copyright 2018, sergio a. balaguera-reina
TRANSCRIPT

Natural History of the American crocodile in a Tropical Pacific Island in
Panama, Central America
by
Sergio A. Balaguera Reina B.S.
A Dissertation
In
Biological Sciences
Submitted to the Graduate Faculty
of Texas Tech University in
Partial Fulfillment of
the Requirements for
the Degree of
Doctor of Philosophy
Approved
Llewellyn D. Densmore III
Chair of Committee
Nancy McIntyre
Richard Strauss
Richard Stevens
David Ray
Mark Sheridan
Dean of the Graduate School
May, 2018

Copyright 2018, Sergio A. Balaguera-Reina

Texas Tech University, Sergio A. Balaguera-Reina, May 2018
ii
ACKNOWLEDGMENTS
I want to express my gratitude to my academic advisor Dr. Llewellyn D.
Densmore III for his continuous support and guidance during my studies in the
Biological Sciences program at Texas Tech University. I would like to extend this
gratitude to the members of my academic advisory committee Drs. Nancy McIntyre,
Richard Strauss, David Ray, and Richard Stevens for their support and encouragement
to pursue my academic goals. Their guidance and critical minds help me to shape and
structure my scientific path and grow-up both personally and intellectually.
The last five years at Texas Tech University have been a great experience at
both personal and professional levels. It is why I want to express my gratitude to the
chair of the department Dr. Ron Chesser as well as all professors I have worked under
as a teacher assistant Drs. Robert Bradley, Rhonda Boros, Michael Dini, Richard
Strauss, Lou Densmore, and Nicte Ordoñez-Garza. I also want to thank to Judy
Edwards, Lanita Ladd, Lisa Dion, Pat Moore, Raquel Miranda, Kunju Li, Carol
Espinosa, Vina Khan, and Christopher Long for all your support and help through this
time. My gratitude to all my friends and colleagues who I met and shared time with at
Texas Tech University, but especially to Stephen Roussos, Mike Sager, Ashish
Bashyal, Elizabeth Mack, Brandon Gross, Austin Osmanski, Mark Lee, Andrés
Rodríguez-Cordero, Betzaida Rivera, Ryan Vazquez, Abbie Ince, Juan Pablo Carrera,
Nicte Ordoñez-Garza, Cibele Sotero, Diana Vargas, Pablo Tovar, Paulina Vélez, and
Diana Palacios.
I want to acknowledge the support of the Colombian government specially the
Colciencias Institute who awarded me a scholarship to study abroad as well as the
Colfuturo Institute staff for their help and administrative support. I would like to
extend this acknowledge to the Panamanian Environmental Agency (ANAM), the
Panamanian National Secretariat of Science, Technology, and Innovation, the
Smithsonian Tropical Research Institute (STRI), the AERONAVAL, and the
IUCN/SSC/Crocodile Specialist Group for their economical and logistical support to
carry out the field part of this dissertation. I want to thank to Dr. Miryam Venegas-

Texas Tech University, Sergio A. Balaguera-Reina, May 2018
iii
Anaya for her support during this project as well as all the undergraduates and local
people who helped me collect data in the field, especially to Betzaida Rivera, Jhon
Gaitan, Tatiana Rincon, Tatiana Niño, Valeria Beltran, Alejandra Cristancho,
Alejandro Morales, Italo Arbeláez, and Andrés Sánchez.
Finally, I want to recognize the unconditional help and support of my beloved
girlfriend Lorena, my father José Vicente, mother María Pureza, brother Diego
Armando, and sister Magda Ximena, as well as cousins, uncles, aunts, grandparents
and close friends that walked this long path with me. This work is dedicated to all my
friends that could not see this dream come through, your names will be never
forgotten.
“Carpe diem, quam minimum credula postero”
Horace 23 (BC)
“We have the duty of formulating, of summarizing, and of communicating our
conclusions, in intelligible form, in recognition of the right of other free minds to
utilize them in making their own decisions”
Ronald Fisher

Texas Tech University, Sergio A. Balaguera-Reina, May 2018
iv
ABSTRACT
Conservation of large predators has long been a challenge for biologists due to
the limited amount of information we have about their ecology and generally low
numbers in the wild. The last decade has made it clear that to implement sound
conservation practices, we must increase our understanding of large predators’
ecology, covering all possible aspects. I investigated the natural history of the
American crocodile (Crocodylus acutus) on Coiba Island, Panama, addressing a
comprehensive ecological framework including four specific topics: crocodile
reproductive, population, spatial, and trophic ecology. As part of this work, I also
developed two novel approaches focused to identify American crocodiles at the
individual level based on the dorsal scute pattern (individual identification pattern
recognition IIPR) and to estimate population sizes (using spotlight data) based on the
sampling distribution (via bootstrapping) with adjusted confidence intervals. American
crocodile reproductive ecology works as a primary driver of the spatial patterns found
on Coiba Island, which are also highly influenced by environmental conditions such as
precipitation. Hierarchization based on age group and sex through space and time was
identified in the study area. Dietary niche overlap analysis showed clear ontogenetic
dietary partitioning among juveniles, subadults, and adults. However, the general
pattern postulated for crocodylians (small individuals eating invertebrates and adults
feeding on larger prey) was not supported by the data collected from Coiba Island,
indicating that even adult American crocodiles dwelling in coastal areas rely on more
on easy-to-catch/abundant prey such as crustaceans. These results have important
implications for the way we see the species as a functional entity of the community,
including its interactions and more complex roles in the system than thought before.
Overall, American crocodile life history varies considerably from insular to mainland
populations and from coastal to in-land populations, demonstrating how “flexible” C.
acutus is in terms of habitat requirements. Data suggest that realized niches in the
insular populations “shrink” compared to mainland populations due to a reduced
availability of resources and an inherent increase of intra and interspecific
competition. Results from the present study allow future management and

Texas Tech University, Sergio A. Balaguera-Reina, May 2018
v
conservation planning to be based on the comprehensive integration of information on
the ecology of a Neotropical crocodylians.
Key words: Crocodylians; nesting ecology; population ecology; spatial
ecology; trophic ecology.
Texas Tech University, Sergio A. Balaguera-Reina, May 2018
vi
TABLE OF CONTENTS
ACKNOWLEDGMENTS ........................................................................ ii
ABSTRACT .............................................................................................. iv
TABLE OF CONTENTS ......................................................................... vi
LIST OF TABLES ................................................................................... xi
LIST OF FIGURES ............................................................................... xiv
CHAPTER I ............................................................................................... 1
INTRODUCTION ..................................................................................... 1
CROCODYLUS ACUTUS IN PANAMA: A STATUS REPORT ...... 1
OBJECTIVES ....................................................................................... 6
ORGANIZATION OF CHAPTERS ..................................................... 7
CHAPTER II ............................................................................................. 8
REPRODUCTIVE ECOLOGY ............................................................... 8
INTRODUCTION ................................................................................ 8
MATERIALS AND METHODS ........................................................ 10
RESULTS ........................................................................................... 13
DISCUSSION ..................................................................................... 24
CHAPTER III ......................................................................................... 32
POPULATION ECOLOGY ................................................................... 32
INTRODUCTION .............................................................................. 32
MATERIALS AND METHODS ........................................................ 35
Study area ...................................................................................... 35
Data collection .............................................................................. 35
Pre-sampling ................................................................................. 36
Sampling ....................................................................................... 38

Texas Tech University, Sergio A. Balaguera-Reina, May 2018
vii
Spotlight surveys data analyses ..................................................... 39
Mark-recapture data analyses ........................................................ 40
RESULTS ........................................................................................... 41
Spotlight survey ............................................................................ 42
Mark-recapture .............................................................................. 43
DISCUSSION ..................................................................................... 47
Source of bias in population size estimations ............................... 49
New population size estimation approach..................................... 51
American crocodile population size estimations........................... 52
Conclusions ................................................................................... 53
CHAPTER IV .......................................................................................... 58
INDIVIDUAL INDENTIFICATION BASED ON DORSAL
PATTERNS ............................................................................................. 58
INTRODUCTION .............................................................................. 58
MATERIALS AND METHODS ........................................................ 60
RESULTS ........................................................................................... 63
DISCUSSION ..................................................................................... 67
CHAPTER V ........................................................................................... 75
SPATIAL ECOLOGY ............................................................................ 75
INTRODUCTION .............................................................................. 75
MATERIALS AND METHODS ........................................................ 78
RESULTS ........................................................................................... 83
DISCUSSION ..................................................................................... 94
CHAPTER VI ........................................................................................ 104
TROPHIC ECOLOGY ......................................................................... 104
INTRODUCTION ............................................................................ 104
MATERIALS AND METHODS ...................................................... 106
Texas Tech University, Sergio A. Balaguera-Reina, May 2018
viii
Study area .................................................................................... 106
Sampling ..................................................................................... 106
RESULTS ......................................................................................... 110
DISCUSSION ................................................................................... 117
CHAPTER VII ...................................................................................... 130
CONCLUSIONS ................................................................................... 130
BIBLIOGRAPHY ................................................................................. 136

Texas Tech University, Sergio A. Balaguera-Reina, May 2018
ix
APPENDICES
3-1. Spatial distribution patterns of American crocodiles observed (spotlight
surveys) and captured (mark-recapture) by size class and age group,
respectively, across 2013 on Coiba Island, Panama. Notice how observations
tend to be grouped (clustered) in most of the months. ..................................... 56
3-2. Sampling distribution of the American crocodiles sighting mean estimated by
transects and for the entire study derived from balanced bootstrap simulation
ran 100,000 times. Each graph represents the frequency of the mean
highlighting the confidence intervals (upward arrows) and the quantiles of
standard normal (45 degrees means normally distributed). ............................. 57
4-1. Pairwise comparisons using Dunn’s test for independent samples between
transverse scute lines (TSL) of all American crocodiles captured in Coiba
Island, Panama (n = 102). We only report data with significant pairwise
comparison values (p-value < 0.05). ................................................................ 74
5-1. Utilization distribution per size classes using Kernel Density Estimation
(KDE). ............................................................................................................ 100
5-2. Number of path trajectories (N), time average between locations (TAG),
average movement distance (AMD), and average movement speed (AMS)
followed by American crocodiles in Coiba Island per size class. .................. 101
5-3. Number of observations, percent of geolocations closer than 200 m, and
average conspecific proximity (ACP) within a time overlapping of 6 h
estimated for 24 American crocodiles followed in Coiba Island from 2010 to
2013 divided by size class. ............................................................................. 102
5-4. Home range and utilization distribution of the American crocodiles on Coiba
Island estimated via Minimum Convex Polygon (MCP), Kernel Density
Estimation (KDE), and Local Convex Hull—adaptive (aLoCoH). Data for all
individuals and averages divided by size classes are reported. Analyses were
made including all data on all individuals and using isopleths at 50% and 95%.
........................................................................................................................ 103
6-1. Species reported historically as American crocodile prey items across its range.
This table also includes all the species identified and reported in the current
study. * Species names adjusted based on current taxonomy. ....................... 122

Texas Tech University, Sergio A. Balaguera-Reina, May 2018
x
6-2. Taxon reported historically as American crocodile prey items across its range.
Notice the broad spectrum of taxonomic groups from which researchers were
unable to identify any further. * Species names adjusted based on current
taxonomy. ....................................................................................................... 126
Texas Tech University, Sergio A. Balaguera-Reina, May 2018
xi
LIST OF TABLES
2-1. Information for each nest (NID) on hatching date (H. Date), sector, total
number of eggs (T.E.), number of eggshells (E.S.), nonviable eggs (N.E.),
unhatched eggs (U.H.E.), dead hatchlings (D.H.), hatched with mother’s help
(H.M.H), and hatched without mother help (H.W.H.) on Playa Balnca (P.B.)
and El Maria beach (E.M.) on Coiba Island 2013. .......................................... 15
2-2. Physical and biological attributes of American crocodile nests on Coiba Island.
.......................................................................................................................... 16
2-3. Soil chemical conditions of American crocodile nests on Coiba Island. N:
Nest, % OM: Organic Matter. ........................................................................ 20
2-4. Some variables assessed in other studies on nesting ecology of Crocodylus
acutus at insular and mainland localities. MRS‑TL: Minimum reproductive
size defined as total length, CS: Clutch size, EM: Egg mass, EL: Egg length,
EW: Egg width, NS: Nesting success, DT: Depth to the top of the clutch, DB:
Depth to the bottom of the clutch, WD: Width of hole, VWC: Volumetric
water content. ................................................................................................... 27
3-1. American crocodiles observed by the spotlight (ST) and capture (CT) teams by
transects and during the entire study (Total) on Coiba Island, Panama,
highlighting the total number of animals observed as well as the mean and
standard deviation (SD). We also included the total number of American
crocodiles captured (TAC) by the capture team. ............................................. 43
3-2. Coiba Island American crocodile population size estimates (N) derived from
the Messel’s and King’s sighting fraction equations as well as our new
approach (sampling distribution), highlighting the standard distribution (SD),
the standard error (SE), the sum of maximum number of observations recorded
by size class (Max), the sighting fraction estimated (p), and the confidence
intervals (CI). ................................................................................................... 46
3-3. “No time dependence by sex” model (female, male, and no determined) and
“hatchlings-allowed-to-vary by age groups” model (juveniles and subadults)
parameters estimated via POPAN formulation, highlighting the standard error
(SE) and the lower and upper confidence intervals (CI) by each parameter (φ,
p, and β). Since hatchlings results were time-dependent, their results (described
by months) are not included in this table. ........................................................ 47

Texas Tech University, Sergio A. Balaguera-Reina, May 2018
xii
3-4. American crocodile gross population on Coiba island, Panama (N*-hat;
superpopulation) estimated via POPAN formulation by sex and age groups,
highlighting the standard error (SE), and the lower and upper confidence
intervals (LCI and UCI). .................................................................................. 48
3-5. American crocodile population size (PS) estimations across its range collected
from literature, including the standard deviation (±SD) or the variation range
(min-max). ........................................................................................................ 53
3-6. American crocodile relative abundance estimations (RA) from insular and
coastal areas across its range by country reported from literature. .................. 54
4-1. Summary statistics per transverse scute line (TSL) of American crocodiles
assessed on Coiba Island, Panama based on the binary analysis (n = 102)
highlighting the mean, standard deviation (SD), and minimum and maximum
(Min–Max) of scales found. ............................................................................. 64
4-2. Pairwise comparisons using Dunn’s test for independent samples between
longitudinal scute lines (LSL) of all American crocodiles captured in Coiba
Island, Panama (n = 102). We only report data with significant pairwise
comparison values (p-value < 0.05). ................................................................ 69
5-1. Number of path trajectories (N), time average between locations (TAG),
average movement distance (AMD), and average movement speed (AMS) for
each Coiba Island individual followed (ID), classified by sex (S; Female F;
Male M) and age group. Individual 84 was monitored in two periods: the first
line in 2010-2011, the second line 2013. ......................................................... 84
5-2. Number of path trajectories (N), time average between geolocations (TAG),
average movement distance (AMD), and average movement speed (AMS)
followed by American crocodiles in Coiba Island per age group and sex. ...... 87
5-3. Pairwise comparisons using Dunn’s-test for independent samples between
individuals (ID#), years, months, precipitation seasons, and reproductive
ecology in Coiba Island. We only report data with significant pairwise
comparisons values (p-value = < 0.05). ........................................................... 89
5-4. Number of observations, percent of geolocations closer than 200 m, and
average conspecific proximity (ACP) within a time overlap of 6 h estimated
for 24 American crocodiles followed in Coiba Island from 2010 to 2013
divided by sex and age group. .......................................................................... 91
Texas Tech University, Sergio A. Balaguera-Reina, May 2018
xiii
5-5. Home range and utilization distribution of the American crocodiles on Coiba
Island estimated via Minimum Convex Polygon (MCP), Kernel Density
Estimation (KDE), and Local Convex Hull-adaptive (aLoCoH). These values
were estimated from the average by individual ± SD, reporting the maximum
and minimum values obtained. Data for all individuals and averages divided by
sex and age group are reported. Analyses were made including all data on all
individuals and using isopleths at 50% and 95%. ............................................ 93
6-1. Stomach content weights and proportions recovered from American crocodiles
from Coiba Island, Panama, expressed as an average (first number) plus a
dispersion measure (minimum-maximum) as well as the respective proportion
value (in brackets) by age group (AD: adults, SA: subadults, LJ: large
juveniles, SJ: small juveniles). The number under each age group reflects the
sample size. .................................................................................................... 112
6-2. Species reported as prey items in the stomach content of 49 American
crocodiles captured from Coiba Island, Panama. ........................................... 113
6-3. Prey items, diversity, and evenness among age groups of Crocodylus acutus
from Coiba Island, Panama, highlighting the number of crocodiles consuming
a specified prey category, followed by percent occurrence (%) within each age
group in parenthesis. ...................................................................................... 115
6-4. Percentage of dietary overlap (%) among American crocodile age groups
assessed from Coiba Island, Panama. ............................................................ 117

Texas Tech University, Sergio A. Balaguera-Reina, May 2018
xiv
LIST OF FIGURES
1-1. Historical and current distribution of Crocodylus acutus in Panama revised
from the multi-criteria analysis in Thorbjarnarson et al. (2006) (datum WGS
84; pers. comm.). We derived this zoom-in approximation from a large-scaled
analysis of the entire range of C. acutus. Considerable fieldwork is necessary
to improve the accuracy and validate these polygons. Green dots represent
areas from where C. acutus was reported historically. ...................................... 3
2-1. Study area and transects assessed from Boca Grande to Punta Felipa in Coiba
National Park. ................................................................................................... 11
2-2. Nests found and hatchling distribution from Boca Grande to Punta Felipa in
Coiba National Park. Red squares are the 100 × 100 m plots assessed to
determine the vegetation cover in the nesting and nursery areas. Light green
spots are the nests found and yellow triangles are the hatchling-juveniles’ geo-
references obtained across the study. ............................................................... 14
2-3. Volumetric water content box-plot for nests 1 and 2, recording the values in
the middle and bottom part of each nest throughout the entire nesting period. 17
2-4. Reproductive ecology throughout the year in relation to mean rainfall recorded
on Coiba Island. ............................................................................................... 21
2-5. Hatchling-juveniles’ growth registered throughout nine months (April to
December). A nonlinear regression test determined that Gompertz’s model best
describes growth in that period (all terms of the model contributed
significantly, P < 0.05). .................................................................................... 22
2-6. Total length and snout–vent length growth rates of hatchlings from April–
December 2013. We used eight of the nine months to calculate the geometric
mean and the growth rate, excluding November, because that was just one
datum and an outlier. ........................................................................................ 23
2-7. Hatchling population size estimated for each recapture event over nine months
(April–December) on Coiba Island based on the POPAN formulation model. 24
3-1. Study area on Coiba Island, Panama, highlighting the transects we followed
across 2013 (T1:3.3 km, T2: 2.4 km, T3: 2.2 km, T4: 2 km) as well as the area
estimated based on a 150-m buffer around each transect. ............................... 37

Texas Tech University, Sergio A. Balaguera-Reina, May 2018
xv
3-2. American crocodile relative abundance by months (top) and by transects
(bottom) as well as the demographic structure by size classes (middle) found
throughout all 2013 in Coiba Island, Panama, expressed as median and
quartiles with whiskers at minimum and maximum values. Outliers are
represented as open circles. .............................................................................. 44
4-1. (A) Vectorized photograph of an individual American Crocodile (ID91 female,
subadult) captured in Coiba Island, Panama, describing the individual
identification pattern recognition method (IIPR) based on the binary and coded
assessments used to analyze the dorsal scute pattern of Crocodylus acutus.
Notice the three scute regions (post-occipital, nuchal, and dorsal) and 20
instead of the 21 TSL because of the lack of L21 in this specific individual.
Several examples of individuals and their scute patterns can be seen in (B)
ID543 male subadult, (C) ID467 hatchling with 21 TSL, and (D) ID441 female
adult. ................................................................................................................. 61
4-2. Number of scutes found on each transverse scute line (TSL) from the anterior
to the posterior part of the body (from L1 to L21) based on the binary analysis
throughout the 21 TSL reported for American crocodiles in Coiba Island,
Panama (n = 102), expressed as median and quartiles with whiskers at
minimum and maximum values. Outliers are represented as open circles. We
also present the percentage of individuals that presented median values. ....... 65
4-3. Number of Crocodylus acutus scute patterns derived from the binary analysis
in Coiba Island, Panama, highlighting all the scute patterns found per TSL as
well as the number of individuals and its representativeness (percentage) based
on the total sampling. Sample size per TSL oscillated between 102 and 110
because we included crocodiles with partial information. ............................... 66
4-4. Scute patterns derived from the coded analysis in Coiba Island, Panama,
highlighting all the scute patterns found per TSL as well as the number of
individuals and its representativeness (percentage) based on the total sampling.
Sample size per TSL oscillated between 102 and 110 because we included
crocodiles with partial information. ................................................................. 68
4-5. Number of patterns of Crocodylus acutus found on each transverse scute line
(TSL) from the anterior to the posterior part of the body (from L1 to L21)
based on the coded analysis throughout the 21 TSL reported for American
crocodiles in Coiba Island, Panama (n = 102). 70
5-1. Location of the Coiba National Park along the Pacific coast of Panama
highlighting transects followed throughout this study. On the bottom left panel

Texas Tech University, Sergio A. Balaguera-Reina, May 2018
xvi
it is also pictured all the geolocation estimated throughout the study as well as
the standard error of distance. .......................................................................... 79
5-2. Trajectory movements of all the American crocodile individuals followed
between 2010 and 2013 in Coiba Island, highlighting the differences in the
trajectory of individual ID84, which expanded its movement area without
overlapping with the previously estimated one. ............................................... 86
5-3. Average movement distances (AMD) of the American crocodile in Coiba
Island from 2010 to 2013 related to the average historical precipitation (1971–
2014) in the area and the reproductive ecology reported for our previous work
(Balaguera-Reina et al. 2015b). Note the AMD increase in the dry season and
decrease in wet season. .................................................................................... 88
5-4. Average movement distances (AMD) per sex and age group of the American
crocodile in Coiba Island related to average historical precipitation and
reproductive ecology. Changes in AMD between seasons are clearer in
females, adults, and sub-adults......................................................................... 90
5-5. Utilization distribution per group (sex and age group) and total geolocations
using Kernel Density Estimation (KDE). ........................................................ 92
6-1. Transects followed between March and December 2013 in the southern tip of
Coiba Island, highlighting all the localities along the coastline where American
crocodiles were captured. ............................................................................... 107
6-2. Proportional values of the four major groups collected from American
crocodile stomach contents in Coiba Island, Panama, expressed as median and
quartiles with whiskers at minimum and maximum values. Outliers are
represented as open circles. ............................................................................ 111
6-3. Species accumulation curve (SAC) and the standard deviation of the data (blue
contour). Boxplot figures represent the median, quartiles, maximum and
minimum per individual and plus symbols (+) represent outliers. 114
6-4. Overlapping group analysis by main categories of Crocodylus acutus sampled
from Coiba Island, Panama. The average Snout-Ventral Length (SVL) was
estimated based on the sizes of all 15 individuals used in each group. ......... 116

Texas Tech University, Sergio A. Balaguera Reina, May 2018
1
CHAPTER I
INTRODUCTION
Balaguera-Reina, S. A., M. Venegas-Anaya, Ll. Densmore III. Crocodylus
acutus in Panama: a status report. Mesoamerican Herpetology 2(4): 566-569.
CROCODYLUS ACUTUS IN PANAMA: A STATUS REPORT
The American Crocodile, Crocodylus acutus, is the most widely distributed of
the Neotropical crocodiles (Thorbjarnarson 2010). Based on information provided by
the International Union for the Conservation of Nature and Natural Resources (IUCN
Red List), this species is one of the three most threatened crocodylians in the
Americas, and has been assessed as Vulnerable (Ponce-Campos et al. 2012). This
species also is included in Appendix I of the Convention on International Trade in
Endangered Species of Wild Flora and Fauna (CITES), except for Cuba where it is
listed in Appendix II (CITES 2012). At the country level, C. acutus is considered as
Critically Endangered in Ecuador (Carvajal et al. 2005) and Peru (National Decree
034-2004-AG), and as Endangered in Colombia (Morales-Betancourt et al. 2015),
Panama (resolution No. AG–0051-2008), Venezuela (Rivas et al. 2012), and the
United States (Mazzotti et al. 2007). In contrast, Mexico has listed this species under
the category of Special Protection (SEMARNAT 2010), whereas in Cuba C. acutus is
not listed in any of the threatened categories because the country harbors one of the
largest and healthiest populations in its range (Larriera et al. 2008). Based on another
conservation measure, the Environmental Vulnerabilty Score (EVS), Johnson et al.
(2015) determined an EVS of 14 for C. acutus in Central America, placing this species
at the lower end of the high vulnerability category.
Presently, the governments, national agencies, and researchers of only a few
countries are providing support for conservation planning and management measures
for C. acutus (Thorbjarnarson 2010, Balaguera-Reina et al. 2015a, Venegas-Anaya
2015a), which is of concern for the potential survival of at least some populations of

Texas Tech University, Sergio A. Balaguera Reina, May 2018
2
this species. To determine where such problems might exist, clear strategies to assess
each region’s conservation plans must be made a priority. Our aim herein is to present
an overview of the current status of C. acutus in Panama, including gaps in our
knowledge of the biology of this species in the country, and to comment on research
priorities based on a review of the literature.
Reports on the presence of C. acutus in Panama’s bays and most rivers along
the Pacific coast, in provinces from Panamá to Chiriquí, date back to the late 19th
century; these reports also contained information on conflicts between crocodiles and
cattle-farmers, and the cultural uses (medical and religious) for C. acutus (Anonymous
1872). Subsequently, newspaper articles and books mostly provided information on
hunting activities and the animal trade (Anonymous 1894, 1907, 1909, Abbot 1914,
Wood 1930). Hunting crocodylians was a major diversion for people working on the
Panama Canal; a report by Grier (1908) noted that eight C. acutus were killed
(maximum length 21 feet [6.4 m]) during expeditions to the mouth of the Río Grande.
In the following years, Swanson (1945) reported killing a crocodile that
measured 10 feet 8 inches [3.25 m] along the Río Cabra (Figure 1-1), the largest
individual he had taken in 25 years of collecting. About the same time, Breder (1946)
reported C. acutus as abundant in the lower and middle Río Chucunaque, in the
province of Darién (Figure 1-1), where he estimated the length of the largest
individuals at 18–20 feet (5.5–6.1 m); he also reported finding a crocodile nest with 46
eggs in April, and later that month encountered groups of newly-hatched crocodiles.
Swanson (1945) also noted that in 1942 La Estrella de Panamá (Panama’s
oldest newspaper) provided an account of a crocodylian attacking and killing a 10-
year-old child. Winner (2007a, b) reported two cases of fishermen being attacked by
C. acutus, one at the mouth of the Río Caimito (victim survived) and another (a fatal
attack) in the Panama Canal Zone on the Pacific coast; he also indicated that at least
two other fatal attacks had occurred in 2004 and 2007, one in Lago Gatún and the
other along the coast in Panama City. On the Caribbean coast, Mendieta and Duarte
(2009) reported a fatal attack by C. acutus on the Río Sixaola, in the province of

Texas Tech University, Sergio A. Balaguera Reina, May 2018
3
Bocas del Toro. The most recent report, documented in the media in 2013, was a fatal
attack on the Río Cañazas, in the area of Chepo. Reports of crocodile-human conflicts
are not restricted to attacks on humans, as accounts of crocodiles feeding on
domesticated species and pets also have appeared (Anonymous 1998). Unfortunately,
to date a comprehensive database for crocodile attacks on humans is not available at
the national level.
Figure 1-1. Historical and current distribution of Crocodylus acutus in Panama
revised from the multi-criteria analysis in Thorbjarnarson et al. (2006) (datum
WGS 84; pers. comm.). We derived this zoom-in approximation from a large-
scaled analysis of the entire range of C. acutus. Considerable fieldwork is
necessary to improve the accuracy and validate these polygons. Green dots
represent areas from where C. acutus was reported historically.
Sporadic crocodile research, primarily involving herpetological records and the
collection of specimens, occurred in such places as the Archipielago de Las Perlas,
Bahía de Panama, and Lago Gatún (Cochran 1946, Neal 2007, Houlihan 2013).
Powell (1971) documented the hide trade, management, and human utilization of C.

Texas Tech University, Sergio A. Balaguera Reina, May 2018
4
acutus, and Rand and Troyer (1980) reported parental care observations at Lago
Gatún, suggesting that past hunting selectively eliminated adults that protected the
young. Collectively, Dugan et al. (1981), Páez and Bock (1988), and Bock and Rand
(1989) provided evidence of predation and nesting interactions of crocodiles with
Green Iguanas (Iguana iguana), as well as the effects of these interactions on the
reproductive success of C. acutus. Using telemetry at Lago Gatún, Rodda (1984)
reported dispersal movements in hatchling C. acutus. Additionally, Obaldia et al.
(1990) provided veterinary information, as they reported the first case of
mesothelioma in C. acutus, and Venegas-Anaya (1992, 1995, 1998) described the
nesting ecology of this species in captivity, as well as first medical cases of nutritional
secondary hyperparathyroidism with fibrous osteodystrophy.
Although detailed studies on the population ecology of C. acutus in Panama
are not available, anecdotal information on populations in the country was included in
the assessment of regional habitat conservation priorities for this species
(Thorbjarnarson et al. 2006; Figure 1-1). However, even though Thorbjarnarson et al.
(2006) represents the most detailed information currently available on the distribution
of C. acutus in Panama, range assessments must be validated “in the field” throughout
the entire country to determine the true conservation status of this species.
Thorbjarnarson et al. (2006) highlighted two areas on the Caribbean (the Lago Gatún
reservoir [Bahía de Panama-este] and Laguna de Chriquí) and five on the Pacific (Isla
de Coiba, Punta Manzanillo, Bahía Charco de Azul, Bahía Montijo, and Bahía de
Panama [oeste]) as relevant areas for developing Crocodile Conservation Units
(CCUs).
Since 2009, a comprehensive study on the biology of C. acutus has been taking
place at Parque Nacional Coiba (PNC) and its continental buffer zone. The goal of this
project is to understand the natural history of this species by comparing insular and
mainland localities, assessing aspects of population ecology (Venegas-Anaya et al.
2015b) and population genetics (Garcia-Jimenez 2010, Garcia-Jimenez et al. 2010,
Bashyal et al. 2010, Bashyal 2012, Venegas-Anaya 2013). To date, the main results of
this project are as follows:

Texas Tech University, Sergio A. Balaguera Reina, May 2018
5
(1) An initial estimated size of 164 individuals on Isla Coiba and 21 in the PNC buffer
area, with a relatively equal female: male ratio in both areas based on captured
animals; an apparent lack of adults in the PNC buffer area that could result from
habitat modification or constant human-mediated disturbance; and differences in
the occurrence of individuals in a variety of landscape units based upon age
groups, with juveniles being habitat generalists compared to sub-adults and adults
(Venegas-Anaya et al. 2015).
(2) Genetically, a model-based clustering analysis revealed the presence of three
spatially overlapping genetic clusters on Isla de Coiba (north and south) and the
PNC buffer area; each of these clusters were comprised of one mainland
population and at least one island population, suggesting that there is either some
gene flow between the populations or retention of an ancient polymorphism
(Bashyal 2012).
These studies not only increased the genetic and ecological database of the C.
acutus in Panama, but also increased our understanding of the biogeographic history
and phylogenetic systematics of Neotropical Crocodylia (Venegas-Anaya 2000, 2001,
2015b, Weaver et al. 2008, Bashyal et al. 2014, Venegas-Anaya et al. 2015).
Despite the above-mentioned research efforts, we still are unable to determine
if changes in factors such as habitat type and/or anthropogenic incursion have had any
effects (deleterious or otherwise) on C. acutus populations, because of the lack of
information on three critical attributes (i.e., abundance, range, and habitat). The
paucity of these kinds of data illustrates the need to develop an “in country”
monitoring plan (as well as other countries that harbor populations of C. acutus) as a
major research priority focused on assessments of the three attributes, which will
allow for the collection of necessary data to generate management plans at the local,
national, and regional levels.
Studies on C. acutus inhabiting the Caribbean coast, middle-lands, and rivers
in Panama are not available, reemphasizing the lack of information on this species at
the country level. Currently, monitoring strategies in Panama are not in place, which

Texas Tech University, Sergio A. Balaguera Reina, May 2018
6
would allow biologists to determine if populations of C. acutus increase, decrease, or
remain stable over time. Moreover, until recently ethno-zoological relationships,
hunting, and human-crocodile conflicts have not been studied scientifically.
Investigating and examining two aspects (the absence of ecological information and
ethno-zoological studies) is another important research priority necessary for
generating critical baseline information to develop conservation plans for C. acutus in
Panama.
The lack of spatial information on C. acutus in Panama and the overall lack of
knowledge on the population attributes (i.e., nesting ecology, habitat status) have had
a major impact on its recovery, as conservation plans often are based on technical
information. Furthermore, the country’s geographical location (Panama serves both as
a “bridge” and a “filter” between Central and South American faunas) could have a
regional impact in assessing the conservation status of these populations. Information
on the implications of these impacts on C. acutus populations at the ecological and
genetic levels is not available, which constitutes a third important research priority.
Clearly, these three research priorities must be addressed, not only in Panama but also
throughout the distribution of this species, to provide the necessary information and
data to expedite our understanding of the natural history, ecology, and genetic
conservation status of C. acutus populations.
OBJECTIVES
The main purpose of this study was to investigate the natural history of the
American crocodile (Crocodylus acutus) on Coiba island, Panama, Central America
addressing a comprehensive ecological framework about four specific topics:
reproductive ecology (nesting, brooding, parental care, and hatchlings growth rates),
population ecology (densities and relative abundances comparing different estimation
methods and testing scute patterns as individual identification method), spatial ecology
(home range and spatial patterns assessments testing for relationships with physical
and biological attributes), and trophic ecology (food items and trophic levels testing
for ontogenetic partitioning shift).

Texas Tech University, Sergio A. Balaguera Reina, May 2018
7
ORGANIZATION OF CHAPTERS
This dissertation is organized in seven chapters. The second chapter describes
the reproductive ecology of American crocodiles from Coiba Island providing novel
knowledge about this ecological attribute for this species on insular habitats. The third
chapter describes the population ecology of the species estimating its population size
based on all available methods and postulating a new approach derived from the
present study based on spotlight surveys data. The fourth chapter describes a novel
method developed to identify individual American crocodiles based on dorsal scute
patterns using coding and binomial types of analyses (IIPR). The fifth chapter
describes the spatial ecology of the species based on 24 tags installed throughout a
period of 4 years testing for spatial patterns and the relationship of these patterns to the
environmental and ecological features of the species. The sixth chapter describe the
trophic ecology of the American crocodile in the study area assessing ontogenetic shift
partitioning and describing main prey items, as well as providing a comprehensive
review of the up-to-date prey items reported for the species throughout its range.
Finally, the seventh chapter includes the overall major discoveries presented in this
dissertation highlighting future directions of my research.
Chapters I, II, IV, and V are already published on scientific outlets and can be
consulted outside of the present dissertation document. Chapters III and VI are
currently submitted to scientific journals and in peer-review. Chapter VII will not be
submitted for publication elsewhere so this dissertation is the only source for
consulting. Citations are provided at the beginning of every chapter indicating if it is
already published or in the process.
Texas Tech University, Sergio A. Balaguera Reina, May 2018
8
CHAPTER II
REPRODUCTIVE ECOLOGY
Balaguera-Reina, S. A., M. Venegas-Anaya, O. I. Sanjur, J. Lessios, Ll.
Densmore. 2015. Reproductive ecology and hatchlings' growth rates of American
crocodile (Crocodylus acutus) on Coiba island, Panama. South American Journal of
Herpetology 10(1):10-22.
INTRODUCTION
The American crocodile (Crocodylus acutus Cuvier 1807) is widely distributed
across the Neotropics along the Atlantic, Caribbean, and Pacific coasts, from Florida,
USA to Venezuela and from Mexico to northern Peru (Thorbjarnarson 2010). Despite
their large distribution, populations of C. acutus are threatened because of past and
current poaching and habitat destruction (Platt and Thorbjarnarson 2000a). There are
only a few islands with known populations of C. acutus on the Pacific side of the
species’ distribution in Panama (Las Perlas Archipelago and Coiba, Gobernadora, and
Leones Islands) and Mexico (Maria Magdalena Island; Casas-Andreu 1992,
Thorbjarnarson et al. 2006); until now none of these populations have been studied.
Currently, Crocodylus acutus is considered to be vulnerable (Ponce-Campos et
al. 2012) by the International Union for Conservation of Nature and Natural Resources
(IUCN) and listed on Appendix I of the Conservation on Trade in Endangered Species
of Flora and Fauna (CITES 2012). Although direct threats to the species are known,
our overall understanding of the different populations’ ecology is too limited to
develop and implement successful management plans across the species’ range
(Thorbjarnarson 2010, Balaguera-Reina et al. 2015a). Centrally situated in the range
of C. acutus is Panama, where the species is considered endangered (Ibáñez 2006) and
our understanding of its ecology is poor (Venegas-Anaya et al. 2015).
As with most crocodylians, the reproductive ecology of Crocodylus acutus
consists of five distinct stages including courtship, mating, nesting, brooding, and

Texas Tech University, Sergio A. Balaguera Reina, May 2018
9
hatching. Some of these components are well studied in populations in Florida, USA
(Mazzotti 1983), Mexico (Alvarez del Toro 1974), Haiti (Thorbjarnarson 1989), and
Colombia (Medem 1981). However, in most countries we have little or no knowledge
about these reproductive stages and whether they vary across different portions of the
species range. Additionally, there is hardly any information on growth rates and
hatchling survivorship in any population of the species (Thorbjarnarson 1988, Platt
and Thorbjarnarson 2000b), even though there is a fair understanding about these traits
in many other crocodylians. For example, from research on other species we know that
age, sex, genetics, incubation conditions, and other biotic characteristics of the
environment play important roles in determining growth rates and survivorship,
confirming that crocodylian reproduction is a complex process affected by multiple of
factors (Webb et al. 1983, Da Silveira et al. 2013).
Coiba National Park (CNP) is located in the Gulf of Chiriqui on the Pacific
side of the Republic of Panama. Currently, it is the largest marine preserve along the
entire Pacific coast of Central America and consists of the large island of Coiba and 38
smaller islands (Maté et al. 2009). Coiba and the surrounding islands are landbridge
islands that separated from continental Panama ca. 12,000–18,000 years ago (Ibáñez
2006). CNP is included in the World Heritage List under natural criteria II and IV due
to its biological and ecological importance (Maté et al. 2009). It is also part of the
Tropical Eastern Pacific Marine Corridor, which is critical for the migration of many
marine species (CMNUDS 2002).
It has been suggested that Coiba Island may harbor one of the largest
remaining populations of Crocodylus acutus across Central America with
approximately 500–1000 individuals (Thorbjarnarson 2010), which further highlights
the importance of C. acutus management in CNP. This population was seriously
depleted in the past, mainly by unsustainable exploitation by locals, sport-hunters,
ranchers, and fishermen (Powell 1971). Even though the species is protected by
national laws and hunting is strictly prohibited, additional information about the
species’ conservation status and its ecology will be critical for creating an effective
conservation plan in Panama. The aim of our study was to assess the reproductive

Texas Tech University, Sergio A. Balaguera Reina, May 2018
10
ecology and early stage growth rates (hatchlings and juveniles) for the first time in a
population of C. acutus in a southeastern bay of Coiba Island.
MATERIALS AND METHODS
From January–April of 2013 we carried out daily transect surveys in the
coastal zone from Boca Grande to Punta Felipa (10.3 km, corresponding to 5.2% of
the total perimeter of Coiba Island) in a southeastern bay of Coiba Island to search for
nests and female Crocodylus acutus (Figure 2-1). The area encompassed five kinds of
local ecosystems: beaches, dry forest, riparian forest, mangrove, and rocky coastline.
Nesting areas were identified by the presence of excavated nests, eggshells,
fresh tracks, and/or other visible crocodile-mediated disturbances in the sand. These
areas were carefully excavated to expose clutches. Prior to excavation, external
features of the nest were recorded (length and width of disturbed area, and level of
canopy cover) as well as the distance to the nearest body of water, tree, and other
crocodile nests. All nests were excavated to determine clutch size and egg viability
and measure the depth and width of the clutch. Egg viability was determined by the
presence of an opaque band on the center of the uppermost surface of fertile egg, and
oviposition dating was estimated based on the width of the band (Ferguson 1985). All
eggs were measured and weighed with analog calipers (± 0.1 mm) and spring scales (±
1 g), respectively, and marked using a pencil on the uppermost surface with a small
cross to avoid changes in egg polarity when eggs were returned to the nest. After
females abandoned their clutches, we waited 1–2 hours and resumed nest excavation
to help any remaining eggs hatch, breaking the egg shell and thus facilitating the
release of the hatchling. At the same time, we determined the numbers of unhatched
eggs, nonviable eggs, dead hatchlings, and eggs that hatched with the aid of the
mother or our team, providing us novel insights into the exact initial moments of
clutch hatching and maternal behaviors that might affect the survivability of
hatchlings.

Texas Tech University, Sergio A. Balaguera Reina, May 2018
11
Figure 2-1. Study area and transects assessed from Boca Grande to Punta
Felipa in Coiba National Park.
Whenever possible, females were captured and measured. Total length (TL)
and snout–vent length (SVL: tip of snout to anterior margin of cloaca; Webb and
Messel 1978a) measurements were taken, and each crocodile was marked by notching
the dorsal scutes in a systematic marking series on the tail (Jennings et al. 1991). If
capture was not possible, length was estimated from the rear-foot tracks found at the
nest site (Platt and Thorbjarnarson 2000b). Camera traps were placed at the nests to
record maternal behaviors and the timing of hatching.
Moisture sensors (Vegetronix®) were placed in the bottom and middle of the
clutches (delay time 30 min) to determine the volumetric water content (VWC) within
the nest. Vegetation cover at the nesting and nursery areas (places where hatchlings
spend the first months, commonly close the nesting areas) was assessed using three
100 × 100 m plots, which included all the nests found to determine the amount of
canopy cover (area of shading), tree height, diameter at breast height (DBH),

Texas Tech University, Sergio A. Balaguera Reina, May 2018
12
vegetation richness, and tree density. Simpson dominance, Margalef richness, and
Shannon diversity indices were calculated for the vegetation cover data. We also used
ArcGIS 10.1 (ESRI 2012) and the most current maps of the area (Maté et al. 2009) to
describe the land cover. Soil samples were taken from the bottom of each clutch,
packed, and transported to the Agriculture Research Institute of Panama (IDIAP) to
determine the chemical and physical properties based on standard protocols.
For one week per month from April–December 2013 we carried out nightly
transect surveys to search for hatchling/juveniles across the coastal zone. Over this
nine-month period, individuals were captured, measured (TL; SVL; tail length-TaL;
head length-HL; head width-HW; mass), marked, and released at the site of capture.
During these transect surveys we also searched for adults (males and females) to
record reproductive behaviors (agonistic behavior, courtship, or mating).
Individual growth rate was estimated by calculating the geometric mean
difference in TL and SVL between capture-recapture events (Campos et al. 2013).
Population size and mark-recapture models were estimated using Mark software
(White and Burnham 1999). We used live recapture (i.e., Cormack-Jolly-Seber models
based on survival, φ, and recapture, p, probabilities) and Popan formulation (i.e.,
Jolly-Seber models using φ and p as well as probability of entry, pent, and initial
population size, N; see White and Burnham 1999) to determine the best model to
describe our population and also to estimate the hatchling population size. We
estimated the activity patterns of hatchlings and their movements based on
georeferenced points collected using a GPS (Global Positioning System) device and
analyzed using ArcGIS 10.1 (ESRI 2012). The size of the study area was estimated
based on the extent of the coastline from Boca Grande to Punta Felipa and calculating
a 1 km buffer around it.
The growth rate and morphometric analyses were conducted using InfoStat and
R statistical software packages (Di Rienzo et al. 2013, R Development Core Team
2012). Significance of changes in variables was estimated from one-sample t‑tests and
nonparametric analysis of variance (Kruskal-Wallis due to sample size; Di Rienzo et

Texas Tech University, Sergio A. Balaguera Reina, May 2018
13
al. 2013). We report the accuracy of sample means using a standard deviation (SD)
and the accuracy of population models as standard error (SE by default estimation in
Mark software).
RESULTS
Three nesting areas and 10 individual nests were identified from Punta Felipa
to Boca Grande in the southeastern part of Coiba Island (Figure 2-2). Most nest areas
were located on Playa Blanca, with eight clutches in total (Figure 2-2, Table 2-1).
Thirty percent of the nests were found under forest canopies and 70% were exposed to
sunlight (distance to the nearest tree 𝑋 = 280 ± 110 cm). One clutch (nest 1) was found
in a mangrove forest (Conocarpus erectus Linnaeus 1753) with minimal exposure to
sunlight, two clutches (nests 5 and 6) were within dry forest (under Prosopis juliflora
(Swartz), DC trees), and the other nests were found on the beach without canopy cover
(Figure 2-2).
We found a colonial nesting area (places with more than one nest in a reduced
area, determined by the distance among each other; see Platt and Thorbjarnarson
2000b) on Playa Blanca (clutches 1, 2, and 10; distance between nests 𝑋 = 620 ± 130
cm). Nine of the 10 nests were built as vertical shafts into the soil and one was a
sloping cavity into a sandbank (~60° slope). Fifty percent were nearer to the sea than
to freshwater (> 1,500 cm) and 50% were closer to bodies of freshwater, at an average
distance of 700 ± 360 cm (Table 2-2).
The average nest was 17.5 ± 7.8 cm from the top of the egg clutch to the
surface and 42.9 ± 9.9 cm from the bottom of the clutch to the surface, with a width of
35.9 ± 3.6 cm. We could determine in five nests the clutch size (𝑋 = 25.2 ± 9.5 eggs;
total eggs = 126) because they were found before, during, or immediately after
hatching, allowing us to count the total number of eggs and hatchlings. Average egg
dimensions were 7.4 ± 0.4 cm in length, 4.0 ± 0.7 cm in width, and 97.1 ± 4.3 g in
mass (Table 2-2). Volumetric water content (VWC) was only measured in nests 1 and
2 as they were found very shortly after oviposition (other nests were discovered later

Texas Tech University, Sergio A. Balaguera Reina, May 2018
14
in the incubation period and could not be monitored through the entire duration of the
study). The mean VWC of nest 1 was 25.4 ± 16.3% at the bottom of the clutch and
24.7 ± 0.1% at the middle of the clutch, whereas for nest 2 it was 24.6 ± 0.8% at the
bottom and 20.9 ± 0.5% at the middle (Figure 2-3). Overall, VWC in nests was about
25.0 ± 12.6% at the bottom and 22.8 ± 5.3% in the middle of the clutches.
Figure 2-2. Nests found and hatchling distribution from Boca Grande to Punta
Felipa in Coiba National Park. Red squares are the 100 × 100 m plots assessed
to determine the vegetation cover in the nesting and nursery areas. Light green
spots are the nests found and yellow triangles are the hatchling-juveniles’ geo-
references obtained across the study.
Soil had high mean concentrations of potassium (69.3 mL/L) and manganese
(9.2 mg/L), moderate mean concentrations of phosphorus (6.6 mg/L) and Iron (3.7
mg/L), and low mean concentrations of zinc (0.5 mg/L) and copper (0.0 mL/L); all
values were consistent for all nests (Kruskal-Wallis test ≥ 0.05). Otherwise, cation
exchange capacity showed high concentrations of calcium (2.2 cmol/kg), moderate of

Texas Tech University, Sergio A. Balaguera Reina, May 2018
15
magnesium (1.1 cmol/kg) and low of aluminum (0.1 cmol/L), which was also
consistent for all nests (n = 10; Kruskal-Wallis test ≥ 0.05; Table 2-3).
Table 2-1. Information for each nest (NID) on hatching date (H. Date), sector, total
number of eggs (T.E.), number of eggshells (E.S.), nonviable eggs (N.E.), unhatched
eggs (U.H.E.), dead hatchlings (D.H.), hatched with mother’s help (H.M.H), and
hatched without mother help (H.W.H.) on Playa Balnca (P.B.) and El Maria beach
(E.M.) on Coiba Island 2013.
NID H. date Sector T.E. E.S. N.E. U.H.E. D.H. H. M. H. H. W. H.
1 16-Apr P.B. 40
1 1 1 26 11
2 6-Apr P.B. 28
1
27 0
3 9-Apr P.B. 16
0 6
1 9
4 10-Apr P.B. N/I 7
5 10-Apr P.B. 24
0 1
17 6
6 11-Apr P.B. N/I 16
7 11-Apr P.B. N/I 7
8 14-Apr E.M. N/I 10
9 13-Apr E.M. N/I 10
10 15-Apr P.B. 18 0 3 15 0
𝑋
25.2 10.0 0.3 2.4
17.2 5.2
SD
9.5 3.7 0.5 2.2
10.5 5.1
Max
40 16 1 6
27.0 11.0
Min 16 7 0 1 1.0 0.0
Total 126 1 12 86 26
Hatching success (total eggs hatched × 100 / total clutch size) for the
incubation cycle was 88.9% (112 hatchlings), of which 68.3% (86 hatchlings)
emerged by themselves or with the mother’s help (natural hatching), and 20.6% (26
hatchlings) hatched with our assistance. Hatchling mean measurements were TL =
27.8 ± 0.8 cm, SVL = 13.6 ± 0.5 cm, TaL = 14.3 ± 0.7 cm, HL = 4.3 ± 0.1 cm, HW =
2.2 ± 0.1 cm, and mass = 69.7 ± 7.3 g (n = 90).

Texas Tech University, Sergio A. Balaguera Reina, May 2018
16
Table 2-2. Physical and biological attributes of American crocodile nests on Coiba
Island.
Parameter Mean ± SD Range N
Nest characteristic
Depth to top of clutch (cm) 17.5 ± 7.8 12. - 30 2
Depth to bottom of clutch (cm) 42.9 ± 9.9 31 - 60 10
Width of clutch (cm) 35.9 ± 3.6 29 - 40 10
Distance to water (m) 7.0 ± 3.6 1.3 - 11 5
Distance to nearest tree (m) 2.0 ± 1.6 0 - 4.8 10
Distance to nearest nest (cm) 22.5 ± 19.1 5.5 - 55.8 10
Volumetric Water Content (%) nest 1 middle 25 ± 2.2 1.4 - 28.3 1787
Volumetric Water Content (%) nest 1 bottom 24.6 ± 16.8 0.6 - 40.1 1787
Volumetric Water Content (%) nest 2 middle 20.6 ± 8.6 0.2 - 36.9 1263
Volumetric Water Content (%) nest 2 bottom 25.5 ± 8.7 0.2 - 42.0 1263
Clutch attributes
Clutch size 25.2 ± 9.5 16 - 40 5
Egg length (cm) 7.4 ± 0.4 6.3 - 8.4 89
Egg width (cm) 4.0 ± 0.7 3.0 - 5.0 52
Proportion 0.5 ± 0.1 0.4 - 0.7 52
Egg mass (g) 97.1 ± 4.3 83.0 - 108.0 68
Eggs hatched with mother help (%) 68.3 0 - 100 126
Eggs hatched with our help (%) 20.6 0 - 100 126
Nonviable eggs (%) 0.8 0 - 100 126
Non-hatched eggs (%) 9.5 0 - 100 126
Hatchling dead at nest (%) 0.8 0 - 100 126
Hatched success (%) 88.9 0 - 100 126
Mother attributes
Total length (cm) 219 ± 6.2 208 - 226 5
Body length (cm) 115.9 ± 3.0 111.5 - 118 4
Mass (kg) 35.9 ± 4.0 32-41.5 4
Parental care
Lapse among visits nest 1 (days) 18.7 ± 18 1. - 88 4
Lapse among visits nest 2 (days) 35 ± 48.1 1. - 85 2

Texas Tech University, Sergio A. Balaguera Reina, May 2018
17
Figure 2-3. Volumetric water content box-plot for nests 1 and 2, recording the values in the middle and bottom part of each
nest throughout the entire nesting period.

Texas Tech University, Sergio A. Balaguera Reina, May 2018
18
We found that some females only helped to hatch superficial eggs, neglecting
the lower eggs (nests 1, 3, and 5). The opaque bands, which is easy to see in daylight,
were only examined in nests 1 and 2, which were found in early stages of incubation;
width of the band was 41% and 55% of the average egg length, respectively. Based on
Ferguson’s (1985) suggestions, these values correspond to the eggs at nest 1 being laid
12 days prior to discovery and at nest 2 20 days prior to discovery. Based on our
observations of hatching, the estimated incubation period was 88 days for nest 1 and
85 days for nest 2.
We captured four of the mothers (at nests 1, 2, 3, and 7) and found one rear-
track at nest 9. The mean size of these animals was TL = 219 ± 0.2 cm (n = 5) and
SVL = 115.9 ± 3.0 cm (n = 4). We only captured one adult male (TL = 199.5 cm) at
the nesting area on 31 January, in close proximity to nests 4 and 5.
Nests 1 and 2 were monitored using camera traps to record parental behavior.
After nest 1 was completed, the female was recorded four times on top of the nest
(counting the day of hatching) with a mean of 18.7 ± 18 days between visits (first
lapse between visits was 39 days, the second lapse was 5 days, and the third lapse was
12 days). The majority of these visits were at night between 19:00–22:30 h and lasted
no more than 5 min. However, on the day of hatching, the nest 1 female arrived at the
nest at 01:35 h and started uncovering and assisting the young to exit the nest until
05:30 h, at which time she left the area. She returned at 22:00 h of the same day to
finish that work until 02:30 h of the next day (total attendance time = 8 h 25 min). One
interesting observation about this female is that when she came to uncover the nest the
fourth time, her right forelimb showed evidence of recent mutilation. This must have
happened within the two weeks leading up to that day, as she had been seen
continuously for 2 months. The female who built nest 2 visited the nest three times
(counting the day of hatching), always between 21:00–01:00 h. These nocturnal visits
occurred during the first days of February (one day lapsed between the first and
second visit) and the beginning of April (day of hatching, 69 days since the previous
visit) between 21:30–01:30 h.

Texas Tech University, Sergio A. Balaguera Reina, May 2018
19
We observed three of the five reproductive events (nesting, brooding, and
hatching; Figure 2-4) commonly recognized in crocodiles (Antelo et al. 2010).
Although we monitored the population year-round across the coastal areas (beaches,
mangroves, riparian forest, dry forest, and rocky coastline), we never observed groups
or pairs of males and females in courtship, mating, or performing agonistic behaviors.
In general, these three plots designed to characterize vegetative cover in
reproductive areas in all cases showed characteristics of mangrove forests in
regeneration dominated by Laguncularia racemosa (Linnaeus) Gaertner 1807 (white
mangrove). These were associated with other mangrove species (Rhizophora mangle
Linnaeus 1753; plot 2), tall grasses (Gynerium sagittatum (Aublet) Beauvois 1812;
plot 3) and flowering trees (Talipariti tiliaceum (Linnaeus) Fryxell 2001; plot 1) in
each of the plots. Plots 2 and 3 showed similarities among Simpson’s index of
dominance of plants (0.2 and 0.3, respectively), Margalef richness (2.7 and 2.8,
respectively), and Shannon diversity values (3.3 and 3.1, respectively). Plot 1 had
higher dominance and lower diversity levels (Simpson index 0.7, Margalef richness
index 2.5, and Shannon index 2.4) than plots 2 and 3. Canopy cover in the three plots
had means of 310 ± 160 cm, 230 ± 40 cm, and 250 ± 150 cm, respectively; otherwise,
forest height and DBH were closely correlated among plots (forest height: 580 ± 300
cm, 590 ± 50 cm, 560 ± 310 cm; DBH: 43.8 ± 27.6 cm, 44.1 ± 32.4, 48.2 ± 28.1 cm,
respectively).
Based on the current cartography of Coiba Island (Maté et al. 2009) the nesting
localities (from Punta Felipa to Boca Grande approximately one km perpendicular to
the coastal line) had seven categories of vegetation cover: rainforest (77.8%),
secondary forest (9.3%), stubble (5.2%), paddock (3.5%), mangrove (2.9%), beach
(0.6%), and beach vegetation (0.6%). All nests were found in or in close proximity to
mangrove forest (dominated by Laguncularia racemosa), secondary forest (dominated
by Prosopis juliflora) and beach (either bare or dominated by Batis maritima Linnaeus
1759).

Texas Tech University, Sergio A. Balaguera Reina, May 2018
20
Table 2-3. Soil chemical conditions of American crocodile nests on Coiba Island. N: Nest, % OM: Organic Matter.
N %O.M
.
P
H
P
mg/l
K
mg/l
Ca
Cmol/kg
Mg
Cmol/kg
Al
Cmol/Kg
Mn
mg/l
Fe
mg/l
Zn
mg/l
Cu
mg/l
1 0 8.5 9 27.1 2.2 1.5 0.3 9.6 2.9 0.4 0
2 0 8.5 6 22.7 1.5 0.6 0.2 6.2 2.2 0.1 0
3 0 7.8 5 63.7 1.8 1.5 0.1 11.3 1.5 0.3 0
4 0.01 8 19 72.9 2.3 0.8 0.1 9.1 2.2 0.3 0
5 0 7.9 11 132.5 1.6 1.1 0.1 11.4 5.1 0.5 0.02
6 0 7.8 6 61.4 2.6 1 0.1 10.6 4.2 0.5 0
7 0 8.1 10 65.3 1.7 0.8 0.1 12 5.9 0.6 0
8 0 7.9 0 94.3 3.4 1.9 0.1 6.8 4.3 0.9 0
9 0 8.3 0 106.4 2.8 1.6 0.1 6.3 4.7 0.7 0
10 0 8.1 0 46.4 1.9 0.3 0.1 8.4 4.1 0.5 0.1
𝑋 6.6 69.3 2.2 1.1 0.1 9.2 3.7 0.5 0.0
SD 6.0 34.3 0.6 0.5 0.1 2.2 1.4 0.2 0.0
Max 19 132.5 3.4 1.9 0.3 12.0 5.9 0.9 0.1
Min 0 22.7 1.5 0.3 0.1 6.2 1.5 0.1 0

Texas Tech University, Sergio A. Balaguera Reina, May 2018
21
From April–December we carried out four nocturnal transects (𝑋 = 2.4 ± 0.32
km) per month to search for hatchlings across the coastal zone. We captured 112
individuals that hatched in 2013 from April–December (88.9% of total eggs found)
which covered two age states, hatchlings (< 30 cm TL, determined by presence of yolk
sac and umbilical scar still open) and juveniles (30–90 cm TL, size when all yolk has
been totally reabsorbed, yolk sac is dried, and the umbilical scar is completely closed;
Thorbjarnarson 1989, Platt and Thorbjarnarson 2000a), the majority in April (90
hatchlings captured on nests after hatched day, corresponding to 80.4% of total
hatchlings captured) with much fewer captures (22, new captures) in the following
months.
Figure 2-4. Reproductive ecology throughout the year in relation to mean
rainfall recorded on Coiba Island.
The capture rate was highest in April (80.4%) and May (13.4%) and decreased
over subsequent months (from 2.7 to 0.9%). Of those, 83.9% were captured once,
13.4% twice, and 0.9% three, four, and five times, respectively. The individual mean
measurements throughout the study were TL = 30.4 ± 5.0 cm, SVL = 15.0 ± 2.8 cm,
TaL = 15.4 ± 2.3 cm, HL = 4.7 ± .9 cm, HW = 2.4 ± 0.3 cm, and mass = 80.0 ± 50.0 g
(n = 112). The individual mean measurements in the last month (maximum size
recorded) were TL = 52.9 ± 3.6 cm, SVL = 27.3 ± 1.8 cm, TaL = 25.7 ± 1.9 cm, HL =

Texas Tech University, Sergio A. Balaguera Reina, May 2018
22
8.6 ± .8 cm, HW = 3.9.4 ± 0.0 cm, and mass = 350.0 ± 80.0 g (n = 2). We did not find
a statistically significant linear relationship among any of these variables (TL, SVL,
and W = n: 142, linear regression P > 0.05), nor the period of time evaluated (months).
A nonlinear regression test determined that Gompertz’s model (Gompertz 1825) best
described the growth through these two age states (hatchlings and juveniles) from
April–December, with all terms of the model contributing significantly (P < 0.05;
Figure 2-5). TL and SVL growth rates were 0.03–0.16 cm/day and 0.00–0.09 cm/day,
respectively (Figure 2-6).
Figure 2-5. Hatchling-juveniles’ growth registered throughout nine months
(April to December). A nonlinear regression test determined that Gompertz’s
model best describes growth in that period (all terms of the model contributed
significantly, P < 0.05).
In general, all hatchlings stayed close to the nest in both brackish and seawater.
For the first 15 d after hatching, the average distance from the nest at which hatchlings
were found was 1,600 ± 1,030 cm and increased to 17,490 ± 3,370 cm within a month
of hatching. In May we found one hatchling 11,850 cm (in a mangrove forest) from its
hatching site. During July, August, and September, hatchlings showed presumably low
movement (0.005 ± 0.004 km, 0.015 ± 0.012 km, 0.029 ± 0.010 km, respectively). In
October (6 months after hatching) we found one hatchling 2.9 km from the nest site
(Figure 2-2). Although we did not follow hatchling movements systematically, these
long distances traveled must have been by sea as we did not identify any flowing

Texas Tech University, Sergio A. Balaguera Reina, May 2018
23
water sources between the nest sites and these secondary observations and C. acutus
hatchlings and early juveniles do not travel long distances overland (Thorbjarnarson
1989).
Figure 2-6. Total length and snout–vent length growth rates of hatchlings from
April–December 2013. We used eight of the nine months to calculate the
geometric mean and the growth rate, excluding November, because that was
just one datum and an outlier.
At nest 3, we observed a female carrying a hatchling from the nest directly to
the sea, which has not been documented previously for C. acutus. One month after
hatching during the rainy season, we began to see groups of hatchlings in the sea.
Sometimes individuals were seen alone, most likely due to the action of waves and
currents. Even though we did not systematically record hatchling predation, we did
observe the common black-hawk, Buteogallus anthracinus (Deppe 1830), and bare-
throated tiger heron, Tigrisoma mexicanum (Swainson 1834), preying on hatchlings in
the first, second, and third month after hatching (couple sightings per month).
Cannibalism was not observed.
Regarding the population model, in the first case (live recapture), survival-
recapture probabilities time dependent (φ (t), p (t)) was the most accurate model to
describe the data (AICc = 138.39, model likelihood = 1.0, number of parameters =
12). In the second case (POPAN formulation) the survival time dependent recapture-

Texas Tech University, Sergio A. Balaguera Reina, May 2018
24
entrance constant (φ (t), p (.), pent (.), N (.)) was the most accurate model to describe
the data (AICc = 170.39, model likelihood = 1.0, number of parameters = 10).
Hatchling population size was estimated to be 218.6 ± 31.9 SE hatchlings in ca. 22.4
km2 (from Boca Grande to Punta Felipa, 4.5% of Coiba Island area; 95% confidence
interval, lower bound = 164.4; upper bound = 290.6). Based on that model, the
hatchling population estimated for each recapture period was 187.3 ± 9.1 SE
hatchlings in May, 64.2 ± 14.7 SE in June, 7.6 ± 4.1 SE in July, 3.3 ± 1.7 SE in
August, 4.2 ± 1.9 SE in September, 5.1 ± 2.2 SE in October, 6 ± 2.5 SE in November,
and 0.8 ± 0.5 SE in December. The hatchling population decline rate was of 65.7% in
May–Ju ne and 95.9% in July, with only 0.5% of this population surviving
through December (Figure 2-7).
Figure 2-7. Hatchling population size estimated for each recapture event over
nine months (April–December) on Coiba Island based on the POPAN
formulation model.
DISCUSSION
This is the first study to assess the biological, physical, and chemical
conditions of American crocodile nesting areas in the Pacific, as well as hatchling
growth rates. In contrast to the lack of information from the Pacific, information about

Texas Tech University, Sergio A. Balaguera Reina, May 2018
25
nesting and reproductive ecology in the Caribbean has been obtained in coastal
habitats (Ogden 1978, Mazzotti 1983, Platt and Thorbjarnarson 2000b), atolls
(Charruau et al. 2010, Platt and Thorbjarnarson 2000b), some islands (Varona 1980,
Medem 1981, Thorbjarnarson 1988, 1989), and at mainland sites (Medem 1981,
Espinal and Escobedo-Galván 2010; see Table 2-4). Comparing our results with these
studies, the mean clutch size on Coiba (25.2 ± 9.5 eggs) was not significantly different
(one-sample t‑test, P = 0.18) from those reported from mainland Panama (46 eggs,
Breder 1946), Mexico, Banco Chinchorro (16.2 ± 4.6 eggs, Charruau et al. 2010),
Belize (22.3 ± 6.0 eggs, Platt and Thorbjarnarson 2000b), Haiti (22.5 ± 2.7 eggs,
Thorbjarnarson 1989), Florida, USA (45.2 ± 17.2 eggs, Ogden 1978; 38.0 ± 0.4 eggs,
Kushlan and Mazzotti 1989), or in two Colombian populations (mainland 40–60 eggs,
Fuerte Island 18–20 eggs; Medem 1981; Table 2-4). However, we observed that the
mean clutch size of insular populations on Fuerte Island (18–20 eggs), Banco
Chinchorro (16.2 ± 4.6 eggs), Haiti (22.5 ± 2.7 eggs) and Coiba Island (25.2 ± 0.5
eggs) was lower than for mainland populations in Colombia (40–60 eggs), Florida
(38.0 ± 9.4 eggs), and Panama (46 eggs), which might result from the smaller body
size of reproductively mature females on islands (Platt and Thorbjarnarson 2000b).
Clutch size is positively correlated with female body size (Platt and Thorbjarnarson
2000b). In general, 19 eggs have been reported as the minimum number in American
crocodile nests (Ferguson 1985) but studies at Banco Chinchorro (16 eggs), Fuerte
Island (18 eggs), and Coiba (16 eggs) show that this value can be lower and depends
on the minimum reproductive size (MRS) of the female.
There is no consensus about what the MRS is for either female or male
Crocodylus acutus, but it is likely to vary throughout the range of the species
(Thorbjarnarson 1989). Currently, the MRS for mainland males and females is known
from American crocodiles in Colombia (a captive male of 219 cm TL mated with a
female of 236 cm TL; Medem 1981) and Florida, USA (estimated to be 225 cm TL for
females; Mazzotti 1983). The MRS is known for island crocodile populations in Haiti
(Etang Saumatre, females begin nesting at around 220–230 cm TL; Thorbjarnarson
1988), Mexico (Banco Chinchorro, 194 cm TL female; Charruau et al. 2010), and
Texas Tech University, Sergio A. Balaguera Reina, May 2018
26
Belize (Turneffe Island, ≤ 200 cm; Platt and Thorbjarnarson 2000b), which have the
smallest MRS. Other reports of female American crocodile MRS on the mainland are
from Honduras (240 cm TL: Klein 1977), Cuba (270–300 cm; Varona 1980), and
Mexico (280 cm; Alvarez del Toro 1974; Table 2-4). The female MRS recorded on
Coiba was 209 cm, which is comparable to the female MRS reported from other
insular populations in the Caribbean. This is likely to be due to genetic,
environmental, or behavior factors (Thorbjarnarson 1988, Platt and Thorbjarnarson
2000b; Charruau et al. 2010). Additional pressures that have been suggested to lead to
smaller female insular MRS include lack of resources (food, space, freshwater, etc.) or
even concentrated overharvesting (Platt and Thorbjarnarson 2000b).
Mean egg mass, depth to the bottom of the clutch, width of nest, and egg
length in Coiba Island crocodiles (Table 2-2) were higher than in Belize (85.6 ± 9.7 g;
32.8 ± 0.4 cm; 26.0 ± 0.6 cm; 70.5 ± 0.3 mm; Platt and Thorbjarnarson 2000b) and
Banco Chinchorro Atoll (80.0 ± 7.2 g; 32.8 ± 0.6 cm; 24.0 ± 0.6 cm; 69.3 ± 0.4 mm;
Charruau et al. 2010; see Table 2-4). Otherwise, mean depth to top of the clutch,
distance to water, and egg width in Coiba were lower than Banco Chinchorro (17.7 ±
5.5 cm; 1,990 ± 810 cm; 43.3 ± 1.6 mm; Charruau et al. 2010), Belize (23.3 ± 6.3 cm;
distance to water unknown; 44.1 ± 1.6 mm; Platt and Thorbjarnarson 2000b), and
Haiti (no depth to top; 2,750 ± 1,180 m; egg width unknown; Thorbjarnarson 1988).
Volumetric water content (VWC) was measured by Thorbjarnarson (1989) and
Charruau et al. (2010) in Haiti and Banco Chincorro Atoll, with mean values of 6.6 ±
3.1% and 0.11 ± 0.07%, respectively. These values are lower than what we estimated
on Coiba Island (nest 1 and nest 2: 25.44 ± 6.34% and 24.56 ± 8.80%, respectively, at
nest bottoms; 24.66 ± 2.07% and 20.94 ± 8.48%, respectively, at the middle of the
nest). Differences between nests 1 and 2 in Coiba Island may be related to the
presence of canopy cover at the first nest and its absence at the second nest. We were
not able to compare the soil chemical conditions to other localities because
comparative data from other American crocodile nesting sites are unavailable.
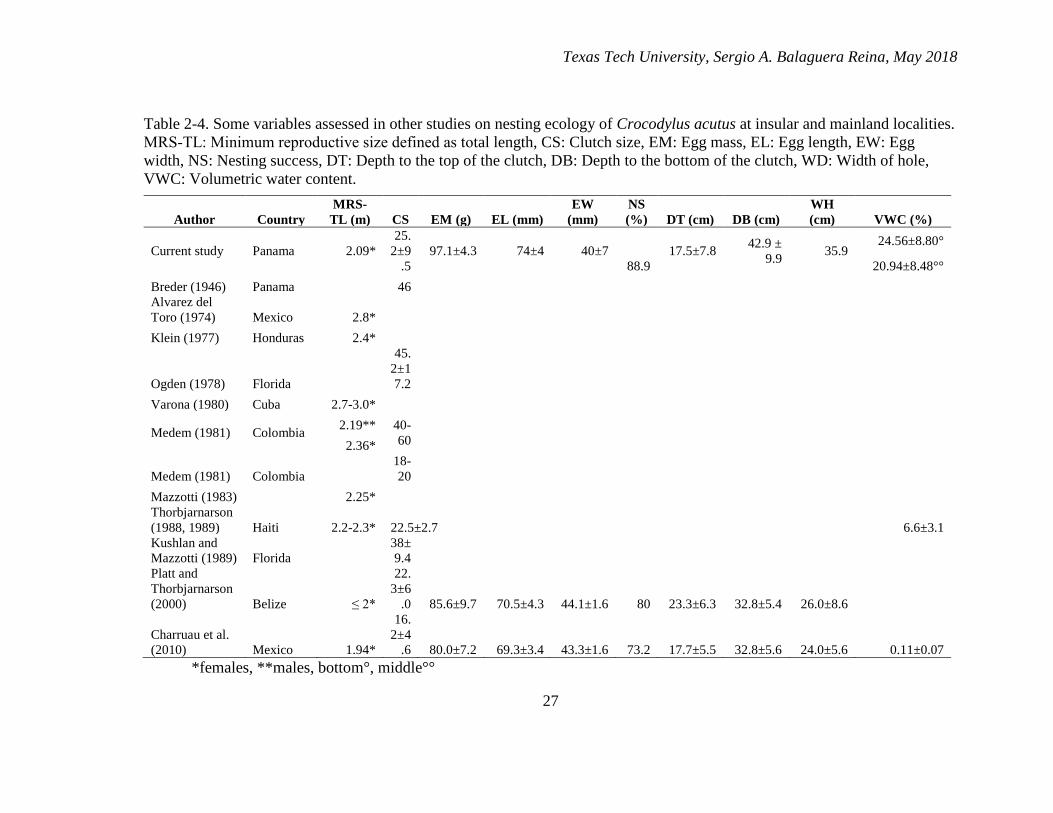
Texas Tech University, Sergio A. Balaguera Reina, May 2018
27
Table 2-4. Some variables assessed in other studies on nesting ecology of Crocodylus acutus at insular and mainland localities.
MRS‑TL: Minimum reproductive size defined as total length, CS: Clutch size, EM: Egg mass, EL: Egg length, EW: Egg
width, NS: Nesting success, DT: Depth to the top of the clutch, DB: Depth to the bottom of the clutch, WD: Width of hole,
VWC: Volumetric water content.
Author Country
MRS-
TL (m) CS EM (g) EL (mm)
EW
(mm)
NS
(%) DT (cm) DB (cm)
WH
(cm) VWC (%)
Current study Panama 2.09*
25.
2±9
.5
97.1±4.3 74±4 40±7
88.9
17.5±7.8 42.9 ±
9.9 35.9
24.56±8.80°
20.94±8.48°°
Breder (1946) Panama 46 Alvarez del
Toro (1974) Mexico 2.8*
Klein (1977) Honduras 2.4*
Ogden (1978) Florida
45.
2±1
7.2
Varona (1980) Cuba 2.7-3.0*
Medem (1981) Colombia 2.19** 40-
60
2.36*
Medem (1981) Colombia
18-
20
Mazzotti (1983) 2.25* Thorbjarnarson
(1988, 1989) Haiti 2.2-2.3* 22.5±2.7 6.6±3.1
Kushlan and
Mazzotti (1989) Florida
38±
9.4 Platt and
Thorbjarnarson
(2000) Belize ≤ 2*
22.
3±6
.0 85.6±9.7 70.5±4.3 44.1±1.6 80 23.3±6.3 32.8±5.4 26.0±8.6
Charruau et al.
(2010) Mexico 1.94*
16.
2±4
.6 80.0±7.2 69.3±3.4 43.3±1.6 73.2 17.7±5.5 32.8±5.6 24.0±5.6 0.11±0.07
*females, **males, bottom°, middle°°

Texas Tech University, Sergio A. Balaguera Reina, May 2018
28
Several authors report that in countries such as Mexico and Cuba females are
territorial towards one another and often compete for nest sites (Alvarez del Toro
1974, Varona 1980). However, in other parts of its range, such as Florida, USA
(Kushlan 1982), Haiti (Thorbjarnarson 1988), Dominican Republic (Thorbjarnarson
1989), and Belize (Platt and Thorbjarnarson 2000b), female crocodiles are apparently
less territorial and may even nest colonially or in small groups. This latter behavior
was observed in Coiba Island (distance between nests at Playa Blanca was 620 ± 30
cm) and at two other nesting areas on the island (south of Playa Blanca and El Maria
beach), where distances between nests were no more than 5,000 cm (1,300 cm
between nest 8 and 9 and 47.3 ± 15.3 m among nests 4, 5, 6, and 7). Although there
were plenty of available (and seemingly suitable) beaches for nesting in Playa Blanca
and El Maria, characteristics such as proximity to freshwater, elevation, and
vegetation cover probably determine nest site selection.
Oviposition in Coiba occurred during the dry season (January) and hatching
was during the beginning of the rainy season (April), consistent with observations by
Breder (1946) on crocodiles from mainland Panama and by Thorbjarnarson (1989) and
Medem (1981) for Crocodylus acutus in Central America, South America, and on
Caribbean Islands. The length of incubation in Coiba (Table 2-2) was comparable to
those reported by Varona (1980) in Cuba (80–90 days), Kushlan and Mazzotti (1989)
in Florida (85 days), Alvarez del Toro (1974) in Mexico (80 days) and Thorbjarnarson
(1989) on Dominic Republic (84 days). Alvarez del Toro (1974) and Varona (1980)
reported that oviposition can follow courtship by 1 or 2 months, and gravid females
begin to visit potential nesting areas 4–6 weeks before laying the clutch
(Thorbjarnarson 1988). Courtship activity on Coiba most likely starts in November
and females visit potential nest sites in December. We did not observe any agonistic
behavior or courtship activity in coastal areas. It is highly probable that any such
events happened in internal water bodies (mangroves or close rivers and creeks) where
we did not survey.
Parental behaviors were observed during both nesting and hatching periods.
We gathered information about continued nocturnal visits of mothers to nests

Texas Tech University, Sergio A. Balaguera Reina, May 2018
29
throughout the nesting period, revealing active nocturnal parental care. We did not
encounter nest defense behavior toward researchers during the day over the nest, likely
due to low diurnal activity in those areas. Some authors report that such behavior is
common in places in inland Panama (Dugan et al. 1981), Mexico (Alvarez del Toro
1974), and Cuba (Varona 1980). On the other hand, at Florida, USA and Haiti it has
been reported that females provide little or no nest protection (Ogden 1978,
Thorbjarnarson 1988, Platt and Thorbjarnarson 2000b). After hatching there was a
short period (2–3 weeks) with parental care (adults in the water with hatchlings
responding to distress calls), but once hatchling-juveniles started to disperse from the
nurseries adults were no longer observed in the area. This lack of extended maternal
behavior period in the American crocodile has also been reported in Panama (Rodda
1984), Haiti (Thorbjarnarson 1988), Florida, USA (Kushlan and Mazzotti 1989), and
Belize (Platt and Thorbjarnarson 2000b). Coiba Island was a prison from 1919–2004,
when it finally closed (Ibáñez 2011). This suggests that coastal crocodile populations
were probably subjected to hunting for a long time and were displaced to inland areas
not inhabited by humans. Therefore, we might be witnessing population expansion or
a re-colonization of suitable habitats where this species occurred historically.
Natural hatching success in Coiba was highly variable among females (6.3–
100%), likely due to differences in female size and behavior. On average, Coiba had
lower natural hatching success (68.3%) compared to other insular and coastal
localities such as Banco Chinchorro (73.2%) and Belize (80.0%). On five occasions,
after mother crocodiles left the nest, we found eggs piping and hatchlings trying to dig
towards the surface, which, without our aid, probably would have died. Therefore, it is
likely that the low hatching success is not primarily due to external conditions or
predation, as has been commonly reported elsewhere (Mazzotti 1999), but due to
differences in parental behavior. For example, in one nest the female helped only a
single hatchling, leaving the others inside the nest. This minimal level of parental
investment might be correlated with overharvesting in the past, which can reduce the
amount of observed parental care (Thorbjarnarson 2010).
Texas Tech University, Sergio A. Balaguera Reina, May 2018
30
Habitats in nesting areas showed evidence of ecosystems in the process of
restoration, probably since 2004 when the prison on Coiba was formally closed. A
mosaic of dry, riparian, and mangrove ecosystems are the result of anthropogenic
impacts (Ibáñez 2011). Based on information collected from people that worked in the
area until the prison was closed (pers. com.), crocodiles were not commonly seen
nesting in or around our study sites.
We caught newly hatched hatchlings on Coiba with a minimum size of 25 cm
TL, 11.90 cm SVL, and 40 g. These values were lower than the values reported by
Platt and Thorbjarnarson (2000b) in Belize (one-week-old hatchling minimum TL =
26.2 cm, SVL = 12.4 cm, mass = 46 g) and greater than those reported by Charruau et
al. (2010) in Banco Chinchorro (minimum = TL 23 cm, SVL = 11.5 cm, mass = 30 g)
and Thorbjarnarson (1988) on Haiti (TL 24.4 cm). Growth rates for hatchlings on
Coiba ranged between 0.03 and 0.16 cm/day compared to 0.13 ± 0.04 cm/day for
hatchlings from Haiti over the first 65–86 days (Thorbjarnarson 1988). On the other
hand, few studies on survival rates have been carried out for C. acutus hatchlings. We
found a high hatchling population decline rate during the first 2 months and a lower
decline rate following those months until the eighth month. For crocodiles in general,
apparently the first 2–3 months are critical, and nursery habitats play an important role
in hatchling survival (Thorbjarnarson 1889). We found early dispersal of these
hatchlings (0.017 ± 0.033 km after first month since hatching), likely related to the
low cover of the nursery areas (mainly mangrove and riparian forest in regeneration)
and the high number of predators (mainly large fishes, sharks, and birds) present.
Based on the mean nest size on Coiba (25.2 ± 4.3 eggs) and the hatchling
population estimates (218.6 ± 31.9 SE), a plausible number of nests for this area in
2013 could be 8.7 ± 0.8. We found 10 nests, which is very similar to the number of
nests estimated for the gross population based on mark-recapture analysis. This
suggests that we likely found most, if not all nests in that area.
Our results suggest that availability of suitable nursery areas in Coiba might be
playing a more important role in the population growth of American crocodile than

Texas Tech University, Sergio A. Balaguera Reina, May 2018
31
physical conditions. Although we did not assess these habitats in depth, the presence
of human impacted ecosystems in the process of regeneration and personal
observations about predation might be related to the low hatchling survival rates.
In conclusion, American crocodile reproductive ecology on Coiba Island
showed patterns more closely related to insular habitats in the Caribbean islands than
to mainland areas. Although some topics such as courtship and mating will require
more research to determine where, when, and which variables might influence these
behaviors, we obtained a good glimpse into nesting and hatching behavior. The low
incidence of infertile, dead, and unhatched eggs and predation suggest that nesting
beaches on Coiba are characterized by optimal conditions to carry on successful
nesting. However, minimal parental care might play an important role in the low
hatching success that we observed. There is still very little information about survival
rates of hatchlings in this species; however, we think that the low number and poor
quality of nurseries on Coiba’s coastal line are correlated with early hatchling
dispersal to the exposed areas (beaches, sea, and rocky coastline) and the low survival
rate after 9 months. For this reason, habitat conservation plans and in-depth research
on the relationship(s) between habitat conditions and demography of this species
should be a priority in future conservation management plans on Coiba Island.
Texas Tech University, Sergio A. Balaguera Reina, May 2018
32
CHAPTER III
POPULATION ECOLOGY
Balaguera-Reina S. A., M. Venegas-Anaya, B. Rivera-Rivera, D. A. Morales,
Ll. Densmore III. How to estimate population size in crocodylians? Population
ecology of American crocodiles in Coiba Island as a study case. Ecosphere.
INTRODUCTION
A key attribute population ecologists try to elucidate or at least estimate is the
population size of a species in a defined area, mainly because this provides the
information needed to measure ecological change (Thompson 2002) and provides
relevant insights about the conservation status of the species (Lettink and Armstrong
2003). To accomplish this, direct methods such as censusing and mark-recapture have
been developed and improved through time, obtaining accurate and useful outcomes
for several species (Southwood and Henderson 2003). There also have been ways
developed to estimate this attribute indirectly from non-conspicuous species where
direct methods are inefficient and/or ineffective (Southwood and Henderson 2003).
Historically, crocodylian population sizes have been estimated indirectly via
spotlight surveys based on sighting fractions (Messel et al. 1981, King et al. 1990) and
directly via mark-recapture (Murphy 1980, Bayliss et al.1986). The former method
was designed specifically for crocodylians based on two primary equations, whereas
the latter is the common mark-recapture method applied broadly in population ecology
since Petersen (1896) and Lincoln (1930). Messel et al. (1981) defined sighting
fraction (p) as:
Eq1. 𝑝 =𝑋
∑ 𝑚𝑎𝑥𝑆𝐶𝑖=1
Texas Tech University, Sergio A. Balaguera Reina, May 2018
33
where 𝑋 is the average number of crocodiles spotted and max is the maximum
number of crocodiles seen within each size class (SC), assuming field data fit a
theoretical binomial distribution. In contrast, King et al. (1990) defined p as:
Eq. 2. 𝑝 =𝑋
(2𝑆𝐷+ 𝑋)1.05
where SD is the standard deviation of the data, assuming normal distribution.
Both equations attempt to estimate the unknown relationship between the sample
population and the true population. Based on solving these two equations, Messel et
al. (1981) and King et al. (1990) defined the crocodile population size (N) as:
Eq. 3. 𝑁 =𝑋
𝑝±
[1.96(𝑆𝐷)]1/2
𝑝
with a 95% confidence interval (CI). However, even though these efforts have
brought important insights regarding the ecology of some crocodylian species, because
the data distribution must fit a theoretical distribution to estimate sighting fractions,
meeting the inherent statistical assumptions is not easy to achieve in natural
populations. Furthermore, some of these methods can drastically underestimate true
population sizes (Webb et al. 1989), making it necessary to define correction factors
derived from empirical experience (Messel et al. 1981) or direct-indirect method
adjustments (Bayliss et al. 1986, Hutton and Woolhouse 1989).
Regarding direct methods, mark-recapture has been the preferred technique to
estimate crocodylian population sizes mainly using the Petersen-Lincoln (Murphy
1980, Bayliss et al, 1986, Hutton and Woolhouse 1989) and Jolly-Seber (Garcia-
Grajales et al. 2007, Espinosa et al. 2012) models. All are based on the same four
basic assumptions: 1) marking does not affect individuals, 2) marked and unmarked

Texas Tech University, Sergio A. Balaguera Reina, May 2018
34
individuals are completely mixed in the population, 3) capture probabilities for both
marked and unmarked individuals are the same regardless of sex or age group, and 4)
sampling must be at discrete time intervals (Southwood and Henderson 2003).
However, because crocodylians are not conspicuous in the field and have cryptic
habits, hierarchal demographical structure (both temporally and spatially), a wide
range of body sizes (i.e., from 0.25 to 6 m in some species), and considerable habitat
diversity (Medem 1981, Thorbjarnarson 1989, Balaguera-Reina et al. 2015b), these
general assumptions are difficult to meet, often yielding high levels of uncertainty in
estimated numbers of crocodylians.
American crocodile (Crocodylus acutus) populations are no exception to this
rule due to the lack of thorough research in many localities, ecological constraints (as
stated above), and scarcity of integrative analyses assessing strengths and flaws of
estimation methods and their applicability. This species has the largest range of all
crocodylians in the New World, inhabiting both coasts (Pacific and Atlantic -
Caribbean) from 0 to 500 m above sea level (Thorbjarnarson 2010). However, even
with this widespread range, C. acutus is considered as Vulnerable (Ponce-Campos et
al. 2012) and is threatened in most of the countries where it occurs (Thorbjarnarson
2010) Thus, a standardized method for estimating the population size in American
crocodiles with a clearly defined level of certainty must be a priority to measure
ecological change as well as to robustly define the current conservation status of the
species.
Herein, we estimate the population size of American crocodiles on the
southern tip of Coiba Island, Panama, using both spotlight surveys (Messel’s and
King’s visible fraction estimations) and mark-recapture (POPAN formulation-
superpopulation) methods. We assess and compare the outcomes of these methods
with the overall capture record for the area from 2009 to 2013, discussing the
applicability, accuracy, strengths, and limitations of the methods. We also propose a
novel way to indirectly estimate population sizes based on sampling distribution
estimations, discussing its applicability as well as strengths and limitations. Finally,
we estimate several other population attributes (relative abundances, demographic

Texas Tech University, Sergio A. Balaguera Reina, May 2018
35
structure, and sex ratio), increasing our understanding of C. acutus population ecology
in insular areas.
MATERIALS AND METHODS
Study area
The coastal zone of the study area encompasses tide-modified reflective
beaches with high tide range (~3 m) and low waves based on Short’s (2006)
classification. Tidal mud flats, sand flats, and low tide terraces are the most common
types of beaches occurring in the area with medium and low sand banks across them.
Shoreline vegetation is characterized by mangrove areas primarily comprised of
Rhizophora mangle (red mangrove) and Avicennia germinans (black mangrove), and
secondary tropical rain forest and riparian forest (Ibañez 2006). Seasonal
freshwater/brackish streams and flooded areas are present in Playa Blanca and El
Maria beaches (Balaguera-Reina et al. 2015b). However, Coiba conditions are hardly
dry from December to April (precipitation < 200 m) with maximum precipitation in
October (around 600 mm; ETESA 2015).
Data collection
We assessed the population size of American crocodiles as well as their
relative abundance, demographic structure, and sex ratios from Playa Blanca to El
Maria beaches on Coiba Island, Panama, using two methods, spotlight surveys and
mark-recapture. To do so, we defined two teams [spotlight team (one researcher) and
capture team (3 researchers)] who assessed four transects (T1:3.3 km, T2: 2.4 km, T3:
2.2 km, T4: 2 km) each separated by 300 m, from February to December 2013. These
transects were monitored by foot at night along the coast throughout four habitats
(beach, mangrove, riparian forest, and rocky coastline) (Figure 3-1). Transects 1 and 4
were characterized by large areas of mangrove and secondary tropical rain forest with
seasonal sources of freshwater and fine-grain beaches with medium sand banks.
Transect 2 included an exposed wind area with shingle beaches and a mangrove
muddy area with low wave incidence. Transect 3 consisted of a shingle beaches with

Texas Tech University, Sergio A. Balaguera Reina, May 2018
36
small mangrove stands across it as well as drastic changes in slope dominated by
tropical rain forest (Figure 3-1). We searched for American crocodiles across open
areas and walkable zones with fresh/brackish water (inside of mangrove areas),
avoiding negative effects in visibility and rate of progress.
Even though the method as described in the present study is not the ‘standard’
survey technique reported elsewhere (Chabreck 1963, Messel et al. 1981, King et al.
1994, Platt and Thorbjarnarson 2000a), it could be defined as ‘appropriate’ to survey
tidal coastal areas in an efficient manner because: 1) foot surveys can potentially
create less disturbance (i.e., less noise and water movement) compared to vessel
surveys, increasing the likelihood of an efficient approach to the animal, 2) the speed
of progress through the transect will not be directly affected by the tide, and 3) it is
logistically feasible given the study site conditions while boat surveys are not.
However, the major limitation of foot surveys is the distance covered by night (e.g.,
around 3 km) comparing with boat surveys (e.g., around 20 km).
Pre-sampling
Tide has a strong effect on the number of crocodiles spotted in any survey
since it increases or decreases habitat availability, affecting also the effective sampled
area (Messel et al. 1981). In our case, it also defines the time when coastal areas are
“walkable” after the highest tide. We pre-sampled the study area in January 2013 to
determine the holding time required after the highest tide to survey transects, allowing
us walk through them and spotlight the maximum number of American crocodiles. We
also defined the time needed between spotlight and capture teams per transect to
minimize effects on the number of animals spotted by the two teams. In the former
case, we walked throughout four transects during three weeks doing spotlight surveys.
We found that 2 hours was the best time to do for the first transect and 3 hours for the
last three due to distance from basecamp. In the latter cases, we monitored these
transects for two weeks, increasing the time between spotlight and capture teams by
10 minutes each day up to 50 minutes, determining that 30 mins was the best time in
between groups with no effect on the number of animals spotted.

Texas Tech University, Sergio A. Balaguera Reina, May 2018
37
Figure 3-1. Study area on Coiba Island, Panama, highlighting the transects we
followed across 2013 (T1:3.3 km, T2: 2.4 km, T3: 2.2 km, T4: 2 km) as well as
the area estimated based on a 150-m buffer around each transect.

Texas Tech University, Sergio A. Balaguera Reina, May 2018
38
Sampling
Spotlight and mark-recapture surveys were carried out per transect one night at
monthly intervals sequentially using industrial Rayovac headlamps (405 lm), always
during the new moon phase (Medem 1981). Transects always followed open areas
through the beach and rocky coastlines, spotlighting in both directions; i.e., nearshore
oceanic water and shoreline vegetation/rocky areas. The former was only limited by
the distance reached by the light beam and the latter was inspected doing incursions
under the vegetation to make sure we were not leaving animals unspotted. Crocodiles
were detected by the reflection of light from their eyes (Chabreck 1963), getting as
close as possible to the animal to geo-locate it and to estimate its total length (spotlight
team) or capture it (mark-recapture team). Special attention was paid on the time spent
collecting information from an animal by the spotlight team due to the effect it could
have on the sampling. Thus, a single uninterrupted, fast-as-possible traverse of each
transect was performed in every survey. For mark-recapture, animals were captured by
noosing (Chabreck 1963) with handcrafted PVC catch poles within a 3-minute capture
window. After this time, if the capture was not accomplished, information about the
animal was recorded as “non-captured” and we resumed looking for other individuals
along the transect. If captured, animal was marked by scute notching using the single
and double crest on the tail following a numerical sequence, sexed (via cloacal
probing), and measured (total length-TL and weight). We used a 20-minute time limit
for the process, trying to reduce the effect it could have on the encounter rate of
individuals across the transect.
We classified animals counted in spotlight surveys by size class (I: < 60 cm, II:
61-120 cm, III: 121-180 cm, IV: 181-240 cm, V: > 240 cm; Seijas 1988) or eyes only
(EO) if the animal submerged before size could be estimated (Messel et al. 1981), and
individuals captured and measured by age group (juvenile TL 30–90 cm, sub-adult TL
91–180 cm, and adult TL > 180 cm; Platt and Thorbjarnarson 2000a). This was
because size classes are assigned arbitrarily (i.e., every 60 cm) with the sole purpose
of reducing the estimation error to a range (e.g., class II between 60 to 120 cm; Messel
et al. 1981). In contrast, age groups represent life stages based on reproductive and
Texas Tech University, Sergio A. Balaguera Reina, May 2018
39
ecological features measured directly from the animal. Even though these two
concepts are sometimes used interchangeably, they have serious implications on the
ways one can interpret and analyze the data collected.
Paired t-tests (P-t) were performed in R (R Development Core Team 2012) to
determine any differences in the number of American crocodiles spotted between
methods (spotlight and mark-recapture) per transect and for the whole study. Average
nearest neighbor analyses were done using ArcGIS 10.4.4 (ESRI, 2016) to define
spatial distribution patterns of American crocodiles in the whole study area, assessing
differences between them.
Spotlight surveys data analyses
We estimated the relative abundance [individuals per km (ind/km)] and the
population structure observed in the area per month and per transect as well as
throughout the whole year. Shapiro-Wilk and Bartlett analyses were performed to test
for normality and homoscedasticity of the data, respectively. Kruskal-Wallis analyses
were run to test for differences in the number of crocodiles spotted among transects
and months.
Population size was estimated by transects and for the whole study based on
three methods: the sighting fraction approximations postulated by Messel et al. (1981)
and King et al. (1990), and a novel sighting fraction approach developed during this
study:
Eq. 4. 𝑝 = 𝑋
max(1.96(𝑆𝐸 × 𝑛12))
where SE is the standard error of the sampling distribution and n is the number
of surveys. To obtain the necessary information to solve this equation, we ran a
balanced bootstrap analysis 100,000 times via package boot in R (Canty and Ripley
Texas Tech University, Sergio A. Balaguera Reina, May 2018
40
2016), estimating the sampling distribution of 𝑋 and its SE by transects and for the
whole study. We also estimated 95% CI based on the adjusted bootstrap percentile
interval. Sightings from class I with a TL estimated < 35 cm were not included in
these analyses because they likely hatched in the area in April or May; fewer than 95%
of these animals will survive until July due to the low recruitment rate present in the
area (Balaguera-Reina et al. 2015b).
Mark-recapture data analyses
We analyzed mark-recapture data using MARK 8.1 software (White and
Burnham 1999) based on the POPAN formulation, where φ represents the apparent
survival parameter, p the recapture parameter, β the entry probability, and N the initial
population size (Schwarz and Arnason 1996). Recapture data were grouped by sex
[females (f), males (m), and not determined (nd)] and age group [hatchlings (h),
juveniles (j) and sub-adults (s)], assessing four models for each set: 1) full time
dependence {φ(t), p(t), β (t)}, 2) no time dependence {φ(.), p(.), β (.)}, 3) either nd and
h allowed to vary as a) {φ[.(f*m)], p[.(f*m)], β [.(f*m)], φ[t(nd)], p[t(nd)], β [t(nd)]},
or b){φ[.(j*s)], p[.(j*s)], β[.(j*s)], φ[t(h)], p[t(h)], β[t(h)]}, 4) and either m and nd and j
and h allowed to vary as a){φ[.(f)], p[.(f)], β[.(f)], φ[t(m*nd)], p[t(m*nd)], β[t(m*nd)]},
or b) {φ[.(s)], p[.(s)], β[.(s)], φ[t(j*h)], p[t(j*h)], β[t(j*h)]}. We did not include adults
due to the lack of occurrence in the capture data and we assumed non-time
dependence in sub-adults and females for all models. This assumption was made
because several studies have shown that older American crocodiles are more stable
(i.e., have smaller home ranges) in the population compared to younger animals and
that males have larger utilization distribution areas than females (Balaguera-Reina et
al. 2016). The “not-determined” sex group encompassed individuals ≤ 45 cm TL due
to the impossibility of differentiating a clitoris from a penis at these small sizes.
We used a sin link function to estimate survival and recapture parameters, a
mlogit(1) function to estimate entry parameters, and a log link function to estimate
superpopulation size as recommended by Cooch and White (2007) for this
formulation. We used an information-theoretical approach to model selection (Akaike

Texas Tech University, Sergio A. Balaguera Reina, May 2018
41
information criterion [AIC]), considering that models with ΔAICc values less than 2
were well-supported by the data, whereas those models with ΔAICc values greater
than 10 were not supported (Burnham and Anderson 2002). We estimated goodness-
of-fit chi-squared values from the model with the lowest AIC using RELEASE
software (Burnham et al. 1987), which is available within MARK, to assess how well
these models fit the data. The chi-squared values were added for the entire sampling
period and divided by the degrees of freedom to estimate the c-hat (ĉ). Values of 1
indicated good model fit, between 1 and 3 indicated moderately good fit, and >3
indicated probable violation of model assumptions (Williams et al. 2011). In the case
when ĉ values were <1 (under-dispersed) we raised them to 1 following
recommendations from Cooch and White (2007).
Capture efficiency was estimated based on the number of individuals captured
over the total number of individuals seen for all transects and for the whole study. The
size of the study area was estimated based on transect distances from Playa Blanca to
the El Maria beaches plus a 150-m buffer estimated via ArcGIS 10.4 (ESRI 2016)
based on the estimated distance reached by the light beam from the shoreline out to the
sea. We report the accuracy of sample means using a standard deviation (SD) for data
distribution and standard error (SE) for sampling distribution with 0.05 as the critical
value, claiming significance when probabilities were below this threshold.
RESULTS
We spotted a total of 206 American crocodiles in the spotlight surveys and 189
in the mark-recapture assessments (Table 3-1) across 2.93 km2 (𝑋 = 0.73 ± 0.06 km2;
Figure 3-1). We found no statistically significant differences in the number of animals
observed by these two methods on any of the four transects (P-t df = 10, p-value =
0.78, 0.23, 0.05, 0.89, respectively) or between months (P-t df = 43, p-value = 0.45).
Spatial distribution patterns were, for the most part (e.g., February-May and
September), clustered by both methods (z-score = < -1.96, p-value = 0.00). However,
we found some discrepancies in patterns between methods in June (from clustered to

Texas Tech University, Sergio A. Balaguera Reina, May 2018
42
random), August (from random to clustered), October (from clustered to random), and
November (from dispersed to clustered; Appendix 3-1).
Spotlight survey
From the 206 American crocodiles observed, 24.8% were classified as EO,
39.8% as class I, 13.6% as class II, 16.5% as class III, 3.9% as class IV, and 1.5% as
class V (Figure 3-2). Crocodiles registered as EO were likely large animals (classes IV
and V) as they are warier than the small ones (Webb and Messel 1979). We did not
find significant differences among the number of individuals observed among
transects (K-W 𝑋2 = 6.99, df = 3, p-value = 0.07) and among months (K-W 𝑋2 =
18.49, df = 10, p-value = 0.05), even though values approached significance. The
average relative abundance per month ranged from 9.0 ± 8.3 ind/km in May to 0.6 ±
0.5 ind/km in November (Figure 3-2). However, when we eliminated May due to
sightings that were mainly hatchlings, the maximum relative abundance value reported
was reduced to 3.6 ± 2.2 ind/km in April.
Sighting fractions ranged between 0.32 and 0.35 for Messel’s equation, 0.37
and 0.57 for King’s equation, and from 0.06 (0.04 – 0.09) to 0.23 (0.18 – 0.26) for our
equation (Table 3-2). Population size (N) estimates based on Messel’s visible fraction
equation ranged between 5 ± 6.18 and 11 ± 8.61 crocodiles, with a total of 19 ± 7.5
crocodiles for the whole study area. N varied between 4.32 ± 3.81 and 13.19 ± 7.37
crocodiles, with a total of 25 ± 7.25 crocodiles based on King’s visible fraction
equation. Finally, N ranged from 11.05 (8.10 – 17.54 CI) to 78.66 (51.66 – 124.73)
crocodiles, with a total of 217.38 (163.03 – 284.96) crocodiles based on our visible
fraction equation. Overall population densities were estimated at 6.48 and 8.77
American crocodiles/km2 based on Messel’s and King’s approaches, respectively, and
74.19 ind/km2 based on our approach.

Texas Tech University, Sergio A. Balaguera Reina, May 2018
43
Table 3-1. American crocodiles observed by the spotlight (ST) and capture (CT) teams
by transects and during the entire study (Total) on Coiba Island, Panama, highlighting
the total number of animals observed as well as the mean and standard deviation (SD).
We also included the total number of American crocodiles captured (TAC) by the
capture team.
Month Transect 1 Transect 2 Transect 3 Transect 4 Total
TAC ST CT ST CT ST CT ST CT ST CT
Feb 3 3 13 5 6 4 3 2 25 14 3
Mar 4 0 9 5 4 3 3 2 20 10 4
Apr 11 27 9 4 2 1 5 3 27 35 27
May 35 30 6 5 2 3 22 21 65 59 27
Jun 1 1 4 3 2 2 12 10 19 16 6
Jul 1 0 2 1 3 1 1 5 7 7 4
Aug 1 2 4 4 2 2 4 4 11 12 5
Sep 3 3 3 5 1 0 2 6 9 14 5
Oct 2 1 3 2 1 1 4 5 10 9 6
Nov 1 0 1 5 0 0 3 2 5 7 3
Dec 0 0 2 3 2 1 4 2 8 6 2
Total 62 67 56 42 25 18 63 62 206 189 92
Mean 5.64 6.09 5.09 3.82 2.27 1.64 5.73 5.64 18.73 17.18 8.36
SD 9.72 10.64 3.58 1.34 1.54 1.23 5.82 5.38 16.30 15.27 8.87
Mark-recapture
From the 189 American crocodiles observed by the capture team, 51.3% (97
individuals) were not captured, 37.0% (70 individuals) were captured once, and 11.6%
(22 individuals) were recaptured at least once, with an overall mean capture of 8.36 ±
8.87 per month (Table 3-1). From these, 17 were sub-adults, 39 were juveniles, and 25
were hatchlings, 11 of which reached the subsequent age group (from hatchlings to
juveniles) between the capture/recapture time (April and May, respectively).

Texas Tech University, Sergio A. Balaguera Reina, May 2018
44
Figure 3-2. American crocodile relative abundance by months (top) and by
transects (bottom) as well as the demographic structure by size classes
(middle) found throughout all 2013 in Coiba Island, Panama, expressed as
median and quartiles with whiskers at minimum and maximum values. Outliers
are represented as open circles.
Texas Tech University, Sergio A. Balaguera Reina, May 2018
45
We found significant differences in the number of individuals observed among
transects (K-W 𝑋2 = 11.86, df = 3, p-value = 0.01) but not among months (K-W 𝑋2 =
11.61, df = 10, p-value = 0.31). Capture efficiency ranged between 21% in February
and 77% on April, with a mean of 45 ± 15%. Juveniles (40.3%) and hatchlings
(37.3%) were the age groups captured the most, followed by sub-adults (22.4%). No
adults were captured during the entire study. Animal capture sizes and weights ranged
from 25 to 168.7 cm TL and 0.035 to 15.5 kg, with a sex ratio of 1:1.6 (9 females:14
males).
The “time-dependence by sex” model and the “hatchlings-allowed-to-vary by
age groups” model had the lowest AIC (121.95 and 119.55, respectively). Survival,
recapture, and entry probabilities were highly variable among both sex and age groups
(Table 3-3). Initial population size (N) by sex was 62.67 (18.67 – 330.11) females,
29.82 (21.49 – 58.08) males, and 54.60 (43.93 – 124.36) non-sex-determined animals,
with an overall population density of 21.39 ind/km2, 10.18 ind/km2, and 18.63
ind/km2, respectively. In contrast, N by age groups was 25 (25 - 25) hatchlings, 50.87
(44.55 – 64.37) juveniles, and 181.80 (46.31 – 943.52) sub-adults, with an overall
population density of 8.53 hatchlings/km2, 17.36 juveniles/km2, and 62.05 sub-
adults/km2. It is important to highlight that the absence of variation in hatchling’s N is
due to the short period of time being considered; hatchlings become ‘early juveniles’
(from ~25 to 30 cm TL; Platt and Thorbjarnarson 2000a) in about one month
(Balaguera-Reina et al. 2015b).
Gross population estimates (i.e., superpopulation; Schwarz and Arnason 1996)
were similar to the initial population size with some increasing numbers in the case of
sex-not-determined individuals (476.83) and juveniles (293.71; Table 3-4). There were
some possible violations of model assumptions related to homogeneity in survival and
capture probability for sex (χ2 = 3.75, df = 8, p-value = 0.87) and age group (χ2 = 3.28,
df = 10, p-value = 0.97), which might implicate biases in the survival, recapture, and
entry probabilities as the numbers of crocodiles estimated. Values of ĉ were in both
cases < 1, implying that data were under-dispersed likely due to the low numbers of
individuals captured and recaptured throughout the study.
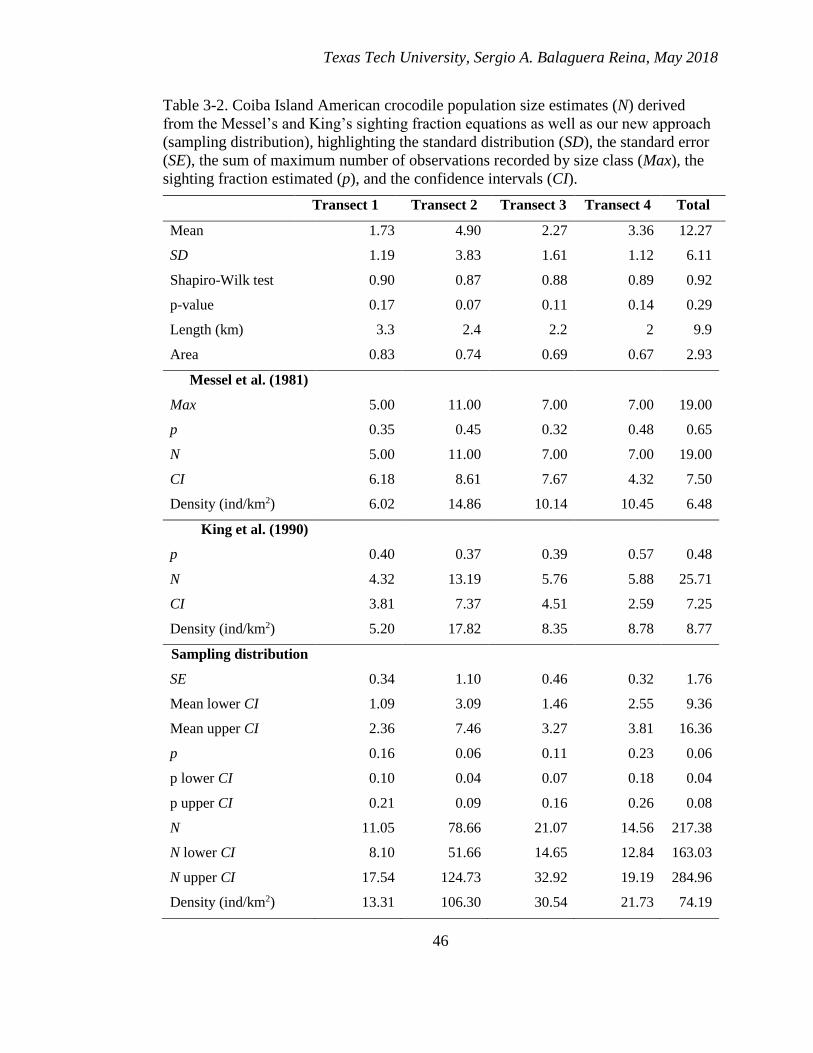
Texas Tech University, Sergio A. Balaguera Reina, May 2018
46
Table 3-2. Coiba Island American crocodile population size estimates (N) derived
from the Messel’s and King’s sighting fraction equations as well as our new approach
(sampling distribution), highlighting the standard distribution (SD), the standard error
(SE), the sum of maximum number of observations recorded by size class (Max), the
sighting fraction estimated (p), and the confidence intervals (CI).
Transect 1 Transect 2 Transect 3 Transect 4 Total
Mean 1.73 4.90 2.27 3.36 12.27
SD 1.19 3.83 1.61 1.12 6.11
Shapiro-Wilk test 0.90 0.87 0.88 0.89 0.92
p-value 0.17 0.07 0.11 0.14 0.29
Length (km) 3.3 2.4 2.2 2 9.9
Area 0.83 0.74 0.69 0.67 2.93
Messel et al. (1981)
Max 5.00 11.00 7.00 7.00 19.00
p 0.35 0.45 0.32 0.48 0.65
N 5.00 11.00 7.00 7.00 19.00
CI 6.18 8.61 7.67 4.32 7.50
Density (ind/km2) 6.02 14.86 10.14 10.45 6.48
King et al. (1990)
p 0.40 0.37 0.39 0.57 0.48
N 4.32 13.19 5.76 5.88 25.71
CI 3.81 7.37 4.51 2.59 7.25
Density (ind/km2) 5.20 17.82 8.35 8.78 8.77
Sampling distribution
SE 0.34 1.10 0.46 0.32 1.76
Mean lower CI 1.09 3.09 1.46 2.55 9.36
Mean upper CI 2.36 7.46 3.27 3.81 16.36
p 0.16 0.06 0.11 0.23 0.06
p lower CI 0.10 0.04 0.07 0.18 0.04
p upper CI 0.21 0.09 0.16 0.26 0.08
N 11.05 78.66 21.07 14.56 217.38
N lower CI 8.10 51.66 14.65 12.84 163.03
N upper CI 17.54 124.73 32.92 19.19 284.96
Density (ind/km2) 13.31 106.30 30.54 21.73 74.19

Texas Tech University, Sergio A. Balaguera Reina, May 2018
47
Table 3-3. “No time dependence by sex” model (female, male, and no determined) and
“hatchlings-allowed-to-vary by age groups” model (juveniles and subadults)
parameters estimated via POPAN formulation, highlighting the standard error (SE)
and the lower and upper confidence intervals (CI) by each parameter (φ, p, and β).
Since hatchlings results were time-dependent, their results (described by months) are
not included in this table.
Female Male No determined Juvenile Subadult
Survival (φ) 0.88 0.97 0.28 0.43 0.87
SE 0.09 0.05 0.07 0.06 0.07
Lower CI 0.59 0.59 0.16 0.32 0.67
Upper CI 0.98 1.00 0.44 0.55 0.96
Recapture (p) 0.03 0.10 0.77 0.77 0.02
SE 0.03 0.03 0.20 0.04 0.02
Lower CI 0.00 0.05 0.27 0.69 0.00
Upper CI 0.17 0.17 0.97 0.83 0.11
Entry (β) 0.00 0.00 1.00 1.00 0.00
SE 0.00 0.00 0.00 0.00 0.00
Lower CI 0.00 0.00 0.00 0.00 0.00
Upper CI 0.00 1.00 1.00 1.00 1.00
Initial population (N) 62.67 29.82 54.60 50.87 181.80
SE 60.84 8.14 15.45 4.78 178.49
Lower CI 18.67 21.49 43.93 44.55 46.31
Upper CI 330.11 58.08 124.36 64.37 943.52
DISCUSSION
This study is one of the few investigations with crocodylians that provides
population size estimates based on both direct (mark-recapture) and indirect
(spotlight) methods which permits comparison and discussion regarding the methods’
effectiveness, robustness, and applicability. Comparisons of data collected from both
spotlight and mark-recapture methods showed no significant differences with respect
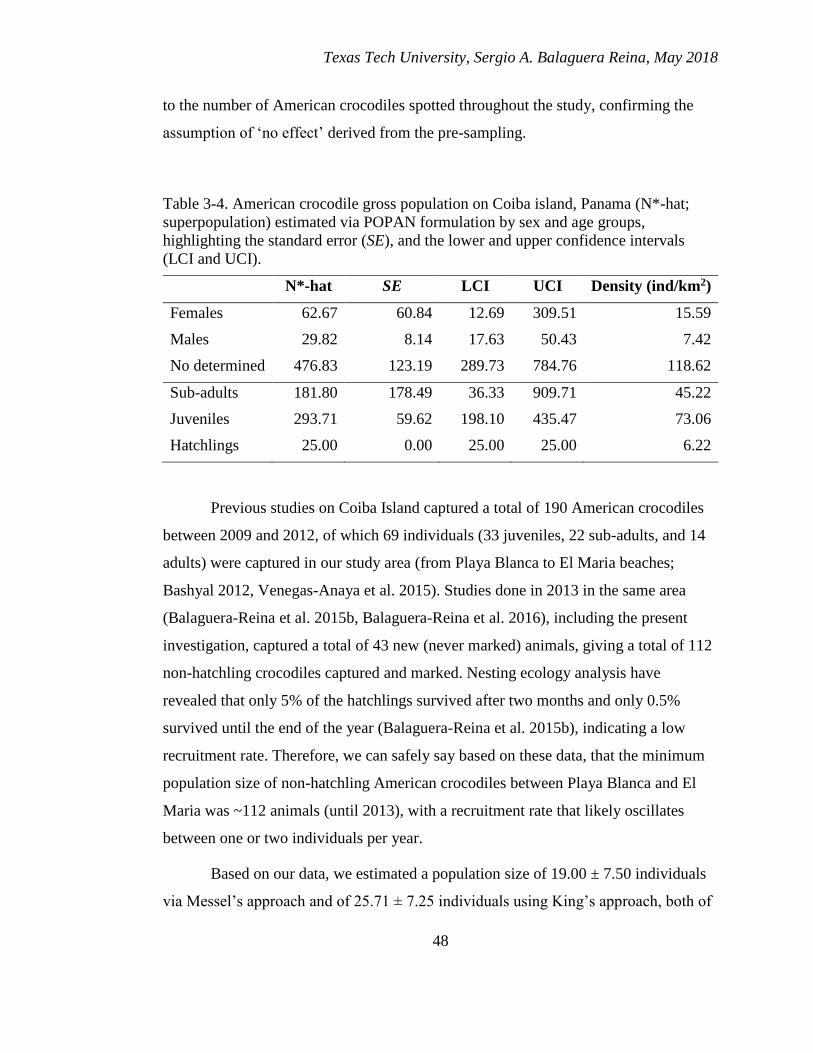
Texas Tech University, Sergio A. Balaguera Reina, May 2018
48
to the number of American crocodiles spotted throughout the study, confirming the
assumption of ‘no effect’ derived from the pre-sampling.
Table 3-4. American crocodile gross population on Coiba island, Panama (N*-hat;
superpopulation) estimated via POPAN formulation by sex and age groups,
highlighting the standard error (SE), and the lower and upper confidence intervals
(LCI and UCI).
N*-hat SE LCI UCI Density (ind/km2)
Females 62.67 60.84 12.69 309.51 15.59
Males 29.82 8.14 17.63 50.43 7.42
No determined 476.83 123.19 289.73 784.76 118.62
Sub-adults 181.80 178.49 36.33 909.71 45.22
Juveniles 293.71 59.62 198.10 435.47 73.06
Hatchlings 25.00 0.00 25.00 25.00 6.22
Previous studies on Coiba Island captured a total of 190 American crocodiles
between 2009 and 2012, of which 69 individuals (33 juveniles, 22 sub-adults, and 14
adults) were captured in our study area (from Playa Blanca to El Maria beaches;
Bashyal 2012, Venegas-Anaya et al. 2015). Studies done in 2013 in the same area
(Balaguera-Reina et al. 2015b, Balaguera-Reina et al. 2016), including the present
investigation, captured a total of 43 new (never marked) animals, giving a total of 112
non-hatchling crocodiles captured and marked. Nesting ecology analysis have
revealed that only 5% of the hatchlings survived after two months and only 0.5%
survived until the end of the year (Balaguera-Reina et al. 2015b), indicating a low
recruitment rate. Therefore, we can safely say based on these data, that the minimum
population size of non-hatchling American crocodiles between Playa Blanca and El
Maria was ~112 animals (until 2013), with a recruitment rate that likely oscillates
between one or two individuals per year.
Based on our data, we estimated a population size of 19.00 ± 7.50 individuals
via Messel’s approach and of 25.71 ± 7.25 individuals using King’s approach, both of

Texas Tech University, Sergio A. Balaguera Reina, May 2018
49
which are well below the minimum population size recorded for the area. In contrast,
we estimated a total population size of 217 (163 – 284) individuals based on our novel
approach and between 147 – 257 individuals by sex and age groups, based on the
POPAN formulation. Even though our equation and POPAN formulation estimate
population numbers based on completely different sets of data (spotlight survey and
mark-recapture, respectively), they were both well above the minimum population size
defined for the area and closer to each other in the estimated CI, suggesting that our
equation can be very useful to estimate population sizes in crocodylians based on
indirect methods.
Chabreck (1966) stated that it was possible to estimate population numbers (N)
based on the relationship of the number of nests (nn) present in a defined area and the
proportion of adults in the population (A), females in the adult population (F), and
nesting females in the female population (E) (N=nn/(A×F×E)). Thus, based on the
data collected for several authors through almost 10 years of studies in our study area
(Bashyal 2012, Venegas-Anaya et al. 2015, Balaguera-Reina et al. 2015b, Balaguera-
Reina et al. 2016), the population size using the Chabreck’s approach (nn=10 nest,
A=20/112, F=11/20, and E=10/11), is 119.04 individuals, which is very close to the
value we estimated from the overall capture data for the study area (~112 individuals).
Even so, this is also an underestimation of the American crocodile population size
because it was impossible for us to have captured anything close to all individuals in
the area, since newly non-hatchling animals have been captured and marked (~30
crocodiles) since 2013 (Venegas-Anaya, unpublished).
Source of bias in population size estimations
It is known that the mean number of animals seen in a survey series will
always be below the actual number of individuals present if there is no way to identify
each individual (Southwood and Henderson 2003). However, if we find a way to relate
these data to the number of individuals present in a survey series and can estimate the
variation of the number based on repeated sampling, it can give us a fair estimation of
the fraction we spotted with respect to the “true” population present at the time of

Texas Tech University, Sergio A. Balaguera Reina, May 2018
50
surveys (Messel et al. 1981). Even though Messel’s and King’s sighting fraction
equation attempted to do this, King et al. (1990) underestimated population sizes due
to the inclusion of the mean number of crocodiles seen as main descriptor of the “true”
population, which is clearly below the actual number of crocodiles present in the area.
Although Messel et al. (1981) included a more sophisticated way to estimate the
minimum number of crocodiles present in a survey series based on the maximum
number of crocodiles seen by age groups (max), they failed to estimate and relate the
actual variation present in the data as a descriptor of the distribution of the mean
number of crocodiles spotted; thus they clearly underestimated the “true” population
size. These two equations are also likely biased by the necessity for the data to fit
theoretical distributions, which is difficult to achieve in ecology because data are
generally skewed (Southwood and Henderson 2003).
The POPAN formulation is a variant of the Jolly-Seber open-population
capture–recapture model, which includes inference about entry probabilities into the
sampled population (Schwarz and Arnason 1996). It implies that all four general
assumptions from mark-recapture must be met to obtain unbiased population size
estimates. However, in our case, goodness-of-fit tests indicated possible violations of
model assumptions related to homogeneity in survival and capture probability, which
implies that both initial and gross population numbers could be biased in some
unknown manner. It is likely that these violations derive from the unequal probability
of “found” and “captured” age groups in crocodylians due to ecological (differences in
habitat utilization, social hierarchization, seasonal range movements, individual
wariness) and logistical (such as walkable/navigable areas and crocodylian size
ranges) constraints (Messel et al. 1981, Kushlan and Mazzotti 1989, Webb et al.
1989). In addition, the low number of American crocodiles observed and captured per
sample in the area due to the use of a standardized technique with a capture window,
could also affect the estimation of population size due to a lack of data necessary to
estimate variation in the model, which will be reflected by a lack of fit of the model
given the data (Cooch and White 2007).

Texas Tech University, Sergio A. Balaguera Reina, May 2018
51
New population size estimation approach
The sighting fraction approach proposed in the present study can be seen as an
adjusted version of Messel’s and King’s approaches, in which the “true” population is
estimated based on the actual variation present in the data (standard error of the
sampling distribution) and the maximum number of crocodiles seen by age group
(max). Even though we will never be perfectly certain what the “true” population size
is simply because it is impossible to capture or see all crocodiles present in a defined
area, this new approach gives a fair and logical approximation based on the max
estimation (which is equal to or less than the number of crocodiles present in the
survey series; Messel et al. 1981) and on the estimate of how broad the “true”
estimated population distribution is via sampling distribution estimation (Appendix 3-
2). The latter is possible via bootstrapping, which simulates the relevant properties of a
statistical procedure with minimal model assumptions (Hinkley 1988). In our case, we
used a balanced bootstrap simulation in which each sample observation (number of
crocodiles seen per month) was reused with equal regularity (Gleason 1988). This
affords the opportunity to use all data collected in the field when considering the
monthly variation, which means accounting for unseen/seen individuals or animals
that move in and/or out of the sampled area.
It may be possible to say that max is the most accurate way to estimate the
number of individuals present in a defined area based on an indirect method as
spotlight surveys (Messel et al. 1981). That is because even though animals are not
individually identified, grouping observations by size classes provides a way to filter
them by groups (i.e., animals grouped each 60 cm TL) to determine a minimum
number of crocodiles present in the area. However, it also means that imprecise
estimates of crocodile lengths due to incorrect assignment of size classes can bias max
estimations as well as population numbers (Messel et al. 1981). One way to minimize
this error could be to estimate the total length of the animal based on its head length
(that is the exposed part that the observer sees commonly) knowing a priori the
allometric relationship between these two measurements. It also could be reduced
using laser distance-measuring tools that provide a more precise measure of the head

Texas Tech University, Sergio A. Balaguera Reina, May 2018
52
of the animal, also generating an uncertainty measure (provided for the device) that
could be included in the total length estimations. Both alternatives could help to
narrow down size classes (e.g., each 30 cm instead each 60 cm TL), making the
estimated minimum number more precise.
American crocodile population size estimations
Despite American crocodiles’ wide distribution, population sizes have only
been estimated in a few countries across its range using either spotlight surveys
sighting fractions, mark-recapture, or some other type of modelling method (Table 3-
5). However, it is important to recognize that estimates derived from Messel’s and
king’s equations and to a lesser extent from Chebreck’s equation underestimate
population numbers, meaning that these populations are likely larger than reported.
Population size estimates based on mark-recapture techniques have been done in
Mexico and Colombia (Table 3-5). However, it is not possible make clear
interpopulation comparisons (either among these studies or with the present study) due
to the lack of standardized measures (e.g., density ind/km2).
Relative abundance estimations from insular and coastal areas have been
reported in Belize, Mexico, Ecuador, Venezuela, Honduras, and Colombia (Table 3-
6). These values, except for the inland data from Banco Chinchorro (Charruau et al.
2005) and the landlocked lake in Haiti (Thorbjarnarson 1989), are similar to the data
we collected, suggesting how this seasonal oscillation we reported in Coiba might also
be found in other islands. These data also suggest that coastal habitats in both insular
and mainland areas might not support relative abundances over 4 ind/km, which is low
compared with inland relative abundances reported in places like Venezuela and Costa
Rica (Table 3-6). We noted fluctuations in the proportion of size class observations
across the year with the presence of class IV and V (adults) only at the hatching (April
and May; likely females) and courtship-mating time (October-December; Balaguera-
Reina et al. 2015b) and classes II and III (juveniles and sub-adults) throughout the
whole year (Figure 3-2). This implies partial ecological assessments through the year
may actually underrepresent the structure present in a defined area.

Texas Tech University, Sergio A. Balaguera Reina, May 2018
53
Table 3-5. American crocodile population size (PS) estimations across its range
collected from literature, including the standard deviation (±SD) or the variation range
(min-max).
Country Study area Method
PS ± SD or
(min-max) Author
Colombia
Tayrona National
Natural Park
King's sighting
fraction 3.7 ± 4.2
Farfan-Ardila et al. (in
press)
Colombia Portete Bay Mark-recapture 134.3 ± 17.9 Espinosa et al. (2012)
Mexico
La Ventanilla
estuary Mark-recapture 749.2 ± 54.9
Garcia-Grajales et al.
(2007)
Mexico La Palmita Lake
King's sighting
fraction 36 (26-45) Brandon (2006)
Mexico
La Encrucijada
Biosphere
Reserve
King's sighting
fraction 99.57 ± 14.32
Reserva de la Biosfera
la Encrucijada (2010)
United
States Southern Florida Chabreck’s model 220 ± 78
Kushlan and Mazzotti
(1989)
United
States Turkey Point Chabreck’s model 440
Wasilewski and Enloe
(2006)
Conclusions
Exploring and understanding the natural history of the American crocodile as
well as other crocodylian species requires trustworthy, repeatable, and most
importantly standardized methods that allow researchers to assess population
dynamics in space and time. These approaches allow the estimation of unbiased
population sizes with confidence intervals and the definition of densities (e.g.,
ind/km2) or relative abundances (e.g., ind/km) values that are suitable for
interpopulation comparisons (Thorbjarnarson 1989). Even though such efforts have
been made in several countries where American crocodiles occur, the scarcity of
density estimates makes it difficult to understand the “big picture” regarding the
population ecology of the species (i.e., how many crocodiles can a system support?
how does it vary with respect to habitats and seasonality and how do habitat reduction
and climate change affect this dynamic?).

Texas Tech University, Sergio A. Balaguera Reina, May 2018
54
Table 3-6. American crocodile relative abundance estimations (RA) from insular and
coastal areas across its range by country reported from literature.
Country Study area RA (ind/km) Author
Belize Turneffe Atoll 0.96
Platt and Thorbjarnarson
(2000)
Belize Turneffe Atoll 1.2 Platt et al. (2004)
Colombia Portete Bay 1.2 Espinosa et al. (2012)
Colombia Cispata Bay 1.1 Ulloa Delgado 2012
Costa
Rica Tempsique River 18.3 Sánchez (2001)
Costa
Rica Las Baulas National Parks 1.2 Mauger et al. (2012)
Costa
Rica Palo Verde National Parks 4 Mauger et al. (2012)
Costa
Rica Santa Rosa National Parks 4.7 Mauger et al. (2012)
Costa
Rica Area of Conservation OSA 4.3 Mauger et al. (2012)
Costa
Rica Bebedero River 4.5 Sanchez et al. (1996)
Costa
Rica Tarcoles rivers 19.1 Sasa and Chavez (1992)
Ecuador Bajen estuary (0.90 Carvajal et al. (2005)
Ecuador Plano Seco estuary 0.45 Carvajal et al. (2005)
Haiti Etang Saumatre 6.3 Thorbjarnarson (1989)
Honduras
0.51 Klein, unpublished
Mexico
Banco Chinchorro Biosphere
Reserve
13.90*;
1.3**;
6.8*** Charruau et al. (2005)
Venezuela
1.57 Seijas (1986)
Venezuela Yaracuy River 4.82 Arteaga and Sánchez (1996)
Venezuela Tocuyo River 5.1 Arteaga (1997)
*Inland water bodies, ** coastline systems, *** overall estimation
Determinations of relative abundances allow researchers to assess population
trends (i.e., increasing, decreasing, stable) over extended time periods, providing
Texas Tech University, Sergio A. Balaguera Reina, May 2018
55
important insights about population dynamics. However, estimates of population
numbers also contribute additional information that allow evaluation of attributes such
as carrying capacity, energy fluxes, and crocodylian functionality in the community or
ecosystem. Crocodylian biologists should strive therefore to generate absolute rather
than relative estimates and support development of methods that will allow these
purposes to be accomplished. We believe our population size method of estimating is
promising and can bring some clarity about how to estimate this attribute in a more
cost-effective way. However, further studies must be done applying this method in
different habitat/species conditions to fully assess its effectiveness, robustness, and
applicability and if necessary adjusting it to specific species/habitat requirements.

Texas Tech University, Sergio A. Balaguera Reina, May 2018
56
Appendix 3-1. Spatial distribution patterns of American crocodiles observed (spotlight surveys) and captured (mark-recapture)
by size class and age group, respectively, across 2013 on Coiba Island, Panama. Notice how observations tend to be grouped
(clustered) in most of the months.
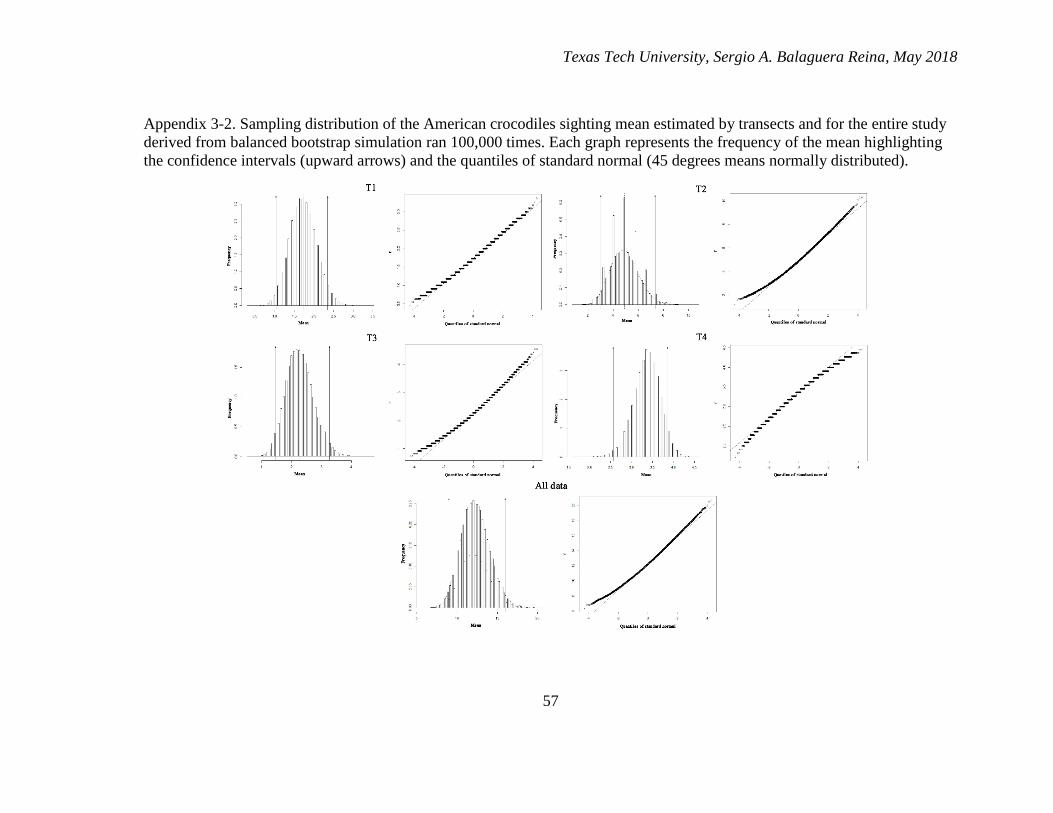
Texas Tech University, Sergio A. Balaguera Reina, May 2018
57
Appendix 3-2. Sampling distribution of the American crocodiles sighting mean estimated by transects and for the entire study
derived from balanced bootstrap simulation ran 100,000 times. Each graph represents the frequency of the mean highlighting
the confidence intervals (upward arrows) and the quantiles of standard normal (45 degrees means normally distributed).
Texas Tech University, Sergio A. Balaguera Reina, May 2018
58
CHAPTER IV
INDIVIDUAL INDENTIFICATION BASED ON DORSAL
PATTERNS
Balaguera Reina S. A., M. Venegas-Anaya, B. Rivera-Rivera, L. D. Densmore
III. 2017. Scute Patterns as an Individual Identification Tool in an American
Crocodile (Crocodylus acutus) Population on Coiba Island, Panama. Journal of
Herpetology 51(4):523-531.
INTRODUCTION
American coocodiles (Crocodylus acutus) are one of the largest crocodile
species in the Americas and one of the more-threatened crocodylians in the Neotropics
(Balaguera-Reina et al. 2015a). This species is widely distributed and occurs on the
Pacific, Atlantic, and Caribbean coasts of North, Central, and South America, from
Mexico to Peru and Florida (USA) to Venezuela (Thorbjarnarson 1989). Being hunted
for food and leather resources, persecution, and habitat modification are the major
anthropogenic threats that this species has faced in the past century (Medem 1981,
Thorbjarnarson 2010); however, after almost 40 yr of hunting bans across its range,
countries such as the United States, Mexico, and Cuba have reported at least some
population recovery (Thorbjarnarson et al. 2006). Nevertheless, the paucity of
knowledge about the natural history of the species still limits the scope of actions
needed to preserve the species (Balaguera-Reina et al. 2015c).
Historically, the individual identification of living crocodylians has been based
on notching scales in the tail or on tagging (Chabreck 1963), both requiring the
capture and handling of the specimen. These techniques are time-consuming and
expensive, however, and compared to noninvasive methods can be dangerous for both
researchers and crocodylians. Because of their threatened status (Thorbjarnarson
2010), American crocodiles are an elusive species in many countries where they are

Texas Tech University, Sergio A. Balaguera Reina, May 2018
59
found. Furthermore, in some localities capture is complicated by their persecution by
humans (Balaguera-Reina and González-Maya 2010).
Identification of individuals based on morphological patterns is a strategy used
primarily in human forensics that also has been applied successfully in several wildlife
scenarios. Sea turtles (Schofield et al. 2008), whales (Hammond 1990), and monk
seals (Forcada and Aguilar 2003) are examples of species where individual animals
have been characterized. To put these pattern-recognition methods into practice,
however, one must be confident that observed patterns are sufficiently variable to
prevent pattern repetition. In the case of crocodylians, one simple way to distinguish
individuals by pattern is to assess the scutellation (scute patterns) using conspicuous
scutes on the dorsal surface. Those with osteoderms (bony elements embedded within
many of the scutes, particularly dorsally) commonly bear conspicuous keels that are
easy to distinguish with the naked eye from short distances (Grigg and Kirshner 2015).
The use of unmanned aerial vehicles (UAV; also called drones) in animal
ecology has been growing in the last decade with the potential to revolutionize the
way in which animals and habitats are monitored (Linchant et al. 2015). Before this
technology can be applicable to collect absolute population numbers (number of
individuals present), methods must be developed to accurately identify individuals. To
date, no studies attempting to identify wild crocodylians based on external,
conspicuous, genetically based characters such as scutes with osteoderms have been
published. Natural patterns on the tail (black spots) have been used to identify
individual Nile crocodiles (Crocodylus niloticus) by Swanepoel (1996); however, this
method has limitations because of the necessity of having the animal completely
exposed (i.e., out of the water) to see the spots, the requirement of collecting
photographs from both sides of the tail in the same individual every time an
identification was needed, and a lack of assessment regarding potential ontogenetic
changes of these marks as the animal grows.
Morphological studies on C. acutus specifically based on differences in
scutellation have been previously described from museum specimens or individuals

Texas Tech University, Sergio A. Balaguera Reina, May 2018
60
kept in captivity (Neill 1971, Brazaitis 1973, Garrick 1982, Ross and Mayer 1983).
These baseline studies focused on the number of scutes present in the dorsal (post-
occipital, nuchal, dorsal, and tail areas) and ventral (transversal and longitudinal lines)
areas, identifying likely geographical variation in American Crocodile scutellation
over its range (Garrick 1982, Ross and Mayer 1983). More-recent studies involving
scute number suggest that scutellation patterns in this species show considerable
variation among localities in the same country (Seijas 2002, Garcia-Grajales et al.
2009) and among animals from different countries (Platt et al. 2010). Therefore, this
level of variation might be enough to differentiate wild populations throughout the
range of C. acutus (Platt et al. 2010).
Currently, variation in the dorsal scutellation of C. acutus has never been
evaluated using both the number and position of scutes to identify individuals.
Therefore, we assessed the dorsal scute patterns (in the post-occipital, nuchal, and
dorsal regions; Figure 4-1) per transverse scute line (TSL) and longitudinal scute line
(LSL) of 110 American crocodiles captured from the wild on Coiba Island, Panama, in
2013. We also estimated the variation in scute number and position and the likelihood
of pattern repetition as an identification method based on both a binary and a coded
assessment. Our major hypothesis was that the overall variation in number and
position of the post-occipital, nuchal, and dorsal scutes per TSL among individuals
would be sufficient to be useful for individual identification pattern recognition. We
call this approach individual identification pattern recognition (IIPR).
MATERIALS AND METHODS
In 2013, we captured 110 American crocodiles from El Maria and Playa
Blanca beaches on Coiba Island, Panama. Every crocodile was marked (by notching
scales in the tail following a numerical series to differentiate them), sexed (via cloacal
probing), measured (total length, TL), dorsally photographed, and released at the
original capture zone. We also assessed the dorsal scute patterns of these individuals
based on 21 TSL found on the post-occipital (1 TSL), nuchal (3 TSL), and dorsal (17
TSL) regions (Figure 4-1). This included the three most prominent scutes present on

Texas Tech University, Sergio A. Balaguera Reina, May 2018
61
each side of the vertebral column axis (LSL designated here as Z, Y, and X, left or
right, from the proximal to the distal part of the vertebral column axis; Figure 4-1). We
defined the last TSL on the dorsal region (in an anterior–posterior direction) based on
the joint between the leg and the tail.
Figure. 4-1. (A) Vectorized photograph of an individual American Crocodile
(ID91 female, subadult) captured in Coiba Island, Panama, describing the
individual identification pattern recognition method (IIPR) based on the binary
and coded assessments used to analyze the dorsal scute pattern of Crocodylus
acutus. Notice the three scute regions (post-occipital, nuchal, and dorsal) and
20 instead of the 21 TSL because of the lack of L21 in this specific individual.
Several examples of individuals and their scute patterns can be seen in (B)
ID543 male subadult, (C) ID467 hatchling with 21 TSL, and (D) ID441 female
adult.
Texas Tech University, Sergio A. Balaguera Reina, May 2018
62
These data were analyzed using two methods based on presence/absence of the
scute (binary [1 = present, 0 = absent]) and presence/absence and position of the scute
(coded [LSL: Z, Y, and X] left or right from the proximal to the distal part of the
vertebral column axis; Figure 4-1). Data were statistically analyzed based on the sum
of values per TSL as well as the sum of values per LSL using R software (R
Development Core Team 2012). We determined whether scute variation was equal to
or differed among TSL, LSL, individual, and age group (hatchling [<30 cm TL],
juvenile [30–90 cm TL], subadult [91–180 cm TL], and adult [>181 cm TL]; Platt and
Thorbjarnarson 2000a). We performed Shapiro-Wilk tests to determine the normality
of the data and Kruskal-Wallis (Hdf) tests to analyze their variability. We used Dunn’s
test for independent samples with a Bonferroni adjustment of p-values to determine
pairwise differences of mean ranks when Kruskal-Wallis tests were significant (p-
value < 0.05).
The binary and coded data were used to estimate the number of patterns and
their representativeness (proportionally) per TSL per individual in the total scute
combinations accounted for in all regions (post-occipital, nuchal, and dorsal). Based
on these binary and coded determinations, we estimated the likelihood of finding two
individuals with the same scute pattern and the necessary number of TSL needed for it
(called minimum probability: minimum number of individuals needed to repeat a
pattern). The IIPR analysis is based on simple comparisons of TSL patterns among
individuals, increasing the number of lines used (from the anterior to the posterior part
of the body) until only two individuals share the same pattern. At that point, we
assessed the next TSL to define if it was different. If it was different, then we
concluded that we had found the amount of TSL needed to differentiate each
individual from this pool of animals. Therefore, we estimated minimum probability by
multiplying the proportion of each scute pattern per TSL based on the total needed to
differentiate individuals. For the two methods used in this study, we assumed that each
of the TSLs per region were independent from one another (i.e., first nuchal transverse
scute line was independent of the second nuchal transverse line scute and so on).

Texas Tech University, Sergio A. Balaguera Reina, May 2018
63
RESULTS
We collected complete data (information from all 21 TSL) from 102
individuals and partial information from 8 individuals (because of lack of definition or
obstacles present in photos, e.g., ropes, which precluded clear recognition of
presence/absence and/or number of scutes on TSL). Of the 110 animals, 69% (76)
were hatchlings, 16% (18) juveniles, 13% (14) subadults, and 2% (2) adults.
Regarding sex ratio, 10% (11) were females, 12% (13) males, and 78% (86) were
undetermined (1:1.18; female: male ratio). All individuals had at least two scutes
present in the post-occipital (L1), first (L2), and second (L3) nuchal TSL; however,
only 53% of them had scutes in the third (L4) nuchal TSL. We found 17 TSL (from
L5 to L21) in the dorsal region, of which 16 TSL (from L5 to L20) were present in all
individuals with at least one scale. Only 42% presented a 17 TSL (L21) with at least 2
scutes.
Based on the binary analysis (1 = present, 0 = absent), the smallest number of
scutes was in line L4 and L21 (zero scutes); lines L14, L15, L13, and L8 had the
highest scute number mean (4.54, 4.33, 4.27, 4.02, respectively); lines L21, L14, L15,
and L13 had the highest scute number variation (± 1.95, 1.17, 1.15, 1.10,
respectively); and lines L6, L7, L8, L9, L11, L12, L13, L14, L15, and L16 had the
highest scute number range (from 2 to 6 scutes per line), all of these from the dorsal
section (Table 4-1, Figure 4-2). We found statistically significant differences among
the summed number of scutes per TSL (H20 = 737.82, p-value < 0.00). The pairwise
comparisons using Dunn’s test showed that on average the majority of transverse lines
were significantly different from each other (p-value < 0.05), the most-variable lines
being L3, L4, L5, and L21 (nuchal and dorsal sections; Appendix 4-1). We also found
statistically significant differences among individuals based on the total value of
scutes per TSL (H101 = 127.26, p-value = 0.03). However, we did not find significant
differences among age groups (H3 = 3.9, p-value = 0.27).

Texas Tech University, Sergio A. Balaguera Reina, May 2018
64
Table 4-1. Summary statistics per transverse scute line (TSL) of American crocodiles
assessed on Coiba Island, Panama based on the binary analysis (n = 102) highlighting
the mean, standard deviation (SD), and minimum and maximum (Min–Max) of scales
found.
Section Line Mean SD Min-Max
Post-occipital L1 3.86 0.47 2-4
Nuchal L2 3.80 0.60 2-4
Nuchal L3 2.06 0.34 2-4
Nuchal L4 0.93 0.94 0-2
Dorsal L5 3.25 0.99 1-4
Dorsal L6 3.92 0.94 2-6
Dorsal L7 3.97 0.99 2-6
Dorsal L8 4.02 0.91 2-6
Dorsal L9 3.91 0.80 2-6
Dorsal L10 3.71 0.75 2-5
Dorsal L11 3.76 0.85 2-6
Dorsal L12 3.90 0.91 2-6
Dorsal L13 4.27 1.10 2-6
Dorsal L14 4.54 1.17 2-6
Dorsal L15 4.33 1.15 2-6
Dorsal L16 3.81 0.93 2-6
Dorsal L17 3.73 0.53 2-5
Dorsal L18 3.55 0.59 2-4
Dorsal L19 3.57 0.54 2-4
Dorsal L20 3.64 0.59 2-4
Dorsal L21 1.72 1.95 0-4
Based on the number of the scutes present on each TSL, we found 7 scute
patterns repeated throughout the 21 TSL (Figures 4-2, 4-3). We obtained complete
differentiation among individuals (i.e., no two individuals with the same pattern) using
the first 13 TSL in an anterior–posterior direction [post-occipital (L1), nuchal (L2, L3,
L4), and dorsal (from L5 to L13)]. Only two individuals (ID464 and ID513) shared the

Texas Tech University, Sergio A. Balaguera Reina, May 2018
65
same scute pattern from L1 to L12, but they differed in the pattern present in the TSL
L13. Based on these results, and considering the proportion of each pattern per TSL
(Figure 4-3), the minimum probability of finding another individual with identical
scute patterns as ID464 based on 13 TSL was 2.89 ×10⁻⁶ and as ID513 was 2.02 ×·10-
5. Put another way, only one American crocodiles out of 346,020 individuals will have
the same number of scutes per TSL as ID464 and one individual out of 49,504 will
have the same number of scutes per TSL as ID513 in the Coiba island population
assessed (which is likely more individuals than we might have there). Based on the
most-likely patterns per TSL we found in this study (Figure 4-3), the minimum
probability of obtaining the same number of scutes in two American crocodiles from
Coiba Island is 2.88 × 10⁻⁶, meaning only one American Crocodile in a group of
347,222 individuals will have an identical scute number.
Figure 4-2. Number of scutes found on each transverse scute line (TSL) from
the anterior to the posterior part of the body (from L1 to L21) based on the
binary analysis throughout the 21 TSL reported for American crocodiles in
Coiba Island, Panama (n = 102), expressed as median and quartiles with
whiskers at minimum and maximum values. Outliers are represented as open
circles. We also present the percentage of individuals that presented median
values.
Regarding the coded analysis, from a possible combination of 2,142 scutes per
LSL (Z, Y, and X left and right × 102 individuals × 21 TSL), 93% (2,013) had a Z
left scute (ZL), 94% (2017) a Z right scute (ZR), 68% YL and YR scutes (1466 and

Texas Tech University, Sergio A. Balaguera Reina, May 2018
66
1472, respectively), 14% (319) an XL scute, and 13% (287) an XR scute. On average,
we found 3.13 ± 2.01 scutes in XL, 2.81 ± 2.07 in XR, 14.37 ± 1.32 in YL, 14.43 ±1.30
in YR, 19.74 ± 0.82 in ZL, and 19.77 ± 0.84 in ZR. We found statistically significant
differences among the summed number of scutes per LSL (H5 = 547.34, p-value <
0.00001). Pairwise comparisons revealed that on average the majority of LSL were
significantly different from each other (p-value < 0.05), with the exception of the
specular longitudinal axes (XLXR, YLYR, and ZLZR; p-value > 0.05; Table 4-2).
Figure 4-3. Number of Crocodylus acutus scute patterns derived from the
binary analysis in Coiba Island, Panama, highlighting all the scute patterns
found per TSL as well as the number of individuals and its representativeness
(percentage) based on the total sampling. Sample size per TSL oscillated
between 102 and 110 because we included crocodiles with partial information.
We found 23 different scute patterns based on the number and position of
scutes present on each TSL repeated throughout the 21 TSL (Figure 4-4). The smallest
number of patterns was in line L3 (2 patterns) and the greatest number in L6 and L7
(16 patterns on each, Figure 4-5). The highest number of patterns was found between
Texas Tech University, Sergio A. Balaguera Reina, May 2018
67
L5 and L15 (more than 10 in all cases), all present in the dorsal region. We obtained
complete differentiation among individuals using only the first 10 TSL (post-occipital
[L1], nuchal [L2, L3, L4], and dorsal [from L5 to L10]). Only two individuals (ID500
and ID531) shared the same scute pattern from L1 to L9, but they differed in the
pattern present in the TSL L10. So, the minimum probability of finding another
individual with identical scute patterns as ID500 on the basis of only the first 10 TSL
was 0.0003 and as ID531 was 7.6 ×·10-5. Put another way, only one American
crocodile out of 3,333 individuals will have the same scute pattern as ID500 and one
individual out of 13,157 will have the same scute pattern as ID531. Based on the most-
likely patterns per TSL we found in this study (Figure 4-4), the minimum probability
of obtaining the same pattern in two American crocodiles in Coiba Island is 6.98·× 10-
8, meaning only one American crocodile in a group of 14,326,647 individuals will
have an identical scute pattern.
DISCUSSION
This project represents the first effort to show a novel and practical method,
individual identification pattern recognition (IIPR), to ‘‘fingerprint’’ American
crocodiles at the individual level using multiple scute dorsal patterns. Previous studies
on C. acutus only measured variation in the number of scutes per TSL, taking only
scute presence/absence into account (Seijas 2002, Garcia-Grajales et al. 2009, Platt et
al. 2010). Herein, we postulated and tested a method that included not only the number
of scutes but also their relative position, defining the scute variation through the dorsal
area of the species (post-occipital, nuchal, and dorsal regions) in a more
comprehensive fashion.

Texas Tech University, Sergio A. Balaguera Reina, May 2018
68
Figure 4-4. Scute patterns derived from the coded analysis in Coiba Island,
Panama, highlighting all the scute patterns found per TSL as well as the
number of individuals and its representativeness (percentage) based on the
total sampling. Sample size per TSL oscillated between 102 and 110 because
we included crocodiles with partial information.
Using IIPR we found a high level of scute variation in both TSL and LSL
through the post-occipital, nuchal, and dorsal regions based on both binary (presence)
and coded (pattern) methods. Interestingly, TSL L4 in the nuchal region and L21 in
the dorsal region were absent in a number of individuals (47% and 58%, respectively),
contributing greatly to the overall scute pattern variation in this population. Regarding
this matter, Brazaitis (1973) reported the presence of only two TSL (L2 and L3) in the
nuchal region and 16–17 TSL (L5 to L20 or L21) in the dorsal region; however, he did
not specify the origin (locality) of the individuals from which he collected this
information. Populations assessed in Venezuela (Seijas 2002), Mexico (Garcia-
Grajales et al. 2009), and Belize (Platt et al. 2010) also showed two TSL in the nuchal
region (L2 and L3), differing only in the number of TSL in the dorsal region (15–16,
L5 to L19 or L20 in Venezuela; 15–17, L5 to L19, L20, or L21 in Belize). We also
documented a different range of post-occipital scutes per TSL (2–4 scutes) compared
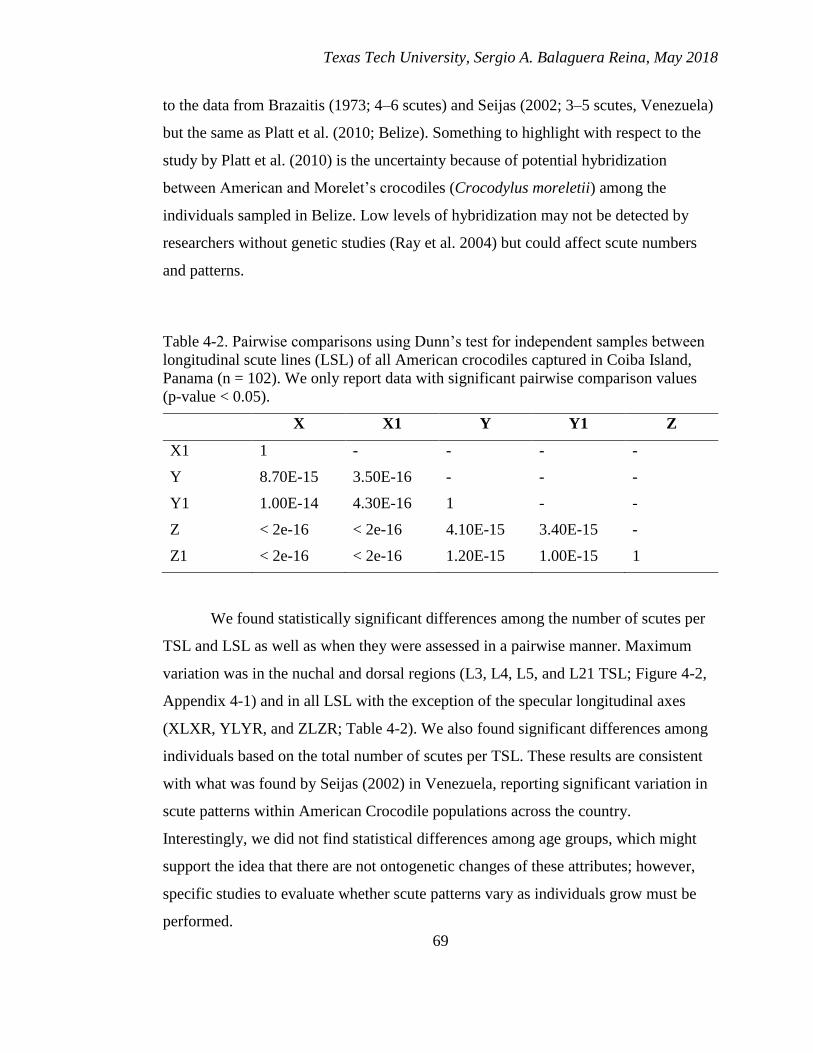
Texas Tech University, Sergio A. Balaguera Reina, May 2018
69
to the data from Brazaitis (1973; 4–6 scutes) and Seijas (2002; 3–5 scutes, Venezuela)
but the same as Platt et al. (2010; Belize). Something to highlight with respect to the
study by Platt et al. (2010) is the uncertainty because of potential hybridization
between American and Morelet’s crocodiles (Crocodylus moreletii) among the
individuals sampled in Belize. Low levels of hybridization may not be detected by
researchers without genetic studies (Ray et al. 2004) but could affect scute numbers
and patterns.
Table 4-2. Pairwise comparisons using Dunn’s test for independent samples between
longitudinal scute lines (LSL) of all American crocodiles captured in Coiba Island,
Panama (n = 102). We only report data with significant pairwise comparison values
(p-value < 0.05).
X X1 Y Y1 Z
X1 1 - - - -
Y 8.70E-15 3.50E-16 - - -
Y1 1.00E-14 4.30E-16 1 - -
Z < 2e-16 < 2e-16 4.10E-15 3.40E-15 -
Z1 < 2e-16 < 2e-16 1.20E-15 1.00E-15 1
We found statistically significant differences among the number of scutes per
TSL and LSL as well as when they were assessed in a pairwise manner. Maximum
variation was in the nuchal and dorsal regions (L3, L4, L5, and L21 TSL; Figure 4-2,
Appendix 4-1) and in all LSL with the exception of the specular longitudinal axes
(XLXR, YLYR, and ZLZR; Table 4-2). We also found significant differences among
individuals based on the total number of scutes per TSL. These results are consistent
with what was found by Seijas (2002) in Venezuela, reporting significant variation in
scute patterns within American Crocodile populations across the country.
Interestingly, we did not find statistical differences among age groups, which might
support the idea that there are not ontogenetic changes of these attributes; however,
specific studies to evaluate whether scute patterns vary as individuals grow must be
performed.
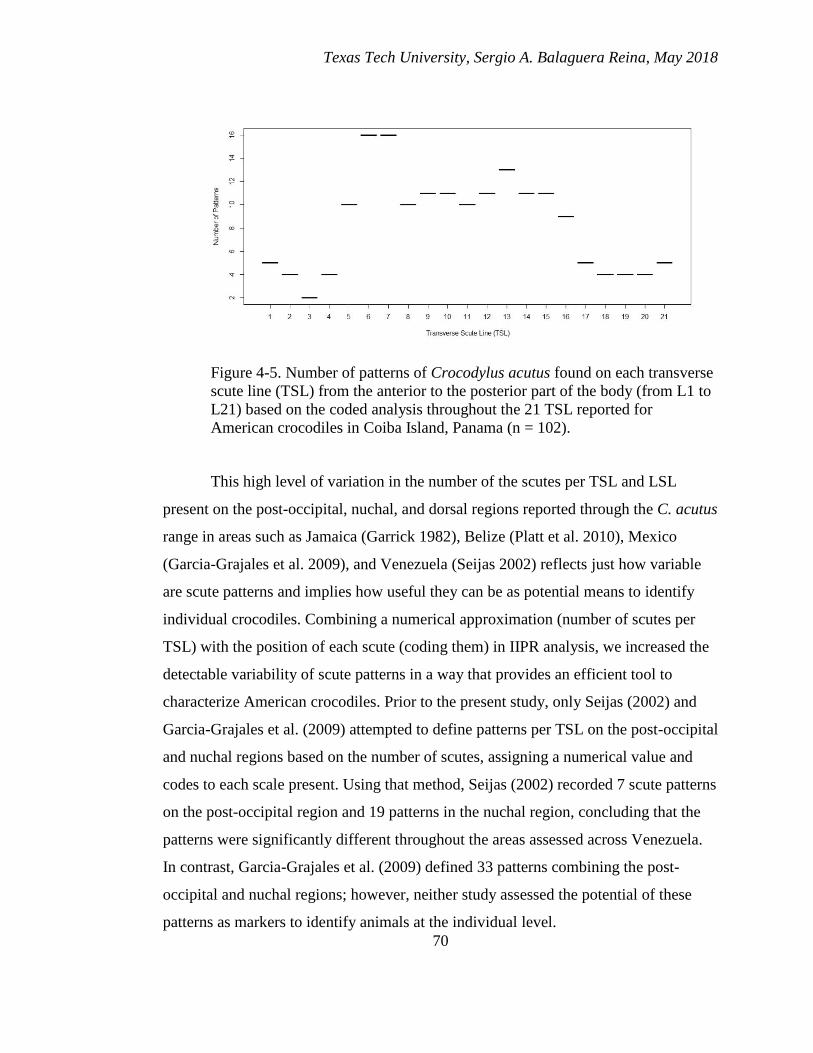
Texas Tech University, Sergio A. Balaguera Reina, May 2018
70
Figure 4-5. Number of patterns of Crocodylus acutus found on each transverse
scute line (TSL) from the anterior to the posterior part of the body (from L1 to
L21) based on the coded analysis throughout the 21 TSL reported for
American crocodiles in Coiba Island, Panama (n = 102).
This high level of variation in the number of the scutes per TSL and LSL
present on the post-occipital, nuchal, and dorsal regions reported through the C. acutus
range in areas such as Jamaica (Garrick 1982), Belize (Platt et al. 2010), Mexico
(Garcia-Grajales et al. 2009), and Venezuela (Seijas 2002) reflects just how variable
are scute patterns and implies how useful they can be as potential means to identify
individual crocodiles. Combining a numerical approximation (number of scutes per
TSL) with the position of each scute (coding them) in IIPR analysis, we increased the
detectable variability of scute patterns in a way that provides an efficient tool to
characterize American crocodiles. Prior to the present study, only Seijas (2002) and
Garcia-Grajales et al. (2009) attempted to define patterns per TSL on the post-occipital
and nuchal regions based on the number of scutes, assigning a numerical value and
codes to each scale present. Using that method, Seijas (2002) recorded 7 scute patterns
on the post-occipital region and 19 patterns in the nuchal region, concluding that the
patterns were significantly different throughout the areas assessed across Venezuela.
In contrast, Garcia-Grajales et al. (2009) defined 33 patterns combining the post-
occipital and nuchal regions; however, neither study assessed the potential of these
patterns as markers to identify animals at the individual level.

Texas Tech University, Sergio A. Balaguera Reina, May 2018
71
We rejected the null hypothesis that no discernible patterns exist among TSL
on the post-occipital, nuchal, and dorsal regions per individual, based on the coded
and binary IIPR analyses, because we found and quantified several scute patterns (23
and 7, respectively) repeated throughout the 21 TSL, with the highest variation found
in the dorsal region. This allowed us to identify all individual crocodiles among the
110 animals evaluated using just 10 (in the coded case) and 13 (in the binary case) out
of the 21 TSL. We found only two individuals using both methods sharing the same
scute pattern from L1 to L9 (ID500 and ID531, coded) and L1 to L12 (ID464 and
ID513, binary), differing only in the pattern present in line L10 and L13, respectively.
This gave us a minimum probability of ≤ 0.0003 based on the coded analysis and ≤
2.02 ×·10-5 based on the binary analysis to find pattern repetition. Put in another way,
we would need to have 3,333 American crocodiles to find one individual with the
most-common scute pattern based on 10 TSL using coded analysis and 49,504
American crocodiles to find one individual with the most common number of scutes
based on 13 TSL using binary analysis. The American Crocodile population in Coiba
has been estimated as no more than 1,000 individuals (Thorbjarnarson et al. 2006,
Venegas-Anaya et al. 2015), which means one should be able to identify all American
crocodiles (with no pattern repetition) inhabiting this insular area. Because of the gene
flow reported between Coiba and Montijo Gulf (Venegas-Anaya, unpubl. data),
applying these numbers to continental areas in Panama should also be plausible. First
though, these hypotheses must be tested by sampling different areas in Coiba Island as
well as populations from the Montijo Gulf, analyzing how the minimum probability
varies as well as the number of TSL needed for individual identification.
Noninvasive methods for individual identification of crocodylians such as IIPR
are very promising with the advancement of technology, opening new ways to monitor
and assess American Crocodile populations. Devices such as UAVs could be used to
map large areas inhabited by American crocodiles by using high resolution
photography, thus providing optimal data (dorsal high-resolution imagery from
American crocodiles) to estimate population sizes and demographic structure as well
as some other relevant population attributes. This method might also be applied to

Texas Tech University, Sergio A. Balaguera Reina, May 2018
72
other species from the Crocodylidae family such as Morelet’s crocodiles, Nile
crocodiles, Cuban crocodiles (Crocodylus rhombifer), Orinoco crocodiles (Crocodylus
intermedius), and Salt-Water crocodiles (Crocodylus porosus) because they also
exhibit irregular dispositions of the dorsal scutellation (Grigg and Kirshner 2015);
however, species-specific studies must be completed to test these hypotheses.
One important question that needs to be addressed regarding the value of these
methods is, ‘‘Do the number and/or position of scutes change through the lifespan of
American crocodiles?’’ To our knowledge, no such studies have been attempted that
can answer this question on American crocodiles or any other crocodylian species.
Studies of Alligator mississippiensis dermal bone formation during embryogenesis,
however, have shown that osteoderms have a delayed development, i.e., they do not
appear until hatching and then appear in an asynchronous fashion across the body, first
dorsally adjacent to the cervical vertebrae and later in caudal and lateral positions
(Vickaryous and Hall 2008). In contrast, dorsally conspicuous scutes composed
mainly of b-keratin can be recognized immediately after hatching in almost all
crocodylians (Grigg and Kirshner 2015). This implies that scute patterns can be
recognized almost immediately after hatching, but resolution improves over time as
individuals and osteoderms grow.
In conclusion, the coded and binary analyses employed in IIPR appear to be
feasible methods to determine individual identification of American crocodiles based
on the number and position of the scutes per TSL in the dorsal area. The coded
analysis showed an overall higher variation per TSL than did the binary analysis,
reaching the minimum probability using fewer TSL. This could be important when
one wants to use this method as an indirect mark–recapture strategy (e.g., using drones
or dorsal pictures of animals), requiring fewer TSL to visualize and achieve confident
results. This provides a new and less-expensive method for population assessments
based on IIPR in combination with UAV to collect highly relevant population
attributes from inaccessible areas.

Texas Tech University, Sergio A. Balaguera Reina, May 2018
73
The minimum probability of repeating a pattern in Coiba Island using both
coded and binary analyses was sufficiently high (one American Crocodile in
14,326,647 individuals and one in 347,222, respectively) to allow a complete,
individual identification of several C. acutus populations throughout its range. The
likelihood of identical scute patterns, however, as well as the number of TSL needed
to identify an individual, might change depending on the patterns described in
different populations. Nevertheless, the considerable variability present in these three
regions over the dorsal area of American crocodiles demonstrated by this and previous
studies (Brazaitis 1973, Garrick 1982, Seijas 2002, Garcia-Grajales et al. 2009, Platt et
al. 2010) provide solid support to continue using and testing IIPR as a way to
characterize individual C. acutus. Finally, additional studies throughout the range of
C. acutus should be done using this approach to further assess both its scope and
limitations.

Texas Tech University, Sergio A. Balaguera Reina, May 2018
74
Appendix 4-1. Pairwise comparisons using Dunn’s test for independent samples between transverse scute lines (TSL) of all
American crocodiles captured in Coiba Island, Panama (n = 102). We only report data with significant pairwise comparison
values (p-value < 0.05).
1 2 3 4 5 6 7 8 9 10 11 12 13 14 15 16 17 18 19 20
2 - - - - - - - - - - - - - - - - - - -
3 0 0 - - - - - - - - - - - - - - - - - -
4 0 0 - - - - - - - - - - - - - - - - -
5 0.01 0.03 0 0 - - - - - - - - - - - - - - - -
6 0 0 0 - - - - - - - - - - - - - - -
7 0 0 0 - - - - - - - - - - - - - -
8 0 0 0 - - - - - - - - - - - - -
9 0 0 0.05 - - - - - - - - - - - -
10 0 0 - - - - - - - - - - -
11 0 0 - - - - - - - - - -
12 0 0 - - - - - - - - -
13 0 0 0 - - - - - - - -
14 0 0 0 0.04 0 0 0.02 - - - - - - -
15 0 0 0 0.03 0.03 - - - - - -
16 0 0 0 - - - - -
17 0 0 0 0.03 - - - -
18 0 0 0 0 0 - - -
19 0 0 0 0 0 - -
20 0 0 0.05 0 0 -
21 0 0 0.05 0 0.01 0 0 0 0 0 0 0 0 0 0 0 0 0 0 0
Texas Tech University, Sergio A. Balaguera Reina, May 2018
75
CHAPTER V
SPATIAL ECOLOGY
Balaguera-Reina S. A., M. Venegas-Anaya, A. Sánchez, I. Arbelaez, H. A.
Lessios, L. D. Densmore III. 2016. Spatial Ecology of the American Crocodile in a
Tropical Pacific Island in Central America. PLoS ONE 11(6): e0157152.
doi:10.1371/journal.pone.0157152.
INTRODUCTION
Large predator management and conservation has been a difficult challenge for
the scientific community for some time (Mech 1995) due to the lack of carefully
collected ecological information that allows a general understanding of their
movements and relationships with their habitats. In addition, the continuous expansion
of human settlements often reduces both suitable habitat and decreases the abundance
of these species (Woodroffe 2000), making them more difficult to track and accurately
evaluate their relationship to the environment. The American crocodile (Crocodylus
acutus) is no exception to this trend despite the fact that it has the largest range of any
of the Neotropical crocodiles, inhabiting North, Central, and South America on both
coasts as well as several oceanic islands in the Caribbean and Pacific (Thorbjarnarson
2010, Balaguera-Reina et al. 2015a). Even after more than 30 years of banned hunting
across most of its range, C. acutus is still one of the most threatened of all New World
crocodile species (along with the Cuban and the Orinoco crocodiles (Targarona et al.
2008, CSG 1996). It has suffered from over-hunting and a general reduction of
optimal habitat across its entire range during the last century (Medem 1981,
Thorbjarnarson 2010, Balaguera-Reina et al. 2015b). C. acutus is currently catalogued
as Vulnerable in the International Union for Conservation of Nature (IUCN) RedList
(Ponce-Campos et al. 2012) and as Endangered in the Panamanian Red List
(resolution No. AG–0051–2008). Panama occupies a central position in the species
range, but the current state of knowledge of Panamanian populations is poor, and
Texas Tech University, Sergio A. Balaguera Reina, May 2018
76
concerns about its conservation in many parts have been raised (Venegas-Anaya et al.
2015, Balaguera-Reina et al. 2015c).
Coiba National Park (CNP) is the largest marine protected area in Panama. It is
included as a World Heritage Site due to its significant biodiversity and overall
biological and ecological importance (Maté et al. 2009). It is located in the Gulf of
Chiriqui on the Pacific coast, being part of the Tropical Eastern Pacific Marine
Corridor along with several other island groups, including Coco (Costa Rica),
Galapagos (Ecuador), Malpelo, and Gorgona (Colombia; CMNUDS 2002). CNP is
comprised of Coiba Island (the largest island on the Pacific side of Central America)
and 38 minor islands and rocky islets (Maté et al. 2009).
One of the largest gaps in knowledge that we believe contributes to the
threatened status of the American crocodile across its entire range (and particularly in
Panama), is the absence of data from any long-term studies on its movement patterns,
home ranges, and habitat use (Balaguera-Reina et al. 2015b, Balaguera-Reina et al.
2015c). Telemetry has proven to be very valuable in clarifying movement patterns and
home ranges, generally providing greater accuracy than classic methods like mark-
recapture (Tucker et al. 1997). It has also contributed to our understanding of the
dynamic and seasonal patterns of habitat use by the generally recognized different
crocodylian life-history stages (Tucker et al. 1997). Currently, in only two of the 18
countries that the American crocodile inhabits have there been published telemetry
studies on this species. In the United States, nine adults (two males and seven females)
and one sub-adult (female) were radio-tracked (VHF transmitters) by boat and airplane
from 1978 to 1981 in the southern tip of Florida between Key Largo and Cape Sable
(Mazzotti 1983, Krushlan and Mazzotti 1989). Another study (also in Florida)
involved four adults, two sub-adults, and three juveniles, which were radio-tracked in
the vicinity of the Turkey Point Power Plant (Gaby et al. 1985). In Panama, 10
juveniles (nine 10-month old animals and one 22-month old animal) were followed
using radio-telemetry in Gatun Lake (Rodda 1984); also five sub-adults (one female
and four males) were tagged (VHF Transmitters) and followed from 2010 to 2011 on
Coiba Island (Gross et al. 2014, Venegas-Anaya et al. 2013). Despite the critical

Texas Tech University, Sergio A. Balaguera Reina, May 2018
77
importance of spatial ecology to understand crocodylian life history, ecological
parameters such as home range behavior and dispersal patterns have received poor (to
no) attention in most countries where C. acutus occurs.
To date, telemetry analyses have been reported for ten out of the 24 species of
crocodylians (other than the American crocodile) including: Caiman yacare (also
known as Caiman crocodilus yacare; Campos et al. 2004, 2006), Melanosuchus niger
(Martin and Da Silva 1998), Alligator mississippiensis (Joanen and McNease 1970,
Goodwin and Marion 1979, Hagan 1982, Rootes and Chabreck 1993, Morea 1999,
Fujisaki et al. 2014), Alligator sinensis (Ding et al. 2004, Thorbjarnarson et al. 2010),
Paleosuchus trigonatus (Magnusson and Lima 1991), Tomistoma schlegelii (Bonke et
al. 2014), Crocodylus johnstoni (Tucker et al. 1997), Crocodylus niloticus (Hutton
1982, 1989, Fergusson 1992), Crocodylus porosus (Kay 2004, Brien et al. 2008, Read
et al. 2004), and Crocodylus intermedius (Muñoz 1997, Muñoz and Thorbjarnarson
2000). It is also notable that for most of the species there have only been one or two
descriptive studies, involving low numbers of animals, which were followed for short
time periods. Actual spatial ecology research has only been accomplished in the
American alligator (A. mississippiensis), in studies performed in the United States
(Kay 2004).
Currently, determination of movement patterns, habitat use, and overall home
ranges are the major research priorities identified for American crocodiles in Panama
(Balaguera-Reina et al. 2015c). These were also designated as priorities across its
entire range, along with development of conservation programs in three countries,
Peru, Ecuador, and Colombia (Thorbjarnarson 2010). By understanding these aspects
of their biology and spatial ecology, we will be able to develop plans to reduce
potential conflicts with humans and protect this species. The United States (Florida),
Cuba, and Costa Rica currently seem to have what apparently are very healthy
populations (Thorbjarnarson 2010). However, only in Florida has the spatial ecology
of the America crocodile been characterized in such a way to allow comprehensive
management and modelling restoration processes to be developed and implemented,
that include habitat (using American crocodile as a species indicator), C. acutus

Texas Tech University, Sergio A. Balaguera Reina, May 2018
78
populations, and people (Green et al. 2014). This same type of research approach
needs to be undertaken throughout C. acutus’ distribution in order to develop
conservation plans that are applicable range-wide. Towards that end, we have assessed
the spatial ecology of the American crocodile in Coiba National Park between 2010
and 2013. Data from 2010 and 2011 came from a previous pilot study done by our
team (Gross et al. 2014, Venegas-Anaya et al. 2013); these were reanalyzed along
with new data collected during 2013. Our efforts also allowed us to determine the
dynamic and seasonal patterns of habitat use by different life-history stages and by sex
on insular habitats, which to our knowledge has not been described and/or published
before now.
MATERIALS AND METHODS
Early on in the fieldwork phase of the study, we did nocturnal spotlight survey
transects (Chabreck 1966) on foot across the coastal zone, creeks, streams, mangrove
and riparian forests in southeastern Coiba (Figure 5-1), capturing any individuals we
encountered. We captured and tagged a total of 24 individuals, which were monitored
for a period ranging from 7 to 10 months [four individuals followed from September
2010 to April 2011-documented in our previous work (Gross et al. 2014, Venegas-
Anaya et al. 2013) and 21 from February to December 2013. One animal was tagged
during both 2010 and 2013]. All individuals were sexed (via cloacal probing),
measured (total length-TL, snout-ventral length-SVL, head length-HL, head width-
HW, and weight-W), marked by notching scales in the tail, tagged with a transmitter
(Telenax® VHF models TXE-311BR and TXE-304BR), and returned and released at
the original capture. We classified them and analyzed the data using age groups
(juvenile TL 30–90 cm, sub-adult TL 91–180 cm, and adult TL > 180 cm; Platt and
Thorbjarnarson 2000a).

Texas Tech University, Sergio A. Balaguera Reina, May 2018
79
Figure 5-1. Location of the Coiba National Park along the Pacific coast of
Panama highlighting transects followed throughout this study. On the bottom
left panel it is also pictured all the geolocation estimated throughout the study
as well as the standard error of distance.
Based on the information collected using these transects, we report the
geolocations of 24 individuals and the standard error of distance (which is the
“uncertainty” component of the data). A transmitter was attached to the neck of each
individual using wire wrapped around the transmitter, over the cervical scutes and
below the osteoderms. Each transmitter had a unique frequency to allow unambiguous
identification of every individual. We did not attach radio-telemeters to hatchlings
because the size of the equipment was not appropriate. Instead, we separately
reanalyzed hatchling (TL < 30 cm) and early juvenile (TL < 50 cm) data that we had
collected in the same area in a previous study where we assessed the reproductive
ecology and hatchling growth rates of C. acutus using mark-recapture from April to
December 2013 (Balaguera-Reina et al. 2015b). This allowed us to cover all of the
major life-history stages. The hatchling/early juvenile data were not included in the
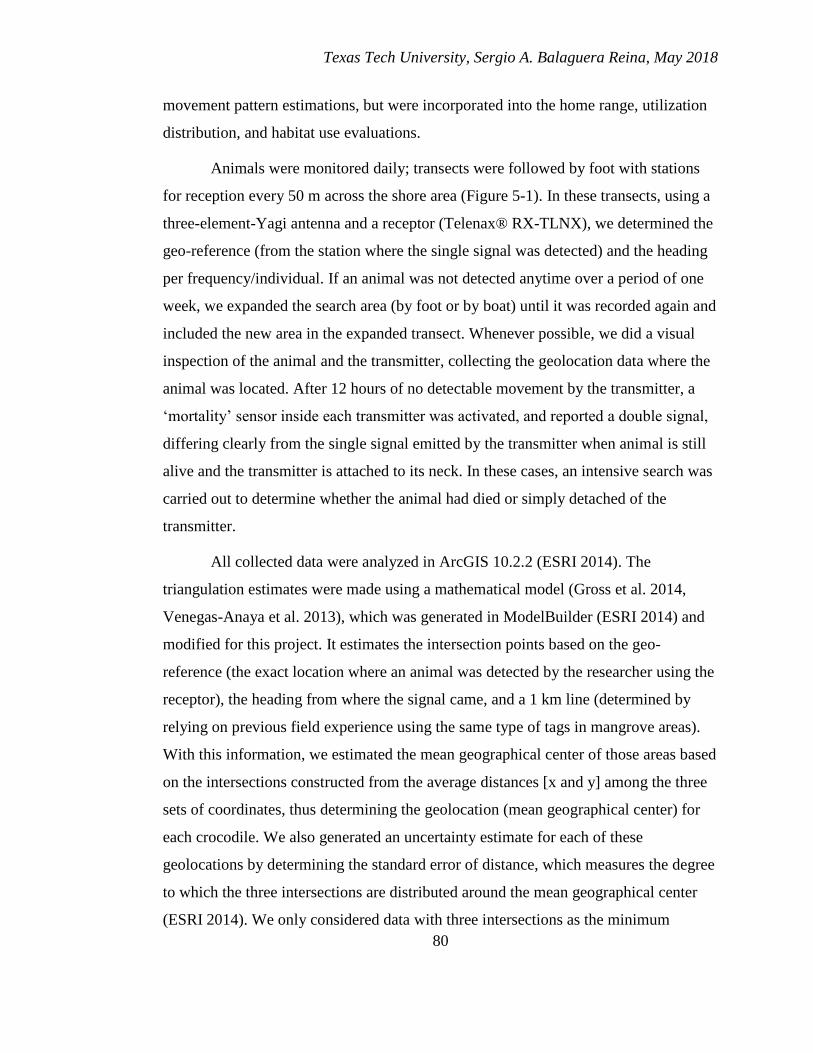
Texas Tech University, Sergio A. Balaguera Reina, May 2018
80
movement pattern estimations, but were incorporated into the home range, utilization
distribution, and habitat use evaluations.
Animals were monitored daily; transects were followed by foot with stations
for reception every 50 m across the shore area (Figure 5-1). In these transects, using a
three-element-Yagi antenna and a receptor (Telenax® RX-TLNX), we determined the
geo-reference (from the station where the single signal was detected) and the heading
per frequency/individual. If an animal was not detected anytime over a period of one
week, we expanded the search area (by foot or by boat) until it was recorded again and
included the new area in the expanded transect. Whenever possible, we did a visual
inspection of the animal and the transmitter, collecting the geolocation data where the
animal was located. After 12 hours of no detectable movement by the transmitter, a
‘mortality’ sensor inside each transmitter was activated, and reported a double signal,
differing clearly from the single signal emitted by the transmitter when animal is still
alive and the transmitter is attached to its neck. In these cases, an intensive search was
carried out to determine whether the animal had died or simply detached of the
transmitter.
All collected data were analyzed in ArcGIS 10.2.2 (ESRI 2014). The
triangulation estimates were made using a mathematical model (Gross et al. 2014,
Venegas-Anaya et al. 2013), which was generated in ModelBuilder (ESRI 2014) and
modified for this project. It estimates the intersection points based on the geo-
reference (the exact location where an animal was detected by the researcher using the
receptor), the heading from where the signal came, and a 1 km line (determined by
relying on previous field experience using the same type of tags in mangrove areas).
With this information, we estimated the mean geographical center of those areas based
on the intersections constructed from the average distances [x and y] among the three
sets of coordinates, thus determining the geolocation (mean geographical center) for
each crocodile. We also generated an uncertainty estimate for each of these
geolocations by determining the standard error of distance, which measures the degree
to which the three intersections are distributed around the mean geographical center
(ESRI 2014). We only considered data with three intersections as the minimum

Texas Tech University, Sergio A. Balaguera Reina, May 2018
81
amount of information required to estimate the standard error of distance.
Geolocations with uncertainty values over 100 m (≥ 0.03 km2 circular area) were
treated as outliers and were deleted from the calculations.
We filtered these final geolocations using the ArcMET extension (Wall 2014)
of ArcMap (ESRI 2014), and included the hatchling/early juvenile geolocations
derived from our previous study (Balaguera-Reina et al. 2015b), based on three
criteria: (1) temporally non-overlapping positions (minimum time separation between
geolocations of 30 seconds), (2) sequential, spatially non-intersecting positions
(minimum distance separation between geolocations of 50 cm), and (3) a threshold
speed (maximum speed = 12 km/h). We chose the first two criteria to avoid temporal
and spatial overlaps and the third was based upon recorded crocodile speed estimates
documented by Britton (2012). From these filtered data, we calculated each animal’s
trajectory, taking into account the Average Time between Geolocations (ATG),
Average Movement Distance (AMD), and Average Movement Speed (AMS) per
individual, sex, and age group. These results were analyzed statistically using Infostat
and R software (Di Rienzo et al. 2014, R Development Core Team 2012) to determine
whether the variation in AMD was equal or differed among months, precipitation
seasons (based on average historical precipitation estimates from 1971–2014; ETESA
2015), and groups. Shapiro-Wilk tests were performed to determine the normality of
the data and Kruskal-Wallis tests were run to analyze its variability. Dunn's-test for
independent samples with a Bonferroni adjustment of p-values was used to determine
pairwise differences of mean ranks, when Kruskal-Wallis tests were significant (p <
0.05). We estimated Conspecific Proximity (CP; Wall 2014) to determine the inter-
crocodile distances based on a temporal range of 6 hours. This interval was chosen
based on the tidal cycles reported in the study area.
We assessed spatial autocorrelation for the data both by individual and by
hatchling/early juvenile (Balaguera-Reina et al. 2015b) based on the time lag between
geolocations using Moran’s I analysis (Moran 1950) in ArcGIS (ESRI 2014). From
these results, for each individual we estimated the Minimum Convex Polygon (MCP;
Mohr 1947), the Kernel Density Estimation (KDE; Kernohan et al. 2001), and the

Texas Tech University, Sergio A. Balaguera Reina, May 2018
82
Local Convex Hull—Adaptive (aLoCoH; Getz and Wilmers 2004) using isopleths 50
(core) and 95 (the contour that captures 50 or 95% of the data related to the distance
between them) to determine the home range and the utilization distribution of
American crocodiles in the study area. These data were analyzed as a whole (all
individuals) as well as by sex and by age groups. We included MCP and Kernel core
estimates for comparison purposes because they have been commonly used in the
literature. We also included Local Convex Hull because it estimates home range in a
more adaptive way (Getz and Wilmers 2004). In the KDE analysis, we estimated the
optimum smoothing parameter (h-ref) based on the spatial variance of the input
geolocations (Worton 1989). In the aLoCoH case, we set the distance threshold based
on the maximum displacement by individuals estimated within the area. Pixel
resolution in the case of KDE was set up based on the average standard error of
distance (geolocations uncertainty).
We performed a site fidelity test per individual (bootstraping it 10,000 times)
using the reproducible home range (rhr) package in R (Signer and Balkenhol 2015).
We estimated the mean squared distance from center of activity (MSD) and the
linearity index (LI), determining where the critical threshold was located (α = 0.05).
Site fidelity was recognized when the observed area that an animal used was smaller
than the area used if an individual’s movement was random (Munger 1984).
Our primary hypothesis was that movement patterns and home ranges in
American crocodiles are influenced by the availability of food resources as reflected
by the suitability of water sources (seasonality), beaches for nesting, and land-cover
around bodies of water (mangrove and riparian forest) for different age groups and
sexes. This hypothesis was tested against the null hypothesis of a random pattern in
those spatial variables in the study area.
“Size class” has been a common way to report data in demographic studies in
American crocodiles due to its practicality (Seijas 1988). Because of this, we also
provide all calculations using this classification method as appendices (5-1 to 5-4)

Texas Tech University, Sergio A. Balaguera Reina, May 2018
83
with the main idea to generate a referent point for those who use this classification
method.
Geolocations were buffered by creating a polygon around each point based on
a defined distance on the basis of the estimated uncertainty and examined as to
whether it overlapped land-cover, coral reefs, and river layers as determined from the
Coiba Natural Park (CNP) management plan (created using the 2006 Advanced
Spaceborne Thermal Emission-ASTER imagery data; Maté et al. 2009). We adjusted
the layer boundaries using imagery provided by ESRI (Environmental Systems
Research Institute) in ArcGIS (ESRI 2014) and generated habitat use estimates
according to sex and age group. We also buffered geolocations based on the AMD by
individual to determine the land-cover that the animals were inhabiting. We report the
accuracy of sample means using a standard deviation of ± 0.1 (SD) and in those cases
where this value was larger than the mean due to the natural skew of the data we used
minimum and maximum values (min-max).
RESULTS
We surveyed the study transects by foot 245 times collecting data from
individuals tagged with VHF transmitters (~ 15 km along the shore line). From
September 2010 to April 2011, we surveyed the transects 101 times, monitoring four
animals (Gross et al. 2014, Venegas-Anaya et al. 2013). From February to December
2013, we surveyed the transects 144 times, monitoring 21 animals. One animal (ID84)
was captured and tagged twice (during 2010 and 2013) giving a total number of 24
different individuals that were studied. Over the three-year span, we collected a total
of 742 geolocations (676 from telemetry and 66 from sightings, capture and release
geolocations) from 14 males (10 sub-adults and 4 juveniles) and 10 females (5 adults
and 5 sub-adults; Table 5-1). Sizes ranged in females from 96 cm to 256 cm (TL); in
contrast male sizes ranged from 76 cm to 167 cm. However, we did not find a
significant difference between TL and sex (K-W χ2 (1) = 3.15, p = 0.075, α = 0.05).

Texas Tech University, Sergio A. Balaguera Reina, May 2018
84
Table 5-1. Number of path trajectories (N), time average between locations (TAG),
average movement distance (AMD), and average movement speed (AMS) for each
Coiba Island individual followed (ID), classified by sex (S; Female F; Male M) and
age group. Individual 84 was monitored in two periods: the first line in 2010-2011, the
second line 2013.
ID Sex
Age
Group
TL
(cm) N
TAG (h)
max-min
AMD (m) max-
min
AMS (m/h)
max-min
404 F Adult 256 13 141 (3-1320) 907 (8-5607) 24 (0-240)
417 F Adult 210 3 258 (16-658) 396 (3-1055) 4 (0-11)
146 F Adult 219 16 329 (8-1565) 270 (4-973) 9 (0-116)
405 F Adult 223 27 254 (4-1653) 171 (17-657) 6 (0-50)
441 F Adult 218 14 334 (23-1585) 138 (2-580) 2 (0-5)
412 M Sub-adult 167 9 460 (16-1987) 1132 (242-4337) 7 (1-27)
402 M Sub-adult 123 17 269 (7-2375) 960 (23-2899) 29 (0-338)
476 M Sub-adult 150 5 632 (41-2375) 470 (107-1224) 4 (0-12)
105 M Sub-adult 154 34 187 (4-1251) 401 (3-3787) 3 (0-19)
403 M Sub-adult 129 19 308 (7-3833) 320 (4-1441) 6 (0-25)
414 M Sub-adult 123 19 285 (4-1337) 162 (48-449) 4 (0-31)
84 M Sub-adult 124 63 104 (2-1228) 81 (3-463) 3 (0-42)
145 41 144 (2-1094) 241 (5-775) 10 (0-64)
128 M Sub-adult 92 2 31 (14-47) 1107 (335-1878) 31 (23-40)
400 F Sub-adult 100 10 227 (5-1375) 753 (18-2013) 9 (1-30)
530 F Sub-adult 96 8 302 (9-1618) 727 (77-1287) 36 (1-149)
419 M Sub-adult 108 3 390 (39-633) 684 (187-1033) 8 (0-22)
411 F Sub-adult 98 16 267 (3-2455) 562 (23-5807) 12 (0-104)
100 F Sub-adult 109 34 183 (2-1265) 362 (21-1169) 15 (0-260)
407 F Sub-adult 113 20 216 (7-1680) 91 (17-399) 3 (0-16)
82 M Subadult 93 43 128 (1-1699) 35 (2-480) 3 (0-36)
416 M Juvenile 76 6 187 (14-356) 607 (370-1207) 8 (1-26)
410 M Juvenile 76 12 50 (6-161) 163 (3-396) 10 (0-50)
135 M Juvenile 87 14 145 (11-497) 139 (4-367) 2 (0-6)
122 M Juvenile 90 23 193 (5-1315) 128 (10-553) 7 (0-91)
Average 135.2 241 (10-1414) 280 (76-1192) 7 (2-63)

Texas Tech University, Sergio A. Balaguera Reina, May 2018
85
The uncertainty value of the geolocations was 38.0 ± 54.8 m, ranging from 0.1
m to 389.2 m with a median value of 18.6 m (n = 472 without including sightings,
capture, and release points). The distances covered a circular area of 4,536.4 ± 9,434.3
m2 (See lower left panel Figure 5-1). The majority of geolocations had an uncertainty
value of ≤ 26 m (60%) and less than 9% of the data had values over 100 m. The
uncertainty average without outliers (≥ 100 m) was estimated to be 24.4 ± 23.1 m
(covering a circular area of 1,870.3 ± 1,676.3 m2). After filtering the data and
including capture and release points, we recorded a total of 498 geolocations. In the
case of hatchlings (< 30 cm TL) and early juveniles (< 50 cm TL), we used 142
geolocations collected in the period of reproduction in 2013 from our earlier study
(Balaguera-Reina et al. 2015b).
The average movement distance (AMD) by an individual was 280 m (ranging
from 76 to 1192 m; Table 5-1). The highest and lowest AMD values were in two sub-
adult males (ID412 and ID82, respectively). The highest AMD value among females
was recorded in an adult (ID404) and the lowest in a sub-adult (ID407; Table 5-1). A
sub-adult male individual (ID402) had the highest average movement speed (AMS)
value recorded in the study (0.34 km/h).
We determined, on average, two geolocations (TAG) from the same individual
every 10 days. In the case of ID84, the AMD value increased from 2010 to 2013, as
did the TAG (Table 5-1). Interestingly, paths of ID84 never overlapped between 2010
and 2013, indicating that he was using different zones in the same area (Figure 5-2).
On average, females moved longer distances than males and adults moved longer
distances than sub-adults and juveniles, respectively (Table 5-2). It is important to
highlight that the absence of adult males could reduce the AMD in that group,
suggesting that males can move longer distances than recorded in this study.

Texas Tech University, Sergio A. Balaguera Reina, May 2018
86
Figure 5-2. Trajectory movements of all the American crocodile individuals
followed between 2010 and 2013 in Coiba Island, highlighting the differences
in the trajectory of individual ID84, which expanded its movement area
without overlapping with the previously estimated one.
We did find significant differences in the AMD by individuals (K-W χ2 (23) =
132.04, p = <0.001, α = 0.05), years (K-W χ2 (2) = 47.97, p = <0.001), months (K-W
χ2 (11) = 31.40, p-value = 0.001, α = 0.05), and sex (K-W χ2 (2) = 9.38, p-value =
0.010), but not by age groups (K-W χ2 (2) = 0.67, p = 0.716). The pairwise
comparisons using Dunn's-test shows that on average the majority of individuals did
not move significantly differently, with the exceptions of ID82 with respect to 16
individuals, and ID84 and ID407 with respect to 2 individuals (Table 5-3). On
average, individuals moved significantly differently through years with the exception
of 2010 and 2011 (p = 0.410). Finally, individuals did not move significantly
differently among months with the exception of May and October (p = 0.018).

Texas Tech University, Sergio A. Balaguera Reina, May 2018
87
We found significant differences between AMD and precipitation season (K-W
χ2 (2) = 23.88, p = <0.001; Figure 5-3) as well as between AMD and the reproductive
behavior (K-W χ2 (5) = 18.60, p-value = 0.002). On average, individuals moved
significantly differently between the high-wet season (September to November 400–
626 mm of precipitation per month) and dry season (December to April < 200 mm),
low-wet season (May to August 300–400 mm) and dry seasons, and low-wet season
and high-wet season (Table 5-3). Likewise, I ndividuals moved significantly
differently between nesting time (January) and parental care time (May and June) and
between courtship and mating time (October to December) and paternal care time
(Figure 5-4; Table 5-3).
Table 5-2. Number of path trajectories (N), time average between geolocations (TAG),
average movement distance (AMD), and average movement speed (AMS) followed by
American crocodiles in Coiba Island per age group and sex.
Groups # of individuals N TAG (h)
max-min
AMD (m)
max-min
SP (m/h)
max-min
Adult 5 59 250 (3-1653) 372 (3-5607) 10 (0-240)
Sub-adult 15 356 204 (1-3837) 311 (2-5807) 24 (0-2739)
Juvenile 4 55 149 (5-1315) 191 (3-1207) 15 (0-253)
Female 10 161 242 (2-2455) 375 (2-5807) 29 (0-2739)
Male 14 309 184 (1-3833) 268 (1-4336) 17 (0-661)
Spatial autocorrelation analysis indicated that there was no autocorrelation
among geolocations by individuals, either in all data or for just hatchlings/early
juvenile, based on the time lag between geolocations for each individual (Z score:
0.07, 0.90, and -0.22; Moran’s I index: -0.00, 0.00, and -0.22; p > 0.05, respectively).
The conspecific proximity (CP) within a temporally overlapping period of 6 h was on
average 1,883.0 ± 2,121.3 m, ranging between 16.5 m to 10,055.1 m (N = 838).
Individuals spent the majority of time (> 60% of events) farther than 500 m from each
other; only 20% of geolocations were 200 m or less from one another. Females were
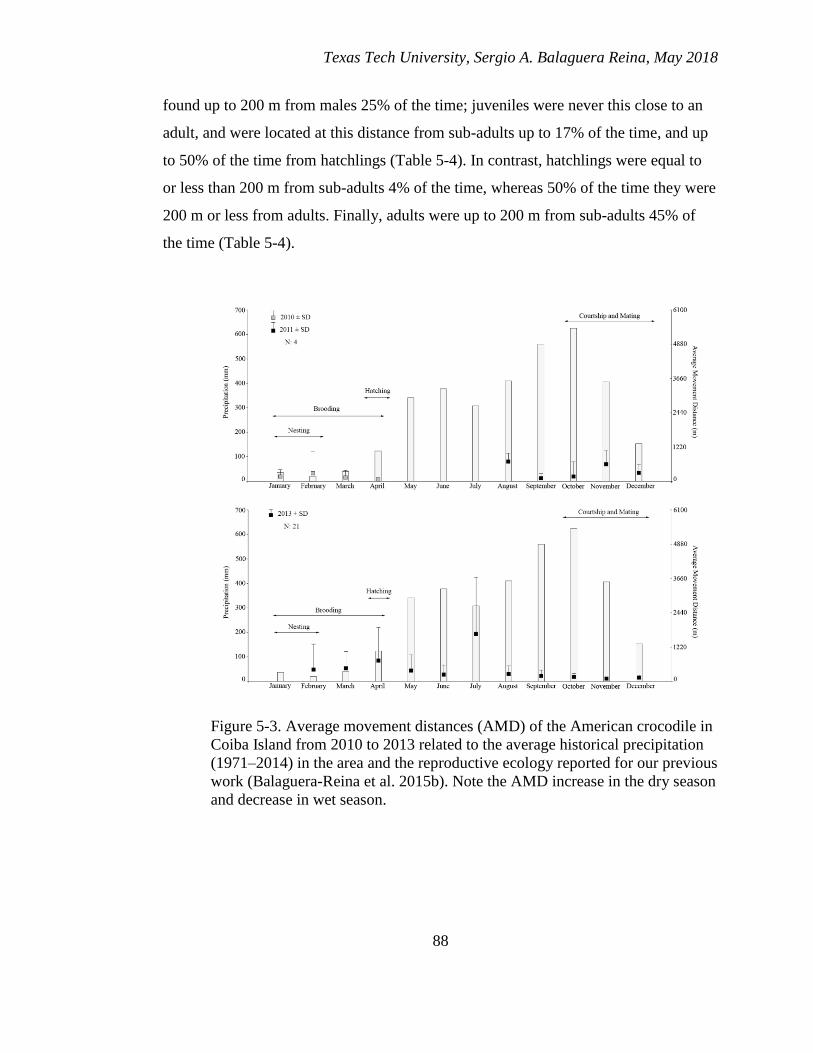
Texas Tech University, Sergio A. Balaguera Reina, May 2018
88
found up to 200 m from males 25% of the time; juveniles were never this close to an
adult, and were located at this distance from sub-adults up to 17% of the time, and up
to 50% of the time from hatchlings (Table 5-4). In contrast, hatchlings were equal to
or less than 200 m from sub-adults 4% of the time, whereas 50% of the time they were
200 m or less from adults. Finally, adults were up to 200 m from sub-adults 45% of
the time (Table 5-4).
Figure 5-3. Average movement distances (AMD) of the American crocodile in
Coiba Island from 2010 to 2013 related to the average historical precipitation
(1971–2014) in the area and the reproductive ecology reported for our previous
work (Balaguera-Reina et al. 2015b). Note the AMD increase in the dry season
and decrease in wet season.

Texas Tech University, Sergio A. Balaguera Reina, May 2018
89
Table 5-3. Pairwise comparisons using Dunn’s-test for independent samples between individuals (ID#), years, months,
precipitation seasons, and reproductive ecology in Coiba Island. We only report data with significant pairwise comparisons
values (p-value = < 0.05).
ID82 ID412 ID530
Dry season
High-wet
season
ID84 <0.001 ID84 0.016 0.038 High-wet season 0.015
ID100 <0.001 ID407 0.026 Low-wet season 0.013 <0.001
ID105 0.001
ID146 0.001
ID400 <0.001
ID402 <0.001
2010 2011
Paternal care
ID403 0.034 2013 <0.001 <0.001 Nesting 0.039
ID405 <0.001 Courtship and Mating 0.002
ID410 0.019
ID411 0.002
ID412 <0.001
ID414 0.001 May
ID416 <0.001 October 0.018
ID419 0.037
ID476 0.008
ID530 <0.001

Texas Tech University, Sergio A. Balaguera Reina, May 2018
90
The MCP for the total data set was larger than the aLoCoH at 50 (core-use
area) and 95% of the total area and the KDE at 50 but not at 95% of volume contours
of the Kernel estimator of the data set (Table 5-5, Figure 5-5). According to the three
methods, the home range and utilization distribution area in males was larger than
females and in sub-adults larger than juveniles, hatchlings, and adults, with some
variation in age groups at 50 MCP, KDE and aLoCoH (Table 5-5). In general, home
ranges estimated using aLoCoH showed less variation among core-use areas and home
range areas than KDE and MCP per individual, sex and age group being a more
consistent estimator of core and home range areas than KDE and MCP.
Figure 5-4. Average movement distances (AMD) per sex and age group of the
American crocodile in Coiba Island related to average historical precipitation
and reproductive ecology. Changes in AMD between seasons are clearer in
females, adults, and sub-adults.

Texas Tech University, Sergio A. Balaguera Reina, May 2018
91
We found site fidelity to a given area based on both indices (mean square
distance-MSD and linearity index-LI) in the majority of animals (p-value = < 0.05; for
IDs 84, 122, 128, 135, 146, 400, 403, 405, 410, 411, 412, 414, 419, and 530); only one
animal did not exhibit this behavior (ID476). However, we obtained inconclusive
results for nine individuals (p-value > 0.05 in the MSD or in the LI).
Table 5-4. Number of observations, percent of geolocations closer than 200 m, and
average conspecific proximity (ACP) within a time overlap of 6 h estimated for 24
American crocodiles followed in Coiba Island from 2010 to 2013 divided by sex and
age group.
N Up to 200 m (%) ACP (m)
Females to males 276 25 1,533.88 ± 1,578.87
Juveniles to adults 20 0 2,297.92 ± 1,659.32
Juveniles to subadults 109 17 1,246.53 ± 1,310.28
Juveniles to hatchlings 4 50 2,891.45 ± 2,843.85
Hatchlings to subadults 24 4 1,936.93 ± 1,865.98
Hatchlings to adults 4 50 117.42 ± 90.00
Adults to subadults 151 45 1,000.52 ± 1,594.02
The animal that was followed twice (ID84) during two years (from April 2011
to April 2013), increased its AMD from 81.1 ± 10.3 m to 241.3 ± 14.6 m. Its home
range increased from 0.0 km2 to 0.2 km2 (MCP) and from 0.0 km2 to 0.1 km2
(aLoCoH), both at 95% isopleth. This may indicate that movement patterns and home
ranges are related and increase together in young animals, but when sexual maturation
begins these types of behavior can be modified. We found no overlap in the paths of
this animal with those of others, which might suggest that young animals will disperse
when they are trying to find a suitable living area while simultaneously avoiding large
crocodiles.

Texas Tech University, Sergio A. Balaguera Reina, May 2018
92
Figure 5-5. Utilization distribution per group (sex and age group) and total
geolocations using Kernel Density Estimation (KDE).
Taking geolocation uncertainty (25 m) into account, individuals were recorded
in the sea 46% of the time and on the beach 19% of the time (including areas with
vegetation and those without vegetation). They were also found in secondary forest
11% of the total time and in mangrove forest 10% of the total time, respectively,
taking into account all the geolocations. The lowest presence of animals was in wet

Texas Tech University, Sergio A. Balaguera Reina, May 2018
93
forest and any human-impacted areas (< 10% each). Males and females spent most of
the time in the sea (42 and 47%, respectively) and on the beach (20 and 27%,
respectively). Sub-adults were largely found in the sea (48%) more frequently than
juveniles (45%), hatchlings (31%), or adults (23%). Hatchlings were recorded in a
higher proportion in mangroves (14%) than sub-adults (11%), juveniles (8%), and
adults (4%). In contrast, adults were more common on the beach (49%) than were
hatchlings (30%), sub-adults (19%) or juveniles (14%).
Table 5-5. Home range and utilization distribution of the American crocodiles on
Coiba Island estimated via Minimum Convex Polygon (MCP), Kernel Density
Estimation (KDE), and Local Convex Hull-adaptive (aLoCoH). These values were
estimated from the average by individual ± SD, reporting the maximum and minimum
values obtained. Data for all individuals and averages divided by sex and age group
are reported. Analyses were made including all data on all individuals and using
isopleths at 50% and 95%.
50% (km2) 95% (km2)
MCP KDE aLoCoH MCP KDE aLoCoH
Average by
Ind.
0.02 ±
0.02
0.13 ±
0.40
0.10 ±
0.14
0.41 ±
0.63
1.71 ±
2.34
0.16 ±
0.20
Maximum 0.11 1.98 0.56 2.18 8.08 0.70
Minimum 0.00 0.00 0.00 0.00 0.01 0.00
Female 1.30 0.78 0.16 8.80 5.84 0.76
Male 6.10 1.61 0.36 10.40 15.17 2.55
Adult 0.24 0.03 0.09 2.48 5.00 0.29
Sub adult 2.62 3.16 0.37 10.42 12.76 2.63
Juvenile 0.28 0.34 0.18 2.16 12.08 0.32
Hatchling 0.44 1.98 0.17 4.34 8.09 0.31
All
Individuals 4.56 2.01 0.26 10.46 14.48 2.15
Habitat use based upon total AMD also revealed a major presence of
individuals in the sea (45%), secondary forest (25%), wet forest (13%), and mangrove

Texas Tech University, Sergio A. Balaguera Reina, May 2018
94
forest (6%), with seemingly minor use of shrubland and pastures. This pattern was
repeated in hatchlings, juveniles, sub-adults, males, females, and adults, except that
mangroves were not used by the latter two. Sub-adults and juveniles seem to be more
generalists using nine land-covers, two more than adults and hatchlings.
DISCUSSION
This project represents the largest telemetry study to date for Crocodylus
acutus, in terms of number of animals tracked and time spent following them, and one
of the largest for any crocodile species, covering all major life stages from hatchling to
adult. Previous studies in both Florida (Mazzotti 1983, Kushlan and Mazzotti 1989)
and Panama (Rodda 1984, Venegas-Anaya et al. 2013, Gross et al. 2014) revealed
some aspects about the spatial ecology of the American crocodile (home ranges and
distance movements) according to sex or age groups in coastal ecosystems and inland
water systems. Our analyses based on a larger database (considerably more animals
and more geolocations through time), were able to produce a much more complete
evaluation of how American crocodiles relate to the physical space that they inhabit in
an insular area, including the effects of seasonal differences in precipitation on their
movements and landscape use.
Triangulation is the most common way to estimate an animal's location
(Springer 1979). However, most researchers have treated radio-telemetry data as exact
points, neglecting to estimate geolocation uncertainty (Samuel and Kenow 1992); this
affects the accuracy of home range, utilization distribution area, and habitat use
pattern estimates. Previous studies on this species (Mazzotti 1983, Rodda 1984, Gaby
et al. 1985, Krushlan and Mazzotti 1989, Venegas-Anaya et al. 2013, Gross et al.
2014) have treated geolocations as exact data ignoring the measurement error; this
resulted in serious underestimation of total variation in the data. This problem also
exists in other studies of crocodiles (Brien et al. 2008, Subalusky et al. 2009, Fujisaki
et al. 2014), with implications on the results and conclusions generated depending on
which analyses were performed (Swithart and Slade 1997). Therefore, we used a
spatial method (standard error of distance) to estimate the uncertainty of the

Texas Tech University, Sergio A. Balaguera Reina, May 2018
95
triangulation technique on C. acutus (24.4 ± 23.0 m), allowing us to reduce the bias in
our estimates of home range, utilization distribution, and habitat use. It also allowed us
to define and filter outliers, reducing noise in the dataset, and increasing the accuracy
of our analyses.
We found patterns in distance movements, home ranges, and utilization
distribution by sex and age groups. Females showed a higher AMD than males and
adults had a higher AMD than sub-adults and juveniles. Nevertheless, the absence of
adult males in the present study may imply that the higher movement detected in
adults could be because they were adults or they were all females. Thus, future studies
should include adult males to test these findings. Regardless, overall, the larger
animals had greater average movements than smaller ones. However, long-distance
movement did not always mean larger home range area. We did find that males in
general had larger home ranges and utilization distribution areas than females
(regardless the absence of adults in the present study); similarly, sub-adults (females
and males) displayed larger values in these two attributes than juveniles, hatchlings,
and adults. Thus, sub-adults had the largest home ranges and utilization distributions
followed by juveniles, whereas adults and hatchlings showed the smallest home ranges
and utilization distributions. Based on these data, we found that females seemed to
move long distances around one particular area (in our case, Playa Blanca and El
Maria beaches), always coming back to or being around beaches (nesting areas),
whereas males moved relatively short distances in a wider area (Figure 5-5). We also
found that juveniles and sub-adults had larger home ranges than adults and hatchlings,
spreading through these larger areas in relatively short movements. The kinds of
dissimilarity in home range size and movement patterns observed in this study of
Crocodylus acutus have been reported in other crocodylians, including C. niloticus
(Hutton 1989), C. johnstoni (Tucker et al. 1997), Paleosuchus trigonatus (Magnusson
and Lima 1991), and C. porosus, and thus, appear to be common in crocodiles (Brien
et al. 2008).
We found a relationship between seasonal precipitation, reproductive ecology
behaviors reported in the area (Balaguera-Reina et al. 2015b), and the AMD, which

Texas Tech University, Sergio A. Balaguera Reina, May 2018
96
were statistically significant based on both Kruskal Wallis and post-hoc Dunn’s tests.
An individual’s average movement distance and its variation were higher during the
dry and ‘low-wet’ season (from December to April and May to August) and lower
during the true “wet” season (September to November). This pattern was clearly
observed by both sex (mainly in females) and age groups (mainly in adults and sub-
adults; Figure 5-4). All individuals’ movements analyzed pairwise per precipitation
season as well as per nesting, courtship and mating, and paternal care times were
significantly different (Table 5-3), showing the effect of these two variables on the
average movement of the American crocodile; movements were more accentuated in
July (low-wet season), February (brooding time), and April (hatching time). This may
be reflecting a correlation between the variation of the movement patterns and
seasonal periods associated with the reproductive ecology of the species. However,
juveniles did not show this same movement pattern as clearly as the other groups,
having their largest AMD in April (Figure 5-4).
These results suggest that the restricted distributions of females and wider
home ranges in males, as well as the wide areas traveled by sub-adults and juveniles
compared to adults and hatchlings, could be highly influenced by reproductive
ecology and the precipitation cycle on Coiba (Balaguera-Reina et al. 2015b).
Reproduction in other crocodylians (as in many other reptiles) is highly influenced by
the availability of water and the precipitation cycle (Medem 1981). Precipitation on
Coiba Island is strongly seasonal, having an average rainfall of 283.6 mm, ranging
from 20.2 to 625.9 mm per year (ETESA 2015). Most of the precipitation is limited to
the so-called “wet” season between May and December. This cycle annually generates
a “changing environment” that can have strong effects on movement patterns of
American crocodiles in the region. These variables have not been considered or
assessed in any other study of American crocodiles, so comparisons are not possible.
Several authors have reported similar results in other crocodylian species, for
example in Australia (Brien et al. 2008), where males of C. porosus (salt-water
crocodile) occupied larger home ranges than females in the dry season in non-tidal
waterholes. Authors studying species from Africa (Hutton 1989) and North America

Texas Tech University, Sergio A. Balaguera Reina, May 2018
97
(Rootes and Chabreck 1993) found that C. niloticus (Nile crocodile) and A.
mississippiensis (American alligator), respectively, have large movements and home
ranges associated with the wet/breeding season, highlighting the impacts of
reproductive behavior and precipitation on the ways that those species utilize the
surrounding physical spaces. Other authors (Webb and Messel 1978b, Kay 2004),
using telemetry methods and mark-recapture, respectively, support the contention that
C. porosus males often moved considerable distances around the home range, whereas
females made fewer but larger-scale movements, usually associated with visits to nest
sites, consistent with our findings on C. acutus. Dissimilarities in the movement
patterns and home ranges between sexes are described for C. porosus (Kay 2004),
possibly reflecting a consequence of the active search for females (which remain in
core areas) by males during the breading season (Brien et al. 2008). This behavior
might also explain the dissimilarities we found in our study, suggesting that this might
be a common behavior found for many crocodylians (Webb et al. 1978).
Using the MCP method Mazzotti (1983) in Florida estimated an average home
range of 5.6 ± 3.0 km2 (varying between 1.6 to 11.7 km2) for 10 American crocodiles
(from 190 to 300 cm total length). In contrast, a pilot study by our research team
(Venegas-Anaya et al. 2013, Gross et al. 2014) estimated average home range for 4
individuals (from 93 to 154 cm TL) on Coiba Island of 0.6 ± 1.0 km2, with a minimum
of 0.0 km2 and a maximum of 2.4 km2. These studies did not specify what percentage
(isopleth) from the MCP area these values correspond to; nevertheless, they are much
larger in Florida than the areas we estimated (0.2 ± 0.2 km2). We cannot directly
compare our results with the data obtained for C. acutus in Gatun Lake (Rodda 1984),
as the method used to estimate home ranges was unspecified and reported was in m
rather than m2. In Florida animals (Mazzotti 1983) AMD ranged from 0.8 to 1.4 km,
somewhat greater than the AMD estimated in the current study (𝑋 = 0.3 km, ranging
from 0.08 to 1.2 km). AMD values reported in the Gatun Lake study (Rodda 1984) are
up to 0.7 km larger than in the present study, but more similar than those reported in
the Florida study. The smaller area and distances traveled by American crocodiles in

Texas Tech University, Sergio A. Balaguera Reina, May 2018
98
Coiba compared to other studies of C. acutus in mainland localities may well be the
result of more limited resource availability of the insular setting.
We rejected the null hypothesis of no discernible pattern among spatial
variables because we found, quantified, and statistically tested relationships among
average movement distances, home ranges, age groups and sexes, influenced by
seasonality and the reproductive ecology behavior of the American crocodiles in the
area. We found also a clear disaggregate distribution by age groups throughout habitat
types on Coiba, as has been reported by a previous study (Venegas-Anaya et al. 2015),
where adults and hatchlings inhabited a more restricted number of habitats than
juveniles and sub-adults.
Conspecific proximity (CP) analysis revealed that tagged individuals were
typically at least 500 m from each other; in only 20% of these geolocations were
animals 200 m or less from one another. We also found that although juveniles were
never this close to adults, they were detected in the “vicinity” of sub-adults 17% of the
time and of hatchlings 50% of the time. In contrast, hatchlings were around or less
than 200 m from sub-adults about 4% of the time and away from adults 50% of the
time. Finally, adults were up to 200 m from sub-adults around 45% of the time. These
results potentially reflect a hierarchy system throughout age classes in the study area,
where adults are more related in space with sub-adults, sub-adults with juveniles, and
juveniles with hatchlings, respectively. The relationship between juveniles and
hatchlings may be established after the parental care period, when hatchlings start to
explore new areas and reduce their relative proximity to adults as they increase it with
other juveniles. Predation is likely to be the most important variable that influences the
relationship between juveniles and adults. However, as animals get reproductively
active, more complex relationships may play a role on this hierarchy system.
Analyses of age groups (Platt and Thorbjarnarson 2000a) and size classes
(Seijas 1988; Appendices 5-1 to 5-4) represent different ways to classify individuals in
order to determine the structure of a population. Both approaches have pros and cons
based on the methods used to estimate them and implications of the results for efforts

Texas Tech University, Sergio A. Balaguera Reina, May 2018
99
in management and conservation. Nevertheless, both approaches have been employed
in studies monitoring American and other crocodile species (Balaguera-Reina and
González-Maya 2008, Hernandez-Hurtado et al. 2011, Espinal and Escobedo-Galván
2011). For this reason, we think it is important to have a reference or measure of the
behavior for those groups in a spatial/ecological context, which will allow researchers
to visualize the movement patterns and home ranges using any of the classification
methods. Finally, the current study’s results regarding home range size per age group,
size class and sex should not necessarily be taken as typical for the entire species, but
rather as a starting point for future research on C. acutus (and other crocodiles). Such
studies will allow us to better understand how the patterns we found in Coiba may
change with latitudinal in both mainland and insular localities.
Historical, current, and future extinction rates of biodiversity have been
documented and modeled in many taxa with often frightening results and predictions
(Alroy 2015, Ceballos et al. 2015). These studies unanimously encourage society to
reduce impacts (e.g., land cover transformation, pollution, among others) and increase
‘real’ planning (i.e., integrative and comprehensive plans) to protect and provide
sustainable use of species and their habitats. However, a lack of thorough ecological
knowledge for many species makes it difficult to effectively meet this challenge in
many parts of the world. Furthermore, top predators face a bigger challenge due to the
overlapping habitats with humans competing directly or indirectly for resources; this
implies that specific spatial information is required in order to assess impacts and
create inclusive management plans (top predators’ ecology, ethno-zoology, urban
ecology, and human development plans). Our findings provide both a technical
resource for developing conservation plans in Panama and a comprehensive
approximation of the inter-relationship between the American crocodile and its
surrounding environment, applicable across its range for baseline management and
conservation planning. They can serve as a valuable starting point relative to
understanding crocodile spatial ecology in other areas (e.g., mainland populations).
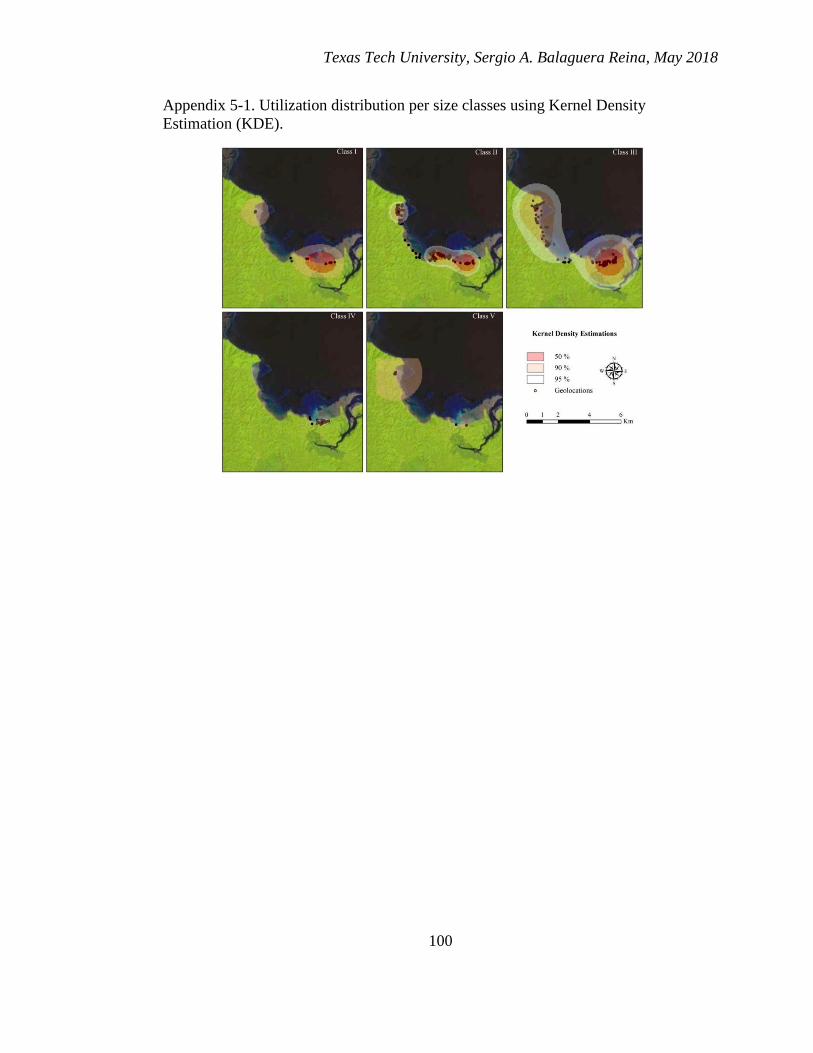
Texas Tech University, Sergio A. Balaguera Reina, May 2018
100
Appendix 5-1. Utilization distribution per size classes using Kernel Density
Estimation (KDE).

Texas Tech University, Sergio A. Balaguera Reina, May 2018
101
Appendix 5-2. Number of path trajectories (N), time average between locations (TAG), average movement distance (AMD),
and average movement speed (AMS) followed by American crocodiles in Coiba Island per size class.
Groups # of individuals N TAG (h) max-min AMD (m) max-min SP (km/h) max-min
Class V 1 13 141 (3-1319) 907 (8-5607) 0.02 (0.0-0.24)
Class IV 4 60 293 (4-1653) 201 (2-1055) 0.01 (0.0-0.12)
Class III 7 206 203 (2-3833) 323 (3-4337) 0.01 (0.0-0.34)
Class II 12 191 180 (1-2455) 276 (2-5807) 0.01 (0.0-0.26)

Texas Tech University, Sergio A. Balaguera Reina, May 2018
102
Appendix 5-3. Number of observations, percent of geolocations closer than 200 m, and average conspecific proximity (ACP)
within a time overlapping of 6 h estimated for 24 American crocodiles followed in Coiba Island from 2010 to 2013 divided by
size class.
N Up to 200 m (%) ACP (m)
Class I to II 11 9 2,616.26 ± 2,178.78
Class I to III 17 6 1,756.72 ± 1,868.94
Class I to IV 4 100 63.28 ± 58.34
Class I to V - - -
Class II to V 29 21 1,639.70 ± 1630.33
Class II to IV 59 57 673.49 ± 1,309.55
Class II to III 245 11 1,665.01 ± 1,810.01
Class III to IV 88 49 876.51 ± 1,571.75
Class III to V 25 0 2,562.83 ± 1,767.77
Class IV to V 2 0 5,619.73

Texas Tech University, Sergio A. Balaguera Reina, May 2018
103
Appendix 5-4. Home range and utilization distribution of the American crocodiles on Coiba Island estimated via Minimum
Convex Polygon (MCP), Kernel Density Estimation (KDE), and Local Convex Hull—adaptive (aLoCoH). Data for all
individuals and averages divided by size classes are reported. Analyses were made including all data on all individuals and
using isopleths at 50% and 95%.
50% (km2) 95% (km2)
MCP KDE aLoCoH MCP KDE aLoCoH
V 0.00 0.00 - 1.34 7.24 -
IV 0.01 0.01 0.01 0.12 0.29 0.09
III 8.42 2.54 0.27 10.31 23.98 2.35
II 2.15 1.46 0.33 8.87 5.97 1.19
I 0.44 1.98 0.17 4.34 8.09 0.31

Texas Tech University, Sergio A. Balaguera Reina, May 2018
104
CHAPTER VI
TROPHIC ECOLOGY
Balaguera-Reina, S. A., M. Venegas-Anaya, V. Beltrán-Lopez, A. Cristancho,
and Ll. D. Densmore III. Food habits and ontogenetic dietary partitioning of
American crocodiles in a tropical Pacific island in Central America. Ecosphere.
Submitted.
INTRODUCTION
The American crocodile (Crocodylus acutus) is one of the largest and most
wide-ranging crocodylians in the world, being distributed throughout the Americas
(North, Central, and South), including the Greater Antilles of the Caribbean and some
minor islands in the Pacific (Thorbjarnarson 2010). This widespread distribution has
provided a variety of habitats for the species to live in, from rivers to coastal areas
including riparian forest, ponds, swamps, mangroves, and beaches in both mainland
and insular areas (Thorbjarnarson et al. 2006). However, the unsustainable use of the
species during the 19th and 20th centuries diminished and fragmented its populations
across its range, displacing American crocodiles to un-populated areas (Medem 1981,
Thorbajarnarson 1989). It also influenced the habitats C. acutus could live in,
currently primarily restricted to estuarine and isolated river areas (Balaguera-Reina et
al. 2015a). To date, American crocodiles are catalogued as “Vulnerable” by the
International Union for Conservation of Nature (Ponce-Campos et al. 2012) on a
regional scale and “Endangered” or “Critically Endangered” in several local
assessments (Colombia: Morales-Betancourt et al. 2015; Venezuela: Rivas et al. 2012;
Ecuador: Carvajal et al. 2005; Peru: SPIJ 2004).
Despite its wide range, some aspects of C. acutus’ natural history remain
poorly studied, especially in insular areas. Regarding food habits, authors such as
Medem (1981) assessed the stomach content of several dead American crocodiles in
the Caribbean (Frio and Palenque rivers) and Choco (Ungia lagoon) regions as well as

Texas Tech University, Sergio A. Balaguera Reina, May 2018
105
in some insular areas (Fuerte Island) in Colombia, reporting fish, mollusks, insects,
and crustaceans along with gastroliths. Thorbjarnarson (1988), Villegas and Schmitter-
Soto (2008), and Platt et al. (2013a) identified aquatic insects, crustaceans, fish,
amphibians, reptiles, birds, and mammals in crocodile stomachs from brackish lakes
and coastal areas in Haiti, Mexico, and Belize based on flushing techniques. Casas-
Andreu and Barrios-Quiroz (2003) analyzed fecal samples from a lagoon in Mexico,
identifying mammal hair, bird feathers, reptile and fish scales, crustaceans, insects,
and seeds. Nevertheless, no studies have been done to date on insular areas on the
Pacific coast regarding American crocodiles’ food habits.
Coiba National Park is one of the five insular areas on the Pacific side (besides
Las Perlas Archipelago, Gobernadora, Leones, and Maria Magdalena islands)
currently harboring C. acutus populations (Casas-Andreu 1992, Thorbjarnarson et al.
2006, Balaguera-Reina et al. 2015b). It is thought that Coiba Island is home to one of
the largest remaining American crocodile populations across Central America
(between 500 - 1000 individuals; Thorbjarnarson et al. 2006, Venegas-Anaya et al.
2015). Even though the species is protected by national and international laws
(Balaguera-Reina et al. 2015c) and hunting is strictly prohibited throughout its range
(Thorbjarnarson 2010), additional information about its ecology and natural history
are needed to create effective and sound conservation measurements.
Studies of how crocodylians relate to other species in a trophic context are
fundamental to understanding how these species fit in their communities, providing
tools for researchers to study more in-depth ecological aspects (e.g., energy fluxes,
carrying capacity). Diet is an important driver in crocodylians, affecting their body
condition, behavior, reproduction, and physiology (Lang 1987, Mazzotti et al. 2009,
Platt et al. 2013a). Species inhabiting hyperosmotic environments (as in our case) are
undoubtedly affected by what they eat, using diet as an osmoregulation control (Leslie
and Taplin 2000). All these aspects highlight how important dietary studies are, in
addition they allow researchers also to understand how food habits relate to life stages
in a defined population.

Texas Tech University, Sergio A. Balaguera Reina, May 2018
106
We characterized C. acutus food habits in Coiba Island, Panama, assessing
ontogenetic dietary variation and dietary niche overlap by age group and size. We
anticipated finding differences in food habits among age groups, with greater overlap
among similar-sized animals and lower overlap among those of different sizes, based
on the spatial ecology already described for American crocodiles in the area
(Balaguera-Reina et al. 2016).
MATERIALS AND METHODS
Study area
The study area encompasses tide-modified reflective beaches with tidal mud
flats, sand flats, and low tide terraces based on Short’s (2006) classification with
medium and low sand banks. Shoreline vegetation is characterized by mangrove areas
(mainly red mangrove -Rhizophora mangle, black mangrove -Avicennia germinans,
and buttonwood -Conocarpus erectus), and tropical rain forest and riparian forest
(primary and secondary; Ibañez 2006). Seasonal freshwater/brackish streams are
present throughout the study area. Salinity in areas were American crocodiles have
been found (including flooding areas) have an annual average of 31 ± 6 practical
salinity units (psu); however, values up to 40 psu have been recorded in dry season
(December to April precipitation < 200 m) and as low as 5 psu in rainy season
(maximum precipitation in October ~ 600 mm; Rivera-Rivera 2014, Balaguera-Reina
et al. 2015, ETESA 2015, Morales-Ramirez 2016). A total of 929 species of fauna
have been reported from Coiba Island of which ~40% belongs to Chordata and ~35%
to Arthropoda (Niño-Monroy and Rincón-Bello 2014). Of these, 240 species have
been recorded on mangrove ecosystems and 297 inhabit coral reefs (Niño-Monroy and
Rincón-Bello 2014), both habitats where American crocodiles are commonly found.
Sampling
We carried out monthly spotlight surveys from March to December 2013 at the
southern tip of Coiba Island (between El Maria and Playa Blanca beaches) across four
transects previously defined (Figure 6-1) and monitored by foot along the coast in four
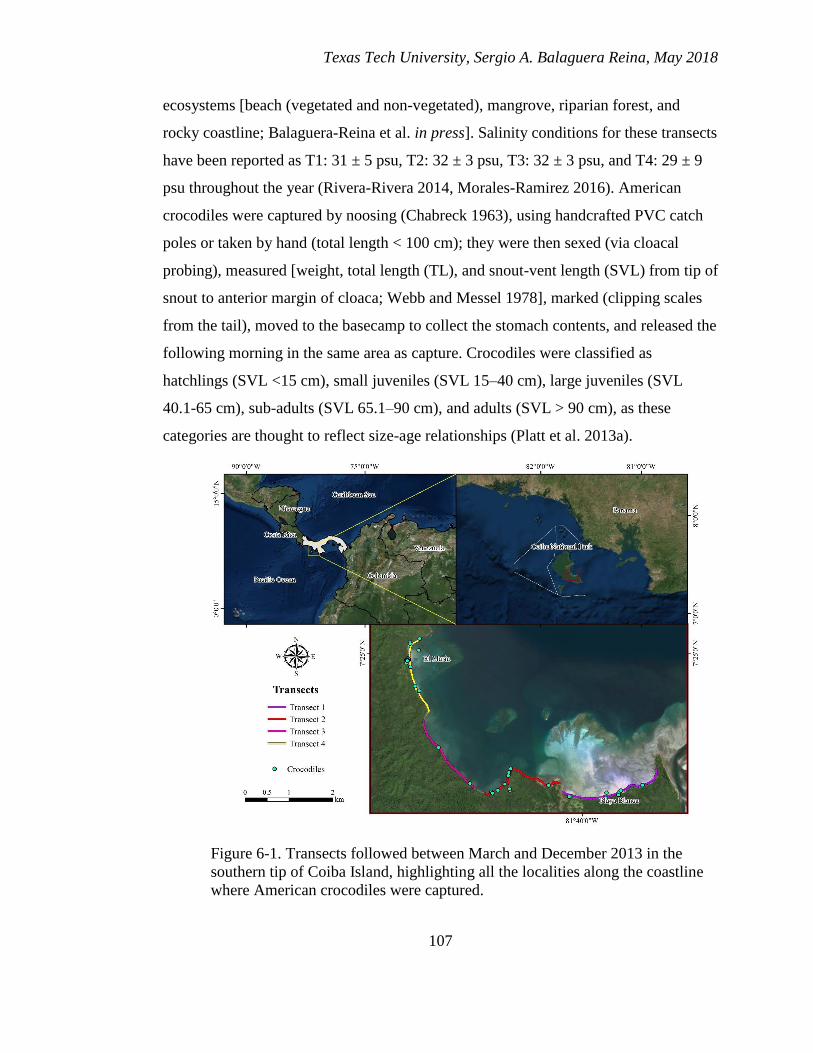
Texas Tech University, Sergio A. Balaguera Reina, May 2018
107
ecosystems [beach (vegetated and non-vegetated), mangrove, riparian forest, and
rocky coastline; Balaguera-Reina et al. in press]. Salinity conditions for these transects
have been reported as T1: 31 ± 5 psu, T2: 32 ± 3 psu, T3: 32 ± 3 psu, and T4: 29 ± 9
psu throughout the year (Rivera-Rivera 2014, Morales-Ramirez 2016). American
crocodiles were captured by noosing (Chabreck 1963), using handcrafted PVC catch
poles or taken by hand (total length < 100 cm); they were then sexed (via cloacal
probing), measured [weight, total length (TL), and snout-vent length (SVL) from tip of
snout to anterior margin of cloaca; Webb and Messel 1978], marked (clipping scales
from the tail), moved to the basecamp to collect the stomach contents, and released the
following morning in the same area as capture. Crocodiles were classified as
hatchlings (SVL <15 cm), small juveniles (SVL 15–40 cm), large juveniles (SVL
40.1-65 cm), sub-adults (SVL 65.1–90 cm), and adults (SVL > 90 cm), as these
categories are thought to reflect size-age relationships (Platt et al. 2013a).
Figure 6-1. Transects followed between March and December 2013 in the
southern tip of Coiba Island, highlighting all the localities along the coastline
where American crocodiles were captured.

Texas Tech University, Sergio A. Balaguera Reina, May 2018
108
Stomach content samples were collected following the flushing method
published by Taylor et al. (1978). The animal’s mouth was opened using ropes or bare
hands (depending on crocodile size) and a piece of PVC tube (adjusted by size) was
inserted and taped around the mouth to keep it fixed. A flexible PVC tube lubricated
with vegetable oil was then gently inserted into the mouth, opening the velum
palatinum and passing through the esophagus and the cardiac sphincter until it reached
the stomach. The animal was tilted up 45° and water was pumped throughout the
flexible PVC tube until the stomach was visibly distended, massaging it to create a
stomach content-water mixture. After this mixing, the animal was tilted down 45° to
collect the mixture coming from the other end of the tube into an empty container
while massaging and pressing the stomach (Heimlich maneuver) to help the stomach
content move out easily (Fitzgerald 1989). This process was repeated three or four
times until water came out clear (“free from ingesta”; Platt et al. 2013a). This method
has proved to be safe and highly effective, recovering up to 95% of prey and non-food
items from crocodylian stomachs (Fitzgerald 1989, Rice et al. 2005).
Each sample was filtered using a 2-mm sieve and a 0.5-mm sieve (separating
large from small stomach content elements) and fixed with 76% ethanol. The liquid
part of the sample as well as elements smaller than 0.5 mm were preserved for future
barcoding analysis. Samples were taken to the lab, classified using an optic
stereoscope into four main groups (prey items, vegetal component, gastroliths, and
parasites) and weighed using an analytical scale (± 0.1 mg). From each of these
groups, prey items were reviewed in detail, weighing samples as we classified them
taxonomically until it was impossible for us to go further. These weights were
standardized to proportions to analyze variation statistically among age groups,
minimizing the effect of animal size in the analyses (making them equivalent). At that
point, we focused our efforts on selecting the most conspicuous (i.e., crab carapace),
representative (i.e., hair), and complete structures that would allow us to classify the
prey items to the lowest possible taxon. We separated these samples per individual and
grouped into major prey categories (insects, arachnids, crustaceans, fish, reptiles,
birds, and mammals) and estimated the percent occurrence (the number of samples in

Texas Tech University, Sergio A. Balaguera Reina, May 2018
109
which a prey items occurred divided by the sample size per age group; Rosenberg and
Cooper 1990). We also included in this list prey items that we saw being held in
crocodiles’ jaws while we were doing fieldwork, since it is highly likely these prey
were ingested.
Shapiro-Wilk and Bartlett analyses were performed in R 3.3.3 (R Development
Core Team 2012) to test for normality and homoscedasticity of the data. We used the
test of equal or given proportions (prop.test) to assess variation in weight proportions
among the four main stomach content groups (prey items, vegetal component,
gastroliths, and parasites) as well as by crocodile age group. Principal component
analysis (PCA) was performed to assess correlation among main groups and its effect
in the total variation of data collected. We also estimated a species accumulation curve
(SAC) based on the function specaccum (accumulator function random) found in the
package vegan in R (Oksanen et al. 2017), to determine whether we reach the plateau
(maximum species diversity). Finally, a linear regression was performed to determine
the allometric relationship between TL and SVL to facilitate comparisons with other
studies that defined age groups based on either of these measurements.
We assessed ontogenetic dietary partitioning using overlapping group analysis
(Games 1990), which consisted of taking groups of 15 individuals ranked per SVL and
assessing the percent occurrence per prey category in each group. In every group, we
removed the first five individuals (the smallest ones) and included five more based on
the ranked SVL. This provided us a continuous measurement of possible trends in
changes of feeding habits per size (Games and Moreau 1997). We also used the
Shannon-Wiener diversity index (H’) to estimate dietary niche breadth and the degree
of dietary specialization for each crocodile age group (Schoener 1968, Platt et al.
2013a). These data were standardized from 0 to 1 using the evenness measure (J’) as
recommended by Platt et al. (2013a); the lower the value of J’ the more specialized the
feeding habits of a particular overlapping group (Krebs 1989). Finally, dietary niche
overlap among age groups was estimated based on the percentage overlap equation
developed by Renkonen (1938) for species niche overlap and adjusted by Platt et al.
(2013a) to evaluate intraspecific diet variation.
Texas Tech University, Sergio A. Balaguera Reina, May 2018
110
RESULTS
We captured and collected stomach content samples from 49 individuals with a
mean of 4.9 ± 1.6 animals per month. From these, 38 were captured once and 11 were
recaptured more than once; 20 were males, 16 females, and 2 with sex not determined
(sex ratio 1.25:1); four were adults (𝑋 = 110.23 ± 9.17 cm SVL), four subadults (𝑋 =
81.68 ± 6.37 cm SVL), 19 large juveniles (𝑋 = 51.38 ± 6.22 cm SVL), and 11 small
juveniles (𝑋 = 26.82 ± 7.17 cm SVL). Even though we captured hatchlings as part of
another study (Balaguera-Reina et al. 2015b), we did not collect stomach contents
from them due to previous studies that showed that animals initiate feeding only after
a week of hatching (Platt et al. 2002). A month later when we came back to the area
and captured these animals, they fit into the “small juvenile” category (Balaguera-
Reina et al. 2015b).
Most crocodiles were captured in transects 1 and 4 (mangrove and vegetated
beach areas), with few being captured in either riparian forest and rocky coastlines
(transect 3; Figure 6-1). Crocodile weights ranged between 0.09 and 35 kg. The
regression model between TL and SVL measurements was statistically significant (F-
statistic = 0.00, df = 47, p-value < 0.00, R2 = 0.99) providing the following linear
equation �̂� = −1.27 + 0.531𝑥, where 𝑥 is the TL in cm and �̂� is the SVL in cm.
We found significant differences among the weight proportions of the four
main groups recovered from crocodile stomachs (n = 49, prop.test χ2 = 1727.2, df = 3,
p-value < 0.00), of which prey items and gastroliths represented the largest majority of
the contents, followed by vegetal material and parasites (Figure 6-2). The PCA
showed a first principal component strongly related with prey items (0.93) and a
smaller proportion with gastroliths (0.34), and vegetal material (0.15); this component
explained 95.9% of the variation found in the data. The second component was
strongly correlated with gastroliths (0.87) and vegetal material (0.33) and inversely
related with prey items (-0.37) and explained only the 4% of the variation.

Texas Tech University, Sergio A. Balaguera Reina, May 2018
111
Figure 6-2. Proportional values of the four major groups collected from
American crocodile stomach contents in Coiba Island, Panama, expressed as
median and quartiles with whiskers at minimum and maximum values. Outliers
are represented as open circles.
On average, we recovered the largest amount of prey items, gastroliths, and
vegetal components in subadults, followed by adults, large juveniles, and small
juveniles (Table 6-1). Values were significantly different in all cases (prop.test χ2 =
42.22, 34.09, and 8.13, df = 3, p-value < 0.00). However, we did not find significant
differences in the proportion of parasites collected throughout age groups (prop.test χ2
= 1, df = 3, p-value = 0.8). Large juveniles had the largest proportion of prey items
and subadults the largest proportion of vegetal component among all age groups. Even
though subadults had the largest amount of ingesta, they had the lowest proportion of
prey items and the largest proportion of gastroliths.
From all samples, we selected the most conspicuous, representative, and
complete structures allowing us taxonomically identified three phyla, four subphyla,
eight classes, 11 orders, 17 families, 14 genera, and 12 species as prey items,
catalogued in seven categories (insects, arachnids, crustaceans, fish, reptiles, birds,
and mammals). However, not all samples could be identified to the lowest taxon, most
being identified only to family (Table 6-2). Samples identified as Annelida were likely
from one or more species belonging to the subclass Oligochaetea (aquatic and
terrestrial worms), but since these samples were highly digested, we were not able to

Texas Tech University, Sergio A. Balaguera Reina, May 2018
112
go beyond that in the classification nor could we obtain a clear weight estimate.
Arthropoda contributed the most to the richness of prey items found in the crocodiles’
ingesta, of which Crustacea, specifically the infraorder Brachyura (i.e., crabs), were
predominant with seven species. Goniopsis pulchra, Cardisoma crassum, Gecarcinus
quadratus, and Ocypode gaudichaudii were the most common crab species found in
the American crocodile stomach contents in the area (Table 6-2). We also identified a
mantis shrimp (Stomatopoda: Cloridopsis dubia) from stomach contents and field
observation since we saw a crocodile holding one in its jaws.
Table 6-1. Stomach content weights and proportions recovered from American
crocodiles from Coiba Island, Panama, expressed as an average (first number) plus a
dispersion measure (minimum-maximum) as well as the respective proportion value
(in brackets) by age group (AD: adults, SA: subadults, LJ: large juveniles, SJ: small
juveniles). The number under each age group reflects the sample size.
Prey items
(gr)
Gastroliths
(gr)
Vegetal component
(gr)
Parasites
(gr)
Total
(gr)
Ad
(4)
47.01
(38.33-
55.61)
[0.87]
4.18
(0.06-8.16)
[0.77]
3.04
(0.16-6.22)
[0.56]
0.05
(0.00-0.18)
[0.01]
54.27
(38.54-
70.17)
SA
(4)
66.05
(23.53-
148.65)
[0.70]
19.36
(0.00-72.99)
[0.21]
8.77
(0.19-31.69)
[0.93]
0.16
(0.00-0.56)
[0.02]
94.33
(23.75-
253.88)
LJ
(21)
6.24
(0.11-28.28)
[0.91]
0.45
(0.00-2.54)
[0.65]
0.18
(0.00-0.77)
[0.26]
0.01
(0.00-0.11)
[0.02]
6.88
(0.11-
31.70)
SJ
(20)
2.53
(0.52-7.48)
[0.89]
0.08
(0.00-0.50)
[0.30]
0.20
(0.00-1.47)
[0.69]
0.02
(0.00-0.30)
[0.08]
2.83
(0.52-
9.75)
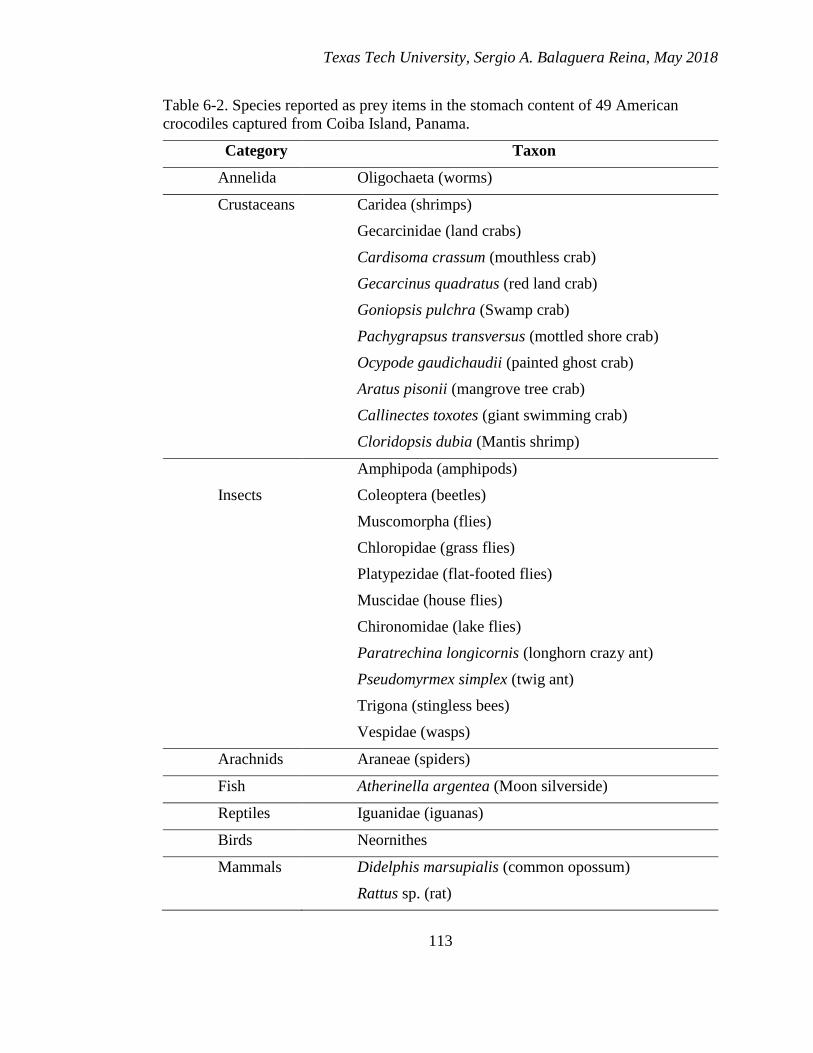
Texas Tech University, Sergio A. Balaguera Reina, May 2018
113
Table 6-2. Species reported as prey items in the stomach content of 49 American
crocodiles captured from Coiba Island, Panama.
Category Taxon
Annelida Oligochaeta (worms)
Crustaceans Caridea (shrimps)
Gecarcinidae (land crabs)
Cardisoma crassum (mouthless crab)
Gecarcinus quadratus (red land crab)
Goniopsis pulchra (Swamp crab)
Pachygrapsus transversus (mottled shore crab)
Ocypode gaudichaudii (painted ghost crab)
Aratus pisonii (mangrove tree crab)
Callinectes toxotes (giant swimming crab)
Cloridopsis dubia (Mantis shrimp)
Amphipoda (amphipods)
Insects Coleoptera (beetles)
Muscomorpha (flies)
Chloropidae (grass flies)
Platypezidae (flat-footed flies)
Muscidae (house flies)
Chironomidae (lake flies)
Paratrechina longicornis (longhorn crazy ant)
Pseudomyrmex simplex (twig ant)
Trigona (stingless bees)
Vespidae (wasps)
Arachnids Araneae (spiders)
Fish Atherinella argentea (Moon silverside)
Reptiles Iguanidae (iguanas)
Birds Neornithes
Mammals Didelphis marsupialis (common opossum)
Rattus sp. (rat)

Texas Tech University, Sergio A. Balaguera Reina, May 2018
114
Two species of Insecta (Hymenoptera: Paratrechina longicornis and
Pseudomyrmex simplex) were identified in the stomach contents of two adults and one
large juvenile, which were likely ingested as “by-catch” prey items (i.e., unwanted or
untargeted prey). Regarding Chordata, we recognized two species, one from the class
Actinopterygii (Atheriniformes: Atherinella argentea) identified in a small juvenile
crocodile, and another from the class Mammalia (Didelphimorphia: Didelphis
marsupialis) identified in one large juvenile and two adults. Most of the prey items
identified inhabit intertidal and coastal ecosystems such as mangroves either in the
ground (e.g., G. pulchra, C. crassum, and G. quadratus) or in trees (Aratus pisonii) as
well as on beaches (O. gaudichaudii), rocky coastlines (A. argentea), and forested
areas (D. marsupialis).
Large juveniles (n = 21) had the highest number of species identified in
stomach contents (nine species), followed by small juveniles (n = 20) and adults (n =
4, four species each), and subadults (n = 4, one species). However, the SAC showed
high variation in the number of species reported as well as a lack of plateau after
sampling 49 individuals (Figure 6-3), which implies that more sampling should be
done to clearly define the maximum diversity of prey items in the study area.
Figure 6-3. Species accumulation curve (SAC) and the standard deviation of
the data (blue contour). Boxplot figures represent the median, quartiles,
maximum and minimum per individual and plus symbols (+) represent
outliers.
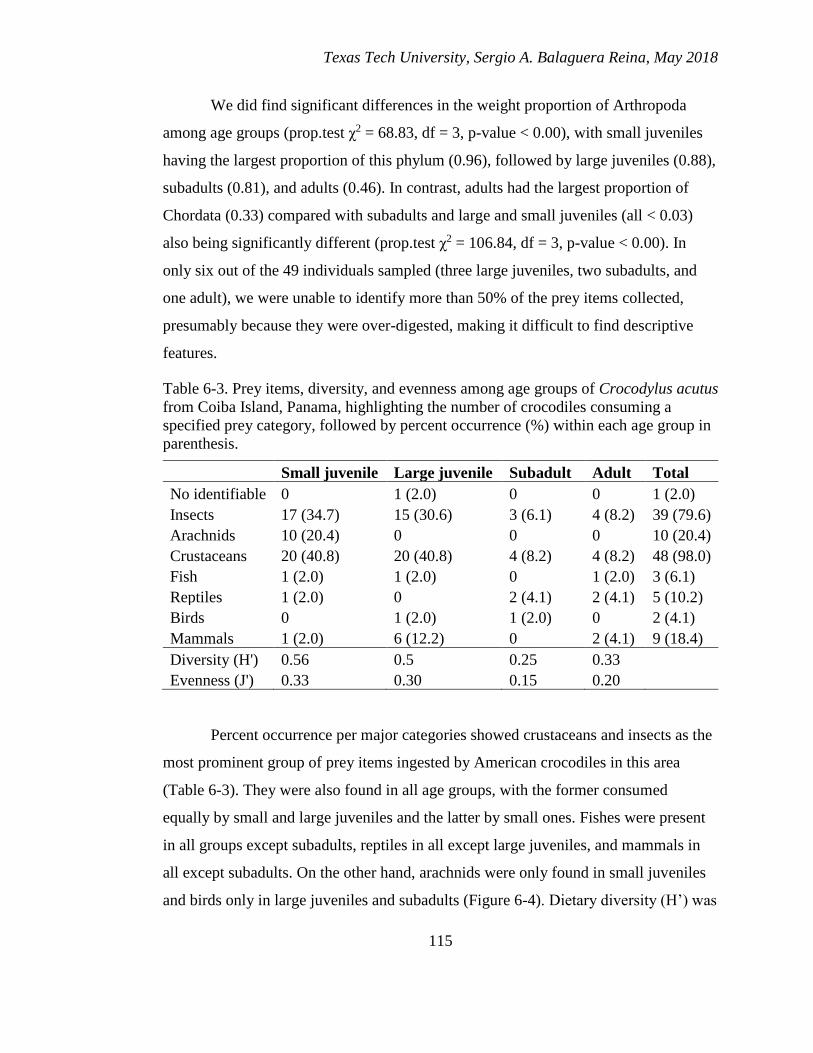
Texas Tech University, Sergio A. Balaguera Reina, May 2018
115
We did find significant differences in the weight proportion of Arthropoda
among age groups (prop.test χ2 = 68.83, df = 3, p-value < 0.00), with small juveniles
having the largest proportion of this phylum (0.96), followed by large juveniles (0.88),
subadults (0.81), and adults (0.46). In contrast, adults had the largest proportion of
Chordata (0.33) compared with subadults and large and small juveniles (all < 0.03)
also being significantly different (prop.test χ2 = 106.84, df = 3, p-value < 0.00). In
only six out of the 49 individuals sampled (three large juveniles, two subadults, and
one adult), we were unable to identify more than 50% of the prey items collected,
presumably because they were over-digested, making it difficult to find descriptive
features.
Table 6-3. Prey items, diversity, and evenness among age groups of Crocodylus acutus
from Coiba Island, Panama, highlighting the number of crocodiles consuming a
specified prey category, followed by percent occurrence (%) within each age group in
parenthesis.
Small juvenile Large juvenile Subadult Adult Total
No identifiable 0 1 (2.0) 0 0 1 (2.0)
Insects 17 (34.7) 15 (30.6) 3 (6.1) 4 (8.2) 39 (79.6)
Arachnids 10 (20.4) 0 0 0 10 (20.4)
Crustaceans 20 (40.8) 20 (40.8) 4 (8.2) 4 (8.2) 48 (98.0)
Fish 1 (2.0) 1 (2.0) 0 1 (2.0) 3 (6.1)
Reptiles 1 (2.0) 0 2 (4.1) 2 (4.1) 5 (10.2)
Birds 0 1 (2.0) 1 (2.0) 0 2 (4.1)
Mammals 1 (2.0) 6 (12.2) 0 2 (4.1) 9 (18.4)
Diversity (H') 0.56 0.5 0.25 0.33 Evenness (J') 0.33 0.30 0.15 0.20
Percent occurrence per major categories showed crustaceans and insects as the
most prominent group of prey items ingested by American crocodiles in this area
(Table 6-3). They were also found in all age groups, with the former consumed
equally by small and large juveniles and the latter by small ones. Fishes were present
in all groups except subadults, reptiles in all except large juveniles, and mammals in
all except subadults. On the other hand, arachnids were only found in small juveniles
and birds only in large juveniles and subadults (Figure 6-4). Dietary diversity (H’) was

Texas Tech University, Sergio A. Balaguera Reina, May 2018
116
uniformly low across all age groups, with the greatest value among small juveniles
followed closely by large juveniles, and the lowest value among subadults followed
closely by adults. Concomitantly, dietary specialization (J’) showed the same patterns
as H’ with relatively specialized age groups; small juveniles were more generalists
(broad prey spectrum) and subadults more specialists due to reliance upon a limited
selection of prey (Table 6-3).
Figure 6-4. Overlapping group analysis by main categories of Crocodylus
acutus sampled from Coiba Island, Panama. The average Snout-Ventral Length
(SVL) was estimated based on the sizes of all 15 individuals used in each
group.
The overlapping group analysis by major categories showed a reduction in
consumption of invertebrates (crustaceans and insects) as individuals aged (Figure 6-
4). However, these two categories were still the most common throughout all
American crocodiles sampled (Table 6-3). Arachnids were the only group used
entirely by small crocodiles and were completely absent in adults. Vertebrates such as
mammals and reptiles were positively correlated with crocodile size, the number of
times found in stomach contents increasing as animals got larger. Fishes were
common in middle-sized animals (large juveniles) and birds in large animals (mainly
subadults). However, even though vertebrates occurred among stomach contents,
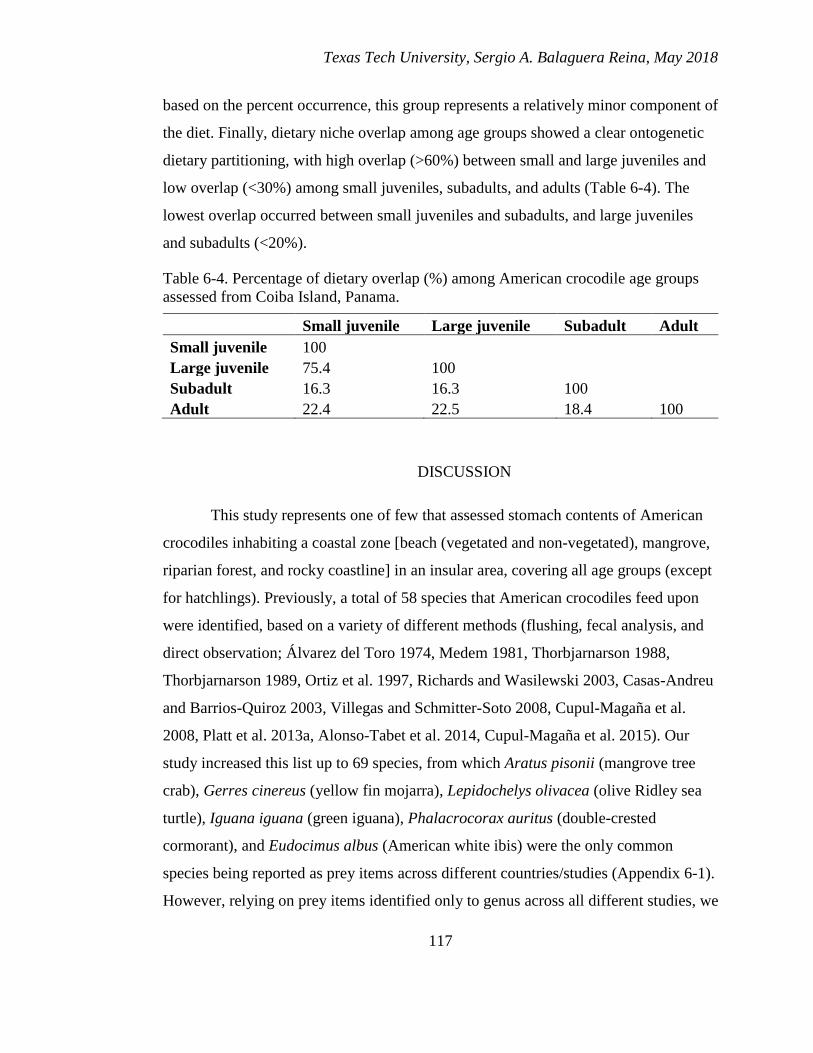
Texas Tech University, Sergio A. Balaguera Reina, May 2018
117
based on the percent occurrence, this group represents a relatively minor component of
the diet. Finally, dietary niche overlap among age groups showed a clear ontogenetic
dietary partitioning, with high overlap (>60%) between small and large juveniles and
low overlap (<30%) among small juveniles, subadults, and adults (Table 6-4). The
lowest overlap occurred between small juveniles and subadults, and large juveniles
and subadults (<20%).
Table 6-4. Percentage of dietary overlap (%) among American crocodile age groups
assessed from Coiba Island, Panama.
Small juvenile Large juvenile Subadult Adult
Small juvenile 100
Large juvenile 75.4 100
Subadult 16.3 16.3 100 Adult 22.4 22.5 18.4 100
DISCUSSION
This study represents one of few that assessed stomach contents of American
crocodiles inhabiting a coastal zone [beach (vegetated and non-vegetated), mangrove,
riparian forest, and rocky coastline] in an insular area, covering all age groups (except
for hatchlings). Previously, a total of 58 species that American crocodiles feed upon
were identified, based on a variety of different methods (flushing, fecal analysis, and
direct observation; Álvarez del Toro 1974, Medem 1981, Thorbjarnarson 1988,
Thorbjarnarson 1989, Ortiz et al. 1997, Richards and Wasilewski 2003, Casas-Andreu
and Barrios-Quiroz 2003, Villegas and Schmitter-Soto 2008, Cupul-Magaña et al.
2008, Platt et al. 2013a, Alonso-Tabet et al. 2014, Cupul-Magaña et al. 2015). Our
study increased this list up to 69 species, from which Aratus pisonii (mangrove tree
crab), Gerres cinereus (yellow fin mojarra), Lepidochelys olivacea (olive Ridley sea
turtle), Iguana iguana (green iguana), Phalacrocorax auritus (double-crested
cormorant), and Eudocimus albus (American white ibis) were the only common
species being reported as prey items across different countries/studies (Appendix 6-1).
However, relying on prey items identified only to genus across all different studies, we

Texas Tech University, Sergio A. Balaguera Reina, May 2018
118
added at least 26 more prey items to this list (Appendix 6-2). Therefore, we estimate
that the number of species American crocodiles feed upon could go over 100 if all the
incompletely identified taxa are included.
These data confirm that Crocodylus acutus can be defined as generalist with a
broad spectrum of prey inhabiting all types of habitats (i.e., terrestrial, aquatic, and
aerial) and consumption classifications (i.e., primary, secondary, tertiary, and
quaternary consumers). However, it is important to highlight that some species listed
as prey items identified from stomach contents or fecal samples might not be
perceived by researchers as target species in general (e.g., plants) or when focusing
only on large crocodiles (e.g., ants, flies, and worms among others). Nevertheless,
some of these species can provide an energetic input if digestion allows it. Optimal
foraging theory (Stephens and Krebs 1986) states that individuals categorize prey
items based on their net energetic value (energy gained considering capture costs,
handling, and digesting), selecting prey that guarantee highest energy intake per time
unit (Costa et al. 2015). However, when more profitable prey categories become
scarce, an expansion of the trophic niche is expected, and other prey categories can be
also exploited (Stephens and Krebs 1986, Costa et al. 2015).
Comprehensive dietary analyses in crocodylians are difficult to achieve mainly
because the lack of non-fatal methods (i.e., other than killing and collecting the
animal) that allow determination of the lowest taxonomic level and the number of prey
consumed with a high level of certainty. Even though percent occurrence has proven
to be an efficient method to examine prey items in terms of relative abundance (Krebs
1989, Platt et al. 2013a), crocodylian digestion and gut retention have been shown to
inflate the observation of hard structures (chitinous remains, crab carapaces, fish
scales, hair, and feathers) compared to more easily digested structures (e.g., bone,
flesh, and mollusk shells), adding uncertainty in the form of “noise” to the data
(Jackson et al. 1974, Platt et al. 2013a). In addition, the uncertainty of differentiating
primary (crocodylian target prey; e.g., fish) from secondary prey (prey items ingested
by the crocodilyan’s prey; e.g., annelids, seeds) that were consumed 16 hours or more
prior flushing (Jackson et al. 1974) will obscure the data collected by this technique.

Texas Tech University, Sergio A. Balaguera Reina, May 2018
119
This is likely not an issue in the present study since higher-level vertebrates were
poorly represented in the stomach contents collected. Nevertheless, this emphasizes
the need for a standardized method to quantify prey items in crocodylians that
characterizes this source of noise and allows us to better understand dietary dynamics
as well as inter-individual diet variation.
By quantifying major stomach content items (prey items, gastroliths, and
vegetal content) we can get a general estimate of the intake dynamic of the species as
well as the stomach fauna (parasites) and test some hypotheses regarding their
relevance (i.e., is vegetal component an important part of stomach content items?) and
whether they vary among age groups (do gastroliths and vegetal component vary
across age groups? does the parasite component increase as animals age? do the
proportions of prey items change as animals age?). In our case, prey items (79.7%)
and gastroliths (13.2%) were the most frequent components of American crocodile
stomach contents in Coiba Island, with the vegetal component (6.9%) and parasites
(0.2%) encompassing only a small fraction (Figure 6-2). Authors such as Platt et al.
(2013b) suggest saurochory as a plausible ecosystem service portrayed by
crocodylians based on how widespread fruit consumption is on these species.
However, the low representation of the vegetal component and the lack of visible
seeds in our study do not support this hypothesis for Coiba Island. Future studies
including the frequency of the vegetal component in the stomach content of American
crocodiles as well as the presence of seeds (differentiating what is coming as by-catch
or secondary ingestion and what is direct/target ingestion) and its viability across the
species range can provide more insights to test this hypothesis.
Proportionally, subadults had the largest weight of ingesta compared to adults
and large and small juveniles. However, this weight was primarily due to gastroliths
(sand and small rocks) rather than prey items. Large juveniles had the largest
proportion of prey items among all age groups. It is important to highlight, however,
that the small sample size of some age groups (adults and subadults n: 4 each)
underrepresent them in the analysis. It suggests that these outcomes should not be
taken as an absolute rather than as hypotheses to be tested in future research with

Texas Tech University, Sergio A. Balaguera Reina, May 2018
120
larger sample sizes per age groups. Nevertheless, the pattern found in this study can be
easily explained by the spatial ecology of the species in the area, with adults and
hatchlings inhabiting optimal areas such as mangroves and beaches (transects 2 and 4),
displacing juveniles and subadults to more sub-optimal habitats such as riparian forest
and rocky coastlines (transect 3; Balaguera-Reina et al. 2016). This type of
intraspecific size-related ecological separation appears commonplace among
crocodylians (Lang 1987) and has already been observed in other coastal areas in
Belize (Platt et al. 2013a), most likely as a strategy that reduces competition for food
(Tucker et al. 1996) and avoid cannibalism.
Crustaceans and insects were the main items recovered from stomach contents
throughout the study area (Figure 6-4), which agrees with studies done in Belize (Platt
et al. 2013a), Mexico (Cupul-Magaña et al. 2008, Casas-Andreu and Barrios-Quiroz
2003), and Haiti (Thorbjarnarson 1988). However, we found a low proportion of
vertebrates such as fish, reptiles, birds, and mammals, which differs notably from what
was reported in Cuba (Alonso-Tabet et al. 2014) and Mexico (Cupul-Magaña et al.
2015). As discussed above, hard structures from both invertebrates and vertebrates
could be over-represented due to slower digestion and gut retention in crocodylians
(Magnusson et al. 1987, Platt et al. 2013a). Nonetheless, the low number of hard
structures derived from vertebrates found in all samples (fish and reptiles scales,
feathers, hair) indicates that those groups may not be common prey of American
crocodiles in Coiba. It is important to highlight though, as we noted above, that the
low number of adults sampled might could have influenced the proportion of
vertebrates recovery in the present study, which means, more sampling must be done
to clearly support/reject this hypothesis. On the other hand, the large and varied
spectrum of crustaceans found across all individuals sampled strongly suggest that
these species are a major source of energy for C. acutus in Coiba Island. This
crustacean preference tendency has also been reported in areas such as coastal Belize
(Platt et al. 2013a) and can be explained by the high diversity and abundance of these
species in marine and coastal ecosystems and their relatively high nutritional value
Texas Tech University, Sergio A. Balaguera Reina, May 2018
121
(Ruppert and Barnes 1994). Therefore, crustaceans may guarantee the highest energy
intake for coastal American crocodiles per unit time with less effort.
Dietary diversity (H’) and dietary specialization (J’) show a tendency of
smaller animals being more generalists and adults more specialists. This pattern was
also reported by Platt et al. (2013a) in coastal Belize, which might also be explained
by optimal foraging theory, as small animals feed on many resources until net
energetic value trade-offs take place (Stephens and Krebs 1986). Overlapping group
analysis and dietary niche overlap analysis showed ontogenetic dietary partitioning
among juveniles, subadults, and adults, which agrees with Thorbjarnarson’s (1988)
findings. However, the general pattern postulated by Thorbjarnarson (1998) of small
individuals eating invertebrates and adults feeding on larger prey (vertebrates) was not
supported by the data we collected from Coiba Island. In contrast, our findings were
more correlated to what Platt et al. (2013a) found in coastal Belize, which may
indicate that American crocodiles dwelling in coastal areas rely more on easy-to-
catch/abundant prey such as crustaceans rather than larger prey items. Future studies
with larger sample sizes by age groups in other insular/coastal areas could provide
more insights to test this hypothesis across the species range.
Overall, American crocodiles inhabiting coastal areas demonstrated differences
in both dietary composition and structure compared to those dwelling inland and in
freshwater habitats. There was also inter-individual diet variation, which reflects the
plasticity and adaptability of C. acutus to a variety of conditions. Nonetheless, despite
this trophic adaptability and after 40 years of hunting banning across its range
(Thorbjarnarson 2010), American crocodiles are still a threatened species due mainly
to human intervention (habitat destruction; Balaguera-Reina et al. 2015). Therefore,
conservation efforts must be directed to maintain habitats in good conditions with
minimum human intervention that allow populations from this threatened species to
recover. More studies that quantify dietary composition and C. acutus niche breadth
should be done throughout its range to better understand how this species fits and
participates in the varied communities in which it is found.

Texas Tech University, Sergio A. Balaguera Reina, May 2018
122
Appendix 6-1. Species reported historically as American crocodile prey items across its range. This table also includes all the
species identified and reported in the current study. * Species names adjusted based on current taxonomy.
Category Species Country Authors
Crustaceans Cloridopsis dubia (Mantis shrimp) Panama Current study
Callinectes toxotes (giant swimming crab) Panama Current study
Callinectes sapidus (blue crab) Cuba Alonso-Tabet et al. (2014)
Cardisoma crassum (mouthless crab) Panama Current study
Cardisoma guanhumi (blue land crab) Belize Plat et al. (2013)
Gecarcinus quadratus (red land crab) Panama Current study
Goniopsis pulchra (swamp crab) Panama Current study
Goniopsis cruentata (mangrove root crab) Belize Plat et al. (2013)
Ocypode gaudichaudii (painted ghost crab) Panama Current study
Ocypode occidentalis (gulf ghost crab) Mexico Casas-Andreu and Barrios-Quiroz (2003)
Pachygrapsus transversus (mottled shore crab) Panama Current study
Aratus pisonii (mangrove tree crab)
Panama,
Belize,
Cuba
Current study, Plat et al. (2013), Alonso-
Tabet et al. (2014)
Macrobrachium tenellum (freshwater prawn) Mexico Cupul-Magaña et al. (2008)
Palaemon mundusnovus (brackish grass shrimp)* Mexico Villegas and Schmitter-Soto (2008)
Farfantepenaeus notialis (white shrimp) Cuba Alonso-Tabet et al. (2014)
Grapsus grapsus (red rock crab) Mexico Casas-Andreu and Barrios-Quiroz (2003)
Panoplax depressa (depressed rubble crab) Mexico Villegas and Schmitter-Soto (2008)

Texas Tech University, Sergio A. Balaguera Reina, May 2018
123
Appendix 6-1. Continued.
Category Species Country Authors
Uca minax (fiddler crab) Belize Plat et al. (2013)
Uca burgersi (Burger's fiddler crab)* Haiti Thorbjarnarson (1988)
Ucides cordatus (mangrove crab) Belize Plat et al. (2013)
Insects Paratrechina longicornis (longhorn crazy ant) Panama Current study
Pseudomyrmex simplex (twig ant) Panama Current study
Trepobates pictus (Water Striders) Mexico Cupul-Magaña et al. (2008)
Trepobates vazquezae (Water Striders) Mexico Cupul-Magaña et al. (2008)
Chilopods Scolopendra alternans (giant centiped) Haiti Thorbjarnarson (1988)
Fish Atherinella argentea (moon silverside) Panama Current study
Cathorops spixii (madamango sea catfish) Colombia Medem (1981)
Gerres cinereus (yellow fin mojarra) Mexico,
Cuba
Villegas and Schmitter-Soto (2008), Alonso-
Tabet et al. (2014)
Cyprinodon artifrons (Yucatan pupfish) Mexico Villegas and Schmitter-Soto (2008)
Dormitator latifrons (Pacific fat sleeper) Mexico Cupul-Magaña et al. (2015)
Gambusia hispaniole (mosquito fish) Haiti Thorbjarnarson (1988)
Gambusia yucatana (Yucatan gambusia) Mexico Villegas and Schmitter-Soto (2008)
Megalops atlanticus (Atlantic tarpon) Colombia Medem (1981)
Nandopsis haitiensis (Odo cichlid) Haiti Thorbjarnarson (1989)
Oreochromis mossambicus (Mozambique tilapia) Haiti Thorbjarnarson (1989)
Oreochromis niloticus (Nile tilapia) Mexico Cupul-Magaña et al. (2015)

Texas Tech University, Sergio A. Balaguera Reina, May 2018
124
Appendix 6-1. Continued.
Category Species Country Authors
Amphibians Lithobates berlandieri (Rio Grande Leopard
Frog)* Belize Plat et al. (2013)
Reptiles Rhinoclemmys areolata (Furrowed Wood Turtle) Belize Plat et al. (2013)
Trachemys decorata (hispaniolan slider) Haiti Thorbjarnarson (1988)
Trachemys decussata (Cuban slider) Cuba Alonso-Tabet et al. (2014)
Podocnemis lewyana (Magdalena river turtle) Colombia Medem (1981)
Lepidochelys olivacea (Olive ridley see turtle)
Costa
Rica,
Mexico
Ortiz et al. (1997), Cupul-Magaña et al.
(2005);
Ctenosaura similis (Spiny-tailed Iguana) Belize Plat et al. (2013)
Iguana iguana (green iguana) Colombia,
Mexico
Medem (1981), Casas-Andreu & Barrios-
Quiroz (2003)
Thamnophis validus (west coast gartersnake) Mexico Casas-Andreu & Barrios-Quiroz (2003)
Boa constrictor (Imperial Boa) Belize Plat et al. (2013)
Caiman crocodilus fuscus (spectacled caiman) Colombia Medem (1981)
Crocodylus acutus (American crocodile) United
States Richards and Wasilewski (2003)
Birds Phalacrocorax brasilianus (neotropic cormorant) Mexico Villegas and Schmitter-Soto (2008)
Phalacrocorax auritus (double-crested
cormorant)
Mexico,
Cuba
Villegas and Schmitter-Soto (2008), Alonso-
Tabet et al. (2014)
Anhinga anhinga (anhinga) Cuba Alonso-Tabet et al. (2014)

Texas Tech University, Sergio A. Balaguera Reina, May 2018
125
Appendix 6-1. Continued.
Category Species Country Authors
Anas discors (blue-winged teal) Mexico Villegas and Schmitter-Soto (2008)
Bubulcus ibis (cattle egret) Cuba Alonso-Tabet et al. (2014)
Eudocimus albus (American white ibis) Mexico,
Cuba
Casas-Andreu and Barrios-Quiroz (2003),
Alonso-Tabet et al. (2014)
Pelecanus occidentalis (brown pelican) Mexico Casas-Andreu and Barrios-Quiroz (2003)
Phoenicopterus ruber (American flamingo) Cuba Alonso-Tabet et al. (2014)
Dulus dominicus (palmchat) Haiti Thorbjarnarson (1988)
Jacana spinosa (northern jacana) Mexico Casas-Andreu and Barrios-Quiroz (2003)
Rallus longirostris (Clapper rail) Cuba Alonso-Tabet et al. (2014)
Nyctanassa violacea (yellow-crowned night
heron) Mexico Cupul-Magaña et al. (2015)
Zenaida macroura (mourning dove) Mexico Alvarez del Toro (1974)
Gallus Gallus (red junglefowl) Haiti Thorbjarnarson (1988)
Mammals Didelphis marsupialis (common opossum) Panama Current study
Mus musculus (house mouse) Haiti Thorbjarnarson (1988)
Capra hircus (Goat) Haiti Thorbjarnarson (1988)
Canis familiaris (domestic dog) Haiti Thorbjarnarson (1988)
Capromys pilorides (Desmarest's hutia) Cuba Alonso-Tabet et al. (2014)
Caluromys derbianus (Derby's wooly opossum) Mexico Alvarez del Toro (1974)
Puma yagouaroundi (Jaguarundi)* Mexico Casas-Andreu and Barrios-Quiroz (2003)

Texas Tech University, Sergio A. Balaguera Reina, May 2018
126
Appendix 6-2. Taxon reported historically as American crocodile prey items across its range. Notice the broad spectrum of
taxonomic groups from which researchers were unable to identify any further. * Species names adjusted based on current
taxonomy.
Category Taxon Country Authors
Annelida Oligochaeta (worm) Panama Current study
Crustaceans Gecarcinidae (land crab) Panama Current study
Amphipoda (amphipod) Panama Current study
Tethorchestia sp. (amphipod) Haiti Thorbjarnarson (1988)
Caridea (shrimp) Panama Current study
Palaemonidae (shrimp) Belize Plat et al. (2013)
Isopoda (isopod) Belize Plat et al. (2013)
Callinectes sp. (blue crab) Mexico, Belize
Villegas and Schmitter-Soto (2008), Plat et
al. (2013)
Mollusks Cephalopoda (octopus) Belize Plat et al. (2013)
Cerithium spp. (marine snail) Belize Plat et al. (2013)
Pomacea sp. Colombia Medem (1981)
Insects Trigona (stingless bees) Panama Current study
Vespidae (wasps) Panama Current study
Muscomorpha (flies) Panama Current study
Muscidae (house flies) Panama Current study
Chironomidae (lake flies) Panama Current study
Chloropidae (grass flies) Panama Current study

Texas Tech University, Sergio A. Balaguera Reina, May 2018
127
Appendix 6-2. Continued.
Category Taxon Country Authors
Coleoptera (beetles) Panama Current study
Platypezidae (flat-footed flies) Panama Current study
Stratiomyidae (soldier flies) Mexico Villegas and Schmitter-Soto (2008)
Caelifera (grasshopper) Belize Plat et al. (2013)
Gryllidae (crikets) Belize Plat et al. (2013)
Mantidae (praying mantises) Haiti Thorbjarnarson (1988)
Blattidae (cockroach)* Haiti Thorbjarnarson (1988)
Odonata (dragonfly) Belize Plat et al. (2013)
Macrodiplax sp. (dragonfly) Haiti Thorbjarnarson (1988)
Brachymesia sp. (tropical pennants) Haiti Thorbjarnarson (1988)
Hemiptera (true bugs) Mexico Villegas and Schmitter-Soto (2008)
Belostomatidae (giant water bug) Haiti Thorbjarnarson (1988)
Scarabaeidae (scarab beetle) Belize Plat et al. (2013)
Heterosternus sp. (beetle) Mexico Villegas and Schmitter-Soto (2008)
Troposternus sp. (hydrophilid beetle) Haiti Thorbjarnarson (1988)
Tomarus sp. (scarab beetle)* Haiti Thorbjarnarson (1988)
Cyclocephala sp. (scarab beetle) Haiti Thorbjarnarson (1988)
Phyllophaga sp. (scarab beetle) Haiti Thorbjarnarson (1988)
Conoderus sp. (click beetle)* Haiti Thorbjarnarson (1988)

Texas Tech University, Sergio A. Balaguera Reina, May 2018
128
Appendix 6-2. Continued.
Category Taxon Country Authors
Pyrophorus sp. (fire beetle) Haiti Thorbjarnarson (1988)
Lagocheirus sp. (longhorn beetle) Haiti Thorbjarnarson (1988)
Chrysobothris sp. (beetle) Haiti Thorbjarnarson (1988)
Selenophorus sp. (beetle) Haiti Thorbjarnarson (1988)
Calosoma sp. (ground beetle) Haiti Thorbjarnarson (1988)
Cicindela sp. (tiger beetle) Haiti Thorbjarnarson (1988)
Acalles sp. (beetle) Haiti Thorbjarnarson (1988)
Artipus sp. (weevil) Haiti Thorbjarnarson (1988)
Aracnids Araneae (spiders) Panama Current study
Pisauridae (nursery web spider) Haiti Thorbjarnarson (1988)
Tetragnatha sp. (strerch spiders) Haiti Thorbjarnarson (1988)
Fish Lutjanidae (snapper) Belize Plat et al. (2013)
Belonidae (needle-fish) Belize Plat et al. (2013)
Eucinostomus sp. (mojarra) Mexico Villegas and Schmitter-Soto (2008)
Gambusia spp. (mosquito fish) Belize Plat et al. (2013)
Limia sp. (limia fish) Haiti Thorbjarnarson (1988)
Reptiles Iguanidae (iguanas) Panama Current study
Birds Neornithes Panama Current study
Phalacrocorax spp. (cormorant) Belize Plat et al. (2013)
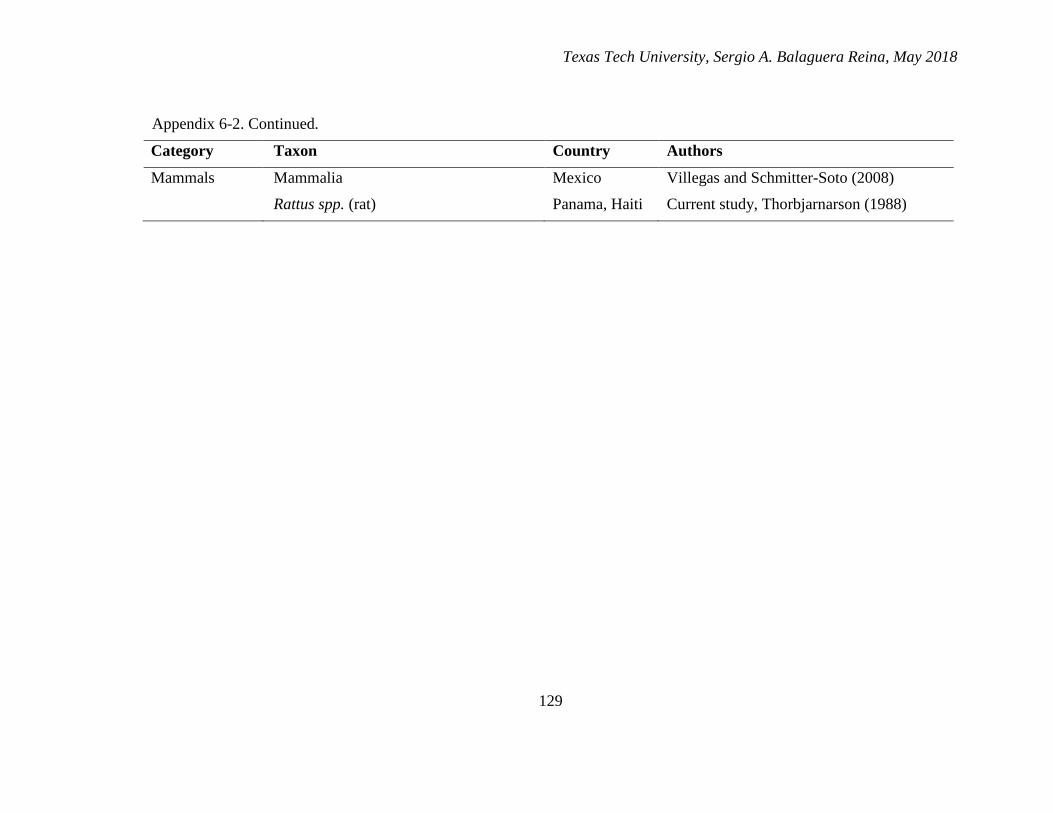
Texas Tech University, Sergio A. Balaguera Reina, May 2018
129
Appendix 6-2. Continued.
Category Taxon Country Authors
Mammals Mammalia Mexico Villegas and Schmitter-Soto (2008)
Rattus spp. (rat) Panama, Haiti Current study, Thorbjarnarson (1988)
Texas Tech University, Sergio A. Balaguera Reina, May 2018
130
CHAPTER VII
CONCLUSIONS
Conservation of large predators has long been a challenge for biologists due to
the limited information we have about their ecology, generally low numbers in the
wild, large home ranges, and the continuous expansion of human settlements. The
American crocodile (Crocodylus acutus) is a typical apex predator, which has suffered
from all of these problems. Humans have had a major impact on the recovery of this
species throughout its range, even though most of the countries it inhabits have banned
hunting. The last decade has made it clear that to implement sound conservation and
management programs, we must increase our understanding of crocodile ecology,
covering all possible aspects. However, only few countries where American crocodiles
are found have had integrative studies that been published. Herein, I have presented
one of the few highly integrative studies performed to date on American crocodiles in
which I analyze ecological attributes of the species in a comprehensive way, linking
these features to better understand the life history of the species and its variability
throughout its range.
American crocodile reproductive ecology on Coiba Island is more similar to
the insular Caribbean populations than to mainland populations, with a reduction in
the number of eggs and size of the hatchlings, which might result from a smaller
minimum reproductive size on islands, likely due to genetic, environmental, or
behavioral factors. Apparently, parental care is reduced on Coiba Island, possibly due
to human-related disturbances, which along with the conservation status of nursery
areas on this island, strongly affects hatchling survival. Attributes such as incubation
period, nesting and hatching times, and parental care were similar to those reported on
Caribbean Islands and Central and South American mainland areas, showing a broader
pattern that seems to be strongly affected by seasonal precipitation and hunting
pressure. The hatchlings/juveniles growth rate was highly variable compared with

Texas Tech University, Sergio A. Balaguera Reina, May 2018
131
Caribbean insular areas, which might be influenced also by resource availability and
inter- and intraspecific competition.
American crocodile population size estimates on Coiba island were 217 (163 -
284) individuals based on our new method and ranged between 147 and 257
individuals based on POPAN formulation, grouping the data by sex and age groups.
Even though our equation and POPAN formulation estimated population numbers
were based on completely different sets of data (spotlight survey and mark-recapture,
respectively), they were both well above the minimum population size defined for the
area (~112) and closer to each other in terms of the estimated confidence intervals,
suggesting that our equation can be very useful to estimate population sizes in
crocodylians using indirect methods. On the other hand, Messel’s and King’s
approaches and to a lesser extent Chabreck’s equation were shown to underestimate
crocodylian population numbers, meaning that populations assessed using these
approaches are likely larger than reported. I believe the novel population size method
proposed herein is promising and can bring some clarity about how to estimate this
attribute in a more cost-effective way. However, further studies must be done applying
this method in different habitat/species conditions to fully assess its effectiveness,
robustness, and applicability, and if necessary, adjusting it to specific species/habitat
requirements.
Relative abundance and size class proportions oscillated seasonally on Coiba
Island, in agreement with what has been reported elsewhere. This implies that partial
ecological assessments made throughout the year may underrepresent the structure
present in a defined area. Data collected suggests that coastal habitats in both insular
and mainland areas might not support relative abundances over 4 ind/km, which is a
low value compared with reported inland relative abundances.
Individual identification pattern recognition (IIPR) proved to be a promising
method to identify individual American crocodiles from Coiba Island based on the
number and position of the scutes per transversal scute line (TSL) in the dorsal area.
The coded analysis showed an overall higher variation per TSL than did the binary

Texas Tech University, Sergio A. Balaguera Reina, May 2018
132
analysis, reaching the minimum probability using fewer TSLs. This could be
important when one wants to use this method as an indirect mark–recapture strategy
(e.g., using drones or dorsal pictures of animals), requiring fewer TSLs to visualize
and achieve confident population estimates. IIPR provides a new and less-expensive
method for population assessments, especially when used in combination with UAV to
collect highly relevant population attributes from inaccessible areas. The minimum
probability of repeating a pattern in Coiba Island using IIPR was sufficiently high (one
American Crocodile in 14,326,647 individuals for coded and one in 347,222 for binary
analyses) to allow complete, individual-specific identification of several C. acutus
populations throughout its range. The likelihood of identical scute patterns, however,
as well as the number of TSL needed to identify an individual, might change
depending on the patterns described in different populations. Nevertheless, the
considerable variability present in the dorsal area of American crocodiles
demonstrated by this and previous studies offer solid support to continue using and
testing IIPR as a way to characterize individual C. acutus.
American crocodile spatial ecology revealed that females had a higher average
movement distance (AMD) than males and adults showed a higher AMD than sub-
adults and juveniles. However, males exhibited larger home ranges than females, and
sub-adults had larger home ranges than juveniles, hatchlings, and adults. There was an
obvious relationship between seasonal precipitation and AMD, with increased AMD
during the dry and “low-wet” seasons, and reduced AMD during the “true” wet
season. We found disaggregate distributions according to age groups throughout the 9
habitat types in the study area, where adults and hatchlings inhabited fewer habitat
types than juveniles and sub-adults. These sex- and age-group differences in
movement and habitat choice are likely due to the influences of reproductive biology
and Coiba’s precipitation cycle. Juveniles also showed distinct movement patterns and
home ranges; however, with sexual maturation and development, these behaviors
became more characteristic of adults and sub-adults.
Conspecific proximity analysis revealed a hierarchy system throughout age
classes in the study area, where adults are more related in space with sub-adults, sub-

Texas Tech University, Sergio A. Balaguera Reina, May 2018
133
adults with juveniles, and juveniles with hatchlings, respectively. The relationship
between juveniles and hatchlings may be established after the parental care period,
when growing hatchlings start to explore new areas and reduce their relative proximity
to adults as they increase their proximity to other juveniles. American crocodiles in
Coiba Island had lower AMD’s compared with what has been reported in mainland
areas, likely due to more limited resource availability in the insular setting.
American crocodile trophic ecology data confirm that C. acutus can be defined
as generalist feeding on a broad spectrum of prey that are found in all types of habitats
(i.e., terrestrial, aquatic, and aerial) and consumption classifications (i.e., primary,
secondary, tertiary, and quaternary consumers). However, my data strongly suggest
that C. acutus inhabiting coastal areas rely more on crustaceans rather than
vertebrates, as the major source of energy. This could be explained by the high
diversity and abundance of these prey species in marine and coastal ecosystems and
their relatively high nutritional value. Thus, crustaceans may guarantee the highest
energy intake for coastal American crocodiles per unit time with less effort. Smaller
animals on Coiba Island were more generalist feeders, and adults more specialists
based on the dietary diversity and dietary specialization analyses, which might be
explained by small animals feeding on many resources until net energetic value trade-
offs take place (i.e., optimal foraging theory, see Stephens and Krebs 1986).
Overlapping group analysis showed a reduction in the consumption at invertebrates
(crustaceans and insects) as individuals aged. However, these items were the still most
common food items throughout all American crocodiles sampled. Dietary niche
overlap analysis showed clear ontogenetic dietary partitioning among juveniles,
subadults, and adults. However, the general pattern postulated for crocodylians, where
small individuals feed upon invertebrates and adults feed on larger prey (primarily
vertebrates), was not supported by the data collected from Coiba Island. It may
indicate that American crocodiles dwelling in coastal areas rely more on easy-to-
catch/highly abundant prey such as crustaceans rather than larger prey items.
Overall, American crocodile life history including reproductive, population,
spatial, and trophic ecological features varies considerably from insular to mainland

Texas Tech University, Sergio A. Balaguera Reina, May 2018
134
populations and from coastal to in-land populations; this is presumably due to a more
limited amount of resources on insular/coastal areas, showing how “flexible” C.
acutus is in terms of main habitat requirements. Population numbers estimated from
Coiba Island as well as the demographic structure described suggest a well-established
population (more than 200 no-hatchlings animals), similar to what has been described
in other studies from across its range (Kushlan and Mazzotti 1989, Garcia-Grajales et
al. 2007, Espinosa et al. 2012). However, my data suggest that realized niches on
insular populations “shrink” compared to mainland populations seemingly due to a
reduced availability of resources (i.e., environmental) and an inherent increase on
intra- and interspecific competition (i.e., behavioral). Trophic and spatial ecology data
collected in the present study and from other coastal habitats (Platt et al. 2013)
demonstrate how American crocodile intraspecific variation occurs (mainly because
niche partitioning), with low levels of reciprocal overlap by age groups (ontogenetic
dietary partitioning and spatial hierarchization); these have the potential to relax the
intensity of intraspecific competition. Niche breadth analysis also reinforced the idea
of high levels of intraspecific variation in coastal American crocodile populations with
young animals being more generalists and older animals being more specialists. Thus,
it is highly likely that a trade-off among resource availability, intraspecific
competition, niche partitioning (intraspecific variation), and American crocodile life
history plasticity all play crucial roles in structuring of populations and its viability
over time. Off course, interspecific competition must also play an important role, as
well shaping the realized niche of the species. Unfortunately, no data have been
collected regarding this topic in studies of American crocodiles across its range.
The American crocodile is commonly defined as an apex predator, meaning it
is a species at the top of the trophic level in the community or ecosystem to which it
belongs. However, trophic ecology data from this and other studies (Medem 1981,
Platt et al. 2013) suggest that American crocodiles inhabiting coastal areas could differ
from this definition due to its reliance on primary, secondary, and tertiary consumers
rather than quaternary consumers or above. Even though C. acutus has been reported
to feed upon species of carnivores across different groups (i.e., fish, amphibians,

Texas Tech University, Sergio A. Balaguera Reina, May 2018
135
reptiles, birds, and mammals) across its range, data from coastal habitats strongly
suggest that this species relies mainly upon abundant/easy-to-catch prey such as
crustaceans rather than larger prey items. This has significant implications for the way
we view the species as a functional entity of the community, and suggest that its
interactions and role in the system is more complex than previously thought. This
trophic plasticity also provides American crocodiles excellent adaptability to changing
trophic conditions, which could be one of the reasons this widespread species has
colonized a wide variety of habitats.
Future research focused on the roles of American crocodiles as functional
entities of communities and ecosystems will provide answers to many of the questions
that have been raised by the present research. Coiba Island provides almost ideal
conditions to research these topics, which can then be used as a model to be replicated
across other habitats and latitudes. Answering questions about ontogenetic trophic
level variation, carrying capacity of the systems regarding age groups, energy fluxes,
and predator-prey population regulation, will provide insightful information critical
for understanding American crocodile populations as functional and structural
components of the ecosystems in which they are found.

Texas Tech University, Sergio A. Balaguera Reina, May 2018
136
BIBLIOGRAPHY
Abbot, W. J. 1914. Panama and the Canal. Dodd, Mead and Company. New York,
United States.
Alonso-Tabet, M., R. Ramos, R. Rodríguez-Soberón, J. B. Throbjarnarson, J. Belliure,
and V. Berovides. 2014. Los Crocodylia de Cuba. San Vicente de Raspeig:
Publicaciones Universidad de Alicante. Alicante, Spain.
Alroy, J. 2015. Current extinction rates of reptiles and amphibians. PNAS
112(42):13003–13008.
Álvarez del Toro M. 1974. Los Crocodylia de México. México, Instituto Mexicano de
Recursos Naturales Renovables, Mexico City.
Anonymous. 1872. The alligator at home. An aborigine in Central America. Chicago
Tribune, 20 February, p. 5. ProQuest Historical Newspapers Chicago Tribune
(1849–1986), Chicago, Illinois, United States.
Anonymous. 1894. The trade in alligators a novel business being built up in
Nicaragua. The Daily Picayune, 5 January, 346: p. 6. New Orleans, Louisiana,
United States.
Anonymous. 1907. A congressional alligator hunt. The Washington Post, 31 March, p
13. Washington, D.C., United States.
Anonymous. 1909. Secretary Dickinson wins alligator hunt. The Atlanta Constitution,
26 May, p. 9. Atlanta Georgia, United States.
Anonymous. 1998. Advierten sobre el peligro de los cocodrilos. La Prensa, date
missing, p. 13. Panamá, Panama.
Antelo, R., J. Ayarzagüena, and J. Castroviejo. 2010. Reproductive ecology of
Orinoco crocodiles (Crocodylus intermedius) in a newly established population
at El Frío Biological Station, Venezuela. Herpetological Journal 20:51–58.
Arteaga, A., and C. Sánchez. 1996. Conservation and management of Crocodylus
acutus in the low Basin of the Yaracuy river, Venezuela. Pp.153–161 in:

Texas Tech University, Sergio A. Balaguera Reina, May 2018
137
Crocodiles. Proceedings of 13th Working Meeting of the Crocodile Specialist
Group. Gland: IUCN-The World Conservation Union.
Arteaga, A. 1997. Actualización de la situación poblacional de Crocodylus acutus y
Caiman crocodilus ssp. En las costas de Venezuela. Pp. 6–16 in: Memorias de
la 4ta Reunión Regional del Grupo de Especialistas en Cocodrilos de América
Latina y el Caribe. Villahermosa: Centro Regional de Innovación Agro-
industrial, S.C.
Balaguera-Reina, S. A., and J. F. Gonzalez-Maya. 2008. Population structure, density,
and habitat of Crocodylus acutus (Cuvier 1807) in the Via Parque Isla de
Salamanca, Magdalena Department, Colombia. Herpetotropicos 4(2):59–63.
Balaguera-Reina, S. A., and J. F. Gonzalez-Maya. 2010. Percepciones, conocimiento y
relaciones entre los Crocodylia y dos poblaciones humanas de la Via Parque
Isla de Salamanca (Caribe colombiano). Latin American Journal of
Conservation 1:53–63.
Balaguera-Reina S. A., M. Venegas-Anaya, and L. Densmore III. 2015a. The biology
and conservation status of the American Crocodile in Colombia. Journal of
Herpetology 49:200–206.
Balaguera-Reina, S. A., M. Venegas-Anaya, O. I. Sanjur, J. Lessios, and L. D.
Densmore III. 2015b. Reproductive ecology and hatchlings’ growth rates of
American Crocodile (Crocodylus acutus) on Coiba Island, Panama. South
American Journal of Herpetology 10:10–22.
Balaguera-Reina, S. A., M. Venegas-Anaya, and L. Densmore III. 2015c. 2015b.
Crocodylus acutus in Panama: a status report. Mesoamerican Herpetology
2:566–571.
Balaguera-Reina S. A., M. Venegas-Anaya, A. Sánchez, I. Arbelaez, H. A. Lessios,
and L. D. Densmore, III. 2016. Spatial ecology of the American crocodile in a
tropical Pacific island in Central America. PLoS One 11(6):e0157152.
doi:10.1371/journal.pone.0157152.

Texas Tech University, Sergio A. Balaguera Reina, May 2018
138
Bashyal, A., M. Venegas-Anaya, G. Perry, and L. D. Densmore III. 2010. Population
genetics of the American Crocodile in Coiba Marine National Park, Panama.
Proceedings of the 20th Working Meeting of the Crocodile Specialist Group of
the Species Survival Commission of IUCN, Manaus, Brazil.
Bashyal, A. 2012. Population Genetics of the American Crocodile in Coiba National
Park, Panama. Unpublished M.S. thesis, Department of Biological Science,
Texas Tech University, Lubbock, Texas, United States.
Bashyal, A., B. Gross, M. Venegas-Anaya, and L. D. Densmore III. 2014. Assessment
of microsatellites in estimating inter- and intraspecific variation among
Neotropical Crocodylus species. Genetic and Molecular Research 13:5,492–
5,502.
Bayliss, P., G. J. W. Webb, P. J. W. Whitehead, and A. M. A. Smith. 1986. Estimating
the abundance of saltwater crocodiles, Crocodylus porosus Schneider in tidal
wetlands of the Northern Territory: a mark-recapture experiment to correct
spotlight counts to absolute numbers, and the calibration of helicopter and
spotlight counts. Australian wildlife Research 13:309–320.
Beauvois A. M. F. J. P. 1812. Essai d'une nouvelle agrostographie, ou, Nouveaux
genres des graminées :avec figures représentant les caractères de tous les
genres. Chez l'auteur, Paris. doi:10.5962/bhl. title.474
Bock, B. C., and A. S. Rand. 1989. Factors influencing nesting synchrony and
hatching success at a Green Iguana nesting aggregation in Panama. Copeia
1989:978–986.
Bonke, R., F. Ihlow, W. Böhme, and D. Rödder. 2014. Movement patterns of
Tomistoma schlegelii in the Sekonyer Kanan River (Tanjung Puting National
Park, Central Kalimantan, Indonesia): preliminary range size estimates.
Salamandra 50(1):40–52.
Brandon, J. 2006. Tamaño poblacional del Crocodylus acutus (Cuvier, 1807)
(REPTILIA: CROCODYLIA) y su variación interanual en la laguna La

Texas Tech University, Sergio A. Balaguera Reina, May 2018
139
Palmite, Jumiltepec, Oaxaca, durante el periodo 2004-2005. Unpublished
Thesis. Universidad del Mar. Mexico.
Brazaitis, P. 1973. The identification of living crocodilians. Zoologica 58:58–102.
Breder, C. M. 1946. Amphibians and reptiles of the Rio Chucunague drainage, Darien,
Panama, with notes on their life histories and habits. Bulletin of the American
Museum of Natural History 86:379–435.
Brien, M. L., M. A. Read, H. I. McCallum, and G. C. Grigg. 2008. Home range and
movements of radio-tracked estuarine crocodiles (Crocodylus porosus) within
a non-tidal waterhole. Wildlife Research 35:140–149.
Britton A. 2012. Crocodilian Biology Database. Crocodilians, natural history and
conservation. [cited May 5th, 2015]. Available:
http://crocodilian.com/cnhc/cbd-faq-q4.htm.
Burnham, K. P., D. R. Anderson, G. C. White, C. Brownie, and K. P. Pollock. 1987.
Design and analysis of methods for fish survival experiments based on release–
recapture. American Fisheries Society Monograph 5:1–437.
Burnham, K. P., and D. R. Anderson. 2002. Model selection and multimodel
inference: a practical information-theoretic approach (2nd edition). Springer-
Verlag, New York.
Campos, Z., G. Mourão, M. E. Coutinho, and W. Magnusson. 2004. Movimento e
Área de Uso do Jacaré-do-Pantanal. Boletim de Pesquisa e Desenvolvimento
57:1–34.
Campos, Z., M. Coutinho, G. Mourão, P. Bayliss, and W. E. Magnusson. 2006. Long
distance movements by Caiman crocodilus yacare: implications for
management of the species in the Brazilian Pantanal. Herpetological Journal
16:123–132.
Campos Z., Magnusson W.E., Marques V. 2013. Growth rates of Paleosuchus
palpebrosus at the Southern limit of its range. Herpetologica 69:405–410.

Texas Tech University, Sergio A. Balaguera Reina, May 2018
140
Canty A., and B. Ripley. 2016. boot: Bootstrap R (S-Plus) Functions. R package
version 1.3–18.
Carvajal, R. I., M. Saavedra, and J. J. Alava. 2005. Ecología poblacional, distribución
y estudio de hábitat de Crocodylus acutus (Cuvier, 1807) en la ‘‘Reserva de
producción de fauna manglares El Salado’’ del estuario del Golfo de
Guayaquil, Ecuador. Revista de Biología Marina y Oceanografía 40:141–150.
Casas-Andreu G. 1992. Anfibios y reptiles de las islas Marías y otras islas adyacentes
de la costa de Nayarit, México. Aspectos sobre su biogeografía y conservación.
Anales del Instituto de Biología Serie Zoología Universidad Nacional
Autónoma de México 63:95–112.
Casas-Andreu, G., and G. Barros-Quiroz. 2003. Hábitos alimenticios de Crocodylus
acutus (Reptilia: Crocodylidae) determinados por el análisis de sus excretas en
la costa de Jalisco, México. Anales del Instituto de Biología, Universidad
Nacional Autónoma de México, Serie Zoología 74:35–42.
Ceballos, G., P. R. Rhrlich, A. D. Barnosky, A. García, R. Pringle, and T. M. Palmer.
2015. Accelerated modern human–induced species losses: Entering the sixth
mass extinction. Science Advances 1(5): e1400253, pmid:26601195
Chabreck, R. H. 1963. Methods of capturing, marking, and sexing alligators.
Proceedings of the Annual Conference of the Southeast Game and Fish
Commission 17:47–50.
Chabreck, R. H. 1966. Methods of determining the size and composition of alligator
populations in Louisiana. Proceedings of the 20th annual conference,
Southeastern Association of Game and Fish Commissioners. 20:105–112.
Charruau P., J. R. Cedeño-Vasquez, and S. Calme. 2005. Status and Conservation of
the American Crocodile (Crocodylus acutus) in Banco Chinchorro Biosphere
Reserve, Quintana Roo, Mexico. Herpetological Review 36(4):390–395.
Charruau, P., J. B. Thorbjarnarson, and Y. Hénaut. 2010. Tropical cyclones and
reproductive ecology of Crocodylus acutus Cuvier, 1807 (Reptilia: Crocodilia:

Texas Tech University, Sergio A. Balaguera Reina, May 2018
141
Crocodylidae) on a Caribbean atoll in Mexico. Journal of Natural History
44:741–761.
CITES (Convention on International Trade in Endangered Species of Wild Fauna and
Flora). 2012. Apéndices I, II and III. Maison internationale de
l’environnement. Chemin des Anémones. Geneva, Switzerland.
Cochran, D. M. 1946. Notes on the herpetology of the Pearl Islands, Panama.
Smithsonian Miscellaneous Collection 104:1–8.
Cooch, E., and G. C. White. 2007. Program MARK: A gentle introduction (5th
edition). Available online at: http://www.phidot.org/software/mark/docs/book/.
Costa, A., S. Salvidio, M. Posillico, G. Matteucci, B. De Cinti, and A. Romano. 2015.
Generalisation within specialization: inter-individual diet variation in the only
specialized salamander in the world. Scientific Reports. DOI:
10.1038/srep13260.
CMNUDS (Cumbre Mundial de las Naciones Unidas para el Desarrollo Sostenible).
2002. Corredor marino de conservación y desarrollo sostenible (Galápagos,
Gorgona, Malpelo, Coiba, isla del Coco). Johannesburg.
CSG (Crocodile Specialist Group). 1996. Crocodylus intermedius. The IUCN Red List
of Threatened Species [cited 28 March 2016]. Available:
http://dx.doi.org/10.2305/IUCN.UK.1996.RLTS.T5661A11503444.en.
Cupul-Magaña, F. G., A. Rubio-Delgado, F. Molano-Rendón, and A. Reyes-Juárez.
2008. Contenido estomacal de neonatos de Crocodylus acutus (Cuvier, 1807)
en Boca Negra, Jalisco. Boletín de la Sociedad Herpetológica Mexicana
16(2):41–45.
Cupul-Magaña, F. G., F. Mc Cann, and A. H. Escobedo-Galvan. 2015. Observación
del consumo de presas en el cocodrilo americano (Crocodylus acutus Cuvier,
1807): registro fotográfico. Quehacer Científico en Chiapas 10(2):11–15.

Texas Tech University, Sergio A. Balaguera Reina, May 2018
142
Cuvier, G. 1807. Sur les différentes espèces de crocodiles vivans et sur leurs
caractères distinctifs. Annales Muséum National D’Histoire Naturelle Paris
10:8–66.
Da Silveira, R., Z. Campos, J. B. Thorbjarnarson, and W. E. Magnusson. 2013.
Growth rates of black caiman (Melanosuchus niger) and spectacled caiman
(Caiman crocodilus) from two different Amazonian flooded habitats.
Amphibia-Reptilia 34:437–449.
Deppe W. 1830. Lichtenst[ein]. Preis-Verz. Saugeth. Vogel, etc. Mexico City.
Ding, Y., X. Wang, J. B. Thorbjarnarson, J. Wu, Z. Wang, W. Wu, C. Gu, and J. Nie.
2004. Movement patterns of released captive-reared Chinese alligators
(Alligator sinensis). Pp. 109 in: Crocodiles Proceedings of the 17th Working
Meeting of the Crocodile Specialist Group, IUCN.
Di Rienzo, J. A., F. Casanoves, M. G. Balzarini, L. Gonzalez, M. Tablada, and C. W.
Robledo. 2014. InfoStat. InfoStat Group, Facultad de Ciencias Agropecuarias,
Universidad Nacional de Córdoba, Córdoba.
Dugan, B. A., A. S. Rand, G. M. Burghardt, and B. C. Bock. 1981. Interactions
between nesting crocodiles and iguanas. Journal of Herpetology 15:409–414.
Espinal M., and A. H. Escobedo-Galván. 2010. Crocodylus acutus (American
crocodile) nesting ecology. Herpetological Review 41:210–211.
Espinal, M., and A. H. Escobedo-Galván. 2011. Population status of the American
crocodile (Crocodylus acutus) in el Cajon reservoir, Honduras. The
southwestern naturalist. 56(2):212–215.
Espinosa, M. I., A. Bertin, J. Gómez, F. Mejìa, M. Guerra, L. Baez, N. Gouin, and E.
Patiño. 2012. A three-year mark-recapture study in a remnant population of
Crocodylus acutus Cuvier in Portete Bay (Guajira, Colombia). Gayana
76(1):52–58.
ESRI (Environmental Systems Research Institute). 2012. Arc GIS Version 10.1. ESRI.
Redlands.

Texas Tech University, Sergio A. Balaguera Reina, May 2018
143
ESRI (Environmental Systems Research Institute). 2014. Arc GIS Version 10.2.2.
ESRI. Redlands.
ESRI (Environmental Systems Research Institute). 2016. Arc GIS Version 10.4.4.
ESRI. Redlands. CA.
ETESA. 2015. Hidrometeorología. Empresa de Transmisión de Energia S.A. Panamá.
[cited May 5, 2015]. Available:
http://www.hidromet.com.pa/clima_historicos.php.
Ferguson M. W. J. 1985. Reproductive biology and embryology of the crocodilians.
Pp. 330–491 in: Biology of the Reptilia (A. C. Gans, F. Billet, and P. F. A.
Maderson Eds.). John Wiley and Sons, New York.
Fergusson, R. A. 1992. A radiotelemetry and mark recapture experiment to assess the
survival of juvenile crocodiles released from farms into the wild in Zimbabwe.
Pp 98–106 in: Crocodiles Proceedings of the 11th Working meeting of the
Crocodile Specialist Group of the Species Survival Commission of the IUCN-
The World Conservation Union.
Fitzgerald, L. A. 1989. An evaluation of stomach-flushing techniques for crocodilians.
Journal of Herpetology 23:170.
Forcada, J., and A. Aguilar. 2003. Use of photographic identification in capture–
recapture studies of Mediterranean monk seals. Marine Mammal Science
Journal 16:767–793.
Fryxell, P. A. 2001. Talipariti (Malvaceae), a segregate from Hibiscus. Contributions
from the University of Michigan Herbarium 23:225–270.
Fujisaki, I., K. M. Hart, F. J. Mazzotti, M. S. Cherkiss, A. R. Sartain, B. M. Jeffery, J.
S. Beauchamp, and M. Denton. 2014. Home range and movements of
American alligators (Alligator mississippiensis) in an estuary habitat. Animal
Biotelemetry 2:1–10.

Texas Tech University, Sergio A. Balaguera Reina, May 2018
144
Gaby, R., M. P. McMahon, F. J. Mazzotti, W. N. Gilles, and J. R. Wilcox. 1985.
Ecology of a population of Crocodylus acutus at a power plant site in Florida.
Journal of Herpetology 19(2):184–198.
Gaertner, C. F. 1807. Supplementum carpologiae: seu continuati operis Josephi
Gaertner de Fructibus et seminibus plantarum. Sumtibus Carol. Frid. Enoch
Richter Bibliopolae Lipsiensis, Leipzig.
Games, I. 1990. The feeding ecology of two Nile crocodile populations in the Zambezi
Valley. Ph.D. Dissertation. University of Zimbabwe, Harare, Zimbabwe.
Games, I, and J. Moreau. 1997. The feeding ecology of two Nile crocodile populations
in the Zambezi Valley. Pp. 183–190 in: Advances in the ecology of lake
Kariba (J. Moreau Ed.). University of Zimbabwe Publications. Harare,
Zimbabwe.
Garcia-Grajales, J., G. Aguirre-León, and A. Contreras-Hernandez. 2007. Tamaño y
estructura poblacional de Crocodylus acutus (Cuvier, 1807) (reptilia:
Crocodylidae) en el estero de La Ventanilla, Oaxaca. Mexico. Acta Zoológica
Mexicana 23(1):53–71.
Garcia-Grajales, J., A. Buenrostro-Silva, and P. R. Tellez-Rodriguez. 2009. Variación
de patrón de escutelación nucal del cocodrilo americano (Crocodylus acutus
Cuvier 1807) en La Ventanilla, Oaxaca, México. Acta Zoológica Mexicana
25:375–382.
Garcia-Jimenez, L. 2010. Population Structure of the American Crocodile (Crocodylus
acutus) in Coiba Island, Panama, Inferred from Morphometric Measurements
and Microsatellite Markers. Unpublished M.S. thesis, Department of
Biological Science, Texas Tech University, Lubbock, Texas, United States.
Garcia-Jimenez, L., M. Venegas-Anaya, and L. D. Densmore III. 2010. Genetic
characterization of the American Crocodile on Coiba Island, Panama.
Proceedings of the 20th Working Meeting of the Crocodile Specialist Group of
the Species Survival Commission of IUCN, Manaus, Brazil.

Texas Tech University, Sergio A. Balaguera Reina, May 2018
145
Garrick, L. D. 1982. Variation in postoccipital and nuchal scale patterns of American
crocodiles (Crocodylus acutus). American Zoologist 22: 906.
Getz, W. M., and C. C. Wilmers. 2004. A local nearest-neighbor convex-hull
construction of home ranges and utilization distributions. Ecography 27:489–
505.
Gleason, J. R. 1988. Algorithms for balanced bootstrap simulations. American
Statistician 42:263–266.
Goodwin, T., and W. R. Marion. 1979. Seasonal activity ranges and habitat
preferences of adult alligators in a north-central Florida lake. Journal of
Herpetology 13(2):157–64.
Gompertz, B. 1825. On the nature of the function expressive of the law of human
mortality, and on a new mode of determining the value of life contingencies.
Philosophical Transactions of the Royal Society of London 115:513–585.
Green, T., D. Slone, E. Swain, M. Cherkiss, M. Lohmann, F. Mazzotti, and K. G.
Rice. 2014. Evaluating Effects of Everglades Restoration on American
Crocodile Populations in South Florida Using a Spatially-Explicit, Stage-
Based Population Model. Wetlands. 34(Suppl 1):213–224.
Grier, T. G. 1908. On the Canal Zone. Panama. The Wagner & Hanson Co., Chicago,
Illinois, United States.
Grigg, G., and D. Kirshner. 2015. Biology and Evolution of Crocodylians. CSIRO
Publishing, Australia.
Gross, B., M. Venegas-Anaya, M. Solano, and L. Densmore III. 2014. Home range
and dispersion of the American crocodile (Crocodylus acutus) pre juveniles in
Playa Blanca, Coiba National Park: Telemetry. Technical report.
IUCN/SSC/Crocodile Specialist Group. Panama City.
Hagan, J. M. I. 1982. Movement habits of the American alligator (Alligator
mississippiensis) in North Carolina. Unpublished MS Thesis. North Carolina
State University.

Texas Tech University, Sergio A. Balaguera Reina, May 2018
146
Hammond, P. S. 1990. Capturing whales on film—estimating cetacean population
parameters from individual recognition data. Mammal Review 20:17–22.
Hernández-Hurtado, H, J. Romero-Villaruel, P. Hernandez-Hurtado. 2011. Ecología
poblacional de Crocodylus acutus en los sistemas estuarinos de San Blas,
Nayarit, México. Revista Mexicana de Biodiversidad 88:887–95.
Hinkley, D. V. 1988. Bootstrap methods (with Discussion). Journal of the Royal
Statistical Society, B, 50:312–337, 355–370.
Houlihan, P. R. 2013. New records of Crocodylus acutus (Cuvier, 1807) on Isla del
Rey and a review of the species’ distribution in Las Perlas Archipelago,
Panama. Crocodile Specialist Group Newsletter 32:10–13.
Hutton J. M. 1982. Home range, territoriality and dispersal in the Nile crocodile at
Ngezi, Zimbabwe. Pp. 100 In: Crocodiles. Proceedings of the 6th IUCN
Crocodile Specialist Group Meeting, Zimbabwe.
Hutton, J. M. 1989. Movements, home range, dispersal, and the separation of size
classes in Nile crocodiles. American Zoologist 29:1033–1049.
Hutton, J. M., and M. E. J. Woolhouse. 1989. Mark-recapture to assess factors
affecting the proportion of a Nile crocodile population seen during spotlight
counts at Ngezi, Zimbabwe, and the use of spotlight counts to monitor
crocodile abundance. Journal of Applied Ecology 26:381–395.
Ibáñez A. 2006. Golfo de Chiriquí, Ecosistemas y Conservación de la Zona Insular y
Costera. The Nature Conservacy. Panama City.
Ibáñez A. 2011. Guía Botánica del Parque Nacional Coiba. Smithsonian Tropical
Research Institute. Panama City.
Jackson, J. F., H. W. Campbell, and K. E. Campbell. 1974. The feeding habits of
crocodilians: validity of the evidence contents. Journal of Herpetology 8:378–
381.

Texas Tech University, Sergio A. Balaguera Reina, May 2018
147
Jennings, M. L., D. N. David, and K. M. Portier. 1991. Effect of marking techniques
on growth and survivorship of hatchling alligators. Wildlife Society Bulletin
19:204–207.
Joanen, T., and L. McNease. 1970. A telemetric study of nesting female alligators on
Rockefeller Refuge, Louisiana. Proceedings of the annual conference,
Southeastern Association of Game and Fish Commissioners 24:175–93.
Johnson, J. D., V. Mata Silva, and L. D. Wilson. 2015. A conservation reassessment of
the Central American herpetofauna based on the EVS measure. Amphibian and
Reptile Conservation 9(2)[General Section]:1–94 (e100).
Kay, W. 2004. A new method for attaching electronic devices to crocodilians.
Herpetological Review 35(4):354–357.
Kernohan, B. J., R. A. Gitzen, and J. J. Millspaugh. 2001. Analysis of Animal Space
Use and Movements. Pp. 125–166 in: Radio Tracking and Animal Populations
(J. J. Millspaugh, and J. M. Marzlu Eds.). Academic Press.
King, F. W., M. Espinal, and C. Cerrato. 1990. Distribution and status of the
crocodilians of Honduras. Pp. 313–354 in: Crocodiles. Proceedings of 10th
Working Meeting of the IUCN/SSC Crocodile Specialist Group. Gland:
IUCN- The World Conservation Union.
King, F. W., J. P. Ross, and L. D. Gutierrez. 1994. Survey of the status of the
crocodilians of Nicaragua. Pp. 121–161 in Crocodiles. Proceedings of the 12th
Working Meeting of Crocodile IUCN/SSC Crocodile Specialist Group. Gland,
Gland: IUCN- The World Conservation Union.
Klein, E. H. 1977. A status evaluation of the crocodilians of Eastern Honduras.
Unpub.Ms.
Krebs, C. J. 1989. Ecological Methodology. Harper Collins, New York, NY, United
States.

Texas Tech University, Sergio A. Balaguera Reina, May 2018
148
Kushlan, J. A. 1982. The status of crocodilians in south Florida. Pp. 99–107 in:
Proceedings of the 5th Working Meeting of the Crocodile Specialist Group (D.
Dietz, and F. W. King Eds.). IUCN–The World Conservation Union, Gland.
Kushlan, J. A., and F. J. Mazzotti. 1989. Population biology of the American
crocodile. Journal of Herpetology 23:7–21.
Lang, W. 1987. Crocodilian behavior: implications for management. Pp. 273–294 in:
Wildlife Management: Crocodiles and Alligators (G. J. W. Webb, S. C.
Manolis, and P. J. Whitehead Eds.). Surrey Beatty and Sons, Ltd. Sydney,
Australia.
Larriera, A., C. Piña, and T. Dacey. 2008. Conservación, Manejo y Uso sustentable de
los Cocodrilos en Cuba: Reporte y Recomendaciones del UICN-CSE Grupo de
Especialistas en Cocodrilos. Crocodile Specialist Group, Darwin, Australia.
Leslie, A. J., and L. E. Taplin. 2000. Recent developments in osmoregulation of
crocodilians. Pp. 265–279 in: Crocodilians Biology and Evolution (G. C.
Grigg, and C. E. Franklin Eds.). Surrey Beatty and Sons Ltd., Sydney,
Australia.
Lettink, M., and D. P. Armstrong. 2003. An introduction to using mark-recapture
analysis for monitoring threatened species. Pp. 5–32 in: Using mark-recapture
analysis for monitoring threatened species: introduction and case study
(Department of Conservation Ed). New Zeeland: Department of Conservation
Technical Series 28.
Linchant, J., J. Lisein, J. Semeki, P. Lejeune, and C. Vermeulen. 2015. Are unmanned
aircraft systems (UASs) the future of wildlife monitoring? A review of
accomplishments and challenges. Mammal Review 45: 239–252.
Lincoln, F. C. 1930. Calculating waterfowl abundance on the basis of banding returns.
USDA Circ. 118. USA.
Linnaeus, C. 1753. Species plantarum, exhibentes plantas rite cognitas ad genera
relatas cum differentiis specificis, nominibus trivialibus, synonymis selectis,

Texas Tech University, Sergio A. Balaguera Reina, May 2018
149
locis natalibus, secundum systema sexuale digestas. Holmiæ, Stockholm.
doi:10.5962/bhl.title.669
Linnaeus, C. 1759. Systema naturæ per regna tria naturæ, secundum classes, ordines,
genera, species, cum characteribus, differentiis, synonymis, locis. Tomus II.
Editio decima, reformata. Holmiæ, Stockholm.
Magnusson, W. E., E. V. Da Silva, and A. P. Lima. 1987. Diet of Amazonian
crocodiles. Journal of Herpetology 21:85–95.
Magnusson W. E., and A. P. Lima. 1991. The ecology of a cryptic predator,
Paleosuchus trigonatus, in a tropical rainforest. Journal of Herpetology.
25:41–48.
Martin, A. R., and V. M. F. Da Silva. 1998. Tracking aquatic vertebrates in dense
tropical forest using VHF telemetry. Marine Technology Society Journal
32:82–88.
Maté J. L., D. Tovar, E. Arcia, and Y. Hidalgo. 2009. Plan de Manejo del Parque
Nacional Coiba. ANAM. Smithsonian Tropical Research Institute. Panama
City.
Mauger, L. A., E. Velez, M. S. Cherkiss, M. L. Brien, M. Boston, F. J. Mazzotti, and
J. R. Spotila. 2012. Population assessment of the American crocodile,
Crocodylus acutus (Crocodilia: Crocodylidae) on the Pacific coast of Costa
Rica. Revista de Biologia Tropical 60(4):1889–1901.
Mazzotti, F. 1983. The ecology of Crocodylus acutus in Florida, Ph.D. Dissertation,
Penn State University, United States.
Mazzotti, F.J. 1999. The American crocodile in Florida Bay. Estuaries 22:552–561.
doi:10.2307/1353217
Mazzotti, F. J., L. A. Brandt, P. Moler, and M. S. Cherkiss. 2007. American Crocodile
(Crocodylus acutus) in Florida: recommendations for endangered species
recovery and ecosystem restoration. Journal of Herpetology 41:121–131.

Texas Tech University, Sergio A. Balaguera Reina, May 2018
150
Mazzotti, F. J., G. R. Best, L. A. Brandt, M. S. Cherkiss, B. M. Jeffery, and K. G.
Rice. 2009. Alligators and crocodiles as indicators for restoration of
Everglades ecosystems. Ecological Indicators 9(6):S137–S149.
Mech, L. D. 1995. The challenge and opportunity of recovering wolf populations.
Conservation Biology 9:270–278.
Medem, F. 1981. Los Crocodylia de Sur América. Los Crocodylia de Colombia.
Editorial Carrera 7 Ltda. Santa Fe de Bogotá.
Mendieta, C., and A. Duarte. 2009. Ataque por animales acuáticos (tiburón y
cocodrilo): a propósito de dos casos fatales en la provincia de Bocas del Toro
(Panamá). Cuadernos de Medicina Forense 58:309–315.
Messel, H., G. C. Vorlicek, A. G. Wells, and W. J. Green. 1981. Surveys of tidal river
systems in the Northern Territory of Australia and their crocodile populations.
The Blyth-Cadell rivers system study and the status of Crocodylus porosus in
tidal waterways of northern Australia. Sydney: Monogragh No.1.Pergamon
Press.
Mohr, C. O. 1947. Table of equivalent populations of North American small
mammals. The American Midland Naturalist 37:223–249.
Morales-Betancourt, M. A., S. A. Balaguera-Reina, G. Ulloa-Delgado, and C. A.
Lasso. 2015. Crocodylus acutus (Cuvier 1807). Pp. 190–195 in: Libro rojo de
reptiles de Colombia (M. A. Morales-Betancourt, C. A. Lasso, V. P. Páez, and
B. C. Bock Eds.). Instituto de Investigación de Recursos Biológicos Alexander
von Humboldt (IAvH), Universidad de Antioquia. Bogotá, D. C., Colombia.
Morales-Ramírez, A. 2016. Estructura poblacional, abundancia relativa, distribución
espacial y estudio de hábitat de Crocodylus acutus (Cuvier, 1807) en el Parque
Nacional Coiba, Panamá. Undergraduate thesis. Universidad de El Bosque.
Bogotá.
Moran, P. A. P. 1950. Notes on continuous stochastic phenomena. Biometrika.
37(1/2):17–23.

Texas Tech University, Sergio A. Balaguera Reina, May 2018
151
Morea, C. R. 1999. Home range, movement and habitat use of the American alligator
in the Everglades. Unpublished MS Thesis. University of Florida.
Munger, J. C. 1984. Long-Term Yield from Harvester Ant Colonies: Implications for
Horned lizard Foraging Strategy. Ecology 65(4):1077–1086.
Muñoz, M. 1997. Seguimiento por radio-telemetria de juveniles del caimán del
Orinoco (Crocodylus intermedius) en el Parque Nacional Cinaruco-
Capanaparo, " Santos Luzardo" (Edo. Apure). Pp. 161–167 in: Ciencia y
Conservación en el sistema de Parques Nacionales de Venezuela. EcoNatura.
Muñoz, M. D. C., and J. Thorbjarnarson. 2000. Movement of captive-released Orinoco
crocodiles (Crocodylus intermedius) in the Capanaparo River, Venezuela.
Journal of Herpetology 34:397–403.
Murphy, T. M. 1980. The population status of the American alligator at Savannah
River National Environmental Research Park. SRP-NERP-4. University of
Georgia. Savannah River Ecology Laboratory, Aiken, South Carolina.
Neal, S. 2007. An Assessment of the Herpetofaunal Biological Diversity of the
Hydrological Reserve on Isla Del Rey, Las Perlas Archipelago, Panama.
Unpublished M.S. thesis. Department of Geography, University College
London, London, England, United Kingdom.
Neill, W. T. 1971. The Last of the Ruling Reptiles. Columbia University Press, USA.
Niño-Monroy, K. T. and Z. T. Rincon-Bello. 2014. Redes tróficas en ecosistemas
marino–costeros: arrecifes coralinos y manglar, en el costado sur del Parque
Nacional Natural Coiba, Panamá. Undergraduate thesis. Universidad
Tecnológica y Pedagógica de Colombia, Colombia. Tunja.
Obaldia, N., M. Brenes, O. Alvarez, and N. Gale. 1990. Polycystic Ovarian
Mesothelioma in an American Crocodile (Crocodylus acutus). Journal of Zoo
and Wildlife Medicine 21:231–233.
Ogden, J. C. 1978. Status and nesting biology of the American crocodile, Crocodylus
acutus (Reptilia, Crocodilidae) in Florida. Journal of Herpetology 12:183–196.

Texas Tech University, Sergio A. Balaguera Reina, May 2018
152
Oksanen, J., F. G. Blanchet, M. Friendly, R. Kindt, P. Legendre, D. McGlinn, P. R.
Minchin, R. B. O'Hara, G. L. Simpson, P. Solymos, M. H. H. Stevens, E.
Szoecs and H. Wagner. 2017. vegan: Community Ecology Package. R package
version 2.4-4. https://CRAN.R-project.org/package=vegan
Ortiz, R., M. Pamela, T. Plotkin, and D. W. Owens. 1997. Predation upon Olive
Ridley sea turtles (Lepidochelys olivacea) by the American crocodile
(Crocodylus acutus) at Playa Nancite, Costa Rica. Chelonian Conservation and
Biology 2(4):585–587.
Paez, V. P., and B. C. Bock. 1988. Life History Notes. Crocodylus acutus (American
Crocodile). Nest defense. Herpetological Review 19: 83.
Petersen, C. G. J. 1896. The yearly immigration of young plaice into the Limfiord
from the German Sea. Report of the Danish Biological Station 6:5-84.
Platt, S. G., and T. B. Thorbjarnarson. 2000a. Status and conservation of the American
crocodile, Crocodylus acutus, in Belize. Biological Conservation 96:13–20.
Platt S.G., and T. B. Thorbjarnarson. 2000b. Nesting ecology of the American
crocodile in the coastal zone of Belize Copeia 3:869–873.
Platt, S. G., J. B. Thorbjarnarson, and T. R. Rainwater. 2002. Crocodylus acutus
(American crocodile) hatchling diet. Herpetological Review 33:202–203.
Platt, S. G., T. R. Rainwater, and S. Nichols. 2004. A recent population assessment of
the American crocodile (Crocodylus acutus) in Turneffe Atoll, Belize.
Herpetological Bulletin 89:26–32.
Platt, S. G., J. B. Thorbjarnarson, and T. R. Rainwater. 2010. Scalation of the
American crocodile, Crocodylus acutus (Crocodylidae, Crocodilia), from the
coastal zone of northern Belize. Caribbean Journal of Science 46:332–338.
Platt, S. G., J. B. Thorbjarnarson, T. R. Rainwater, and D. R. Martin. 2013a. Diet of
the American crocodile (Crocodylus acutus) in Marine Environments of
Coastal Belize. Journal of Herpetology 47:1:1–10.

Texas Tech University, Sergio A. Balaguera Reina, May 2018
153
Platt, S. G., R. M. Elsey, H. Liu, T. R. Rainwater, J. C. Nifong, A. E. Rosenblatt, M.
R. Heithaus and F. J. Mazzotti. 2013b. Frugivory and seed dispersal by
crocodilians: an overlooked form of saurochory? Journal of Zoology 291:87–
99.
Ponce-Campos, P., J. B. Thorbjarnarson, and A. Velasco (IUCN SSC Crocodile
Specialist Group) 2012. Crocodylus acutus. in: IUCN 2012. IUCN Red List of
Threatened Species. Version 2012.2. (www.iucnredlist.org; accessed 10 June
2015).
Powell, J. H., Jr. 1971. The status of crocodilians in the United States, Mexico, Central
America, and the West Indies. Pp. 72–82 in: Crocodiles. Proceedings of the
First Working Meeting of the Crocodile Specialist Group. IUCN Publications
N.S., New York, United States and Morges, Switzerland.
R Development Core Team. 2012. R: A language and environment for statistical
computing. R Foundation for Statistical Computing, Vienna.
Rand, A. S., and K. Troyer. 1980. Reduced parental care in Crocodilus acutus in
Panama: causes and implications. Abstract. Society for the study of
amphibians and reptiles-Herpetological league meeting, Milwaukee,
Wisconsin, United States.
Read, M., G. Grigg, C. Franklin, and S. Irwin. 2004. Movements of adult sized
estuarine crocodiles (Crocodylus porosus) tracked by satellite telemetry. Pp.
386 in: Crocodiles Proceedings of the 17th Working Meeting of the Crocodile
Specialist Group, IUCN.
Ray, D. A., J. A. Dever, S. G. Platt, T. R. Rainwater, A. G. Finger, S. T. Mcmurry, M.
A. Batzer, B. Barr, P. J. Stafford, J. Mcknight, and L. D. Densmore. 2004. Low
levels of nucleotide diversity in Crocodylus moreletii and evidence of
hybridization with C. acutus. Conservation Genetics 5:449–462.

Texas Tech University, Sergio A. Balaguera Reina, May 2018
154
Renkonen, O. 1938. Statistisch-/Skologische Untersuchungen tiber die terrestische
Kfiferwelt der finnischen Bruchmoore. Annales Botanici Societatis
Zoologicae-Botanicae Fennicae "Vanamo" 6:1–231.
Reserva de la Biosfera la Encrucijada. 2010. Monitoreo Poblacional de Cocodrilianos
(Crocodylus acutus y Caiman crocodilus fuscus) en la Reserva de la Biosfera
La Encrucijada. Comisión Nacional de Áreas Naturales Protegidas.
Rice, A. N., J. P. Ross, A. G. Finger, and R. Owen. 2005. Application and evaluation
of a stomach flushing technique for alligators. Herpetological Review 36:400–
401.
Richards, P. M., and J. Wasilewski. 2003. Crocodylus acutus (American crocodile).
Cannibalism. Herpetological Review 34(4):371.
Rivas, G. A., C. R. Molina, G. N. Ugueto, T. R. Barros, C. L. Barrio-Amorós, and P.
J. R. Kok. 2012. Reptiles of Venezuela: an updated and commented checklist.
Zootaxa 3,211:1–64.
Rivera-Rivera, B. 2014. Abundancia, estructura demográfica y relaciones con el
hábitat del Cocodrilo americano Crocodylus acutus (Cuvier, 1807) en el
Parque Nacional Coiba, Panamá. Undergraduate thesis. Universidad de El
Bosque. Bogotá.
Rodda, G. H. 1984. Movements of juvenile American Crocodiles in Gatun Lake,
Panama. Herpetologica 40: 444–451.
Rootes, W. L., and R. H. Chabreck. 1993. Reproductive status and movement of adult
female alligators. Journal of Herpetology 27:121–126.
Rosenberg, K. V., and R. J. Cooper. 1990. Approaches to avian diet analysis. Studies
in Avian Biology 13:80–90.
Ross, F. D., and G. C. Mayer. 1983. On the dorsal armor of the Crocodilia. Pp. 305–
331 in: Advances in Herpetology and Evolutionary Biology: Essays in Honor
of Ernest E. Williams (A. G. Rhodin and K. Miyata Eds.). Harvard University,
USA.

Texas Tech University, Sergio A. Balaguera Reina, May 2018
155
Ruppert, E. E., and R. W. Barnes. 1994. Invertebrate Zoology. 7th Edition. Saunders
College Publishing, Philadelphia, PA, United States.
Samuel M. D., and K. O. Kenow. 1992. Evaluating habitat selection with radio-
telemetry triangulation error. Journal of Wildlife Management 56(4):725–734.
Sánchez, J. 2001. Estado de la población de cocodrilos (Crocodylus acutus) en el río
Tempisque, Guanacaste, Costa Rica. Unpublished Report. Área de
Conservación Tempisque-Instituto Nacional de Biodiversidad (INBio),
Heredia, Costa Rica.
Sasa, M. and G. Chaves. 1992. Tamaño, estructura y distribución de una población de
Crocodylus acutus (Crocodylia: Crocodilidae) en Costa Rica. Revista de
Biologia Tropical 40:131–134.
Schoener, T. W. 1968. The Anolis lizards of Bimini: resource partitioning in a
complex fauna. Ecology 49:704–726.
Schofield, G., K. A. Katselidis, P. Dimopoulos, and J. D. Pantis. 2008. Investigating
the viability of photo-identification as an objective tool to study endangered
sea turtle populations. Journal of Experimental Marine Biology and Ecology
360:103–108.
Schwarz, C. J., and A. N. Arnason. 1996. A general methodology for the analysis of
open-model capture recapture experiments. Biometrics 52:860–873.
Seijas, A. E. 1986. Situación actual del caimán de la costa Crocodylus acutus en
Venezuela. Pp. 96-108 in: Crocodiles. Proceedings of 8th Working Meeting of
the Crocodile Specialist Group. Gland: IUCN-The World Conservation Union.
Seijas, A. E. 1988. Habitat use by the American crocodile and the spectacled caiman
coexisting along the Venezuelan coastal region. Unpublished MS Thesis.
University of Florida.
Seijas, A. 2002. Scale patterns of American crocodiles (Crocodylus acutus) from
several Venezuelan localities. Revista Unellez de Ciencia y Tecnología
20:118–134.

Texas Tech University, Sergio A. Balaguera Reina, May 2018
156
SEMARNAT. 2010. Norma Oficial Mexicana NOM-059- ECOL-2001. Protección
Ambiental. Especies Nativas de México de Flora y Fauna Silvestres.
Categorías de Riesgo y Especificaciones para su Inclusión, Exclusión o
Cambio. Lista de Especies en Riesgo. Diario Oficial de la Federación, México
D.F., Mexico.
Short, A. D. 2006. Australian Beach Systems - Nature and Distribution, Journal of
Coastal Research 22:11–27.
Signer, J., and N. Balkenhol. 2015. Reproducible home ranges (rhr): A new, user-
friendly R package for analyses of wildlife telemetry data. Wildlife Society
Bulletin. [cited March 25, 2016]. Available:
http://jmsigner.github.io/rhrman/methodsSF.html.
Southwood, T. R. E. and P. A. Henderson. 2003. Ecological methods. Blackwell
Science Ltd. Oxford.
SPIJ (Sistema Peruano de Información Jurídica). 2004. Decreto supremo Nº 034-
2004-AG. Online document http://osinfor.gob.pe/portal/data/articulo/D.S.-N-
034-2004-AG---Categorizacin-de-Especies-Amenazadas-de-Fauna-
Silvestre.pdf.
Springer, J. T. 1979. Some sources of bias and sampling error in radio triangulation.
Journal of Wildlife Management 43:926–935.
Stephens, D. W. and J. R. Krebs. 1986. Foraging Theory. Princeton University Press,
Princeton, NJ, United States.
Subalusky, A. L., L. A. Fitzgerald, and L. L. Smith. 2009. Ontogenetic niche shifts in
the American Alligator establish functional connectivity between aquatic
systems. Biological Conservation 142:1507–1514.
Swainson, W. 1834. A Preliminary Discourse on the Study of Natural History.
Longman, Rees, Orme, Brown, Green & Longman, and J. Taylor. London.
Swanepoel, D. G. J. 1996. Identification of Nile crocodile Crocodylus niloticus by the
use of natural tail marks. Koedoe 31:113–115.
Texas Tech University, Sergio A. Balaguera Reina, May 2018
157
Swanson, P. L. 1945. Herpetological notes from Panama. Copeia 1945: 210–216.
Swihart R. K., and N. A. Slade. 1997. On testing for independence of animal
movements. Journal of Agricultural, Biological, and Environmental Statistics.
2(1):48–63.
Targarona, R. R., R. R. Soberón, L. Cotayo, M. A. Tabet, and J. Thorbjarnarson,
(IUCN Crocodile Specialist Group). 1996. Crocodylus rhombifer. The IUCN
Red List of Threatened Species [cited 28 March 2016]. Available:
http://dx.doi.org/10.2305/IUCN.UK.1996.RLTS.T5670A11516438.en.
Taylor, J. M., G. J. W. Webb, and W. E. Magnusson. 1978. Methods of obtaining
stomach contents from live crocodiles (Reptilia, Crocodilidae). Journal of
Herpetology 12:415–417.
Thompson, W. L. 2002. Towards reliable bird surveys: accounting for individuals
present but not detected. Auk 119:18–25.
Thorbjarnarson, J. B. 1988. The status and ecology of the American crocodile in Haiti.
Bulletin of the Florida State Museum, Biological Sciences 33:1–86.
Thorbjarnarson, J. B. 1989. Ecology of the American crocodile (Crocodylus acutus).
Pp. 228–258, in: Crocodiles: Their Ecology, Management, and Conservation
(P. M. Hall Ed.). IUCN, Gland.
Thorbjarnarson, J. B. 2010. American Crocodile Crocodylus acutus. Pp 46–53 in:
Crocodiles: Status Survey and Conservation Action Plan (S. C. Manolis and C.
Stevenson Eds.). 3rd ed. Crocodile Specialist Group, Darwin. Australia.
Thorbjarnarson, J., F. Mazzotti, E. Sandern, F. Buitrago, M. Lazcano, K. Minkowski,
M. Muñoz, P. Ponce, L. Sigler, R. Soberon, A. Trelancia, and A. Velasco.
2006. Regional habitat conservation priorities for the American Crocodile.
Biological Conservation 128:25–36.
Thorbjarnarson, J. B., X. Wang, and G. B. Schaller. 2010. The Chinese alligator:
Ecology, behavior, conservation, and culture. Baltimore, Md: Johns Hopkins
University Press.
Texas Tech University, Sergio A. Balaguera Reina, May 2018
158
Tucker, A. D., C. J. Limpus, H. I. McCallum, and K. R. McDonald. 1996. Ontogenetic
dietary partitioning by Crocodylus johnstoni during the dry season. Copeia
1996:978–988.
Tucker, A. D., C. J. Limpus, H. I. Mccallum, and K. R. Mcdonald. 1997. Movements
and home ranges of Crocodylus johnstoni in the Lynd River, Queensland
Wildlife Research 24:379–396.
Varona L.S. 1980. The status of Crocodylus acutus and C. rhombifer in Cuba.
Unpublished Report. Santiago.
Venegas-Anaya, M. 1992. Algunos aspectos zootécnicos y de salud pública veterinaria
aplicados a una cría de lagartos. Notas Veterinarias 2: 7.
Venegas-Anaya, M. 1995. Síndrome Osteodistrofico en cocodrilos. Notas Veterinarias
4: 1–2.
Venegas-Anaya, M. 1998. Estudio retrospectivo de algunos parámetros involucrados
en la anidación del Lagarto Blanco en la granja Panagator S.A. Panamá,
América Central. Panagator S.A. and INRENARE. 58 Pp.
Venegas-Anaya, M. 2000. La Reconstrucción Filogeográfica de Crocodylus acutus
Revela una Diversificación Criptica en el Terciario Tardío Asociada a su
Comportamiento Ecológico. Unpublished Master thesis, Universidad Católica
Santa María La Antigua, Panama City, Panama.
Venegas-Anaya, M. 2001. Avances del estudio piloto: determinación de marcadores
genéticos para la identificación de poblaciones de Caiman crocodilus fuscus y
Crocodylus acutus en Panamá, utilizando técnicas de sistemática molecular.
Pp. 174–184 in: Memorias del Primer Seminario Taller de Capacitación y
Actualización del Manejo Sostenible de los Cocodrilos de Panamá. Panama
City, Panama.
Venegas-Anaya, M. 2013. Estructura poblacional y uso de hábitat de Crocodylus
acutus en la Isla de Coiba y Golfo de Montijo: genética molecular y telemetría.
Technical report. SENACYT. Panama.

Texas Tech University, Sergio A. Balaguera Reina, May 2018
159
Venegas-Anaya, M. 2015a. Análisis de situación de la explotación comercial de
cocodrilos y propuesta para un estudio poblacional en Panamá. Technical
Report. SENACYT. Panama.
Venegas-Anaya, M. 2015b. Ecología de la reproducción y patrones de dispersión
asociados a la productividad del hábitat del Cocodrilo Americano (Crocodylus
acutus) del Parque Nacional Coiba: genética y telemetría. Technical report,
SENACYT, Panama.
Venegas-Anaya, M., A. Bashyal, S. A. Balaguera-Reina, B. Gross, J. Gaitan, I.
Arbelaez, K. T. Niño, Z. T. Rincon, B. I. Rivera, V. Beltran, and L. D.
Densmore. 2013. Training workshop on participatory research and education
applied to understand and conserve the American crocodile in Coiba national
park, Panama. CSG Newsletter 32(3):10–12
Venegas-Anaya, M., A. H. Escobedo-Galván, S. A. Balaguera-Reina, F. Lowrance, O.
I. Sanjur, and L. D. Densmore III. 2015. Population ecology and habitat status
of Crocodylus acutus in Coiba National Park and its buffer zone, Panama.
Journal of Herpetology 49:349–357.
Vickaryous, M. K., and B. K. Hall. 2008. Development of the dermal skeleton in
Alligator mississippiensis (Archosauria, Crocodylia) with comments on the
homology of osteoderms. Journal of Morphology 269:398–422.
Villegas, A., and J. J. Schmitter-Soto. 2008. Feeding habitats of the American
crocodile, Crocodylus acutus (Cuvier, 1807) (Reptilia: Crocodylidae) in the
southern coast of Quintana Roo, Mexico. Acta Zoologica Mexicana 24:117–
124.
Wall. J. 2014. Movement Ecology Tools for ArcGIS (AcrMET). Version 10.2.2 v3.
[cited May 5, 2015]. Available: www.movementecology.net.
Wasilewski, J. A. and B. Enloe. 2006. The status of American crocodiles (Crocodylus
acutus) at Turkey point nuclear power plant, Florida, USA. Pp. 284–292 in:

Texas Tech University, Sergio A. Balaguera Reina, May 2018
160
Proceeding of the 18th working meeting of the crocodile specialist group.
Gland: IUCN-The World Conservation Union.
Weaver, J., D. Rodriguez, M. Venegas-Anaya, M. Forstner, and L. D. Densmore III.
2008. Genetic characterization of captive Cuban Crocodiles (Crocodylus
rhombifer) and evidence of hybridization with the American Crocodile
(Crocodylus acutus). Journal of Experimental Zoology. 309A:649–660.
Webb G. J. W., and H. Messel. 1978a. Morphometric analysis of Crocodylus porosus
from the north coast of Arnhem Land, Northern Australia. Australian Journal
of Zoology 26:1–27.
Webb G. J. W., and H. Messel. 1978b. Movement and dispersal patterns of
Crocodylus porosus in some rivers of Arnhem Land, northern Australia.
Australian Wildlife Research 5:263–283.
Webb G. J. W., H. Messel, J. Crawford, and M. Yerbury. 1978. Growth rates of
Crocodylus porosus (Reptilia: Crocodilia) from Arnhem Land, northern
Australia. Australian Wildlife Research 5:385–399.
Webb, G. J. W., and H. Messel. 1979. Wariness in Crocodylus porosus (Reptilia:
Crocodilia). Australian wildlife research 6(2):227–234.
Webb G. J. W., S. C. Manolis, R. Buckworth, and G. C. Sack. 1983. An examination
of Crocodylus porosus nests in two Northern Australia freshwater swamps,
with an analysis of embryo mortality. Australian Wildlife Research 10:571–
605.
Webb, G. J. W., P. G. Bayliss, and S. C. Manolis. 1989. Population research on
crocodiles in the Northern Territory, 1984-86. Pp. 22-59 in: Crocodiles.
Proceedings of the 8th Working Meeting of the IUCN-SSC Crocodile
Specialist Group. Gland: IUCN-The World Conservation Union.
White, G. C., and K. P. Burnham, 1999. Program MARK: Survival estimation from
populations of marked animals. Bird Study 46:120–139.

Texas Tech University, Sergio A. Balaguera Reina, May 2018
161
Williams, K. A., P. C. Frederick, and J. D. Nichols. 2011. Use of the superpopulation
approach to estimate breeding population size: an example in asynchronously
breeding birds. Ecology 92(4):821–828.
Winner, D. 2007a. Crocodile attack survivor tells his story. Panama-Guide.com.
(www.panama-guide.com/article.php/2007072809 1144515).
Winner, D. 2007b. Crocodile attacks and kills fisherman in Panama Canal. Panama-
Guide.com. (www.panama-guide.com/article.php/20070517190345717).
Wood, J. B. 1930. Flying the world’s longest air-mail route. National Geographic
57:261–326.
Woodroffe, R. 2000. Predators and people: using human densities to interpret declines
of large carnivores. Animal Conservation 3:165–173.
Worton, B. J. 1989. Kernel methods for estimating the utilization distribution in home-
range studies. Ecology 70:164–168.