copyright © 2011-12. university of minnesota. all rights reserved. conservation tillage workshop...
TRANSCRIPT

Copyright © 2011-12. University of Minnesota. All Rights Reserved.
Conservation Tillage Workshop
Heron Lake, MN
March 22, 2012
David BauExtension Educator
Agricultural Business ManagementUniversity of Minnesota Extension
507-372-3906

Operation Estimated Costs
ChiselPlow
Chisel Plow 2 No-Till
OnePass
Strip Till
RidgeTill
Stalk Chopping 8.00 8.00 8.00 8.00 8.00 8.00 8.00
Primary Tillage Chisel Plow 11.80 11.80 11.80 11.80
Strip Tillage 16 Row2 9.50 9.50
Spring Tillage Field Cultivator 40‘ 8.45 8.45 8.45 8.45 8.45
Planter 12.60 12.60 12.60 12.60 12.60 12.60 12.60
Ridge Till Cultivation 10.00 10.00
Spraying 4.90 4.90 4.90 4.90 4.90 4.90 4.90
Spraying 4.90 4.90 4.90 4.90 4.90 4.90 4.90
Harvest 25.00 25.00 25.00 25.00 25.00 25.00 25.00
Total Tillage Costs 75.65 75.65 55.40 63.85 64.90 77.20
Conservation Tillage Demonstration Project Heron Lake Watershed District 2006 Beans
Copyright © 2011-12. University of Minnesota. All Rights Reserved.

Operation Estimated Costs
ChiselPlow
Chisel Plow 2 No-Till
OnePass
Strip Till
RidgeTill
Stalk Chopping 8.65 8.65 8.65 8.65 8.65
Primary Tillage Chisel Plow 12.70 12.70 12.70
Strip Tillage 10.50 10.50
Spring Tillage Field Cultivator 40‘ 9.05 9.05 9.05 9.05
Planter 13.05 13.05 13.05 13.05 13.05 13.05 13.05
Spraying 5.15 5.15 5.15 5.15 5.15 5.15 5.15
Spraying 5.15 5.15 5.15 5.15 5.15 5.15 5.15
Harvest 25.80 25.80 25.80 25.80 25.80 25.80 25.80
Total Tillage Costs 79.55 79.55 49.15 66.85 59.65 57.80
Conservation Tillage Demonstration Project Heron Lake Watershed District 2007 Beans
Copyright © 2011-12. University of Minnesota. All Rights Reserved.

Operation Estimated Costs
ChiselPlow
Chisel Plow 2 No-Till
OnePass
Strip Till
RidgeTill
Stalk Chopping 9.50 9.50 9.50 9.50 9.50
Primary Tillage Chisel Plow 13.70 13.70 13.70
Strip Tillage 12.90 12.90
Spring Tillage Field Cultivator 40‘ 10.10 10.10 10.10 10.10
Planter 14.60 14.60 14.60 14.60 14.60 14.60 14.60
Spraying 5.60 5.60 5.60 5.60 5.60 5.60 5.60
Spraying 5.60 5.60 5.60 5.60 5.60 5.60 5.60
Harvest 34.40 34.40 34.40 34.40 34.40 34.40 34.40
Total Tillage Costs 93.50 93.50 60.20 79.80 73.10 69.70
Conservation Tillage Demonstration Project Heron Lake Watershed District 2008 Beans
Copyright © 2011-12. University of Minnesota. All Rights Reserved.

Operation Estimated Costs
ChiselPlow
Chisel Plow 2 No-Till
OnePass
Strip Till
RidgeTill
Stalk Chopping 9.80 9.80 9.80 9.80 9.80
Primary Tillage Chisel Plow 13.70 13.70 13.70
Strip Tillage 13.30 13.30
Spring Tillage Field Cultivator 40‘ 10.70 10.70 10.70 10.70
Planter 14.70 14.70 14.70 14.70 14.70 14.70 14.70
Spraying 6.00 6.00 6.00 6.00 6.00 6.00 6.00
Spraying 6.00 6.00 6.00 6.00 6.00 6.00 6.00
Harvest 35.30 35.30 35.30 35.30 35.30 35.30 35.30
Total Tillage Costs 96.20 96.20 62.00 82.50 75.30 71.80
Conservation Tillage Demonstration Project Heron Lake Watershed District 2009 Beans
Copyright © 2011-12. University of Minnesota. All Rights Reserved.

Operation Estimated Costs
ChiselPlow
Chisel Plow 2 No-Till
OnePass
Strip Till
RidgeTill
Primary Tillage Chisel Plow 14.20 14.20 14.20
Strip Tillage 13.80 13.80
Spring Tillage Field Cultivator 40‘ 10.85 10.85 10.85 10.85
Planter 14.70 14.70 14.70 14.70 14.70 14.70 14.70
Spraying 6.10 6.10 6.10 6.10 6.10 6.10 6.10
Spraying 6.10 6.10 6.10 6.10 6.10 6.10 6.10
Harvest 35.30 35.30 35.30 35.30 35.30 35.30 35.30
Total Tillage Costs 87.25 87.25 62.20 73.05 76.00 62.20
Conservation Tillage Demonstration Project Heron Lake Watershed District 2010 Beans
Copyright © 2011-12. University of Minnesota. All Rights Reserved.

Operation Estimated Costs
ChiselPlow
Chisel Plow 2 No-Till
OnePass
Strip Till
RidgeTill
Primary Tillage Chisel Plow 13.70 13.70 13.70
Strip Tillage 16 Row2 13.30 13.30
Spring Tillage Field Cultivator 40‘ 10.70 10.70 10.70 10.70
Planter 14.70 14.70 14.70 14.70 14.70 14.70 14.70
Spraying 6.00 6.00 6.00 6.00 6.00 6.00 6.00
Spraying 6.00 6.00 6.00 6.00 6.00 6.00 6.00
Harvest 38.15 38.15 38.15 38.15 38.15 38.15 38.15
Total Tillage Costs 89.25 89.25 64.85 75.55 78.15 64.85
Conservation Tillage Demonstration Project Heron Lake Watershed District 2011 Beans
Copyright © 2011-12. University of Minnesota. All Rights Reserved.

Average Input Cost3
Estimated Costs
ChiselPlow
Chisel Plow 2
No-Till OnePass
Strip Till
RidgeTill
Seed 31.19 31.19 31.19 31.19 31.19 31.19 31.19
Fertilizer 0.00 0.00 0.00 0.00 0.00 0.00 0.00
Herbicides 15.62 15.62 15.62 15.62 15.62 15.62 15.62
Insecticides 6.60 6.60 6.60 6.60 6.60 6.60 6.60
Crop Insurance 13.00 13.00 13.00 13.00 13.00 13.00 13.00
Marketing/ Trucking 6.00 6.00 6.00 6.00 6.00 6.00 6.00
Rent 120.00 120.00 120.00 120.00 120.00 120.00 120.00
Other 8.00 8.00 8.00 8.00 8.00 8.00 8.00
Total Input Costs 200.41 200.41 200.41 200.41 200.41 200.41 200.41
Total Cost Per Acre 276.06 276.06 255.81 264.26 265.31 277.61
Average Yields 52.33 51.67 50.00 47.67 53.00 50.33
Conservation Tillage Demonstration Project Heron Lake Watershed District 2006 Beans
Copyright © 2011-12. University of Minnesota. All Rights Reserved.

Total Crop Expenses ChiselPlow
Chisel Plow 2
No-Till OnePass
Strip Till
RidgeTill
Production Costs 2006 276.06 276.06 255.81 264.26 265.31 277.61Production Costs 2007 310.02 310.02 279.62 297.32 290.12 288.27Production Costs 2008 364.05 364.05 330.75 350.35 343.65 340.25Production Costs 2009 372.77 372.77 338.57 359.07 351.87 348.37Production Costs 2010 367.82 367.82 342.77 353.62 356.57 342.77Production Costs 2011 375.84 375.84 351.44 362.14 364.74 351.44Average Costs 2006-2010 338.14 338.14 309.50 324.92 321.50 319.45
Conservation Tillage Demonstration Project Heron Lake Watershed District 2006-2011 Beans
Copyright © 2011-12. University of Minnesota. All Rights Reserved.

Yields
ChiselPlow
Chisel Plow 2
No-Till OnePass
Strip Till
RidgeTill
Average Yields 2006 52.33 51.67 50.00 47.67 53.00 50.33Average Yields 2007 57.20 58.60 53.30 56.30 56.40 59.70Average Yields 2008 44.90 45.10 39.10 43.00 44.50 45.90Average Yields 2009 50.80 51.20 45.20 49.50 50.00 46.10Average Yields 2010 48.10 49.40 39.00 46.90 48.80 44.50Average Yields 2011 47.50 44.30 47.00 NA 47.70 46.50Average Yields 2006-2010 50.67 51.19 45.32 48.67 50.54 49.31
Conservation Tillage Demonstration Project Heron Lake Watershed District 2006-2011 Beans
Copyright © 2011-12. University of Minnesota. All Rights Reserved.
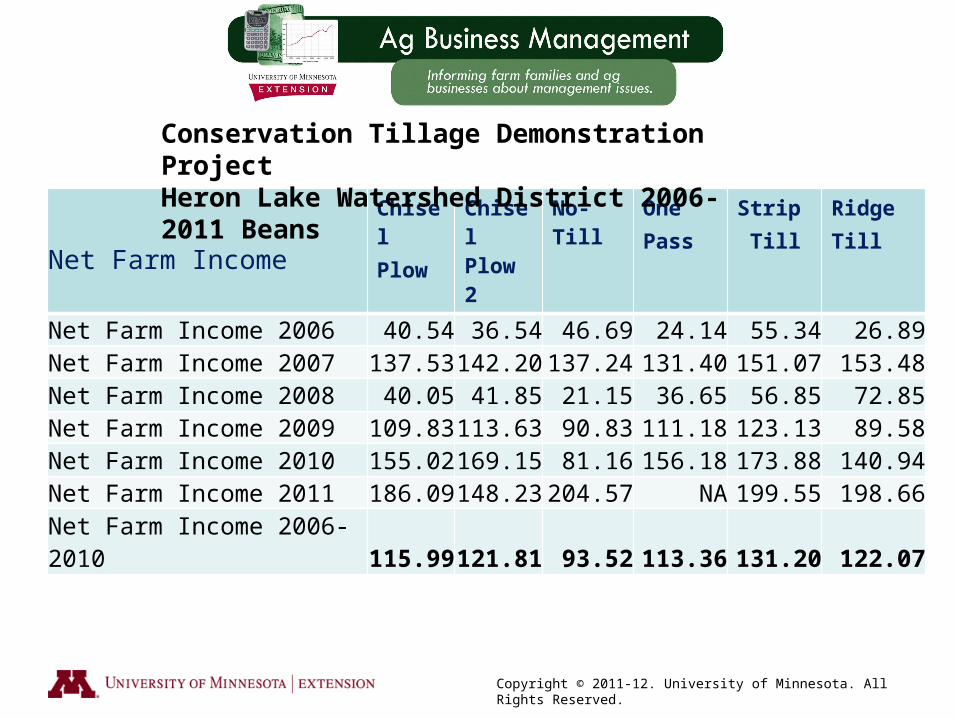
Net Farm Income ChiselPlow
Chisel Plow 2
No-Till OnePass
Strip Till
RidgeTill
Net Farm Income 2006 40.54 36.54 46.69 24.14 55.34 26.89Net Farm Income 2007 137.53 142.20 137.24 131.40 151.07 153.48Net Farm Income 2008 40.05 41.85 21.15 36.65 56.85 72.85Net Farm Income 2009 109.83 113.63 90.83 111.18 123.13 89.58Net Farm Income 2010 155.02 169.15 81.16 156.18 173.88 140.94Net Farm Income 2011 186.09 148.23 204.57 NA 199.55 198.66Net Farm Income 2006-2010 115.99 121.81 93.52 113.36 131.20 122.07
Conservation Tillage Demonstration Project Heron Lake Watershed District 2006-2011 Beans
Copyright © 2011-12. University of Minnesota. All Rights Reserved.

2006-2010 Beans AveragesChiselPlow
Chisel Plow 2
No-Till
OnePass
Strip Till
RidgeTill
Total Cost Per Acre 338.14 338.14 309.50 324.92 321.50 319.45
Average Yields 50.67 51.19 45.32 48.67 50.54 49.31
Total Revenue 454.14 459.95 403.03 438.29 452.71 441.52
Net Farm Income Per Acre 115.99 121.81 93.52 113.36 131.20 122.07
Conservation Tillage Demonstration Project Heron Lake Watershed District 2006-2010 Beans
Copyright © 2011-12. University of Minnesota. All Rights Reserved.
Results Indicate: Strip and Ridge Till Tillage Systems are very
economically competitive with conventional tillage!

Assumptions:
2006 cost for Ridge Till higher than normal on beans to establish ridge
Normally would not chisel, field cultivate or Ridge Till in beans.
2006 corn yields for Ridge Till were destroyed by green snap during cultivating and therefore could not use yields for a good comparison
Used Fertilizer costs for 2006 and adjusted for Strip and Ridge Till banded reduced fertilizer material.
Although plot area soil tests were high P & K, applicator could not reduce rate applied by banding so banded and broadcasted were at the same pounds per acre
Each year used actual cost of fertilizer used on plots. Costs were used as provided otherwise used prices in annual Farm Resource Guide Publication

Assumptions Continued:
Equipment Costs came from Iowa State publication: Farm Custom Rates
2007 Total crop expenses were calculated using 2006 costs multiplied by 1.15 for a 15% increased costs in 2007. This process was continued each year for costs other than fertilizer and used FINBIN data in Farm Resource Guide
Cash prices came from FINBIN data for average sale price on corn and soybeans sold in year. This number was used to calculate Gross Farm Income calculations

Operation Estimated Costs
ChiselPlow
Chisel Plow 2 No-Till
OnePass
Strip Till
Ridge Till
Primary Tillage Chisel Plow 11.80 11.80 11.80 11.80
Strip Tillage 16 Row 9.50 9.50
Dry Fertilizer Application 3.50 3.50 3.50 3.50 3.50 3.50
Anhydrous Applicator 7.40 7.40 7.40 7.40 7.40 7.40 7.40
Spring Field Cultivator 8.45 8.45 8.45 8.45 8.45
Planter 12.60 12.60 12.60 12.60 12.60 12.60 12.60
Spraying 4.90 4.90 4.90 4.90 4.90 4.90 4.90
Spraying 4.90 4.90 4.90 4.90 4.90 4.90 4.90
Ridge Tillage Cultivation 10.00 10.00
Harvest 25.70 25.70 25.70 25.70 25.70 25.70 25.70
Total Tillage Costs 79.25 79.25 59.00 67.45 65.00 89.25
Conservation Tillage Demonstration Project Heron Lake Watershed District 2006 Corn

Operation Estimated Costs
ChiselPlow
Chisel Plow 2 No-Till
OnePass
Strip Till
Ridge Till
Primary Tillage Chisel Plow 12.70 12.70 12.70 12.70
Strip Tillage 16 Row 10.50 10.50
Dry Fertilizer Application 3.20 3.20 3.20 3.20 3.20
Anhydrous Applicator 7.90 7.90 7.90 7.90 7.90 7.90 7.90
RT Fertilizer Application 7.90 7.90
Spring Field Cultivator 9.05 9.05 9.05 9.05
Planter 13.05 13.05 13.05 13.05 13.05 13.05 13.05
Spraying 5.15 5.15 5.15 5.15 5.15 5.15 5.15
Spraying 5.15 5.15 5.15 5.15 5.15 5.15 5.15
Ridge Tillage Cultivation 10.50 10.50
Harvest 26.60 26.60 26.60 26.60 26.60 26.60 26.60
Total Tillage Costs 82.80 82.80 61.05 70.10 68.35 76.25
Conservation Tillage Demonstration Project Heron Lake Watershed District 2007 Corn

Operation Estimated Costs
ChiselPlow
Chisel Plow 2
No-Till
OnePass
Strip Till
Ridge Till
Primary Tillage Chisel Plow 13.70 13.70 13.70
Strip Tillage 16 Row 12.90 12.90
Dry Fertilizer Application 3.75 3.75 3.75 3.75 3.75
Anhydrous Applicator 8.75 8.75 8.75 8.75 8.75 8.75 8.75
RT Fertilizer Application 8.75 8.75
Spring Field Cultivator 10.10 10.10 10.10 10.10 10.10
Planter 14.60 14.60 14.60 14.60 14.60 14.60 14.60
Spraying 5.60 5.60 5.60 5.60 5.60 5.60 5.60
Spraying 5.60 5.60 5.60 5.60 5.60 5.60 5.60
Ridge Tillage Cultivation 11.70 11.70
Harvest 38.00 38.00 38.00 38.00 38.00 38.00 38.00
Total Tillage Costs 100.10 100.10 76.30 86.40 85.45 93.00
Conservation Tillage Demonstration Project Heron Lake Watershed District 2008 Corn
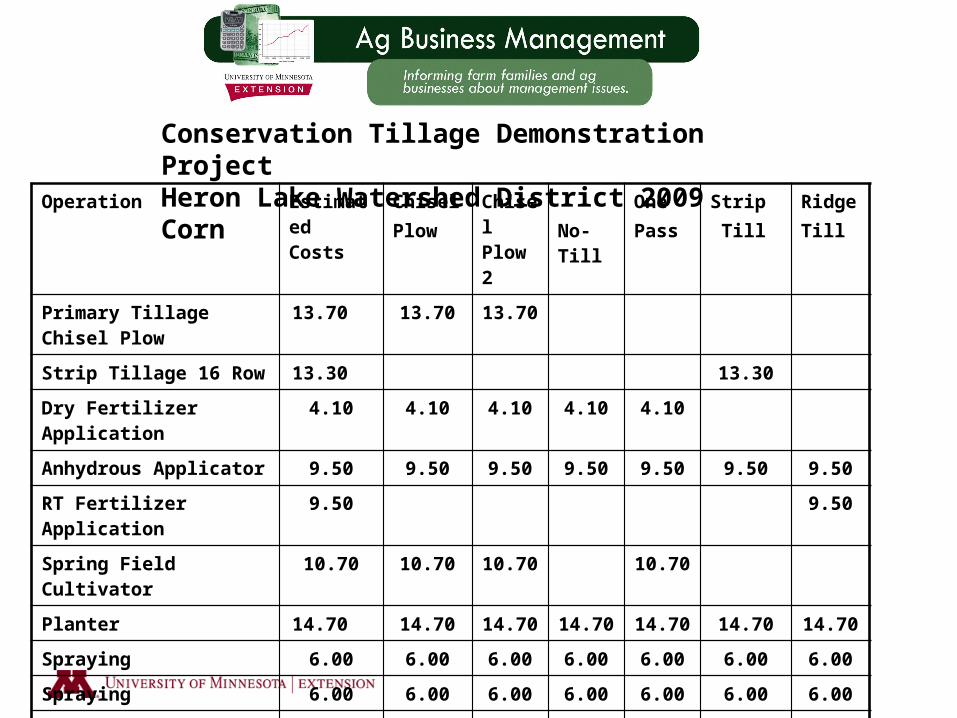
Operation Estimated Costs
ChiselPlow
Chisel Plow 2 No-Till
OnePass
Strip Till
Ridge Till
Primary Tillage Chisel Plow 13.70 13.70 13.70
Strip Tillage 16 Row 13.30 13.30
Dry Fertilizer Application 4.10 4.10 4.10 4.10 4.10
Anhydrous Applicator 9.50 9.50 9.50 9.50 9.50 9.50 9.50
RT Fertilizer Application 9.50 9.50
Spring Field Cultivator 10.70 10.70 10.70 10.70
Planter 14.70 14.70 14.70 14.70 14.70 14.70 14.70
Spraying 6.00 6.00 6.00 6.00 6.00 6.00 6.00
Spraying 6.00 6.00 6.00 6.00 6.00 6.00 6.00
Ridge Tillage Cultivation 11.50 11.50
Harvest 39.60 39.60 39.60 39.60 39.60 39.60 39.60
Total Tillage Costs 104.30 104.30 79.90 90.60 89.10 96.80
Conservation Tillage Demonstration Project Heron Lake Watershed District 2009 Corn

Operation Estimated Costs
ChiselPlow
Chisel Plow 2 No-Till
OnePass
Strip Till
Ridge Till
Primary Tillage Chisel Plow 14.20 14.20 14.20
Strip Tillage 16 Row 13.80 13.80
Dry Fertilizer Application 4.15 4.15 4.15 4.15 4.15
Anhydrous Applicator 9.75 9.75 9.75 9.75 9.75 9.75 9.75
RT Fertilizer Application 9.75 9.75
Spring Field Cultivator 10.85 10.85 10.85 10.85
Planter 14.70 14.70 14.70 14.70 14.70 14.70 14.70
Spraying 6.10 6.10 6.10 6.10 6.10 6.10 6.10
Spraying 6.10 6.10 6.10 6.10 6.10 6.10 6.10
Ridge Tillage Cultivation 12.45 12.45
Harvest 39.80 39.80 39.80 39.80 39.80 39.80 39.80
Total Tillage Costs 105.65 105.65 80.60 91.45 90.25 98.65
Conservation Tillage Demonstration Project Heron Lake Watershed District 2010 Corn

Operation Estimated Costs
ChiselPlow
Chisel Plow 2 No-Till
OnePass
Strip Till
Ridge Till
Primary Tillage Chisel Plow 13.70 13.70 13.70
Strip Tillage 16 Row 13.30 13.30
Dry Fertilizer Application 4.05 4.05 4.05 4.05 4.05
Anhydrous Applicator 10.30 10.30 10.30 10.30 10.30 10.30 10.30
RT Fertilizer Application 10.30 10.30
Spring Field Cultivator 11.45 11.45 11.45 11.45
Planter 15.70 15.70 15.70 15.70 15.70 15.70 15.70
Spraying 6.05 6.05 6.05 6.05 6.05 6.05 6.05
Spraying 6.05 6.05 6.05 6.05 6.05 6.05 6.05
Ridge Tillage Cultivation 13.35 13.35
Harvest 40.80 40.80 40.80 40.80 40.80 40.80 40.80
Total Tillage Costs 108.10 108.10 82.95 94.40 92.20 102.55
Conservation Tillage Demonstration Project Heron Lake Watershed District 2011 Corn

Average Input Cost 2006 ChiselPlow
Chisel Plow 2
No-Till
OnePass
Strip Till
Ridge Till
Fertilizer-Actual costs 2006 70.30 80.18 70.30 70.30 63.55 70.30Seed 70.33 70.33 70.33 70.33 70.33 70.33Herbicides 14.92 14.92 14.92 14.92 14.92 14.92Crop Insurance 13.00 13.00 13.00 13.00 13.00 13.00Marketing/ Trucking 6.00 6.00 6.00 6.00 6.00 6.00Rent 120.00 120.00 120.00 120.00 120.00 120.00Other 12.00 12.00 12.00 12.00 12.00 12.00Total Misc Input Costs 236.25 236.25 236.25 236.25 236.25 236.25Total Cost Per Acre 385.80 395.68 365.55 374.00 364.80 395.80Average Yields 188.28 179.33 171.33 171.67 178.78 NATotal Revenue Yield x $2.90 546.01 520.06 496.86 497.84 518.46 NA
Conservation Tillage Demonstration Project Heron Lake Watershed District 2006 Corn

Annual Fertilizer Cost ChiselPlow
Chisel Plow 2
No-Till
OnePass
Strip Till
Ridge Till
Fertilizer-Actual costs 2006 70.30 80.18 70.30 70.30 63.55 70.30Fertilizer-Actual costs 2007 34.47 43.89 34.47 34.47 34.47 34.47Fertilizer-Actual costs 2008 72.56 82.35 72.56 72.56 72.56 72.56Fertilizer-Actual costs 2009 100.48 107.47 100.48 100.48 100.48 100.48Fertilizer-Actual costs 2010 112.88 132.88 112.88 112.88 112.88 112.88Fertilizer-Actual costs 2011 214.00 238.8 214.00 214.00 214.00 214.00
Conservation Tillage Demonstration Project Heron Lake Watershed District 2006 Corn

Total Crop Expenses ChiselPlow
Chisel Plow 2
No-Till OnePass
Strip Till
RidgeTill
Production Costs 2006 385.80 395.68 365.55 374.00 364.80 395.80Production Costs 2007 388.96 398.38 367.21 376.26 374.51 382.41Production Costs 2008 491.60 501.39 467.80 477.90 476.95 484.50Production Costs 2009 556.79 563.78 532.39 543.09 541.59 549.29Production Costs 2010 565.82 585.82 540.77 551.62 550.42 558.82Production Costs 2011 676.48 701.28 651.33 662.78 660.58 670.93Average Costs 2006-2010 500.79 512.34 477.04 487.22 485.87 493.75
Conservation Tillage Demonstration Project Heron Lake Watershed District 2006-2011 Corn
Copyright © 2011-12. University of Minnesota. All Rights Reserved.

Yields
ChiselPlow
Chisel Plow 2
No-Till OnePass
Strip Till
RidgeTill
Average Yields 2006 188.28 179.33 171.33 171.67 178.78 NAAverage Yields 2007 157.30 163.90 144.00 151.70 150.60 153.90Average Yields 2008 175.20 197.30 176.60 179.10 169.60 193.80Average Yields 2009 154.70 157.50 131.80 149.00 165.50 154.30Average Yields 2010 176.10 175.90 164.00 174.30 163.10 154.10Average Yields 2011 182.20 194.50 155.70 NA 177.00 182.20Average Yields 2007-2010 165.83 173.65 154.10 163.53 162.20 164.03
Conservation Tillage Demonstration Project Heron Lake Watershed District 2006-2011 Corn
Copyright © 2011-12. University of Minnesota. All Rights Reserved.

Net Farm Income ChiselPlow
Chisel Plow 2
No-Till OnePass
Strip Till
RidgeTill
Net Farm Income 2006 160.21 124.38 131.31 123.84 153.66 NANet Farm Income 2007 189.91 204.77 162.71 182.00 179.70 183.94Net Farm Income 2008 189.93 266.11 219.18 218.80 182.80 269.38Net Farm Income 2009 21.79 25.27 -39.46 14.17 77.38 27.79Net Farm Income 2010 258.33 237.39 226.75 264.11 212.89 162.37Net Farm Income 2011 347.49 391.82 223.71 NA 334.17 353.04Net Farm Income 2007-2010 164.99 183.39 142.30 169.77 163.19 160.87
Conservation Tillage Demonstration Project Heron Lake Watershed District 2006-2011 Corn
Copyright © 2011-12. University of Minnesota. All Rights Reserved.

2007-2010 Corn AveragesChiselPlow
Chisel Plow 2
No-Till
OnePass
Strip Till
RidgeTill
Total Cost Per Acre 500.79 512.34 477.04 487.22 485.87 493.75
Average Yields 165.83 173.65 154.10 163.53 162.20 164.03
Total Revenue 665.78 695.73 619.34 656.98 649.06 654.63
Net Farm Income Per Acre 164.99 183.39 142.30 169.77 163.19 160.87
Conservation Tillage Demonstration Project Heron Lake Watershed District 2007-2010 Corn
Copyright © 2011-12. University of Minnesota. All Rights Reserved.
Results Indicate: Strip and Ridge Till Tillage Systems are very economically competitive with conventional tillage!

Corn2007-2010 Averages
ChiselPlow
Chisel Plow 2
No-Till
OnePass
Strip Till
RidgeTill
Total Cost Per Acre 500.79 512.34 477.04 487.22 485.87 493.75
Average Yields 165.83 173.65 154.10 163.53 162.20 164.03
Total Revenue 665.78 695.73 619.34 656.98 649.06 654.63
Net Farm Income Per Acre 164.99 183.39 142.30 169.77 163.19 160.87
Bean 2006-2010 Averages
Total Cost Per Acre 338.14 338.14 309.50 324.92 321.50 319.45
Average Yields 50.67 51.19 45.32 48.67 50.54 49.31
Total Revenue 454.14 459.95 403.03 438.29 452.71 441.52
Net Farm Income Per Acre 115.99 121.81 93.52 113.36 131.20 122.07
Combined Corn & Bean Net 140.49 152.60 117.91 141.57 147.20 141.47
Conservation Tillage Demonstration Project Heron Lake Watershed District 2007-2010 Corn and 2006-2010 Soybeans Averages
Copyright © 2011-12. University of Minnesota. All Rights Reserved.

Copyright © 2010-12. University of Minnesota. All Rights Reserved.
FINBIN AVERAGES 2006 2007 2008 2009 2010 2011Soybean
Net Farm Income 38.89 171.17 112.75 90.29 166.85 178.03Corn
Net Farm Income 97.92 156.14 127.23 55.39 259.05 277.78Bean and Corn Ave $68.41 $163.66 $119.99 $72.84 $212.95 $227.91
2006-2010 Bean Average: $115.99
2007-2010 Corn Average $149.45
Combined Bean and Corn Average: $132.72

Results Indicate: Strip and Ridge Till Tillage Systems are very economically competitive with conventional tillage!
Conservation Tillage Demonstration Project Heron Lake Watershed District
2007-2010 Corn and 2006-2010 Soybeans Averages
Copyright © 2011-12. University of Minnesota. All Rights Reserved.

Reference Websites: FINBIN Data Base: http://www.finbin.umn.eduUse this website to examine crop and livestock budgets for Minnesota and surrounding states. The data can be sorted by county using many different variables.
Acceptable Price Worksheet: http://swroc.cfans.umn.edu/SWFM/farm_mgmt.htmlGo to the Southwest Research and Outreach website and under Farm Business Management you can find information including Acceptable Price Worksheet which you can use to determine your farm’s corn and soybean breakeven prices.
Center for Farm Financial Management: http://www.cffm.umn.edu/Use this website to find county farmland rental information and marketing plan information provided by Ed Usset and several basis charts for cities across the state. You can also access the FINBIN data base from here.
Farmland Sales: http://www.cffm.umn.edu/landeconomics/landdata/FarmLandSale/Default.htmSteve Taff’s information on farmland values and sales can be found at this website. You can search this data base by Townships across Minnesota.
University of Minnesota Extension Service County Offices: http://www.extension.umn.eduYou can go the University of Minnesota Extension Service Home Page and link to County Offices across the state. You can find crop production information here.
Annual Reports of Farm Business Management Association: http://www.cffm.umn.edu/publications/FarmAnnualReports.aspxAt this website you can find the annual reports from the Southwest and Southeast Farm Business Management Associations.
2012 Farm Resource Guide, David BauThis 114 page publication is full of Agricultural Farm Business Management information. It is available at many County Extension Offices or by emailing Dave @ [email protected]. Cost is $25 plus postage and materials.

Questions??2012 Farm Resource Guide
David BauRegional Extension Educator
Agricultural Business ManagementUniversity of Minnesota Extension