copyright 2006, icmi, inc. ptel inc. callcenterstore inc 800-647-7640
TRANSCRIPT

Copyright 2006, ICMI, Inc.
PTel Inc.CallCenterStore Inc
800-647-7640

Copyright 2006, ICMI, Inc.
Do You . . .
Want to meet your service level objectives?
Need to cope with response time objectives for email, fax, web callbacks, or correspondence?
Wish you could spend less energy on real-time crisis management in your call center?

Copyright 2006, ICMI, Inc.
A Spreadsheet May Be All You Need to Schedule Your Agents
Anyone can use a spreadsheet
No need to learn a new program
No bells and whistles that you’ll never use
Keep it simple!

Copyright 2006, ICMI, Inc.
The step-by-step interactive “wizard” makes it easy to get started

Copyright 2006, ICMI, Inc.
Set Up Your Agents

Copyright 2006, ICMI, Inc.
Schedule All Agent Activities

Copyright 2006, ICMI, Inc.
Set Up Your Service Level Objective Work

Copyright 2006, ICMI, Inc.
Set Up Your Email or other Response Time Objective Work

Copyright 2006, ICMI, Inc.
See What You Need For Every Interval to Meet Service Level Objectives
539 80%
20
Interval Interval %Interval
ProjectionTalk Time
After Call Work
Staff Required on
Phones Adherence
Rate
Phone Schedule
Requirement
8:00 0.98% 5 500 30 5.3 75% 7.18:15 0.98% 5 500 30 5.3 90% 5.98:30 1.72% 9 500 30 8.2 90% 9.18:45 1.72% 9 500 30 8.2 90% 9.19:00 2.64% 14 232 109 8.0 90% 8.99:15 2.64% 14 232 109 8.0 90% 8.99:30 3.37% 18 232 109 9.8 90% 10.99:45 3.37% 18 232 109 9.8 90% 10.9
10:00 3.31% 18 232 109 9.6 70% 13.810:15 3.31% 18 232 109 9.6 70% 13.810:30 3.37% 18 232 109 9.8 75% 13.010:45 3.37% 18 232 109 9.8 80% 12.211:00 3.11% 17 232 109 9.1 85% 10.7
Daily ACD Projection:
Service Level Time (secs):Service Level % Goal:

Copyright 2006, ICMI, Inc.
See Your Run Rate For Every Interval to Handle Response Time Work
4/2/2001100 200
Interval Interval %Interval
Projection
Total Available for Processing
Average Completion
Time (seconds)
Efficiency Factor
Expected Production Based on Schedule
Projected On-Hand -
End of Interval
8:00 0.98% 2 102 600 90% 2.7 99.38:15 0.98% 2 101 600 90% 1.4 99.98:30 1.72% 3 103 600 90% 2.7 100.68:45 1.72% 3 104 600 90% 2.7 101.39:00 2.64% 5 107 600 90% 4.1 102.69:15 2.64% 5 108 600 90% 4.1 103.89:30 3.37% 7 111 600 90% 4.1 106.59:45 3.37% 7 113 600 90% 4.1 109.2
10:00 3.31% 7 116 600 90% 1.4 114.410:15 3.31% 7 121 600 90% 5.4 115.7
Daily E-mail Projection:
Date:On-Hand - Start of day
Copyright 2006, ICMI, Inc.
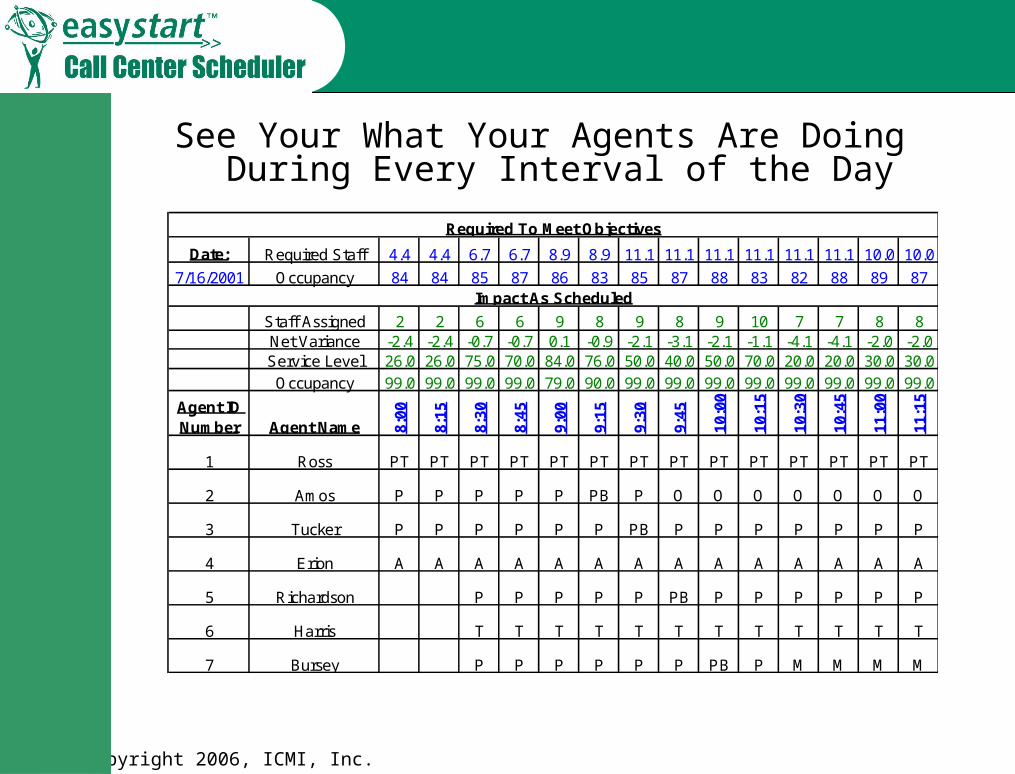
See Your What Your Agents Are Doing During Every Interval of the Day
Date: Required Staff 4.4 4.4 6.7 6.7 8.9 8.9 11.1 11.1 11.1 11.1 11.1 11.1 10.0 10.0
7/16/2001 Occupancy 84 84 85 87 86 83 85 87 88 83 82 88 89 87
Staff Assigned 2 2 6 6 9 8 9 8 9 10 7 7 8 8 Net Variance -2.4 -2.4 -0.7 -0.7 0.1 -0.9 -2.1 -3.1 -2.1 -1.1 -4.1 -4.1 -2.0 -2.0
Service Level 26.0 26.0 75.0 70.0 84.0 76.0 50.0 40.0 50.0 70.0 20.0 20.0 30.0 30.0
Occupancy 99.0 99.0 99.0 99.0 79.0 90.0 99.0 99.0 99.0 99.0 99.0 99.0 99.0 99.0
Agent ID Number Agent Name 8:
00
8:15
8:30
8:45
9:00
9:15
9:30
9:45
10:0
0
10:1
5
10:3
0
10:4
5
11:0
0
11:1
5
1 Ross PT PT PT PT PT PT PT PT PT PT PT PT PT PT
2 Amos P P P P P PB P O O O O O O O
3 Tucker P P P P P P PB P P P P P P P
4 Erion A A A A A A A A A A A A A A
5 Richardson P P P P P PB P P P P P P
6 Harris T T T T T T T T T T T T
7 Bursey P P P P P P PB P M M M M
Required To Meet Objectives
Impact As Scheduled

Copyright 2006, ICMI, Inc.
See the Big Picture Plus Interval Detail
4/2/2001 100539 139
Interval Required StaffScheduled
Staff Gap
Projected Service Level
Projected Occupancy
Rate
Projected E-Mail On-
Hand
8:00 7.1 1 -6.1 100% 100% 998:15 5.9 2 -3.9 0% 100% 1008:30 9.1 6 -3.1 1% 100% 1018:45 9.1 6 -3.1 1% 100% 1019:00 8.9 9 0.1 100% 67% 1039:15 8.9 8 -0.9 89% 75% 1049:30 10.9 9 -1.9 71% 85% 1069:45 10.9 8 -2.9 24% 96% 109
10:00 13.8 9 -4.8 3% 100% 11410:15 13.8 10 -3.8 19% 97% 11610:30 13.0 7 -6.0 2% 100% 11710:45 12.2 7 -5.2 2% 100% 11811:00 10.7 8 -2.7 30% 93% 12011:15 10.1 8 -2.1 55% 88% 121
E-mail on hand - Start of Day:E-mail on hand - End of Day:Daily ACD Projection:
Date:

Copyright 2006, ICMI, Inc.
See Where All the Time Is Going
Date: 7/16/2001
Activity Code Description
Total Hours
% of Time in Activity
P Phones 96.25 48.13%E Email 30.00 15.00%A Absent 16.00 8.00%F FMLA 8.00 4.00%
PT PTO 8.00 4.00%PB Paid Break 7.00 3.50%UB Unpaid Break 10.00 5.00%T Training 8.00 4.00%M Meeting 6.00 3.00%C Coaching 1.00 0.50%
PC PC Backup 8.00 4.00%O Other 1.75 0.88%
Total 200.00 100%
Activity Code Summary

Copyright 2006, ICMI, Inc.
Make Adjustments Ahead of Time!
See when and where the problems will be
Change schedules and see the impact
Call in reinforcements if needed
Schedule off-phone activities during slow times
Enjoy the benefits of planning!

Copyright 2006, ICMI, Inc.
Remember, It’s Just A Spreadsheet
Add your own calculations
Copy, paste, or link to other spreadsheets
Leverage your ExcelTM skills and knowledge
Create your own Schedule vs Actual reports and save files to analyze so you forecast better

Copyright 2006, ICMI, Inc.
Understand What to Do and Why
We’ll teach you what to do in our step-by-step User Guide
We’ll teach you the concepts underlying the process, too
Learn even more by reading Call Center Forecasting and Scheduling: The Best of Call Center Management Review
Included FREE with your purchase!

Copyright 2006, ICMI, Inc.
And The Price Is Right!
It won’t bust your budget . . . it might not even require a cost-benefit analysis!
Only $499!!!!
Satisfaction Guaranteed or your money back