copyright 2004 david j. lilja1 what do all of these means mean? indices of central tendency sample...
TRANSCRIPT
Copyright 2004 David J. Lilja 1
What Do All of These Means Mean?
Indices of central tendency Sample mean Median Mode
Other means Arithmetic Harmonic Geometric
Quantifying variability
Copyright 2004 David J. Lilja 2
Why mean values?
Desire to reduce performance to a single number Makes comparisons easy
Mine Apple is faster than your Cray! People like a measure of “typical” performance
Leads to all sorts of crazy ways for summarizing data X = f(10 parts A, 25 parts B, 13 parts C, …) X then represents “typical” performance?!
Copyright 2004 David J. Lilja 3
The Problem
Performance is multidimensional CPU time I/O time Network time Interactions of various components Etc, etc
Copyright 2004 David J. Lilja 4
The Problem
Systems are often specialized Performs great on application type X Performs lousy on anything else
Potentially a wide range of execution times on one system using different benchmark programs
Copyright 2004 David J. Lilja 5
The Problem
Nevertheless, people still want a single number answer!
How to (correctly) summarize a wide range of measurements with a single value?
Copyright 2004 David J. Lilja 6
Index of Central Tendency
Tries to capture “center” of a distribution of values
Use this “center” to summarize overall behavior
Not recommended for real information, but … You will be pressured to provide mean values
Understand how to choose the best type for the circumstance
Be able to detect bad results from others
Copyright 2004 David J. Lilja 7
Indices of Central Tendency
Sample mean Common “average”
Sample median ½ of the values are above, ½ below
Mode Most common
Copyright 2004 David J. Lilja 8
Indices of Central Tendency
“Sample” implies that Values are measured from a random process on
discrete random variable X Value computed is only an approximation of
true mean value of underlying process True mean value cannot actually be known
Would require infinite number of measurements
Copyright 2004 David J. Lilja 9
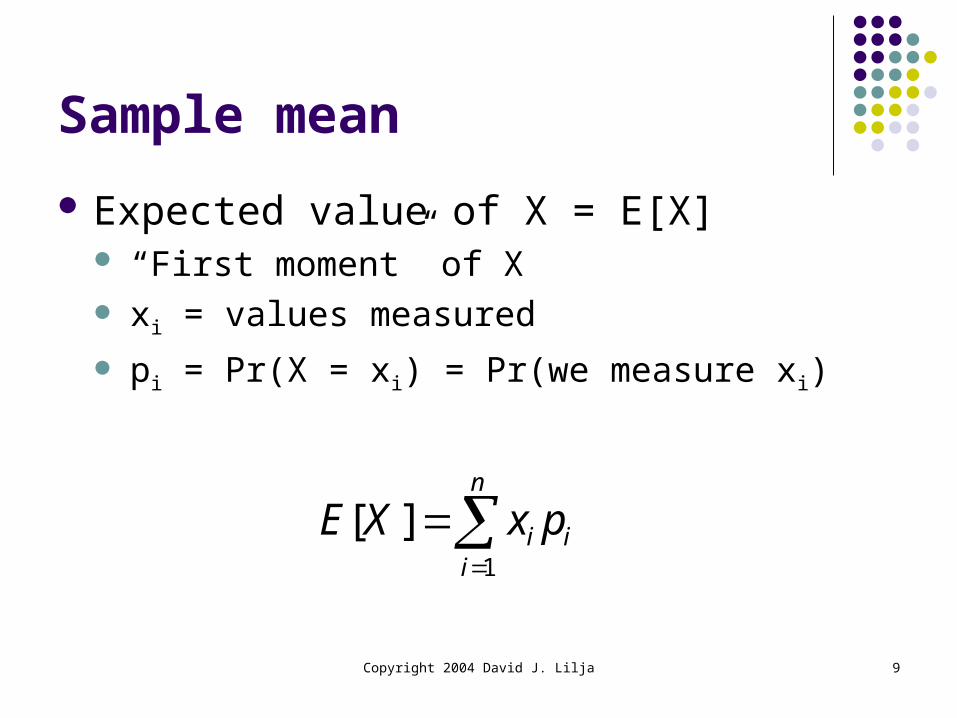
Sample mean
Expected value of X = E[X] “First moment” of X xi = values measured
pi = Pr(X = xi) = Pr(we measure xi)
n
iii pxXE
1
][
Copyright 2004 David J. Lilja 10
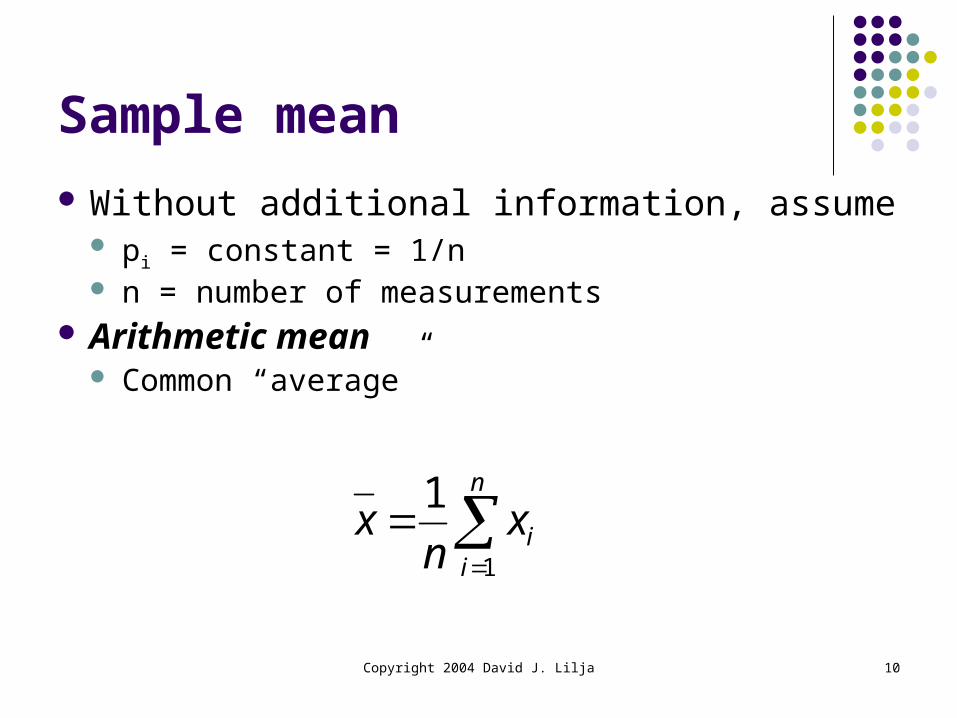
Sample mean
Without additional information, assume pi = constant = 1/n n = number of measurements
Arithmetic mean Common “average”
n
iixn
x1
1
Copyright 2004 David J. Lilja 11
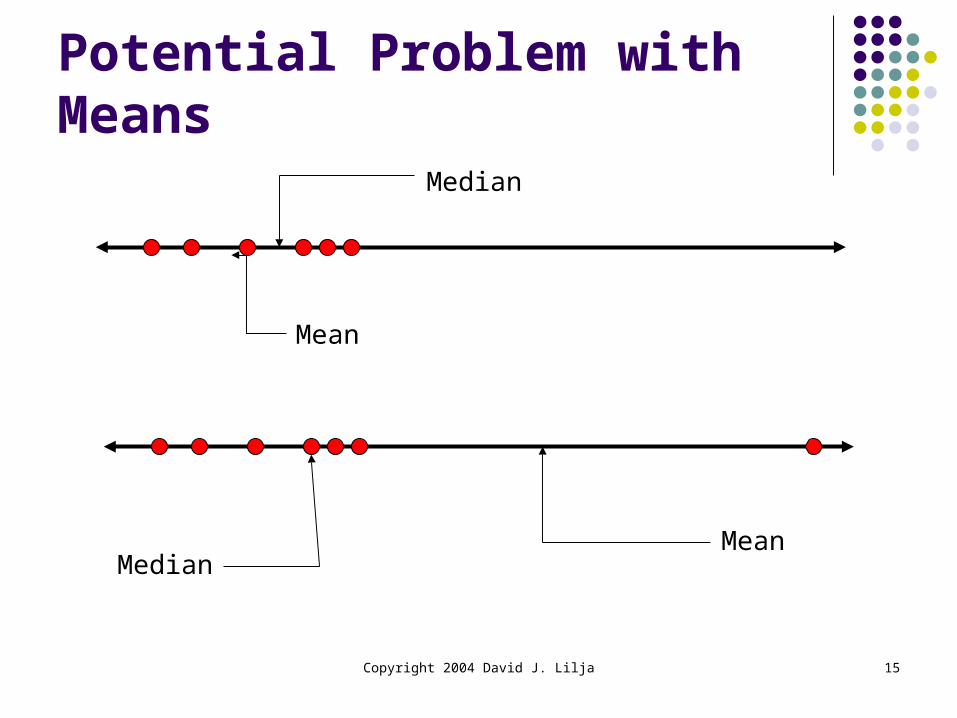
Potential Problem with Means
Sample mean gives equal weight to all measurements
Outliers can have a large influence on the computed mean value
Distorts our intuition about the central tendency of the measured values
Copyright 2004 David J. Lilja 12
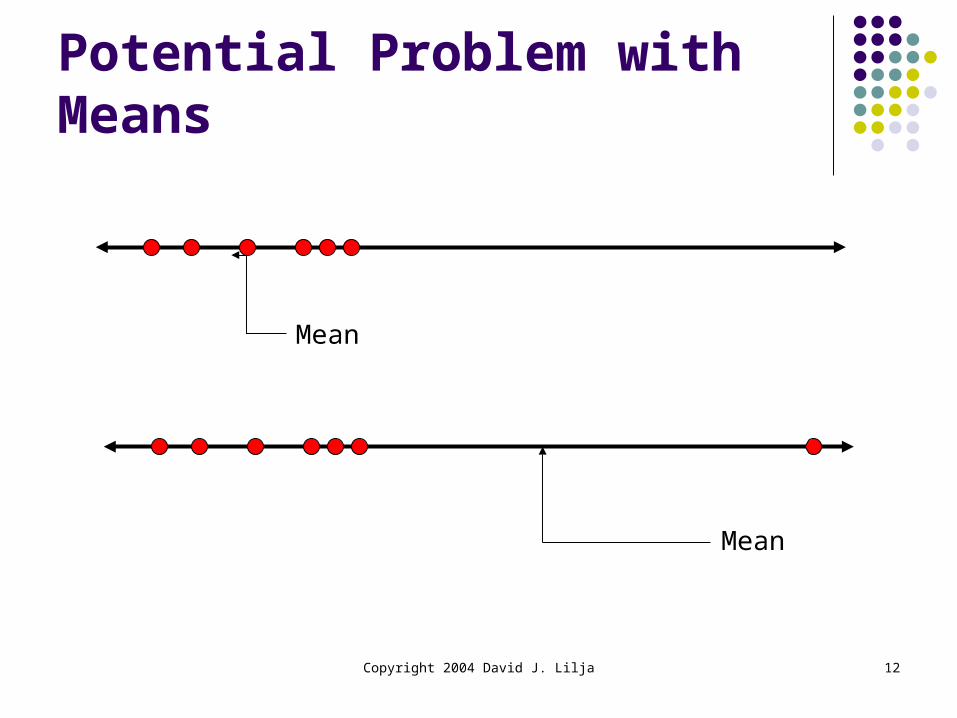
Potential Problem with Means
Mean
Mean
Copyright 2004 David J. Lilja 13
Median
Index of central tendency with ½ of the values larger, ½ smaller
Sort n measurements If n is odd
Median = middle value Else, median = mean of two middle values
Reduces skewing effect of outliers on the value of the index
Copyright 2004 David J. Lilja 14
Example
Measured values: 10, 20, 15, 18, 16 Mean = 15.8 Median = 16
Obtain one more measurement: 200 Mean = 46.5 Median = ½ (16 + 18) = 17
Median give more intuitive sense of central tendency
Copyright 2004 David J. Lilja 15
Potential Problem with Means
Mean
Mean
Median
Median
Copyright 2004 David J. Lilja 16
Mode
Value that occurs most often May not exist May not be unique
E.g. “bi-modal” distribution Two values occur with same frequency
Copyright 2004 David J. Lilja 17
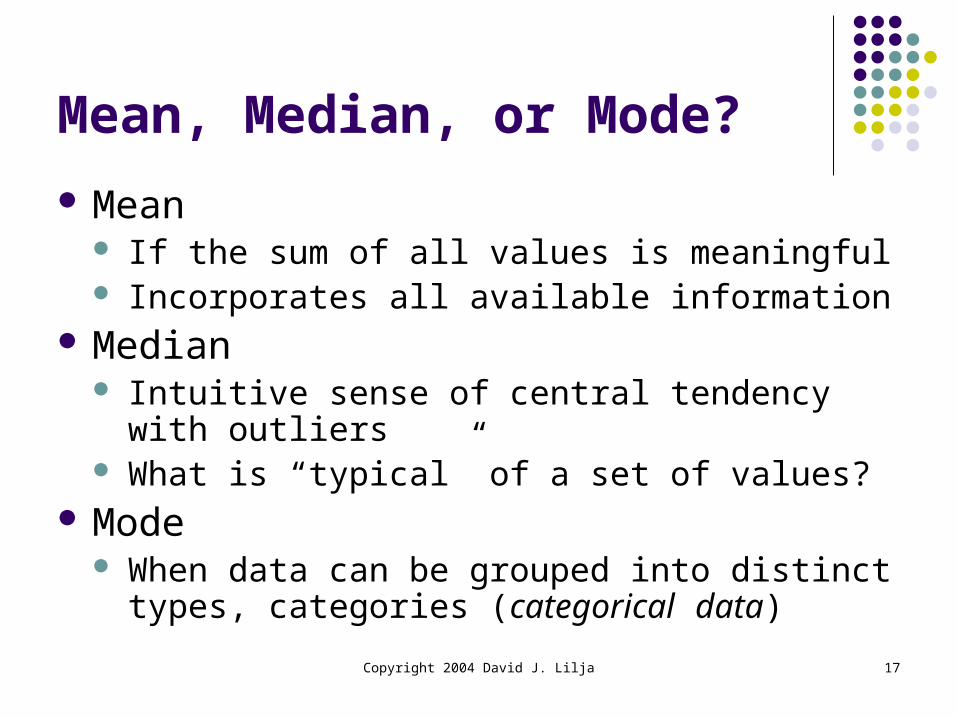
Mean, Median, or Mode?
Mean If the sum of all values is meaningful Incorporates all available information
Median Intuitive sense of central tendency with outliers What is “typical” of a set of values?
Mode When data can be grouped into distinct types,
categories (categorical data)
Copyright 2004 David J. Lilja 18
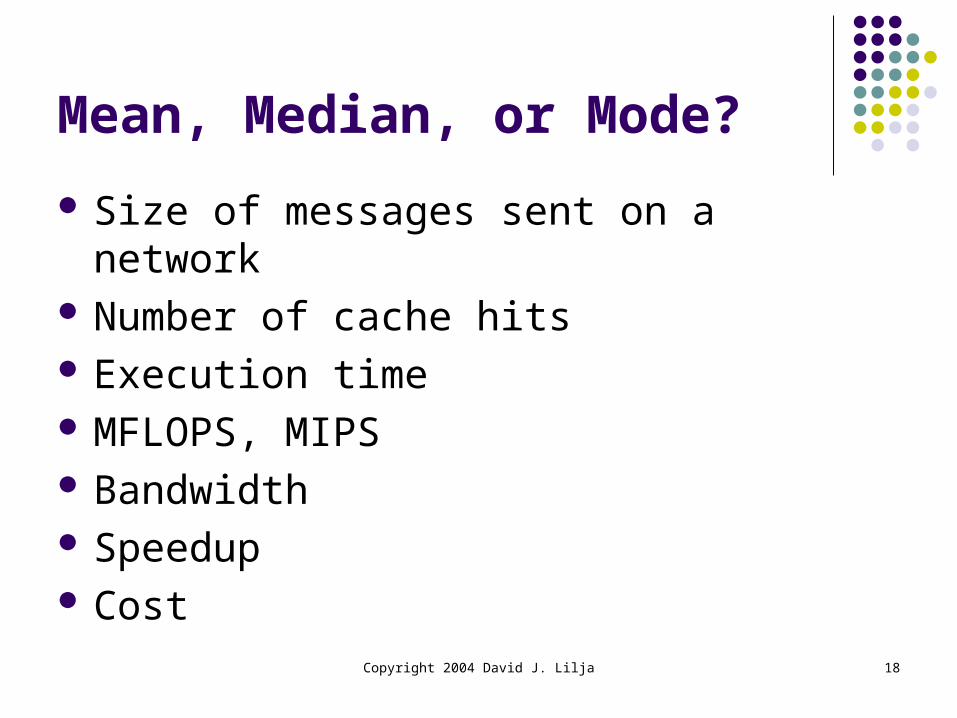
Mean, Median, or Mode?
Size of messages sent on a network Number of cache hits Execution time MFLOPS, MIPS Bandwidth Speedup Cost
Copyright 2004 David J. Lilja 19
Yet Even More Means!
Arithmetic Harmonic? Geometric? Which one should be used when?
Copyright 2004 David J. Lilja 20
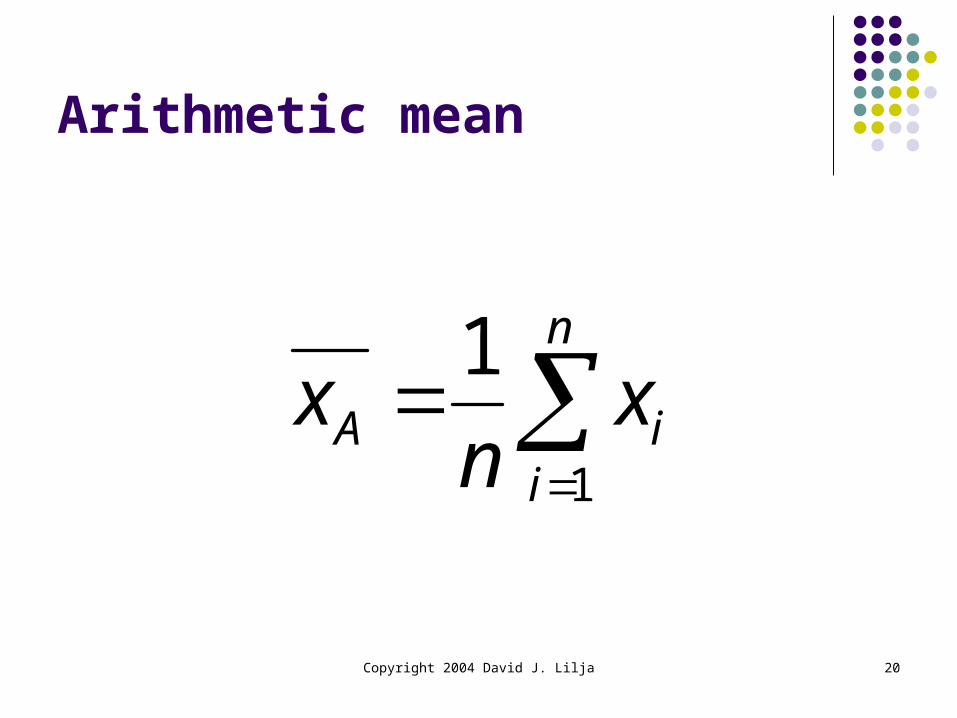
Arithmetic mean
n
iiA x
nx
1
1
Copyright 2004 David J. Lilja 21
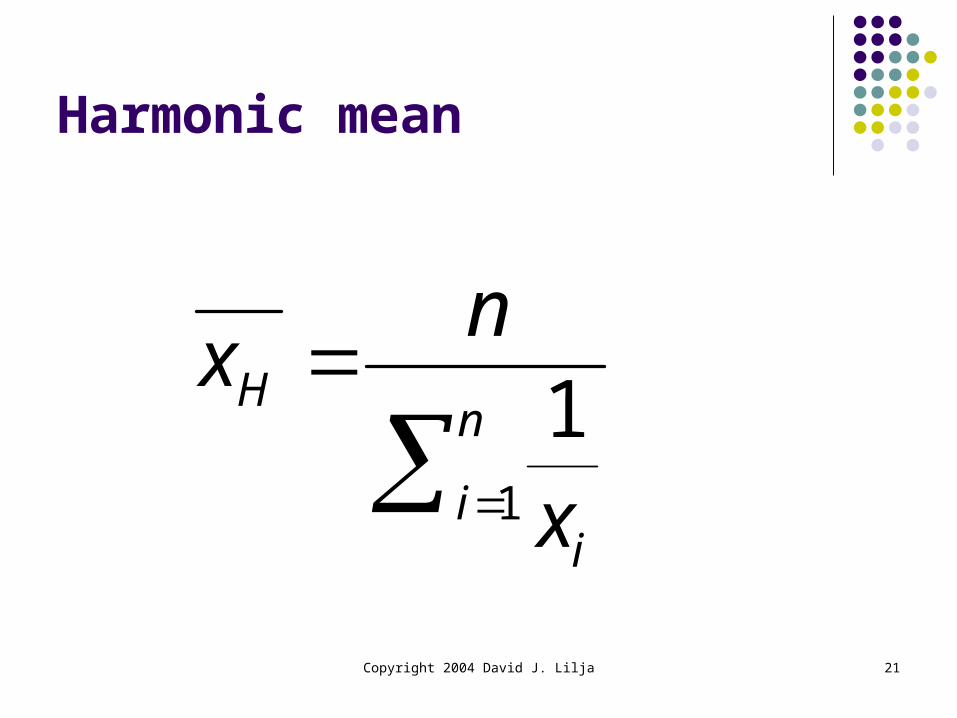
Harmonic mean
n
ii
H
x
nx
1
1
Copyright 2004 David J. Lilja 22
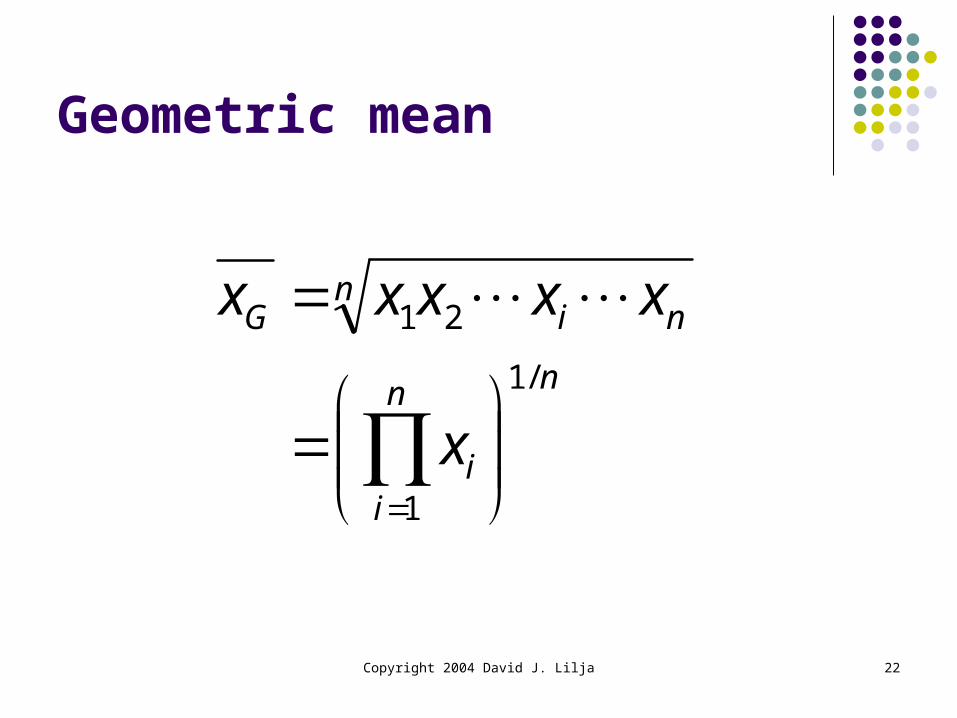
Geometric mean
nn
ii
nniG
x
xxxxx/1
1
21
Copyright 2004 David J. Lilja 23
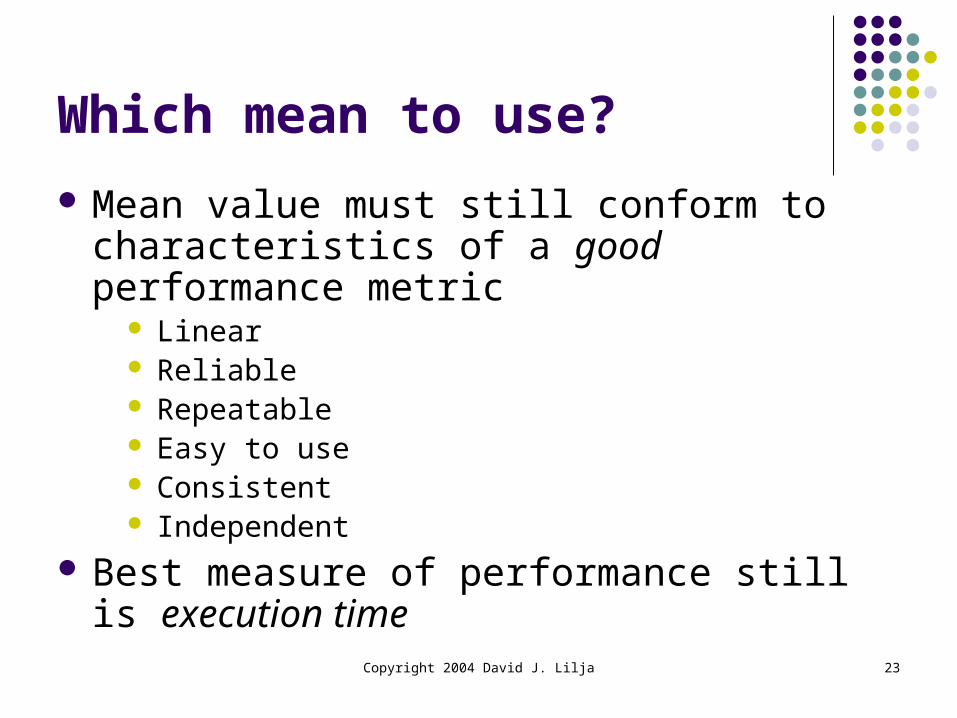
Which mean to use?
Mean value must still conform to characteristics of a good performance metric
Linear Reliable Repeatable Easy to use Consistent Independent
Best measure of performance still is execution time

Copyright 2004 David J. Lilja 24
What makes a good mean?
Time–based mean (e.g. seconds) Should be directly proportional to total weighted
time If time doubles, mean value should double
Rate–based mean (e.g. operations/sec) Should be inversely proportional to total weighted
time If time doubles, mean value should reduce
by half Which means satisfy these criteria?
Copyright 2004 David J. Lilja 25
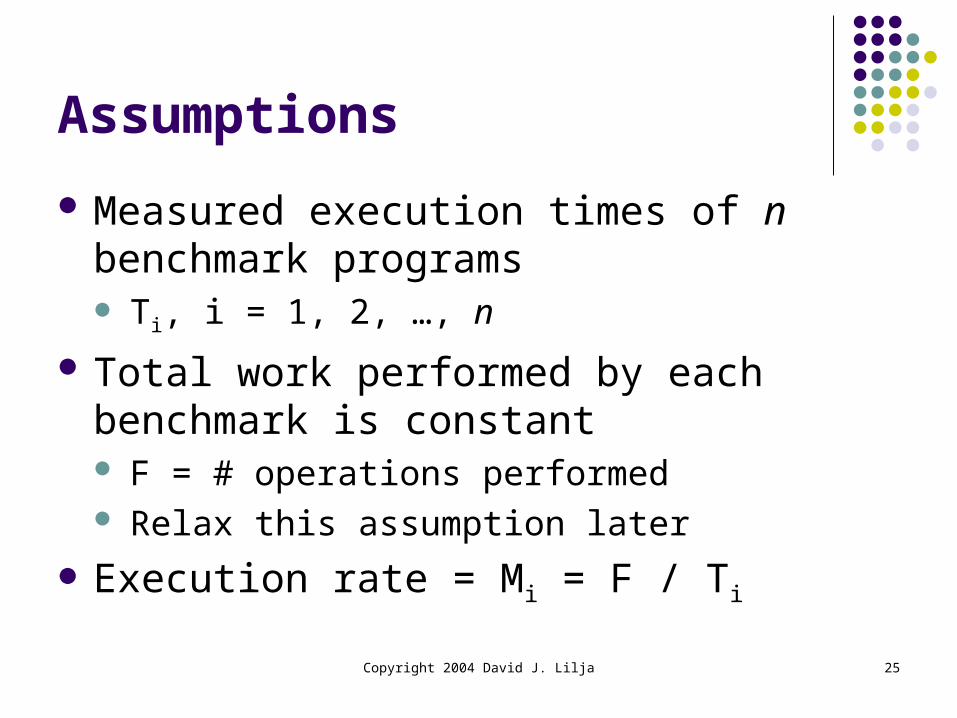
Assumptions
Measured execution times of n benchmark programs Ti, i = 1, 2, …, n
Total work performed by each benchmark is constant F = # operations performed Relax this assumption later
Execution rate = Mi = F / Ti
Copyright 2004 David J. Lilja 26
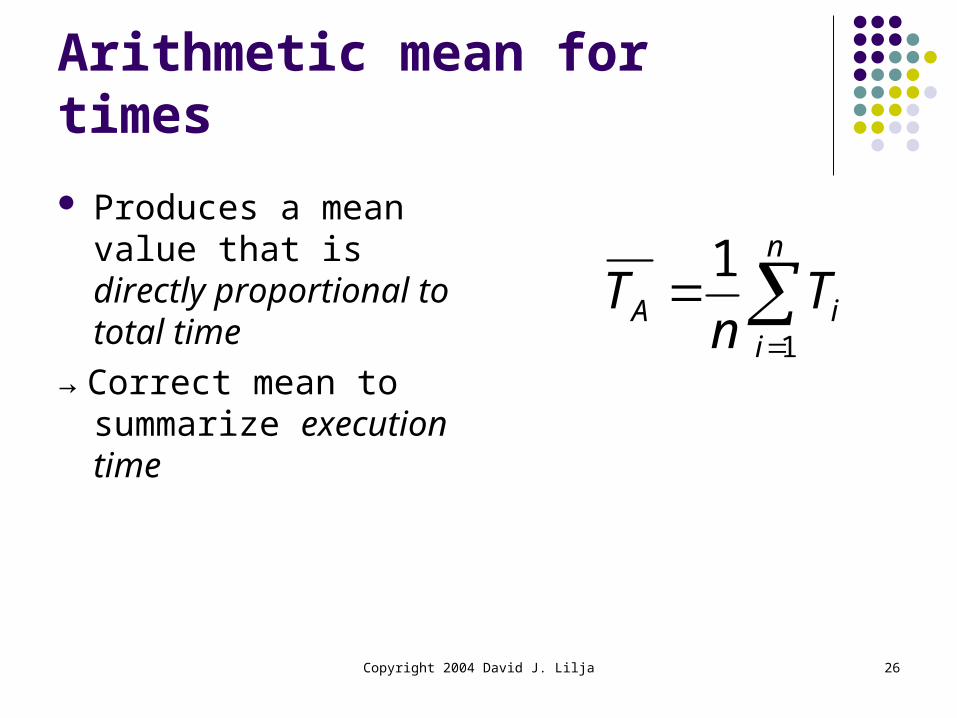
Arithmetic mean for times
Produces a mean value that is directly proportional to total time
→ Correct mean to summarize execution time
n
iiA T
nT
1
1
Copyright 2004 David J. Lilja 27
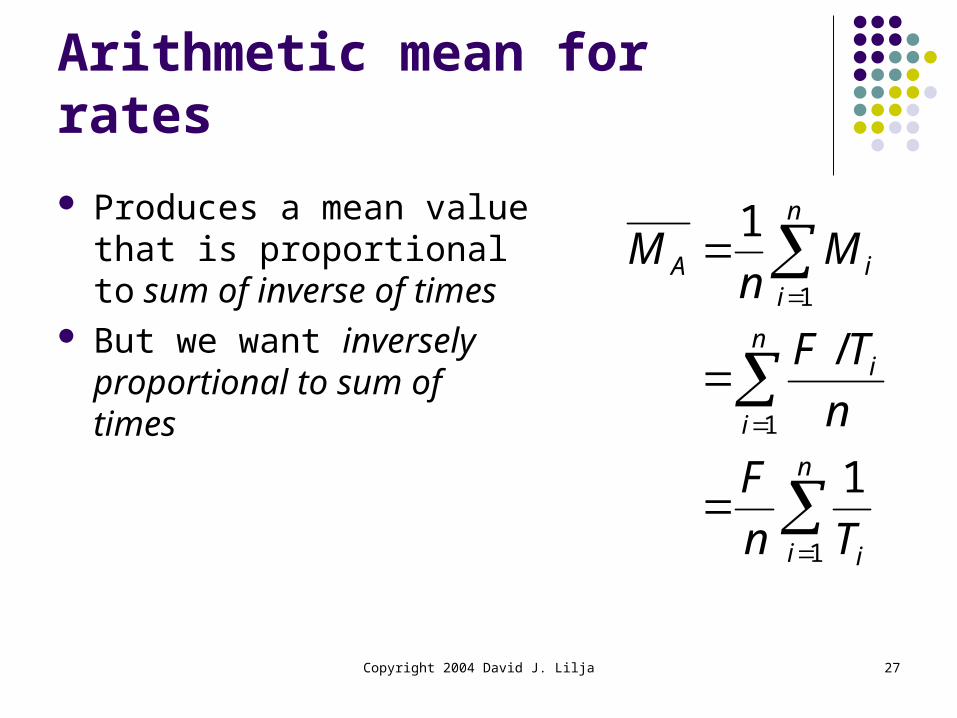
Arithmetic mean for rates
Produces a mean value that is proportional to sum of inverse of times
But we want inversely proportional to sum of times
n
i i
n
i
i
n
iiA
Tn
F
n
TF
Mn
M
1
1
1
1
/
1
Copyright 2004 David J. Lilja 28
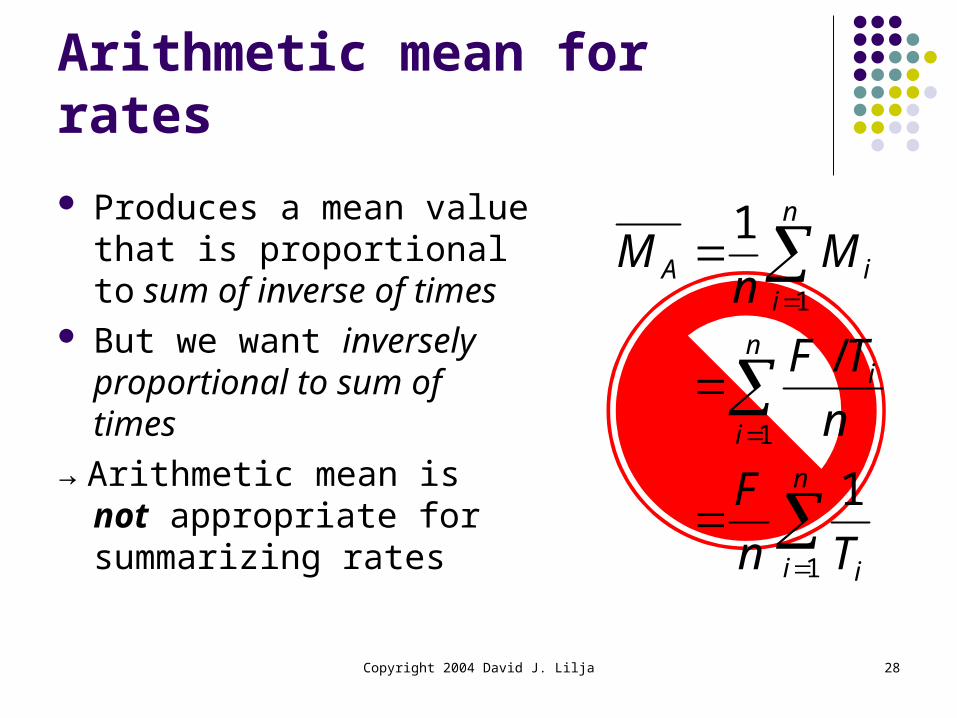
Arithmetic mean for rates
Produces a mean value that is proportional to sum of inverse of times
But we want inversely proportional to sum of times
→ Arithmetic mean is not appropriate for summarizing rates
n
i i
n
i
i
n
iiA
Tn
F
n
TF
Mn
M
1
1
1
1
/
1
Copyright 2004 David J. Lilja 29
n
ii
H
T
nT
1
1
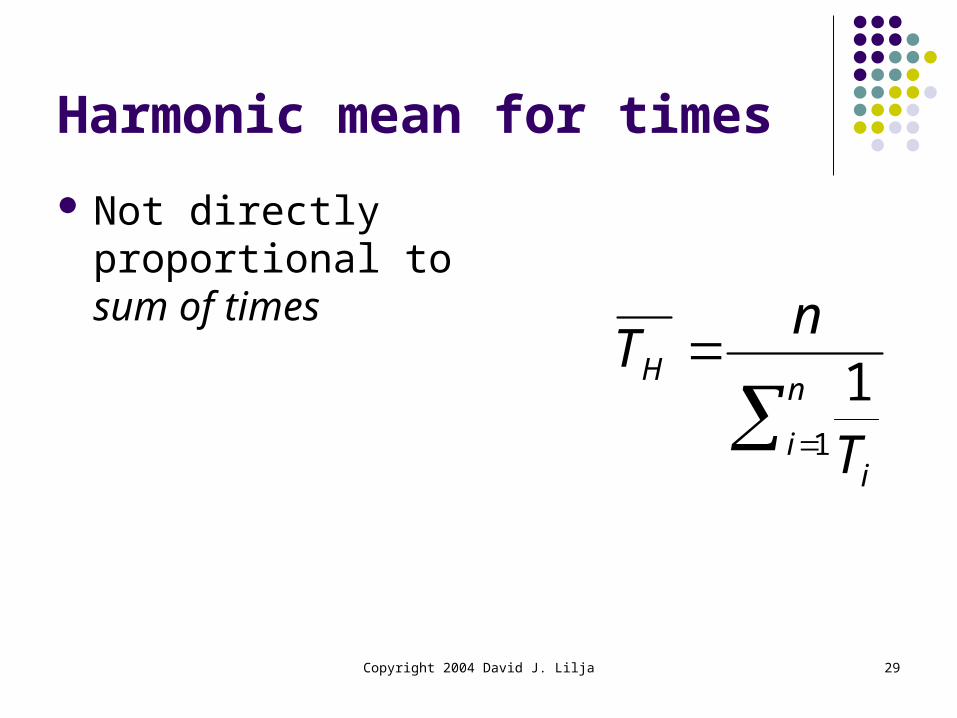
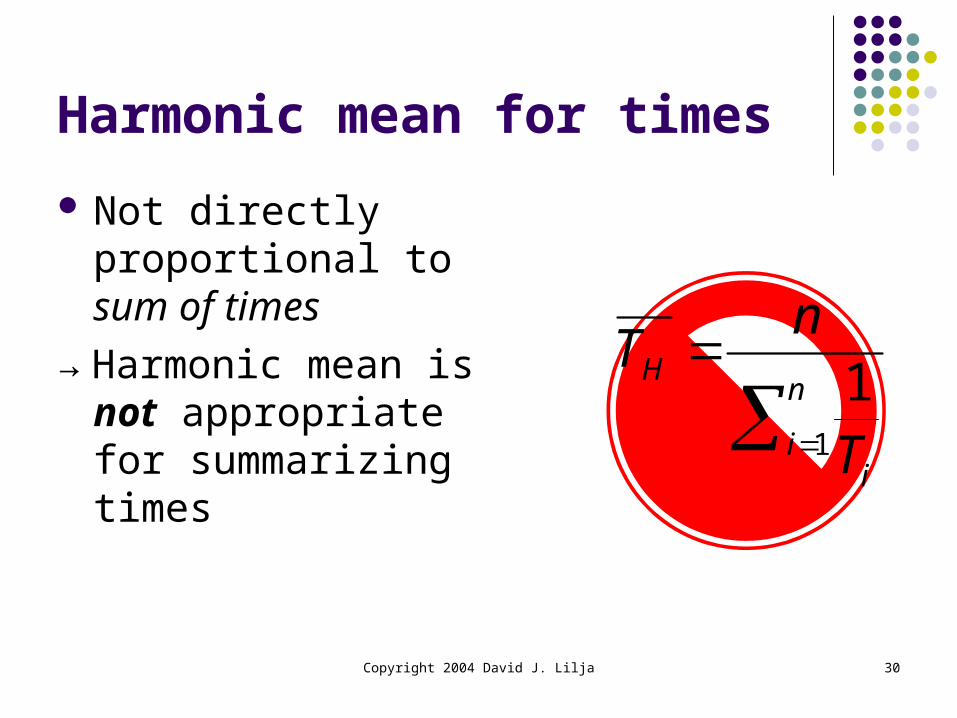
Harmonic mean for times
Not directly proportional to sum of times
Copyright 2004 David J. Lilja 30
Harmonic mean for times
Not directly proportional to sum of times
→ Harmonic mean is not appropriate for summarizing times
n
ii
H
T
nT
1
1
Copyright 2004 David J. Lilja 31
n
i i
n
ii
n
ii
H
T
FnFT
n
M
nM
1
1
1
1
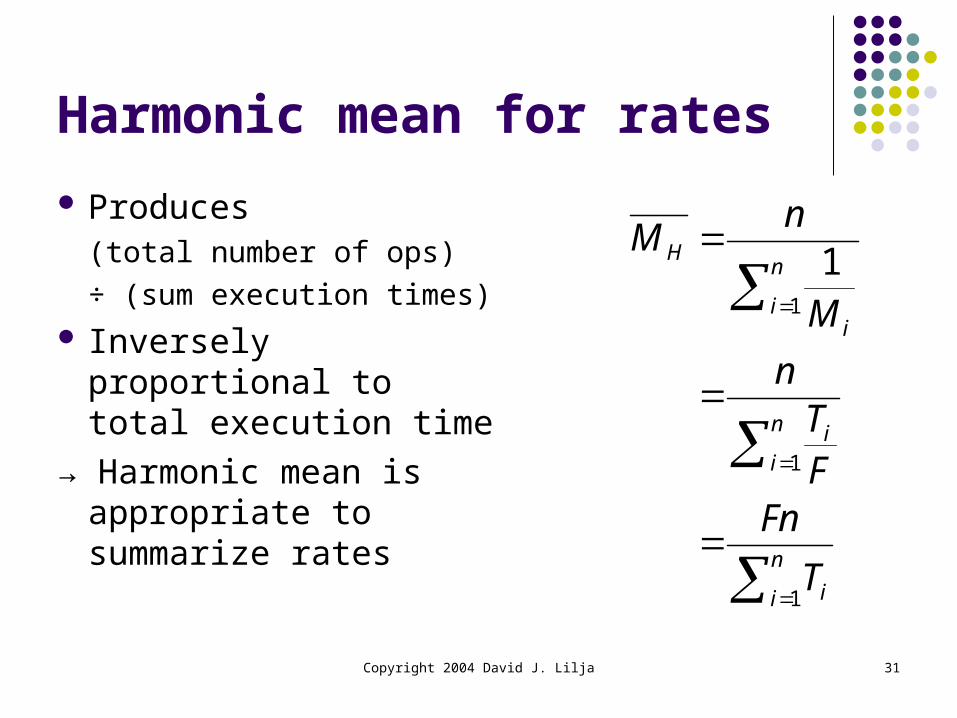
Harmonic mean for rates
Produces (total number of ops)
÷ (sum execution times) Inversely proportional
to total execution time
→ Harmonic mean is appropriate to summarize rates
Copyright 2004 David J. Lilja 32
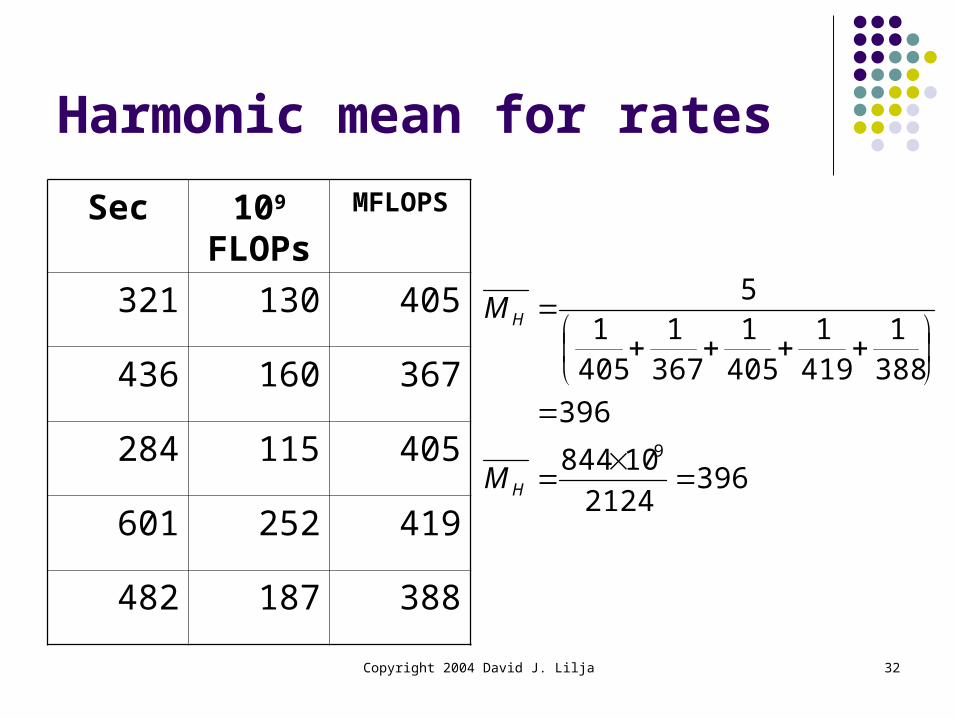
Harmonic mean for rates
Sec 109 FLOPs
MFLOPS
321 130 405
436 160 367
284 115 405
601 252 419
482 187 388
3962124
10844
396
3881
4191
4051
3671
4051
5
9
H
H
M
M
Copyright 2004 David J. Lilja 33
Geometric mean
Correct mean for averaging normalized values, right?
Used to compute SPECmark Good when averaging measurements with
wide range of values, right? Maintains consistent relationships when
comparing normalized values Independent of basis used to normalize
Copyright 2004 David J. Lilja 34
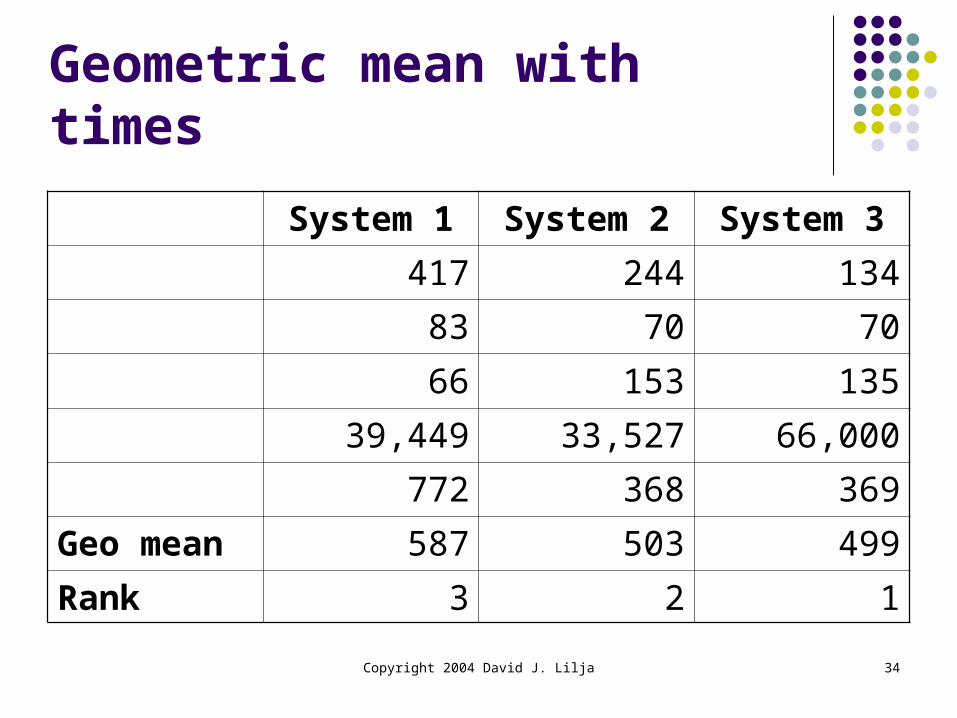
Geometric mean with times
System 1 System 2 System 3
417 244 134
83 70 70
66 153 135
39,449 33,527 66,000
772 368 369
Geo mean 587 503 499
Rank 3 2 1
Copyright 2004 David J. Lilja 35
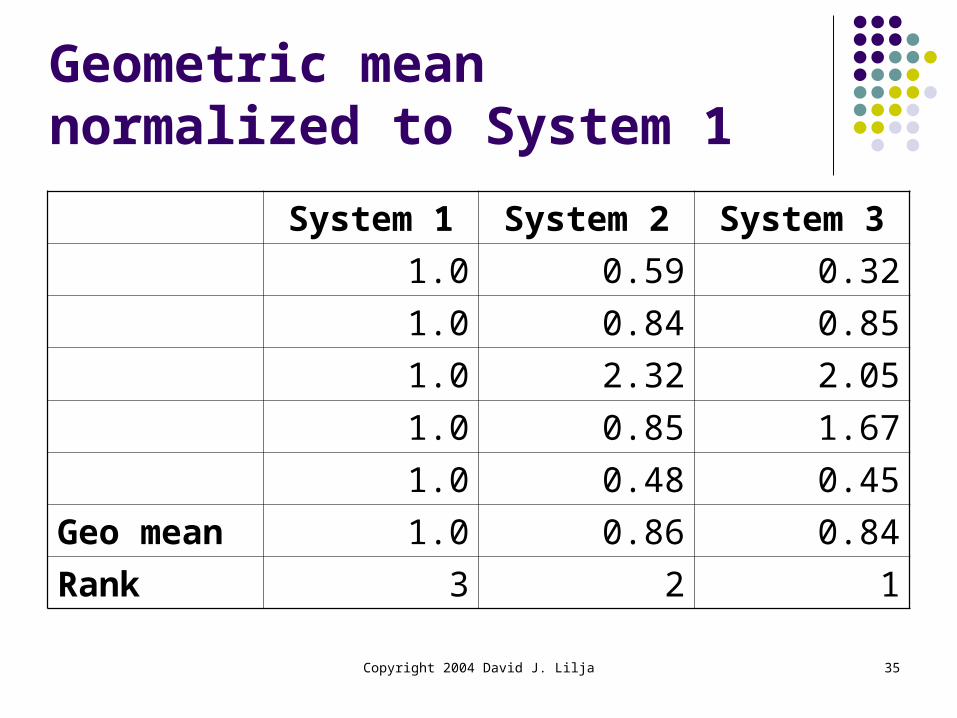
Geometric mean normalized to System 1
System 1 System 2 System 3
1.0 0.59 0.32
1.0 0.84 0.85
1.0 2.32 2.05
1.0 0.85 1.67
1.0 0.48 0.45
Geo mean 1.0 0.86 0.84
Rank 3 2 1
Copyright 2004 David J. Lilja 36
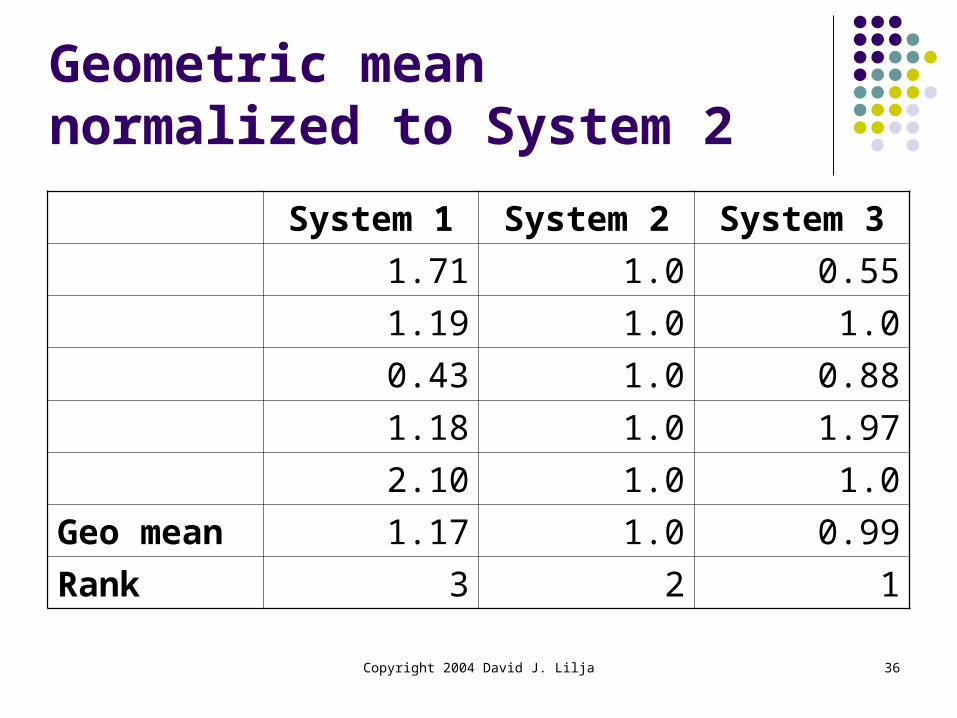
Geometric mean normalized to System 2
System 1 System 2 System 3
1.71 1.0 0.55
1.19 1.0 1.0
0.43 1.0 0.88
1.18 1.0 1.97
2.10 1.0 1.0
Geo mean 1.17 1.0 0.99
Rank 3 2 1
Copyright 2004 David J. Lilja 37
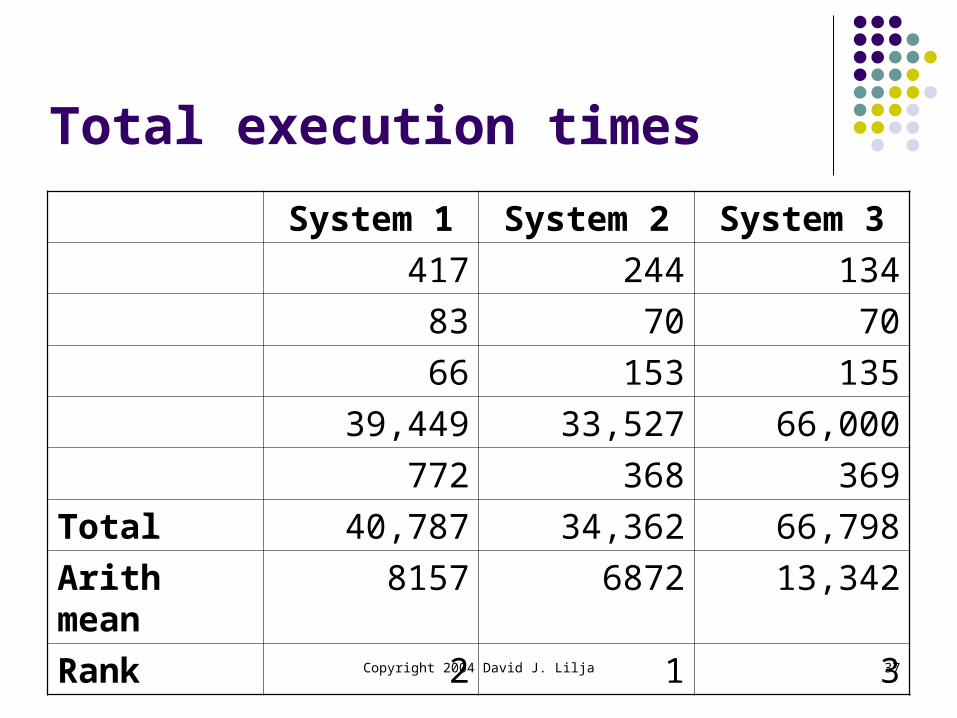
Total execution times
System 1 System 2 System 3
417 244 134
83 70 70
66 153 135
39,449 33,527 66,000
772 368 369
Total 40,787 34,362 66,798
Arith mean 8157 6872 13,342
Rank 2 1 3
Copyright 2004 David J. Lilja 38
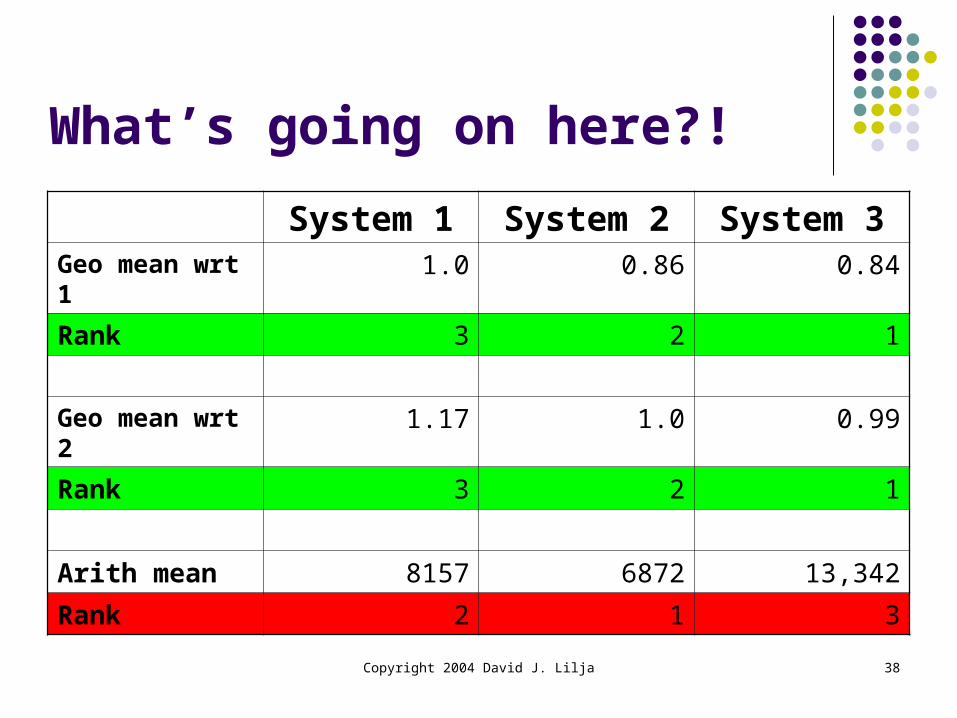
What’s going on here?!
System 1 System 2 System 3Geo mean wrt 1 1.0 0.86 0.84
Rank 3 2 1
Geo mean wrt 2 1.17 1.0 0.99
Rank 3 2 1
Arith mean 8157 6872 13,342
Rank 2 1 3
Copyright 2004 David J. Lilja 39
nn
iiG TT
/1
1
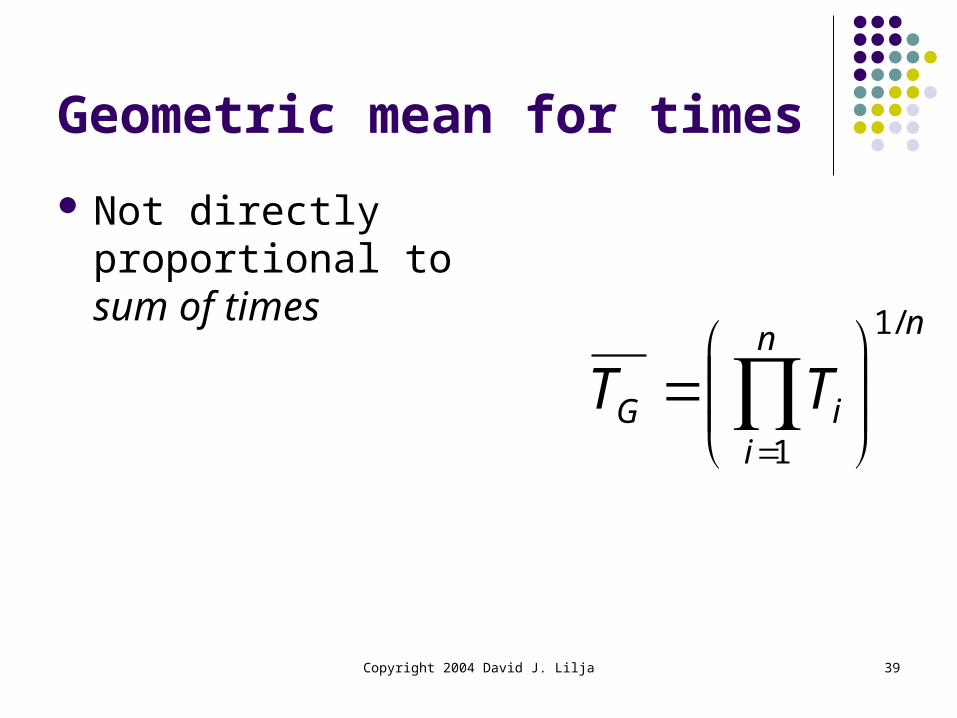
Geometric mean for times
Not directly proportional to sum of times
Copyright 2004 David J. Lilja 40
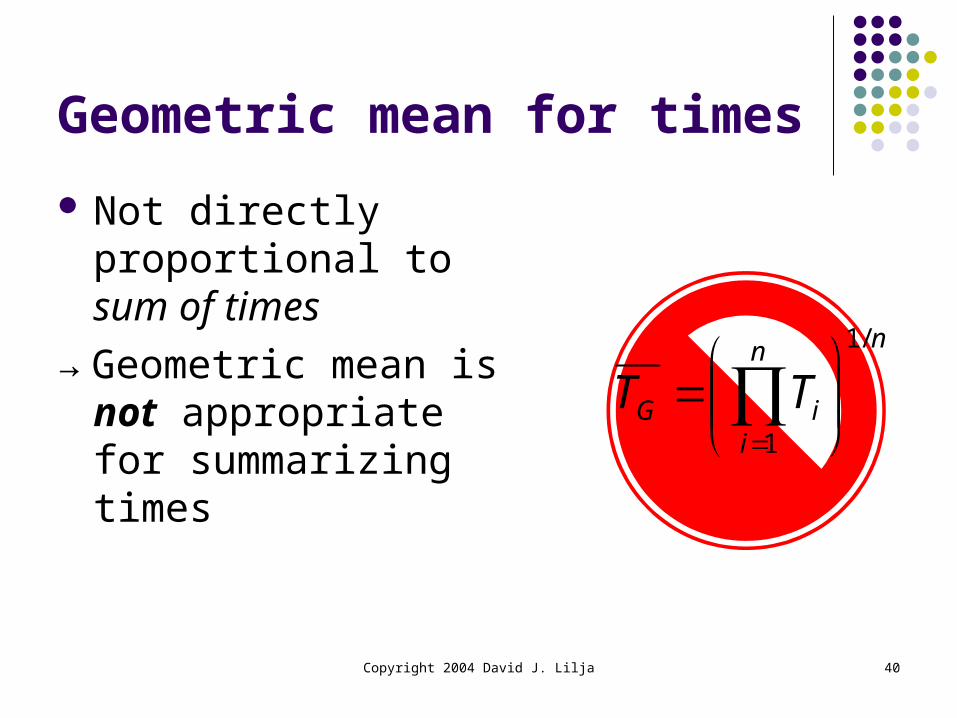
Geometric mean for times
Not directly proportional to sum of times
→ Geometric mean is not appropriate for summarizing times
nn
iiG TT
/1
1
Copyright 2004 David J. Lilja 41
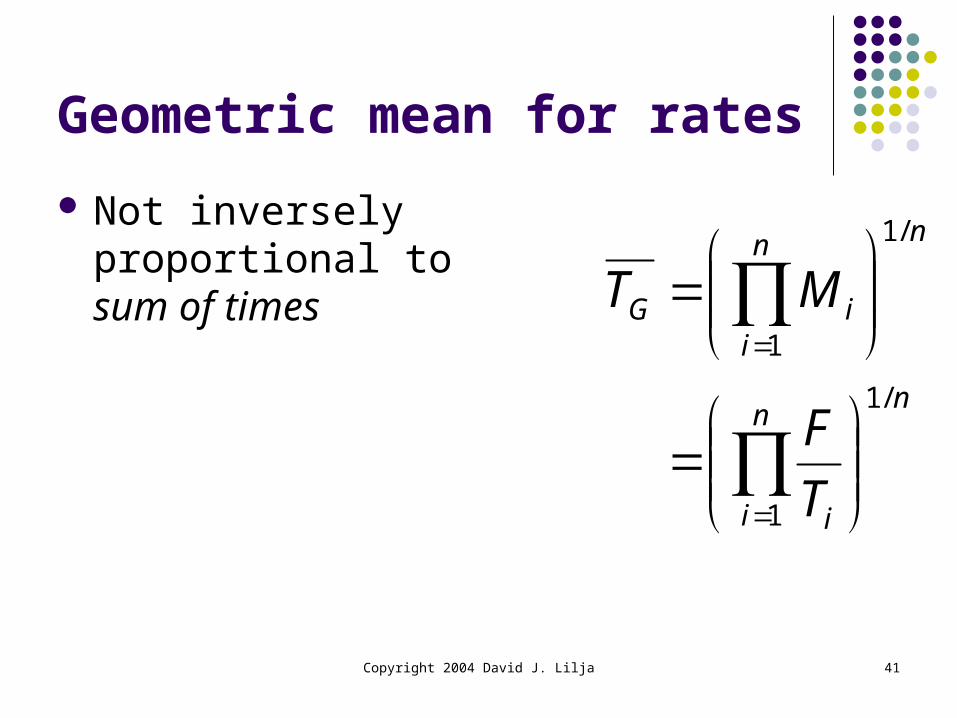
nn
i i
nn
iiG
T
F
MT
/1
1
/1
1
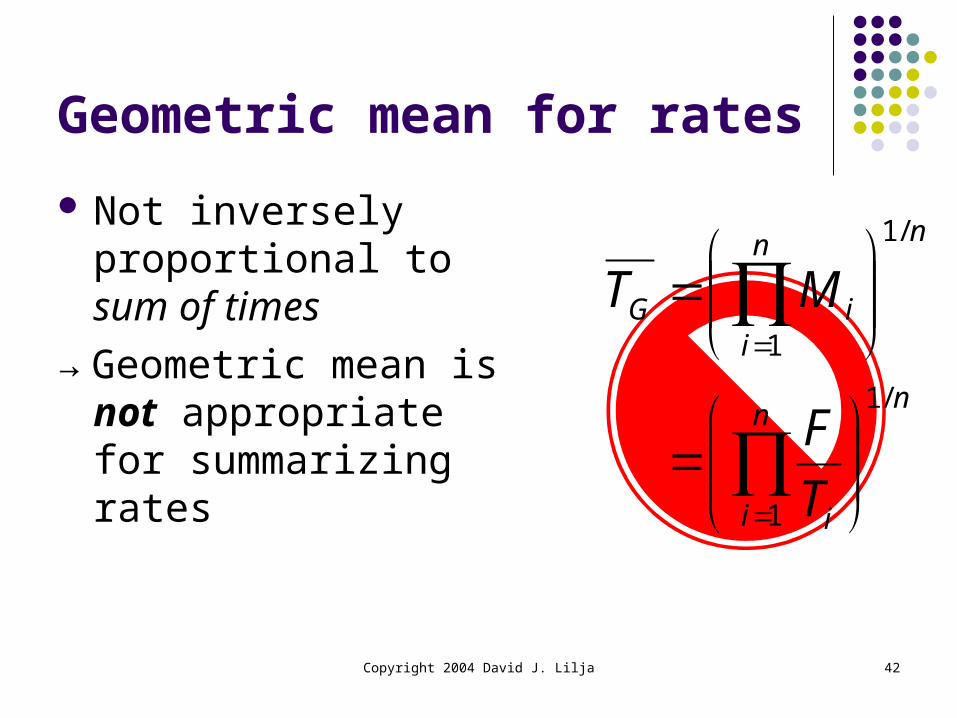
Geometric mean for rates
Not inversely proportional to sum of times
Copyright 2004 David J. Lilja 42
Geometric mean for rates
Not inversely proportional to sum of times
→ Geometric mean is not appropriate for summarizing rates
nn
i i
nn
iiG
T
F
MT
/1
1
/1
1
Copyright 2004 David J. Lilja 43
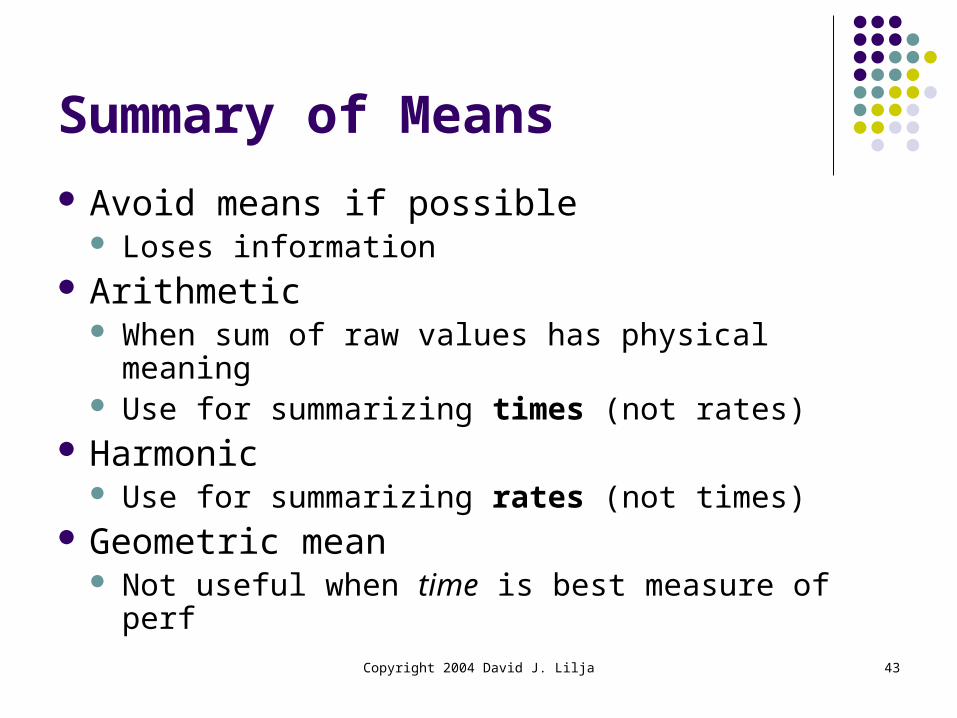
Summary of Means
Avoid means if possible Loses information
Arithmetic When sum of raw values has physical meaning Use for summarizing times (not rates)
Harmonic Use for summarizing rates (not times)
Geometric mean Not useful when time is best measure of perf
Copyright 2004 David J. Lilja 44
Geometric mean
Does provide consistent rankings Independent of basis for normalization
But can be consistently wrong! Value can be computed
But has no physical meaning
Copyright 2004 David J. Lilja 45
Normalization
Averaging normalized values doesn’t make sense mathematically Gives a number But the number has no physical meaning
First compute the mean Then normalize
Copyright 2004 David J. Lilja 46
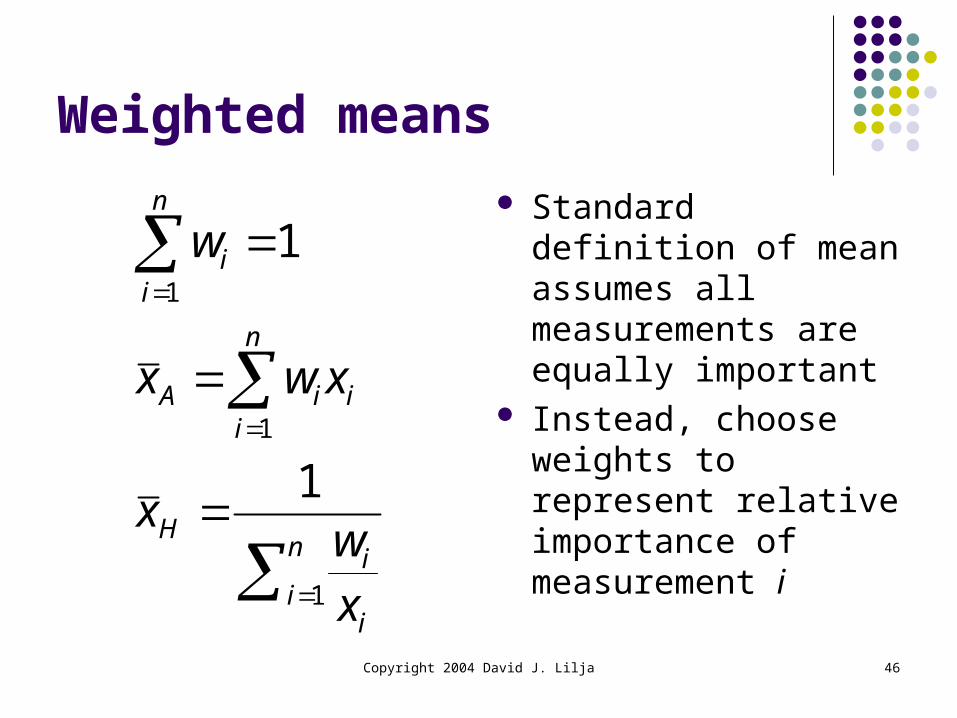
Weighted means
n
ii
iH
n
iiiA
n
ii
x
wx
xwx
w
1
1
1
1
1 Standard definition of
mean assumes all measurements are equally important
Instead, choose weights to represent relative importance of measurement i
Copyright 2004 David J. Lilja 47
Quantifying variability
Means hide information about variability How “spread out” are the values? How much spread relative to the mean? What is the shape of the distribution of
values?
Copyright 2004 David J. Lilja 48
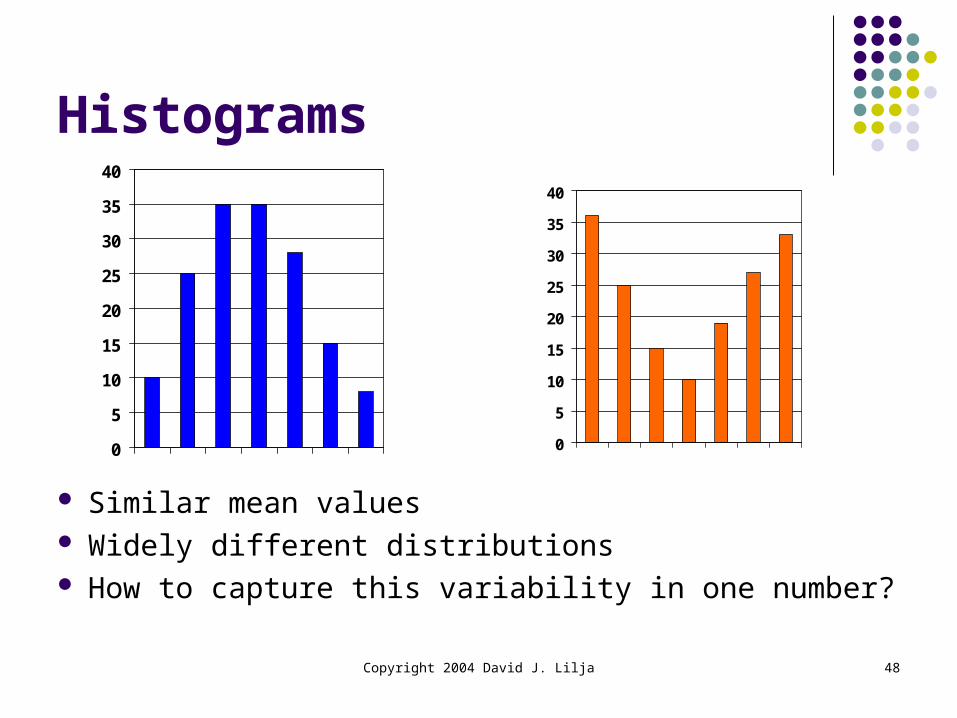
Histograms
0
5
10
15
20
25
30
35
40
0
5
10
15
20
25
30
35
40
Similar mean values Widely different distributions How to capture this variability in one number?
Copyright 2004 David J. Lilja 49
Index of Dispersion
Quantifies how “spread out” measurements are
Range (max value) – (min value)
Maximum distance from the mean Max of | xi – mean |
Neither efficiently incorporates all available information
Copyright 2004 David J. Lilja 50
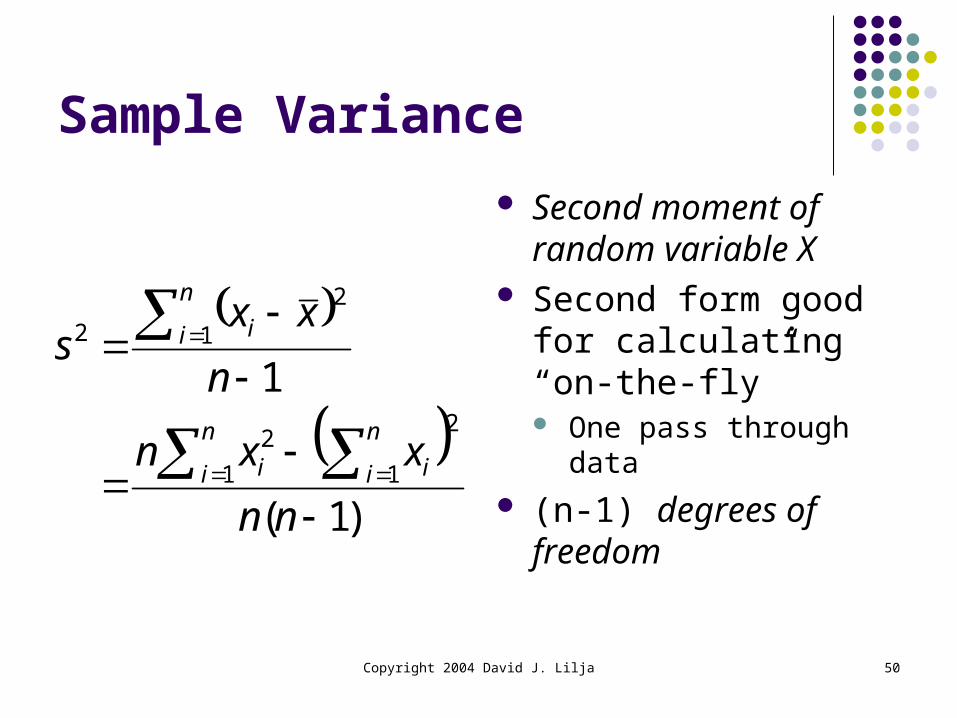
Sample Variance
)1(
1
1
2
1
2
1
2
2
nn
xxn
n
xxs
n
i
n
i ii
n
i i
Second moment of random variable X
Second form good for calculating “on-the-fly” One pass through data
(n-1) degrees of freedom
Copyright 2004 David J. Lilja 51
Sample Variance
Gives “units-squared” Hard to compare to mean Use standard deviation, s
s = square root of variance Units = same as mean
Copyright 2004 David J. Lilja 52
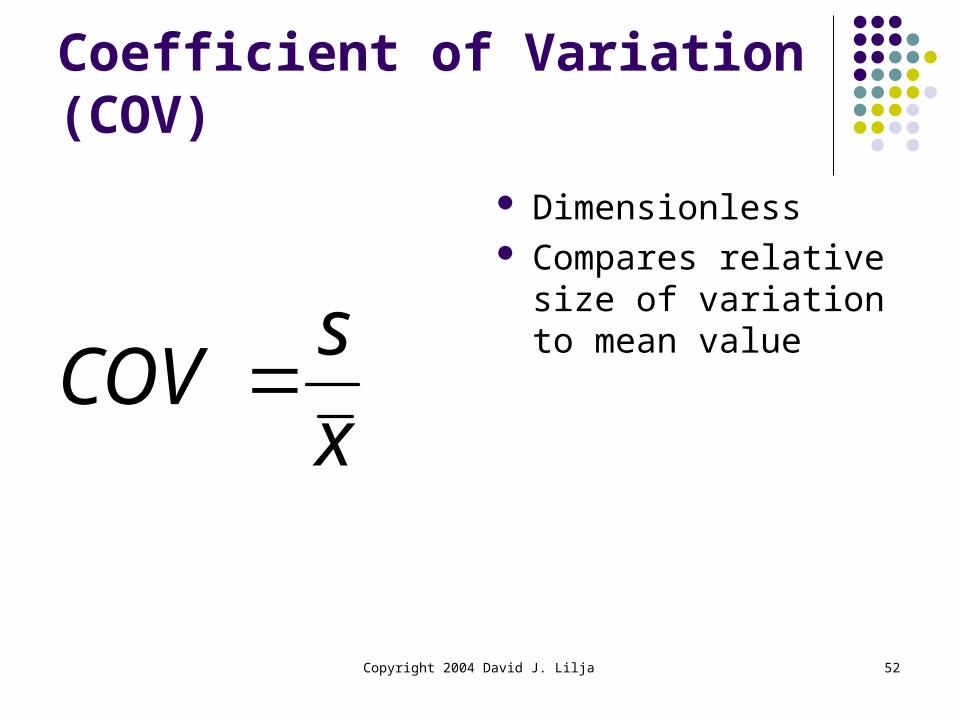
Coefficient of Variation (COV)
x
sCOV
Dimensionless Compares relative size
of variation to mean value
Copyright 2004 David J. Lilja 53
Important Points
“Average” metrics are dangerous Hides multidimensional aspects of performance Hides variability in group of measurements
But often forced to report a “typical” value Know what others are telling you!
Copyright 2004 David J. Lilja 54
Important Points
Sample mean First moment of random process Run-of-the-mill average
Sample median Middle value
Sample mode Most common value
Copyright 2004 David J. Lilja 55
Important Points
Arithmetic mean Use to summarize times
Harmonic mean Use to summarize rates
Geometric mean Don’t use for times or rates
Variance, standard deviation, coefficient of variation Quantify variability