copy number variation of ampliconic genes across major ... · these gene families are expressed...
TRANSCRIPT

Copy number variation of ampliconic genes across major human Y haplogroups
Danling Ye†, Arslan Zaidi †, Marta Tomaszkiewicz†, Corey Liebowitz,
Mark D. Shriver, and Kateryna D. Makova*
†These authors have contributed equally
* Author for Correspondence: Kateryna D. Makova, Department of Biology, The PennsylvaniaState University, University Park, USA, [email protected]
1
.CC-BY-NC-ND 4.0 International licenseIt is made available under a was not peer-reviewed) is the author/funder, who has granted bioRxiv a license to display the preprint in perpetuity.
The copyright holder for this preprint (which. http://dx.doi.org/10.1101/230342doi: bioRxiv preprint first posted online Dec. 7, 2017;

Abstract
Due to its highly repetitive nature, the human male-specific Y chromosome remains
understudied. It is important to investigate variation on the Y chromosome to understand its
evolution and contribution to phenotypic variation, including infertility. Approximately 20% of the
human Y chromosome consists of ampliconic regions which include nine multi-copy gene
families. These gene families are expressed exclusively in testes and usually implicated in
spermatogenesis. Here, to gain a better understanding of the role of the Y chromosome in
human evolution and in determining sexually dimorphic traits, we studied ampliconic gene copy
number variation in 100 males representing ten major Y haplogroups world-wide. Copy number
was estimated with droplet digital PCR. In contrast to low nucleotide diversity observed on the Y
in previous studies, here we show that ampliconic gene copy number diversity is very high. A
total of 98 copy-number-based haplotypes were observed among 100 individuals, and
haplotypes were sometimes shared by males from very different haplogroups, suggesting
homoplasies. The resulting haplotypes did not cluster according to major Y haplogroups.
Overall, only three gene families (DAZ, RBMY, and TSPY) showed significant differences in
copy number among major Y haplogroups, and the haplogroup of an individual could not be
predicted based on his ampliconic gene copy numbers. Our results suggest rapid evolution of
ampliconic gene copy numbers on the human Y. Finally, we tested whether ampliconic gene
copy number variation is correlated with variation in height and facial masculinity/femininity, but
found no significant associations.
2
.CC-BY-NC-ND 4.0 International licenseIt is made available under a was not peer-reviewed) is the author/funder, who has granted bioRxiv a license to display the preprint in perpetuity.
The copyright holder for this preprint (which. http://dx.doi.org/10.1101/230342doi: bioRxiv preprint first posted online Dec. 7, 2017;

Introduction Studying the Y chromosome provides insights into sex determination, sex-specific disease risks,
and evolutionary history that cannot be determined by studying the female genome alone
(Skaletsky et al. 2003; van Oven et al. 2013). However, for the vast majority of mammalian
species, only female genomes have been sequenced and assembled. Mammalian females
have diploid sex chromosomes (XX), which allows easier sequencing and assembly of the X
chromosome compared to the highly repetitive haploid Y chromosome (Tomaszkiewicz et al.
2017).
The eutherian sex chromosomes evolved from a pair of autosomes, with the X chromosome
keeping the original autosomal size and the Y chromosome shrinking over time. The
male-specific region (MSY) constitutes approximately 95% of the length of the Y chromosome.
The MSY encompasses a mosaic of euchromatic ‒ X-degenerate, X-transposed, and
ampliconic ‒ and heterochromatic sequences. The human MSY is flanked on both sides by
pseudoautosomal regions (PARs), the only parts of the Y that recombine with the X (Skaletsky
et al. 2003).
The Y chromosome acquired the sex-determining gene, SRY, and subsequently underwent a
series of inversions that suppressed its ability to recombine with the X chromosome over most
of its length (Lahn et al. 2001). As a result, the Y chromosome has become prone to
accumulation of deleterious mutations via Muller’s ratchet, genetic hitchhiking along with
beneficial alleles, and background selection against deleterious alleles (Charlesworth and
Charlesworth 2000; Filatov et al. 2000; Bachtrog 2008; Bachtrog 2013). The Y chromosome is
present only in males and is haploid. Therefore, its effective population size is 25% that of
autosomes, making it more susceptible to genetic drift (Charlesworth and Charlesworth 2000;
Filatov et al. 2000). Because the Y is non-recombining over most of its length and inherited
exclusively along the paternal lineage, it provides information about patterns of male-specific
dispersal and gene flow (Hammer et al. 2008).
Previous studies have noted reduced nucleotide diversity on human MSY relative to autosomes
(e.g., (Dorit et al. 1995 ; Wilson Sayres et al. 2014)) and attempted to explain this observation by
its small effective population size (Charlesworth and Charlesworth 2000; Filatov et al. 2000), high variance in reproductive success among males (Wilder et al. 2004; Hammer et al. 2008),
3
.CC-BY-NC-ND 4.0 International licenseIt is made available under a was not peer-reviewed) is the author/funder, who has granted bioRxiv a license to display the preprint in perpetuity.
The copyright holder for this preprint (which. http://dx.doi.org/10.1101/230342doi: bioRxiv preprint first posted online Dec. 7, 2017;

high levels of gene conversion among palindrome arms (Rozen et al. 2003; Marais et al. 2010;
Helgason et al. 2015), and purifying selection (Wilson Sayres et al. 2014). In contrast, structural
diversity on the Y is known to be high (Repping et al. 2006), which is consistent with frequent
intrachromosomal rearrangements facilitated by the highly repetitive nature of the Y (Skaletsky
et al. 2003).
In humans, as in most other mammals studied, the MSY plays an important biological role. It harbors the SRY gene that produces the transcription factor initiating male development, while
suppressing signals leading to the development of female reproductive organs (Harley et al.
1992). A number of genes located in the MSY are critical to male reproduction, as their deletion
can cause spermatogenic failure (Dhanoa et al. 2016). Additionally, the MSY has been
implicated in skeletal growth (Tanner et al. 1959), germ-line and somatic tumorigenesis (Kido
and Lau 2015), and graft rejection (Scott et al. 1997; Kido and Lau 2015). As the MSY
accumulated genes important for male function to resolve sexually antagonistic selection, it is
conceivable that some of them are important for the development of sexually dimorphic traits
(Dean and Mank 2014; Case and Teuscher 2015).
The human MSY harbors nine multi-copy ampliconic gene families ‒ BPY, CDY, DAZ, HSFY, PRY, RBMY, TSPY, VCY, and XKRY (Skaletsky et al. 2003; Bhowmick et al. 2007). All but one
(TSPY) of these gene families are located within either palindromes (P1, P2, P3, P4, P5, and
P8) or an inverted repeat (IR2) (Skaletsky et al. 2003). The TSPY gene family is arrayed in
tandem outside palindromes and more widely spaced inverted repeats (Skaletsky et al. 2003). Seven of the nine families are implicated in spermatogenesis or sperm production, and all nine
gene families are expressed predominantly or exclusively in testes (Skaletsky et al. 2003;
Bhowmick et al. 2007). Ampliconic gene copies within each family have high sequence identity
(>99.9%) that is maintained by gene conversion, which prevents degeneration of these gene
families critical for male function (Rozen et al. 2003). It has been proposed that multiple copies
of ampliconic genes accumulated on the Y because they increase male reproductive fitness via
enhanced sperm production (Rozen et al. 2003; Betrán et al. 2012; Bellott et al. 2014).
Several studies have focused on exploring associations between ampliconic gene copy number
and reproductive diseases, and/or fertility. The regions that have been reported to be deleted on
the Y chromosome in infertile males are azoospermia factor (AZF) regions a, b and c (AZFa,
AZFb, and AZFc), the latter two containing ampliconic gene families (Vogt et al. 1996; Krausz
4
.CC-BY-NC-ND 4.0 International licenseIt is made available under a was not peer-reviewed) is the author/funder, who has granted bioRxiv a license to display the preprint in perpetuity.
The copyright holder for this preprint (which. http://dx.doi.org/10.1101/230342doi: bioRxiv preprint first posted online Dec. 7, 2017;

and Degl’Innocenti 2006; Yu et al. 2015). AZFb contains CDY2 , XKRY, HSFY, and PRY
families, deletions in which have been shown to lead to spermatogenic arrest (Foresta et al.
2001; Krausz et al. 2014). AZFc contains DAZ, BPY2 , CDY1A, and CDY1B families, deletions in
which can result in different levels of spermatogenic failure (Pryor et al. 1998; Krausz et al.
1999) and can be heritable (Page et al. 1999; Rozen et al. 2012). The AZFc region is highly
repetitive, harbors palindromes (Kuroda-Kawaguchi et al. 2001) and thus is more prone to
deletions than the other AZF regions (Navarro-Costa et al. 2010; Knebel et al. 2011). Indeed,
AZFc deletions constitute 80% of all AZF deletions (Bansal et al. 2016). Ampliconic gene
families outside of AZF regions are also implicated in reproductive diseases. For example, copy
number reductions in DAZ, BPY, and CDY gene families have been associated with lower total
motile sperm counts in men (Noordam et al. 2011; Bansal et al. 2016). Contradictory results
have been reported on the association between TSPY and fertility (Krausz et al. 2010). Nickkholgh and colleagues (Nickkholgh et al. 2010) did not find a statistically significant
difference in TSPY copy number between men with low vs. high sperm counts, while Giachini
and colleagues (Giachini et al. 2009) reported that low TSPY copy number is associated with
low sperm production. No studies have been conducted to explore potential associations of Y
chromosome ampliconic gene copy numbers and traits besides fertility, e.g. sexually dimorphic
traits.
We presently have only limited knowledge about Y chromosome ampliconic gene copy number
variation in healthy males within and among human populations. In fact, the only available
information comes from the analysis of small samples of persons of European ancestry. Earlier
studies have determined copy number for a total of only three males (Skaletsky et al. 2003;
Tomaszkiewicz et al. 2016). Recently, Skov and colleagues investigated Y chromosome
ampliconic gene copy number variation in 62 males of Danish descent (Skov et al. 2017).
In the present study, we experimentally determined the copy number of all nine ampliconic
genes in 100 men representing ten major Y haplogroups (Y Chromosome Consortium 2002)
using droplet digital PCR (ddPCR) (Hindson et al. 2011; McDermott et al. 2013). We used these
data to obtain a view of ampliconic gene copy number variation within and across human
populations around the world by addressing the following questions: (i) Are ampliconic genes
more variable between major Y haplogroups than within haplogroups? (ii) Can ampliconic gene
copy number variation be used to classify major Y haplogroups accurately? (iii) How variable
are haplotypes reconstructed based on ampliconic gene copy number? (iv) Does ampliconic
5
.CC-BY-NC-ND 4.0 International licenseIt is made available under a was not peer-reviewed) is the author/funder, who has granted bioRxiv a license to display the preprint in perpetuity.
The copyright holder for this preprint (which. http://dx.doi.org/10.1101/230342doi: bioRxiv preprint first posted online Dec. 7, 2017;

gene copy number variation underlie variation in sexually dimorphic traits such as height and
facial masculinity/femininity? Thus, by answering these questions, we characterized evolution of
ampliconic gene copy number variation in a large number of individuals representing major Y
haplogroups.
Results Ampliconic gene copy number variation. To study copy number variation of Y chromosome
ampliconic genes, we applied ddPCR. This method allows absolute quantification of the target
DNA copies without the need to run a standard curve. This is in contrast to other methods such
as quantitative real-time PCR (qRT-PCR), in which suboptimal amplification efficiency
influences cycle threshold values and can ultimately result in an inaccurate quantification of the
target (Hindson et al. 2011; Pinheiro et al. 2012; McDermott et al. 2013). ddPCR was recently
used to evaluate the copy number of ampliconic Y chromosome genes in humans and gorillas
(Tomaszkiewicz et al. 2016) and to verify computationally derived ampliconic gene copy number
estimates for chimpanzees and bonobos (Oetjens et al. 2016).
The ddPCR assay, with the primers previously developed by us (Tomaszkiewicz et al. 2016), was used to estimate the copy number for Y chromosome ampliconic genes in 100 male
participants from the ongoing Anthropometrics, DNA and the Appearances and Perceptions of
Traits (ADAPT) study. The goal of the ADAPT study (http://ched.la.psu.edu/projects/adapt),
based at Penn State, is to study the evolutionary, genetic, and socio-cultural factors shaping
complex phenotypic variation within and across human populations. Among ADAPT
participants, we selected 100 males harboring Y chromosomes from ten major haplogroups (Y
Chromosome Consortium 2002): C, E, G, I, J, L, O, Q, R, and T (Table 1). Individuals with
subhaplogroups that are evolutionarily close to each other were grouped into a ‘major
haplogroup’ category to increase the statistical power in subsequent analyses. For example,
individuals from the O1, O2, and O3 subhaplogroups were grouped into the ‘O’ major
haplogroup category. These haplogroups were selected because they find their origins in
different regions of the world (Table 1).
The copy number for each gene family for every individual was estimated using three technical
replicates, with a handful of exceptions for which less than three replicates were analyzed
6
.CC-BY-NC-ND 4.0 International licenseIt is made available under a was not peer-reviewed) is the author/funder, who has granted bioRxiv a license to display the preprint in perpetuity.
The copyright holder for this preprint (which. http://dx.doi.org/10.1101/230342doi: bioRxiv preprint first posted online Dec. 7, 2017;

(Table S1A). In total, we processed 100 males x 9 gene families = 900 samples, 875 of which
were analyzed in three replicates. To assess the consistency of measurements among
replicates, we calculated the coefficient of variation (i.e. standard deviation divided by mean),
CV, across replicates. The median CV was low, 3.5% of the mean across all samples (red
dashed line in Fig. S1A). After removing the most distant value among the three replicates (see
Methods), the median CV was even lower; 1.07% of the mean (red dashed line in Fig. S1B). We
averaged the values of the two remaining replicates and used them in all subsequent analyses
(Tables S1A and S1B). We used these unrounded average values for all the analyses, except
for counting the number of haplotypes and building haplotype networks, where we rounded the
averaged values to the nearest integer.
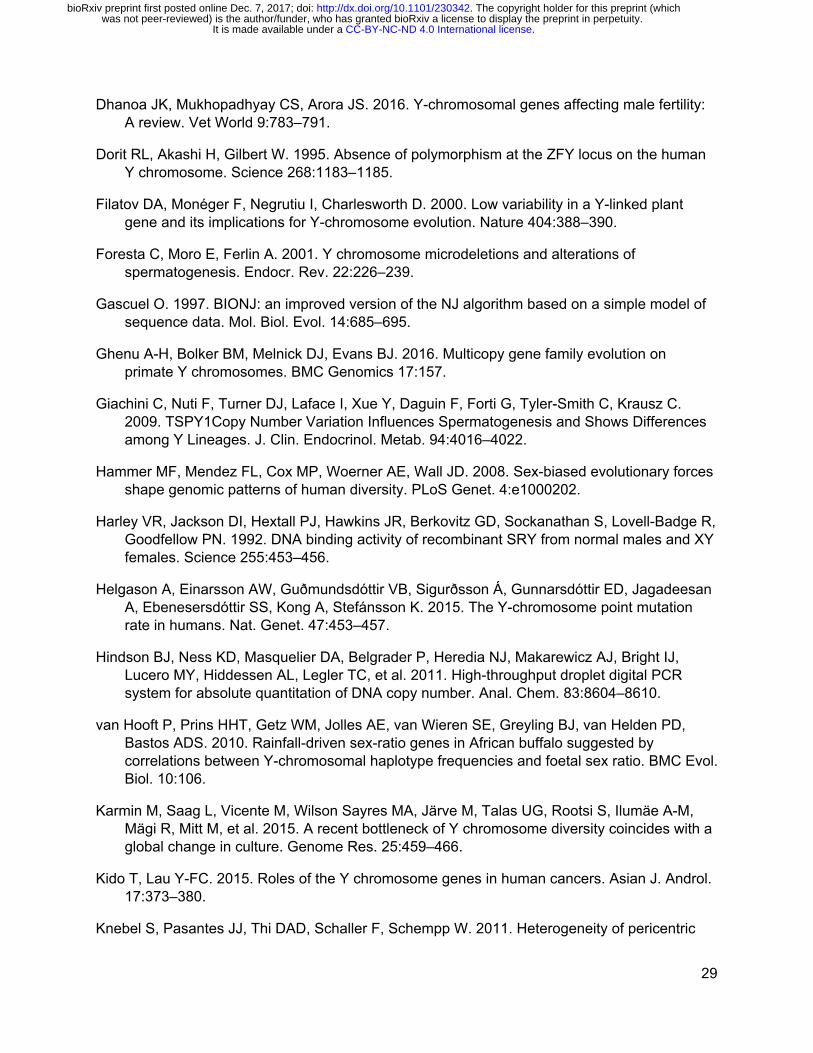
Variation in copy number among gene families. We first tested whether larger gene families
were also more variable in their copy number among individuals. Such a relationship is
expected because the probability of copy insertions and deletions increases with copy number
(Ghenu et al. 2016). A plot of median vs. variance in copy number for ampliconic gene families
across all individuals (Fig. 1) indicates a strong positive correlation (Spearman’s r = 0.97).
Larger gene families are indeed more variable, on average (Fig. 1; Table 2 ).
Lack of a phylogenetic pattern in ampliconic gene copy number variation. To examine
whether there is a phylogenetic pattern underlying ampliconic gene copy number variation in the
humans studied, we constructed a phylogenetic tree based on Y chromosome SNPs and
superimposed copy numbers for each of the ampliconic gene families per individual next to this
phylogeny (Fig. 2), following (Skov et al. 2017). As expected, individuals from the same
haplogroup clustered together based on Y chromosome SNPs. However, ampliconic gene copy
number variation did not show discernible patterns with respect to the Y-specific phylogeny.
Differences in ampliconic gene copy numbers among Y haplogroups. We further tested
whether ampliconic gene copy numbers are significantly different among the ten major Y
haplogroups analyzed. The distribution of ampliconic gene copy numbers per family across all
Y-haplogroups is shown in Figure 3. Using a one-way ANOVA test (Table 3) we found that copy
numbers of BPY, CDY, HSFY, PRY, VCY, and XKRY gene families were not significantly
different among major Y haplogroups. However, copy numbers for DAZ (P = 0.007), RBMY (P =
1.3x10 -05) and TSPY (P = 1.5x10 -05) did differ significantly among major haplogroups (Table 3).
The differences for the DAZ gene family were not significant after Bonferroni correction for
7
.CC-BY-NC-ND 4.0 International licenseIt is made available under a was not peer-reviewed) is the author/funder, who has granted bioRxiv a license to display the preprint in perpetuity.
The copyright holder for this preprint (which. http://dx.doi.org/10.1101/230342doi: bioRxiv preprint first posted online Dec. 7, 2017;

multiple tests.
In addition to the conventional, one-way ANOVA, we carried out a phylogenetic ANOVA with the
Expression Variance and Evolution (EVE) model (Rohlfs and Nielsen 2015). The test estimates
a parameter for each gene, 𝛽, which is the ratio of the variance in ampliconic gene copy number
within haplogroups to the variance between haplogroups. It assumes that genes sharing their
variability level will share a common 𝛽 parameter, 𝛽_shared. Based on a likelihood ratio test, we
used EVE to identify genes with either 𝛽_i < 𝛽_shared (higher variation between haplogroups
than within haplogroups), or 𝛽_i > 𝛽_shared (higher variation within haplogroups than between
haplogroups). We found that TSPY (log𝛽 = 0.59, LR = 4.94, P = 0.026) and RBMY (log𝛽 = 0.46,
LR = 7.39, P = 9.89E-163) gene families exhibited lower values of 𝛽 than of 𝛽_shared (Table 3).
This suggests that these two gene families have diverged more across haplogroups than the
overall level of divergence observed in all gene families together. Such cases suggest
non-neutral evolution along the phylogeny.
Do major haplogroups cluster by ampliconic gene copy number? Because copy numbers
for some ampliconic gene families are significantly different among major haplogroups (Table
3), we next tested whether individuals cluster based on ampliconic gene copy number. To
answer this question, we carried out Principal Component Analysis (PCA) on ampliconic gene
copy numbers. The first three PCs explain ~70% of the total variation (Fig. S2A). The resulting
clustering of individuals indicated that, whereas there is some separation of major haplogroups
based on ampliconic gene copy number (Fig. 4A-B), it is not nearly as pronounced as clustering
based on Y chromosome SNPs (Fig. 4C-D; Fig. S2B).
Can an individual’s haplogroup be predicted based on ampliconic gene copy number? To
test whether we can correctly classify the haplogroup of an individual based on his ampliconic
gene copy numbers, we carried out linear discriminant analysis (LDA) with major haplogroup as
the response variable and all nine ampliconic gene copy numbers as predictors. Using a
leave-one-out approach, we determined the posterior probability that an individual belongs to a
major haplogroup based on his copy number profile. The results are displayed as barplots in
Figure 5, where individuals are arranged on the x-axis (vertical bars) and the probability of being
classified correctly, or incorrectly, in the known haplogroup (determined by SNPs) is shown on
the y-axis. We can conclude that the major haplogroups are often ambiguously or incorrectly
predicted from copy number variation data alone, which confirms the patterns seen in the PCA
8
.CC-BY-NC-ND 4.0 International licenseIt is made available under a was not peer-reviewed) is the author/funder, who has granted bioRxiv a license to display the preprint in perpetuity.
The copyright holder for this preprint (which. http://dx.doi.org/10.1101/230342doi: bioRxiv preprint first posted online Dec. 7, 2017;

plots (Fig. 4), i.e. that most of the variation in ampliconic gene copy number is shared among
haplogroups. Consequently, it is difficult to predict the haplogroup of a person based on his
ampliconic gene copy number profile.
Haplotype variability and network analysis. We next compared the variability of haplotypes
based on SNP data versus that based on ampliconic gene copy numbers. Based on 187 SNPs
segregating in this data set on the Y chromosome, there are 39 distinct haplotypes among 100
individuals that cluster, as expected, by either subhaplogroup or major haplogroup (Fig. 6). In
fact, many haplogroups are monophyletic, and usually a unique substitution path leads to each
haplotype.
For the same 100 individuals, haplotypes obtained from ampliconic gene copy numbers were
more numerous than those obtained from SNP data. To construct haplotypes using ampliconic
gene copy numbers, we rounded the values we obtained with ddPCR (after averaging of the two
most similar replicates) to the nearest integer (Table S1C). This resulted in 98 haplotypes
among 100 individuals studied, more than twice the number of haplotypes obtained from SNP
data (Table S2A). The large number of haplotypes seen with copy number data was not
because of variation introduced by rounding to the nearest integer (see Methods). The 98
distinct haplotypes usually differed from each other by several copies of genes either from the
same or different families (Table S2B). From a total of 4,753 pairwise comparisons among
haplotypes, only 64 pairs (~1%) showed a one-copy difference in one gene family (Table S2B).
Among the two shared haplotype pairs observed in our sample of 100 males, one pair included
a male with an African (E) and a male with an Asian (O2) haplogroups, whereas in the other
pair, one male had a European (I) and another one an Asian (Q) haplogroup (Table S2A). Thus,
shared haplotypes in these instances provide examples of homoplasy. In a summary, nine
ampliconic gene families still produced a greater number of haplotypes than 187 SNPs.
We also studied the variability of ampliconic gene copy number-based haplotypes using
rounded ampliconic gene copy number from the data set generated by Skov and colleagues
(Skov et al. 2017) (Table S3A). Even though their data set includes 62 Danish males
representing only three major European haplogroups (I, R, and Q; Fig. 7B), we observed a total
of 35 copy number-based haplotypes (Table S3B), including 22 haplotypes carried by one
individual each, and 13 haplotypes shared by two or more individuals. One-copy differences
within the same ampliconic gene family constituted a small proportion of haplotype pairwise
9
.CC-BY-NC-ND 4.0 International licenseIt is made available under a was not peer-reviewed) is the author/funder, who has granted bioRxiv a license to display the preprint in perpetuity.
The copyright holder for this preprint (which. http://dx.doi.org/10.1101/230342doi: bioRxiv preprint first posted online Dec. 7, 2017;

comparisons (16%, 97 from a total of 595 haplotype pairwise comparisons; Table S3C). This
proportion was higher than in our data (16% vs. 1%) likely because Skov and colleagues (Skov
et al. 2017) only analyzed individuals of Danish ancestry, while we analyzed a world-wide
sample. Again, several cases of homoplasy were observed (Table S3B), including the same
haplotypes carried by individuals belonging to different major Y haplogroups. Therefore,
independently of the divergence time of the studied individuals ‒ worldwide human populations
vs. a single Danish population ‒ the number of haplotypes based on ampliconic gene copy
number was high. Furthermore, in contrast to the SNP-based haplotype network, the haplotype
networks constructed using ampliconic gene copy numbers from the same 100 individuals did
not display clustering by major Y haplogroups for both our and Skov et al.’s data sets (Fig.
7A-B).
The ampliconic gene copy number-based haplotype variability observed in our data and in the
data generated by Skov and colleagues (Skov et al. 2017) was mostly due to the variability of
the most diverse TSPY and RBMY gene families (Fig. 8). In our data, after removing TSPY, the
most variable gene family (Fig. 1), the total haplotype number decreased from 98 to 81. An
additional removal of the RBMY family led to 58 haplotypes. The effect was even more dramatic
for the Skov et al.’s data set. After removing TSPY from the haplotype analysis, only 19
haplotypes remained, whereas an additional removal of RBMY led to a significant drop to only
nine haplotypes.
Phenotypic traits. We further tested whether ampliconic gene copy number is associated with
two sexually dimorphic traits, namely height and facial masculinity/femininity (FMF, see
Methods). The premise here is that ampliconic genes on the Y chromosome could be involved
in the development of sexually dimorphic traits. If ampliconic genes are associated with fertility,
they might also have pleiotropic effects on sexually dimorphic traits. As shown in Table 4, we
found no statistically significant correlations between these traits and ampliconic gene copy
number whether or not we corrected for phylogenetic dependence among Y chromosomes
based on SNPs (see Methods). Interestingly, the TSPY gene family showed marginal
significance that should be investigated in further studies.
10
.CC-BY-NC-ND 4.0 International licenseIt is made available under a was not peer-reviewed) is the author/funder, who has granted bioRxiv a license to display the preprint in perpetuity.
The copyright holder for this preprint (which. http://dx.doi.org/10.1101/230342doi: bioRxiv preprint first posted online Dec. 7, 2017;

Discussion Very little is known about the variability in copy number of the Y chromosome ampliconic genes
in humans and about how such variability impacts phenotypes. These genes, organized in nine
multi-gene families, constitute 80% of only 78 protein-coding genes present on the Y
chromosome (as annotated in the reference human genome) (Skaletsky et al. 2003) and are
important for spermatogenesis. Here we experimentally determined the copy number of
ampliconic genes in 100 individuals across the world and analyzed this variation in light of Y
chromosome haplogroups based on SNPs. Additionally, we assessed whether ampliconic gene
copy number is associated with two sexually dimorphic traits.
Variability in ampliconic gene copy number. Substantial variability in ampliconic gene copy
number was observed among gene families (Table 2). As a rule, gene families with high copy
numbers (RBMY and TSPY) had higher variance in copy number among individuals than gene
families with low copy number numbers (HSFY, PRY, VCY, and XKRY). This is not surprising as
the probability of gene duplication and deletion should be proportional to gene copy number,
allowing for greater variation in large gene families (Ghenu et al. 2016). TSPY had the highest
copy number and the highest level of variability from all ampliconic gene families analyzed.
In contrast to the generally low levels of nucleotide diversity on the human Y chromosome
humans (e.g., (Wilson Sayres et al. 2014)), we observed high levels of variability on the Y
chromosome in terms of ampliconic gene copy numbers, among individuals. A total of 98
different haplotypes were observed among 100 individuals. Thus, almost each male analyzed
had his own, unique haplotype. Previously, high levels of variation in ampliconic gene copy
number were reported in chimpanzee and bonobo (Oetjens et al. 2016). Thus, our results are
consistent with high levels of intrachromosomal rearrangements seen on the Y chromosome
(Repping et al. 2006) and with rapid evolution of Y chromosomal multi-copy genes (i.e.
ampliconic genes) in primates (Ghenu et al. 2016).
Potential evolutionary mechanisms and other factors. Mutation and drift. Most gene families
are not significantly different in their copy number among major Y chromosome haplogroups
(i.e. haplogroups determined by SNPs). Only larger families ‒ DAZ, RBMY and TSPY ‒ showed
11
.CC-BY-NC-ND 4.0 International licenseIt is made available under a was not peer-reviewed) is the author/funder, who has granted bioRxiv a license to display the preprint in perpetuity.
The copyright holder for this preprint (which. http://dx.doi.org/10.1101/230342doi: bioRxiv preprint first posted online Dec. 7, 2017;

significant differences (Table 3). In other words, most of the variation in copy number is shared
among populations.
A multitude of back-and-forth duplication/deletion mutations could lead to the observed diversity
of haplotypes among human world-wide populations that resulted in some homoplastic
haplotypes shared by individuals belonging to different major Y haplogroups. This pattern of
variation contrasts that for SNPs, which are virtually free of homoplasies and thus allow us to
follow the evolution of Y chromosomes unambiguously. Interestingly, this pattern is reminiscent
of that observed for microsatellite haplotype variability (Cooper 1996). Such variation patterns
highlight the different nature of SNP vs. ampliconic gene copy number mutation mechanisms,
but similarities between microsatellite and ampliconic gene copy number mutation mechanisms.
While our purpose was not to study ampliconic gene mutational mechanisms, indirectly we can
infer very rapid mutations changing ampliconic gene copy numbers that occurred among
different haplotypes. More directed studies including pedigrees will have to be conducted to
study the rates and relative prevalence of one- vs. multi-copy mutations in ampliconic genes
from generation to generation.
Gene conversion. Gene conversion, prevalent at Y chromosome genes located in palindromes
likely contributes to homogenization of ampliconic gene sequences, rescuing them from
accumulation of deleterious mutations (Rozen et al. 2003; Betrán et al. 2012; Bellott et al.
2014). In theory, gene conversion is unlikely to influence the evolution of ampliconic gene copy
number itself, because gene conversion operates at a scale smaller than individual gene copies,
i.e. at the scale of a few hundreds of bases (Chen et al. 2007). Simulation studies have
indicated that gene conversion acting alone does not facilitate gene duplication on the Y
chromosome (Connallon and Clark 2010 ; Marais et al. 2010). Interestingly, it has been
suggested that gene conversion can slow down the loss of redundant duplicates, nevertheless
contributing to copy number evolution in this manner (Connallon and Clark 2010). Recently,
gene conversion on the human Y was found to be biased towards ancestral alleles and towards
GC (Skov et al. 2017). Future studies should combine sequence information of ampliconic
genes together with copy number data on them to investigate Y chromosomes from humans
around the globe.
Selection. Selection could have contributed to the observed patterns of ampliconic gene copy
number variation. In particular, we observe that most of the variation in gene copy number is
12
.CC-BY-NC-ND 4.0 International licenseIt is made available under a was not peer-reviewed) is the author/funder, who has granted bioRxiv a license to display the preprint in perpetuity.
The copyright holder for this preprint (which. http://dx.doi.org/10.1101/230342doi: bioRxiv preprint first posted online Dec. 7, 2017;

shared across different haplogroups. If we assume that this is not due to back mutations,
uniform selection ‒ selection that is uniform in its pressure across different human populations ‒
could potentially explain this result (Lynch 1986; Whitlock 2008). For instance, if copy number is
associated with a specific trait, and the same trait is maintained across populations by uniform
selection, it might also facilitate maintenance of an optimal copy number (Hammer et al. 2008). Copy number could then be allowed to ‘drift’ around this optimum within populations by
mutation.
Another selective explanation for the lack of copy number divergence across populations is
balancing selection within populations via negative frequency dependent selection (van Hooft et
al. 2010). However, this contradicts the generally low nucleotide diversity on the human Y (e.g.,
(Dorit et al. 1995; Wilson Sayres et al. 2014) and thus is unlikely.
Our results for the comparison of between-haplogroup variation versus within-haplogroup
variation based on the EVE model (Rohlfs and Nielsen 2015) suggest that the copy number of
two of the nine ampliconic gene families, TSPY and RBMY, have diverged more across
haplogroups than the overall level of divergence observed in all gene families together. This
could be due to directional selection in one or more haplogroup lineages. However, we state this
result with caution for a number of reasons. First, we only studied nine ampliconic genes and
the combined pattern of divergence across these genes may not represent patterns of neutral
evolution and could be skewed by one or two genes evolving non-neutrally. Second, we
calculated the P values for the likelihood obtained from the EVE model assuming that the
likelihood ratio follows a chi-square distribution with one degree of freedom. For the small
number of genes studied here, this is a rough approximation (Rohlfs and Nielsen 2015). More
sophisticated modeling is required to elucidate the role of selection on copy number in
ampliconic genes.
Selection on expression levels might have also played a role in determining the observed
variation in ampliconic gene copy number. Increased expression levels of some genes can lead
to an increase in fitness. In this case, chromosomes carrying higher copy numbers of such
genes might rise in frequency simply because a higher copy number is correlated with higher
gene expression, especially for genes that are associated with fitness-related traits such as
fertility (Marais et al. 2010). However, there is likely to be an upper limit for ampliconic gene
copy number, as the probability of ectopic crossover events with deleterious consequences
13
.CC-BY-NC-ND 4.0 International licenseIt is made available under a was not peer-reviewed) is the author/funder, who has granted bioRxiv a license to display the preprint in perpetuity.
The copyright holder for this preprint (which. http://dx.doi.org/10.1101/230342doi: bioRxiv preprint first posted online Dec. 7, 2017;

increases with the number of copies (Connallon and Clark 2010). Similarly, there might be a
lower limit for each gene family, below which gene expression levels would be inadequate for
spermatogenesis. These dosage-dependent factors might act as selective limits keeping copy
number for ampliconic genes within a certain range (Rozen et al. 2003; Betrán et al. 2012;
Bellott et al. 2014). Within this range, which might be different for each gene family, the copy
number would be allowed to drift neutrally. The role of dosage-dependent selection on
ampliconic gene copy number needs to be explored further by studying the relationship between
ampliconic gene copy number and expression levels.
Technical artifacts. One potential technical factor contributing to the high haplotype variability
observed for copy number variation data is amplification of pseudogenes together with
functional genes. While highly accurate given the primers used, ddPCR might amplify
non-functional copies if the primers anneal to them. We made a substantial effort to construct
our primers in such a manner that they capture functional copies only, based on the information
in the reference human chromosome Y (Tomaszkiewicz et al. 2016). However high sequence
identity among gene copies might not have allowed us to completely achieve this goal. This is
particularly true for the TSPY gene family, which is the largest tandem protein-coding array
present in the human genome (Skaletsky et al. 2003). Because of its size, it is challenging to
design primers that capture only functional copies of the TSPY family (Tomaszkiewicz et al.
2016). Other groups have reported similar difficulties with TSPY. For example, a recent study
conducted by Oetjens and colleagues (Oetjens et al. 2016) used a k-mer based approach to
detect ampliconic gene copy number variation in chimpanzees from whole-genome sequences.
However, they found that the utility of their method for the repetitive TSPY array was limited,
and their estimates of TSPY copy number included truncated gene copies (Oetjens et al. 2016). Ghenu and colleagues were unable to develop a robust qPCR assay to analyze TSPY copy
number in macaques (Ghenu et al. 2016). Therefore, different methods will have to be
developed to determine functional TSPY copy number more accurately. Nevertheless, this
limitation is unlikely to be the reason behind the large number of haplotypes observed in our
data. Even with the TSPY gene family excluded, the number of haplotypes based on ampliconic
gene copy number is higher than that based on SNPs (81 vs. 39).
Ampliconic gene copy number and male-specific sexually dimorphic traits. In this study,
we tested for a potential association between ampliconic gene copy number and two sexually
dimorphic traits, height and facial masculinity/femininity. We found no significant correlations
14
.CC-BY-NC-ND 4.0 International licenseIt is made available under a was not peer-reviewed) is the author/funder, who has granted bioRxiv a license to display the preprint in perpetuity.
The copyright holder for this preprint (which. http://dx.doi.org/10.1101/230342doi: bioRxiv preprint first posted online Dec. 7, 2017;

between these phenotypes and copy number of any gene family. This does not necessarily
mean that ampliconic gene copy number does not have an effect on these traits. The sample
size we analyzed here was relatively small (N = 100) and included individuals from many
different populations/haplogroups. While we corrected for phylogenetic dependence among the
Y chromosomes, we did not correct for variation in their nuclear genome. Sexually dimorphic
traits, like many other complex traits, are likely influenced by genes located on several
chromosomes. For instance, height is a polygenic trait and GWAS analyses of height have
identified hundreds of common variants, each with a small effect, distributed throughout the
genome (Yang et al. 2010; Wood et al. 2014). Traits specific to males and related to their
reproduction are also influenced by variants located on multiple chromosomes outside of the Y.
For instance, non-obstructive azoospermia, a reproductive disease characterized by the
absence of sperm in semen, displays synergistic and antagonistic interactions between Y
chromosomal haplogroups and certain autosomal SNPs (Lu et al. 2016). It would be interesting
to study the contribution of copy number variation to sexually dimorphic traits in light of variation
in the nuclear genome.
Furthermore, future studies would benefit from focusing on males from both extremes of the trait
distribution (for example, the shortest and the tallest individuals within the data set) and from the
same population/haplogroup. Additionally, we only used two phenotypic traits for analysis; a
more comprehensive understanding of the role of ampliconic genes and sexually dimorphic
characteristics will be gained by including other traits in the analysis.
15
.CC-BY-NC-ND 4.0 International licenseIt is made available under a was not peer-reviewed) is the author/funder, who has granted bioRxiv a license to display the preprint in perpetuity.
The copyright holder for this preprint (which. http://dx.doi.org/10.1101/230342doi: bioRxiv preprint first posted online Dec. 7, 2017;

Materials and Methods
Sample collection, consent, SNP typing, and DNA extraction. A total of 100 men were
recruited with written informed consent as part of the ADAPT and ADAPT2 studies (IRB #44929
and #45727) conducted at The Pennsylvania State University. According to the approved
protocol, saliva samples were obtained and two phenotypes ‒ height and facial
masculinity/femininity (see below) ‒ were measured for all participants. The saliva samples were
sent to 23andMe for genotyping on their v3 and v4 arrays (23andMe, Mountainview, CA). DNA
was extracted from the saliva samples using a salting-out method followed by an ammonium
acetate cleanup (Quinque et al. 2006) and quantified using Qubit dsDNA BR Assay Kit
(Invitrogen, Carlsbad, CA).
Droplet digital PCR (ddPCR). For each of the 100 DNA samples, we performed ddPCR for
nine ampliconic gene families of interest (BPY, CDY, DAZ, HSFY, PRY, RBMY, TSPY, VCY, and XKRY) and for SRY, a single-copy gene on the Y chromosome, used as a reference. Each
sample was run in triplicates. In 25 cases out of a total of 900, one or two replicates had no calls
(Table S1A). The ddPCR copy number assays were performed using the QX200 system and
EvaGreen dsDNA dye (Bio-Rad, Hercules, CA) using the protocol and primers described in our
previous publication (Tomaszkiewicz et al. 2016). Briefly, for a completion of one assay replicate
for each DNA sample included in the study, BPY, CDY, HSFY, TSPY, and XKRY were amplified
at an annealing temperature of 59°C on one plate, and DAZ, PRY, RBMY and VCY were
amplified with an annealing temperature of 63°C on another plate. SRY was amplified on each
plate for the ampliconic gene copy number inference. Based on the human reference genome
sequence, the primers designed were specific for capturing functional ampliconic gene families
(one primer pair per gene family) except for TSPY, for which primers were designed to anneal to
the smallest number of pseudogenes (Tomaszkiewicz et al. 2016).
The fluorescence in each droplet was measured and an automatic threshold was drawn using
QuantaSoft software (Bio-Rad, Hercules, CA). Droplets above the threshold were counted as
positive, and those below it were counted as negative. The concentration (copies/uL) of the
ampliconic gene family of interest was divided by the concentration of the reference, SRY, a
single-copy gene in a human male genome (Tomaszkiewicz et al. 2016). Because each sample
was run in triplicates, we had three measurements (or two measurements when one of the
16
.CC-BY-NC-ND 4.0 International licenseIt is made available under a was not peer-reviewed) is the author/funder, who has granted bioRxiv a license to display the preprint in perpetuity.
The copyright holder for this preprint (which. http://dx.doi.org/10.1101/230342doi: bioRxiv preprint first posted online Dec. 7, 2017;

replicates had no call) of ampliconic gene copy number for each gene family in every individual.
Where three replicates were present, the observation most distant from the median was
removed to reduce the effect of outliers (Table S1A). After this, ampliconic gene copy number
was determined by calculating the mean across the two replicates for each sample (Table 1B). We present the median, standard deviation (SD) and coefficient of variation for each gene
family in Table 2 and Fig. S1.
Construction of phylogeny based on SNP data. A maximum likelihood phylogenetic tree
based on 187 segregating Y chromosome SNPs for 100 male individuals was constructed
based on the Tamura-Nei model using MEGA7 (Kumar et al. 2016). The initial trees for the
heuristic search were obtained automatically by applying the BioNJ algorithm (Gascuel 1997) to
a matrix of pairwise distances estimated using the Maximum Composite Likelihood (MCL)
approach, and then selecting the topology with the highest log likelihood value. The tree was
drawn to scale, with branch lengths measured in the number of substitutions per site. There
were a total of 450 sites in the final data set, including 187 segregating sites.
Evaluating differences in ampliconic gene copy numbers among haplogroups. We tested
whether ampliconic gene copy number is different among different haplogroups for each gene
family separately. This was done using two different approaches. First, we applied the
conventional one-way analysis of variance (ANOVA), which does not take into account the
phylogenetic relationships among Y-haplogroup lineages into account. The simple ANOVA was
performed for each ampliconic gene family using major haplogroup (e.g. C, E, G, etc.) as factor.
Second, we applied the EVE model (Rohlfs and Nielsen 2015), which accounts for the
phylogenetic structure among haplogroups. Whereas the EVE model was developed with the
intention of testing for non-neutral evolution of gene expression in a given phylogeny, it can be
applied to any quantitative trait as long as it is measured on multiple individuals from every
species in the phylogeny (Rohlfs and Nielsen 2015). Our goal was to measure the ratio of
variation in copy number within haplogroups to the variation between haplogroups, denoted by
𝛽_i for every gene family. We expect this ratio to be similar across gene families evolving
neutrally in the phylogeny (i.e. 𝛽_1 = 𝛽_2 = 𝛽_3 …. = 𝛽_shared). Deviations from this
expectation can be suggestive of selection. As such, we test whether 𝛽_i for any one gene
family i deviates from this expectation (i.e 𝛽_i ≄𝛽_shared). If 𝛽_i < 𝛽_shared, then there is more
variation between haplogroups than the variation within haplogroups than expected, which could
17
.CC-BY-NC-ND 4.0 International licenseIt is made available under a was not peer-reviewed) is the author/funder, who has granted bioRxiv a license to display the preprint in perpetuity.
The copyright holder for this preprint (which. http://dx.doi.org/10.1101/230342doi: bioRxiv preprint first posted online Dec. 7, 2017;

be suggestive of directional selection in some haplogroups. Conversely, if 𝛽_i > 𝛽_shared, then
there is more variation within haplogroups than the variation between haplogroups, which could
be indicative of high conservation of copy number between haplogroups.
To apply the EVE model to the copy number data, we first constructed an ultrametric tree
connecting the major haplogroups from the phylogenetic tree based on Y-chromosomal SNPs.
This was done by first collapsing all individual branches from the same haplogroup such that
each major haplogroup is represented by one terminal branch in the phylogeny. Then, we
scaled the tree by setting the time of the most recent common ancestor of all lineages to
~250,000 years ago based on the most recent common ancestor (MRCA) of the Y phylogeny
presented by Karmin and colleagues (Karmin et al. 2015). We estimated the parameter 𝛽_i for
each gene from the copy number data using EVE and calculated the likelihood ratio between
the null hypothesis (Ho : 𝛽_i = 𝛽_shared) and alternative hypothesis (H1: 𝛽_i ≄ 𝛽_shared). A P
value for each test was calculated assuming the likelihood ratio asymptotically follows a
chi-square distribution with one degree of freedom. The likelihood ratio for each gene and
corresponding values are presented in Table 3.
Clustering of major haplogroups by copy number. Principal Component Analysis (PCA) was
performed on the centered and scaled ampliconic gene copy numbers ({x_ij-mean(x_i)}/var(x_i),
where x_ij is the copy number of the ith gene family and jth individual), to visualize the clustering
of major haplogroups based on ampliconic gene copy number (Cirillo 2016). For comparison,
we also carried out PCA on the genotypes of SNPs on the Y chromosome using Plink 1.9
(Chang et al. 2015).
In addition to the unsupervised PCA, we also carried out linear discriminant analysis (LDA) to
determine whether ampliconic gene copy number of an individual can be used to correctly
predict their major haplogroup. This was carried out using the lda function in the MASS package
in R (Venables and Ripley 2002). With leave-one-out cross validation, we calculated the
posterior probability that each individual can be assigned to their correct haplogroup (Fig. 5).
Haplotype variability and network analysis. Rounding the fractional copy numbers generated
by ddPCR could artificially introduce variation in the data, which could overestimate the number
of haplotypes. In order to evaluate whether this was the case, we calculated the range of
haplotypes observed by randomly rounding the original data ‒ the values produced by
averaging the two most similar replicates for each gene family and individual ‒ up or down
18
.CC-BY-NC-ND 4.0 International licenseIt is made available under a was not peer-reviewed) is the author/funder, who has granted bioRxiv a license to display the preprint in perpetuity.
The copyright holder for this preprint (which. http://dx.doi.org/10.1101/230342doi: bioRxiv preprint first posted online Dec. 7, 2017;

(Tables S1B and S4A). This was done by generating 100 sets of haplotypes, each of which was
obtained by rounding a value y either up or down if [floor(y) + 0.25] < y < [ceiling(y) - 0.25]
where floor(y) refers to the greatest integer less than y and ceiling(y) refers to the smallest
integer greater than y. Values outside this range were rounded to the nearest integer. For
example, a mean copy number of 2.35 was either rounded up or down to 2 or 3, respectively,
but a copy number of 2.15 was always rounded down to 2. We performed the same experiment
on unrounded ampliconic gene copy numbers from Skov data (Table S3A) (Skov et al. 2017). A
total of 100 data sets, each consisting of randomly rounded values for each of the 100 (our data
set) and 62 (Skov data set) individuals, were produced (Table S4A and S4B) and the range of
the number of haplotypes observed was calculated (Table S5B, Fig. S3). We found the number
of haplotypes in our data set to vary form 98 to 100 (median = 99, Table S5A) and in the Skov
data set to vary from 40 to 52 (median = 45; Table S5B).
Haplotype networks based on Y-chromosomal SNP genotypes and based on ampliconic gene
copy numbers were constructed separately. The alignment of SNP genotypes from 100 males
was inserted as an input for reconstructing haplotypes using “pegas” package in R (Paradis
2010; Cirillo 2016). To construct haplotype networks, we rounded the copy numbers to the
nearest integer for both our and Skov et al.’s data sets. The alignment of nine different
ampliconic gene copy numbers from each of the 100 male individuals was used to build a
haplotype network accounting specifically for indel mutations using “haplotypes” package in R
(Cirillo 2016). The same approach was used to construct the haplotype network for 62 males
from the Danish population (Skov et al. 2017). Haplotype distance matrices used for the
haplotype network reconstructions are provided in Tables S4A and S4B. Haplotypes were
separated by deletions or insertions of ampliconic gene copies, regardless of the copy number
changes (two one-copy indels in two gene families are portrayed the same way as one two-copy
indel in one gene family).
To get an idea of which ampliconic gene families were contributing most to the variability
observed among haplotypes, we sampled pairs of haplotypes, separately from within- and
between major Y haplogroups, and counted the copy number differences per ampliconic gene
family between each pair. A total of 1,000 such pairs for each comparison, within- and between
major haplogroups, were generated. The results are shown in Fig. 8.
Measurement of height and facial masculinity/femininity (FMF). For the participants in the
19
.CC-BY-NC-ND 4.0 International licenseIt is made available under a was not peer-reviewed) is the author/funder, who has granted bioRxiv a license to display the preprint in perpetuity.
The copyright holder for this preprint (which. http://dx.doi.org/10.1101/230342doi: bioRxiv preprint first posted online Dec. 7, 2017;

ADAPT study (a total of 64 men), height was measured using a standard stadiometer.
Self-reported height was used for 36 participants from the ADAPT2 study due to remote
sampling and lack of a portable stadiometer. Facial masculinity was calculated from 3D images
collected on participants using a method developed by (Claes et al. 2014), as described briefly
below. FMF scores were estimated by orthogonally projecting the participants' faces onto the
regression line that represents facial sexual dimorphism. A spatially dense mesh of 7,150
quasi-landmarks (QL) was superimposed on participant’s 3D facial scans and differences in
translation, rotation, and scale were removed by applying a Generalized Procrustes
Superimposition (GPS) on the set of facial coordinates (Claes et al. 2014). The first sixty
principal components, which explained 98% of the variance, were retained. To calculate FMF,
we used a leave-one-out cross-validation approach, that is, the participant face for whom we
wanted FMF to be estimated was left out of the regression model while the remaining
participants were used to estimate regression coefficients with a multivariate linear regression of
facial Principal Components on sex and height. Height was used too as a covariate to remove
the influence of size differences on facial shape from the estimation of FMF. The average
female face was set as the origin of the facial PCA, allowing higher values to reflect more
masculine faces. Using the regression line for sex, the FMF score was orthogonally projected
for the participant’s face. Both height and FMF data are provided in Table S6.
Evaluating correlations between haplogroups and phenotypic traits. We evaluated
correlations between ampliconic gene families and phenotypic traits using the phylogenetic
generalized least square method (PGLM) implemented using the nlme package in R (Cirillo
2016)(Pinheiro J, Bates D, DebRoy S, Sarkar D and R Core Team 2017). As some individuals
were more closely related to each other than to other individuals, the ampliconic gene copy
number data for each individual cannot be considered to be independent data points. To take
this phylogenetic relatedness into account, we constructed a variance-covariance matrix from
the Y-chromosomal phylogeny using the vcov function in the ape package in R (Paradis et al.
2004), assuming a Brownian motion model of phenotypic evolution (Wilson Sayres et al.
2011)(Cirillo 2016). This variance-covariance matrix was used to specify the correlation
structure of the residuals.
We tested whether ampliconic gene copy number for each of the nine ampliconic gene families
is a predictor of the two phenotypic traits using the gls function from the nlme package in R
(Cirillo 2016). The models were fit using maximum likelihood and significance of the ampliconic
20
.CC-BY-NC-ND 4.0 International licenseIt is made available under a was not peer-reviewed) is the author/funder, who has granted bioRxiv a license to display the preprint in perpetuity.
The copyright holder for this preprint (which. http://dx.doi.org/10.1101/230342doi: bioRxiv preprint first posted online Dec. 7, 2017;
gene copy number as a predictor of height and FMF was determined using a likelihood ratio test
between the “full” (intercept + predictor) and “reduced” (intercept only) models.
Code availability . All the scripts for this study are provided at GitHub:
https://github.com/makovalab-psu/Ampliconic_CNV
Acknowledgements The authors are grateful to Mike DeGiorgio for his advice and critical reading of the manuscript
and to Tomas Benjamin Gonzalez Zarzar for providing facial masculinity scores. We also thank
the ADAPT study participants, without whom this research would not have been possible.
Funding for the project was provided by the Penn State Center for Human Evolution and
Disease (CHED) seed grant, the Huck Institutes for the Life Sciences, the Eberly College of
Sciences, the Institute of Cyberscience at Penn State, and by a grant from the Pennsylvania
Department of Health using Tobacco Settlement Funds. The Department
specifically disclaims responsibility for any analyses, interpretations, or conclusions.
21
.CC-BY-NC-ND 4.0 International licenseIt is made available under a was not peer-reviewed) is the author/funder, who has granted bioRxiv a license to display the preprint in perpetuity.
The copyright holder for this preprint (which. http://dx.doi.org/10.1101/230342doi: bioRxiv preprint first posted online Dec. 7, 2017;

Table 1. Male samples utilized in the study.
Major Y haplogroups
Y sub-haplogroups
Number of males
Major geographic
location (Karmin et al. 2015)
C C3 5 5 Asia
E
E1b1a 5
22
Africa
E1b1a1a1g1a 7
E1b1b1 5
E1b1b1a 5
G G2 5 5 Africa
I
I1 5
15
Europe
I2a2a 5
I2Aa1b 5
J J2 5 5 Western Asia
L L1 4 4 Western Asia
O
O1 3
14
Eastern and Southeastern Asia O2 6
O3 5
Q Q1 5 5 Central Asia
R
R1b1a2a1a2c 5
20
Europe
R1b1a2a1a2b 5
R1b1a2a1a1 5
R1a1a1 5
T T 5 5 Western Asia
Total 100
22
.CC-BY-NC-ND 4.0 International licenseIt is made available under a was not peer-reviewed) is the author/funder, who has granted bioRxiv a license to display the preprint in perpetuity.
The copyright holder for this preprint (which. http://dx.doi.org/10.1101/230342doi: bioRxiv preprint first posted online Dec. 7, 2017;

Table 2. Median, standard deviation (SD) and range of unrounded copy number values per ampliconic
gene family (based on the data from Table S1A).
Gene Median SD Range
BPY 3.23 1.03 0.96-8.51
CDY 4.06 0.74 2.74-5.88
DAZ 4.20 1.32 1.89-10.27
HSFY 2.10 0.33 1.37-3.12
PRY 2.14 0.29 1.18-2.92
RBMY 10.54 2.37 5.13-19.42
TSPY 30.18 5.20 15.92-40.86
VCY 2.32 0.53 1.50-4.81
XKRY 1.98 0.29 1.03-2.99
23
.CC-BY-NC-ND 4.0 International licenseIt is made available under a was not peer-reviewed) is the author/funder, who has granted bioRxiv a license to display the preprint in perpetuity.
The copyright holder for this preprint (which. http://dx.doi.org/10.1101/230342doi: bioRxiv preprint first posted online Dec. 7, 2017;

Table 3. Analysis of variance of the ampliconic gene copy number data. Both conventional one-way
ANOVA and phylogenetic ANOVA (EVE) were performed to determine which ampliconic gene families
vary significantly in their copy numbers among major haplogroups. F is the f-statistic for the one-way
ANOVA. 𝛽 and LR are the ratio of the within-haplogroup variance to the between-haplogroup variance in
copy number and the likelihood ratio between the null model and the alternative model, respectively, from
the phylogenetic ANOVA (see Methods).
Gene
Conventional ANOVA Phylogenetic ANOVA (EVE)
F P Log(𝛽) LR P
BPY 1.34 0.23 7.59 1.59 0.207
CDY 0.71 0.69 6.42 2.41 0.121
DAZ 2.74 0.007 0.93 0.28 0.597
HSFY 0.37 0.95 8.07 3.21 0.073
PRY 0.62 0.77 6.95 2.60 0.107
RBMY 5.14 1.3x10 -5 0.46 7.39 9.89E-163
TSPY 5.03 1.7x10 -5 0.59 4.94 0.026
VCY 1.01 0.44 3.07 1.22 0.269
XKRY 0.34 0.96 7.87 2.66 0.103
24
.CC-BY-NC-ND 4.0 International licenseIt is made available under a was not peer-reviewed) is the author/funder, who has granted bioRxiv a license to display the preprint in perpetuity.
The copyright holder for this preprint (which. http://dx.doi.org/10.1101/230342doi: bioRxiv preprint first posted online Dec. 7, 2017;

Table 4. ANOVA analysis of the association between phenotypic traits (height and FMF scores) and
ampliconic gene copy number without and with applying correction for phylogenetic dependence. F is the
f-statistic for one-way ANOVA without correction for phylogenetic dependence. LR is the likelihood ratio
between full model (predictor included) and reduced model (predictor excluded). P are the respective P
values for the significance of each predictor. Marginally significant P values are shown in bold.
Gene
Without correction for
phylogenetic dependence
After applying correction for
phylogenetic dependence
Height FMF Height FMF
F P F P LR P LR P
BPY 0.804 0.372 0.193 0.6613 0.832 0.362 0.063 0.802
CDY 0.005 0.9446 0.352 0.5547 0.069 0.794 0.459 0.498
DAZ 0.552 0.459 0.140 0.709 0.337 0.562 0.058 0.809
HSFY 1.347 0.249 0.962 0.3294 1.32 0.251 0.856 0.355
PRY 0.107 0.744 0.090 0.765 0.352 0.553 1.117 0.291
RBMY 0.714 0.400 6.00E-04 0.9803 0.396 0.529 0.717 0.397
TSPY 0.679 0.412 2.941 0.089 3.49 0.062 1.222 0.269
VCY 0.343 0.559 2.382 0.126 0.122 0.727 1.472 0.225
XKRY 2.534 0.1156 0.924 0.339 2.925 0.087 0.432 0.511
25
.CC-BY-NC-ND 4.0 International licenseIt is made available under a was not peer-reviewed) is the author/funder, who has granted bioRxiv a license to display the preprint in perpetuity.
The copyright holder for this preprint (which. http://dx.doi.org/10.1101/230342doi: bioRxiv preprint first posted online Dec. 7, 2017;

Figure legends
Figure 1. Larger gene families tend to be more variable. The median and variance of copy
number were calculated across all individuals in the sample (N = 100). The grey line shows the
line of best fit.
Figure 2. The phylogenetic tree based on Y chromosomal SNPs. The evolutionary tree was
inferred from 187 Y chromosomal SNPs using maximum likelihood (log-likelihood = -1586.52).
The branches are colored according to Y haplogroup. Ampliconic gene copy number averaged
between two most similar replicates is presented on the right. For comparison, we included the
copy numbers for an individual sequenced by Skaletsky and colleagues (indicated in black font
in parenthesis) (Skaletsky et al. 2003).
Figure 3. The distribution of ampliconic gene copy numbers across major Y haplogroups.
Between four and 22 participants per major Y-haplogroup were analyzed (see Table 1 for
sample sizes for each haplogroup).
Figure 4. (A) and (B) Results of PCA on ampliconic gene copy number data (A. PC1 vs PC2; B.
PC1 vs PC3). (C) and (D) Results of PCA on SNP genotype data (C. PC1 vs PC2, D. PC1 vs
PC3). Individuals are colored based on the haplogroup determined from SNP genotype data.
Individuals cluster by haplogroup based on SNP genotype data but not very clearly based on
ampliconic gene copy number.
Figure 5. Barplots showing the posterior probability of classifying each individual to his known
haplogroup correctly (blue) vs. incorrectly (orange). The known haplogroup of the individual,
determined by SNP genotypes, is written on top of each bar plot in the strip.
Figure 6. Haplotype network constructed using SNP genotypes from 100 males (39
haplotypes). The disc size is proportional to the number of individuals with a particular
haplotype. Black lines connect each haplotype to its closest haplotype, while bars correspond to
mutational steps between connected haplotypes.
Figure 7 . (A) Haplotype network constructed using nine different ampliconic gene copy
numbers (rounded) from each of the 100 male individuals (98 haplotypes) (rounded copy
26
.CC-BY-NC-ND 4.0 International licenseIt is made available under a was not peer-reviewed) is the author/funder, who has granted bioRxiv a license to display the preprint in perpetuity.
The copyright holder for this preprint (which. http://dx.doi.org/10.1101/230342doi: bioRxiv preprint first posted online Dec. 7, 2017;

number values were used; Table S1C). Each big colored disc represents a different haplotype.
Small colored discs represent intermediate haplotypes. Black lines connect each haplotype to
its closest relative. A link between two haplotypes corresponds to a one-copy difference in one
gene family. If extant or ancestral haplotypes are joint by several consecutive links, this
indicates several copy number differences (either within the same or different gene families)
between them, and the number of such links corresponds to the number of copy number
differences. A pink ring indicates haplotypes that were observed in more than one individual. (B) Same as A, but for the data from 62 Danish males in (Skov et al. 2017) (rounded copy number
values were used; Table S3A).
Figure 8. Copy number differences per ampliconic gene family between two haplotypes
randomly picked from within and between major Y haplogroups (1,000 samplings within and
between haplogroups each; see Methods).
27
.CC-BY-NC-ND 4.0 International licenseIt is made available under a was not peer-reviewed) is the author/funder, who has granted bioRxiv a license to display the preprint in perpetuity.
The copyright holder for this preprint (which. http://dx.doi.org/10.1101/230342doi: bioRxiv preprint first posted online Dec. 7, 2017;

REFERENCES Bachtrog D. 2008. The temporal dynamics of processes underlying Y chromosome
degeneration. Genetics 179:1513–1525.
Bachtrog D. 2013. Y-chromosome evolution: emerging insights into processes of Y-chromosome degeneration. Nat. Rev. Genet. 14:113–124.
Bansal SK, Jaiswal D, Gupta N, Singh K, Dada R, Sankhwar SN, Gupta G, Rajender S. 2016. Gr/gr deletions on Y-chromosome correlate with male infertility: an original study, meta-analyses, and trial sequential analyses. Sci. Rep. 6:19798.
Bellott DW, Hughes JF, Skaletsky H, Brown LG, Pyntikova T, Cho T-J, Koutseva N, Zaghlul S, Graves T, Rock S, et al. 2014. Mammalian Y chromosomes retain widely expressed dosage-sensitive regulators. Nature 508:494–499.
Betrán E, Demuth JP, Williford A. 2012. Why chromosome palindromes? Int. J. Evol. Biol. 2012:207958.
Bhowmick BK, Satta Y, Takahata N. 2007. The origin and evolution of human ampliconic gene families and ampliconic structure. Genome Res. 17:441–450.
Case LK, Teuscher C. 2015. Y genetic variation and phenotypic diversity in health and disease. Biol. Sex Differ. [Internet] 6. Available from: http://dx.doi.org/10.1186/s13293-015-0024-z
Chang CC, Chow CC, Tellier LC, Vattikuti S, Purcell SM, Lee JJ. 2015. Second-generation PLINK: rising to the challenge of larger and richer datasets. Gigascience 4:7.
Charlesworth B, Charlesworth D. 2000. The degeneration of Y chromosomes. Philos. Trans. R. Soc. Lond. B Biol. Sci. 355:1563–1572.
Chen J-M, Cooper DN, Chuzhanova N, Férec C, Patrinos GP. 2007. Gene conversion: mechanisms, evolution and human disease. Nat. Rev. Genet. 8:762–775.
Cirillo A. 2016. RStudio for R Statistical Computing Cookbook. Packt Publishing Ltd
Claes P, Liberton DK, Daniels K, Rosana KM, Quillen EE, Pearson LN, McEvoy B, Bauchet M, Zaidi AA, Yao W, et al. 2014. Modeling 3D facial shape from DNA. PLoS Genet. 10:e1004224.
Connallon T, Clark AG. 2010. Gene Duplication, Gene Conversion and the Evolution of the Y Chromosome. Genetics 186:277–286.
Cooper G. 1996. Network analysis of human Y microsatellite haplotypes. Hum. Mol. Genet. 5:1759–1766.
Dean R, Mank JE. 2014. The role of sex chromosomes in sexual dimorphism: discordance between molecular and phenotypic data. J. Evol. Biol. 27:1443–1453.
28
.CC-BY-NC-ND 4.0 International licenseIt is made available under a was not peer-reviewed) is the author/funder, who has granted bioRxiv a license to display the preprint in perpetuity.
The copyright holder for this preprint (which. http://dx.doi.org/10.1101/230342doi: bioRxiv preprint first posted online Dec. 7, 2017;
Dhanoa JK, Mukhopadhyay CS, Arora JS. 2016. Y-chromosomal genes affecting male fertility: A review. Vet World 9:783–791.
Dorit RL, Akashi H, Gilbert W. 1995. Absence of polymorphism at the ZFY locus on the human Y chromosome. Science 268:1183–1185.
Filatov DA, Monéger F, Negrutiu I, Charlesworth D. 2000. Low variability in a Y-linked plant gene and its implications for Y-chromosome evolution. Nature 404:388–390.
Foresta C, Moro E, Ferlin A. 2001. Y chromosome microdeletions and alterations of spermatogenesis. Endocr. Rev. 22:226–239.
Gascuel O. 1997. BIONJ: an improved version of the NJ algorithm based on a simple model of sequence data. Mol. Biol. Evol. 14:685–695.
Ghenu A-H, Bolker BM, Melnick DJ, Evans BJ. 2016. Multicopy gene family evolution on primate Y chromosomes. BMC Genomics 17:157.
Giachini C, Nuti F, Turner DJ, Laface I, Xue Y, Daguin F, Forti G, Tyler-Smith C, Krausz C. 2009. TSPY1Copy Number Variation Influences Spermatogenesis and Shows Differences among Y Lineages. J. Clin. Endocrinol. Metab. 94:4016–4022.
Hammer MF, Mendez FL, Cox MP, Woerner AE, Wall JD. 2008. Sex-biased evolutionary forces shape genomic patterns of human diversity. PLoS Genet. 4:e1000202.
Harley VR, Jackson DI, Hextall PJ, Hawkins JR, Berkovitz GD, Sockanathan S, Lovell-Badge R, Goodfellow PN. 1992. DNA binding activity of recombinant SRY from normal males and XY females. Science 255:453–456.
Helgason A, Einarsson AW, Guðmundsdóttir VB, Sigurðsson Á, Gunnarsdóttir ED, Jagadeesan A, Ebenesersdóttir SS, Kong A, Stefánsson K. 2015. The Y-chromosome point mutation rate in humans. Nat. Genet. 47:453–457.
Hindson BJ, Ness KD, Masquelier DA, Belgrader P, Heredia NJ, Makarewicz AJ, Bright IJ, Lucero MY, Hiddessen AL, Legler TC, et al. 2011. High-throughput droplet digital PCR system for absolute quantitation of DNA copy number. Anal. Chem. 83:8604–8610.
van Hooft P, Prins HHT, Getz WM, Jolles AE, van Wieren SE, Greyling BJ, van Helden PD, Bastos ADS. 2010. Rainfall-driven sex-ratio genes in African buffalo suggested by correlations between Y-chromosomal haplotype frequencies and foetal sex ratio. BMC Evol. Biol. 10:106.
Karmin M, Saag L, Vicente M, Wilson Sayres MA, Järve M, Talas UG, Rootsi S, Ilumäe A-M, Mägi R, Mitt M, et al. 2015. A recent bottleneck of Y chromosome diversity coincides with a global change in culture. Genome Res. 25:459–466.
Kido T, Lau Y-FC. 2015. Roles of the Y chromosome genes in human cancers. Asian J. Androl. 17:373–380.
Knebel S, Pasantes JJ, Thi DAD, Schaller F, Schempp W. 2011. Heterogeneity of pericentric
29
.CC-BY-NC-ND 4.0 International licenseIt is made available under a was not peer-reviewed) is the author/funder, who has granted bioRxiv a license to display the preprint in perpetuity.
The copyright holder for this preprint (which. http://dx.doi.org/10.1101/230342doi: bioRxiv preprint first posted online Dec. 7, 2017;

inversions of the human y chromosome. Cytogenet. Genome Res. 132:219–226.
Krausz C, Degl’Innocenti S. 2006. Y chromosome and male infertility: update, 2006. Front. Biosci. 11:3049–3061.
Krausz C, Giachini C, Forti G. 2010. TSPY and Male Fertility. Genes 1:308–316.
Krausz C, Hoefsloot L, Simoni M, Tüttelmann F, European Academy of Andrology, European Molecular Genetics Quality Network. 2014. EAA/EMQN best practice guidelines for molecular diagnosis of Y-chromosomal microdeletions: state-of-the-art 2013. Andrology 2:5–19.
Krausz C, Quintana-Murci L, Barbaux S, Siffroi JP, Rouba H, Delafontaine D, Souleyreau-Therville N, Arvis G, Antoine JM, Erdei E, et al. 1999. A high frequency of Y chromosome deletions in males with nonidiopathic infertility. J. Clin. Endocrinol. Metab. 84:3606–3612.
Kumar S, Stecher G, Tamura K. 2016. MEGA7: Molecular Evolutionary Genetics Analysis Version 7.0 for Bigger Datasets. Mol. Biol. Evol. 33:1870–1874.
Kuroda-Kawaguchi T, Skaletsky H, Brown LG, Minx PJ, Cordum HS, Waterston RH, Wilson RK, Silber S, Oates R, Rozen S, et al. 2001. Nat. Genet. 29:279–286.
Lahn BT, Pearson NM, Jegalian K. 2001. The human Y chromosome, in the light of evolution. Nat. Rev. Genet. 2:207–216.
Lu C, Wen Y, Hu W, Lu F, Qin Y, Wang Y, Li S, Yang S, Lin Y, Wang C, et al. 2016. Y chromosome haplogroups based genome-wide association study pinpoints revelation for interactions on non-obstructive azoospermia. Sci. Rep. 6:33363.
Lynch M. 1986. Random Drift, Uniform Selection, and the Degree of Population Differentiation. Evolution 40:640–643.
Marais GAB, Campos PRA, Gordo I. 2010. Can intra-Y gene conversion oppose the degeneration of the human Y chromosome? A simulation study. Genome Biol. Evol. 2:347–357.
McDermott GP, Do D, Litterst CM, Maar D, Hindson CM, Steenblock ER, Legler TC, Jouvenot Y, Marrs SH, Bemis A, et al. 2013. Multiplexed target detection using DNA-binding dye chemistry in droplet digital PCR. Anal. Chem. 85:11619–11627.
Navarro-Costa P, Goncalves J, Plancha CE. 2010. The AZFc region of the Y chromosome: at the crossroads between genetic diversity and male infertility. Hum. Reprod. Update 16:525–542.
Nickkholgh B, Noordam MJ, Hovingh SE, van Pelt AMM, van der Veen F, Repping S. 2010. Y chromosome TSPY copy numbers and semen quality. Fertil. Steril. 94:1744–1747.
Noordam MJ, Westerveld GH, Hovingh SE, van Daalen SKM, Korver CM, van der Veen F, van Pelt AMM, Repping S. 2011. Gene copy number reduction in the azoospermia factor c
30
.CC-BY-NC-ND 4.0 International licenseIt is made available under a was not peer-reviewed) is the author/funder, who has granted bioRxiv a license to display the preprint in perpetuity.
The copyright holder for this preprint (which. http://dx.doi.org/10.1101/230342doi: bioRxiv preprint first posted online Dec. 7, 2017;

(AZFc) region and its effect on total motile sperm count. Hum. Mol. Genet. 20:2457–2463.
Oetjens MT, Shen F, Emery SB, Zou Z, Kidd JM. 2016. Y-Chromosome Structural Diversity in the Bonobo and Chimpanzee Lineages. Genome Biol. Evol. 8:2231–2240.
van Oven M, Van Geystelen A, Kayser M, Decorte R, Larmuseau MHD. 2013. Seeing the Wood for the Trees: A Minimal Reference Phylogeny for the Human Y Chromosome. Hum. Mutat. 35:187–191.
Page DC, Silber S, Brown LG. 1999. Men with infertility caused by AZFc deletion can produce sons by intracytoplasmic sperm injection, but are likely to transmit the deletion and infertility. Hum. Reprod. 14:1722–1726.
Paradis E. 2010. pegas: an R package for population genetics with an integrated-modular approach. Bioinformatics 26:419–420.
Paradis E, Claude J, Strimmer K. 2004. APE: Analyses of Phylogenetics and Evolution in R language. Bioinformatics 20:289–290.
Pinheiro J, Bates D, DebRoy S, Sarkar D and R Core Team. 2017. nlme: Linear and Nonlinear Mixed Effects Models. Available from: https://CRAN.R-project.org/package=nlme
Pinheiro LB, Coleman VA, Hindson CM, Herrmann J, Hindson BJ, Bhat S, Emslie KR. 2012. Evaluation of a droplet digital polymerase chain reaction format for DNA copy number quantification. Anal. Chem. 84:1003–1011.
Pryor JL, Kent-First M, Muallem A, Van Bergen AH, Nolten WE, Meisner L, Roberts KP. 1998. Microdeletions in the Y Chromosome of Infertile Men. J. Urol.:608–609.
Quinque D, Kittler R, Kayser M, Stoneking M, Nasidze I. 2006. Evaluation of saliva as a source of human DNA for population and association studies. Anal. Biochem. 353:272–277.
Repping S, van Daalen SKM, Brown LG, Korver CM, Lange J, Marszalek JD, Pyntikova T, van der Veen F, Skaletsky H, Page DC, et al. 2006. High mutation rates have driven extensive structural polymorphism among human Y chromosomes. Nat. Genet. 38:463–467.
Rohlfs RV, Nielsen R. 2015. Phylogenetic ANOVA: The Expression Variance and Evolution Model for Quantitative Trait Evolution. Syst. Biol. 64:695–708.
Rozen SG, Marszalek JD, Irenze K, Skaletsky H, Brown LG, Oates RD, Silber SJ, Ardlie K, Page DC. 2012. AZFc deletions and spermatogenic failure: a population-based survey of 20,000 Y chromosomes. Am. J. Hum. Genet. 91:890–896.
Rozen S, Skaletsky H, Marszalek JD, Minx PJ, Cordum HS, Waterston RH, Wilson RK, Page DC. 2003. Abundant gene conversion between arms of palindromes in human and ape Y chromosomes. Nature 423:873–876.
Scott DM, Ehrmann IE, Ellis PS, Chandler PR, Simpson E. 1997. Why do some females reject males? The molecular basis for male-specific graft rejection. J. Mol. Med. 75:103–114.
Skaletsky H, Kuroda-Kawaguchi T, Minx PJ, Cordum HS, Hillier L, Brown LG, Repping S,
31
.CC-BY-NC-ND 4.0 International licenseIt is made available under a was not peer-reviewed) is the author/funder, who has granted bioRxiv a license to display the preprint in perpetuity.
The copyright holder for this preprint (which. http://dx.doi.org/10.1101/230342doi: bioRxiv preprint first posted online Dec. 7, 2017;

Pyntikova T, Ali J, Bieri T, et al. 2003. The male-specific region of the human Y chromosome is a mosaic of discrete sequence classes. Nature 423:825–837.
Skov L, Danish Pan Genome Consortium, Schierup MH. 2017. Analysis of 62 hybrid assembled human Y chromosomes exposes rapid structural changes and high rates of gene conversion. PLoS Genet. 13:e1006834.
Tanner JM, Prader A, Habich H, Ferguson-Smith MA. 1959. Genes on the Y chromosome influencing rate of maturation in man: skeletal age studies in children with Klinefelter's (XXY) and Turner's (XO) syndromes. Lancet 274:141–144.
Tomaszkiewicz M, Medvedev P, Makova KD. 2017. Y and W Chromosome Assemblies: Approaches and Discoveries. Trends Genet. 33:266–282.
Tomaszkiewicz M, Rangavittal S, Cechova M, Campos Sanchez R, Fescemyer HW, Harris R, Ye D, O’Brien PCM, Chikhi R, Ryder OA, et al. 2016. A time- and cost-effective strategy to sequence mammalian Y Chromosomes: an application to the de novo assembly of gorilla Y. Genome Res. 26:530–540.
Venables WN, Ripley BD. 2002. Modern Applied Statistics with S.
Vogt PH, Edelmann A, Kirsch S, Henegariu O, Hirschmann P, Kiesewetter F, Köhn FM, Schill WB, Farah S, Ramos C, et al. 1996. Human Y chromosome azoospermia factors (AZF) mapped to different subregions in Yq11. Hum. Mol. Genet. 5:933–943.
Whitlock MC. 2008. Evolutionary inference from QST. Mol. Ecol. 17:1885–1896.
Wilder JA, Mobasher Z, Hammer MF. 2004. Genetic evidence for unequal effective population sizes of human females and males. Mol. Biol. Evol. 21:2047–2057.
Wilson Sayres MA, Lohmueller KE, Nielsen R. 2014. Natural selection reduced diversity on human y chromosomes. PLoS Genet. 10:e1004064.
Wilson Sayres MA, Venditti C, Pagel M, Makova KD. 2011. Do variations in substitution rates and male mutation bias correlate with life-history traits? A study of 32 mammalian genomes. Evolution 65:2800–2815.
Wood AR, Esko T, Yang J, Vedantam S, Pers TH, Gustafsson S, Chu AY, Estrada K, Luan J ’an, Kutalik Z, et al. 2014. Defining the role of common variation in the genomic and biological architecture of adult human height. Nat. Genet. 46:1173–1186.
Yang J, Benyamin B, McEvoy BP, Gordon S, Henders AK, Nyholt DR, Madden PA, Heath AC, Martin NG, Montgomery GW, et al. 2010. Common SNPs explain a large proportion of the heritability for human height. Nat. Genet. 42:565–569.
Y Chromosome Consortium. 2002. A nomenclature system for the tree of human Y-chromosomal binary haplogroups. Genome Res. 12:339–348.
Yu X-W, Wei Z-T, Jiang Y-T, Zhang S-L. 2015. Y chromosome azoospermia factor region microdeletions and transmission characteristics in azoospermic and severe
32
.CC-BY-NC-ND 4.0 International licenseIt is made available under a was not peer-reviewed) is the author/funder, who has granted bioRxiv a license to display the preprint in perpetuity.
The copyright holder for this preprint (which. http://dx.doi.org/10.1101/230342doi: bioRxiv preprint first posted online Dec. 7, 2017;

oligozoospermic patients. Int. J. Clin. Exp. Med. 8:14634–14646.
33
.CC-BY-NC-ND 4.0 International licenseIt is made available under a was not peer-reviewed) is the author/funder, who has granted bioRxiv a license to display the preprint in perpetuity.
The copyright holder for this preprint (which. http://dx.doi.org/10.1101/230342doi: bioRxiv preprint first posted online Dec. 7, 2017;
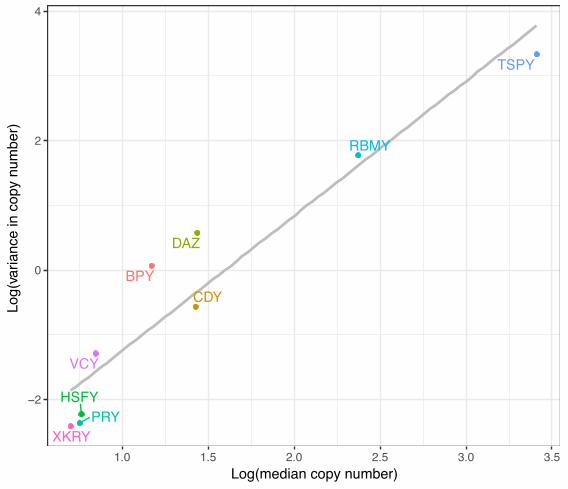
BPYCDY
DAZ
HSFYPRY
RBMY
TSPY
VCY
XKRY
−2
0
2
4
1.0 1.5 2.0 2.5 3.0 3.5Log(median copy number)
Log(
varia
nce
in c
opy
num
ber)
.CC-BY-NC-ND 4.0 International licenseIt is made available under a was not peer-reviewed) is the author/funder, who has granted bioRxiv a license to display the preprint in perpetuity.
The copyright holder for this preprint (which. http://dx.doi.org/10.1101/230342doi: bioRxiv preprint first posted online Dec. 7, 2017;

0.008 nucleotide substitutions / site
4.394.685.014.272.933.64
3.403.783.02
5.604.054.444.57
2.963.66
4.424.833.585.063.94
3.945.023.044.165.55
5.984.945.183.98
3.435.884.355.293.83
3.654.623.613.86
5.783.783.363.894.20
3.114.933.545.164.14
3.403.484.733.544.88
4.303.544.614.015.36
3.533.792.843.994.89
4.565.194.013.874.44
3.815.213.944.803.25
2.754.263.844.332.83
5.513.653.364.054.884.70
4.283.653.84
3.245.094.174.814.53
4.174.104.933.043.174.343.773.99
3.373.343.513.284.233.66
2.782.582.41
3.953.072.833.68
3.532.72
4.543.292.803.893.17
3.034.171.063.243.52
5.863.523.543.11
2.615.753.293.603.83
2.645.692.663.02
8.423.263.233.173.46
2.102.812.734.193.39
3.202.464.432.795.94
3.313.033.483.503.86
2.522.942.063.083.58
3.724.342.872.913.49
2.736.523.943.502.55
1.102.703.263.060.96
3.862.841.822.874.173.70
3.573.143.03
2.303.753.563.433.25
2.993.143.542.652.283.243.183.10
4.30 4.32 5.49 4.33 3.54 3.80
4.39 4.59 4.21
5.51 4.32 3.22 6.12
3.36 4.27
4.21 5.08 4.37 4.60 2.70
4.17 9.55 2.43 3.7710.27
8.95 4.10 3.66 3.87
4.42 6.42 4.36 4.30 2.98
3.80 3.12 3.16 4.21
5.51 4.18 3.73 4.13 5.62
2.26 4.86 4.11 5.50 3.67
5.03 4.02 5.02 4.78 6.66
4.44 3.67 5.01 4.04 4.04
4.10 3.68 4.09 4.10 5.34
5.12 6.35 3.59 4.17 4.88
4.00 8.39 6.20 5.48 4.54
1.80 4.17 3.84 4.00 2.23
5.56 3.15 4.84 4.56 4.30 4.01
4.28 4.09 4.11
2.80 4.45 4.33 5.29 4.36
4.22 3.81 4.65 4.08 2.56 3.91 4.27 3.61
2.542.072.602.452.731.84
2.282.292.09
2.632.691.602.15
1.682.03
2.002.102.282.251.35
2.352.322.301.912.12
2.752.381.681.75
2.192.251.932.351.90
1.901.521.691.97
2.352.042.042.142.49
2.242.752.052.701.96
2.262.062.522.132.41
2.421.842.352.062.13
1.882.222.042.142.28
2.122.122.072.062.26
2.002.242.582.442.52
1.982.302.112.451.17
2.661.602.042.482.082.23
2.062.202.04
2.802.102.122.092.28
2.091.902.172.191.881.922.071.93
11.1611.9712.6812.1416.3910.84
11.6912.0212.56
13.8811.4010.4213.98
11.5010.70
15.0515.0515.0015.3811.33
7.70 9.33 7.77 8.5114.43
11.44 9.0612.15 9.53
12.1015.63 8.9913.7915.12
8.43 8.97 9.3710.88
10.83 9.4811.6411.0411.36
8.19 8.99 8.8711.4410.18
9.72 9.4211.34 7.7111.90
10.9712.7612.0619.4214.41
7.8910.47 9.93 9.60 9.86
12.5012.80 9.4614.5213.70
10.02 9.73 7.9011.10 7.97
10.6213.9313.8413.44 8.12
7.09 9.31 8.00 5.1310.2611.21
9.34 8.46 7.60
9.3912.6611.7910.6710.67
10.07 9.5410.70 8.69 7.48 7.50 8.8310.84
2.182.562.391.381.372.00
2.302.241.93
2.602.102.322.16
2.341.68
2.542.271.922.261.80
2.172.322.002.172.34
2.082.192.252.03
1.802.202.372.101.99
2.051.902.142.24
2.761.702.282.172.75
2.112.271.922.742.20
1.982.943.121.822.03
2.132.242.742.202.66
1.542.111.941.982.29
2.562.412.001.711.99
2.002.551.943.041.62
2.042.102.152.122.04
2.501.961.871.762.392.33
2.201.772.05
2.142.882.472.372.31
1.981.902.331.841.442.242.001.98
2.102.201.861.681.032.23
1.582.001.69
2.981.492.172.20
2.021.71
2.441.981.772.121.94
2.002.041.802.042.21
2.232.022.202.02
2.002.292.052.101.66
1.941.772.061.89
2.691.912.041.992.75
1.891.991.772.352.20
1.721.862.991.622.08
2.102.042.051.902.76
2.082.141.901.682.09
2.281.801.842.042.17
1.882.011.862.471.48
1.922.002.022.152.02
2.121.951.531.542.372.33
1.731.751.95
1.982.171.902.092.21
1.751.982.151.781.591.932.011.86
2.962.853.012.704.812.46
3.062.912.88
2.232.831.762.69
2.872.34
2.302.032.941.551.55
2.622.742.462.132.26
3.232.192.111.83
2.872.371.782.403.90
2.281.522.412.67
2.252.252.582.492.56
2.463.192.162.182.08
2.272.731.942.422.84
2.342.272.723.072.57
2.342.592.892.602.21
2.222.242.142.491.85
4.422.871.802.312.05
1.971.542.983.002.13
2.691.672.012.432.392.14
2.302.702.27
2.102.023.272.092.40
2.492.272.732.332.222.162.302.19
21.5734.3134.0725.0117.0529.15
28.3625.9722.25
33.6025.2432.2626.67
28.6221.87
33.1530.2023.4431.4727.42
26.2130.3229.5028.0133.22
34.7030.5035.5932.79
34.4336.2237.8133.9217.13
29.5725.2330.6330.32
35.5430.8935.0036.5636.59
26.5534.9329.9533.5229.37
28.4827.8340.8629.9429.87
29.6929.0135.6523.0822.98
15.9226.5218.6723.8324.71
27.5228.8127.7623.6427.76
28.5235.8631.1939.5631.30
31.5536.1832.1838.7524.84
37.1230.9626.2835.6834.6234.48
37.8627.0824.54
32.2340.1633.4833.0835.45
29.8935.1440.2832.8029.3931.7235.1635.80
CDY
BPY
DAZ
PRY
RBM
YH
SFY
XKRY
VCY
TSPY
Haplogroup
C
E
G
I
J
L
O
Q
R
T
R
Q
L
T
O
I
J
E
C
G
.CC-BY-NC-ND 4.0 International licenseIt is made available under a was not peer-reviewed) is the author/funder, who has granted bioRxiv a license to display the preprint in perpetuity.
The copyright holder for this preprint (which. http://dx.doi.org/10.1101/230342doi: bioRxiv preprint first posted online Dec. 7, 2017;

TSPY VCY XKRY
HSFY PRY RBMY
BPY CDY DAZ
C E G I J L O Q R T C E G I J L O Q R T C E G I J L O Q R T
2.5
5.0
7.5
10.0
5
10
15
20
1.0
1.5
2.0
2.5
3.0
3
4
5
6
1.5
2.0
2.5
3.0
2
3
4
2
4
6
8
1.5
2.0
2.5
3.0
152025303540
Y haplogroup
Cop
y nu
mbe
r
.CC-BY-NC-ND 4.0 International licenseIt is made available under a was not peer-reviewed) is the author/funder, who has granted bioRxiv a license to display the preprint in perpetuity.
The copyright holder for this preprint (which. http://dx.doi.org/10.1101/230342doi: bioRxiv preprint first posted online Dec. 7, 2017;
�
�
�
�
�
��
�
�
�
�
�
�
�
�
�
�
�
�
�
�
�
�
�
�
�
�
�
�
�
�
�
�
�
�
�
�
�
��
�
�
� �
�
�
�
�
�
�
�
�
�
�
�
�
�
�
�
�
�
�
�
�
�
�
�
�
�
�
�
�
��
�
�
�
�
�
�
�
�
�
�
�
�
�
�
�
�
�
�
�
�
��
�
�
�
−5.0
−2.5
0.0
2.5
−2.5 0.0 2.5− .
2−
.
A
�
�
�
�
�
�
�
�
�
�
�
�
�
�
�
�
�
��
�
�
�
�
��
�
�
�
�
�
�
�
�
�
� �
�
�
�
�
�
�
��
�
�
�
�
�
�
�
�
�
�
�
��
�
�
�
�
��
�
�
�
�
�
�
��
�
�
�
�
�
�
�
�
��
�
�
�
�
�
�
�
�
�
�
�
�
�
�
�
�
�
�
−2
0
2
−2.5 0.0 2.5 5.0
− .
−.
B
0.
−0.
0.0
0.
−0.2 −0. 0.0
− .0
2−20.
C
−0.2
−0.
0.0
0.
0.2
−0.2 −0. 0.0 0.
− .0
−.
D
Y chromosomal SNP genotypes
Ampliconic gene copy number
HaplogroupCEGIJLOQRT
.CC-BY-NC-ND 4.0 International licenseIt is made available under a was not peer-reviewed) is the author/funder, who has granted bioRxiv a license to display the preprint in perpetuity.
The copyright holder for this preprint (which. http://dx.doi.org/10.1101/230342doi: bioRxiv preprint first posted online Dec. 7, 2017;

J I G C E
R Q L T O
0.00
0.25
0.50
0.75
1.00
0.00
0.25
0.50
0.75
1.00
Individuals
Post
erio
r Pro
babi
lity
Match/Mismatchmatch
mismatch
.CC-BY-NC-ND 4.0 International licenseIt is made available under a was not peer-reviewed) is the author/funder, who has granted bioRxiv a license to display the preprint in perpetuity.
The copyright holder for this preprint (which. http://dx.doi.org/10.1101/230342doi: bioRxiv preprint first posted online Dec. 7, 2017;

I
II
III
IV
IX
VVI
VII
VIII
X
XI
XII
XIII
XIV
XIX
XV
XVI
XVII
XVIII
XX
XXI
XXIIXXIII
XXIV
XXIX
XXV
XXVI
XXVII
XXVIII
XXX
XXXI
XXXII
XXXIII
XXXIV
XXXIX
XXXV
XXXVI
XXXVIIXXXVIII
C
E
G
I
J
L
O
Q
R
T
.CC-BY-NC-ND 4.0 International licenseIt is made available under a was not peer-reviewed) is the author/funder, who has granted bioRxiv a license to display the preprint in perpetuity.
The copyright holder for this preprint (which. http://dx.doi.org/10.1101/230342doi: bioRxiv preprint first posted online Dec. 7, 2017;

O2_99
O2_91
C3_69
E1b1b1a_42
R1b1a2a1a2b_29
O3_52
O3_62
R1a1a1_77
R1a1a1_74
E1b1b1_59
E1b1b1_53
L1_97
R1b1a2a1a2c_12
E1b1a_67
I2a1b_86
C3_51
I2a1b_85
I2a1b_88
I2a2a_10
E1b1b1_34
R1b1a2a1a2b_58
G2_11
O3_56
I1_20
T_79
E1b1b1a_72
R1b1a2a1a1_37
R1b1a2a1a2c_28
E1b1b1_44
R1b1a2a1a2c_21
Q1_5
Q1_2
I1_27
I2a2a_25
I2a2a_22
I2a1b_15
R1a1a1_55
E1b1b1_19
T_60
E1b1b1a_46
G2_61
G2_63
R1b1a2a1a2c_31
E1b1b1a_7
O3_30
T_84
J2_71
E1b1a1a1g1a_39
I2a2a_38
E1b1a_48
E1b1a_47
L1_70
G2_78
R1a1a1_26
E1b1a1a1g1a_49
I2a1b_4
E1b1a1a1g1a_43
E1b1a1a1g1a_40
I2a2a_41
J2_66
O1_98
E1b1b1a_23
G2_45
O1_76
J2_94
E1b1a1a1g1a_13
L1_96
C3_16
Q1_33
R1b1a2a1a2c_65
O2_24
L1_75
J2_87
R1b1a2a1a1_6
R1b1a2a1a1_89
R1a1a1_54
C3_3
I1_81
O2_32 E1b1a_17
E1b1a1a1g1a_90
E1b1a1a1g1a_95
E1b1a_8
R1b1a2a1a2b_82
I1_68
J2_80
O2_83
R1b1a2a1a2b_9
I1_64
T_14
R1b1a2a1a1_93
C3_73
O3_1
T_50
Q1_92
R1b1a2a1a2b_35
O1_100
R1b1a2a1a1_18
E
C
G
J
I
O
T
L
Q
R
R1b1_1326 03R1b1_1326 01R1b1_1136 04
R1b1_1136 01
R1b1_1298 01R1b1_727 04
R1b1_727 01
R1b1_878 01
R1b1_1423 01
R1b1_1304 01
R1b1_1433 01
R1b1_797 03
R1b1_797 01 R1b1_1506 05
R1a1_714 01
R1a1_1252 01
Q1a2_1505 01
I2a1_983 05
I2a1_983 01
I2a2_1426 01
I2a2_1089 06
I1a1_1089 01
I1a1_1054 01 I1a1_1214 04
I1a1_995 01
I1a1_1406 03I1a1_1406 01
I1a1_1113 05 I1a1_1113 01
I1a1_1468 01
I1a1_989 01I1a2_749 01
I1a2_623 01
I1a2_890 01
I1a2_1270 06
R
Q
I
A
B
.CC-BY-NC-ND 4.0 International licenseIt is made available under a was not peer-reviewed) is the author/funder, who has granted bioRxiv a license to display the preprint in perpetuity.
The copyright holder for this preprint (which. http://dx.doi.org/10.1101/230342doi: bioRxiv preprint first posted online Dec. 7, 2017;

0
5
10
15
20
25
BPY CDY DAZ HSFY PRY RBMY TSPY VCY XKRYGene
Cop
y nu
mbe
r diff
eren
ce b
/w tw
o ra
ndom
ly p
icke
d ha
plot
ypes
Between haplogroups
Within haplogroups
.CC-BY-NC-ND 4.0 International licenseIt is made available under a was not peer-reviewed) is the author/funder, who has granted bioRxiv a license to display the preprint in perpetuity.
The copyright holder for this preprint (which. http://dx.doi.org/10.1101/230342doi: bioRxiv preprint first posted online Dec. 7, 2017;