coping with complexity: childand adultpoverty · cpag 94 white lion street london n1 9pf coping...
TRANSCRIPT

CPAG 94 White Lion Street
London N1 9PF
Coping with
complexity:child and
adult poverty Mark Tomlinson and Robert Walker

CPAG promotes action for the prevention and relief of poverty among children and
families with children. To achieve this, CPAG aims to raise awareness of the causes,
extent, nature and impact of poverty, and strategies for its eradication and prevention;
bring about positive policy changes for families with children in poverty; and enable
those eligible for income maintenance to have access to their full entitlement. If you are
not already supporting us, please consider making a donation, or ask for details of our
membership schemes, training courses and publications.
Poverty Publication 115
Published by CPAG
94 White Lion Street
London N1 9PF
Tel: 020 7837 7979
www.cpag.org.uk
© Child Poverty Action Group 2009
The views expressed in this book are the authors’ and are not necessarily those of
CPAG.
This book is sold subject to the condition that it shall not, by way of trade or otherwise,
be lent, resold, hired out or otherwise circulated without the publisher’s prior consent in
any form of binding or cover other than that in which it is published and without a similar
condition including this condition being imposed on the subsequent purchaser.
A CIP record for this book is available from the British Library
IBSN 978 1 906076 36 8
Cover and design by Devious Designs 0114 275 5634
Typeset by Boldface 020 7833 8868
Printed by Russell Press 0115 978 4505
Child Poverty Action Group is a charity registered in England and Wales (294841) and
in Scotland (SC039339), and is a company limited by guarantee, registered in England
(1993854).

Acknowledgements
The research on which this book is based was carried out under an ESRCgrant (RES-000-23-1418) and we acknowledge the very important contri -bution made by Glenn Williams of Nottingham Trent University as a co-investigator. We would also like to thank the members of our advisorygroup for their constructive comments and criticisms throughout theresearch: Larry Aber (NYU); Kate Green (CPAG); Stephen McKay (Univer -sity of Birmingham); Mark Shevlin (University of Ulster); and also DirkNachbar, Daniel Foster and Amy Morgan of the Department for Work andPensions. While the merits of the book owe much to all these colleagues,errors, omissions and other inadequacies are ours alone.
Mark TomlinsonRobert Walker

About the authors
Mark Tomlinson is a Senior Research Officer in the Department of SocialPolicy and Social Work, University of Oxford, and a Research Associate ofGreen Templeton College, Oxford. He has worked in several universitiesas a quantitative social scientist, including Nuffield College Oxford;University of Manchester; National University of Ireland, Galway; AalborgUniversity, Denmark; and the University of Birmingham. He has publishednumerous articles in academic journals and books, as well as severalreports for institutions such as the OECD, the European Commission,UNIDO, the Department of Trade and Industry, and the Confederation ofBritish Indus try. He is currently working on poverty and labour marketissues with the aid of a grant from the Joseph Rowntree Foundation.
Robert Walker is a Professor of Social Policy and Fellow of GreenTempleton College, University of Oxford. He was formerly Professor ofSocial Policy at the University of Nottingham and before that Professor ofSocial Policy Research, Loughborough University where he was Directorof the Centre for Research in Social Policy. He is a member of the statutoryUK Social Security Advisory Committee and of the Technical AdvisoryGroup, Department of Social Development, South Africa. He chairs theAcademic Advisory Committee of the ESRC UK Household LongitudinalStudy (Understanding Society) and is a member of the governing board.He is a Research Affiliate of the National Poverty Center, University ofMichigan and a Fellow of the Royal Society of Arts. He has published 19books, 61 research reports and numerous academic articles.
Contents
Preface v i
Summary 1
1 The cause for concern 7
2 Why multi-dimensional poverty is important 15
3 Multi-dimensional poverty in Britain 27
4 The dynamics of multi-dimensional poverty 48
5 Children’s experience of poverty 62
6 Poverty and childhood wellbeing 71
7 Multi-dimensional poverty and policy 87
Appendix: Calculating relative poverty rates 98using the Poverty Index

vi Coping with complexity
Preface
On 18 March 2009 it will be the tenth anniversary of Tony Blair’s commit -ment to eradicate child poverty. This ten-year milestone not only givespause for thought about the difference made to children’s lives and lifechances by this pledge, but it coincides with a range of challenges andopportunities for tackling poverty. To mark this tenth anniversary, the ChildPoverty Action Group will publish two pieces of thought-provoking workaround child poverty and wellbeing intended to stimulate debate, and wewill publish a manifesto of steps to take anti-poverty policy beyond 2010.This report is the first in this series. As well as coinciding with the tenthanniversary, this innovative work by Mark Tomlinson and Robert Walker isparticularly timely.
• The ten-year milestone means we are approaching the target to halvechild poverty by 2010/11. Coping with Complexity demonstrates that,despite the progress on income poverty, the gap between the policy inplace now and what is needed to reach the target is large – Budget2010 is a vital opportunity to get back on track.
• The Government has announced a commitment to enshrine the 2020target in law, strengthening the long-term commitment to child povertyeradication, and requiring a strategy and clear reporting on how thisgoal is being achieved.
• Concerns about unlocking social mobility are rising higher on the policyagenda, with interest being shown from all political quarters and asocial mobility White Paper published in January.
• As well as social mobility, concerns about child wellbeing have alsobeen on the increase (triggered by work for UNICEF showing howpoorly the UK performs on a range of indicators compared with similarcountries). Coping with Complexity adds to this by constructing amod el of child wellbeing, and comparing it to a model of poverty tounderstand better some of the causative links between poverty andpoor child wellbeing.
• We are moving deeper into recession, with unemployment rapidlyclimb ing. The falling-off of labour demand is a serious risk for familiesin general and will affect public finances. However, as this reportargues, a recession is no excuse for failing to take the measures
Preface vii
needed to tackle poverty, and not to do so would worsen child well-being.
Coping with Complexity sheds light on each of these issues and, inparticular, its clear analysis of the interlinked, multi-dimensional nature ofpoverty in the UK gives a clear steer for how the 2020 legislation ought tobe set. Drawing on this research CPAG believes that relative incomesought to be at the heart of measurement (and reporting) of poverty in the2020 legislation, but supporting this, a wider set of multi-dimensionalfeatures of poverty should also be considered in how policy is con -structed. Tomlinson and Walker show not only how important financialstrain is to poverty (not identical to income poverty, but linked), but alsothe limitations of these measures and so the need for a wider approach.Lack of money is at the core of poverty, but other dimensions are alsoimportant. Characteristics such as under standing better the physical andsocial environment, the sigma and psychological strains on families shouldnot replace income measurement, rather these dimensions should con -textualise and widen these measures and help condition better policyresponses.
The recent clamour of debate around social mobility is tightly foc -us ed on children’s future chances (for instance, the Government hasrecently brought in Alan Milburn MP to look at barriers to children frompoorer backgrounds joining key professions) and the Government isincreasingly linking this to its child poverty commitments. This futuresframework is important – one of the most compelling reasons for outrageis the long-term damage poverty does to children, but, as Coping withComplexity argues, achieving child wellbeing is much more than this. Weshould value the quality of childhoods as experienced by children now, notjust their future chances of social progression.
Tomlinson and Walker draw from their analysis a series of con clus -ions about the impact of the recession on adult and child poverty, and indoing so provide food for thought about how the recession should behandled in order to protect children. Two points are worth reiterating.Firstly, expenditure constraints make investment seem harder, but therecess ion should not delay policies to reduce poverty and improve childwellbeing. Even in the absence of economic growth we must care aboutthe position of our children. Secondly, though protecting jobs is nowclearly vital, simply getting people into work does not necessarily lift child -ren out of poverty. Rather, as the authors argue, ‘the ‘important achieve -ment is not work itself, not even well-paid work, but employment with

viii Coping with complexity
prospects that leads to longer-term stability’. The welfare reform debateneeds to move further on from simply getting people into work, to lookingat the quality of employment.
The first ten years of policy to tackle child poverty have led tonotable gains. There has been more investment in children, relativeincome poverty rates have come down (although they rose in 2005/06and 2006/07), a range of new policy initiatives have been taken and childpoverty has been driven to the centre of political debate. We are now at acrossroads, with both the economic crisis threatening this agenda and aseries of opportunities to improve policy for children. Mark Tomlinson andRobert Walker’s analysis offers clear insights into how these opportunitiesshould be used.
Paul Dornan, Head of Policy, CPAG

Summary 1
Summary
Listening to people talk about their experience of poverty, it is clear thatpoverty is complex and multi-dimensional. Poverty is more than simply alack of income. It is the stress caused by the inability to make ends meet,social isolation, and the fatalism and lack of time that prevent politicalengagement. It is the associated material deprivation, poor housing andneighbourhood. Poverty is a product of multiple causes and can havemultifarious, interconnected short- and long-term negative consequencesthat make life difficult to cope with. Such complexity is easily overlookedand frustrates the best intentions of policymakers who are often temptedto tackle single causes and specific outcomes.
Why multi-dimensional poverty is important
The multi-dimensionality of poverty is evident in the official Opportunity forAll report, published annually with 41 indicators of poverty. However, this isvery different from the realisation that poverty is inherently multi-dimen -sional, which requires all indices of poverty to be measured for the sameindividuals so as to capture, insofar as is possible, the multiple complexityof each person’s experience of poverty. Some people may score highly onincome poverty, but be low on stress and material deprivation. Others willhave markedly different profiles across the various dimensions of poverty,arguably experiencing very different kinds of poverty.
The various dimensions of poverty are likely to be causally related,with the possibility that some people may be poor, for example, becausethey are ill and others ill because they are poor. The direction of causality isimportant in devising policy responses and in providing individuals withadvice, but less so in the measurement of poverty. The challenge for theresearcher is to capture the complexity of poverty and for the policycommunity to take note of its implications for the design and delivery ofpolicy.
Multi-dimensional poverty in Britain
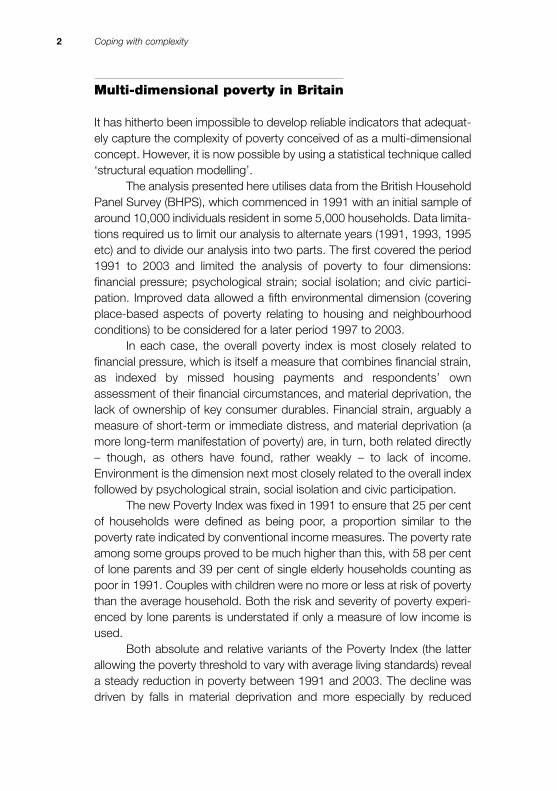
It has hitherto been impossible to develop reliable indicators that ade quat -ely capture the complexity of poverty conceived of as a multi-dimensionalconcept. However, it is now possible by using a statistical technique called‘structural equation modelling’.
The analysis presented here utilises data from the British HouseholdPanel Survey (BHPS), which commenced in 1991 with an initial sample ofaround 10,000 individuals resident in some 5,000 households. Data limita -tions required us to limit our analysis to alternate years (1991, 1993, 1995etc) and to divide our analysis into two parts. The first covered the period1991 to 2003 and limited the analysis of poverty to four dimen sions:financial pressure; psychological strain; social isolation; and civic partici -pation. Improved data allowed a fifth environmental dimension (cover ingplace-based aspects of poverty relating to housing and neigh bourhoodconditions) to be considered for a later period 1997 to 2003.
In each case, the overall poverty index is most closely related tofinancial pressure, which is itself a measure that combines financial strain,as indexed by missed housing payments and respondents’ ownassessment of their financial circumstances, and material deprivation, thelack of ownership of key consumer durables. Financial strain, arguably ameasure of short-term or immediate distress, and material deprivation (amore long-term manifestation of poverty) are, in turn, both related directly– though, as others have found, rather weakly – to lack of income.Environment is the dimension next most closely related to the overall indexfollowed by psychological strain, social isolation and civic participation.
The new Poverty Index was fixed in 1991 to ensure that 25 per centof households were defined as being poor, a proportion similar to thepoverty rate indicated by conventional income measures. The poverty rateamong some groups proved to be much higher than this, with 58 per centof lone parents and 39 per cent of single elderly households counting aspoor in 1991. Couples with children were no more or less at risk of povertythan the average household. Both the risk and severity of poverty experi -enced by lone parents is understated if only a measure of low income isused.
Both absolute and relative variants of the Poverty Index (the latterallowing the poverty threshold to vary with average living standards) reveala steady reduction in poverty between 1991 and 2003. The decline wasdriven by falls in material deprivation and more especially by reduced
2 Coping with complexity

finan cial stress, particularly during the early 1990s, a time when unem -ploy ment, inflation and interest rates were all falling. Psychological strain,social isolation and civic participation persisted at similar levels throughoutthe 13 years, suggesting that financial improvements in people’s lives maynot immediately negate the exclusionary aspects of poverty.
The dynamics of multi-dimensional poverty
Employment is shown to be a strong defence against poverty, defined inmulti-dimensional terms, especially if the work is in a high-status occupa -tion or two or more adults in a household have jobs. However, paid workis not in itself sufficient to sustain a person above the poverty threshold inthe long term; it needs to be full-time employment, preferably in a higherstatus occupation.
Divorce and separation significantly increase the risk of poverty forboth partners, but especially for women. Furthermore, the finding that loneparents are still at substantially increased risk of poverty, even after theirchildren have notionally attained financial independence, underlines thelong-term consequences of relationship breakdown. Moreover, there is noevidence that re-partnering reduces the risk of poverty or that it isgenerally possible to ‘marry’ one’s way out of poverty. Only obtaining full-time employment in the highest status occupations can secure a loneparent sustained protection against poverty.
Children’s experience of poverty
Children are more likely than adults to live in households that are poor. Thisis largely because wages are generally set by market rates and take noaccount of the presence of dependent children. However, the analysisrevealed that the child poverty rate fell faster than adult poverty, especiallybetween 2001 and 2003, at which time the Government’s policies toreduce child poverty would have been beginning to have an effect. Childpoverty measured multi-dimensionally fell faster than income poverty, butpoverty associated with parental psychological stress declined only slowlyand haphazardly. Lone parents were more likely than other adults toexperience psychological stress and parents in couples less so.
Summary 3

Interestingly, children are only rarely found in households experienc -ing material deprivation, possibly because deprivation is poorly measured.However, the finding underlines the importance parents attach to con -sumer goods that make servicing children’s basic needs more manage -able and electronic equipment that can provide entertainment, educationor both. These findings illustrate the additional costs associated withbring ing up children and the extreme relative deprivation likely to beexperi enced by the small number of children who live without access tosocial necessities, such as central heating, a washing machine or apersonal computer.
The risk of poverty is highest for children living in households inwhich the head has a disability or long-term illness, is a lone parent or, likeother adults in the household, does not work. Income-based measuresappear to exaggerate the importance of worklessness, social housing andhousehold size as factors associated with child poverty compared withthe multi-dimensional measure.
Poverty and childhood wellbeing
Poverty affects the wellbeing of children, contributing to low self-worthand increased risky behaviour while detracting from educational orienta -tion and engagement in home life. The strongest negative effect appearsto be on home life, followed by that on educational orientation. In contrast,income poverty only has strong detrimental effects on home life andeducational orientation.
Financial strain affects all four dimensions of child wellbeing. Poorhousing conditions and deprived neighbourhoods are associated withreduced quality of home life, low self-worth and risky behaviour, butmater ial deprivation only increases risky behaviour and negatively affectshome life. Children in lone-parent families do less well on all dimensions ofwellbeing irrespective of income.
The policy implications of this analysis are direct. Improving homelife could be achieved by tackling any dimension of poverty but mosteffectively by reducing financial pressure. If the goal is to enhance educa -tional performance, then alleviating financial strain and encouraging civicparticipation of parents may be important strategies since these appear tomediate the effects of poverty on child wellbeing. However, if the aim is toachieve the greatest improvement in wellbeing overall, improving the
4 Coping with complexity

home and neighbourhood environment is likely to be more effective thanreducing material deprivation.
Multi-dimensional poverty and policy
The policy logic that follows from recognition of the true complexity of poverty is both radical and familiar. Within employment policy it isalready recognised that a personalised, multi-faceted service is required to assist jobseekers success fully into employment. A similarly holistic policyapproach needs to be applied to poverty in which the different dimensionsare separately and comprehensively addressed.
It would be understandable, though undoubtedly wrong, to ignorethe need for a comprehensive strategy at a time of recession whendemands on government are high and expenditure constraints are at theirmost severe. If job layoffs turn into a deluge of redundancies, the tempta -tion may be to increase conditionality so as to encourage jobseekers totake ‘any job’, overlooking the findings that only quality jobs offer sus -tained protection against poverty, defined to embrace psychologicalstress, social isolation and environmental factors as well as financial stressand material deprivation.
A deep recession might also cause government to neglect theimpact of separation and divorce on the risk of poverty for the adults andchildren affected. Children additionally suffer a generalised diminution ofwellbeing with lowered self-esteem, poorer home life and an enhanced riskof engaging in risky behaviour. As well as better benefits to reduce the riskand severity of poverty, there is a need for increased support to coupleswho have recently separated, especially when children are involved.
The analysis also points to the need for a redefinition of the problemof child poverty, focusing more on immediate wellbeing than the dis -advantage as adults. Parental poverty has immediate effects on allaspects of the wellbeing of children. Therefore, any increase in povertyassociated with recession is likely to have an instant impact as well asincreasing vulnerability to disadvantage later in life. It follows that existingpolicies to raise family incomes and promote adult employment should beaccompanied by a range of new policies, some of which might need to beexplicitly child-focused.
Addressing the different dimensions of poverty is likely to have arange of beneficial effects on children. For example, our analysis suggests
Summary 5

that implementing a more comprehensive and coherent neighbourhoodregeneration policy could improve all aspects of child wellbeing. Further -more, if such a policy were able to incorporate significant elements of localparticipation, this might be doubly effective since the analysis found thatcivic participation by parents had a surprisingly high impact on childwellbeing. The analysis also points to the need to explore ways in whichthe psychological strain of adults in poor households can be alleviated –as this negatively affects the mental wellbeing of the children, as well asundermining home life.
6 Coping with complexity
OneThe cause for concern
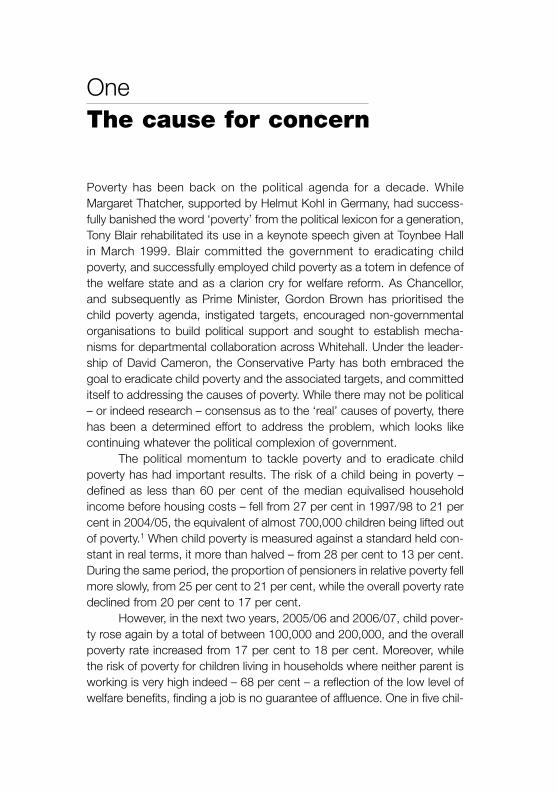
Poverty has been back on the political agenda for a decade. WhileMargaret Thatcher, supported by Helmut Kohl in Germany, had success-fully banished the word ‘poverty’ from the political lexicon for a generation,Tony Blair rehabilitated its use in a keynote speech given at Toynbee Hallin March 1999. Blair committed the government to eradicating childpoverty, and successfully employed child poverty as a totem in defence ofthe welfare state and as a clarion cry for welfare reform. As Chancellor,and subsequently as Prime Minister, Gordon Brown has prioritised thechild poverty agenda, instigated targets, encouraged non-governmentalorganisations to build political support and sought to establish mecha-nisms for departmental collaboration across Whitehall. Under the leader-ship of David Cameron, the Conservative Party has both embraced thegoal to eradicate child poverty and the associated targets, and committeditself to addressing the causes of poverty. While there may not be political– or indeed research – consensus as to the ‘real’ causes of poverty, therehas been a determined effort to address the problem, which looks likecontinuing whatever the political complexion of government.
The political momentum to tackle poverty and to eradicate childpoverty has had important results. The risk of a child being in poverty –defined as less than 60 per cent of the median equivalised householdincome before housing costs – fell from 27 per cent in 1997/98 to 21 percent in 2004/05, the equivalent of almost 700,000 children being lifted outof poverty.1 When child poverty is measured against a standard held con-stant in real terms, it more than halved – from 28 per cent to 13 per cent.During the same period, the proportion of pensioners in relative poverty fellmore slowly, from 25 per cent to 21 per cent, while the overall poverty ratedeclined from 20 per cent to 17 per cent.
However, in the next two years, 2005/06 and 2006/07, child pover-ty rose again by a total of between 100,000 and 200,000, and the overallpoverty rate increased from 17 per cent to 18 per cent. Moreover, whilethe risk of poverty for children living in households where neither parent isworking is very high indeed – 68 per cent – a reflection of the low level ofwelfare benefits, finding a job is no guarantee of affluence. One in five chil-

dren (20 per cent) in households where one parent works full time and theother stays at home remain in poverty. Only when both parents work – onefull time and the other part time – or when a lone parent is employed fulltime does the risk of poverty faced by a child (3 per cent and 7 per centrespectively) fall below that of an average person. Given that the Gov -ernment had hoped to lift 25 per cent of children out of poverty by2005/06 and achieved a 21 per cent reduction, the goal of a 50 per centreduction by 2010/11 now appears to be immensely challenging.
It is true that a number of important policy changes have beenmade that would not have had a chance to show up in the figures citedabove. These include increases in the level of the child element of child taxcredit and in child benefit for the first child and the disregarding of childbenefit in calculating income used to means-test housing benefit. TheGovernment calculates that planned extra expenditure of about £2 billionwill take about 500,000 children out of poverty, about half the numberrequired to reach the 2010/11 target.2 There is clearly a need to reinvigo-rate policies to eradicate child poverty and substantially to reduce the levelof poverty experienced by other groups.
8 Coping with complexity
Figure 1.1
Trends in poverty, 1994/05 to 2006/07
Source: Department for Work and Pensions, Households Below Average Income: an analysis of the incomedistribution 1994/95–2006/07, DWP, 2008
Pov
erty
rat
e (%
)
40
35
30
25
20
15
10
1988
/89
1991
/92
1993
/95
1995
/97
1994
/95
1996
/97
1998
/99
2000
/01
2002
/03
2004
/05
2006
/07
Total
Children
Pensioners

Recognising the reality of poverty
Disappointing though the results of anti-poverty measures have proved tobe, few policy makers ever expected that the task of eradicating povertywould be an easy one. To illustrate this, the Child Poverty Action Group(CPAG) has been in existence since 1965. It is widely regarded as one ofthe most effective political lobbying organisations in Britain, not leastbecause its campaigns are underpinned by empirical research andsophisticated policy analysis. Its intellectual credibility and policy sophisti-cation means that it has remained influential irrespective of the party inpower. Nevertheless, the telling fact is that poverty has risen more than ithas fallen during the four decades of CPAG’s existence.
The research conducted by CPAG and others helps to illustrate thechallenges confronting policy makers. Poverty is a complex phenomenon.Most obviously, poverty refers to the lack of resources required to meetthe basic needs of individuals living in a family or household. However,basic needs are likely to change over time as the economy grows, livingstandards rise, and the expectations and demands created by societyalter. This means that poverty cannot simply be eradicated by the eco-nomic growth delivered by a successful economy, since greater wealthserves to increase the threshold distinguishing poor people from all oth-ers. Instead, it is necessary to redistribute resources between the twogroups, meaning that a more affluent portion of the population will need toforgo income, or increases in income, in order to lift others out of poverty.For this reason, and others to do with differing attitudes and ideology,basic needs are themselves contested, making it difficult to build politicalsupport for tackling poverty.3 Nevertheless, as an important prerequisitefor creating popular backing for anti-poverty policies, the JosephRowntree Foundation has demonstrated that it is possible for laypeople toreach a consensus about the standard of living that families need to enjoyif they are to avoid poverty.4
Poverty is more than simply a lack of income. It is equally the stresscaused by a family’s inability to make ends meet. It is the poor housing orhomelessness, the lack of facilities, infrastructure and stimulation, the fearof crime and the possible lack of respect resulting from living in a deprivedarea. It is the inability to acquire or renew possessions and the reducedopportunities to fulfil personal ambitions or to exploit opportunities inemployment, sport, education, the arts and/or in the local neighbourhood.It is the lack of personal contacts, sometimes arising from the inability to
The cause for concern 9

reciprocate, the perceived futility of political engagement and the poorphysical and mental health, itself a product of bad living conditions, day-to-day pressure and debilitating personal circumstances.
This multi-dimensionality of poverty is now recognised by theGovernment. Each year it publishes the Opportunity for All report, whichincludes 41 different indicators of poverty.5 The New Policy Institute annu-ally publishes an additional set of 50 indicators.6 However, one problemwith this plethora of indicators is that it can lead to a vacuous debate asgovernment spotlights measures that show improvement and critics focuson indicators that have worsened, thereby dissipating public attention andpolarising political discussion.
Another problem with multiple indicators, one that is exacerbatedwhen indicators are framed as targets, is that policy is devised to max-imise the impact on one aspect of poverty to the possible detriment ofothers. To the extent that poverty is truly multi-faceted with the variousdimensions being interactive, cumulative or both, targeted policies arelikely to be minimally effective on the problem as a whole, equivalent tosticking an elastoplast on a malignant rash.
Poverty is caused by many factors and has many, often negative,effects. Some babies are born into poverty and, less frequently, spendtheir entire childhoods in poverty, with the consequence that the statisti-cal likelihood that they will grow up to be poor in adulthood is muchincreas ed.7 Some people become poor in early adulthood if they have lim-ited skills, are in poor health or have children before they are able to estab-lish a secure foothold in the labour market. Others may become poor laterin life because of a plethora of reasons that affect them directly or indirectlyincluding accident, ill health, pregnancy and childbirth, relationship break-down, unemployment and redundancy. Some will remain poor; others,albeit a small proportion, will go on to enjoy a life of affluence. Most willcarry forward the scars of poverty; once poor, the probability of becomingpoor again rises noticeably. Poor children achieve lower exam results,8
experience more poor physical and mental health as children and adults,9
are more likely to be affected by and to engage in crime10 and to experi-ence worklessness as adults than their non-poor contemporaries.11
Adults with intermittent work histories and low pay have a high risk ofbeing poor in old age, not least because the social security and pensionsystems tend to map the inequalities experienced in work onto retirement.
Poverty is further complicated by the rapidity of social change andby fluctuations in individual circumstances. Not long ago, policy debatescontrasted the poor with the non-poor as if the two groups never changed
10 Coping with complexity
places. In fact, there is a great deal of ‘churning’, with more than half ofBritons having had an annual income below the poverty threshold at leastonce in the last decade. The majority of spells of poverty are short-lived.However, most poor people experience more than one spell of povertyand some people remain poor for long periods: 17 per cent of childrenwere poor in three of the four years between 2002 and 2005 as were 13per cent of pensioners.12 Policy rarely discriminates between the differentkinds of poverty – transient, occasional, recurrent, chronic and permanent– and yet there is evidence, albeit mostly from abroad, that different socialgroups are differentially prone to the various kinds of poverty with diverseshort- and long-term consequences.
Poverty, then, is a multi-faceted phenomenon of considerable com-plexity. The product of multiple causes, it often has multifarious negativeconsequences that make life hard to live and sometimes very difficult tocope with. Its effects are both short and long term. In a world of soundbites, such complexity is easily overlooked.
Responding to the complexity of poverty
The failure of the Government to stay on track towards eradicating pover-ty is explicable in many ways: hesitant political leadership in the context oflimited popular support; excessive concern about the hostility of the medi-an voter; unanticipated events, notably 9/11, 11/7 and Iraq; political expe-diency and the failure to align benefit rates with poverty thresholds; and,more recently, the collapse of confidence in the global economy. Less self-evident, although still of considerable importance, has been the collectivefailure adequately to confront the inherent complexity of poverty, both itsnature and causality.
Modern politics, driven as it is by media interest and short attentionspans, cannot easily accommodate nuance and difference. Likewise, policies to be delivered nationally by a variety of government, private andvoluntary organisations favour simplified bureaucratic solutions that canbe readily communicated, easily computerised and straightforwardlyaudited. Nevertheless, if policy is to be effective, there is a need to recog-nise that the diversity in the causes and effects of poverty calls for differ-entiated policy responses. The commitment to personalised and tailoredservices provided by Jobcentre Plus reflects a comparatively new appre-ciation of this need. However, the precise pattern of causality is not well
The cause for concern 11

understood in relation to the many dimensions of disadvantage that definethe experience of poverty. Do, for example, poor people living in deprivedneighbourhoods suffer more than low-income families in affluent neigh -bour hoods, and is it better to target policies on poor areas or poor fami-lies?13 Even the seemingly simple question of whether tenants in socialhousing are income poor because they are social tenants or social tenantsbecause they are income poor is contested with quite bizarre policy impli-cations.14
Likewise, the diversity in the nature and experience of povertyrequires the sensitive application of a greater range of policy interventions,while an understanding of the temporal characteristics of poverty mayhelp in achieving this through improved targeting. The occurrence ofevents that can precipitate poverty is far greater than the number of peo-ple who experience poverty as a consequence.15 There is potential, there-fore, to identify factors that mediate the negative consequences of eventsand to extend protection to those who would otherwise be more exposed.Similarly, people who have experienced one spell of poverty are measur-ably more at risk of experiencing poverty again and could be targeted withpreventative interventions. Furthermore, if the type of poverty in terms ofits severity or likely duration could be assessed at onset, then tailored sup-port could again be offered.
It is in this context, therefore, that the research reported in this bookseeks to explore the complexity of the phenomenon of poverty not, asacademics are sometimes wont to do, simply for its own sake, but ratherto exploit an understanding of the complexity to inform the design of bet-ter, more effective policy. Underpinning this investigation is a set of novelstatistical techniques, generally referred to as ‘structural equation model-ling’, that allow us to handle the complexities of real life more efficientlythan has hitherto been possible. However, for the most part we focus onthe findings and the lessons rather than the methodology that makes thisnovel investigation possible.
The remainder of the book is organised as follows. The multi-dimensional nature of poverty is first explored in Chapter 2 and then, inChapter 3, the extent of multi-dimensional poverty in Britain is mapped outand its development plotted throughout the 1990s and early 2000s. InChapter 4, attention shifts to the dynamics of multi-dimensional povertyand to two questions in particular: can poverty trajectories be predictedand what could be done to prevent the continuation of repeated spells ofpoverty. In Chapter 5, we discuss the overall state and prevalence of childpoverty in the UK, while Chapter 6 examines the consequences of family
12 Coping with complexity

poverty for the wellbeing of children and young people, not in the futurewhen they reach adulthood, but in the here and now. It shows that vari-ous dimensions of family poverty affect children in different ways and thatdistinctive policy measures are required to stem the negative conse-quences of poverty. Finally, in Chapter 7 we return to consider in moredetail the policy implications for tackling poverty.
Notes1 Department for Work and Pensions, Households Below Average Income: an
analysis of the income distribution 1994/95–2006/07, Department for Work and
Pensions, 2008
2 Joseph Rowntree Foundation, Child Poverty Updates, June 2008: progress
since 2006, Joseph Rowntree Foundation, 2008, available at www.jrf.org.uk/
child-poverty/updates.asp (accessed 11 September 2008)
3 M Orton and K Rowlingson, Public Attitudes to Economic Inequality, Joseph
Rowntree Foundation, 2007
4 J Bradshaw and others, Minimum Income Standards in Britain, Joseph
Rowntree Foundation, 2008
5 Department for Work and Pensions, Opportunity for All: indicators update 2007,
Department for Work and Pensions, 2008, available at www.dwp.gov.uk/ofa/
reports/2007/OpportunityforAll2007.pdf (accessed 11 September 2008)
6 G Palmer, T MacInnes and P Kenway, Monitoring Poverty and Social Exclusion
2007, New Policy Institute, 2007, available at www.poverty.org.uk/reports/
mpse%202007.pdf (accessed 11 September 2008)
7 J Hobcraft, Continuity and Change in Pathways to Young Adult Disadvantage:
results from a British birth cohort, CASE Paper 66, Centre for Analysis of Social
Exclusion, London School of Economics, 2003
8 National Statistics, National Curriculum Assessment, GCSE and Equivalent
Attainment and Post-16 Attainment by Pupil Characteristics in England,
2006/07, Department for Children, Schools and Families, 2007
9 HM Treasury, Ending Child Poverty: everybody's business, HM Treasury, 2008,
available at www.hm-treasury.gov.uk/media/d/bud08_childpoverty_1310.pdf
(accessed 11 September 2008)
10 J Neale, ‘Children, Crime and Illegal Drug Use’, in J Bradshaw and E Mayhew
(eds), The Well-being of Children in the UK, Save the Children, 2005
11 J Griggs with R Walker, The Costs of Child Poverty for Individuals and Society:
a literature review, Joseph Rowntree Foundation, 2008
12 Department for Work and Pensions, Households Below Average Income: an
analysis of the income distribution 1994/95–2006/07, Department for Work and
Pensions, 2008, p169
The cause for concern 13
13 J Griggs, A Whitworth, R Walker, D McLennan and M Noble, Person or Place-
based Policies to Tackle Disadvantage? Not knowing what works, Joseph
Rowntree Foundation, 2008
14 For example, the then newly appointed former housing minister Caroline Flint
questioned ‘whether it would be right to ask new tenants who can work to sign
‘commitment contracts’ when getting a tenancy, agreeing to engage with job-
seeking or training in return for better support’, New Statesman, 12 February
2008
15 R Walker, ‘Opportunity and Life Chances: the dynamics of poverty, inequality
and exclusion’, in P Diamond and A Giddens (eds), The New Egalitarianism,
Polity Press, 2005, pp69-85
14 Coping with complexity

TwoWhy multi-dimensional poverty is important
For a not insignificant number of people the problem of poverty in Britainis a no-brainer; there simply is none.
This view, that poverty has been extinguished by economic andsocial progress, was one espoused by Margaret Thatcher across the cap-itals of Europe and it did her little political harm at home. Often people whohold to this position understand poverty to be a near-death state of abjecthunger and distress, epitomised by ‘images of malnourished ‘third-world’children, or if pressed to consider the British context, a bygone age ofDickensian squalor’.1 Opinion polls typically suggest that around 40 percent of people believe that there is very little poverty in Britain today.2
In most surveys, however, people who believe poverty is a problemthat has largely been consigned to history are outnumbered by the smallmajority of Britons who would argue that there is ‘quite a lot of poverty inBritain today’. This discrepancy of view does not seem to be one that isshaped by either knowledge or experience. Rather, it appears to reflectdifferences in deep-seated values. Some people consider that povertyresults from indolence exacerbated by high benefits and profligate publicexpenditure. Overwhelmingly this group tends to adhere to a strict defini-tion of poverty (‘someone cannot eat and live without getting into debt’)and thereby to conclude that poverty is no longer a problem in Britain. Incontrast, people who believe that poverty is the product of unfairness andsocial injustice, low benefits and insufficient government action are muchmore prepared to countenance a definition of poverty that refers to a per-son’s inability to buy ‘things that others take for granted’ and therefore toaccept that poverty continues to be a scourge in Britain. It is hardly sur-prising, therefore, that it has proved so difficult to build a popular consen-sus to invest in eradicating poverty.
Moreover, very few people admit to being poor. Rather they useterms such as struggling, money being tight, being hard up or having ahard time to describe their circumstances. This failure to self-diagnosepoverty may reflect the sense of shame that attaches to poverty. This is

externally reinforced by stigmatising language and procedures encoun-tered when dealing with public agencies, and by the attitudes and expec-tations of the public at large. Moreover, the fact that most people inpoverty see themselves as coping well in adverse circumstances andbeing better off than many others does not accord with the popular notionof poverty as penury and the result of moral failings and budgeting incom-petence.
What people on low incomes report is a situation of great complex-ity in which the pressures they face are cumulative.3 Basics become luxu-ries that have to be prioritised and saved for. Solutions to one problemcreate problems of their own, as when saving on heating exacerbates ill-ness and borrowing from the rent money generates arrears and threats ofeviction. Poverty feels like entrapment when options are always lacking,the future is looming and unpredictable and guilt seems ever present, aris-ing from an inability to meet one’s children’s needs, one’s own expecta-tions and society’s demands.
That large numbers of people confront the problems of poverty dailyis indisputable, despite being seemingly invisible to a large minority of theirfellow citizens. What is also the case is that the complexity of poverty andthe experience of poverty is seldom given adequate attention in policydebates, be it in discussions of the measurement of poverty or in thedesign and implementation of policies to combat it. This book seeks torectify this omission and to place the complex experience of poverty at theheart of the analysis in the hope that this will lead to the prospect of moreeffective policy. To this end, in this chapter, we explain the reasons whydebates about poverty have come to be oversimplified before setting outthe case for viewing poverty multi-dimensionally.
The early days of measurement
The early pioneers who researched poverty, Henry Mayhew,4 CharlesBooth5 and Seebohm Rowntree,6 all grappled with its complexity.Rowntree notably distinguished between different categories of povertyand recognised the need to take account of social conditions, diet andhealth as well as income in assessing living standards. However, in thenineteenth century, for those who looked, poverty was self-evident, withlarge numbers existing in squalor, without sufficient food, decent clothingor adequate heating or sanitation. The pioneers’ interest in measuring
16 Coping with complexity
poverty was moral and instrumental rather than scientific; they wanted tomobilise political support so as to ameliorate the conditions of the poor.Moreover, this goal demanded that they show that poverty was due to alack of resources rather than to profligate spending. Hence, these pio-neers paid considerable attention to establishing how much income theirpoor respondents had, as well as how much it cost to provide for thebasic necessities of life.
The focus on income proved enduring, partly because income iscomparatively easy to measure – or would seem to be. It provides thebasis for the United Nations’ Millennium Development Goals – income lessthan one or two dollars a day – and constitutes the core component of theUK child poverty target – household income less than 60 per cent of themedian. However, the apparent simplicity of measurement is largely illu-sory. Income is typically under-reported in surveys, partly because peopleoften mistakenly equate income with earnings and/or with cash therebyomitting sources such as interest payments and income in kind. Incomefluctuates much more than consumption, meaning that income-basedmeasures suggest that living standards oscillate much more than theyprobably do. It is also difficult to know how income is allocated within fam-ilies, to children for example, and how far this equates with needs.
More important however, it might be argued that income is merelyan indirect measure of poverty, since poverty is really experienced as theinability to consume at a level that would enable someone to engage in anormal way of life. Ringen takes this view, noting that true poverty is man-ifest as deprivation, ‘visible poverty’, self-evident to those who look.7
Moreover, he argues that low income and deprivation are intrinsically dif-ferent and can lead to contrasting policy responses. Whereas incomepoverty could be eradicated by ensuring that poor people are given theprecise amount of additional income to lift them above the poverty line,such additional income would not guarantee reduced deprivation.
Poverty in the here and now
People who deny that poverty exists in Britain tend to take an absolutistview of poverty; that it is a matter of life and death. US commentators onthe British scene, such as Charles Murray, are apt to take a similar view,not least because the US poverty standard is fixed as a multiple of moneyneeded for food and is only uprated in line with prices.8 In Britain, even at
Why multi-dimensional poverty is important 17

the turn of the twentieth century, Rowntree was aware of the necessity totake account of needs beyond mere subsistence.9
Coinciding with the foundation of CPAG, Brian Abel-Smith andPeter Townsend recognised that the basic necessities were changing asthe austerity of earlier years gave way to growing affluence for an increas-ing number of people.10 They also appreciated that, simultaneously, a lackof income was preventing some people from engaging in the activities andexpenditure expected of them, causing them to be excluded and stigma-tised. They argued eloquently for a relative definition of poverty and intro-duced one in their book, The Poor and the Poorest. This set variousincome thresholds that were expressed as different percentages abovethe prevailing rate of means-tested benefits (then called national assis-tance) and which indicated varying degrees of hardship.11
Subsequently, measures of relative poverty have been refined, withthresholds set as a proportion of median equivalent household income.Equivalent income is income that is adjusted in an attempt to take accountof differences in household size and composition, and the varying needs ofadults and children. Median income is used as a reference point, ratherthan the mean (the simple average), because it is less affected by theincomes of the comparatively small number of extremely rich households.While in some respects these measures are an improvement on Brian Abel-Smith and Peter Townsend’s index, they have certain defects. First,because they are not tied to benefit levels they do not provide a directmeasure of the effectiveness of policy; in the US some benefit rates are setrelative to the poverty line but British governments have never explicitly setbenefits to be at or above the poverty line. Secondly, the measures relateto income poverty which, as already noted, provides only a partial, andarguably biased, measure of true poverty. Thirdly, and for associated rea-sons, relative income measures can sometimes generate perverse results.Income inequalities often tend to increase during periods of high econom-ic growth (which increases median income and hence the associatedpoverty thresholds) at a faster rate than incomes rise overall. As a conse-quence, at times when almost everybody, including low-income families, isgetting richer, the observed poverty rate will actually rise, while the reversecan be true during economic recessions. Furthermore, when the economyis growing, poor households are likely to experience some improvement intheir absolute living standards, in the number or quality of products or serv-ices that they purchase, which will go unrecorded in statistics measuringrelative poverty. The Government therefore now produces a series ofpoverty statistics in which the poverty line is held constant in real terms.12
18 Coping with complexity
Peter Townsend was aware of the partial nature of income meas-ures, later arguing that poverty was not the lack of income necessary topurchase a basket of goods, but rather the lack of resources required toparticipate fully in society.13 He compiled a list of common items and activ-ities and showed that many people on low incomes went without them,although he was criticised for his ‘arbitrary’ selection of indicators and forpresuming that people who lacked items were invariably deprived by lackof income rather than through the exercise of choice and personal prefer-ence. Subsequently, many studies of deprivation have avoided the prob-lem of ‘deprivation through choice’ by explicitly asking respondentswhether or not they lacked possessions or failed to engage in activitiesbecause of a shortage of income.14 The possessions and activities select-ed as indicators are now often chosen because a majority of the popula-tion considers them to be ‘social necessities’ that ‘nobody should have todo without’.15 Such ‘majoritarian’ or ‘consensual’ measures are inherent-ly relative.
Studies that compare material deprivation and income povertyshow them to be only moderately correlated. Calandrino, for example,finds 32 per cent of British lone parents to be both poor and multiplydeprived and another 36 per cent to be either poor or deprived.16 Suchfindings lend support to Ringen’s contention that the two concepts aredistinct and should be differentiated although the lack of association mightsimply be the result of measurement error.17 The differences betweenincome poverty and deprivation could also be a product of the ways thatfamilies cope in times of adversity. There are likely to be time lags betweena drop in income and the depreciation or sale of assets that might follow.Indeed, asset sales might precede a drop of income if families adoptedthe strategy to prepare for harder times. Whatever the reason, differencesbetween income poverty and deprivation point to the need simultaneous-ly to measure and report both, a strategy that has now been adopted bythe Government. This approach has the further advantage that depriva-tion measures are less affected by the perverse effects of economicgrowth and changes in income inequality.
For many years, Britain did not have an official poverty standard,although by convention a relative income measure was adopted with thethreshold set at household income below 60 per cent of the median.Since 2003, this measure has been taken by the Government as one ofthree used to monitor progress towards the eradication of child poverty.18
The second is an absolute measure – the 60 per cent threshold fixed atthe 1998/99 level – and the third is a composite measure, counting the
Why multi-dimensional poverty is important 19

numbers who are both materially deprived and have an income below 70per cent of contemporary median equivalised household income. Thesethree measures are intended to be supported by other multi-dimensionalindicators included in the annual Opportunity for All publication.
It would be churlish not to acknowledge the progress made in theofficial measurement of poverty and wrong to deny a political commitmentto tackle the problem. Nevertheless, the measures currently employed fallfar short of capturing the multi-dimensional experience of povertydescribed above.
Multi-dimensional poverty
Poverty is not just the absence of income or even the material deprivationthat accompanies it. It is both of these and everything that follows fromthem: the hassle; the stress; the hard work; the budgeting; the conflict;the shame; the degraded environment; the isolation; the helplessness; theill health; the misfortune – and much else that, taken together, is both areasoned and involuntary response to hardship and which may, quiteoften, serve to exacerbate it.
Social exclusion first entered the British political vocabulary in the1980s when European governments insisted on continuing debates aboutpoverty in opposition to Margaret Thatcher and Helmut Kohl. Social exclu-sion became a euphemism for poverty. With the creation of the defunctSocial Exclusion Unit (now the Social Exclusion Task Force) in 1997, socialexclusion was re-interpreted ‘to be more than income poverty’:
It is a shorthand term for what can happen when people or areas have a
com bination of linked problems, such as unemployment, discrimination,
poor skills, low incomes, poor housing, high crime and family breakdown.
These problems are linked and mutually reinforcing. Social exclusion is an
extreme consequence of what happens when people don't get a fair deal
throughout their lives, often because of disadvantage they face at birth, and
this disadvantage can be transmitted from one generation to the next.19
This shorthand emphasises the multi-dimensionality of social exclusion,the reinforcing nature of the various forms of disadvantage and its extremeconsequences. Leaving aside, for the moment, the fact that the TaskForce applies the concept of social exclusion to areas as well as individu-
20 Coping with complexity

als, social exclusion could equally be characterised as severe poverty.Whereas poverty is traditionally thought of as a state, with poor peoplecontrasted with the non-poor, and all poor people assumed to be prettymuch the same, it might be more accurate to view poverty as a matter ofdegree. The same reinforcing dimensions of disadvantage apply to allpeople in poverty but to a different degree. In terms of measurement, eachpoor person would have a set of scores, one for each dimension, with thedegree of poverty indicated by the accumulated scores. (The samedimensions could equally be applied to the non-poor as, indeed, they arein Chapter 3.) People’s scores on the various dimensions are likely tochange over time, not least because of the reinforcing nature of disad-vantage. Social and psychological supports that protect people, goodphysical and mental health, social capital and competence, and civicengagement, can all be casualties of low income and may, in certain cir-cumstances, be compounded if mediated by the negative characteristicsof poor places, such as dilapidated infrastructure, isolation, crime and red-lining. This can result in people being caught in a destructive social andeconomic down-current, although, equally, there is considerable evidenceof poor people resisting such forces through a mixture of their ownagency, appropriate support and good fortune.20
What are the dimensions of disadvantage that comprise poverty?Clearly the accoutrements, or lack of them, that would enable Ringen toidentify visible poverty. These would include: housing and housing quality;fuel and warmth; clothing (the amount, its quality and whether fashionableor otherwise); material deprivation (defined quite broadly to include furni-ture, soft furnishings, white goods and electronics including those used forentertainment); and access to transport. Such commodities, to exploit thelanguage and ideas of Amartya Sen, enable people to function adequate-ly in society and, in Britain, are largely acquired through spending andhence are dependent on income and savings, which would ideally be sep-arately measured.21 To these commodities, one could add others thatwould help a person function economically – for example, access to cred-it, insurance and childcare.
A dimension often neglected in policy debates, but which loomslarge in the experience of poor people, is the stress associated with pover-ty. This manifests itself in many ways. It is the constant prioritising and jug-gling; the anxiety; the fighting of the structure and seeming inflexibility ofthe benefits system; the conflict with officialdom and with partners; theinability to say ‘yes’ to a child who refuses to take ‘no’ for an answer; thelack of space and time; the absence of satisfaction; the humiliation, low
Why multi-dimensional poverty is important 21
esteem and sense of helplessness. It is perhaps possible to distinguishbetween the direct financial stress or distress of debt and going withoutand its emotional consequences. Indeed, Sen argues, that while povertyis relative, differing according to context, poverty experienced as shame isabsolute, everywhere the same, arising from people’s inability fully to func-tion as members of their community.22
Closely related to the dimension of shame is that of health. Manystudies have shown physical and mental ill health to be either a cause ora consequence of income poverty.23 So close and so ubiquitous is therelationship that it is sensible always to register the health of a person withlow income. Clearly, the affluent are not immune to poor health, but poorpeople seldom fully escape it.24
Similarly associated with stress is the social isolation frequentlyreported as a manifestation or consequence of poverty and which itselfcan be a risk factor associated with downward spirals into social exclu-sion. Not only does it typically cost money to engage in the reciprocity thathelps support social networks, it requires confidence and emotional ener-gy that can be drained by living on a tight budget.25 Once marginalised,the effect becomes self-reinforcing, leaving the person with few contactsto whom to turn for practical, financial or emotional support. There is con-siderable evidence too that poor people often have limited social capitalwith few links that bridge social domains, and are either frequently exclud-ed, or frequently exclude themselves, from civic participation. Not surpris-ingly, complex relationships are also found between poverty, socialnet works and health.26
As noted above, the Social Exclusion Task Force applies the con-cept of social exclusion to geographic areas as well as to people, imply-ing that some localities are social excluded and, perhaps, also, that someare socially excluding. Obviously it is true that all people live in places, con-tribute to places and are affected by places. Moreover, it is probable thatpoverty and disadvantage are mediated by place and places affected bythe poverty or otherwise of their inhabitants. However, the associationsare likely to be complex. The fact that poverty is concentrated in areas ofsocial housing might be, as is a current ministerial concern, attributable tolocalised ‘cultures of worklessness’ but could equally be a consequenceof policies to house people with priority needs, many of whom will alsoface substantial barriers to employment. Spatial concentrations of low-income families may or may not be characterised by dense, supportivenetworks, but are unlikely to provide social capital that fosters rapidupward social mobility. Such areas are unlikely to be well endowed with
22 Coping with complexity

Why multi-dimensional poverty is important 23
good schools, accessible cultural facilities and generously funded publicservices but, equally, the poor person living in more affluent areas mayhave less access to affordable facilities and be inhibited in building localnetworks. However, whatever the precise circumstances, it is rational toassume that a person’s experience of poverty is likely to be partly shapedby the characteristics of the neighbourhood in which s/he lives. Place isitself a further dimension of the personal phenomenon of poverty.
Causes and dimensions
Listening to poor people talk, it is clear that multi-dimensionality is inher-ent in poverty and the experience of poverty. A person who lacks incomeis likely also to live in inadequate housing, perhaps in a bad area, to be indebt, and to feel stressed, isolated and personally inadequate. It will notalways be the case; as in all things, it is a matter of degree.
It is important to recognise that the concept of multi-dimensionalpoverty introduced in this chapter is very different from the multiple meas-ures available in the Government’s annual Opportunity for All report. The 41Opportunity for All indices cover different aspects of poverty and relate todifferent individuals; there is some overlap between individuals counted asincome poor and those who are recorded as being materially deprived, butit is incomplete. In contrast, the multi-dimensionality considered here rel atesto the same individuals, the aim being to capture, insofar as is possible, themultiple complexity of each person’s experience of poverty. Some peoplemay score highly on income poverty, but be low on stress and material dep-rivation. Others will have very different profiles across the various dimen-sions of poverty, arguably experiencing very different kinds of poverty.
The various dimensions of poverty are likely to be inherently causal-ly related and there will always be debate about the direction of causality.Is someone poor because they are ill, or ill because they are poor? Arethey in debt because they have too little money or lack money becausethey are in debt? Such questions are important. The direction of causalityis relevant at the individual level for, to take one example, the debt advis-er dealing with a client. It is also of concern at a strategic policy level.Building political support for anti-poverty programmes is easier when themajority of the poor are demonstrably more sinned against than sinning.Knowledge of the direction of causality might also help in prioritisingresources, say, between healthcare and social security.

24 Coping with complexity
Table 2.1
Official measure of material deprivation
The survey question
Do you and your family have. . .
Are you and your family able to afford to . . .
Possible responses:
[1] ‘We have this’
[2] ‘We would like to have this, but cannot afford it at the moment’
[3] ‘We do not want/need this at the moment’
Adult deprivation Child deprivation
Keep your home adequately warm A holiday away from home at least one week
Two pairs of all-weather shoes for each adult a year with his or her family
Enough money to keep your home in a Swimming at least once a month
decent state of repair A hobby or leisure activity
A holiday away from home for one week a Friends round for tea or a snack once a
year, not staying with relatives fortnight
Replace any worn-out furniture Enough bedrooms for every child over 10 of
A small amount of money to spend each different sex to have her/his own bedroom
week on yourself, not on your family Leisure equipment (for example, sports
Regular savings (of £10 a month) for rainy equipment or a bicycle)
days or retirement Celebrations on special occasions, such as
Insurance of contents of dwelling birthdays, Christmas or other religious
Have friends or family for a drink or meal at festivals
least once a month Play group/nursery/toddler group at least
A hobby or leisure activity once a week for children of pre-school age
Replace or repair broken electrical goods Going on a school trip at least once a term
such as refrigerator or washing machine for school-aged children
Source: Department for Work and Pensions, Measuring Child Poverty, DWP, 2003, p21
However, causality need not be an issue when it comes to the measure-ment of poverty. It does not much matter to a poor person today whethers/he is in debt because s/he is in poor housing or in poor housing becauseof the debt: the person is both in debt and in poor housing, neither ispleasant and experiencing both is undoubtedly worse than either justbeing in debt or living in poor housing without the additional burden ofdebt. Over time, the level of a person’s debt and the quality of housing
may change and the degree of improvement or deterioration in each maymeasurably affect the nature of the poverty experienced. Again, from theperspective of measuring poverty, it is irrelevant whether the level of debtand the quality of housing are related, although, of course, the peoplethemselves may seek a trade-off between the level of debt they incur andthe quality of housing they enjoy (or suffer).
Poverty, then, is complex, inherently multi-dimensional, but real. Thechallenge for the researcher is to capture the complexity of this reality andfor the policy community to take note of its implications for the design anddelivery of policy.
Notes1 S Castell and J Thompson, Understanding Attitudes to Poverty in the UK: get-
ting the public’s attention, Joseph Rowntree Foundation, 2007, p10
2 A Park, M Phillips and C Robinson, Attitudes to Poverty: findings from the British
Social Attitudes Survey, Joseph Rowntree Foundation, 2007
3 C-A Hooper, S Gorin, C Cabral and C Dyson, Living with Hardship 24/7: the div -
erse experiences of families in poverty in England, The Frank Buttle Trust, 2007
4 H Mayhew, London Labour and London Poor, Griffin, Bohn and Company, 1851
5 C Booth, Life and Labour of the People in London (1889–1903), Macmillan,
1892
6 S Rowntree, Poverty: a study of town life, Macmillan, 1901
7 S Ringen, ‘Direct and Indirect Measures of Poverty’, Journal of Social Policy
17(3),1988, pp351-65
8 R Blank, ‘How to Improve Poverty Measurement in the United States’, Journal
of Policy Analysis and Management 27(2), 2008, pp233-54
9 J Veit-Wilson, ‘Paradigms of Poverty: a rehabilitation of JS Rowntree’, Journal
of Social Policy 15, 1986
10 B Abel-Smith and P Townsend, The Poor and the Poorest, Bell, 1965
11 B Abel-Smith and P Townsend, The Poor and the Poorest, Bell, 1965
12 Department for Work and Pensions, Households Below Average Income: an
analysis of the income distribution 1994/95–2006/07, Department for Work and
Pensions, 2008
13 P Townsend, Poverty in the United Kingdom, Allen Lane, 1979
14 R Berthoud, M Bryan and E Bardasi, The Relationship Between Income and
Material Deprivation over Time, DWP Research Report 219, Corporate Docu -
ment Services, 2004; D Gordon and others, Poverty and Social Exclusion in
Britain, Joseph Rowntree Foundation, 2000
15 D Gordon and others, Poverty and Social Exclusion in Britain, Joseph Rowntree
Foundation, 2000
Why multi-dimensional poverty is important 25

16 M Calandrino, Low Income and Deprivation in British Families, DWP Working
Paper 10, Department for Work and Pensions, 2003
17 R Berthoud, M Bryan and E Bardasi, The Relationship Between Income and
Material Deprivation over Time, DWP Research Report 219, Corporate Docu -
ment Services, 2004
18 Department for Work and Pensions, Measuring Child Poverty, Department for
Work and Pensions, 2003
19 Social Fund Task Force, available at www.cabinetoffice.gov.uk/social_exclusion
_task_force/context.aspx (accessed 12 September 2008)
20 C-A Hooper, S Gorin, C Cabral and C Dyson, Living with Hardship 24/7: the
diverse experiences of families in poverty in England, The Frank Buttle Trust,
2007; E Kempson, Life on a Low Income, York Publishing Services, 1996
21 A Sen, Commodities and Capabilities, Oxford University Press,1999
22 A Sen, ‘Poor, Relatively Speaking’, Oxford Economic Papers 35(2), 1983,
pp153-69
23 S Payne, ‘Mental Health, Poverty and Social Exclusion’, in C Pantazis, D
Gordon and R Levitas (eds), Poverty and Social Exclusion in Britain: the Millen -
nium survey, The Policy Press, 2006
24 S Weich and G Lewis, ‘Poverty, Unemployment and Common Mental Disorders:
population-based cohort study’, British Medical Journal 317, 1998, pp115–19
25 D Gallie, S Paugam and S Jacobs, ‘Unemployment, Poverty and Social
Isolation: is there a vicious circle of social exclusion?’ European Societies 5(1),
2003, pp1-32
26 V Cattell, ‘Poor People, Poor Places and Poor Health: the mediating role of
social networks and social capital’, Social Science and Medicine 52, 2001,
pp1501-16
26 Coping with complexity
ThreeMulti-dimensional povertyin Britain
It is easy to agree that poverty is complex and multi-dimensional but, untilvery recently, it has not been possible to develop reliable indicators thatadequately capture the complexity and which are sufficiently stable fortrends in poverty rates to be identified. In this chapter, we briefly explainhow we measure multi-dimensional poverty before reporting results thatrecast our understanding of the nature and distribution of poverty in Britain.
Measuring poverty as a multi-dimensional concept
A useful starting point when it comes to measuring poverty is Ringen’srecognition of the measurement assumption and the income assumptionthat underpin much poverty research. The former refers to the belief thatpoverty exists and as such can be measured; while this assumption iswidely contested, it is self-evidently necessary given the task at hand. Thelatter assumption asserts that poverty can be measured in terms of adeficit in income in relation to needs, a presumption that – as we haveseen – becomes increasingly untenable if poverty is defined as the com-plex multi-dimensional phenomenon described above. Baulch has useful-ly illustrated the problem with reference to a pyramid of concepts (Figure3.1).1 Moving down the pyramid takes increasing account of aspects ofpoverty that define it as a meaningful social phenomenon. In terms ofmeasurement, the most frequently used measures lie at the top of thepyramid since they are more straightforward to operationalise.
Personal consumption is placed at the top of the pyramid, althoughthis is typically measured with reference to personal or, more usually,household income since this is more easily measured. The concept ofpoverty gradually increases in scope to include shared property rights,state-provided commodities, assets, dignity and autonomy at the bottomof the pyramid. The implication of the diagram is that the various dimen-

sions are strictly additive, although empirically this is unlikely to be thecase. Indeed, a major challenge of the current research is to formulate thenature of the relationship between these various dimensions. Moreover, itis probable that the dimensions lie in a causative sequence which willrequire specification.
In summary, while it is widely appreciated that poverty is an inher-ently multi-dimensional concept, this multi-dimensionality has generallybeen lost, weakened or distorted when poverty is measured. This has notjust been the result of political expediency but the absence of any methodby which the holistic nature of poverty can be captured in a way that facil-itates measurement over time. The partial measures used to date neces-sarily fail to do justice to the experience of poor people and, to the extentthat they distort through omission, may result in implementation of inap-propriate policies.
What is required is the use of statistical techniques that representthe dimensionality of the concept in a stable fashion, an approach that will
28 Coping with complexity
Figure 3.1
Baulch’s pyramid
Source: B Baulch, ‘The New Poverty Agenda: a disputed consensus’, IDS Bulletin, 27:1-10, 1996
PC
PC + SPR
PC + SPR + SPC
PC + SPR + SPC + Assets
PC + SPR + SPC + Assets + Dignity
PC + SPR + SPC + Assets + Dignity + Autonomy
PC = personal consumption
SPC = state-provided commodities
SPR = shared property rights (resources)
ultimately require access to comprehensive datasets with reliable meas-ures.
A new approach to measurement
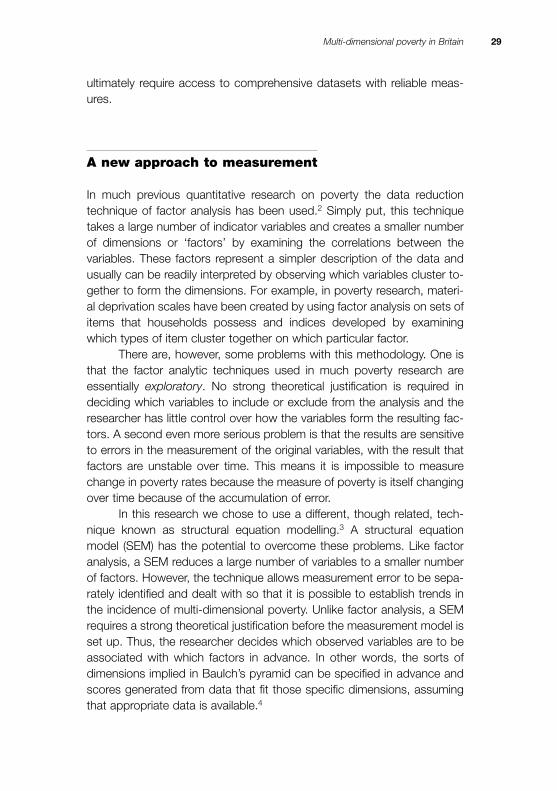
In much previous quantitative research on poverty the data reductiontechnique of factor analysis has been used.2 Simply put, this techniquetakes a large number of indicator variables and creates a smaller numberof dimensions or ‘factors’ by examining the correlations between the variables. These factors represent a simpler description of the data andusually can be readily interpreted by observing which variables cluster to -gether to form the dimensions. For example, in poverty research, materi-al deprivation scales have been created by using factor analysis on sets ofitems that households possess and indices developed by examiningwhich types of item cluster together on which particular factor.
There are, however, some problems with this methodology. One isthat the factor analytic techniques used in much poverty research areessentially exploratory. No strong theoretical justification is required indeciding which variables to include or exclude from the analysis and theresearcher has little control over how the variables form the resulting fac-tors. A second even more serious problem is that the results are sensitiveto errors in the measurement of the original variables, with the result thatfactors are unstable over time. This means it is impossible to measurechange in poverty rates because the measure of poverty is itself changingover time because of the accumulation of error.
In this research we chose to use a different, though related, tech-nique known as structural equation modelling.3 A structural equationmodel (SEM) has the potential to overcome these problems. Like factoranalysis, a SEM reduces a large number of variables to a smaller numberof factors. However, the technique allows measurement error to be sepa-rately identified and dealt with so that it is possible to establish trends inthe incidence of multi-dimensional poverty. Unlike factor analysis, a SEMrequires a strong theoretical justification before the measurement model isset up. Thus, the researcher decides which observed variables are to beassociated with which factors in advance. In other words, the sorts ofdimensions implied in Baulch’s pyramid can be specified in advance andscores generated from data that fit those specific dimensions, assumingthat appropriate data is available.4
Multi-dimensional poverty in Britain 29

Defining the measurement models
The analysis presented here utilises data from the British Household PanelSurvey (BHPS). The BHPS commenced in 1991 with an initial sample ofaround 10,000 individuals resident in some 5,000 households. These indi-viduals have subsequently been re-interviewed each year and the samplehas also been extended to include more households from Scotland andWales, and to embrace Northern Ireland. While the data can be weightedto provide an accurate picture of life in Great Britain or the United Kingdomat different points in time, this analysis is restricted to Great Britain (Eng -land, Scotland and Wales) to facilitate measurement of trends. The analy-sis covers the period 1991 to 2003 (ie, BHPS waves 1 to 13) and drawson information from adults in the study on the following topics, which areused to define the dimensions of poverty within our multi-dimensional indi-cators: income, finances and benefits; stress; material deprivation; gener-al housing and neighbourhood characteristics; and social exclusion andcivic participation.
While the BHPS is widely used in poverty research,5 it has a num-ber of shortcomings, the most important of which is that the data is notalways consistent or collected for all waves. For example, the civic partic-ipation and social isolation variables are only collected in alternate waves,while the housing and neighbourhood variables were only included from1996 onwards. Similarly, the material deprivation variables, which werelimited at the beginning of the survey, were significantly augmented from1996. Thus, we are forced to limit our analysis to alternate years (1991,1993, 1995 etc) and to divide our analysis into two parts. The firstemploys a relatively simple model (referred to as Model 1) to exploit datafor the full period 1991 to 2003, while the second uses a more compre-hensive model that takes advantage of the better data available from 1996onwards (referred to as Model 2). The latter model conveniently coincideswith the first eight years of the Blair Government (covering years 1997,1999, 2001 and 2003).
Finally, as with any secondary analysis, the analyst is constrained bythe variables included in the dataset. Almost inevitably, key variables areomitted, while the variables available constitute only imprecise indices ofthe concepts of interest.
30 Coping with complexity
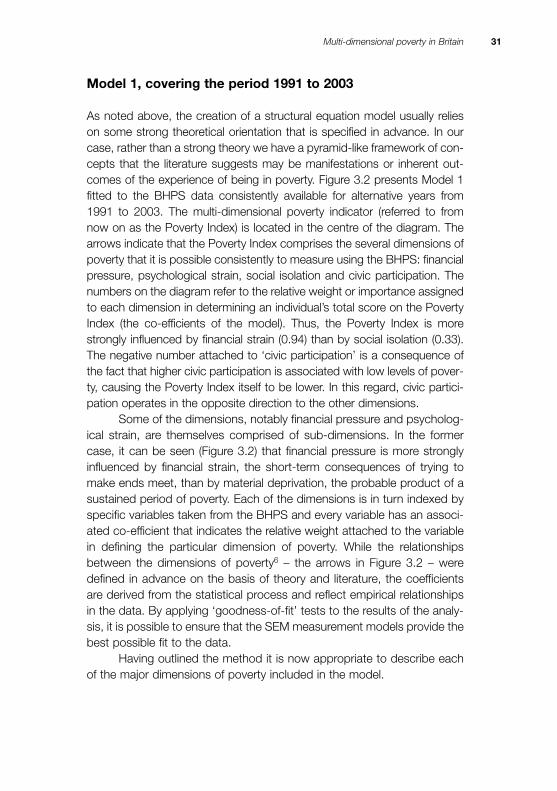
Model 1, covering the period 1991 to 2003
As noted above, the creation of a structural equation model usually relieson some strong theoretical orientation that is specified in advance. In ourcase, rather than a strong theory we have a pyramid-like framework of con-cepts that the literature suggests may be manifestations or inherent out-comes of the experience of being in poverty. Figure 3.2 presents Model 1fitted to the BHPS data consistently available for alternative years from1991 to 2003. The multi-dimensional poverty indicator (referred to fromnow on as the Poverty Index) is located in the centre of the diagram. Thearrows indicate that the Poverty Index comprises the several dimensions ofpoverty that it is possible consistently to measure using the BHPS: financialpressure, psychological strain, social isolation and civic participation. Thenumbers on the diagram refer to the relative weight or importance assignedto each dimension in determining an individual’s total score on the PovertyIndex (the co-efficients of the model). Thus, the Poverty Index is morestrongly influenced by financial strain (0.94) than by social isolation (0.33).The negative number attached to ‘civic participation’ is a consequence ofthe fact that higher civic participation is associated with low levels of pover-ty, causing the Poverty Index itself to be lower. In this regard, civic partici-pation operates in the opposite direction to the other dimensions.
Some of the dimensions, notably financial pressure and psycholog-ical strain, are themselves comprised of sub-dimensions. In the formercase, it can be seen (Figure 3.2) that financial pressure is more stronglyinfluenced by financial strain, the short-term consequences of trying tomake ends meet, than by material deprivation, the probable product of asustained period of poverty. Each of the dimensions is in turn indexed byspecific variables taken from the BHPS and every variable has an associ-ated co-efficient that indicates the relative weight attached to the variablein defining the particular dimension of poverty. While the relationshipsbetween the dimensions of poverty6 – the arrows in Figure 3.2 – weredefined in advance on the basis of theory and literature, the coefficientsare derived from the statistical process and reflect empirical relationshipsin the data. By applying ‘goodness-of-fit’ tests to the results of the analy-sis, it is possible to ensure that the SEM measurement models provide thebest possible fit to the data.
Having outlined the method it is now appropriate to describe eachof the major dimensions of poverty included in the model.
Multi-dimensional poverty in Britain 31
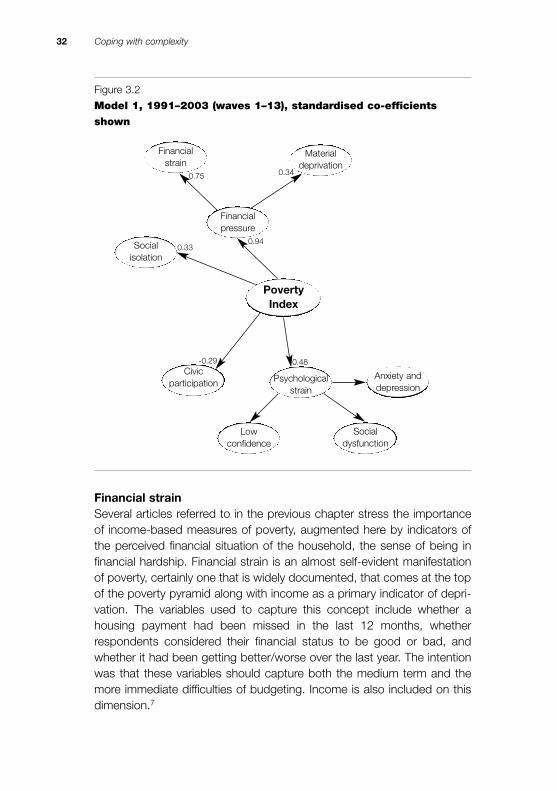
Financial strainSeveral articles referred to in the previous chapter stress the importanceof income-based measures of poverty, augmented here by indicators ofthe perceived financial situation of the household, the sense of being infinancial hardship. Financial strain is an almost self-evident manifestationof poverty, certainly one that is widely documented, that comes at the topof the poverty pyramid along with income as a primary indicator of depri-vation. The variables used to capture this concept include whether ahousing payment had been missed in the last 12 months, whetherrespondents considered their financial status to be good or bad, andwhether it had been getting better/worse over the last year. The intentionwas that these variables should capture both the medium term and themore immediate difficulties of budgeting. Income is also included on thisdimension.7
32 Coping with complexity
Figure 3.2
Model 1, 1991–2003 (waves 1–13), standardised co-efficients
shown
Financialstrain
Materialdeprivation
Financialpressure
PovertyIndex
Psychologicalstrain
Socialisolation
Socialdysfunction
Lowconfidence
Civicparticipation
Anxiety anddepression
0.340.75
0.33
-0.29 0.48
0.94
Material deprivationThere is a large body of work on the importance of including material dep-rivation in any measure of poverty.8 The measures available in the BHPSare generally limited to the ownership of certain possessions, with no ref-erence made to whether respondents attribute lack of ownership to per-sonal preference or inadequate resources. The raft of such indicators ofmaterial wellbeing include if the respondent’s household does not possessa: CD player, VCR, washing machine, tumble dryer, micro wave oven, dish-washer, personal computer, central heating, or has use of a car. Income isalso included on this dimension, as well as financial strain.
We have kept material deprivation conceptually distinct from finan-cial strain as it represents the real effects of long-term financial hardshipon the household rather than the personal financial strain itself. In otherwords, it captures the essence of not being able to afford things or beingable to replace worn-out items, such as electronic goods or kitchen appli-ances. Financial strain reflects monetary strain, which may be somewhatdifferent and apply in different circumstances. For example, a householdmay be under financial strain because of high mortgage payments, butmay have a well-equipped house. Material and financial deprivation werealso linked to the Poverty Index by another latent variable representingoverall financial and material deprivation. This represents the combinedeffects of long-term and short-term ‘financial pressure’.
Social isolationThe next dimension is that of social isolation, a trait seen both as a mani-festation or consequence of poverty and as a risk factor linked with down-ward spirals into poverty. Once a person is marginalised the effect canbecome self-reinforcing, as when a person no longer has friends to helpthem out or contacts that could help secure employment and escapepoverty. The BHPS includes variables indicating whether the respondenthas someone who will listen to her/him, help in a crisis, who appreciatesand who comforts her/him, and with whom s/he can relax.
Civic participationRelated to social isolation, we also include the converse concept of civicparticipation since the literature suggests that people in poverty will oftenbe excluded from civic participation and have weak social networks andsocial capital.9 Civic participation is captured in the BHPS by two variablesthat count the number of organisations of which the respondent is a mem-ber and the number in which s/he is active. Respondents are presented
Multi-dimensional poverty in Britain 33

with a list of 13 kinds of organisation from which they are asked to selectones with which they are involved. The list includes: political parties, tradeunions, environmental groups, parents’ associations, tenants’ or resi-dents’ groups, religious groups, voluntary service organisations, commu-nity groups, social groups, sports clubs, women’s institutes and women’sgroups. High scores indicate higher civic participation.
Psychological strainPsychological wellbeing could be seen as a cause or a consequence ofpoverty.10 There have also been a number of studies that have found anassociation between mental ill health and poverty.11 We assume here thatpsychological strain is a component towards the bottom of our pyramid ofconcepts and that it can be entered into a comprehensive poverty index.Psychological strain is measured using the General Health Questionnaireset of 12 items (GHQ12)12 split into three distinct components: low confi-dence, anxiety and depression, and social dysfunction.
Model 2, covering the period 1997 to 2003
The more detailed data available from 1996 onwards allows us to addanother dimension, ‘environment’, a place-based aspect of poverty whichcaptures housing and neighbourhood conditions, and to refine certain ofthe other dimensions (Figure 3.3). The housing variables included in theenvironment dimension are: whether the house in which a respondentresides has poor light, bad heating, leaks, rotting wood, and/or damp.Neighbourhood variables included more objective measures appertainingto noise from neighbours, noise from the street, crime levels and lack ofspace, and more subjective ones recording whether the respondent likedthe area or not and whether s/he would prefer to move away.
The new material deprivation dimension additionally includes lack ofa cable or satellite TV, together with assessments by respondents ofwhether they as a household could afford a week-long holiday once ayear, to feed visitors once a month or to buy new clothes or replace furni-ture. Three extra variables were added to the social isolation dimensionwhich recorded whether respondents reported knowing someone outsidethe household from whom they could borrow money or someone whomight assist them find a job, or someone who might help with depression.Financial strain, civic participation and psychological strain remain as inModel 1.
34 Coping with complexity

Multi-dimensional poverty in Britain 35
Based on the modelling, it is possible to calculate a Poverty Index scorefor every respondent and separate scores for each person on all the indi-vidual sub-dimensions. These were calculated from both models and formthe basis of the analysis that follows.13 Reflecting Sen’s analysis of capa-bilities and shame discussed in Chapter 2, the overall Poverty Indexreflects both absolute and relative concepts of poverty. The income meas-ure is deflated, which removes the tendency with absolute measures forpeople to be floated out of poverty simply as a result of economic growth.The measures of material deprivation are socially salient but are notweighted to take account of market penetration, while indices of strain aremeasured in absolute terms.
Figure 3.3
Model 2, 1997–2003 (waves 7–13), standardised co-efficients
shown
Financialstrain
Materialdeprivation
Financialpressure
PovertyIndex
Psychologicalstrain
Socialisolation
Socialdysfunction
Lowconfidence
Civicparticipation
Anxiety anddepression
0.44
Environment0.47
0.72
0.21
-0.25 0.38
0.99

36 Coping with complexity
Trends in multi-dimensional poverty
So what does all this modelling tell us? Does it add anything to what wemight deduce by simply measuring income poverty? We believe that theanswer to the second question is a profound ‘yes’, but first we have toexplain the results and to compare them with traditional analyses.
All poverty thresholds are somewhat arbitrary. Ideally, an income-based measure would fix the threshold as the amount of income requiredto meet socially determined minimal needs. Conventionally, though,income-based measures are fixed as a proportion of median equivalisedhousehold income – that is, income adjusted to take account of differ-ences in household size. The threshold for the new Poverty Index was
Figure 3.4
Percentage poor by various measures, BHPS 1991–2003
30
28
26
24
22
20
18
16
14
12
10
x
x x
x x xx
xx
1991 1993 1995 1997 1999 2001 2003
60% median income
50% average income
Absolute income (1991=25%)
Absolute PI (1991=25%)
Relative PI (90% median normalised wellbeing index)
%

fixed in 1991 to ensure that 25 per cent of households fell beneath thepoverty threshold, a proportion similar to the poverty rate indicated by con-ventional income measures (Figure 3.4). Absolute measures hold thepoverty threshold constant in real terms, meaning that the thresholdretains the same value in terms of the goods that could be purchased.Relative measures allow the poverty threshold to rise (or fall) with averageincomes and/or overall living standards; fixing a poverty threshold as a pro-portion of median household income achieves this effect automatically.
Trends in the new Poverty Index are compared to conventional ‘rel-ative’ and ‘absolute’ income poverty measures in Figure 3.4. All the meas-ures are derived from the same BHPS data and so any differences cannotbe attributed to different data. The relative income measure suggests apattern of stable or slightly increasing poverty during the period 1992–97when John Major was prime minister, followed by a decline after NewLabour took office in 1997. In contrast, the absolute income measure, inwhich the poverty threshold is held constant in real terms, shows a con-tinuous decline. This is as be expected given that the period as a wholewas characterised by moderate economic growth. The absolute PovertyIndex-based measure similarly shows a steady decline throughout thewhole period, but so too does the relative variant.14 Why should this beso? Because a portion of the Poverty Index is designed to captureaspects of poverty (material deprivation, for example) that are theoretical-ly more stable and less sensitive to short-term fluctuations in the nationaleconomic situation. Not only does this more accurately reflect the actualexperience of people living in poverty, it also helps to avoid the problem,noted in Chapter 2, that the observed poverty rate can sometimes appearto rise when everybody, including those counted as poor, is getting richerin times of rapid economic growth.
A Poverty Index score was calculated for every adult in the BHPSsample; the higher the score, the more severe the poverty. People with ascore below 0.854 in 1991 – 75 per cent of all respondents – were notconsidered to be poor at all. The mean and median score from Models 1and 2 are plotted in Figure 3.5 for all odd-numbered year waves from1991 to 2003. This is analogous to plotting the inverse of average equiv-alised household income used in traditional measures since, unlikeincome, the Poverty Index is a direct measure of poverty and high scoresindicate extreme poverty. It is evident that the mean score in Model 1declined steadily throughout the period from around 0.43 to 0.16, whichis both consistent with the recorded fall in poverty rates and also suggestsa general rise in social wellbeing. The comparison between the mean and
Multi-dimensional poverty in Britain 37

median Poverty Index is also instructive. It indicates that that the distribu-tion of the Poverty Index is somewhat skewed, with disproportionate num-bers of people having very low scores. However, the Poverty Index, whichof course takes into account the many dimensions of poverty and wellbe-ing is less skewed and less unequal than the distribution of income alone.However, the increasing difference between the mean and median Poverty
38 Coping with complexity
Figure 3.5
Mean and median Poverty Index scores from the models
0.5
0.4
0.3
0.2
0.1
01991 1993 1995 1997 1999 2001 2003
PI s
core
Model 1
0.8
0.7
0.6
0.5
0.4
0.3
0.2
0.1
01997 1999 2001 2003
PI s
core
Model 2
Mean
Median

Index scores points to a widening in social inequalities, perhaps especial-ly during the last years of the Major Government.15
It is possible to estimate individuals’ Poverty Index scores on all theseparate dimensions of poverty and hence to calculate dimension-spec -ific poverty rates. Again, it is necessary to select a more or less arbitrarypoverty threshold for each dimension and, to ensure consistency acrossthe dimensions, this was in each case fixed to ensure that 25 per cent ofthe population was defined as being poor in 1991 (Table 3.1). The mate-rial deprivation and financial strain dimensions were calculated withoutincome included (which is presented separately), while financial pressurecombines the scores for income, material deprivation and financial strain.
From Table 3.1 it can be seen that poverty rates based on the finan-cial strain and material deprivation components of the Index both fell muchfaster than income, declining by three-quarters from 25 per cent in 1991 toaround 8 per cent in 2003 as opposed to one-half for income. Povertydefined in terms of financial strain decreased more quickly in the early partof the period, subsequently slowing as did material deprivation, to a lessmarked degree, whereas the marked fall in poverty experienced as finan-
Multi-dimensional poverty in Britain 39
Table 3.1
Headcount poverty rates (%) using the Poverty Index and selected
dimensions, Model 1, fixing the1991 rate at 25% in each case
Year Overall Material Financial Income Financialdeprivation strain pressure
1991 25 25 25 25 25
1993 23 20 16 21 22
1995 20 17 13 19 18
1997 17 14 10 16 13
1999 16 12 9 17 11
2001 14 9 8 13 9
2003 12 7 6 11 7
Headcount poverty rates (%) using the Poverty Index, Model 2,
fixing the 1997 rate at 25% in each case
Year Overall Material Financial Income Financial Environ-deprivation strain pressure ment
1997 25 25 25 25 25 25
1999 22 21 17 23 22 23
2001 19 17 15 22 18 21
2003 17 14 14 16 15 21
cial press ure (a product of the effects of income, financial strain and mate-rial deprivation) occurred slightly later during the last years of the Major era.The other components (psychological strain, civic participation and socialisolation) all remained fairly constant throughout the period and were, addi-tionally, less closely associated in the model with the composite PovertyIndex. It follows that falls in the overall Poverty Index were therefore largelydue to improvements in people’s material wellbeing and easing of financialstrain than to changes in the social or psychological side of life.
The more comprehensive measure that it was possible to employduring the Blair era presents a subtly different picture (see Figure 3.5,Model 2). Again the mean Poverty Index score fell, but with different scal-ing, from 0.69 in 1997 to around 0.53 in 2003, implying an overallimprovement in wellbeing. This is reflected in the headcount poverty rate,which (calculated in a fashion analogous to Model 1) fell by almost a quar-ter. During this period, however, while material deprivation and financialstrain both fell by 44 per cent and by more than other aspects of poverty,the decline in income poverty was, though less, of a similar order of mag-nitude (36 per cent), presumably reflecting the significant policy shift to tar-geting poverty through increases in benefits and tax credits (see Table3.1). Psychological strain, civic participation and social isolation againremained stable, but a decline in environmental or place-based povertywas evident, falling by about one-sixth from 25 to 21 per cent.
Briefly, to summarise: poverty, measured as a multi-dimensionalconcept, fell throughout the period 1991 to 2003 in both absolute and rel-ative terms, driven more by reductions in material deprivation and financialstrain than by increases in income per se. The implication is that for thisperiod, income-based measures understated the fall in poverty. Peoplethroughout society, though particularly – as we shall see – those at thebottom, found it easier to manage and gained from increased material liv-ing standards over and above the benefits attributable to rising income.Writing in the era of the so-called international ‘credit crunch’, one canonly wonder whether these differential experiences were to become pre-cursors to future hardships.
The distribution of poverty
Having established trends in multi-dimensional poverty, it is important toconsider its distribution and particularly which groups are most at risk.
40 Coping with complexity

First, however, it is worth asking whether the same people are affected bymulti-dimensional poverty as are afflicted by income poverty. The answeris that there is some overlap between the two groups, but that the coinci-dence is by no means perfect. Indeed, it will already be apparent from thestructure of the SEM models and the fact that income poverty fell lessmarkedly than other kinds of poverty, that the Poverty Index is only mod-erately associated with income. Typically, in any one year, the correlationbetween the Poverty Index and the logarithm of household equivalisedincome is about 0.46, with income explaining no more than around 23 percent of the variance of the Poverty Index. This finding is, of course, con-sistent with Ringen’s assertion (noted in Chapter 2) that income is an indi-rect, but also an imperfect, measure of poverty.16 Never theless, thePoverty Index takes income into account and, as would be anticipated,when the BHPS sample is divided into deciles according to equivalisedhousehold income, the average Poverty Index score falls consistently withincreasing income deciles (Figure 3.6).
The comparison between movements in the Poverty Index overtime and changes in income is particularly instructive in that it suggests
Multi-dimensional poverty in Britain 41
Figure 3.6
Mean Poverty Index from Model 2 by income deciles, 1997–2003
1.7
1.5
1.3
1.1
0.9
0.7
0.5
.03
.01
-0.1 1 2 3 4 5 6 7 8 9 10
Income decile
1997 1999 2001 2003
Mea
n P
I sco
re

that gains in wellbeing were greatest among those with the least income,even though income inequalities were increasing throughout most of theperiod. Figure 3.6 not only shows that the average Poverty Index scoredeclined for people at all points in the income distribution between 1997and 2003, it also reveals that the biggest absolute falls occurred amongthe lowest income groups. Falls were especially marked for people withinthe lowest income decile, such that by 2003, average Poverty Indexscores did not differ statistically between the first and second income dec -iles. However, the proportion of people in the lowest income decile thatwere poor according to the Poverty Index fell only marginally from 1991 to2003, suggesting that most of the fall in the Index translated into a reduc-tion in the severity of multi-dimensional poverty as indicated by the pover-ty gap – the difference between a person’s Poverty Index score and themulti-dimensional poverty threshold.
Turning to the risk of experiencing multi-dimensional poverty, wefind patterns, which at face value are broadly consistent with the literatureon income poverty (Table 3.2). Single parents with dependent children aremost at risk of poverty followed by single elderly households. Couples withchildren face an average risk of being poor while couples without childrengenerally confront a low, but far from negligible, risk of poverty. These
42 Coping with complexity
Table 3.2
Headcount multi-dimensional poverty rates (relative %) by various
household types, Model 1, 1991
Degree of poverty
Severe1 Moderate2 Less severe3
Single, non-elderly 20 26 33
Single, elderly 18 27 39
Couple, no children 9 13 20
Couple, dependent children 13 18 26
Couple, non-dependent children 9 12 19
Lone parent, dependent children 36 48 58
Lone parent, non-dependent children 15 22 33
2+ unrelated adults 13 23 32
Other households 11 15 20
All 13 18 26
1 80% of the median Poverty Index score
2 85% of the median Poverty Index score
3 90% of the median Poverty Index score
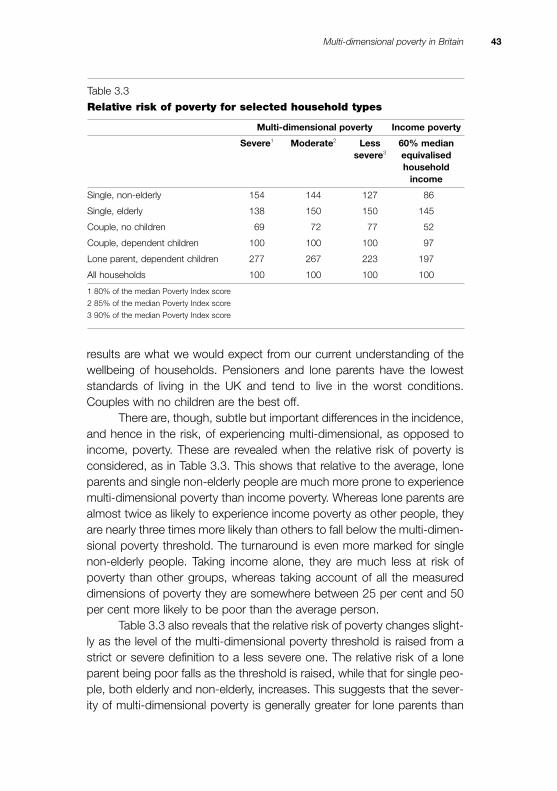
results are what we would expect from our current understanding of thewellbeing of households. Pensioners and lone parents have the loweststand ards of living in the UK and tend to live in the worst conditions.Couples with no children are the best off.
There are, though, subtle but important differences in the incidence,and hence in the risk, of experiencing multi-dimensional, as opposed toincome, poverty. These are revealed when the relative risk of poverty isconsidered, as in Table 3.3. This shows that relative to the average, loneparents and single non-elderly people are much more prone to experiencemulti-dimensional poverty than income poverty. Whereas lone parents arealmost twice as likely to experience income poverty as other people, theyare nearly three times more likely than others to fall below the multi-dimen-sional poverty threshold. The turnaround is even more marked for singlenon-elderly people. Taking income alone, they are much less at risk ofpoverty than other groups, whereas taking account of all the measureddimensions of poverty they are somewhere between 25 per cent and 50per cent more likely to be poor than the average person.
Table 3.3 also reveals that the relative risk of poverty changes slight-ly as the level of the multi-dimensional poverty threshold is raised from astrict or severe definition to a less severe one. The relative risk of a loneparent being poor falls as the threshold is raised, while that for single peo-ple, both elderly and non-elderly, increases. This suggests that the sever-ity of multi-dimensional poverty is generally greater for lone parents than
Multi-dimensional poverty in Britain 43
Table 3.3
Relative risk of poverty for selected household types
Multi-dimensional poverty Income poverty
Severe1 Moderate2 Less 60% mediansevere3 equivalised
household income
Single, non-elderly 154 144 127 86
Single, elderly 138 150 150 145
Couple, no children 69 72 77 52
Couple, dependent children 100 100 100 97
Lone parent, dependent children 277 267 223 197
All households 100 100 100 100
1 80% of the median Poverty Index score
2 85% of the median Poverty Index score
3 90% of the median Poverty Index score

for the other two groups, which tends to support the Government’s pol icyfocus on lone parents.
To recap, our analysis confirms the theoretical proposition that, whileincome poverty is important, it fails fully to encapsulate what it means to bepoor. Moreover, taking account of the non-financial dimensions of povertyreveals that the risk of poverty faced by non-elderly single people is under-stated when an income definition is used, while both the risk and severityof poverty experienced by lone parents is also downplayed.
Conclusions
It has long been argued that poverty is an inherently multi-dimensional con-cept and that reliance on one-dimensional measures can be misleading.However, it has hitherto proved impossible to devise multi-dimensionalmeasures that are stable over time and which thereby facilitate the accu-rate measurement of trends in the poverty rate, a necessary requirement ifthe effects of anti-poverty programmes are to be assessed. Above, wehave demonstrated that it is possible, through the application of structuralequation modelling, to create multi-dimensional indicators without theusual drawbacks. It is also proved possible to disaggregate the con tri -bution of the individual components to the overall trend, thereby isolatingthe effect of single dimensions while holding other components con stant.
While we have been able to specify the dimensions of poverty, atleast within the limitations of the available data, based on our under-standing of the literature, it is through the empirical analysis that we havebeen able to specify the relative importance of each in shaping the over-all experience of poverty. We discovered, as one might expect, that finan-cial pressure lies at the heart of poverty, but importantly also that the effectof low income is mediated through short-term financial stress and longer-term material deprivation, with the former being almost twice as importantas the latter. Environment emerges as the next most important dimensionof poverty (although data limitations meant that this could only be meas-ured from 1997 onwards), followed by psychological stress and, lessimportant though still statistically significant, civic participation and socialisolation. It is worth noting, as an aside, that the methodology pursuedhere represents a major advance on the combinatorial method recentlyintroduced by the Government to measure child poverty and which countspeople as poor if they are both income poor and experience material dep-
44 Coping with complexity
rivation.17 The Government’s approach cannot adequately cope with thephenomenon that a person might often appear poor on one index and noton another, whereas we have been able to construct a single measure thattakes account of a person’s status on multiple dimensions of poverty,each of which can be disaggregated.
The decline in the Poverty Index between 1991 and 2003 was driv-en by falls in material deprivation and more especially by reduced financialstress, particularly during the early 1990s, a time when unemployment,inflation and interest rates were all falling. It is at least possible that theseeds of the current, so-called ‘credit crunch’ were sown at this time, withpeople unwittingly taking on commitments that were unsustainable, giventheir long-term earning power in the context of as yet unappreciated riskssuch as pregnancy and relationship breakdown. Further work to investi-gate this possibility would certainly be justified.
Interpretation of the decline in material deprivation is complexbecause the commodities included in the Index were fixed in 1991 (or1997 with the inclusion of cable and satellite TV). Many of these itemshave become much cheaper and more widely diffused now than theywould have been in 1991, with the result that one would expect the mate-rial deprivation based on these items to fall naturally during the subse-quent 13 years. The implication is that, while in absolute terms the poorhave become better off in that they possess more of the indicator items,they may still be experiencing relative deprivation in not having access toitems that have subsequently become socially essential, such as a mobilephone. Significantly, psychological strain, social isolation and civic partici-pation persisted at similar levels throughout the 13 years, suggesting thatfinancial improvements in people’s lives may not immediately negate theexclusionary aspects of poverty.
Finally, following others, we have demonstrated that income is onlyrather weakly associated with the other generally accepted manifestationsof poverty.18 Not only is this consistent with Ringen’s theoretical argu-ments, it underlines the need to take a multi-dimensional approach seri-ously, not least because income measures can be misleading in thegroups that appear to be most at risk of poverty.
Notes1 B Baulch, ‘The New Poverty Agenda: a disputed consensus’, IDS Bulletin 27,
1996, pp1-10
2 See for example, M Calandrino, Low Income and Deprivation in British Families,
DWP Working Paper 10, Department for Work and Pensions, 2003 and T
Multi-dimensional poverty in Britain 45

Haase and J Pratschke, Deprivation and its Spatial Articulation in the Republic
of Ireland, ADM Ltd /NDP, 2005
3 Although SEM has rarely been used in the measurement of poverty, we are
aware of the following exceptions: R Layte, B Nolan and C Whelan, ‘Targeting
Poverty: lessons from monitoring Ireland’s national anti-poverty strategy’,
Journal of Social Policy 29(4), 2000, pp553-75; W Kuklys, ‘Measuring
Standards of Living in the UK: an application of Sen’s functioning approach
using structural equation models’, Working Paper on Strategic Interaction 11,
Max Planck Institute, Jena, 2004; T Haase and J Pratschke, Deprivation and its
Spatial Articulation in the Republic of Ireland, ADM Ltd/NDP, 2005; and MSD,
Direct Measurement of Living Standards: the New Zealand ELSI Scale, New
Zealand Ministry of Social Development, 2002
4 A much more detailed and technical exposition of the models presented in this
chapter can be found in M Tomlinson, R Walker and G Williams, ‘Measuring
Poverty in Britain as a Multi-dimensional Concept 1991 to 2003’, Journal of
Social Policy 37(4), 2008
5 For example, SP Jenkins and J Rigg, The Dynamics of Poverty in Britain, DWP
Research Report 157, Corporate Document Services, 2001; J Ermisch, M Fran -
ces coni and DJ Pevalin, Outcomes for Children of Poverty, DWP Research Report
158, Corporate Document Services, 2001; SP Jenkins and L Cappellari, ‘Summar -
ising Multiple Deprivation Indicators’, in SP Jenkins and J Micklewright (eds),
Inequality and Poverty Re-examined, Oxford University Press, 2007, pp166-84
6 More detail can be found in M Tomlinson, R Walker and G Williams, ‘Measuring
Poverty in Britain as a Multi-dimensional Concept 1991 to 2003’, Journal of
Social Policy 37(4), 2008. The details of the statistical models are available from
the Oxford Research Archive at: http://ora.ouls.ox.ac.uk. For simplicity, neither
the variables nor the associated co-efficients are shown in Figure 3.2.
7 After considerable experimentation, gross income was used instead of the the-
oretically more appropriate measure of disposable income. The decision led to
10 per cent fewer cases being dropped from some of the analyses on account
of missing values. All the indices and sub-indices are very highly correlated
when the different income measures are used and poverty rates differ by less
than a percentage point across the various demographic subgroups.
8 SP Jenkins and L Cappellari, ‘Summarising Multiple Deprivation Indicators', in
SP Jenkins and J Micklewright (eds), Inequality and Poverty Re-examined,
Oxford University Press, 2007, pp166-84; C Whelan and B Maitre, ‘Vulnerability
and Multiple Deprivation Perspectives on Economic Exclusion in Europe: a
latent class analysis’, European Societies 7(3), 2005, pp423-50; M Willetts,
Measuring Child Poverty Using Material Deprivation: possible approaches,
DWP Working Paper 28, Corporate Document Services, 2006
46 Coping with complexity
9 V Cattell, ‘Poor People, Poor Places and Poor Health: the mediating role of
social networks and social capital’, Social Science and Medicine 52, 2001,
pp1501-16; D Gordon and others, Poverty and Social Exclusion in Britain,
Joseph Rowntree Foundation, 2000; C Pantazis, D Gordon and R Levitas (eds),
Poverty and Social Exclusion in Britain: the Millennium survey, The Policy Press,
2006
10 For example, S Payne, ‘Mental Health, Poverty and Social Exclusion’, in
C Pantazis, D Gordon and R Levitas (eds), Poverty and Social Exclusion in
Britain: the Millennium survey, The Policy Press, 2006
11 For instance, S Weich and G Lewis, ‘Poverty, Unemployment and Common
Mental Disorders: population-based cohort study’, British Medical Journal 317,
1998, pp115-19; and E Whitley, D Gunnell, D Dorling and GD Smith, ‘Ecological
Study of Social Fragmentation, Poverty and Suicide’, British Medical Journal
319, 1999, pp1034-37
12 Following M Shevlin and G Adamson, ‘Alternative Factor Models and Factorial
Invariance of the GHQ-12: a large sample analysis using confirmatory factor analy -
sis’, Psychological Assessment 17(2), 2005, pp231-36, we modelled psychologi-
cal strain as a three-part model combining anxiety/depression (items 2, 5, 6, 9),
social dysfunction (1, 3, 4, 7, 8) and loss of confidence (10 and 11). This pro duces
a much better fit than using all 12 items loading on just one latent variable.
13 More detail can be found in M Tomlinson, R Walker and G Williams, ‘Measuring
Poverty in Britain as a Multi-dimensional Concept 1991 to 2003’, Journal of
Social Policy 37(4), 2008. The details of the statistical models are available from
the Oxford Research Archive at: http://ora.ouls.ox.ac.uk. For simplicity, neither
the variables nor the associated co-efficients are shown in Figure 3.2.
14 See Appendix for the calculation of the relative version of Poverty Index.
15 It is not possible to assess straightforwardly the strength of the fall in the Poverty
Index because the scores are not standardised in any way. Moreover, since a
negative score is possible, meaning that a score of zero does not indicate an
absence of poverty, it cannot be presumed that that the average Poverty Index
more than halved.
16 S Ringen, ‘Direct and Indirect Measures of Poverty’, Journal of Social Policy
17(3), 1988, pp351-65
17 Department for Work and Pensions, Measuring Child Poverty, Department for
Work and Pensions, 2003
18 R Berthoud, M Blekesaune and R Hancock, Are ‘Poor’ Pensioners ‘Deprived’?,
DWP Research Report 364, Corporate Document Services, 2006; R Berthoud,
M Bryan and E Bardasi, The Dynamics of Deprivation: the relationship between
income and material deprivation over time, DWP Research Report 219,
Corporate Document Services, 2004
Multi-dimensional poverty in Britain 47
FourThe dynamics of multi-dimensional poverty
Introduction
We saw, in the previous chapter, that poverty fell throughout the period1991 and 2003, which means that significant numbers of people movedout of poverty. Indeed, in reality many more people will have escaped frompoverty than is suggested by the fall in the poverty rate from 27.5 per centto 23 per cent. This is because, while some people left poverty, others willhave become poor for the first time and yet others will have moved in andout of poverty on several occasions. It is now widely recognised that it isjust as important to study these poverty dynamics as it is to measurepoverty rates. However, most studies of poverty dynamics have con-cerned income poverty and little is known about the dynamics of povertywhen it is defined in multi-dimensional terms.
Moreover, previous studies of dynamics have tended to focus onestimating the duration and number of spells of poverty experienced bypeople over comparatively short periods of time. This chapter takes amuch longer-term view of poverty and uses methods that seek to explainthe determinants of poverty trajectories followed by individuals over 14years (and measured in a multi-dimensional fashion).1 This analysis allowsfor a deeper understanding of the processes that shape people’s experi-ence of poverty over substantial portions of their lives, which in turn canbe used to inform thinking about policy options.
It is the increasing availability of longitudinal data, most notably theUK cohort studies and the British Household Panel Survey (BHPS), whichhas made possible the study of poverty dynamics.2 The studies havedem on strated that poverty is much more widespread than indicated bycross-sectional statistics, but also that it is more complex. Few people areper ma nently poor, but many experience repeated spells of poverty.Transient, recurrent and permanent poverty may differ in kind, in theireffects on the individuals involved and in their consequences for society asa whole. The risk events associated with poverty are more prevalent than
actual spells of poverty, which suggests that social structures, and indi-vidual agency and government policies may protect some people againstthe onset of poverty.
In Chapter 3 we used the BHPS to track long-term trends in themulti-dimensional Poverty Index. In this chapter, we use the same data toexplore individual histories over the same time period (1991 to 2003) andto investigate the inherent causes or determinants of poverty from a multi-dimensional perspective. By adopting a long-term perspective we identifythe factors that trigger sustained downward trajectories into poverty (orlong-term moves out of poverty) rather than the episodic events which,though important in the short term, may have consequences that evapo-rate quite quickly. We also explore which social groups risk experiencinglong-term poverty, with a view to thinking about the targeting of preventiveinterventions.
Policy targeting in the UK
As already discussed, the current Labour administration has focused par-ticular attention on child poverty in Britain and pledged to eradicate it by2020. Policy continues to evolve rapidly, but the steps the Governmentbelieves to be necessary to reduce child poverty, as set out in The ChildPoverty Review in 2004, remain relevant:3
• Increase employment opportunities, raising incomes for those who canwork.
• Increase support for those who cannot work.• Improve the effectiveness of public services that tackle material depri-
vation, for instance, housing and homelessness.• Improve those public services – for example, education, that can con-
tribute most to increasing the future life chances of children in house-holds with low incomes, and ensure public services and the welfaresystem work well together when families face crisis points in their lives.
• Improve services for children and their families living in deprived areas,including targeted programmes.
This policy agenda is embedded in, and reflects, a broader policy thrustwith three key characteristics. The first is the strong emphasis on employ-ment as the principal way out of poverty, leading to the sustained invest-
The dynamics of multi-dimensional poverty 49
ment in successive generations of welfare-to-work (or activation) policies,designed to encourage an ever greater number of benefit recipients toenter or return to work.4 A second characteristic, evident in the welfare-to-work programmes, but also apparent more widely in government rhet-oric, is the juxtaposition of rights and responsibilities. Sometimes thesenotions are conflated as they are in the context of poverty and employ-ment; while it is presumed to be the right of anyone to expect a minimumstandard of living, it is also presumed to be an individual’s responsibility toseek gainful employment in order to meet that end. A third feature, corre-sponding with the first two bullet points above, is a strong emphasis onhelping families (single parents in particular) financially by means of the taxcredit and benefit systems.5
While the Conservative opposition shares the Government’s ambi-tions on child poverty, its policy perspectives (insofar as they can be ascer-tained) are rather different. However, they have made clear their belief inthe need for a stable family environment (by which is generally meant atwo-parent family) in order to fight child poverty. Their proposals empha-sise help for couples with children and encouraging couples to stay to -geth er as a family unit as a means of alleviating the risks to children.6
This policy context helps shape our analysis of poverty dynamicssince the longitudinal panel data at our disposal allows us to explore theimpact of employment, labour force status and family circumstances –and changes in these factors – on our multi-dimensional indicator over thelong term. This approach strikes us as being particularly apposite, giventhe difficulty of reaching the child poverty targets under current fiscal con-ditions.7
Because of data limitations, it is more difficult to assess the impactof government services, education and housing in the same way. Forexample, we know that many poor families are homeless or live in tempo-rary accommodation, but these people will not be picked up adequatelyin our data. Furthermore, the long-term impacts of education reforms ona child’s future chances are also difficult to measure and beyond thescope of the present work.
Modelling poverty experiences over the long term
The approach that we adopt in the analysis is called ‘latent growth mod-elling’. In essence, a latent growth model takes a repeated measure of an
50 Coping with complexity

indicator, such as our Poverty Index, and creates two measures that sum-marise the level and the trajectory of the indicator for every individual in thesample. Each individual in the analysis can be thought of as having abaseline score measured by the indicator (referred to as the intercept) anda trajectory representing how the individual’s score generally changes overtime (usually referred to as the slope).
In our case, the Poverty Index was measured at two-year intervalsbetween 1991 and 2003 and a latent growth model applied measuring thechange in our Index over this period. The estimation of the intercepts givesus a measure of the long-term, baseline severity of poverty for each per-son in the sample, while the slopes provide measures of the long-termpoverty trajectory of every individual. Figure 4.1 shows some hypotheticalcases of individuals with different intercepts and slopes related to thePoverty Index measured between 1991 and 2003 in the BHPS. An indi-vidual with a high intercept value generally experiences deep or severepoverty over much of the time period. Individuals with a high positive ornegative slope value tend, respectively, to become worse or better off.
Taking this modelling a stage further, we can explore the significantdeterminants of individuals’ poverty baselines and trajectories while simul-taneously taking many things into account. We can also investigatewhether particular circumstances or events trigger a move in or out ofpoverty or a change in the severity of poverty. In the long run, it is possi-ble that this approach could assist in the fight against poverty by enablingthe relative significance of various triggers of poverty to be assessed andby helping target support and assistance to people at risk of long-termpoverty.
We estimated two models for people of working age. The firstexplored the characteristics of individuals and households that might bethought to make them more or less prone to poverty. Some characteris-tics that do not change, gender for example, were measured only once atthe beginning of the study period but others were measured afresh in eachof the years studied. The second model added selected household eventsto help isolate the significant triggers that might push a family or individualover the edge into poverty.8
No statistical model is perfect and the variables available are fre-quently depressingly imprecise, adding to the difficulty of choosing whichvariables to include in the analysis and which to exclude. Our analysis wasno different. Among the individual and household characteristics that weincluded were gender and ethnicity, occupation, employment status andfamily situation (Table 4.1). Full-time occupation was disaggregated into
The dynamics of multi-dimensional poverty 51

six status categories, ranging from semi and unskilled work to profession-al, while part-time employment was separated into just two types (higherand lower status9). People not working were divided into those who wereunemployed, carers (a person who is not working, but not looking for workbecause of other family circumstances), and those who were long-termsick or disabled. A variable was also included to indicate whether the per-son had a partner who was employed. Family circumstances were repre-sented as one of six states corresponding to various stages in the lifehistory of a family: single people, couples with no children, couples withdependent children, couples with non-dependent children, lone parentswith dependants and lone parents with non-dependants. In order toexplore the impact of changes in household composition that might act astriggers to induce spells of poverty, we included simple changes in the
52 Coping with complexity
Figure 4.1
Hypothetical examples of poverty trajectories using the latent
growth model
A represents a person who starts off poor but gradually gets better off
B represents someone whose poverty stays the same throughout the observation period
C represents someone who descends into poverty
PIB
C
A
Time
family situation alongside the occupation and employment variables ratherthan family status per se. Specifically, we examined the impact of increas-es in the number of dependent children, the separation of couples andfamily formation – ie, the transition from being a single adult household tosharing a household with a partner.
The results of the analysis are presented in Tables 4.1 and 4.2. Thepresence of a ‘+’ or ‘–’ sign in the tables indicates a statistically significantchange in the Index across all or most of the period under observation(1991 to 2003). Thus, a ‘+’ indicates a significant increase in people’sPoverty Index score (and therefore an increase in the severity of theirpoverty) and a ‘–’ indicates a reduction in the Index and hence in theseverity of poverty. While we examined both the severity of poverty expe-rienced by people and their trajectories, our results are largely concernedwith the former. This is because, for the most part, the variables consid-ered did not significantly affect trajectories in the same way as they helpedto explain differences in the severity of poverty. However, it should beremembered that the models used separate the effects the variables haveon the severity of poverty from the effects they have on movements in andout of poverty.
Understanding long-term poverty
The analysis confirms that full-time employment serves as a very strongdefence against poverty, which is, of course, consistent with the Gov ern -ment’s emphasis on welfare-to-work programmes. Moreover, as onemight have expected (although it is not shown in the tables), the degree ofprotection increases with the status of the employment: people in profes-sional and managerial employment have much lower Poverty Index scoresthan skilled manual workers who, in turn, have lower scores than semi andunskilled workers. Having two people in a family working also has a verystrong protective effect with very few such families falling below the pover-ty line in any of years covered by the study.
However, part-time employment in itself generally offers very littleprotection against poverty over the long term. Only when the higher-status part-time occupations are broken down into more detailed cate-gories does it become apparent that managerial and professional posi-tions have a downward influence on the Poverty Index. Having a routineand unskilled part-time job had no significant effect at all on the PovertyIndex in many of the models that were explored. Being unemployed
The dynamics of multi-dimensional poverty 53
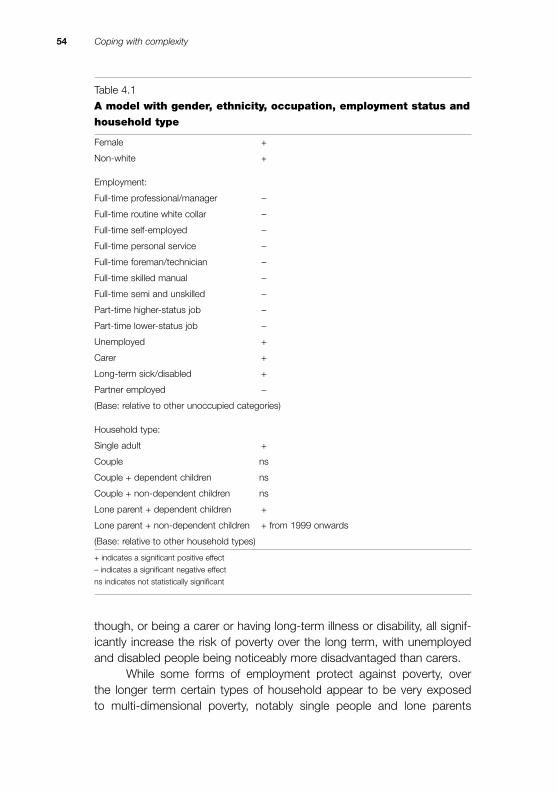
though, or being a carer or having long-term illness or disability, all signif-icantly increase the risk of poverty over the long term, with unemployedand disabled people being noticeably more disadvantaged than carers.
While some forms of employment protect against poverty, over the longer term certain types of household appear to be very exposed to multi-dimensional poverty, notably single people and lone parents
54 Coping with complexity
Table 4.1
A model with gender, ethnicity, occupation, employment status and
household type
Female +
Non-white +
Employment:
Full-time professional/manager –
Full-time routine white collar –
Full-time self-employed –
Full-time personal service –
Full-time foreman/technician –
Full-time skilled manual –
Full-time semi and unskilled –
Part-time higher-status job –
Part-time lower-status job –
Unemployed +
Carer +
Long-term sick/disabled +
Partner employed –
(Base: relative to other unoccupied categories)
Household type:
Single adult +
Couple ns
Couple + dependent children ns
Couple + non-dependent children ns
Lone parent + dependent children +
Lone parent + non-dependent children + from 1999 onwards
(Base: relative to other household types)
+ indicates a significant positive effect
– indicates a significant negative effect
ns indicates not statistically significant
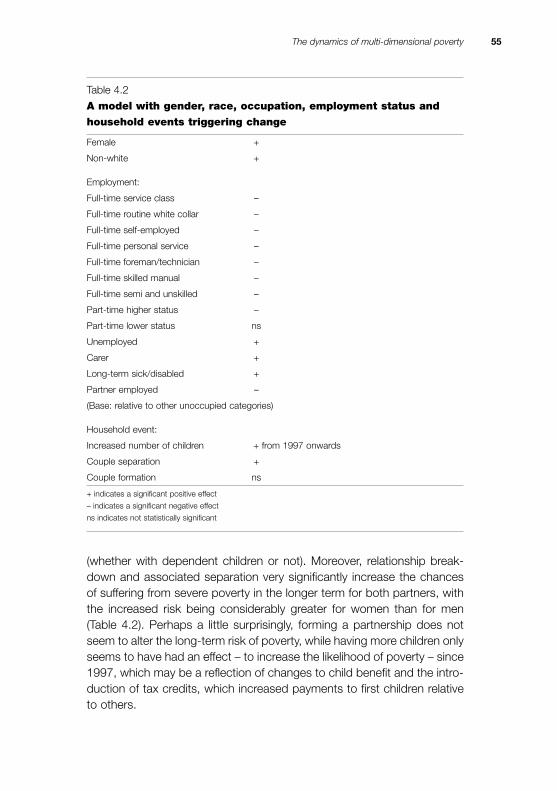
(whether with dependent children or not). Moreover, relationship break-down and associated separation very significantly increase the chancesof suffering from severe poverty in the longer term for both partners, withthe increased risk being considerably greater for women than for men(Table 4.2). Perhaps a little surprisingly, forming a partnership does notseem to alter the long-term risk of poverty, while having more children onlyseems to have had an effect – to increase the likelihood of poverty – since1997, which may be a reflection of changes to child benefit and the intro-duction of tax credits, which increased payments to first children relativeto others.
The dynamics of multi-dimensional poverty 55
Table 4.2
A model with gender, race, occupation, employment status and
household events triggering change
Female +
Non-white +
Employment:
Full-time service class –
Full-time routine white collar –
Full-time self-employed –
Full-time personal service –
Full-time foreman/technician –
Full-time skilled manual –
Full-time semi and unskilled –
Part-time higher status –
Part-time lower status ns
Unemployed +
Carer +
Long-term sick/disabled +
Partner employed –
(Base: relative to other unoccupied categories)
Household event:
Increased number of children + from 1997 onwards
Couple separation +
Couple formation ns
+ indicates a significant positive effect
– indicates a significant negative effect
ns indicates not statistically significant

Finally, gender and ethnicity appear to have a significant impact onthe risk of experiencing poverty over the long term, even after account is taken of differences in household type, occupation and householdchanges. Not being white in Britain during the 1990s and early 2000s car-ried a major penalty in terms of the increased risk of poverty, one that was,in fact, three times greater than that associated with being a woman. Bothbeing non-white and being a woman increased the risk of severe poverty,but neither affected the likely trajectory out of poverty once other factorshad been taken into consideration.
To summarise, the groups who seem to confront the highest long-term risk of poverty are:
• single people;• lone parents;• people who are not working (especially when unemployed, or sick or
disabled);• people working in low-status occupations (typically attracting lower
wages and offering less advantageous terms of employment), espe-cially if part time;
• people from households in which a couple has recently separated;• women;• people from minority ethnic communities.
Family or employment?
To return to the policy focus on employment and on the family, the firstthing to note is that, although employment generally serves to lower therisk of experiencing poverty, lone-parent families and single childless peo-ple are still much more prone to poverty than other types of family, evenwhen differences in employment are taken into account. In order to assessthe extent to which employment can lower the risk of poverty for thesetwo relatively disadvantaged groups, it is necessary to return to the statis-tical models and to compare the size of the relevant co-efficients (Tables4.3 and 4.4). To make comparison easier, the numbers are standardisedto show the relative effect of the various individual and household charac-teristics on the multi-dimensional Poverty Index. To simplify matters stillfurther, the figures are shown are for the latest year only (2003), althoughthese are generally representative of all the years studied.10
From Table 4.3 it can seen that the two largest positive coefficients,
56 Coping with complexity

signifying an increase in the risk and severity of poverty, are both associ-ated with being a lone parent, either with or without dependent children.Moreover, there is only one negative coefficient of similar size, namely thatassociated with ‘service class’ employment, which covers managerial andprofessional occupations. What this means is that the risk of severe pov -erty associated with being a lone parent can only be offset if the lone par-ent secures full-time employment in the most prestigious and lucrativekind of occupation. Self-employment and full-time employment in semiand unskilled occupations lower the Poverty Index, as does part-timeemployment in higher-status occupations, but not by nearly enough toalleviate the pressures of being a single parent. Personal service occupa-tions and part-time lower status occupations make hardly any differenceat all.
Therefore, employment offers no guaranteed pathway out of pover-ty for lone parents; only full-time employment in the best of jobs canachieve this. Moreover, the fact that lone parents remain substantially dis-advantaged, even when their live-in children are supposedly financiallyindependent, points to the need to take more account of the long-termconsequences of lone parenthood. The impact of relationship breakdown
The dynamics of multi-dimensional poverty 57
Table 4.3
Selected impact size relating to 2003
Full-time service class –0.240 (ns)
Full-time routine white collar –0.130 (ns)
Full-time personal service –0.047 (ns)
Full-time self-employed –0.143 (ns)
Full-time foreman/technician –0.146 (ns)
Full-time skilled manual –0.130 (ns)
Full-time semi/unskilled –0.116 (ns)
Part-time high status –0.140 (ns)
Part-time low status –0.005 (ns)
Single 0.106 (ns)
Couple, no children 0.000 (ns)
Couple, dependants 0.079 (ns)
Couple, non-dependants –0.002 (ns)
Lone parent, dependants 0.229 (ns)
Lone parent, non-dependants 0.257 (ns)
ns = not statistically significant

and separation on the risk of poverty is evident from Table 4.4. Separationsignificantly increases the size of the Poverty Index, irrespective of occu-pational status and it would seem that even the most prestigious employ-ment cannot fully offset the increased risk of poverty over the longer term.On the other hand, employment does appear to offer single childlessadults substantial protection against poverty, but for most part this wouldentail a person securing a full-time job.
Conclusions
Whereas in the previous chapter we documented national trends in themulti-dimensional poverty rate between 1991 and 2003, in this chapter wehave focused on individual trajectories over the same period and soughtto identify events and characteristics that might make individuals moreprone to poverty over the long term. In so doing, our approach has beeninfluenced both by the belief among policy makers that employment offersthe best route out of poverty and by the increased attention being paid bythe official opposition to the family as a defence against poverty. Our con-clusions are that, while employment is important, it is not a universalpanacea, and that, although family breakdown is a major cause of pover-
58 Coping with complexity
Table 4.4
Selected impact size relating to 2003
Full-time service class –0.242 (ns)
Full-time routine white collar –0.137 (ns)
Full-time personal service –0.043 (ns)
Full-time self-employed –0.145 (ns)
Full-time foreman/technician –0.166 (ns)
Full-time skilled manual –0.128 (ns)
Full-time semi/unskilled –0.112 (ns)
Part-time high status –0.141 (ns)
Part-time low status –0.012 (ns)
Increased number of children 0.096 (ns)
Couple separation 0.347 (ns)
Couple formation 0.004 (ns)
ns = not statistically significant

ty, there is little evidence that family formation or reconstitution does muchto lift individuals out of poverty over the longer term.
The consequences of relationship breakdown and separation inincreasing the susceptibility to multi-dimensional poverty are very marked,affecting, as they do, both men and, particularly, women. Moreover, giventhat our observations were necessarily spaced at two-year intervals, wewill have missed many of the short-term effects of separation on poverty,while demonstrating that the impact is sustained over considerable peri-ods. Indeed, the finding that lone parents are still massively at risk ofpoverty even after their children have notionally attained financial inde-pendence underlines the long-term consequences of relationship break-down. Furthermore, as we show in the next chapter, a stable homeenvironment is one of the key determinants of child wellbeing along anumber of dimensions.
Unlike studies in the United States, we did not uncover evidence ofsymmetry in the dissolution and formation of relationships.11 It does notseem that in Britain it is generally possible to ‘marry’ one’s way out ofpoverty by partnering, at least not as evidenced by the period between1991 and 2003. New unions that were formed appeared to have no sig-nificant effect on the risk of poverty for either of the individuals involved.Therefore, while in policy terms it might be possible to prevent occur-rences of poverty by reducing relationship breakdown (although how thiswould be done, and with what other consequences, is unclear), there isno basis for believing that encouraging partnering or marriage would havemuch impact on the long-term poverty rate. On the other hand, it is clearthat, despite all the policy innovation witnessed during the 1990s and early2000s, lone parents remain very susceptible to poverty over long periodsand, hence, that new policy thinking is required.
Policy thinking to date has focused largely, if not exclusively, onemployment as a bulwark against poverty. Self-evidently, paid work canmake a real difference, although its effect on the various dimensions ofpoverty is likely to vary both in timing and in degree. Moreover, employ-ment alone seems insufficient to lift most lone parents out of long-termpoverty. This is because only full-time employment in a high status job islikely to generate the resources necessary to compensate for the lossesdue to relationship breakdown and the costs of lone parenthood. The low-skilled, low-paid employment generally available to lone parents proveslikely to be of real benefit only if it proves to be stable and to be a step-ping stone to better long-term prospects – the exception rather than therule, given that low-skilled and personal service jobs tend to be low paid,
The dynamics of multi-dimensional poverty 59
temporary and inherently unstable. It is not surprising, therefore, that a sig-nificant number of participants in the New Deal for Lone Parents havemoved into poor quality employment, with high exit rates and quite rap idlyreturned to benefits.12
Finally, two other results are worth underlining. First, to be singleand alone is not necessarily to be poor, but the risk of people with thesecharacteristics experiencing multi-dimensional poverty over the longerterm is noticeably higher than for most other groups. The vulnerability of this group has been noted in the context of cross-sectional measuresof poverty and at various times they have been a policy priority. Alongsidetackling child poverty, policy makers should be concerned about the living conditions and health of working-age adults living alone without children.
Secondly, our analysis hints at the probable continued existence ofdiscrimination in relation to gender and ethnicity. Certainly, like incomepoverty in the here and now, multi-dimensional poverty observed overlong periods is contoured by ethnicity and gender.
Notes1 The methodology (latent growth modelling) is a powerful tool that can be used
to understand simultaneously both short- and long-term determinants of pov -
erty trajectories.
2 See for example, R Walker with K Ashworth, Poverty Dynamics: issues and
examples, Avebury, 1994; S Jenkins and J Rigg, The Dynamics of Poverty in
Britain, DWP Working Paper 157, Corporate Document Services, 2001; J Rigg
and T Sefton, ‘Income Dynamics and the Life Cycle’, Journal of Social Policy
35(3), 2006, pp411-35; G Maggio, Multidimensional Analysis Of Poverty
Dynamics In Great Britain, Working Papers of the Institute for Social and
Economic Research, Paper 10, University of Essex, 2004; D Fouarge and R
Layte, ‘Welfare Regimes and Poverty Dynamics: the duration and recurrence of
poverty spells in Europe’, Journal of Social Policy 34(3), 2005, pp407-26; R
Layte and C Whelan, ‘Moving in and out of Poverty: the impact of welfare
regimes on poverty dynamics in the EU’, European Societies 5(2), 2003, pp167-
91; C Whelan, R Layte and B Maitre, ‘Multiple Deprivation and Persistent
Poverty in the European Union’, Journal of European Social Policy 12(2), 2002,
pp91-105
3 HM Treasury, The Child Poverty Review, HMT/HMSO, 2004, p5
4 See D Hirsch, What Will it Take to End Child Poverty? Firing on all cylinders,
Joseph Rowntree Foundation, 2006, Chapter 2 for an overview and a discus-
sion of the limitations of this approach.
60 Coping with complexity

5 Department for Work and Pensions, Working for Children, Cm 7067, The
Stationery Office, 2007
6 For example, S Callan and others, The State of the Nation Report: fractured
families, Social Policy Justice Group, 2006
7 See for example, M Brewer, J Brown and H Sutherland, Micro-simulating Child
Poverty in 2010 and 2020, Joseph Rowntree Foundation, 2006
8 The models were estimated for the whole sample of individuals where complete
data was available for all waves. Furthermore, the event model excluded Wave
1 (as these models are based on events happening between waves, we cannot
include Wave 1 as we do not have enough information on what happened to
the household before 1991).
9 Higher status includes professionals, managers, self-employed, foremen and
technicians, skilled manual; lower status is routine white collar, personal service,
semi and unskilled.
10 These relate only to the last wave of data in the analysis (Wave 13 from 2003),
but are fairly representative of the results from all the other waves.
11 M Rank, One Nation, Underprivileged: why American poverty affects us all,
Oxford University Press, 2004. But see also T Mauldin and Y Mimura, ‘Marrying,
Unmarrying and Poverty Dynamics among Mothers with Children Living at
Home’, Journal of Family and Economic Issues 28(4), 2007, pp566-82
12 A Yeo, ‘Experience of Work and Job Retention Among Lone Parents: an evi-
dence review’, DWP Working Paper 37, Corporate Document Services, 2007
The dynamics of multi-dimensional poverty 61
FiveChildren’s experience of poverty
In Chapter 3 we not only showed that it was technically possible to cap-ture the complexity of poverty as adults experience it but also that the inci-dence of poverty measured in this way declined noticeably between 1991and 2003 in both absolute and relative terms. The fall was initially drivenby a drop in the level of financial stress, people’s ability to cope financiallyand, subsequently, by falls in material deprivation as goods became rela-tively cheaper. Incomes rose, but respondents’ rounded experiences of lifeimproved even more, thereby lifting greater numbers of people above thepoverty line when measured in a multi-dimensional way than when meas-ured by income alone.
The focus of attention shifts in this chapter away from adults to chil-dren. We do not seek directly to measure the dimensions of childhoodpoverty (although in Chapter 6 we investigate the wellbeing of childrenbased on questionnaires completed by young people aged 11 to 15).Rather, we pay attention to children living in households headed by a per-son with a multi-dimensional poverty score below the poverty threshold. Itis, of course, possible that some heads of household are both able andchoose to make sacrifices of varying kinds to ensure that their children donot experience the full force of the household’s poverty.1 It may also be thecase that some children in apparently more prosperous households willexperience poverty either inadvertently through poor budgeting or as aresult of wanton neglect. However, logic suggests that the probability of achild experiencing poverty is much increased if adults in the householdsare themselves poor.
The extent of child poverty
It is widely recognised that children are more at risk of poverty than adults.This reflects the fact that all children, other than the small number cared

for in institutions, live in families in which income has to be shared betweenadults and children. Many adults – indeed the majority of adults – live inhouseholds without children and so do not have to spend any of theirincome meeting the needs of children. Since the main forms of income(wages, investment income and certain benefits) are not determined byhousehold size or need, adults without children are typically better off thanadults with children and hence, parental sacrifice notwithstanding, betteroff than children themselves. In addition, adults who manage to follow thetraditional career trajectory of rising incomes are likely to find themselveswith most income at the time when their children have left home andostensibly have become independent of parental resources.
The threshold for the multi-dimensional measure of poverty wasarbitrarily fixed at 25 per cent of adults in 1991 and this poverty rate fellover time to 12 per cent in 2003 (Figure 5.1). The corresponding figuresfor children were respectively 30 per cent and 13 per cent, indicating notonly that the incidence of child poverty fell as did that for adults, but thatthe increased risk of poverty faced by children over adults was noticeablyreduced, from 20 per cent in 1991 to just 11 per cent 2003. The goodnews, then, is that multi-dimensional poverty among children fell at aneven faster rate than among adults.
Children’s experience of poverty 63
Figure 5.1
Poverty rates for children and adults
1991 1993 1995 1997 1999 2001 2003
Pov
erty
rat
es (%
)
35
30
25
20
15
10
Absolute adults
Absolute children
Relative adults
Relative children

When measured in relative terms, of course, the adult poverty rate provedto be more stubborn, partly because of the well-documented increase ininequality that occurred over the 1990s and into the first years of the twen-ty-first century. Among adults, multi-dimensional poverty measured in arelative sense2 fell from 19 per cent to 15 per cent between 1991 and2003, whereas that for children fell markedly faster, from 26 per cent to 16per cent. While the absolute poverty rates for adults and children trackedeach other downwards over the period, the relative rate for childrenappeared to exaggerate movements in the adult rate. Relative poverty forchildren fell very rapidly between 1991 and 1995 but, while the adult rateremained more or less constant from then until 2001, that for children roseuntil 1997, then hesitated, before falling sharply between 2001 and 2003.This sharp decline, when absolute and relative poverty among children fellat a similar rate, coincided with the maturation of a number of anti-childpoverty measures triggered by the Government’s 1999 commitment toeradicating child poverty. Possibly reflecting the Government’s change inemphasis, adult poverty – again measured relatively – scarcely changedbetween 2001 and 2003, whereas the rate for children fell by 3.4 per-centage points, or 17 per cent.
The fall in relative child poverty identified by the multi-dimensionalmeasure was noticeably more than that registered by simple income-based measures. So, while over the period 1991 to 2003, relative incomepoverty fell by almost one-quarter from 28.6 to 21.6 per cent, multi-dimensional poverty also measured relatively declined by nearly two-fifths– from 26 per cent to 16.4 per cent. By looking at movements in the otherdimensions of poverty it is possible to understand why this should be so(Figure 5.2).
In 1991, as already noted, children faced a noticeably greater riskthan adults of living in households characterised by multi-dimensionalpoverty. Figure 5.2 shows that they were also more likely to live in house-holds with equivalent incomes below 60 per cent of the median and inwhich the head of household reported financial stress, indexed by indebt-edness and self-assessment of their financial circumstances. In the sub-sequent 12 years, income poverty fell noticeably after an initial rise, whilefinancial stress declined earlier and progressed further, contributing sub-stantially to the fall in the overall index of multi-dimensional poverty.Families found it easier to cope financially in the early twenty-first centurythan they had a decade or so earlier.
What was particularly noticeable in 1991, and remained truethroughout the period studied, was that children were very unlikely to live
64 Coping with complexity

in households experiencing material deprivation. In part, this may point toproblems with the way in which material deprivation is measured – ie, bythe absence of consumer durables such as a washing machine, tumbledrier, central heating, CD player and personal computer. The data source,the British Household Panel Survey (BHPS), does not include questionsasking respondents about whether they would like to own the consumerdurables they do not have, if they could afford them. It may be, therefore,that the index of material deprivation partly measures consumption pref-erences rather than hardship.
On the other hand, the finding underlines the importance that par-ents attach to consumer goods, such as washing machines and tumble
Children’s experience of poverty 65
Figure 5.2
Trends in the dimensions of child poverty
1991 1993 1995 1997 1999 2001 2003
Pov
erty
rat
es (%
)
35
30
25
20
15
10
5
0
Income
Financial strain
Material deprivation
Psychological stress (GHQ)
Environment
Total Poverty Index

driers, that make servicing children’s basic needs more manageable, andto letting children have access to electronic equipment that can provideentertainment, education or both.3 As many as 76 per cent of single elder-ly people fell beneath the deprivation threshold, which suggests both life-cycle and a cohort dimension to material deprivation since many of theproducts included in the index have been introduced as consumer prod-ucts comparatively recently. Just 7.6 per cent of households with childrenand 8.7 per cent of children as a whole were defined as being materiallydeprived compared with 20 per cent of childless couples of working age.This latter finding points not only to the additional costs that have come tobe associated with bringing up children, but also in social, if not absolute,terms, to the extreme relative deprivation likely to be experienced by thesmall number of children living in households without access to such socialnecessities as central heating, a washing machine and a personal com-puter.
Interestingly, children are marginally less likely to live in a householdin which the head reports symptoms of psychological stress. Whether thisis attributable to the beneficial mental health effects of being a parent ordue to selectivity, with less stressed people having, or being able to have,children, is not discernable from the data. Analysis of the 1999 Povertyand Social Exclusion survey, smaller in scale than the BHPS and less sta-tistically robust, found that couple parents were no more or less likely thanother adults to exhibit symptoms of psychological stress but lone par entswere more prone to report symptoms of depression than any other demo-graphic group.4 This study also found that lone parents were more likelythan other adults to suffer from psychological stress but this was offset bythe mental wellbeing of couple parents and the fact that more childrenlived with two adults than with a lone parent.
While the 1999 Poverty and Social Exclusion survey focuses onadults, Figure 5.2 concerns children and there is reason to believe that par-ents with more than one child – in which children by definition are over-rep-resented – exhibit less stress, being older, more experienced and less likelyto be a lone parent. What the 1999 Poverty and Social Exclusion surveyalso cannot reveal is the change in the level of parental stress over time.Figure 5.2 shows that, despite the strong contribution of psychologicalstress to the overall measure of multi-dimensional poverty, the probability ofa child living with stressed parents did not decline systematically between1991 and 2003 despite the marked fall in poverty. One conceivable expla-nation is that psychological stress that is part of poverty is more a productof relative, rather than absolute, differences in deprivation. So, for example,
66 Coping with complexity
parents in poverty may be less stressed as a result of an absolute shortageof money than by not being able to buy the latest toys for their children, orto participate fully in social activities or live up to current expectations.
While environmental factors were important elements in the defini-tion of multi-dimensional poverty, they are not included in the compositepoverty measure presented in Figure 5.2 because appropriate variableswere not carried by early waves of the BHPS. However, there was no fallin the child poverty associated with environmental deprivation over theperiod 1997 to 2003 for which data is available. Rather, it rose slightly andthen fell in almost exactly the same fashion as that associated with psy-chological stress. This association may be coincidental, but equally itmight be that parents’ psychological stress is closely associated withcharacteristics in the local environment or that trends in both are deter-mined by another unmeasured influence, such as housing demand.
What is clear, however, is that children are more at risk of experi-encing poverty measured multi-dimensionally than are adults, but that thepoverty rate among children fell faster than for adults in the dozen or soyears to 2003. Moreover, it would appear that children are less exposedto material deprivation than adults in general, possibly – if other studies aretaken as evidence – because parents seek to protect their children againstthis kind of hardship, but maybe also because certain consumer durablesmake parenting easier.
The risk of child poverty
Of course, studies of income poverty demonstrate that children are not allequally at risk of poverty. The same is true of multi-dimensional poverty,although the risk factors are by no means identical.
The risk of a child being poor varies according to age and house-hold characteristics. To aid comparison, the average risk of a child beingpoor in 2003 – 26 per cent – is set equal to 1.0 in Table 5.1. If the risk ofa child with a particular set of characteristics being poor exceeds the aver-age, the value in the first column of Table 5.1 will be greater than 1.0.Thus, it can be seen that the risk of a child being poor is slightly more thandoubled (2.04) if s/he happens to live a household in which no adultworks. However, the risk of poverty is even higher among children livingwith lone parents, but greatest of all when the household head has a dis-ability or long-term illness.
Children’s experience of poverty 67

Comparing the first two columns of figures in Table 5.1, whichrecord the relative risk of multi-dimensional and income poverty, is veryinstructive. To the extent that one accepts the argument that a multi-dimensional measure provides a more accurate index of ‘true’ poverty,focusing on income poverty serves significantly to distort the actual inci-dence of poverty and could mislead those seeking most effectively to tar-get assistance. The income-based measure exaggerates the risk ofpov erty faced by a child living in a workless household and those living insocial housing, compared with the more comprehensive index of multi-dimensional poverty. So, whereas the income measure prioritises work -lessness as a cause or correlate of child poverty, the multi-dimensionalmeasure underlines the importance of adult disability and somewhatdownplays the risk associated with living in social housing.
Table 5.1
Risk of child poverty by household characteristic
Relative risk Percentage change in the2003 risk of poverty 1991–2003
Characteristic Poverty Income Poverty IncomeIndex poverty1 Index poverty1
Living with a lone parent 2.18 2.11 34.3 36.6
Living with sick/disabled head of household 2.41 2.39 46.8 25.2
Living in council housing 1.96 2.52 40.9 11.4
Living in housing association accommodation 1.76 2.44 45.1 –5.8
Living with a workless head of household 2.04 2.88 47.2 18.0
All children 1.00 1.00 24.5 36.9
1 Equivalised household income below 60 per cent of the median before housing costs
Table 5.1 also reveals significant changes in the incidence of child pover-ty between 1991 and 2003 that again differ according to whether a nar-row income definition of poverty or a multi-dimensional one is used. Takingan income measure, the incidence of poverty has fallen most among chil-dren living with lone parents or with a disabled head of household andleast among children living in social housing. Indeed, child poverty actual-ly rose marginally among children in housing association accommodation.This could be interpreted as a product of targeting benefits and employ-
68 Coping with complexity

ment support to lone parents and disabled people. The multi-dimension-al measures confirm the reduction in the risk of poverty among thesegroups but indicate improvements of a similar, if not greater, magnitudeamong children in social housing attributable to factors other thanincreased income.
Table 5.2
Risk of child poverty by demographic characteristics
Relative risk 2003
Characteristic Poverty Index Income poverty1
Child aged 0–4 0.74 0.80
Child aged 5–11 1.13 1.11
Child aged 12+ 0.72 1.04
1 child in household 0.99 0.66
2 children in household 0.88 0.89
3 children in household 1.10 1.29
4+ children in household 1.61 2.17
All children 1.00 1.00
1 Equivalised household income below 60% of the median before housing costs
Two demographic risk factors – age and household size – are comparedin Table 5.2 and again their relative importance differs between the multi-dimensional and simple income measures. Irrespective of the measureused, primary school-aged children appear to be most at risk of povertywhile pre-school-aged children are less likely than an average child to livein a poor household. However, the multi-dimensional measure suggeststhat secondary school-aged children are noticeably less likely thanyounger ones to experience poverty, while the income-based measuredoes not. There are subtle differences too when considering family size.Using an income measure, poverty increases with the number of children,such that children with three or more siblings are more than three timesmore likely to be poor than an only child. This differential proves to bemuch less marked when the more comprehensive measure of poverty isapplied since, with this measure, the risk of a child being poor is lowestwhen they have a single sibling. The suggestion here, then, is that the con-sequences of needing to share a similar amount of income between alarger number of individuals in large families is to some extent offset whenaccount is taken of other aspects of poverty.
Children’s experience of poverty 69
Child poverty
The period 1991 to 2003 witnessed a steady and substantial decline inchild poverty, measured multi-dimensionally, from over 30 per cent to a lit-tle more than 13 per cent. Much of this improvement occurred before1999 when Tony Blair committed the Labour Government to the eradica-tion of child poverty and, indeed, there is little evidence that the activitiesof government made a difference until after 2001.
As for adults, taking account of the many dimensions of povertyproves instructive. It enriches understanding of the factors most likely tobe associated with child poverty – for example, adult disability increasesthe risk of a child experiencing poverty more than worklessness, and largefamily size proves to be less important than when account is taken ofincome alone. It is also clear that, for whatever reason, children are betterprotected against material deprivation than other aspects of poverty. Evenso, as explained in the next chapter, household poverty has a profoundnegative impact on the wellbeing of children.
Notes1 It is also possible that adults in the household have human capital resources
suff ic ient to outweigh the poverty of the household head, although it should be
noted that the methodology adopted means that the household head is
assigned the appropriate equivalent household income.
2 See Appendix for a discussion of translating the Poverty Index into a relative
form.
3 J Bradshaw and others, Minimum Income Standards in Britain, Joseph
Rowntree Foundation, 2008
4 S Payne, ‘Mental Health, Poverty and Social Exclusion’, in C Pantazis, D
Gordon and R Levitas (eds), Poverty and Social Exclusion in Britain: the
Millennium survey, The Policy Press, 2006
70 Coping with complexity
SixPoverty and childhood wellbeing
We have seen how a multi-dimensional measure of poverty can enhanceour understanding of poverty and its dynamics. In this chapter we take themulti-dimensional poverty measure a stage further by exploring the rela-tionship between it and measures of childhood wellbeing.
Anti-poverty policy in Britain, the United States and much of Europeis increasingly focused on child poverty.1 Among the many reasons for thisshift in emphasis is the evidence of the scarring effects of child pov erty onadult outcomes, undermining the equality of opportunity that is meant tounderpin social justice, as proposed by the influential US phil osopherJohn Rawls.2 However, there is growing concern in some quarters that thefuture-orientated emphasis on children becoming adults neglects theimport ance of child wellbeing in the here and now.3 One consequencemay be to misdirect policy, prioritising instrumental measures while failingdirectly to enhance the quality of childhood. This may curtail the chancesof a child in a low-income household enjoying a ‘good’ childhood, anundesirable outcome in itself, but one that could also inhibit the develop-ment of personal resilience needed to break the link between child pover-ty and poor adult outcomes.
In Britain, the re-focusing of policy can be precisely dated to 18March 1999 when the then Prime Minister, Tony Blair, delivered the annu-al Beveridge lecture and announced the goal to ‘end child poverty’ within‘a generation’. This important commitment was a late addition to a lectureon social justice in which Blair reasserted his meritocratic, Rawlsian viewof justice, defined as equality of opportunity rather than equality of out-come. The lecture was future orientated, borrowing the sound bite fromGordon Brown, then Chancellor of the Exchequer, that while childrencomprised 20 per cent of the population, they were ‘100 per cent of thefuture’. Consistent with Blair’s concept of social justice as ‘a communitywhere everyone has the chance to succeed’, he committed the Govern -ment to breaking ‘the cycle of deprivation so that children born into pover-ty are not condemned to social exclusion and deprivation’. The speech

was followed by a blizzard of anti-child poverty policies and commitmentsand the publication of an annual document against which performancewas to be assessed.4 Despite lukewarm public support for the policy,political commitment to the anti-child poverty agenda has proved long-lived and has also been endorsed by leaders of the political opposition.5
Much of the academic literature relating to child poverty in the UKhas focused on two issues. First, the identification of households whererisk is greatest and, second, the so-called ‘scarring’ of children and thetransmission of disadvantage into adulthood. With respect to the former,the risk factors are now well established. Not surprisingly, poor childrenare more likely to be found in low-income households, but also in: work-less households; households receiving benefits; those in rented accom-modation; lone-parent families; families with younger children; largefam il ies and ethnic minority households. From a policy perspective, thecrucial issue is no longer that of identifying which children are most at risk(though the previous chapter suggests some correctives), but rather map-ping the pathways through which household poverty in all its manifesta-tions affects children and their wellbeing.
With respect to the second set of literature on scarring and trans-mission, the impact of poverty on a child’s future life chances has beenextensively researched and summarised.6 Moreover, early analysescaught the attention of Gordon Brown in late 1998 and may have influ-enced the content of Blair’s Beveridge lecture.7 While this work is con-vincing, there is comparatively much less literature relating to child povertyin the here and now and its immediate impact on the life of the child.Studies suggest a complex relationship between economic hardship andchild well being and that the latter may mediate the effect of poverty onadult outcomes. Some British evidence points to children feeling embar-rassed and socially excluded, seeing inequality as inevitable and educa-tion futile,8 although other work shows children being variously obliviousto their poverty, accepting of it or pestering hard for extra resources andopportunities.9 At one extreme, children find themselves protected by par-ents and other family relationships whereas, at the other, poverty may lieat the root of abusive or ineffectual parenting.10 Similarly, school may pro-vide a refuge and a potential means of economic escape or serve to traplow-income children in a state of under-performance.11
Given this somewhat confusing picture of the way that householdpoverty may or may not impact on the lives and wellbeing of children,there is again a need to confront head on the complexity that is real lifeand to use it to good effect with a view to informing policy. As it happens,
72 Coping with complexity

variants of the same statistical modelling technique employed in Chapter3, structural equation modelling (SEM), can be used to track the pathwaysby which the various dimensions of poverty affect different aspects of childwellbeing. Therefore, this chapter is devoted first of all to understandingbetter the ways in which children in the ‘here and now’ are affected by thepoverty of the adults with whom they live. However, the same modellingtechniques also enable us to explore the likely impact of policies designedto mediate the effects of poverty on child wellbeing.
The measurement of poverty and child wellbeing
As poverty is multi-dimensional, so too is child wellbeing. Four key dimen-sions are suggested from the literature that could be measured with thedata available. ‘Home life’ is a measure of a child’s relationship with her/hisparents. ‘Educational orientation’ is a measure of how well the child isdoing at school. ‘Low self-worth’ is a measure of the child’s psychologicalhealth, while ‘risky behaviour’ is an attempt to measure aspects of risk-taking or anti-social behaviour.
The data used was drawn from the 2001 wave of the British House -hold Panel Survey (BHPS) for all households with children, after excludingthe small number headed by a person aged less than 18 or over 64. TheBHPS collects information on children in the sample households and,importantly, all older children (those aged between 11 and 15) complete aseparate questionnaire (known as the British Youth Panel), which forms thebasis for the measurement of child wellbeing presented below.
Adopting the same approach as to the multi-dimensional measureof poverty, a model of child wellbeing was constructed using the variableslisted in Table 6.1 (see Figure 6.1).12 The basic model with four dimensionswas enhanced by including variables to take account of the gender andage of the child and the score of the head of household on the PovertyIndex. It is important to realise that the measures of wellbeing relate onlyto children aged 11 to 15 since we have no data for younger children. Inone sense, this is clearly a limitation. Indeed, because of the age rangeone might be tempted to speak of ‘young people’ rather than ‘children’.On the other hand, the data was obtained directly from the young peoplethemselves rather than being filtered through the perceptions of adults.
As would be expected, the four dimensions of wellbeing are inter-connected. So, as can be seen from Table 6.2, educational orientation is
Poverty and childhood wellbeing 73
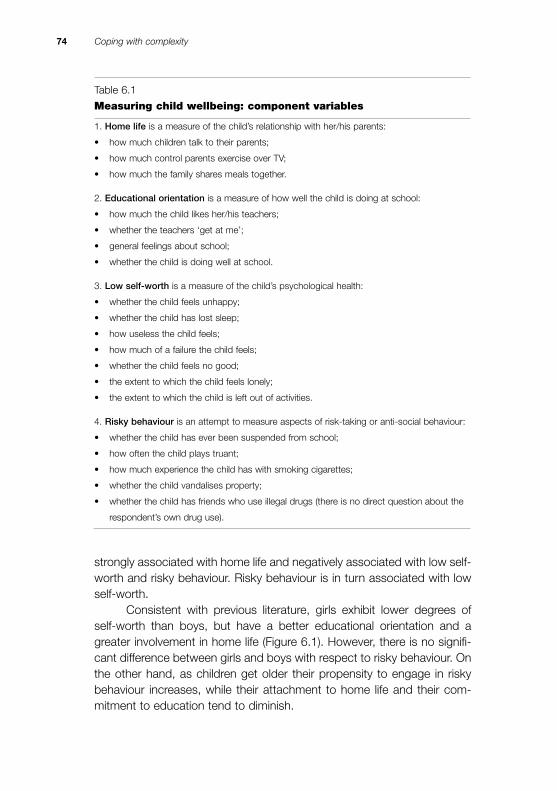
strongly associated with home life and negatively associated with low self-worth and risky behaviour. Risky behaviour is in turn associated with lowself-worth.
Consistent with previous literature, girls exhibit lower degrees ofself-worth than boys, but have a better educational orientation and agreater involvement in home life (Figure 6.1). However, there is no signifi-cant difference between girls and boys with respect to risky behaviour. Onthe other hand, as children get older their propensity to engage in riskybehaviour increases, while their attachment to home life and their com-mitment to education tend to diminish.
74 Coping with complexity
Table 6.1
Measuring child wellbeing: component variables
1. Home life is a measure of the child’s relationship with her/his parents:
• how much children talk to their parents;
• how much control parents exercise over TV;
• how much the family shares meals together.
2. Educational orientation is a measure of how well the child is doing at school:
• how much the child likes her/his teachers;
• whether the teachers ‘get at me’;
• general feelings about school;
• whether the child is doing well at school.
3. Low self-worth is a measure of the child’s psychological health:
• whether the child feels unhappy;
• whether the child has lost sleep;
• how useless the child feels;
• how much of a failure the child feels;
• whether the child feels no good;
• the extent to which the child feels lonely;
• the extent to which the child is left out of activities.
4. Risky behaviour is an attempt to measure aspects of risk-taking or anti-social behaviour:
• whether the child has ever been suspended from school;
• how often the child plays truant;
• how much experience the child has with smoking cigarettes;
• whether the child vandalises property;
• whether the child has friends who use illegal drugs (there is no direct question about the
respondent’s own drug use).

Poverty and childhood wellbeing 75
Figure 6.1
A basic model of child wellbeing (arrows show significant impacts)
Home life
Educationalorientation
Low self-worth
Risky behaviour
Female
0.17
0.47
30
2420
-0.22
-0.130.13
0.23
0.10
-0.57
0.10
-0.19 -0.27
-0.47
0.21
0.11
Age 12
Age 11
Age 13
Age 14
Poverty Index
Base: Male Age 15+
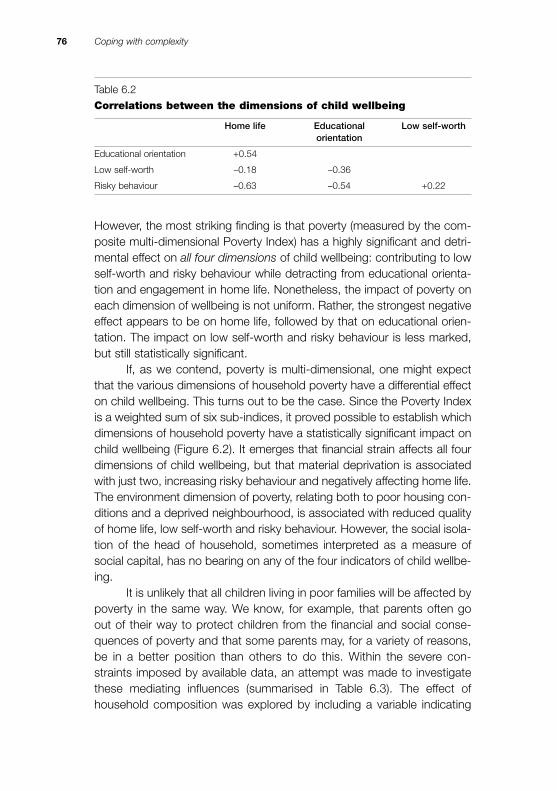
However, the most striking finding is that poverty (measured by the com-posite multi-dimensional Poverty Index) has a highly significant and detri-mental effect on all four dimensions of child wellbeing: contributing to lowself-worth and risky behaviour while detracting from educational orienta-tion and engagement in home life. Nonetheless, the impact of poverty oneach dimension of wellbeing is not uniform. Rather, the strongest negativeeffect appears to be on home life, followed by that on educational orien-tation. The impact on low self-worth and risky behaviour is less marked,but still statistically significant.
If, as we contend, poverty is multi-dimensional, one might expectthat the various dimensions of household poverty have a differential effecton child wellbeing. This turns out to be the case. Since the Poverty Indexis a weighted sum of six sub-indices, it proved possible to establish whichdimensions of household poverty have a statistically significant impact onchild wellbeing (Figure 6.2). It emerges that financial strain affects all fourdimensions of child wellbeing, but that material deprivation is associatedwith just two, increasing risky behaviour and negatively affecting home life.The environment dimension of poverty, relating both to poor housing con-ditions and a deprived neighbourhood, is associated with reduced qualityof home life, low self-worth and risky behaviour. However, the social isola-tion of the head of household, sometimes interpreted as a measure ofsocial capital, has no bearing on any of the four indicators of child wellbe-ing.
It is unlikely that all children living in poor families will be affected bypoverty in the same way. We know, for example, that parents often goout of their way to protect children from the financial and social conse-quences of poverty and that some parents may, for a variety of reasons,be in a better position than others to do this. Within the severe con-straints imposed by available data, an attempt was made to investigatethese mediating influences (summarised in Table 6.3). The effect ofhousehold composition was explored by including a variable indicating
76 Coping with complexity
Table 6.2
Correlations between the dimensions of child wellbeing
Home life Educational Low self-worthorientation
Educational orientation +0.54
Low self-worth –0.18 –0.36
Risky behaviour –0.63 –0.54 +0.22

whether the household was headed by a single adult and variables rep-resenting the number of children in different age categories. Likewise, thepossible influence of the educational and employment and employmentstatus of the head of household was considered, as was the level ofincome available.
The results show that the children in single-adult households areless likely than others to eat or talk with their parent or to have their accessto television monitored – variables that relate to the home life dimension.They are also more likely to engage in risky behaviour, but do not differfrom other children in terms of educational orientation or sense of self-worth. In certain respects, therefore, the wellbeing of children in lone-par-ent households may be compromised. This may possibly be because,
Poverty and childhood wellbeing 77
Figure 6.2
How different aspects of poverty impact on aspects of wellbeing
Home life
Educational orientation
Low self-worth
Risky behaviour
Financial strain
Material deprivation
Psychologicalstrain
Poor environment
Social isolation
Civic participation
Positive relationship Negative relationship
Household Child

with just one adult, the total volume of care available is less in lone-parenthouseholds. Certainly, the modelling indicated that the lower incomes oflone-parent families do not account for the observed differences in childwellbeing. The presence of other children or siblings also appears to haveno effect on children’s wellbeing.
The impact of poverty on child wellbeing seems to be influenced bythe employment status of the household head, but in complex ways.Where the household head is unemployed, children are more prone toengage in risky behaviour and to have a poor home life. On the otherhand, their educational attachment is unaffected as is their sense of self-worth. Children brought up in households in which the head is economi-cally inactive, which would include people who are disabled and for otherreasons not required to look for work, appear to be somewhat moreadversely affected in that they are disadvantaged on all four dimensions ofwellbeing. This difference may reflect the impact of long-term poverty onchildren since this is more likely to occur among households headed by a
78 Coping with complexity
Table 6.3
Effects of various factors on child wellbeing with various controls
in addition to age and gender of the child
Household Education Employment Household composition of head status of head income
Significant impact on:
Home life –0.11 +0.23 –0.11 +0.16
(Single adult (Higher (Unemployed)
household) education) –0.11
(Non-employed)
Educational orientation ns +0.15 –0.10 +0.11
(Higher (Non-employed)
education)
Low self-worth ns ns +0.07* ns
(Non-employed)
Risky behaviour +0.09 ns +0.08 –0.09*
(Single adult (Unemployed)
household) +0.09
(Non-employed)
ns = not statistically significant
* = marginally significant at 5% level

person who is economically inactive, as unemployment is more typicallyintermittent, and interspersed with periods of relatively greater prosperity.
One might anticipate children of more educated parents would havea competitive advantage over other children, certainly in terms of educa-tional orientation and possibly in terms quality of home life. The evidenceis that this is the case for children in households where the head hasreceived higher education, meaning the negative effects of poverty on chil-dren are mediated on these two dimensions of wellbeing. However, lowerlevels of parental education do not appear sufficient to prevent the corro-sive effect of poverty on child wellbeing, and even a higher level educationfails to inoculate children against the increased risk of low self-esteem andof engaging in risky behaviour associated with living in poverty.
To conclude, poverty not only scars children in the long term, asdemonstrated by earlier research, it also has negative consequences forchildren in the immediate present. Moreover, the different dimensions ofpoverty affect children in varying ways. Furthermore, the impact of pover-ty on a child’s mental state is greater than the effect of low income alone,significantly lowering her/his sense of self-worth, as well as the otherdimensions of wellbeing, in a way that income does not (Table 6.3). All thispoints to the importance of relying on other policies as well as on cashbenefits to tackle the problem of child poverty and raises the possibilitythat anti-poverty policies might be better targeted on particular aspects ofpoverty in order to maximise their effect on child wellbeing.
Potential policy implications of the model
In Britain, the Government’s determined assault on poverty has employeda wide range of policy instruments. These have included a strong empha-sis on help for families, including lone parents in particular, through the taxcredit and benefit system and a range of measures to break the inter-gen-erational inheritance of poverty, ranging from investment in health andschools to the provision of early years education, investment in deprivedcommunities and parenting support. However, the central thrust of policyhas been to encourage workless parents into employment while payingsomewhat less attention to other aspects of a child’s environment. But,while child poverty has fallen, improvements have stubbornly been belowtarget and specific policies, such as the New Deal for Lone Parentsdesigned to encourage lone parents to take up employment, have some-
Poverty and childhood wellbeing 79

times failed to provide the secure, well-paid employment necessary to liftfamilies out of poverty.13
Moreover, the indicators the Government has chosen to use to tar-get policy and to measure its effectiveness (income and deprivation) haveproved problematic. Income measures show wide fluctuations over timewithin households while low income, as we have shown, does not alwayscorrelate very well with deprivation or with the other dimensions of pover-ty which the government has largely overlooked. While the multi-facetednature of poverty has been acknowledged, its cumulative character hashardly registered because of the use of a multiplicity of separate indica-tors.
In a context in which the Government seeks new policy instrumentsin order to renew its commitment to reduce or eradicate child poverty, theforegoing analysis points to the possibility that policies could, in principle,be targeted on different aspects of household poverty to the benefit of thecurrent generation of children. For example, the analysis suggests thatimproving the environment of children – both within and outside the house -hold – may well have a greater overall impact on wellbeing than improvingmaterial deprivation. Equally, if the goal is to enhance educational per-formance, then alleviating financial strain and encouraging civic participa-tion of parents may be important strategies since these appear to mediatethe effects of poverty on child wellbeing. On the other hand, the social iso-lation of the head of household, often taken as a measure of social capi-tal, seems to have little bearing on any of the four indicators of childwellbeing.
The methodology presented above can be further exploited toexplore the likely impact on child wellbeing of policy options that succeedin tackling the various dimensions of household poverty. By simulatingimprovements of the various dimensions of poverty, it is possible toassess the potential effect of successfully targeted policies on the childwellbeing scores generated for the Youth Panel. Tables 6.4 and 6.5 pres-ent the results of such simulations, showing the predicted consequencesfor child wellbeing of changing the different components of householdpoverty in the following manner:
• moving from a completely materially deprived to a fully-equippedhousehold;
• moving from a relatively frequent level of deprivation to no deprivation(frequent deprivation refers to a household that does not have: a PC,dishwasher, dryer, car, and cable/satellite TV, and that cannot afford
80 Coping with complexity
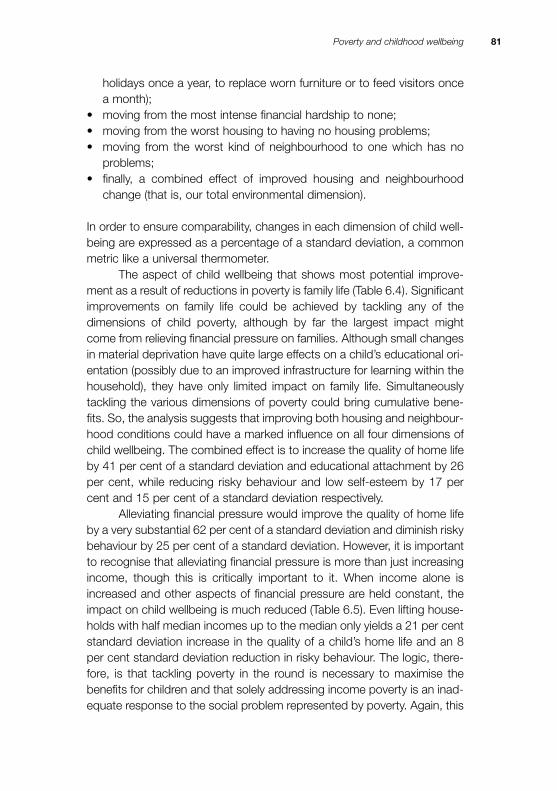
holidays once a year, to replace worn furniture or to feed visitors oncea month);
• moving from the most intense financial hardship to none;• moving from the worst housing to having no housing problems;• moving from the worst kind of neighbourhood to one which has no
problems;• finally, a combined effect of improved housing and neighbourhood
change (that is, our total environmental dimension).
In order to ensure comparability, changes in each dimension of child well-being are expressed as a percentage of a standard deviation, a commonmetric like a universal thermometer.
The aspect of child wellbeing that shows most potential improve-ment as a result of reductions in poverty is family life (Table 6.4). Significantimprovements on family life could be achieved by tackling any of thedimensions of child poverty, although by far the largest impact mightcome from relieving financial pressure on families. Although small changesin material deprivation have quite large effects on a child’s educational ori-entation (possibly due to an improved infrastructure for learning within thehousehold), they have only limited impact on family life. Simultaneouslytackling the various dimensions of poverty could bring cumulative bene-fits. So, the analysis suggests that improving both housing and neighbour -hood conditions could have a marked influence on all four dimensions ofchild wellbeing. The combined effect is to increase the quality of home lifeby 41 per cent of a standard deviation and educational attachment by 26per cent, while reducing risky behaviour and low self-esteem by 17 percent and 15 per cent of a standard deviation respectively.
Alleviating financial pressure would improve the quality of home lifeby a very substantial 62 per cent of a standard deviation and diminish riskybehaviour by 25 per cent of a standard deviation. However, it is importantto recognise that alleviating financial pressure is more than just increasingincome, though this is critically important to it. When income alone isincreased and other aspects of financial pressure are held constant, theimpact on child wellbeing is much reduced (Table 6.5). Even lifting house-holds with half median incomes up to the median only yields a 21 per centstandard deviation increase in the quality of a child’s home life and an 8per cent standard deviation reduction in risky behaviour. The logic, there-fore, is that tackling poverty in the round is necessary to maximise thebenefits for children and that solely addressing income poverty is an inad-equate response to the social problem represented by poverty. Again, this
Poverty and childhood wellbeing 81

Tabl
e 6.
4
Impact
of
vari
ous
house
hold
changes
on c
hild w
ellbein
g a
fter
contr
ollin
g f
or
gender
and a
ge (
num
bers
refe
r to
changes
in t
he %
of
a s
tandard
devi
ati
on)
Dim
ensi
on
Ful
l dep
riva
tion
Co
mm
on
Inte
nse
Bad
ho
usin
gB
ad
Tota
lto
no
d
epri
vatio
n fin
anci
al
to b
est
neig
hbo
urho
od
envi
ronm
enta
ld
epri
vatio
nto
no
p
ress
ure
to n
o
hous
ing
to b
est
effe
ctd
epri
vatio
nfin
anci
al p
ress
ure
neig
hbo
urho
od
Hom
e lif
e+
26%
+3%
+62
%+
23%
+18
%+
41%
Edu
catio
nal o
rient
atio
n+
15%
+8%
+39
%+
15%
+11
%+
26%
Low
sel
f-w
orth
–9%
–1%
–24%
–9%
–6%
–15%
Ris
ky b
ehav
iour
–8
%–1
%–2
5%–8
%–8
%–1
7%
Tabl
e 6.
5
Impact
of
house
hold
incom
e c
hanges
on c
hild w
ellbein
g a
fter
contr
ollin
g f
or
gender
and a
ge (
num
bers
refe
r to
change i
n t
he %
of
a s
tandard
devi
ati
on)
Dim
ensi
on
50%
med
ian
60%
med
ian
70%
med
ian
80%
med
ian
90%
med
ian
to m
edia
n in
com
eto
med
ian
inco
me
to m
edia
n in
com
eto
med
ian
inco
me
to m
edia
n In
com
e
Hom
e lif
e+
21%
+16
%+
11%
+8%
+3%
Edu
catio
nal o
rient
atio
n+
15%
+11
%+
9%+
4%+
2%
Low
sel
f-w
orth
–9%
–3%
–3%
0%0%
Ris
ky b
ehav
iour
–8
%–8
%–4
%–4
%0%
82 Coping with complexity

underlines the importance of using multi-dimensional poverty indicators inany serious analysis.
Finally, we can use a similar methodology to investigate the impactof changing employment status and household composition on child well-being: two matters at the heart of current debates about addressing childpoverty (Table 6.6) The analysis indicates that changing the status of a household head from employment to unemployment has substantialnegative effects on a child’s home life, risky behaviour and educational ori-entation – effects which, in the symmetrical world of cross-sectional mod -el ling, could be reversed by policies that successfully help unemployedpeople enter work. The implication, therefore, is that successful work activation programmes targeted at unemployed people could also havebeneficial effects for the children of those who successfully secureemploy ment.
However, the differential effects of changing status from employ-ment to unemployment or to non-employment suggest that the currentUK policy of extending the coverage of such schemes to the economical-ly inactive, including lone parents and disabled people, could have anoticeably more limited positive effect. Certainly, the impact of the differ-ence between employment and non-employment on home life andengagement in risky behaviour is much less than that associated with thedifference between employment and unemployment. On the other hand,policies targeted at the economically inactive might, if successful, addi-tionally contribute to a child’s sense of worth, something that the model-ling predicts is unlikely to happen when an unemployed person gets a job.This, in turn, could suggest that young people see job search as a mani-
Poverty and childhood wellbeing 83
Table 6.6
Impact of moving from various household states on child wellbeing
after controlling for gender and age (numbers refer to change in
the % of a standard deviation)
Loss of an Becoming a Household Householdadult from one-parent head moves head moves
the household household from employed from employed to unemployed to non-employed
Home life –1% –35% –62% –34%
Educational orientation +6% –11% –38% –31%
Low self-worth –2% +12% –1% +19%
Risky behaviour +3% +23% +38% +23%

festation of an adult’s positive work ethic (and not just employment) andgain emotional sustenance from it.
The modelling indicates that a reduction in the number of adults ina household has little effect on child wellbeing, but that the differencebetween a multiple adult and a lone-parent household is marked. Thelargest detrimental effect associated with a child living with a lone parentis on home life (reducing it by 35 per cent of a standard deviation), butthere are also associated increases in risky behaviour and, to a lesserextent, increases in low self-worth and decreases in educational orienta-tion in lone-parent households. This finding reflects the earlier observationthat household structure is important in mediating the impact of the vari-ous dimensions of poverty on child wellbeing. It also chimes well with thepolicy attention being given by the British Conservative opposition to waysof supporting the traditional two-parent nuclear family. Whether it wouldprove possible to reverse the demographic momentum towards cohabi-tation and lone parenthood is a moot point, although there is little evi-dence that the sustained attempts to do so in the United States haveproved very effective.14 Thought, nevertheless, needs to be given to poli-cies that would counteract the apparent negative consequences of grow-ing up in a lone-parent family. Our analysis suggests that strategies thatrely on increased income alone and ignore the role of other supports areunlikely to prove to be successful.
Conclusions
While not wishing to ignore the importance of research demonstrating thatpoverty can scar children for life, attention has been drawn to the com-plementary need to focus on the effects of poverty on children in the hereand now. The analysis shows that, other things being equal, children whoare poor are more likely than others to report having a difficult home life,to have negative attitudes towards school, to feel isolated and anxiousand to engage in anti-social and risky behaviour. Perhaps even moreimportantly, the research demonstrates that household poverty compris-es different dimensions and that each has different effects on the fouraspects of child wellbeing that have been captured with the data available.
For example, it seems clear that where adults are not succeedingwell in making ends meet, this has significant effects on all aspects of achild’s wellbeing. Moreover, the associated psychological problems that
84 Coping with complexity
many adults experience when poor independently impact on a child’smental wellbeing, their chance of engaging in risky behaviour and, per-haps not surprisingly, on their reports of the quality of their home life.Likewise, poor housing and unsatisfactory local environments exert theirtoll. It is clearly important, therefore, to recognise that poverty adds signif-icantly to pressures in children’s lives and directly diminishes the experi-ence of childhood. It also seems likely that differentiated policyinstruments will be required to ameliorate the impact of different dimen-sions of poverty on each element of child wellbeing.
Notes1 European Union, Child Poverty and Well-Being in the EU: current status and
way forward, European Commission, Directorate-General for Employment,
Social Affairs and Equal Opportunities, 2008; HM Treasury, Ending Child
Poverty: everybody’s business, HM Treasury, The Stationery Office, 2008;
Commission for Economic Opportunity, ‘Increasing Opportunity and Reducing
Poverty in New York City’, The New York City Commission for Economic
Opportunity Report to Mayor Michael R Bloomberg, 2006
2 J Rawls, A Theory of Justice, Harvard University Press, 1971
3 L Sutton, ‘A Child’s Eye View’, Poverty 126 (Winter), 2007, pp8-11; T Ridge,
Childhood Poverty and Social Exclusion, The Policy Press, 2002
4 J Hills and K Stewart (eds), A More Equal Society? New Labour, poverty,
inequality and exclusion, The Policy Press, 2005; Department for Work and
Pensions, Opportunity for All: indicators update 2007, Department for Work and
Pensions, 2007
5 S Cross and P Golding, ‘A Poor Press? Media reception of the Beveridge
lecture’, in R Walker (ed), Ending Child Poverty: popular welfare for the
21st Century, The Policy Press, 1999, pp121-38; D Cameron, ‘Together We
Can End Poverty’, Speech given in London on 28 April 2008, available at
www.youtube.com/watch?v=o1PDBynvnC4
6 HM Treasury, Ending Child Poverty: everybody’s business, HM Treasury, The
Stationery Office, 2008; Children’s Defense Fund, Child Poverty in America,
Children’s Defense Fund, 2007; E Such and R Walker, ‘Falling Behind?
Research on transmitted deprivation’, Benefits 10(3), 2002, pp185-92
7 A Lee and J Hills, New Cycles of Disadvantage? Report of a conference organ-
ised by CASE on behalf of ESRC for HM Treasury, CASE Report 1, Centre for
the Analysis of Social Exclusion, London School of Economics,1998
8 P Attree, ‘The Social Costs of Child Poverty: a systematic review of the qualita-
tive evidence’, Children and Society 20(1), 2006, pp54-66; S O’Neill, The Cost
of Education, End Child Poverty Network Cymru, 2006
Poverty and childhood wellbeing 85
9 S Fortier, ‘On Being a Poor Child in America: views of poverty from 7–12-year-
olds’, Journal of Children and Poverty 12(2), 2006, pp113-28; S Middleton, K
Ashworth and I Braithwaite, Small Fortunes: spending on children, childhood
poverty and parental sacrifice, Joseph Rowntree Foundation, 1997
10 S Bartlett, ‘No Place to Play: implications for the interaction of parents and chil-
dren’, Journal of Children and Poverty 3(1), 1997, pp37-48; R Barth, J Wildfire
and R Green, ‘Placement into Foster Care and the Interplay of Urbanicity, Child
Behavior Problems and Poverty’, American Journal of Orthopsychiatry 76(3),
2006, pp358-66; I Katz, J Corlyon, V La Placa and S Hunter, The Relationship
between Parenting and Poverty, Joseph Rowntree Foundation, 2007
11 G Horgan, The Impact of Poverty on Young Children’s Experience of School,
Joseph Rowntree Foundation, 2007; G Ansalone, ‘Schooling, Tracking and
Inequality’, Journal of Children and Poverty 7(1), 2001, pp33-47
12 See M Tomlinson, R Walker and G Williams, ‘The Relationship Between Poverty
and Child Well-being in Great Britain’, Barnett Papers in Social Research 3,
Department of Social Policy and Social Work, University of Oxford, 2008, for a
more detailed and technical discussion of the model.
13 A Yeo, Experience of Work and Job Retention Among Lone Parents: an evi-
dence review, DWP Working Paper 37, Corporate Document Services, 2007
14 P Birch, S Weed and J Olsen, ‘Assessing the Impact of Community Marriage
Policies on County Divorce Rates’, Family Relations 53(5), 2004, pp495-503; C
Trenholm, B Devaney, K Fortson, L Quay, J Wheeler and M Clark, Impacts of
Four Title V, Section 510 Abstinence Education Programs, Final Report, Mathe -
matica Policy Research, 2007
86 Coping with complexity

SevenMulti-dimensional povertyand policy
We began this book by acknowledging that poverty is thankfully now highon the political agenda. The importance attached to child poverty and theprogress made in tackling the poverty of families with children are undis-puted, although much more still needs to be done if Blair’s bold target toeradicate child poverty is to be achieved. Moreover, writing in a world thatis being buffeted by financial storms with rising unemployment and ahousing market in crisis, the future is very uncertain.1 Nevertheless, theGovernment appears to be still committed to meeting its targets. At the2008 Labour Party conference, Prime Minister Gordon Brown proclaimedthat child poverty ‘demeans Britain’ and reaffirmed his party's pledge tohalve child poverty by 2010, and ultimately to end it completely,2 despitethe fact that child poverty is now on the rise again.
The Conservatives – who before the so-called ‘credit crunch’ andthe ensuing crisis looked set to take power after the next general election– are also committed to tackling poverty. Notions of poverty, fairness andthe gap between rich and poor have now become part of the lexicon ofthe official opposition, although their emphasis in terms of solutions isoften slightly different. This is a far cry from the days of Thatcherism, whenpoverty was an unspoken word and so-called ‘genuine’ poverty had sup-posedly all but been eradicated. In 2006, Oliver Letwin committed theConservatives to upholding Labour’s targets on child poverty, but itremains to be seen whether this commitment will make its way into themanifesto at the next general election.3
Complexity
Poverty is still often measured in terms of a lack of income. This is not onlya form of simple shorthand for there is a strong underlying historical ration-ale as noted in Chapter 2. In the nineteenth century, the interest of social

reformers in measuring poverty was based on moral rather than scientificvalues in that they wanted to mobilise support for the cause by the mostdirect route possible. This goal demanded that they demonstrate thatpoverty was due to a person’s lack of resources rather than to recklessexpenditure, hence their focus was on establishing how much incomepoor people had in relation to the income required to attain a decent stan-dard of living.
However, to focus only on income poverty is to misunderstand thetrue multi-faceted nature of poverty and the complexity of poor people’slives. It can also lead to wrong conclusions about the incidence, causesand consequences of poverty as we have repeatedly demonstratedthroughout this book. Such misconceptions can, in turn, result in poorlytargeted and ineffectual policies. Even if income poverty is reduced withina household, this does not immediately lead to a cessation of the otherproblems associated with limited financial resources. It takes time after aprolonged period of low income to replace worn-out durables and recov-er from material deprivation, to overcome low self-esteem and improve theimmediate home environment. For a substantial period, the household isalso likely to remain vulnerable to repeated spells of financial hardship.
The complexity of poverty is an enduring problem for policy makers.The diversity of poverty experienced by different segments of the popula-tion makes simple solutions hard to find. We have sought to understandthe relative weight of different dimensions of poverty using statistical tech-niques that can cope with this complexity and by exploring detailed andcomprehensive longitudinal data. In this way, we have begun to be able toisolate those dimensions of poverty that are the most salient for the indi-viduals and families affected and to explore the interrelations betweenthese different aspects of poverty over quite a long period of time. Thesophisticated statistical techniques employed allow us to measure com-plex and inherently difficult to observe phenomena associated with beingpoor and help us to separate the wheat from the chaff in terms of what isrelevant and what is not. The same techniques could be used to assist inthe design and targeting of policy.
Our approach has enabled us to isolate various dimensions of theproblem: namely financial strain, material deprivation, social isolation, civicparticipation, the environment and the psychological strain associated withpoverty. Some of these dimensions are more tied up with each other thanothers. For example, not surprisingly, there was a strong associationbetween financial strain and material deprivation (but they still emerged asseparate dimensions in their own right). The approach also validated the
88 Coping with complexity

notion that there is an ordered pyramid of concepts of increasing impor-tance when seeking to measure and better understand poverty. Never -theless, many dimensions play a role in shaping the overall experience ofpoverty and the relative strength of these dimensions changes over time.
The summary measures of poverty that combine the various dimen-sions into a single index also have several advantages over other indica-tors in common use. It has previously proved nigh on impossible to devisemulti-dimensional measures that are stable over time and which therebyfacilitate accurate measurement of trends in the poverty rate. This is a fun-damental requirement if the effects of anti-poverty programmes are to beassessed. The poverty indices we devised overcome many of measure-ment problems of other approaches and do not suffer wide fluctuationsfrom one year to the next. Moreover, our approach is a significant advanceon the various methods used up to now which cannot adequately copewith the situation where a person might appear poor on one index and noton another. It is, though, limited by available data appertaining to the var-ious dimensions of poverty.
The substantive findings demonstrate that poverty, measured as amulti-dimensional concept, fell throughout the 1990s and early 2000swithout a marked turning point associated with the election of the NewLabour Government in 1997.4 This was true of both absolute and relativemeasures. The decline was mainly driven by falls in financial stress, butalso by reduced material deprivation particularly during the early 1990s, atime when unemployment, inflation and interest rates were falling andremained at historically low levels.
In terms of the relative importance of the dimensions under consid-eration, the models revealed the dominating importance of financial pres-sure brought about by the combination of financial stress (ie, difficulty incoping) and material deprivation. Nevertheless, poverty was also indexedand experienced as a manifestation of psychological strain (that changedlittle over the period) and reflected environmental factors such as badhousing and poor neighbourhoods. It was perhaps surprising that socialisolation and civic participation (both related in one way or another tosocial exclusion) have a much less marked impact on the multi-dimen-sional poverty measures. It also suggests that strategies that prioritise thebuilding of social capital may not, by themselves, achieve all that is some-times expected of them. That said, measures of both these dimensions ofpoverty could be significantly improved if different questions were addedto the British Household Panel Survey (to be integrated in the new UKHousehold Longitudinal Study, ‘Understanding Society’).
Multi-dimensional poverty and policy 89

The analysis presented in Chapter 3 confirmed the now widelyobserved finding that income is only weakly associated with other mani-festations of poverty5 and underlines the need to take a multi-dimension-al approach seriously in order to develop the tools necessary for theaccurate measurement of poverty and related phenomena. The pyramidof concepts proved to be a useful starting point when coupled with themore advanced statistical techniques becoming available.
Poverty dynamics, children and families
The long-term dynamics of poverty were analysed in detail in Chapter 4,again using a multi-dimensional approach. The groups most at long-termrisk of experiencing poverty proved to include the following groups: sin-gle people, lone parents, those who are not working, those working inlow-skilled and/or part-time jobs, fragmented households, women andminority ethnic groups. While employment certainly reduces poverty,lone-parent families in particular were found still to be prone to poverty,even if they managed to secure paid employment. Furthermore, two-par-ent families that split as a consequence of relationship breakdown weresimilarly at high risk of poverty affecting both partners in the relationship– although women proved to suffer more than men after other charac-teristics had been taken into consideration.
Other research has shown that poverty in childhood can have a pro-found effect on life chances and on social and economic outcomes inadulthood. Indeed, the current emphasis that the Government places onreducing child poverty is sometimes narrowly conceived in terms of afinancial logic that attempts to calculate the costs to future generations ofthe transmission of bad outcomes from one generation to the next. Atten -tion has been drawn in Chapters 5 and 6 to the complementary need tofocus on the effects of poverty on children and young people in the pres-ent. Taking the multi-dimensional analysis a stage further, we demonstrat-ed that children and young people, aged 11 to 15, who are poor are likelyto have an inferior quality of life, lower wellbeing, than their contempo-raries. We also showed how different dimensions of household povertyhave diverse impacts on various aspects of child wellbeing. As discussedlater in this chapter, these statistical relationships could be used to moreeffectively direct policy orientated at alleviating the impact of poverty onfamilies with children in the here and now.
90 Coping with complexity
In addition to the effects of low income on children in families, wedemonstrated the additional burdens imposed on them by the psycho-logical strain exhibited by parents under financial pressure, and by living inpoor housing and deprived neighbourhoods in particular. There was evenevidence that the psychological stress of parents can find expression inthe lower self-esteem reported by their children. It would seem clear,therefore, that the effects of child poverty that manifest themselves in laterlife could have their roots in dimensions of poverty that can be isolatedand therefore addressed in the present, thereby avoiding the long-term‘scarring’ attributable to poverty.
Policy
A wide array of policy tools has been deployed by the Labour Governmentsince 1997 in its fight against poverty and, latterly, child poverty. Manyhave been employed to tackle worklessness – households in which noone is employed – which is seen as a major cause of poverty. Welfare-to-work schemes, introduced under the banner of the ‘New Deal’, targetedan increasing number of groups ranging from young people, to peopleaged 25+, aged 50+, lone parents and disabled people. Jobcentre Pluscombined job centres, benefit agencies and employment services underone roof in an attempt to provide finely tuned programmes and assistancefor the unemployed. More recently, the employment and supportallowance has been introduced, lessening the distinction between dis-abled and other people of working age, while the Flexible New Deal, to beintroduced in 2009, seeks to consolidate the various welfare-to-workschemes and to increase further the role played by private sector organi-sations in the delivery of services. Increased employment-orientated con-ditionality and sanctions have been applied across a larger proportion ofthe working-age benefit recipient population.
Alongside welfare to work, there have been various initiatives ‘tomake work pay’ and, hence, to tackle financial disincentives thought todeter people on benefits from seeking employment, and also to addressin-work poverty. Foremost among them have been the introduction of aminimum wage, development of the tax credit system and repeatedreductions in income tax. These direct policies have been coupled withfar-reaching investments in health and education, as well as targetedinvestment for run-down communities and extra help for parents.
Multi-dimensional poverty and policy 91

Children’s services, such as Sure Start and the rolling out of free childcarefor very young children, were implemented as part of the NationalChildcare Strategy, with guaranteed school places provided for four-year-olds instead of the usual mandatory starting age of five. Such policieswere not only seen as better for children, but as also enabling mothers toenter, or re-enter, the labour market and gain access to training.
Adult poverty
These measures no doubt contributed to rising employment rates andfalling poverty, but recently, ahead of the global financial crisis, child pover-ty began to rise again and the interim child poverty reduction targets lookvery vulnerable against the prospect of increasing unemployment. More -over, as is evident from our analysis, poverty rates, measured as a multi-dimensional concept, were already falling before Labour came to power in1997, suggesting that the improvements were not solely due to new poli-cies. Furthermore, our evidence suggests that there are dangers in poli-cies that overemphasise employment as the principal antidote to poverty.While paid work is important, quality employment is even more important;not all kinds of work are sufficient to protect families and children fromlong-term poverty. Low-skilled employment may be of benefit only if itturns out to be stable and to provide a stepping stone to improved long-term pros pects, further advancement or training. Lone parents, in partic-ular, need decent jobs to lift them out of poverty and to hold them there.New research currently underway by the authors suggests that there is asignificant gain from skills-based training, both on and off the job, provid-ing long-term protection from poverty facilitated by improved career pros -pects. General training appears to have less of an impact unless it is tiedto an employer. Thus, a policy that would really help lone parents back towork would have to provide quite specific, rather than general, trainingand help with appropriate job placement – preferably with a family-friendlyemployer.6
Government is already responding to fears of rising unemploymentlinked to the prospect of global recession with measures to help meetmort gage costs and to provide rapid access to assistance with jobsearch. If job layoffs turn into a deluge of redundancies, the temptationmay be to increase conditionality so as to encourage jobseekers to take‘any job’, overlooking the above findings that only quality jobs offer sus-tained protection against poverty.
92 Coping with complexity
A deep recession might also result in the Government neglectingthe socio-demographic triggers that precipitate long or repeated spells ofpov erty. Foremost among them are separation and divorce, the effects ofwhich are not only dramatic in the immediate aftermath, but also in thelonger term. Indeed, the effect of separation on a couple (whether marriedor co-habiting) in terms of increasing risk of poverty was much greaterthan for any of the other triggers that we were able to investigate, includ-ing job loss. This was true of both men and women, although the impactwas worse for the latter. If any policy lessons are to be drawn from thisfinding beyond the potential importance of reconciliation services, it wouldbe the need for increased assistance to couples who have recently sepa-rated, especially when children are involved.
Part of the reason that women are so much more vulnerable topoverty than men following separation is their weak position in the labourmarket, given continuing wage discrimination and the existence of ‘glassceilings’ that limit progress and possibly lessen ambition. The analysisrevealed strong gender effects that left women more susceptible to pover-ty than men over long periods. Similarly, powerful effects were found forethnicity, despite less than perfect measurement, with non-whites of bothgenders being noticeably more at risk of poverty long term than their whitecounterparts. Although it is already widely appreciated by policy makersthat women and certain ethnic groups are particularly likely to be poor, thefact that they are more likely to remain poor, or at risk of poverty, for longperiods deserves more recognition that it has hitherto achieved. Thismight be especially so if the current economic downturn is sustained.
However, perhaps the most important policy lesson of all is thatpoverty is more complex than simple income measures suggest. Income,as noted above, is not that strongly related to other measures of povertyand increasing income alone will not eradicate poverty. Likewise, social iso-lation and civic participation make a statistically significant, though com -paratively limited, contribution to the overall poverty score, which mightsuggest a real distinction between poverty and social exclusion (althoughmeasurement issues make this more of a hypothesis than an assertionbased on evidence). What is clear, however, is that in the same way that itis increasingly recognised that a personalised, multi-faceted ser vice isrequired to assist jobseekers successfully into employment, so a similarapproach needs to be applied to poverty. Poverty is simultaneously onething and many and, as a consequence, likely to be susceptible only to aholistic policy response. This is consistent with the across-governmentdrive to eradicate poverty and, to the extent that poverty is viewed as part
Multi-dimensional poverty and policy 93

of the European concept of social inclusion, with the obligations on Britainunder the European Commission Lisbon Strategy to ‘mainstream’ socialinclusion – ie, to take it into account in all aspects of policy making.However, the real challenge is to ensure that such comprehensive, joined-up thinking reaches the fingertips of organisations where bureaucracy bothtouches and helps to shape the lives of poor people.
Child poverty
Adult poverty and changes in adult circumstances have been shown inChapter 6 to have immediate effects on the wellbeing of older children andyoung people that could well help to explain the negative long-term effectsof poverty on child outcomes. Moreover, it has been possible to simulatethe effects of tackling the various dimensions of household poverty onchild wellbeing with striking results. For example, it would appear that thequality of a child’s home life is particularly sensitive to almost all aspects ofpoverty and that, therefore, policies which succeed in reducing the finan-cial strain experienced by parents, lessen material deprivation, enhancethe quality of the local environment and increase civic participation mightsimultaneously improve the home life of children. A further implication isthat any increase in poverty associated with recession is also likely to haveimmediate effects on child wellbeing and, if poverty is lengthy, increasingvulnerability to disadvantage later in life.
The modelling that we presented in Chapter 6 suggested that allfour dimensions of the child’s wellbeing – relationships at home, educa-tional attachment, risky behaviour and self-esteem – were closely relatedto housing and neighbourhood conditions. It is at least possible, therefore,that regenerating poor neighbourhoods and improving housing couldhave a marked impact on children’s overall wellbeing, including education -al performance and reduced involvement in crime and anti-social behav-iour, goals that have not in the past been much associated with urbanregeneration policy. To the extent any growth in unemployment is sus-tained and geographically concentrated, it could deleteriously affect childwellbeing through environmental factors as well as via falls in householdincome.
While tackling environmental factors could protect and benefit chil-dren, the biggest single effect would seem to be achieved by alleviatingfinancial pressures on parents. However, it is again important to recognisethat alleviating financial pressure is not simply a matter of increasing
94 Coping with complexity

income. When income changes alone were factored into the statisticalmodels, the impact was somewhat diminished, which serves to empha-sise the advantages of multi-dimensional indicators and the limitations of one-track policies. The fundamental policy logic that flows from thesefindings is that tackling poverty along all its dimensions is necessary tomaximise the benefits for children. This poses significant challenges forpolicy makers, not least at a time of public expenditure constraint. It is nec-essary, therefore, not just to tackle poverty through the tax and benefitssystem, but also to adopt a much more systemic approach that simulta-neously addresses several complex and interrelated processes by whichdifferent aspects of poverty impact on the lives of children. Equally, therecould be unexpected benefits from such a co-ordinated response, as illus-trated by the possible beneficial effects of urban regeneration on childwellbeing.
The triggers that increase the likelihood of poverty among adultsperhaps, not surprisingly, generally also have negative effects on the well-being of children. It might be possible, therefore, to enhance child wellbe-ing by means of proactive strategies that help to prevent such events orto ameliorate their consequences. The modelling indicated that the unem-ployment of a parent had substantial negative effects on a child’s homelife, educational orientation and propensity to engage in risky behaviour.An important by-product of policies that help unemployed people enterwork might be to reverse these effects for children. Thus, successful workactivation programmes targeted on the unemployed might not only havebeneficial effects for adults but also for the children of those who suc-cessfully secure employment. However, at the risk of repetition, it will berecalled that our analysis also suggested that the important achievementis not work itself, not even well-paid work, but employment with prospectsthat lead to longer-term stability.
The modelling also lent qualified support to policies that assist people outside the labour market to find employment, lone parents receiv-ing income support and people receiving incapacity benefit (or employ-ment and support allowance). Again, the children of people making thetransition into employment are likely themselves to benefit throughenhanced wellbeing. However, the indirect impact on child wellbeing ofsuccessful welfare-to-work policies targeted at the economically inactiveare likely to be different from, and less than, those aimed at the unem-ployed. The modelling suggests that policies that assist the economicallyinactive may serve to enhance the self-esteem of participants’ children –possibly because employment is so highly valued socially – but are less
Multi-dimensional poverty and policy 95

likely than policies that tackle unemployment to affect the other dimen-sions of child wellbeing. Also, of course, it is difficult to say how far engag-ing lone parents in employment would, in reality, overcome the loss in childwellbeing associated with being brought up in a lone-parent family, rang-ing from a less satisfactory home life to lower self-esteem and an increasein risky behaviour. The American evidence is that it certainly helps,although some negative consequences have been reported for teenagechildren.7 What again is clear is that neither income nor employment islikely to be a sufficient mechanism on its own to eradicate poverty or toreduce significantly its detrimental impact on child wellbeing.
Instead, the policy logic that follows from the child-focussed analy-sis of Chapter 6 is the requirement for a well-rounded strategy that wouldattempt to counteract the many processes by which poverty affects childwellbeing. The analysis supports elements in the Government’s currentstrategy. It suggests, for example, that children may suffer less from theeffects of poverty if their parents are in work. However, this is only part ofthe story, for the type of work and the prospects associated with the workare more important than is usually recognised. Moreover, children inhouseholds where adults are experiencing financial stress suffer badly andemployment does not always succeed in lifting families clear of incomepoverty or in placing them on an even financial keel. In the case of the chil-dren of lone parents, the analysis builds a strong case for extra support,irrespective of whether the parent is employed or not.
The logic that underpins the kind of analysis begun in this book callsfor a more radical shift in policy thinking than might be immediately appar-ent from the preceding paragraph. It points to a redefinition in the natureof the policy problem. Rather than focusing on poverty because it scarschildren’s futures, it encourages us to recognise that poverty also blightschildhood. Moreover, because poverty is multi-dimensional and multi-faceted, it deleteriously affects childhood in multiple ways, ways that it isincreasingly possible to research and hence to respond to in policy terms.Even in a recession, existing policies to raise family incomes and promoteadult employment should be accompanied by a range of new policies,some of which might need to be explicitly child-focused. Address ing thedifferent dimensions of poverty is likely to have a range of beneficial effectson children. For example, our analysis suggests that implementing a morecomprehensive and coherent neighbourhood regeneration policy couldimprove all aspects of child wellbeing. Furthermore, if such a policy wereable to incorporate significant elements of local participation, this might bedoubly effective since the analysis found that civic participation by parents
96 Coping with complexity

had a surprisingly high impact on child wellbeing. The analysis also pointsto the need to explore ways in which the psychological strain of adults inpoor households can be alleviated – as this negatively affects the mentalwellbeing of the children, and undermines home life.
Of course, no research is definitive and we plan to exploit more fullythe longitudinal potential of the British Household Panel Survey by observ-ing the consequences of actual changes in family circumstances and tran-sitions on the wellbeing of children expressed within a multi-dimensionalframework. We need also to look more closely at the factors that protectsome children against the most pernicious consequences of poverty.Nevertheless, it is to be hoped that research such as that presentedabove, which focuses on the immediate effects of poverty, will furtherenthuse governments to continue to pursue the goal of eradicating childpoverty. The clear message is that the social gains from this strategy donot all lie in the future. Rather, the immediate benefit is that 3.9 million chil-dren in Britain could potentially enjoy a childhood freed from the familialstress, academic failure, anxiety and social isolation that so often accom-panies poverty.
Notes1 How the poverty threshold values will be affected by the current economic tur-
moil could actually help the government meet its targets. If the highest income
earners are disproportionately affected the thresholds could come down, thus
reducing relative poverty headcounts.
2 BBC news website at http://news.bbc.co.uk/1/hi/uk/7641734.stm (accessed
30 September 2008)
3 www.conservatives.com/News/Articles/2006/04/Letwin_Why_we_have_signed
_up_to_Labours_anti-poverty_target.aspx (accessed 30 September 2008)
4 Given the financial changes in recent times, it would be of great interest to be
able to replicate our measures on the latest waves of data, but they are not yet
available.
5 See for example, Calandrino, Low Income and Deprivation in British Families,
DWP Working Paper 10, 2003; S Ringen, ‘Direct and Indirect Measures of
Poverty’, Journal of Social Policy 17(3),1988, pp351-65
6 A Yeo, Experience of Work and Job Retention Among Lone Parents: an evi-
dence review, DWP Working Paper 37, Corporate Document Services, 2007
7 P Morris, L Gennetian and G Duncan, Effects of Welfare and Employment
Policies on Young Children: new findings on policy experiments conducted in
the early 1990s, MDRC, 2005
Multi-dimensional poverty and policy 97
AppendixCalculating relative povertyrates using the Poverty Index
The traditional way of calculating relative poverty is to use some fractionof median (or mean) income as the cut-off point and then count everyonebelow this as ‘poor’. With respect to the Poverty Index, there are problemswith this approach.
In order to measure adequately relative poverty headcounts, it is nec-essary to have a fixed baseline below which no one can fall. With incomemeasures this is straightforward as no one can have a negative income andso relative indicators based on a fraction of mean and median income thenmake sense. With the Poverty Index, there is no effective zero position, whichleads to a second problem in that, unlike when using income, negative val-ues for the Poverty Index are possible. Thus, calculating cut-offs based onthe mean and median is no longer valid over time (although threshold valuesof the Poverty Index are still possible to calculate absolute poverty figures).
Thus, the Poverty Index needs to be ‘normalised’ before relativepoverty headcounts can be calculated. The strategy adopted was to cal-culate a maximum value of the Poverty Index for the model PImax. This isthe highest score anyone can actually have (ie, with no income, no pos-sessions, maximum stress, no social contact, no civic participation, max-imum financial strain etc). The Poverty Index was then transformed into anormalised wellbeing index W:
W = (-PI) + PImax
This essentially reverses the distribution and sets a minimum at zero. Thiseffectively creates an index of wellbeing where a person who is as badlyoff as one can be will always have a score of zero (W=0). Everyone elsewill be measured relative to that hypothetical person. No one can have anegative score.
Relative poverty rates were then calculated based on median frac-tions of the mean of ‘the ‘wellbeing’ index W. Means and medians of Wgradually increase over time and the relative poverty rates slowly fall.

Model 1
Year Mean W Median W Headcount (%) based on median (W) x
.8 .85 .9
1991 4.36 4.45 13.5 19.2 27.5
1993 4.40 4.48 12.6 18.3 26.8
1995 4.46 4.55 11.6 17.4 26.3
1997 4.53 4.65 11.5 17.2 26.1
1999 4.55 4.66 10.9 16.7 25.0
2001 4.59 4.70 10.2 15.4 23.8
2003 4.63 4.73 9.7 14.8 23.0
Appendix 99