conversations of possibility with the canola … of possibility with the canola council of ......
TRANSCRIPT

Future Consumers “Keep it Coming”:
Conversations of Possibility with the
Canola Council of Canada
Vincent Amanor-Boadu, PhD
Department of Agricultural Economics
Kansas State University
Manhattan, KS 66506
Email: [email protected]
Keynote Address to the Canola Council of Canada
San Antonio, TX
Feb. 27, 2014
1
Introduction We are entering a very exciting world for agriculture and food over the next two
decades. Finally, we are getting a better understanding of how to leverage our
scientific knowledge about food production, processing, packaging and distribution to
match our knowledge about consumer behavior, consumer choice and preferences
and decision-making. We are figuring out how to match the objectives of the business
of agriculture and agri-food to the business of public policy to maximize the net benefits
for consumers and citizens – the common connection between public policymakers
and business – in an activity that often seems to have competing objectives.
Let me start by quoting the oft-overlook purpose of all production activities, no matter
how they are conducted, where they are conducted and who conducts them. As
long as the production activity is driven by an economic objective, i.e., to increase the
net benefit of the producer, then it is prudent to heed the admonition of Mr. Adam
Smith in his second, but most popular book, The Wealth of Nations (2005, p. 537-538):1
Consumption is the sole end and purpose of all production; and the interest of
the producer ought to be attended to, only so far as it may be necessary for
promoting that of the consumer. The maxim is so perfectly self-evident, that it
would be absurd to attempt to prove it.
Mr. Smith goes on to note that in our mercantile system – then as it is now – the
consumer’s interest is often sacrificed to the producer’s, making production, not
consumption, the ultimate end of our production activities. An assessment of our
policies in all industries, not only agriculture and agri-food, would provide overwhelming
evidence of this. Indeed, it is so prevalent in our public policies that we needed special
departments to oversee consumer protection. The United States Bureau of Consumer
Protection, for example, has a mandate to protect consumers against unfair, deceptive
or fraudulent practices. In Canada, the mandate of Office of Consumer Affairs --
based in Industry Canada – is the promotion and protection Canadian consumers.
When producers and their industries understand that consumption of their production is
the sole end and reason for their production activities, there would be no economically
rational reason to do anything but ensure consumers’ utter satisfaction and enjoyment
in the consumption of the products and services they produce.
Indeed, the need for these regulatory bodies may become obsolete with
improvements in product traceability through effective product passports and chains of
custody. Even when inputs going into the manufacture of products are co-mingled, as
1 Smith, A. An Inquiry into the Nature and Causes of the Wealth of Nations, The Electronic
Classics Series, Jim Manis, Editor. State Park, PA: The Pennsylvania State University, 2005.

2
is the case in most of agriculture (Amanor-Boadu and Starbird, 2005), the potential risks
associated with a stained reputation could be high enough to remove any economic
incentive to do anything underhanded to consumers.2 The services of the various
social media companies – Facebook, Twitter, Instagram, You Tube, Flicker, Google+,
etc. – allow consumers a rapid path to publish their experiences with products and their
suppliers. The online marketplaces, such as Amazon, Hotels.com, Yelp and EBay, offer
the perfect avenue for consumers to provide feedback and rate their experiences with
the products and suppliers. These ratings are used by future consumers to assess
supplier reliability – a powerful incentive for good behavior if it is assumed that the firm
intends to continue its business operations.
The future consumer is, thus, going to be more powerful in controlling producers’
behaviors. Therefore, we begin with a number of assumptions about the preparedness
of the Canola Council of Canada (CCC) for engaging the future consumer:
The CCC understands that the sole end and purpose of all the activities within its
supply chain – from genetics companies through growers and processors to
distributors and retailers – is consumption.
The CCC recognizes its strength is in positioning itself as an industry organization
that spans the whole supply chain, giving it the opportunity to create real value
through strategic collaborations.
The CCC is committed to its strategic objective to sustain its global leadership
position in the supply of raw and processed canola products to the world.
The foregoing implies that we begin with the end in mind, as advised by Dr. Stephen
Covey in his long-running New York Times bestseller, The 7 Habits of Highly Effective
People.3 CCC’s strategic plan suggests that we can jump the first habit suggested by
Dr. Covey, i.e., Be Proactive, because the very process of thinking and transforming our
thoughts onto paper and talking about them is an act of vulnerability and proactivity.
The spirit of interdependence is foundational to sustained competitiveness in the
agriculture and agri-food sector because no segment is effective in meeting the
consumer’s complex and evolving needs. That the CCC encompasses all of Canada’s
canola supply chain puts it in a position to help the industry’s stakeholder secure their
competitiveness. Finally, we start with the belief that creating sustained flexible
competitive advantage depends on increasing value creation.
2 Amanor-Boadu, V. and S.A. Starbird. “The Value of Anonymity,” Journal of Chain and
Network Science, 5(2005): 5-16. 3 Covey, S.R. The 7 Habits of Highly Effective People: Powerful Lessons in Personal Change.
New York, NY: Free Press, 1989.

3
It is understood giving the foregoing that only the consumer defines value. This means
we need to develop vital appreciation of (1) who this consumer is; and (2) what this
consumer values in her dealings with us through our products and services. Given the
foregoing, let us frame our conversations around three principal questions:
1. Who is the future consumer and what is she looking for?
2. What should we do to meet the needs of the future consumer given the choices
that confront her and the competition that poses for us?
3. How should we go about executing the “Keep it Coming” strategic plan to
increase our probability of achieving its specified goals?
The Future Consumer
Population Trends
By 2025, the end of the CCC’s current strategic plan, global population is projected to
reach 8.1 billion from the current 7.2 billion (UN, 2013).4 If we use a billion people as the
milestone indicator, Figure 1 shows the number of years it took to reach the different
milestones. For example, it took about 123 years for the world’s population to move
from 1 billion in 1804 to 2 billion in 1927. Reaching the 3 billion mark only took 33 years
and 14 years to reach 4 billion people. World population reached 6 billion in 1999, only
12 years after it reach five billion. The halving of the time to reach these billion people
milestones motivated Heinz von Foerster to employ the power law to suggest, albeit
facetiously, that the world population would become infinitely large by his 115th
birthday on November 13, 2026.5 We bottomed out at seven billion in 2012 and the
population growth rate is projected to commence a decline, moving from seven to
eight billion in 16 years and reaching the ninth billion in nearly two decades.
Only two regions are projected to see an increase in their share of global population
between 2010 and 2050. The population growth in Africa between those two periods is
about 744 million people, a 73% increase, will lead to increasing Africa’s share of global
population from 15% to 20%. Latin America and the Caribbean’s share will increase
from 8% to 9% with a 39% increase in their 2010 population, equivalent to 229 million
people. Asia’s share is projected to decline from 61% to 59%. However, its total
population is projected to grow by more than 1 billion over the period, equivalent 24%
of its 2010 population. North America’s population will increase by a mere 41 million
4 Available at http://www.un.org/en/development/desa/population. 5 Heinz von Foerster, P. M. Mora and L. W. Amiot (November 1960). "Doomsday: Friday, 13
November, A.D. 2026. At this date human population will approach infinity if it grows as it
has grown in the last two millennia". Science, 132 (3436): 1291–1295.

4
people, about 12% of its 2010 population, causing its share of global population in that
period to decrease from 5% to 4%. Finally, Europe’s share of global population is
projected to decline from 10% to 7%, equivalent to a decline of 104 million people or
14% of its 2010 population. The foregoing shows the shifts in the physical market,
defined as the number of people who can potentially consume products that are
produced by local and international producers and manufacturers. It allows producers
to focus on where the markets are going to be so they can position themselves to
create the highest value experiences for their consumers.
FIGURE 1: YEARS BETWEEN 1 BILLION POPULATION INTERVALS (1804-2050)
It is projected that global average life expectancy at birth increased from 48 years
in1955 to 65 years in 1995 and it is expected to reach 73 by 2025. The World Health
Organization projects that no country will have a life expectancy of less than 50 years
by 2025 despite more than 50 million people living in countries where the life
expectancy is less than 45 years. The good news is that more than 5 billion people in
120 countries already have life expectancy of more than 60 years. By 2025, life
expectancy in Europe will be close to 80 years and in the mid-80s in North America.
Africa, although the lowest by 2025, will still have a life expectancy higher than 60 years.
Thus, not only are the numbers of people in countries changing but the age distribution
of the people in these countries are also going to undergo significant changes as they
live longer. The increasing life expectancy means that the number of young people in
the world would increase significantly even as older people’s numbers increase.
1804
1927
1960
1974 1987 1999 2012 2027 2046
0
20
40
60
80
100
120
140
1.00 2.00 3.00 4.00 5.00 6.00 7.00 8.00 9.00
Ye
ar
Inte
rva
l

5
Overall, it is projected that 3.6 billion people will be below 30 years by 2020. India is
projected to have 726 million people below 30 years compared to China’s 456 million.
On the contrary, by 2027, the EU-35 region will have 50% more people over 65 than
children under 15 years. The economics of these demographic changes promise to be
interesting and present significant opportunities for all segments of the agriculture and
agri-food sector.
Why do we believe these numbers? Rapid enhancements in nutrition and food.
Despite the rising health care costs everywhere, health care services are becoming
increasingly available and accessible to an increasing majority of the world’s
population. The result has been a rapid decline in childhood mortality and the
observed improvement and projected numbers regarding life expectancy. New
vaccines and prophylactics have reduced the threat of infectious diseases, such as
cholera and small pox, in many places around the globe. The World Health
Organization is projecting that non-communicable diseases (NCD) – cancer, chronic
respiratory diseases, cardiovascular disease, and diabetes – will become the leading
sources of health care problems everywhere, including developing countries.6 Current
infectious diseases that are proving challenging, HIV/AIDS and malaria, for example,
are expected to be brought under control in the next decade or so. For example,
clinical trials of a malaria vaccine developed by GlaxoSmithKline conducted in seven
African countries has shown some level of effectiveness in children over an 18-month
period.7 Numerous ongoing research in various places around the world, including the
U.S. and South Africa, are pointing to the possibility of developing an effective vaccine
to deal with HIV.8 These activities and the progress being made are the result of the
dedication and commitment of many medical and pharmaceutical scientists, public
health professionals and numerous volunteers in developed and developing countries
as well as private foundations, businesses and governments believed these
achievements were possible in the first place.9 According to the WHO, 40% of all
6 World Health Organization. NCD Alliance Briefing Paper, 2012. Available at
http://ncdalliance.org/sites/default/files/NCD%20Alliance%20-%20NCDs%20and%20Sustai
nable%20Development%20Brief_0.pdf. 7 New York Times Editorial Board. Hope for a Malaria Vaccine, New York Times, Oct. 13,
2013. Available at http://www.nytimes.com/2013/10/14/opinion/hope-for-a-malaria-
vaccine.html?_r=0. 8 See National Institute of Allergy and Infectious Diseases (NIAID) for a listing of current and
past work in this area. Website:
http://www.niaid.nih.gov/topics/hivaids/research/vaccines/Pages/default.aspx. 9 The continuing funding and promotional efforts of organizations such as Bill and Melinda
Gates Foundation (http://www.gatesfoundation.org/) and the International AIDS
Vaccine Initiative (http://iavi.org) are recognized as critical in making this transformation
of global health a reality.

6
deaths in 1955 were among children under 5 years old and 21% among those over 65
years. By 2025, they project that only 8% of all deaths will be among children under 5
years while 63% will be those over 65 years.
Improved knowledge about those at risks and the factors that contribute to health,
nutrition and food security risks provide better policy instruments for dealing with these
risks. However, what is remarkable is how knowledge and technology have contributed
to improved food production in many places and caused hunger and food security
risks to decline. FAO data shows that the average daily per capita caloric availability
for Africa in 2009 was 2,560 Kcal/day compared to was 2,263 Kcal/day twenty years
earlier in 1989, a 13.1% improvement.10 The same is true in Asia, where the average
daily per capita caloric availability in 1989 was 2,449 Kcal/day and 2,706 Kcal/day in
2009. Figure 2 shows the improvements in gross per capita production of food
measured in International dollars for Africa, Asia and the world between 1990 and 2012,
using FAO data and setting 2004-2006 = 100. The figure shows that while Asia’s gross per
capita production of food has been growing at an average annual rate of 2.1%
between 1990 and 2012, Africa’s has been at 0.8% and the average for the whole
world has been about 1.0%.
Over the past three decades, we have seen many countries open their borders to both
regional and global trade. Many more countries have joined the World Trade
Organization even as many have formed their own preferential trade arrangements. In
Africa, the West Africa Economic Community and the Common Market for East and
Southern Africa provide preferential trade treatment to their respective members while
Association of South East Asian Nations does the same thing for member countries in the
Southeast Asian region. These efforts are not different from the North American Free
Trade Agreement (NAFTA), which has just celebrated its 20th anniversary.11 This
increasing openness to trade contributed to a 6.1% average annual growth in total
global agricultural merchandise trade 1990 and 2012, from about U.S.$858 billion to
U.S.$3.4 billion (in current prices) (Figure 3). Thus, between 1990 and 2012, total
agricultural merchandise trade nearly quadrupled.
10 It is important to recognize that availability does not equal accessibility because of
infrastructural gaps along the agriculture and agri-food supply chain in these regions. 11 Amanor-Boadu, V. and F. Nti. “NAFTA at 20: How Has Agriculture and Food Performed?”
Discussion Paper, Department of Agricultural Economics, Kansas State University, Feb.
2014.

7
FIGURE 2: GROSS PER CAPITA PRODUCTION INDEX (2004-2006=100) IN INTERNATIONAL DOLLARS
Source: FAOStat (http://faostat3.fao.org/faostat-gateway/go/to/download/Q/QI/E).
FIGURE 3: TOTAL GLOBAL AGRICULTURAL MERCHANDISE TRADE (CURRENT US$ BILLION)
Source: WTO (http://stat.wto.org/StatisticalProgram/WsdbExport.aspx?Language=E)
60
70
80
90
100
110
120G
ross
Pe
r C
ap
ita
Pro
du
ctio
n In
de
x
Africa Asia World
$0
$500
$1,000
$1,500
$2,000
$2,500
$3,000
$3,500
$4,000
$ B
illio
n
Imports Exports

8
Economic Trends
There have been conversations among numerous people about the population growth
rate and its potential implications for meeting food needs. Let us start with a couple of
points about people and agriculture and food markets. First, people make potential
markets. For those of us in markets that have inherent elastic demand structures, higher
populations are always better than smaller ones. Therefore, while some might see the
population trend pictures presented as a challenge we need to avoid in some form or
another, it is imperative for stakeholders in the food and agribusiness sector to see them
as an opportunity they need to embrace. Some of these people will not be persuaded
by the production and trade trends, arguing that they are unsustainable with increasing
populations. However, for those of us who make our living feeding these people, we
can only see these as a challenge demanding from us extreme creativity in the use of
our limited resources and talent.
Let me contextualize and preface my position about population and markets because
it is easy to misplace the rationale. There once was a British preacher, Rev. Thomas
Robert Malthus was his name, who projected that the world will be unable to feed itself
because its population was growing at a geometric rate and its food production at an
arithmetic rate. He advocated two approaches to population control: one he termed
positive checks and the other he called preventative checks. His positive checks
included raising the death rate while his preventative checks included strategies aimed
at reducing the birth rate. To raise the death rate, the good Reverend proposed
hunger, disease and war. His preventative checks, on the other hand, included
abortion, birth control, postponement of marriage and celibacy. The Reverend
Malthus, arguing in 1798, suggested focusing on reducing the population of the poor as
a primary target. I want to believe this man of God was only being provocative in his
prescriptions but I am sure he will find some interesting followers were he alive today.
One thing that I am sure blinded Reverend Malthus from seeing people as an
economic resource instead of the scourge was his ambivalence about international
trade. He was indeed the only economist of note in his time to support Britain’s Corn
Laws, which prohibited the importation of corn into Great Britain after the Napoleonic
Wars in 1815. The result of these laws, interestingly, was rioting in London and the
consequent Peterloo Massacre in Manchester in 1819.12 The lesson from Reverend
Malthus’ erroneous summations: Correlation is not causation and free trade is good.
12 High food prices are often cited as the reason for the Peterloo Massacre. However, the
August 16, 1819 events were initiated by an agitation by the Manchester Patriotic Union
for parliamentary reform and poor judgment by local authorities to disperse crowds using
sabre-drawn cavalry.

9
I had noted earlier that people define potential markets. People with disposable
incomes make actual markets. The good news is that despite all the bad stories
engendered by the Great Recession of 2008, incomes are actually rising for most
people. For example, Figure 4 shows that the average and median total incomes of
Canadians, measured in 2011 constant dollars shows a steady increase between 1990
and 2011. Rough estimates show that both average and median incomes in Canada
were growing at about 1.3% per annum over that period.
FIGURE 4: DISTRIBUTION OF TOTAL ANNUAL INDIVIDUAL INCOMES IN CANADA (2011 CONSTANT
DOLLARS)
Source: Statistics Canada. Table 202-0402. Available at www5.statcan.gc.ca.
The part of the conversations about incomes that is often lost is the fact that disparity
between the very rich and the very poor has been increasing virtually everywhere. It is
important to remember that increasing disparity does not necessarily imply one group’s
income is increasing and another’s is decreasing. Often, it means one group’s income
is increasing much more rapidly than the other’s. For those who care about income
disparities, the Gini coefficient is the common metric used. The Gini coefficient is a
measure between 0 and 1 that determines the extent of inequality between the top
and bottom 20% of a country’s population. A coefficient of 0 corresponds to perfect
equality and 1 is equivalent to perfect inequality. Using World Bank data, the Gini
coefficient in 2011 for Belarus is 0.265, Ethiopia 0.336, Indonesia 0.381 and Rwanda
0.508. Thus, measured by their inequality, Belarus is “better” than Indonesia or Poland at
0.327 in 2011.
$20,000
$22,000
$24,000
$26,000
$28,000
$30,000
$32,000
$34,000
$36,000
$38,000
$40,000
Inc
om
e in
Cd
n $
Average Income Median Income

10
Without coming off as uncaring about income disparities, it is important for us to focus
our attention of the economic rationale of our activities. As participants in the
agriculture and food sector, our primary rationale is to meet consumer needs, however
they are defined. We want to supply them the highest value products given their
incomes and their willingness and ability to reward us with cash and loyalty. This means
that we develop products and solutions that fit the incomes of our target customers.
For, as long as we are able to provide products and services that our customers,
regardless of their incomes, find valuable, we can be confident that we will be playing
in the market we have chosen to play in.
The future consumer we choose to serve is, thus, heterogeneous across the different
continents and the different countries on the same continent. This future consumer is
heterogeneous even within countries because of significant disparities in incomes and
others socio-economic characteristics as well as revealed preferences for different
products and services. We need to bear this fundamental caveat in mind as we
continue talking about the economics of the future consumer.
Focusing on Middle Class Consumers
Using World Bank’s forecast and other estimates, the GDP growth rate in advanced
economies between 2000 and 2017 averaged 1.9% and it is expected to hover
between 2% and 3% for the next decade or so. The average over the same period for
Asia and Sub-Saharan Africa was 7.8% and 5.5% respectively. Granted that
percentages can be dangerous metrics because of they do not provide any
information about their reference points, yet, this is where market segmentation based
on the heterogeneity of the future consumer in these places become important.
Ernst and Young (2013) projects be a significant shift in the distribution of the world’s
middle class population by 2030 (Figure 5). About 1.85 billion people globally were in
the middle class in 2009 and Ernst and Young projects that there will be 3.25 billion in
2020, and increase of more than 76% in 11 years. By 2030, the global middle class
population is projected to exceed 4.88 billion. Of the middle class population in 2009,
18% were in North America (NA), 36% in Europe, 28% in Asia-Pacific Region (AP), 10% in
Central and South America (C&SA), 6% in Middle East and North Africa (MENA) and 2%
in Sub-Saharan Africa (SSA). The data show that by 2030, the Asia-Pacific Region will
account for 66% of the world’s middle class population and North America’s and
Europe’s shares would shrink to only 7% and 14% respectively. Thus, the Asia-Pacific
Region, with a much larger share of the global population in 2030, would have a lot
more people with significant disposable incomes than the much richer countries of
North America and Europe. We cannot afford to overlook this significant shifter in food
11
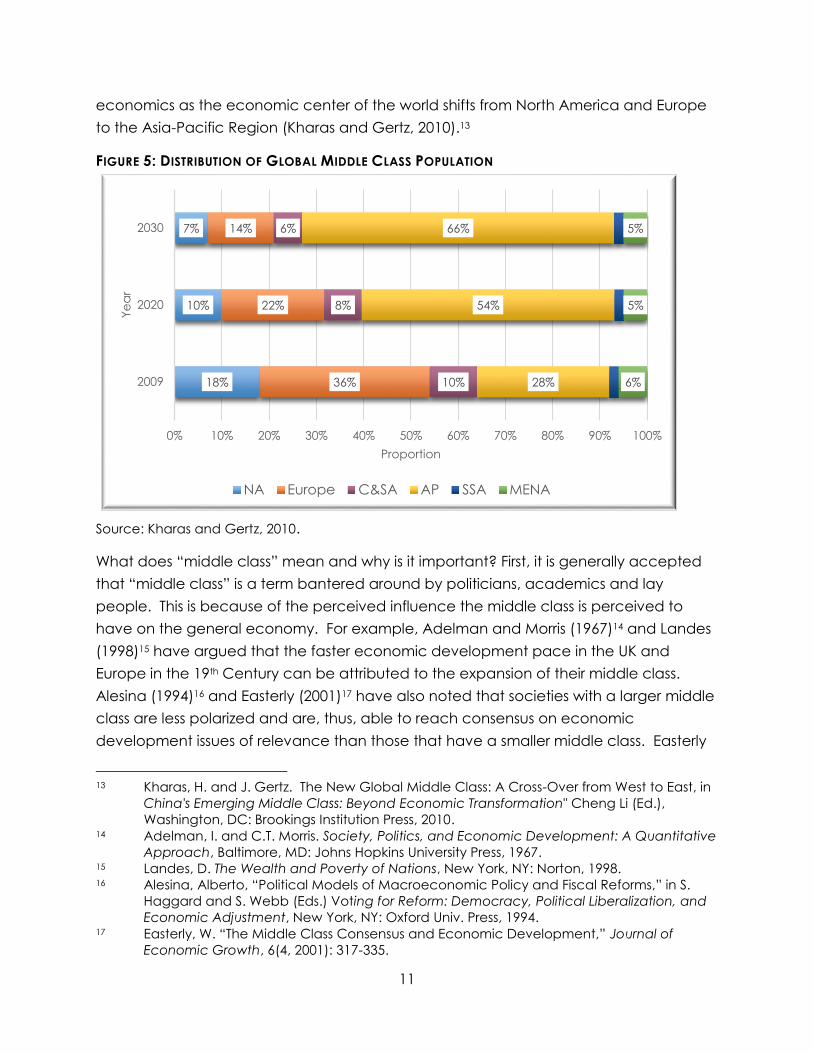
economics as the economic center of the world shifts from North America and Europe
to the Asia-Pacific Region (Kharas and Gertz, 2010).13
FIGURE 5: DISTRIBUTION OF GLOBAL MIDDLE CLASS POPULATION
Source: Kharas and Gertz, 2010.
What does “middle class” mean and why is it important? First, it is generally accepted
that “middle class” is a term bantered around by politicians, academics and lay
people. This is because of the perceived influence the middle class is perceived to
have on the general economy. For example, Adelman and Morris (1967)14 and Landes
(1998)15 have argued that the faster economic development pace in the UK and
Europe in the 19th Century can be attributed to the expansion of their middle class.
Alesina (1994)16 and Easterly (2001)17 have also noted that societies with a larger middle
class are less polarized and are, thus, able to reach consensus on economic
development issues of relevance than those that have a smaller middle class. Easterly
13 Kharas, H. and J. Gertz. The New Global Middle Class: A Cross-Over from West to East, in
China's Emerging Middle Class: Beyond Economic Transformation" Cheng Li (Ed.),
Washington, DC: Brookings Institution Press, 2010. 14 Adelman, I. and C.T. Morris. Society, Politics, and Economic Development: A Quantitative
Approach, Baltimore, MD: Johns Hopkins University Press, 1967. 15 Landes, D. The Wealth and Poverty of Nations, New York, NY: Norton, 1998. 16 Alesina, Alberto, “Political Models of Macroeconomic Policy and Fiscal Reforms,” in S.
Haggard and S. Webb (Eds.) Voting for Reform: Democracy, Political Liberalization, and
Economic Adjustment, New York, NY: Oxford Univ. Press, 1994. 17 Easterly, W. “The Middle Class Consensus and Economic Development,” Journal of
Economic Growth, 6(4, 2001): 317-335.
18%
10%
7%
36%
22%
14%
10%
8%
6%
28%
54%
66%
6%
5%
5%
0% 10% 20% 30% 40% 50% 60% 70% 80% 90% 100%
2009
2020
2030
Proportion
Ye
ar
NA Europe C&SA AP SSA MENA

12
contends that this “middle class consensus” allows people to agree on the provision of
public goods, such as physical infrastructure – roads, electricity, water, etc. – and
human capital – education and health – which are necessary for their national
economic development. Easterly’s empirical analysis involving 175 countries shows that
countries with a smaller middle class tend to underinvest in public goods, are less
democratic and poor macroeconomic policies. It is for these reasons (and more) that
the middle class is important in discourses about poverty alleviation and the
competitiveness of both private and public organizations going forward into the future.
They also explain why politicians and almost everybody banters the term around.
Who is in the middle class is not as simple a question to answer why the middle class is
important. In general, the middle class is seen as the group of consumers who are not
counted among the richest and poorest 20% of the population. Yet, this is immediately
problematic, especially for cross-country comparisons because the top and bottom
20% of any population by income could be very different. To this end, income and/or
expenditure brackets have been employed to define the middle class. The World Bank,
for example, defines the middle class as those with disposable incomes of between
U.S.$2 and U.S.$13 per day. The African Development Bank (AfDB) (2011) and the Asian
Development Bank (ADB) (2008) both used a daily per capita disposable income range
of U.S.$2-U.S.$20. Based on these measures, the AfDB claimed more than a third of
Africans were in the middle class in 2011 while the ADB placed 56% of Asia’s 3.4 billion
people in the middle class. Both the AfDB and the ADB note that a larger proportion of
the people in their middle class are at the bottom (i.e., U.S.$4 or less), making them
vulnerable to slipping back below the U.S.$2 line.
For our purposes in this paper, the most appealing and useful definition of “middle
class” comes from Kharas (2010), noting that “as an economic driver, the “middle class”
may be termed the ‘consumer class’ . . . [with] income elasticity for consumer durables
and services that is greater than unity.” This definition implies that an individual is
deemed to be in the middle class when a percentage increase in that individual’s
income results in more than a percentage increase in the consumption of consumer
durables and services. In essence, for this group, an increase in incomes do not go
towards food consumption or food security, because they already have attained that,
but instead towards durables.
Kharas uses a wider range of a daily per capita disposable income than either the
World Bank or the two development banks referenced above. He uses a lower bound
of U.S. $10 per capita daily disposable income and an upper bound of U.S.$100 to
define the global middle class. He argues that his lower bound is a reference to the
average poverty line in Italy and Portugal while the upper line reflects twice the median

13
income of Luxemburg. This definition would exclude most people who would be
counted in the middle class using the World Bank’s definition of poverty. Kharas
estimated the global middle class spending in 2009, 2020 and 2030 using 2005
Purchasing Power Parity (PPP) dollars (Figure 6). The figure shows the shifts in the
proportion of middle class spending across regions and time.
FIGURE 6: DISTRIBUTION OF GLOBAL MIDDLE CLASS SPENDING (USING 2005 PPP)
Source: Kharas, 2010
Figure 6 shows while North America (NA) and Asia-Pacific (AP) accounted for 26% and
23% of middle class spending in 2009, their respective shares by 2030 are respectively
10% and 59%. The shift in AP’s middle class expenditure shift is, thus, not as large as its
population shift (Figure 5) but NA’s expenditure shift is larger than its population shift.
Yet, the shifts are significant enough to cause the centers of global spending to shift
from North American and Europe to the Asia-Pacific Region by 2030. Specifically, both
China and India are expected to expand their shares of middle class spending
significantly. India’s expansion is projected to be much higher than China’s by 2050.
Let us zero in on India as a case example.
Only about 25% of India’s 1.2 billion people in 2013 are in the “middle class,” using the
Asian Development Bank’s definition. Despite what seems like many people, Mustafi
observes the proportion of people in India’s middle class is smaller than China’s,
26%
17%
10%
38%
29%
20%
23%
42%
59%
0% 10% 20% 30% 40% 50% 60% 70% 80% 90% 100%
2009
2020
2030
Proportion
Ye
ar
NA Europe C&SA AP SSA MENA

14
Bhuttan’s and even Pakistan’s.18 However, McKinsey Global Institute (2007) projections
suggest that India’s middle class households will increase nearly four-fold between 2005
and 2025 and their disposable incomes would increase about seven times.19 Their
aggregate consumption is projected by the same study to increase 12 times between
2005 and 2025. Stakeholders in the agriculture and agri-food sector are going to see
these expansions in their potential market over the next decade or so. Their
responsibility to their stakeholders and themselves is a simple one: Develop an effective
strategy that allows these customers to perceive significant value in the products and
services that the sector presents.
The Future Consumer’s Needs We have already noted that the future consumer is heterogeneous in her needs. We
have also noted that regardless of the income group into which they fall, they can still
provide a credible market for the agriculture and agri-food sector. However, as
incomes increase, consumers in all income groups are going to change what they eat.
Regmi and his colleagues (2001) provide further evidence that food budget share and
income elasticity of food decline with increases in income.20 That means that low
income consumers spend a larger proportion of their income on food and are, thus,
more responsive to income and price shifts than middle and higher income consumers.
They also point out that the composition of food consumed moves from low value to
high value as incomes increase. Using data from 32 low income countries and 26 high
income countries, they show that the proportion of income allocated to cereals by low
income consumers averaged about 28% compared to 16% for higher income
consumers. Allocation to meat and dairy products were respectively 18% and 9% for
lower income consumers and 25% and 14% for higher income consumers. Thus, animal
products accounted for nearly 40% of the food budget of higher income consumers
compared to 27% for lower income consumers.
What this and other studies tell us is that, all things remaining equal, the projections of
increasing incomes and the migration into the middle class everywhere is going to
18 Mustaf, S.M. India’s Middle Class: Growth Engine or Loose Wheel? India Ink – Notes on
the World’s Largest Democracy (New York Times Blogs).May 13, 2013. Available at
http://india.blogs.nytimes.com/2013/05/13/indias-middle-class-growth-engine-or-loose-
wheel/. 19 McKinsey Global Institute. The “Bird of Gold: The rise of India’s Consumer Market,” San
Fransico, CA: McKinsey & Company, May 2007. 20 Regmi, A., M.S. Deepak, James L. Seale Jr., Jason Bernstein. Cross-Country Analysis of
Food Consumption Patterns, in Changing Structure of Global Food consumption and
Trade, Regmi, A. (Ed.), Washington, DC: U.S. Department of Agriculture/Economic
Research Service, 2001, pp. 14-22

15
increase the demand for animal products. Thus, there is going to an increasing need to
produce more meat, milk and eggs for direct consumption or as ingredients for the
manufacture of higher value products. FAO data show that per capita meat
consumption is projected to increase by 24.5% globally between 1997-99 and 2030.
However, for developing countries, the projected increase is 43.9% while East Asia and
South Asia increases are projected at 55.2% and 120.8% respectively. Sub-Saharan
Africa’s (excluding South Africa) meat consumption is projected to increase by 42.6% in
the same period (Figure 7).
FIGURE 7: PER CAPITA MEAT CONSUMPTION BY REGIONS (1997-1999 & 2030)
Projected higher meat and animal products’ consumption foretells a surge in feed,
feed ingredients and feed grain demand. It is, however, important to recognize that
the heterogeneous marketplace is going to demand different meat and animal
products, which will require different production practices. We are already familiar with
meat products that are organic, free-range, non-antibiotics, etc. Provenance and
production practices are going to be demanded by a segment of the market that is
willing and capable of paying for specific products. The increasing recognition of
specific nutrients and minerals to health would cause certain segments of the market to
demand products that exhibit these characteristics.
Let us use two essential fatty acids – omega-3 and omega-6 – as examples of how the
demand for better health through nutrition is going to alter the food market and create
increased opportunities for segmentation and value creation. The crucial role of
0
10
20
30
40
50
60
70
World Developing
countries
Sub-Saharan
Africaa
East Asia South Asia
Pe
r C
ap
ita
Co
nsu
mp
tio
n (
Kg
/Ye
ar)
1997-1999 2030

16
omega-3 and omega-6 essential fatty acids in promoting health is becoming
increasingly recognized and consumers are demanding food products exhibiting high
levels of these essential fatty acids. They have been shown to play a crucial role in
brain function and are reputed to ease nerve pain in some arthritic conditions
(University of Maryland Medical Center).21 Given the fact that life expectancy is
projected to increase, it is expected that an aging population will look for help to aid
brain function and alleviate nerve and other pains.
Simopoulos (2002) showed that the best outcome from omega-3 and omega-6 fatty
acids is obtained when the omega-6/omega-3 ratio is unity.22 Current western diets,
the author argues, have ratios that are as high as 15:1 and 16.7:1, suggesting that these
diets are deficient in omega-3 fatty acids but excessive levels of omega-6. The
research shows that excessive omega-6 has pathogenesis promotion effects for many
diseases, including cardiovascular diseases, cancer, and inflammatory and
autoimmune diseases. Simopoulos’ research showed that omega-6/omega-3 ratio of
2.5:1 reduced rectal cell proliferation in patients with colorectal cancer while 2-3:1 ratio
reduced inflammation in rheumatoid arthritis patients.
If we agree with Adam Smith that consumption is the sole purpose of all production,
then it is imperative that we use the information about the future consumer’s needs to
supply food products that address her health concerns and her demands for “natural”
solutions. This is where the CCC can leverage its cross-industry relationships to position
itself not only as a food and feed supplier but also as a major player in the natural
health marketplace. The natural health market comprises consumers who want to
enhance their health status by carefully managing their food consumption.
Let us look at what I call the Canola Advantage. Over the past several years, Rachel
Ray has emerged as an important authority on food in the United States and around
the world. Ms. Ray got her break when, as a buyer for the Albany-based gourmet foods
supplier, Cowan & Lobel, she discovered that people who did not want to cook. This
led her to develop a concept for 30-minute meals classes, where she showed people
how to cook meals in less than 30 minutes. She got a weekly segment on the local CBS
TV station (WRGB), started doing radio appearances, and finally got a show on the
Food Network in 2001.
Why is Rachel Ray important in our conversations about the future consumer and
canola? Simple: She coined the term E-V-O-O – extra virgin olive oil, which catapulted
21 http://umm.edu/health/medical/altmed/supplement/omega6-fatty-acids. 22 Simopoulos, A.P. “The importance of the ratio of omega-6/omega-3 essential fatty
acids,” Biomedical Pharmacotherapy, 56(2002, 8): 365-379.
17
the demand for olive oil in the US.23 For the consumer, EVOO has become synonymous
with healthy oils.
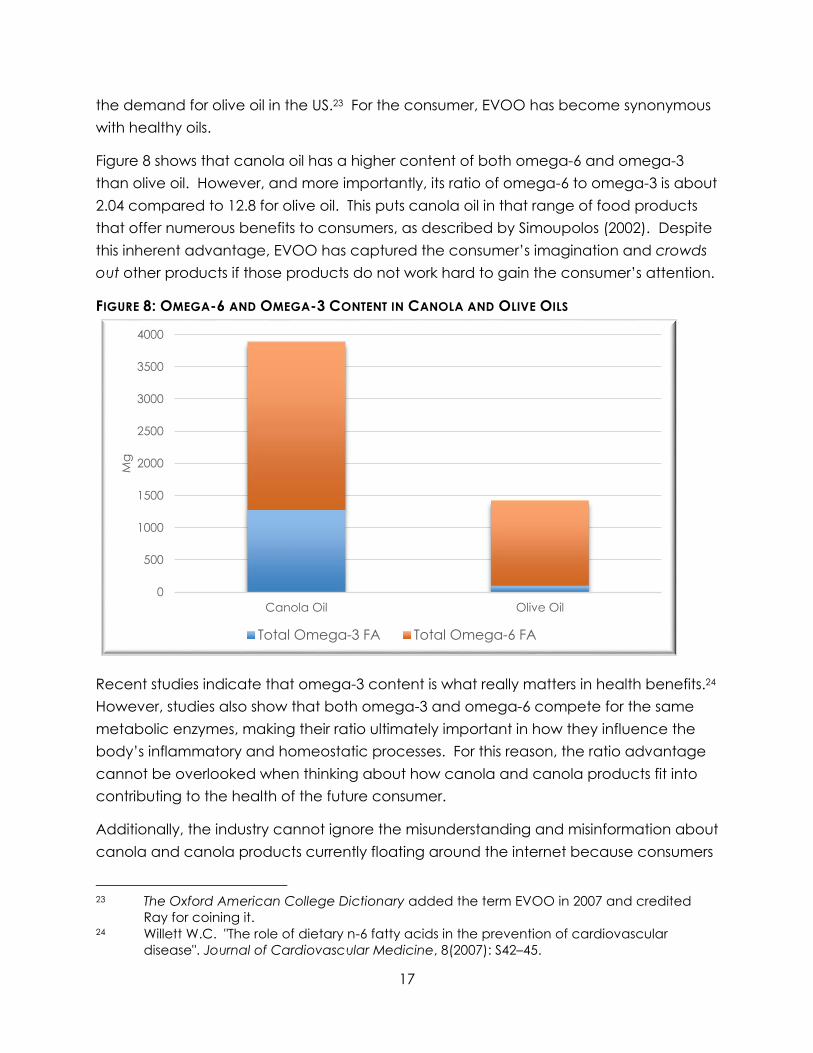
Figure 8 shows that canola oil has a higher content of both omega-6 and omega-3
than olive oil. However, and more importantly, its ratio of omega-6 to omega-3 is about
2.04 compared to 12.8 for olive oil. This puts canola oil in that range of food products
that offer numerous benefits to consumers, as described by Simoupolos (2002). Despite
this inherent advantage, EVOO has captured the consumer’s imagination and crowds
out other products if those products do not work hard to gain the consumer’s attention.
FIGURE 8: OMEGA-6 AND OMEGA-3 CONTENT IN CANOLA AND OLIVE OILS
Recent studies indicate that omega-3 content is what really matters in health benefits.24
However, studies also show that both omega-3 and omega-6 compete for the same
metabolic enzymes, making their ratio ultimately important in how they influence the
body’s inflammatory and homeostatic processes. For this reason, the ratio advantage
cannot be overlooked when thinking about how canola and canola products fit into
contributing to the health of the future consumer.
Additionally, the industry cannot ignore the misunderstanding and misinformation about
canola and canola products currently floating around the internet because consumers
23 The Oxford American College Dictionary added the term EVOO in 2007 and credited
Ray for coining it. 24 Willett W.C. "The role of dietary n-6 fatty acids in the prevention of cardiovascular
disease". Journal of Cardiovascular Medicine, 8(2007): S42–45.
0
500
1000
1500
2000
2500
3000
3500
4000
Canola Oil Olive Oil
Mg
Total Omega-3 FA Total Omega-6 FA

18
abhor information vacuum. The industry’s detractors are working hard to make canola
synonymous with rapeseed, place it within the GMO orbit and confuse the consumer.
However, in addressing erroneous information, it is important that the industry is as
transparent as possible, appealing to science while finding the language to address
any genuine fear that consumers may have.
Overwhelming evidence of canola oil’s benefits have contributed to the Food and
Drug Administration (FDA) allowing manufacturers to make a qualified health claim:
"Limited and not conclusive scientific evidence suggests that eating about 1 ½
tablespoons (19 grams) of canola oil daily may reduce the risk of coronary
heart disease due to the unsaturated fat content in canola oil.”
Johnson, Keast AND Kris-Etherton (2007) showed that complete substitution of other
spreads with canola oil-based margarine increased monounsaturated fatty acid
intakes by 27.6% and increased and α-linolenic acid (ALA) intakes by about 73%.25 They
also noted that 100% replacement decreased n-6 polyunsaturated fatty acid and
linoleic acid intakes respectively by 32.4% and nearly 45%. This altered the n-6 to n-3
fatty acids ratio from 9.8:1 to 3.1:1, which was positive for health improvement.
Benefits of feeding canola meal in animal feed have also been shown in research. For
example, Chibasa, Christensen and Mutsvangwa (2013) used canola meal as the
principal protein source with wheat dried distillers’ grain in dairy cow feed.26 They
observed a quadratic changes in milk concentrations of total C18:2, C18:3n-3 and total
n-3 polyunsaturated fatty acids (PUFA) as well as n-6 PUFA with increasing levels of the
wheat dried distillers’ grain. They concluded that these have potential human health
improvement qualities. Mambasa and others (2013) also show support for the
suppression effect of dietary canola oil on breast cancer in their study involving
measuring mammary carcinogenesis in female rat offspring. Thus, not only is a dietary
canola oil helpful for the mothers, it also promotes the health of offspring, leading
Mombasa and his colleagues to argue that the potential anticancer effect of dietary
canola oil may provide insights into developing nutritional strategies to reduce breast
cancer risks in humans.
25 Johnson, G.H., D.R. Keast, P.M. Kris-Etherton. “Dietary Modeling Shows that the
Substitution of Canola Oil for Fats Commonly Used in the United States Would Increase
Compliance with Dietary Recommendations for Fatty Acids,” Journal of the American
Dietetic Association, 107(2007, 10): 1726-1734. 26 Chibisa, G.E., D.A. Christensen, and T. Mutsvangwa. “Replacing Canola Meal as the
Major Protein Source with Wheat Dried Distillers' Grains Alters Omasal Fatty Acid Flow and
Milk Fatty Acid Composition in Dairy Cows,” Canadian Journal of Animal Science, 93
(2013, 1): 137-147.

19
The foregoing point us to a couple of activities as the CCC prepares for the future
consumer. It is all about the consumer’s needs! First, breeders and producers should
intensify their collaboration to develop varieties that continue to enhance the canola
advantage – i.e., reduce the ratio of n-6 to n-3 to as close as possible to unity by further
enhancing the omega-3 content to stretch canola’s advantage. In the pursuit of this
goal, it may be prudent to identify the agronomic and environmental determinants of
the ratio because it may not all be genetic. For example, do certain locations produce
higher levels of omega-3 than omega-6 and so what are the triggers? Once this
question is answered (and it may have been already), the ingenuity of the breeder
must be brought to bear on enhancing the canola advantage even more.
Canola oil’s manufacturing process has been criticized because of a perception that
hexane extraction adversely affects final product quality. Whether credible or not, we
know that what the consumer believes is how she behaves. Therefore, keeping our eye
on the essence of all production being satisfying the consumer, the industry needs to
explore innovations that can make the competition irrelevant through value
improvement. While the innovations may be more expensive, the appropriate
assessment process is not cost but net value achieved. By segmenting the market to
identify those who value canola’s health value proposition but are wary about the
perceived adverse effects of its manufacturing processes, a value-enhancing solution
could lead to higher net profits.
The feed industry needs a stronger story to move canola meal, and research that shows
that animal products, such as meat, eggs and milk, that are produced with feeding
canola meal have superior PUFA levels in the right ratios would be helpful. This area
requires some more work, with a focus on omega-3 and omega-6 content and ratios as
well as effects on taste, shelf-stability and production costs.
Potential future opportunities for the canola industry would be incomplete without a
statement about biofuels. There is good reason to use canola in biofuel production but
it is important to recognize that this product is a lower value product compared to food
and feed. Furthermore, there is no segmentation advantage once the biofuel is
produced since the lower heating value of the resulting biodiesel is not very different
from others. However, there may be processing cost advantage in using green seed
canola for biodiesel because of its poor food quality and higher processing costs.27
27 See Luque, R., J. Campelo and J. Clark. Handbook of Biofuels Production: Processes and
Technologies, Elsevier: Woodhead Publishing Series in Energy, 2010.

20
“Keep it Coming” In the end, what really matters is to do right with our customers and their customers. All
stakeholders in the Canadian canola industry – from breeders through producers to
processors and shippers – need to understand the needs of every partner in the chain.
What do retailers need to be successful? How can we all make exporters more
competitive against other canola exporters or competing oilseeds in particular
markets? How can we enhance producer revenues to encourage the allocation of
more production resources to canola? What tools do breeders and genetics
companies need to deal with the edaphic, biotic and value challenges confronting not
only producers but whole the canola supply chain? What knowledge and technology
does everyone along the canola chain need to be operationally excellent?
As we work on addressing these questions as individual players and as an industry, we
need to candidly assess what we do and how we do them as individuals and as an
industry. What assumptions about our operations are being taken as “facts” and how
are those affecting our competitive capabilities? We may employ the ERIC Model – An
Effective Strategy Development Tool – to evaluate our current activities so that we
accentuate our winning strategies and make our weaknesses irrelevant to our future
success.
The ERIC – Eliminate, Reduce, Increase and Create – Model is a path-dependent
approach to building sustained competitive advantage that is resilient to a changing
environment. The strategic thinking and operational excellence enhancement model
begins with cataloging everything that we currently do as individual organizations and
as collectives within an industry association, such as the CCC. It might make sense to
do this cataloging at the departmental level in organizations that have multiple
departments or units. The cataloging process helps people see what they do in their
service to the ultimate customer. Sometimes, what one department may do is not
visible to the customer – e.g., the breeder – but it makes the customer-interface of the
firm – e.g., the restaurant – look very good. That is, the customer perceives value in the
exchange, and that perception leads to the reward the whole chain enjoys, including
those whose contributions were invisible to the customer. It is important that the
cataloging is as complete as realistically possible. We have seen morale improved and
pride increase after individuals complete their catalogs and found how much they do
that they themselves take for granted.
The purpose of the cataloging process is to identify what we do and why we do them,
what we do not do and why we do not and what need to do that we are not doing.
We focus on our assumptions and the organizational or industry stories that constrain our
performance and our creativity. To bring some objectivity to the process, we need to

21
develop clear estimates of costs and benefits for each activity in the catalog we
develop. We employ non-market valuation methods to assess the costs and benefits
associated with doing all those things that we have always assumed cannot be valued.
When done carefully and with respect, candor and sensitivity – after all, everyone
around the table has something positive to offer, which is why they are there – the
outcome can be wonderful. The participants are ready to implement the ERIC Model
once the assumptions and the net benefits of the items in the catalog are defined,
discussed and articulated.
Figure 9 summarizes the objective for each quadrant of the matrix defining the ERIC
Model. Organizations that seek to sustain their competitive advantage in the emerging
environment and get an increasing share of the future consumer’s dollar need to
embark on this path of re-imagining all their activities within the ERIC Model.
FIGURE 9: THE ERIC MODEL - STRATEGY MAKING RE-IMAGINED
The process used in this conversation underscores the ERIC Model approach. We
started with understanding the forces that were driving current and future change in
the agriculture and food sector. We agreed with Rev. Malthus that people are driving
the changes we are seeing now and are going to see in future. However, we
disagreed with the good reverend on our strategic response to the increasing

22
population. We argued that for this industry, the more people we have the better
because of the elastic nature of food and food-related consumption. We showed that
populations are going to increase because of drastic reductions in child mortalities in
developing countries and increased life expectancy everywhere. We pointed to
projections that indicated that incomes are going to go up for a significantly larger
proportion of people and that these people would demand higher value food
products. Our job is to focus on the different consumer market segments that we can
exploit effectively create the highest value for which the consumer is willing and able to
reward us over and above our efforts. The ERIC Model provides a strategic thinking and
execution tool to facilitate the process.
Upon completing our value creation maps (as individual companies and collectively as
an industry), we need to develop a powerful marketing initiative. We need someone
like Rachel Ray, seen by the consumer as independent and unthreatening, who would
carry the “message” of the new products and solutions we develop and make it stick
enough for it to transform into demand. When these efforts translate into demand, then
we know our production has met the needs of a consumer somewhere. When we
satisfy a consumer, then we have achieved the purpose of our production objectives.