controlled hypersonic flight air data system and … educational notes/rto-en... · air data system...
TRANSCRIPT

Controlled Hypersonic Flight Air Data System and Flight Instrumentation
Georg Koppenwallner
HTG Hyperschall Technology Göttingen Max-Planck-Strasse 19
37191 Katlenburg-Lindau, Germany
Summary The main task of an air data system, namely to deduce from measurement on the body the aerodynamic free stream conditions will be outlined. Emphasis will also be given to the limi-tations of aerodynamic systems. A short review of the aerodynamic probe functions relating measured quantities to the desired free stream conditions and vehicle orientation will be given. After explaining the principle elements of an air data system the design of individual compo-nents will be outlined. The design of an air data system depends strongly on the flight envelope, re-entry trajectory and vehicle structure. Flight envelope and re-entry trajectory influence primarily the sensor range and sensor head design. Vehicle structure has a strong influence on the probe install-ment. The principal components are: Probe heads, probe mounting elements, sensors, sensor elec-tronics, harness and data acquisition system. In a similar way the design of calorimetric heat flux sensors will be explained. Testing and flight qualification are one of the mayor efforts during development of an air data system and flight instrumentation. Therefore the principal steps for these activities will also be outlined.
RTO-EN-AVT-116 12 - 1
Paper presented at the RTO AVT Lecture Series on “Critical Technologies for Hypersonic Vehicle Development”, held at the von Kármán Institute, Rhode-St-Genèse, Belgium, 10-14 May, 2004, and published in RTO-EN-AVT-116.

Content
1. Introduction....................................................................................................................................................... 3
2. Tasks and requirement and of an air data system ......................................................................................... 3 2.1 Air data system tasks.................................................................................................................................... 3 2.2 Air data system requirements ....................................................................................................................... 4
3. The aerodynamic probe functions ................................................................................................................... 5 3.1 Free-stream dynamic pressure determination at Ma >>1 ............................................................................. 5 3.2 Mach number Ma and static pressure determination for Ma >> 1................................................................ 6 3.3 Flight Wind angles and basic considerations ............................................................................................... 6 3.4 Derivation of α, β sensor functions .............................................................................................................. 8 3.5 Sensitivity and error analysis ..................................................................................................................... 11
4. Simple tools for pressure and heat load dimensioning of sensor heads...................................................... 12
5 Some typical air data systems for re-entry vehicles ...................................................................................... 14 5.1 The Shuttle Entry Air Data System SDS.................................................................................................... 14 5.2 The ARD capsule ....................................................................................................................................... 14 5.3 The RAFLEX Air Data System and Instrumentation................................................................................. 15
6. RAFLEX design principles............................................................................................................................. 17 6.1 The basic principle of RAFLEX of combined sensor heads ...................................................................... 18 6.2 Mission specific design influence .............................................................................................................. 20 6.3 The influence of vehicle mechanical and thermal structure ....................................................................... 21
7. Electronic components and mass budget ...................................................................................................... 23
8. Validation and qualification testing of the probes........................................................................................ 24
9. Some flight results with RAFLEX system..................................................................................................... 26
10. Conclusions.................................................................................................................................................... 28
Literature............................................................................................................................................................. 29
Controlled Hypersonic Flight Air Data System and Flight Instrumentation
12 - 2 RTO-EN-AVT-116

1. Introduction Air data systems have to provide information on the ambient air and on the vehicle state of flight relative to ambient air. For an operational vehicle these state quantities are important for the vehicle control and guidance. For an experimental research vehicle these quantities are necessary for reduction of quantities measured on the vehicle itself. Thus the air data system should in combination with other on board or remote measurement quantify the state of the ambient atmosphere and the state of the vehicle. Typical supplementary onboard or remote measurements are acceleration vector sensing and radar tracking.
2. Tasks and requirement and of an air data system
2.1 Air data system tasks. Air data systems have in general a specific task and they have in addition to comply with a set of requirements [1]. The main task concerns information on ambient air and on the vehicle state as outlined below. Information on ambient atmosphere As the main aerodynamic re-entry occurs in the homosphere (H < 120 km) with constant mo-lecular mass we need only 2 quantities to determine the atmospheric state, pressure p, density ρ, and temperature T. For H < 120 km the molecular mass is constant with a value of M = 28.96 kg/kmol. Information on vehicles aerodynamic state Vehicles aerodynamic state is in principle determined by the flight velocity vector relative to ambient air in a body fixed coordinate system. This requires the determination of the three scalar quantities. In principle this measurement is achieved by determination of magnitude of velocity V and the aerodynamic angle of attack α and the angle of side slip β. In summary one needs 5 combinations of quantities in order to completely describe the vehi-cles state in an aerodynamic reference plane
Quantity 1 Free stream dynamic pressure q = (ρ/2)V2 2 Angles of attack α 3 Angle of sideslip β 4 Free stream pressure or temperature p or T 5 Flight velocity or density V or ρ
In a flush mounted Air Data System (FADS) the vehicle itself acts as an aerodynamic probe. Thus one has to relate physical quantities measured at the vehicle surface to the atmospheric free stream and to the vehicle’s velocity and aerodynamic orientation. Fig. 1 shows that the atmospheric free stream and the vehicle flow field determine the local surface properties.
p(surface) = Function (V, ρ, T, α, β, vehicle shape, location)
Controlled Hypersonic Flight Air Data System and Flight Instrumentation
RTO-EN-AVT-116 12 - 3

Fig. 1: The main tasks of an aerodynamic air data system A flush mounted air data system has, however, to solve the inverse problem, namely to de-duce from a surface measurement the state of the atmosphere and the vehicle orientation. The solution of this inverse problem is by nature much more complex because one identical sur-face quantity can result from a variety of free-stream conditions and vehicle orientations. In order to find the unique inverse solution, a set of surface quantities have to be measured. From this set of measurements the compatible solutions have to be isolated in order to obtain a unique solution for the free stream quantity.
2.2 Air data system requirements The requirements may be split up in mission dependent, operational and vehicle specific. Mission dependent requirements a. Altitude and velocity range of mission to be covered b. Accuracy, response time c. Availability of evaluated information (Immediately as input for flight control after flight
for reconstruction of aerodynamic environment) Operational requirements a. Heat loads (mainly for sensor heads) b. Dynamic, vibration loads (sensors and electronics) a. Response time Vehicle dependent requirements a. Location for installation b. Compatibility with vehicles external internal structure
Controlled Hypersonic Flight Air Data System and Flight Instrumentation
12 - 4 RTO-EN-AVT-116

3. The aerodynamic probe functions The aerodynamic probe functions establish relations between the measured quantity of the sensor head (in our case surface pressure) and the aerodynamic free stream quantities. This is mathematically an inverse problem, which only in simple cases can be solved directly. In or-der to simplify the situation we select as representative vehicle shape a blunted cone similar to EXPERT [2] and restrict the analysis to the hypersonic part of the re-entry regime.
3.1 Free-stream dynamic pressure determination at Ma >>1 Free stream dynamic pressure should be determined with a pressure port installed in the vehi-cles nose. We then can use the classical Raleigh-Pitot relation [3] given below.
1/( 1)/( 1)
,2 21 2
1 1
1 12 2 ( 1)
tPMa
p Ma
κκ κκ κκ κ
−− ⎛ ⎞+ +⎛ ⎞= ⎜ ⎟⎜ ⎟ − −⎝ ⎠ ⎝ ⎠
with 211
1
2q Map κ= and 2
11
1 2Vq ρ
= we obtain:
1/( 1)/( 1)
,2 212 2
1 1 1
2 1 1 12 2 ( 1)
tPMa
q Ma Ma
κκ κκ κκ κ κ
−− ⎛ ⎞+ +⎛ ⎞= ⎜ ⎟⎜ ⎟ − −⎝ ⎠ ⎝ ⎠
Ratio of freestream dynamic pressure q to measured stagnation point pressure pt2 as function of Ma
0
0,1
0,2
0,3
0,4
0,5
0,6
0 2 4 6 8 10 12 14 16 18 20Mach number Ma
q/pt
2
kappa=1,4kappa =1.2
Ma1, pt
Fig. 2: Ratio of free stream dynamic to Pitot pressure as function of Mach number
Controlled Hypersonic Flight Air Data System and Flight Instrumentation
RTO-EN-AVT-116 12 - 5

Fig. 2 shows the ratio of actual free stream dynamic pressure to measured Pitot pressure as function of Mach number Ma. It is evident that for Ma > 4 this pressure ratio becomes inde-pendent from Ma. Thus the free stream dynamic pressure can directly be determined by the measured Pitot pressure. It is also important to note that real gas effects have only a minor influence on the stagnation point pressure. Equilibrium chemistry [4] reduces the q/pt2 ratio from q/pt2 = 0.54 for κ= 1.4 to a value of q/pt2 = 0.52 which corresponds to κ=1.2.
3.2 Mach number Ma and static pressure determination for Ma >> 1 Mach number determination requires beside of the Pitot pressure also a static pressure deter-mination. For our test case vehicle this can only be done on the lateral conical surface.
Pressure coefficient pc/q of a 12.5 ° half angle cone as function of Mach number
0
0,05
0,1
0,15
0,2
0,25
0,3
0,35
0,4
0,45
0,5
0 2 4 6 8 10 12 14 16 18 20Ma
pc/q
1
Ma independencef M *th t 2
Ma1, q1Pc
Fig. 3: Pressure coefficient of a 12.5° half angle cone and Mach number independence In Fig. 3 we show the pressure coefficient of a cone half angle Θ = 12.5 ° as function of Mach number. It is evident that due to the hypersonic Mach number independence principle, which holds also for slender bodies with Ma *sin θ >2 the cone pressure is only a function of the free stream dynamic pressure and the cone angle. We therefore can not use the combination of Pitot and cone pressure in order to determine the free stream Mach number because both quantities are only functions of the free stream dynamic pressure q. For angle of attack and angle of sideslip determination the Mach number independence principle can however be used to derive simple analytic expressions.
3.3 Flight Wind angles and basic considerations The definition of the US standard aerodynamic coordinate system [5] and the corresponding angle of attack α and side slip β are used in the following.
Controlled Hypersonic Flight Air Data System and Flight Instrumentation
12 - 6 RTO-EN-AVT-116

The Newtonian impact method states, that the local surface pressure depends only on the an-gle Θ between local surface normal and free stream vector as shown below. 2( ) ( 0 ) cosp pΘ = Θ = ° ⋅ Θ for -90° < Θ < 90° ( ) 0p Θ = for 90° < Θ < 270° Newtonian method is an acceptable approximation for ( )cos 2Ma ⋅ Θ > . We analyze the probe function for 5 sensors installed in an axis symmetric body with a blunt nose. The following Table shows in a general way the angles φ and θ defining the installation conditions of the five probes. Fig 4 explains for an axis-symmetric body the sensor installation angles and the flight wind angles α, β. In order to achieve a simple formulation for the probe functions a symmetric in-stallation with θ1 = θ2 = θ3 = θ4 = θ will be used for the following analysis.
Fig. 4: Definition of local surface inclination and flight wind angles
No. Pressure Probe Circumference Angle φ [°]
Local surface inclina-tion θ against body x axis
0 P0 Stagn. Point 0 θ = 90° 1 P1 Alpha 1 φ 1 = 0 θ1 2 P2 Beta 1 φ 2 = 90 θ2 3 P3 Alpha 2 φ 2 = 180 θ3 4 P4 Beta 2 φ 4 = 270 θ4
Table 1: Conditions for sensor installation
P1
P2
P3
Phi
Ybody
Zbody
P3
Xaero
Lateral view
View against Xbody axis
P 1
P3
+α
X b o dy
Zaero
Air Velocity
Air Velocity
+β
P 4
P2
Xbod y
Alpha: Rotation about Ybody axis Beta: Rotation around Zaero axis
View from top
Definition of local surface inclination θ at sensor p1, p2, p3, p4 locations and flight wind angles α and β
P0
P0
Local inclination θ against body axis
Controlled Hypersonic Flight Air Data System and Flight Instrumentation
RTO-EN-AVT-116 12 - 7

In the NASA TR-R-127 [6] formula for the ‘Newtonian’ pressure distribution on axis-symmetric bodies in dependence of the flight wind angles are presented. The circumferential pressure distribution of a general axis-symmetric body is given as func-tion of flight wind angles α, β and the local angles of inclination θ and circumference φ. 2)cossincossinsincoscoscos(sin βαθφβφθβαθ soskcp N −−= For the spherical stagnation point the following expression holds
2
0 )cos(cos βαNkcp =
with Nk given by 13
++
=κκ
Nk for modified Newtonian theory.
Based on this formula simple probe functions have been derived in [1] which are shortly out-lined below
3.4 Derivation of α, β sensor functions For a symmetric circumferential installation of 5 pressure probes the angular functions cos φ and sin φ have values as shown in the following table
No Pressure Probe Circumference Angle φ [°]
Cos φ Sin φ
0 P0 Stagn. Point 0 1 P1 Alpha 1 φ 1 = 0 1 0 2 P2 Beta 1 φ 2 = 90 0 1 3 P3 Alpha 2 φ 2 = 180 -1 0 4 P4 Beta 2 φ 4 = 270 0 -1
Table 2: Pressure probe installation on blunted axis symmetric body
Using these values one obtains for the Alpha 1, Alpha 3, Beta 2 and Beta 4 sensors the fol-lowing pressure formula set: 2 2(Alpha 1) cos (sin cos cos sin )Ncp k β θ α θ α= − 2 2(Alpha 3) cos (sin cos cos sin )Ncp k β θ α θ α= + 2(Beta 2) (sin cos cos cos sin )Ncp k θ α β θ β= − 2(Beta 4) (sin cos cos cos sin )Ncp k θ α β θ β= + These four equations have to be solved in order to determine with the 4 measured pressures the two flight wind angles α, β. The solution procedure can substantially be simplified when the probe positions are selected at local surface inclination with θ = 45°. We then have sin 45° = cos 45° and the equations are further simplified to
Controlled Hypersonic Flight Air Data System and Flight Instrumentation
12 - 8 RTO-EN-AVT-116

2 2 2(Alpha 1) sin 45 cos (cos sin )Ncp k β α α= ° − 2 2 2(Alpha 3) sin 45 cos (cos sin )Ncp k β α α= ° + 2 2(Beta 2) sin 45 (cos cos sin )Ncp k α β β= ° − 2 2(Beta 4) sin 45 (cos cos sin )Ncp k α β β= ° + For the differential pressures (Alpha 3 - Alpha 1)cp∆ and (Beta 4 - Beta 2)cp∆ we obtain:
2 2(Alpha 3 - Alpha 1) 4sin 45 cos cos sinNcp k β α α∆ = °
2(Beta 4 - Beta 2) 4sin 45 cos sin cosNcp k β β α∆ = °
We arrive at an explicit solution if we normalize the above equations by the geometric stagna-tion point values cp0. The beta dependence in the alpha formula is then compensated by the stagnation point pressure.
2 2
22 2
0
4sin 45 cos cos sin(Alpha 3 - Alpha 1) 4sin 45 * tancos cos
N
N
kcpcp k
β α α αβ α
°∆= = °
2
22 2
0
4sin 45 cos sin cos(Beta 4 - Beta 2) tan4sin 45cos cos cos
N
N
kcpcp k
β β α ββ α α
°∆= = °
We note that due to the normalization with cp0 the Newton factor kN and the dynamic pres-sure are eliminated from the functions and we obtain as final probe functions:
20
1 ( 3 1)arctan4sin 45
p pp
α⎛ ⎞−
= ⎜ ⎟°⎝ ⎠
20
cos ( 4 2)arctan4sin 45
p pp
αβ⎛ ⎞−
= ⎜ ⎟°⎝ ⎠
The angle of attack α can now directly determined by the measured pressure ratio ( )3 1 / 0cp cp cp− and in a second step the sideslip angle β can be determined with
( )4 2 / 0cp cp cp− . It is evident that there exists only a small influence of alpha on the beta pressure ratio function. Fig. 5 and Fig. 6 show the alpha pressure ratio ( )3 1 / 0p p p− and the beta pressure ratio
( )4 2 / 0p p p− as function of the corresponding angles. It should be noted that the formula are only valid for 45α < ° and 45β < ° . For 45α > ° or 45β > ° the sensors will move into the shadowed flow regime with p=0, a situation which in the above derivation has not been considered.
Controlled Hypersonic Flight Air Data System and Flight Instrumentation
RTO-EN-AVT-116 12 - 9

Alpha pressure ratio (p3-p1)/p0 versus of angle of attack
0
0,2
0,4
0,6
0,8
1
1,2
0 5 10 15 20 25 30Alpha °
(p3-
p1)/p
0
Fig. 5: Alpha pressure ratio p3-p1/p0 versus angle of attack, Newtonian pressure law, Sensor installation at θ = 45°
Beta pressure ratio (p4-p2)/p0 versus side slip angle
0
0,2
0,4
0,6
0,8
1
1,2
1,4
1,6
1,8
0 5 10 15 20 25 30 35 40Beta °
(p4-
p2)/p
0
alpha = 0
alpha = 10
alpha = 20
alpha = 30
Fig. 6: Beta pressure ratio p4-p2/p0 versus angle of attack, Newtonian pressure law, Sensor installation at θ = 45°
Controlled Hypersonic Flight Air Data System and Flight Instrumentation
12 - 10 RTO-EN-AVT-116

In a CFD study [7] conducted at CLE with Navier-Stokes codes the above analytical formula-tion has been tested for EXPERT [2] vehicle conditions along the entry trajectory. It was found that viscous boundary and real gas effects have only a minor influence on the analytical derived probe functions for Mach numbers Ma> 5. Based on this study small correction terms for the probe functions, which amount to about 6%, have been developed by CLE.
3.5 Sensitivity and error analysis For primary importance for the directional sensitivity of one pressure sensing orifice is the local inclination Θ. Newtonian pressure is given by p/p(Θ=0) = cos2Θ. Taking the derivative d(p/p0)/dΘ we obtain:
( / ) 2cos sind p pod
= − Θ⋅ ΘΘ
Fig. 7 shows for one pressure tap the Newtonian pressure and the directional sensitivity. It is evident that the sensor installation at Θ = 45° provides the largest directional sensitivity. In blunt capsule like bodies of the Apollo and ARD type only a very small angular sensitivity can be achieved. Thus the selected pressure port locations with Θ = 45° and ∆φ = 90 ° are the optimum posi-tions for flight wind angle determination. This special angular arrangement provides not only an explicit probe function but also the highest angular resolution.
Normalised pressure and angular sensitivity of Newtonian pressure distribution
0
0,1
0,2
0,3
0,4
0,5
0,6
0,7
0,8
0,9
1
0 10 20 30 40 50 60 70 80 90
theta, °
p/p
o an
d (1
/2)d
(p/p
o)/d
(thet
a)
norm. pressure p/psAngular sinsitivity (1/2)d(p/po)/dtheta
Fig. 7: Normalized Newtonian pressure distribution and angular sensitivity for one pres-sure tap
Controlled Hypersonic Flight Air Data System and Flight Instrumentation
RTO-EN-AVT-116 12 - 11

The relative angle of attack error is obtained by logarithmic differentiation of the probe func-tion 2
3 1 0/ 4sin 45 tanp p α− = °⋅ . At small angle of attacks α <10° (with sin α ∼ α and cos α ∼1) we obtain:
0
0
31
31
pp
pp ∆
+∆
=∆
−
−
αα
This means if we measure both pressures p0 and, p3-1 with an accuracy of 1% the resulting an-gle of attack accuracy will be 2% of alpha value. It should however be noted that this analysis applies only if we have identical Newton factor kN between the different pressure taps. Real gas effects may influence the Newton factors between tap 0 taps 31 which would result in Newton factors of kN0 and kN13.In this case the error formula would contain the following additional term:
N
N
KK
pp
pp ∆
+∆
+∆
=∆
−
−
0
0
31
31
αα
4. Simple tools for pressure and heat load dimensioning of sensor heads Principal tasks of the dimensioning are: • Determination of the pressure measurement range for each sensor head. • Determination of heat load measurement range for calorimetric sensor heads. • Thermal dimensioning to withstand the maximum heat load and the time integrated heat
load during the mission. Fast engineering analysis methods are extremely useful for the dimensioning during the de-sign phase. Simple ballistic trajectory analysis codes like the Allen-Eggers [8] or Chapman’s method [9] combined analytical pressure and heat flux formula allow a fast analysis of the pressure, heat load and thermal response of the sensor heads along the complete trajectory. HTG relies on Allen Egger’ entry dynamics combined with modified Newtonian surface pres-sure analysis and Lees [10] heat flux analysis. As typical analysis example we show in Fig. 8 the dynamic pressure and velocity for the re-entry trajectory case B of the EXPERT vehicle [2]. In Fig. 9 we show as function of entry time the stagnation point heat flux and the resulting temperature of a calorimetric heat flux sensor of the RAFLEX type [11]. It should be noted that the thermal design of sensor heads has to consider both the maximum heat load during re-entry and the time integrated heat load during the whole re-entry phase. In the present analysis case the copper sensor head reaches a maximum temperature of 1300 K, which is only 60° below the melting temperature of 1360 K. Thus the calorimetric constant of the head has to be increased.
Controlled Hypersonic Flight Air Data System and Flight Instrumentation
12 - 12 RTO-EN-AVT-116

Dynam ic pressure and ve locity during re-entry Expert Vehicle , case B Entry angle 3,8°; Entry ve locity 6000m /s; Bal Coeff. B = 750 kg/m ^2
0
10000
20000
30000
40000
50000
60000
0 10 20 30 40 50 60 70 80 90 100
Altitude h, km
dyn.
Pre
sure
q, N
/m^2
0
1000
2000
3000
4000
5000
6000
7000
Velo
city
, m
/s
dyn. Pressure N/m^2
velocity m/s
Fig. 8: Dynamic pressure and velocity EXPERT Case B, Sensor length 30 mm, B = 750 kg/m^2, entry angle = 3.8°
Heat flux and sensor head temperature during re-entry Case B revisedB = 750 kg/m^2 ; the = 3,8 ° ;Sensor length 35 mm , eps = 0,6
0
200
400
600
800
1000
1200
1400
0 50 100 150 200 250 300 350 400Entry time t , s
Hea
t flu
x kW
/m^2
0
200
400
600
800
1000
1200
1400
Sens
or te
mpe
ratu
re, KHeat flux qs, kW/m^2
Sensor temperature in K
Fig. 9 Heat flux and sensor head temperature, EXPERT Case B, Sensor length 30 mm; B = 750 kg/m^2, entry angle = 3.8°
Controlled Hypersonic Flight Air Data System and Flight Instrumentation
RTO-EN-AVT-116 12 - 13

5 Some typical air data systems for re-entry vehicles Typical air data systems used in re-entry vehicles are shortly summarized in the following.
5.1 The Shuttle Entry Air Data System SDS The US Shuttle Entry Air Data System SEADS [12] consists of 14 nose cap orifices and 6 static orifices mounted behind the nose cap with smaller local surface inclination. Due to the asymmetric nose and due to safety considerations more than 5 pressure orifices had to be used. Therefore also the derivation of probe functions required a large computational and experimental effort. In order to cover the complete altitude range below 90 km each orifice is connected to a pair of 2 absolute pressure transducers with different measurement range. Fig. 10 shows a sketch of the Shuttle nose with the installation locations of the 20 probes.
Fig. 10: Principle of Shuttle Entry Air Data system SEADS
5.2 The ARD capsule The ARD capsule, whose geometry is shown in Fig. 11, has the Apollo shape and its spherical front part consists of a spherical segment with 22.6° half angle. This means that the maximum pressure variation amounts on the flow exposed spherical sur-face at α = 0° is only to 15% and at α = 15° the pressure variation increases to 36%. Thus the air data system principally operates in the low sensitivity regime of Fig. 7.
Fig. 11: Geometry of ARD capsule, dimensions in mm
Controlled Hypersonic Flight Air Data System and Flight Instrumentation
12 - 14 RTO-EN-AVT-116

5.3 The RAFLEX Air Data System and Instrumentation The RAFLEX air data system (Re-entry Aerodynamic FLow Experiment) consists of com-bined flux probes measuring both pressure and heat flux. Up to now RAFLEX served for 3 entry capsules as air data system [11]. RAFLEX for Express Capsule RAFLEX development started during the years 1993 – 1995 for the EXPRESS mission [13], [14]. The shape and the main dimensions of the EXPRESS capsule and sensor installation positions are shown in Fig. 12. EXPRESS was launched in January 1995 and recovered after a launch failure and an unex-pected recovery in Ghana in the middle of 1996. Due to these circumstances no flight data were obtained during the uncontrolled re entry. Inspection and calibration checks after landing showed that the hardware and sensors suffered no mayor damage due to the re-entry forces and heat loads.
Sensor type Measurement task 1 DPP Dynamic Pressure Probe
Free stream dynamic pressure
3 CFP Combined Flux Probe (KFA)
Particle flux, Slip flow, Heat flux Pressure (momentum flux) Combin. 1+2+3 free stream orientation
Fig. 12: Raflex installation on Express Capsule
Controlled Hypersonic Flight Air Data System and Flight Instrumentation
RTO-EN-AVT-116 12 - 15

RAFLEX on MIRKA MIRKA [15] was a ballistic re-entry capsule with a spherical shape of about 1m diameter and a total mass of 154 kg. (Fig.13), it was launched and recovered after parachute landing in Oc-tober 1997. For MIRKA a second improved version of RAFLEX was developed. Excellent flight data were obtained during the re-entry.
D =
1m0.
65 m
0.36
m+Z
+Z
+X +Y SDS
KFA1 KFA2
KFA3
SDS
KFA
Sensor type Measurement task 1 SDS Dyn. Pressure Probe Free stream dynamic pressure
3 CFP (KFA) Combined Flux Probes
Heat flux Pressure (normal momentum flux) Combin. 1+2+3 free stream orientation
Fig. 13: Geometry of MIRKA Capsule with sensor locations
Controlled Hypersonic Flight Air Data System and Flight Instrumentation
12 - 16 RTO-EN-AVT-116

RAFLEX on IRDT
IRDT (Inflatable Re-entry and Descent Technology) is a ballistic re-entry capsule with a two staged Inflatable Braking Unit (IBU) [11], [16]. Fig.14 shows the rigid part of the IRDT2 cap-sule with RAFLEX probe positions and the launch configuration with stowed IBU. The first IBU will be inflated at the beginning of the re-entry in an altitude of about 100 km while the second IBU acts as a parachute for landing. In total one DSP (Dynamic Stagnation Point Probe), four CFP (Combined Flux Probe) and one BPP (Base Pressure Probe) were installed. DSP and CFP are capable of measuring heat flux and pressure. For DSP and CFP probes differential pressure transducers were installed obtaining the reference form the vehicle base. Therefore bas pressure was monitored with one absolute transducer. Due to an unfortunate launch failure no re-entry data could be obtained. Also IRDT was not recovered after an uncontrolled re-entry.
Sensor type Measurement task 1 DSP Dynamic Stagnation Point Probe
Free stream dynamic pressure Stagnation Point heat flux
4 CFP Combined Flux Probes
Heat flux Pressure (normal momentum flux) Combin. 1+2+3 +4 free stream orientation
1 BPP Base Pressure Probe Base Pressure, reference pressure for CFP
Fig. 14: Geometry of IRDT rigid part with Raflex probe positions and IRDT with
stowed IBU
6. RAFLEX design principles The design and development of each RAFLEX system was dominated by the mission specific design loads, by the vehicle geometry, by the vehicle mechanical and thermal structure by the local installation position and by the restrictions imposed by other experiments. For each new re-entry mission the RAFLEX system needed a redesign for the mechanical and thermal hardware as well as for the electronic parts of the sensor package. The basic principle of our combined flux probes remained however identical.
Controlled Hypersonic Flight Air Data System and Flight Instrumentation
RTO-EN-AVT-116 12 - 17

6.1 The basic principle of RAFLEX of combined sensor heads
The RAFLEX combined sensor heads measure with on head local simultaneously pressure and heat flux .The heat load sensor is based on the calorimetric principle. This means that the heat load acting on the sensor is stored by the calorimetric sensor head. The calorimetric sen-sor head has in addition a pressure tap which allows pressure and heat flux measurement at identical location. Sensor heads of this type can also be used in the rarefied slip flow regime were thermal transpiration influences the sensed pressure. Fig. 15 shows a principle sketch of a combined probe.
Fig. 15: Principle of combined RAFLEX sensor head for pressure and heat flux As this head has also heat losses due to radiation and conduction the following simplified heat balance applies for a cylindrical calorimeter.
( )4'aer Sens C Sens Sens ambdTq A H A T A k T Tdt
εσ= + + −
with Asens the flow exposed area of sensor head. For a cylindrical calorimeter as sketched in Fig. 15 we obtain:
Sensing area: 2
4sensA dπ= [m²]
Sensor heat capacity CH : 2
4C VH c d Lπ= [J/K]
Calorimeter constant CC : CC V
HC c LA
= = [J/(m2K)]
thermal structure of SC
Calorimetric heat flux sensor, diameter d length L material spec.heat cV
sensor support and housing
mechanical structure of SC
time dependent aero heat flux q(t)
sensor response dT/dt =q(t)/(L*cV)
thermal insulators
thermocouple pressure port
Pressure tap
Controlled Hypersonic Flight Air Data System and Flight Instrumentation
12 - 18 RTO-EN-AVT-116
Neglecting heat conduction we obtain for a sensor exposed to aerodynamic heating and radia-tive heat loss the following simple expression.
4' T
dtdTLcq Vaer εσ+=
With this equation the aerodynamic heating can be deduced from the sensor temperature-time derivative dT/dt with a correction for radiation losses. The above formulation treats the sensor head as a lumped mass with infinite heat capacity. This means that the heating dT/dt is uni-form with in the sensor volume. This assumption is only valid in case the heat penetration time tP through the sensor is smaller than a characteristic time for a heat flux change during the re-entry tP << tq. The penetration time is given by Fourier number FoL = 0.1, which gives
20.1pVt L ck
= ⋅
The characteristic time for a heat flux change tq is given by a change of re-entry heat flux q(t) by a factor 1/e.
( ) ( )
( ) ( )/
q
q
dq t q ttdt e
q t dq tte dt
=
=
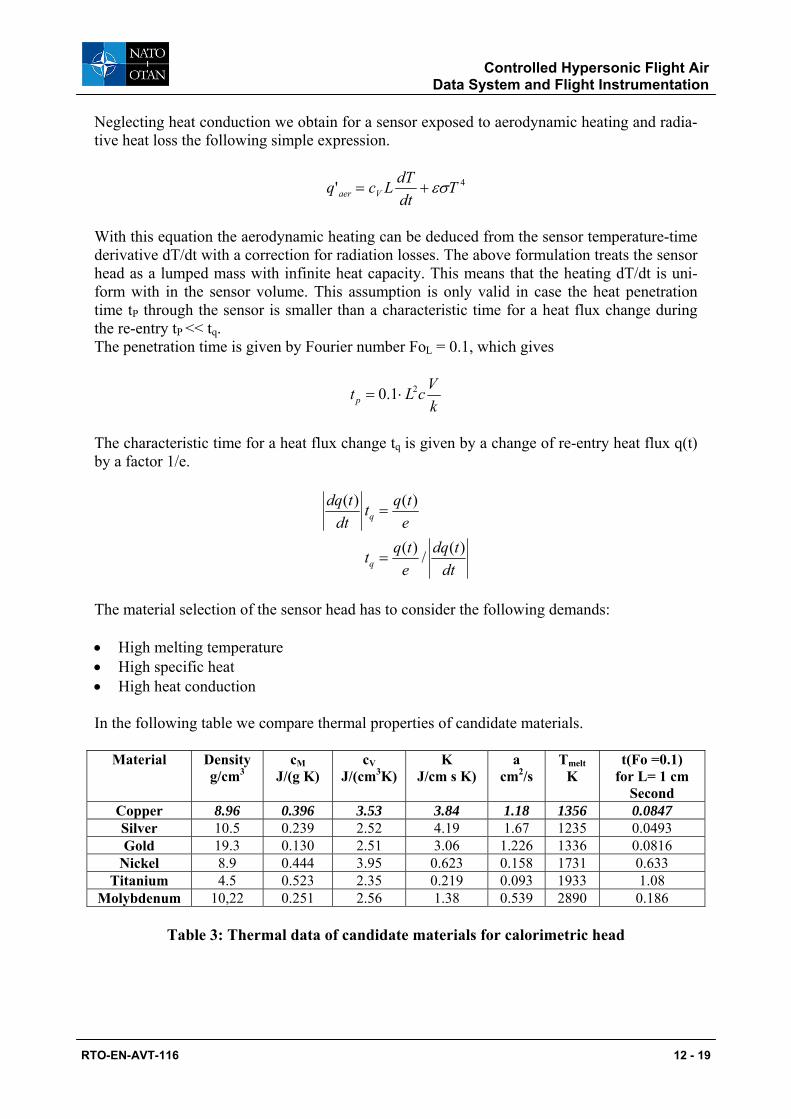
The material selection of the sensor head has to consider the following demands: • High melting temperature • High specific heat • High heat conduction In the following table we compare thermal properties of candidate materials.
Material Density g/cm3
cM J/(g K)
cV J/(cm3K)
K J/cm s K)
a cm2/s
Tmelt K
t(Fo =0.1) for L= 1 cm
Second Copper 8.96 0.396 3.53 3.84 1.18 1356 0.0847 Silver 10.5 0.239 2.52 4.19 1.67 1235 0.0493 Gold 19.3 0.130 2.51 3.06 1.226 1336 0.0816
Nickel 8.9 0.444 3.95 0.623 0.158 1731 0.633 Titanium 4.5 0.523 2.35 0.219 0.093 1933 1.08
Molybdenum 10,22 0.251 2.56 1.38 0.539 2890 0.186
Table 3: Thermal data of candidate materials for calorimetric head
Controlled Hypersonic Flight Air Data System and Flight Instrumentation
RTO-EN-AVT-116 12 - 19

It is evident that copper has the best material properties. Sensor heads with 20mm length have a penetration time of 0.3 sec whereas characteristic times for heat load change are during the re-entry heating phase larger than tq > 10 sec. Thus an adequate time resolution can be achieved with this heads.
6.2 Mission specific design influence Mission and trajectory dependent design influences are the maximum heat flux q’max , the local heat flux profile q’(t) as function of re-entry time, its integral ∫= dttqQ )(' , the maxi-mum dynamic pressure qmax and the pressure profile p(t). This quantities influence primarily the sensor head dimensioning and the range of pressure transducers. With the given data for a new mission, like capsule shape and mass, re-entry trajectory and location for the sensor installation in the capsule, we evaluated the heat flux and pressure pro-files over the flight time. In the next table the maximum stagnation point heat flux and dynamic pressures are shown for the three RAFLEX missions. Express capsule had an extreme high ballistic coefficient B and had thus a low altitude re-entry trajectory, whereas the inflatable demonstrator IRDT re-entered at high altitudes.
Table 4: Mission and trajectory specific design loads
The design values for the RAFLEX sensors had to be based on heat flux and pressure on local installation position. These values are shown in the next Table.
Design heat flux
Calorimeter dimensions
Peak dyn. Pressure
Pressure Transducer
Mission Installation position
[kW/m²] ∅·L [mm] mbar mbar Stagn. Point 3000 - 2000 3000
1000 EXPRESS
Conical Flare
600 ∅16 x 30 1000 abs. 10 abs. 10 diff.
Stagn. Point 2000 - 500 1000 abs. 10 abs.
MIRKA
48°-position 1200 ∅10 x 40 1000 abs. 10 abs.
Stag. point 800 ∅10 x 30 150 330 diff. IRDT2 Cone 400 ∅10 x 16 330 diff.
Table 5: Design values for heat flux sensor heads and pressure transducer range
Mission Ball. Coefficient B=m/CD*A
Altitude h max. deceler.
Max.heat flux stagnation point
Max. dynamicpressure
kg/m^2 Km [kW/m²] [mbar] EXPRESS 972 37,7 3000 2000 MIRKA 200 52 2000 500 IRDT2 36 68 800 150
Controlled Hypersonic Flight Air Data System and Flight Instrumentation
12 - 20 RTO-EN-AVT-116

In the EXPRESS and MIRKA capsule we had limited access to the stagnation point and therefore only pressure sensing ports could be installed. As port materials were used SIC In the EXPRESS capsule and TZM (a molybdenum alloy) in the MIRKA capsule.
6.3 The influence of vehicle mechanical and thermal structure The principal dimensioning of heat load sensors and pressure transducer can in principle be performed without knowledge of local vehicle structure. The local structure of the vehicle has however dominant influence of on the final design of a probe. As explained in the following table each probe assembly consists of the 4 basic components each with specific tasks. The sensor housing with mounting socket is the primary interface to the vehicles mechanical and thermal structure. The mounting socket has to compensate the hazardousness which re-sults from putting holes into the external thermal and internal mechanical structure of the ve-hicle. The design of the mounting depends therefore completely on the local vehicle structure. MIRKA and IRDT are demonstrative examples for complex and simple installations.
Component Tasks Sensor head Primary sensing on vehicle surface
Transmission to sensing instrument Thermal insulation between surface and inside
Sensor housing with mounting unit
Main interface to vehicle structure Support of sensor head Support for transducers Support for electrical sockets Pressure sealing between out - inside Compensation of differ. thermal expansion Thermal insulation
Sensing instruments (pressure trans-ducers, thermocouples)
Transformation of primary quantity in electrical signal
Electrical sockets and lines Connection to power supply and data acquisition system
Table 6: Probe components and specific tasks
RAFLEX II installation in MIRKA The double wall structure of MIRKA with RAFLEX installation is shown in Fig. 16. Within the MIRKA double walled structure a surface protected ablator SPA is located. The ablator is covered by the thin outer skin made of C/SIC, and the inner load carrying structure is made of CFRP. The ablator is positioned in a honey comb like structure, which allows the ablating gases to flow to the base where they are discharged, Fig. 16 shows that a very complex instal-lation design of RAFLEX sensors was necessary. The installation had to provide sealing be-tween outside and ablating room and sealing between ablating room and the vehicle inside. The installation had in addition to compensate various thermal expansions.
Controlled Hypersonic Flight Air Data System and Flight Instrumentation
RTO-EN-AVT-116 12 - 21

Fig. 16: RAFLEX II combined flux probe installation in MIRKA RAFLEX III installation on IRDT The rigid part of the IRDT capsule consists of a load bearing aluminum shell covered with ablator. At each installation location of a Raflex Probe the ablator was replaced by ceramic tile with 100 mm diameter. Thus the REFLEX III had only to pass through the aluminum shell the ceramic tile. Fig. 17 shows the installation detail. Due to experience gained with MIRKA smaller pressure transducers were selected and the total mass of one probe unit could be reduced from 1800 grams at MIRKA to 500 grams.
Fig.17: Installation drawing of RAFLEX III in stagnation point of IRDT
Calorimetric sensor
Double walled structure with internal ablator
Connection to pressure transducers
Thermocouples
Compensators for differen-tial thermal expansion
MIRKA combined heat flux pressure probe CFP, RAFLEX II
Controlled Hypersonic Flight Air Data System and Flight Instrumentation
12 - 22 RTO-EN-AVT-116

7. Electronic components and mass budget The following table shows as example the electrical supply and output data of RAFLEX III on IRDT.
Supply Voltage Current Output Voltage DPP Dyn. pressure probe ± 15 V 15 mA 0-10 V CFP 1Static probe ± 15 V 15 mA 0-10 V CFP 2 Static probe ± 15 V 15 mA 0-10 V CFP 3 Static probe CFP ± 15 V 15 mA 0-10 V CFP 4 Static probe CFP ± 15 V 15 mA 0-10 V Thermocouples 0 2 DPP, Type K 0- 50 mV 8 CFP1-CFP4 Type K 0-50 mV Total 5* ± 15 V
5 supply lines 75 mA
15 output lines
Table 7: Electrical supply and output data of RAFLEX III Power supply for sensors and acquisition of these data can either be provided by a central on board unit or by a experiment dedicated separate unit. We usually us for each pressure signal a scan rate of 30 HZ and for temperatures scan rates of 3-5 Hz. Typical mass budget of air data system Typical for the mass of 5 probe air data system may be the mass budget of the HTG RAFLEX III system mounted on IRDT2. The detailed component data are given in the following table.
Component Mass (Total/Component) Explanation Type of Interface Dyn. pressure probe 390 g Sensor head with mounting unit
200 g Head for pressure and calorimeter
Mechanical. and thermal structure
Pressure Transducer with signal conditioner
110 g Electric
Thermocouples 30 g 3 Thermocouples Electric Local harness 50 g 4 Combined flux probes 1360 g Sensor head with mounting unit
150 g Head for pressure and calorimeter
Mechanical. and thermal structure
Pressure Transducer with signal conditioner
110 g Electric
Thermocouples 30 g 3 Thermocouples Electric Local harness 50 g Total mass 1750 g
Table 8: Mass budget RAFLEX III air data system for pressure heat flux measurement
It also should be remembered that in the instrumentation mass budget the contributions of electrical wiring, which establish connection to the data logger, can not be neglected.
Controlled Hypersonic Flight Air Data System and Flight Instrumentation
RTO-EN-AVT-116 12 - 23

8. Validation and qualification testing of the probes
Validation and qualification testing shall assure the correct operation of a measurement sys-tem during flight operation. In principle we distinguish between the testing on the component and on the system level. As demonstrative examples for the different activities we use our RAFLEX system. Calibration tests of sensors Calibration test of sensors are usually conducted at simulated vacuum and pressure conditions during the development and before delivery of an instrumentation system. These tests also serve to identify appropriate transducers and electronic equipment Wind tunnel tests for determination of sensor functions Wind tunnel tests are usually necessary to validate the numerically derived sensor functions. Therefore either a complete model of the vehicle or a model of the vehicle nose section in-strumented with pressure ports and pressure sensors will be required. Fig. 18 shows the rigid nose part of the IRDT capsule during a wind tunnel test at Ma = 9 in our HHK facility.
Fig. 18: Schlieren picture of IRDT2 model in HHK win tunnel at Ma= 9
Controlled Hypersonic Flight Air Data System and Flight Instrumentation
12 - 24 RTO-EN-AVT-116

Heat load testing Heat load testing is part of the flight qualification for a re-entry experiment. A complete probe unit mounted in a simulated installation environment has to be tested. During these tests the actual heat load and pressure profile during re-entry shall be duplicated in a ground facility. These types of tests we had to conduct for each of our 3 RAFLEX systems. As the flight de-pendent time profile of q’ is difficult to simulate the model is usually tested with maximum heat load q’max for a time period, which assures that also the time integral of heat load is simulated. Fig. 19 shows the e IRDT RAFLEX III stagnation point probe after the heat load test in a Plasma Jet Facility (U-13UHFP at Babakin).
Fig. 19: IRDT2 RAFLEX III stagnation point probe after the heat load testing
Vibration testing Vibration testing is also part of the instrument qualification and is usually conducted on the subsystem and on completes system level. The test have to demonstrate that the instrument payload will accept the dynamic launch loads and that the instrument will not damage the vehicle. It should be noted that vibration tests show often unexpected failure of sensitive me-chanical components.
Controlled Hypersonic Flight Air Data System and Flight Instrumentation
RTO-EN-AVT-116 12 - 25

9. Some flight results with RAFLEX system RAFLEX I on EXPRESS Due to the start failure EXPRESS didn’t reach the nominal orbit and the experiments could not be activated. EXPRESS capsule re-entered uncontrolled after some orbits and was one year after launch recovered in Ghana in the middle of 1996. We thus were able to recover also our RAFLEX sensor system. The instrumentation showed no damage due to re-entry forces and heat loads. Even a re-calibration of the pressure transducers was possible. Thus EXPESS was partially successful for direct flight qualification of our system RAFLEX II on MIRKA MIRKA was launched on October 9, 1997 together with the Russian FOTON-11 by a SOJUS rocket from Plesetsk. After 14 days in orbit MIRKA the successful re-entry of MIRKA was initiated with a final parachute landing in Kazakhstan on October 23, 1997. Our RAFLEX system worked during the whole re-entry successfully. Fig. 20 shows a combined flux probe sensor head after the re-entry mission.
Fig 20: RAFLEX II sensor head after MIRKA re-entry
Fig. 21 shows the recorded pressures of the 4 Raflex probes during the complete re-entry, which covered a time span from 1150 to 1500 seconds. A detailed evaluation of the pressure oscillations for the period between 1300-1320 seconds is shown in Fig. 22. An evaluation of this data showed that MIRCA conducted a coning motion which is shown in an alpha – beta plane of Fig. 23 for a period of 6 seconds. This example demonstrates the high time resolution of the RAFEX II air data system.
Controlled Hypersonic Flight Air Data System and Flight Instrumentation
12 - 26 RTO-EN-AVT-116

Pressure Measurement SDS and KFA
-50
0
50
100
150
200
250
300
350
400
450
500
1150 1200 1250 1300 1350 1400 1450 1500time [s]
prob
e pr
essu
re [m
bar]
PR2
PR6
PR8
PR5
PR4
PR3
PR1
PR1, PR2 - SDSPR3, PR4 - KFA1PR5, PR6 - KFA2PR7, PR8 - KFA3 max. pressure
max. decelaration b
parachute-deployment
Fig. 21: Recorded RAFLEX pressure during MIRKA re-entry Pressure Measurement
Pressure Oscillation at the KFA Probes
0
0.1
0.2
0.3
0.4
0.5
0.6
0.7
0.8
0.9
1
1300 1302 1304 1306 1308 1310 1312 1314 1316 1318 1320
time [s]
prob
e pr
essu
re o
f the
KFA
no
rmal
ized
with
q
100
110
120
130
140
150
160
170
180
dyn.
pre
ssur
e q
[mba
r]
KFA2 PR6
KFA3 PR8
SDSKFA2 KFA1
KFA3
stagnation point region
SDS
+Z
+Y
KFA1 PR4
Fig 22: Evaluated RAFLEX pressure during 20 s time period, t=1300-1320s
Controlled Hypersonic Flight Air Data System and Flight Instrumentation
RTO-EN-AVT-116 12 - 27

Fig. 23: MIRKA re-entry, angle of attack versus slip angle, t = 1310-1316s
10. Conclusions The complete development process for hypersonic air data systems and for heat flux probes has been outlined on basis of RAFLEX installed in 3 different re-entry capsules. The experience showed that for each re-entry vehicle a new design was required by mission and vehicle structure. Thus for each new type of re-entry vehicle a dedicated development and design of air data system seems necessary. Only the experience, the basic design methodology and some identical type of mechanical and electronic parts may be used on different projects.
Flight Motion of MIRKA Evaluated from the Pressure Measurement
4
5
6
7
8
9
10
-6 -5 -4 -3 -2 -1 0
slip angle [°]
angle of attack [°]
t = 1310 - 1316s
Controlled Hypersonic Flight Air Data System and Flight Instrumentation
12 - 28 RTO-EN-AVT-116

Literature [1] G. Koppenwallner Definition of requirements and operational specifications for FADS WP1 Report, Flush and Laser Air Data System HTG TN-03-6, 2003 [2] L. Walpot, H. Ottens FESART/EXPERT Aerodynamic and Aerothermodynamic Analysis of the REV and KHEOPS Configuration ESTEC TN TOS-MPA/2718/LW [3] Liepmann H. W. Rhosko Elements of Gas Dynamics John Wiley, New York 1957 [4] Lewis C. H., Burgess III E.G. Altitude velocity table and charts for imperfect air AEDC–TDR-64-214, 1965 [5] Anonym Atmospheric and Space Flight Vehicle Coordinate Systems AIAA recommended Practice ANSI/AIAA R-004-1992 [6] W.R. Wells; W.O. Armstrong Tables of aerodynamic coefficients obtained from developed Newtonian expressions for com-plete and partial conic and spherical bodies at combined angles of attack and sideslip NASA TR R-127 [7] Häuser J. Dai Wuye Numerical Simulation for the Flush and LASER air Data System WP3 Report, Flush and Laser Air Data System CLE, Salzgitter, Germany 2004 [8] Allen.H. J.; Eggers,jr. A. J. A study of the motion and aerodynamic Heating of Missiles entering the Earth’s Atmosphere at High Supersonic Speeds NACA TN- 4047, Washington USA, 1957 [9] Chapman D. R. An approximate analytical method for studying entry into planetary atmospheres NACA TN 4276, Washington 1958, and NASA TR-11, Washington 1959 [10] Lees, Lester Laminar Heat Transfer over Blunt –Nosed Bodies at Hypersonic Speeds. Jet Propulsion Vol. 26, No. 4, 1956, pp. 259-269
Controlled Hypersonic Flight Air Data System and Flight Instrumentation
RTO-EN-AVT-116 12 - 29

[11] R. Müller Eigner, G. Koppenwallner RAFLEX an Air Data System for Re-entry Vehicles 4th European Symposium on Aerothermodynamics for Space Vehicles ESA SP 4876, 2002, pp. 457-464 [12] Cunningham J.A. et al. Shuttle Entry Air Data System, Pre-flight Testing and Analysis AIAA Journal of Spacecraft, Vol. 24, No. 1, 1987, pp. 33-39 [13] G. Koppenwallner, D. Johannsmeier, R. Müller Eigner High altitude free flight experiments and instrumentation developed for Brem-SAT and Express capsule 2nd European Symposium on Aerothermodynamics of Space Vehicles ESA SP 358, 1995, pp. 437- 444 [14] Auweter-Kurtz M., Hald H., Koppenwallner, G., Speckmann, H.-D. "German Re-entry Experiments on EXPRESS" IAF-94-1.3.192, 45th Congress of the International Astronautical Federation, Israel, 1994 [15] R. Müller Eigner, G. Koppenwallner Pressure and Heat Flux Measurement with RAFLEX 2 during MIRKA Re-Entry 3rd European Symposium on Aerothermodynamics of Space Vehicles ESA SP 426, 1999, pp. 685-689 [16] R. Müller-Eigner Instrumentierung der IRDT2 Kapsel mit RAFLEX III Abschlußbericht des Zuwendungsbescheids 50 JR 0082 HTG-Report 04-01, HTG 2004
Controlled Hypersonic Flight Air Data System and Flight Instrumentation
12 - 30 RTO-EN-AVT-116