control of peak stresses in tensile testing machine
TRANSCRIPT

AN ABSTRACT OF THE THESIS OF
JACK ALAN MITCHELL for the M. S. in Mechanical Engineering (Degree) (Major)
Date thesis is presented 7 7w Title CONTROL OF PEAK STRESSES IN TENSILE TESTING
MACHINE COMPONENTS SUBJECTED TO SHOCK LOADING
Abstract approved (Major professor)
The mechanical properties of materials at cryogenic tempera-
ores have been the subject of increasing interest during the past few
years, although very little actual materials testing has been done at
extremely low temperatures because of the high cost and low heat of
vaporaization of liquid helium. Recently, the Department of
Mechanical and Industrial Engineering at Oregon State University
initiated a research program of materials testing at liquid helium
temperatures, 4. 2° K. A specially designed cryogenic tensile testing
machine has been built employing a variable rate of loading and an
electronic chart drive recorder.
A Baldwin U -1 load cell was placed in the loading column of
the testing machine to measure the magnitude of the applied load. Pre-
vious experience has found that damage to the load cell can occur because
of the shock environment present upon fracture of a tensile specimen.
(77,(íe4, l_.

The object of this thesis is to analyze the effects of shock loading on
the cryogenic tensile testing machine and to develop a means of
reducing any shock environment seen by the load cell,
After determining that 92. 6 percent of the strain energy in the
loading column was stored in the tensile rod between the load cell
and tensile specimen, a theoretical analysis of the response of the
tensile rod and load cell to specimen fracture was made using the
mathematical model of a long, slender rod with fixed -free end condi-
tions and a suddenly removed axial load. The theoretical funda-
mental frequencies of the tensile rod and load cell were found to be
1570 and 5940 cycles per second, respectively.
In order to verify the problem of a shock environment imposed
on the load cell and to check the theoretical results, an experimental
study of the actual system was made. Strain gages on the tensile rod,
on the adapter above the load cell, and in the load cell measured the
motion response of these components to specimen fracture at room
temperature. An oscilloscope and camera were used to record the
results. The actual fundamental frequencies of the tensile rod and
load cell were 1080 and 3250 cycles per second, respectively, and
the assumed problem of shock environment on the load cell was
verified.
After studying many methods of absorbing and damping the
shock loading, it was decided to design and fabricate a shock

absorber having a piston and cylinder arrangement with a shock ab-
sorbing medium placed between the piston and cylinder head. Poly-
ethylene and polyester urethane foams were chosen as possible shock
absorbing mediums because of their excellent energy dissipation
properties in compression.
After the shock absorber was fabricated and placed in the test-
ing machine, its effectiveness was determined by following the exper-
imental procedures previously used. Results indicated that the initial
load release was adequately damped with polyethylene foam. Less
damping was noticed with the polyester foam. In both cases, however,
a delayed peak compressive force on the load cell occurred three
milliseconds after specimen fracture. When it was determined that
this force was due to the motion of the top plate of the testing ma-
chine, the jack on the top plate was spring mounted. Test results of
this system showed that the maximum peak compressive force follow-
ing specimen fracture was reduced to 15 percent of the tensile force
before fracture when polyethylene foam was used as the shock ab-
sorbing medium; however, when the polyester foam was used, the
test results indicated that the foam bottomed out. Polyethylene foam
thus proved to be a substantially superior solution to the problem
under consideration.

CONTROL OF PEAK STRESSES IN TENSILE TESTING MACHINE COMPONENTS
SUBJECTED TO SHOCK LOADING
by
JACK ALAN MITCHELL
A THESIS
submitted to
OREGON STATE UNIVERSITY
in partial fulfillment of the requirements for the
degree of
MASTER OF SCIENCE
June 1964

APPROVED:
Associate Professor of Mechanical Engineering
In Charge of Major
Head of Department, echanical and Industrial Engineering
Dean of Graduate School
Date thesis is presented G%
Typed by Ilia W. Atwood
Cyi 7/ fj

ACKNOWLEDGEMENTS
The author would like to express his deep gratitude to
Professor Roger D. 011eman of the Department of Mechanical
and Industrial Engineering for his welcome advice and constant
encouragement during the preparation and completion of the
thesis.
Appreciation is also extended to Professor Olaf G. Paasche
and Professor Charles E. Smith of the Department of Mechanical
and Industrial Engineering for their comments and technical
assistance and to Jack R. Kellogg, Mechanician for the Depart-
ment of Mechanical and Industrial Engineering, for the many
hours he spent on the fabrication of both the cryogenic tensile
testing machine and the shock absorber.

TABLE OF CONTENTS
INTRODUCTION
Page
1
THEORY AND ANALYSIS 7
Strain Energy of System 7
Response of Tensile Rod 9 Response of Load Cell 14
EXPERIMENTAL STUDIES - PART ONE 16 Experimental Setup 16 Results 20 Discussion 22
DESIGN OF ENERGY ABSORBER 25 Methods of Absorbing Shock 25 Shock Absorbers 25 Material Damping 27 Requirements and Selection of Absorber 29 Design Parameters 32 Shock Absorbant 34
Polyethylene Foam 35 Polyester Urethane Foam 36
Shock Absorber Assembly 37 Cylinder Assembly 37 Piston Assembly 43
EXPERIMENTAL STUDIES - PART TWO 51 Experimental Setup 51 Results 51 Discussion 55
CONC LUSIONS 59
RECOMMENDATIONS 61
BIBLIOGRAPHY 62
APPENDIX 64

LIST OF FIGURES
Figure Page
1 Cryogenic tensile testing machine 3
2 Baldwin type U -1 load cell 5
3 Longitudinally vibrating bar with fixed -free end conditions 9
4 Displacements and stress distributions for fixed - free rod 15
5 Circuit diagram for measuring apparatus 18
6 Response of tensile rod 21
7 Response of load cell 21
8 Response of adapter above load cell 21
9 Compressive stress - strain curve for polyethylene foam 33
10 Compressive stress - strain curve for polyester urethane foam 33
11 Shock absorber assembly 38
12 Flange 41
13 Cylinder assembly 42
14 Top cylinder cap 44
15 Bottom cylinder cap 45
16 Piston rod 47
17 Piston 48
18 Closeup of shock absorber and load cell as mounted in testing machine 50

Figure Page
19 Shock absorber disassembled 50
20 Experimental setup with shock absorber 52
21 Response of load cell using polyethylene as shock absorbing medium
22 Response of load cell using polyester urethane as shock absorbing medium
23 Response of load cell using polyethylene in shock absorber and spring mounts on the jack
24 Response of load cell using polyester urethane in shock absorber and spring mounts on the jack
Appendix Figure
25 Tensile rod
LIST OF TABLES
Table
53
53
56
56
64
1 Classification and Explanation of Damping Modes 28

NOMENCLATURE
A = area, inches
b = flange thickness, inches
c = E /p 'f = velocity of wave propagation, inches per second
C,D = constants of integration
E
weld thickness, inches
= modulus of elasticity, pounds per square inch
f = frequency, cycles per second
F, G = constants of integration
h = thickness of foam material, inches
i = positive integer
n
=
=
=
P =
R(x) =
S(t) =
t =
length of tensile rod, inches
torque, inch -pounds
positive integer
axial force, pounds
function of x
function of t
time, seconds
T = load reduction factor
u(x,t) = longitudinal displacement of tensile rod, inches
U = energy capacity of shock absorbing medium, inch -pounds per cubic inch
d =
L
M

V =
W =
x =
y =
=
e =
p =
o- =
volume, cubic inches
strain energy, inch -pounds
axial space coordinate
deflection, inches
2Trf = angular frequency, radians per second
strain, inches per inch
mass density of rod, pound seconds squared per inches to the fourth power
normal stress, pounds per square inch
= shear stress, pounds per square inch
P
s

INTRODUCTION
The mechanical properties of materials at cryogenic tempera-
tures have been the subject of extensive interest during the past few
years, and several laboratories have been actively engaged in mater-
ials research and testing at these temperatures. The majority of
this work, however, has been done in the temperature ranges of
liquid oxygen, nitrogen, and hydrogen. The transfer and storage
boil -off rates of these liquefied gases are not excessive and their
liquefaction costs are low.
Very little actual materials testing has been done at lower
temperatures using liquid helium because its heat of vaporization is
extremely low when compared to that of liquid oxygen, nitrogen, and
hydrogen, and its liquefaction cost is high enough to prohibit or
greatly hinder its use in the majority of materials testing programs.
Most researchers, instead, have extrapolated their data from the
known materials properties at higher temperatures.
Recently, the Department of Mechanical and Industrial
Engineering at Oregon State University decided to inaugurate a
research program of materials testing at cryogenic temperatures,
with an emphasis on temperatures in the region of liquid helium.
The actual development of the program began when Carl Fullman
wrote a Master's thesis on "The Design of a Mechanism for Tensile

2
Testing in a Liquid Helium Dewar" (8). The object of his thesis was
to design a system for tensile testing at liquid helium temperatures
that would be inexpensive and efficient, and that would eliminate the
need of a local supply of liquid helium. Carl Fullman's design will
enable the research worker willing to make a modest investment to
carry on a tensile testing program at extremely low temperatures.
The main feature and advantage of the design is that it enables the
cryogenic liquid shipping container to be used as the testing chamber,
thus eliminating the drastic losses incurred when the liquid helium is
transferred to a separate cryostat.
The development of Oregon State University's low temperature
materials testing program was continued when Gordon Hull wrote his
Master's thesis on "The Design of a Variable Strain Rate, Auto-
graphic Recording, Tensile Testing Machine" (13). The purpose of
his thesis was to design a tensile testing machine that would be par-
ticularly adaptable for use with the apparatus designed by Carl
Fullman. The testing machine, shown in Figure 1, has a load capac-
ity of 20, 000 pounds and a variable strain rate ranging from zero to
one inch per minute. A history of the entire load- deformation curve
is obtained by using a Honeywell -Brown Electronik chart recorder.
The load is measured through a Baldwin- Lima - Hamilton Type U -1
load cell and the deformation is obtained by a mechanical drive

3
Transmission
Jack
Top Plate
Vertical Support
Reaction Beam
Compression Column
Yoke Assembly
Specimen
Dewar Rotation Assembly
Load Cell
Tensile Rod
1 r
( / iiii/ Base
I-
Dewar
70
1
Scale: 3/32 inch = 1 inch
50
Figure 1 Cryogenic tensile testing machine
¡-
I' 1 == F_ --=-
II
I
.

4
connection between the jack and the chart -drive of the recorder.
This testing machine has been designed primarily for low tem-
perature testing; however, since Oregon State University does not
have a testing machine capable of recording a complete load -
deformation curve, it was also designed so that tensile tests can be
performed at room temperatures and elevated temperatures.
The Baldwin -Lima- Hamilton load cell used in the testing
machine is essentially a resistance strain bridge having a structural
configuration similar to that shown in Figure 2. The strain gage ele-
ments are bonded to the surface of the strain member.
It has been found from previous experience that, after using the
load cell in a considerable number of tension tests and having it di-
rectly connected in the loading column, it will give inaccurate read-
ings. 1 The apparent reason for this decrease in accuracy is that
repeated shock loading of the load cell, which is thought to occur
when the tensile specimen fractures, eventually causes the bonding
between the strain gages and the strain member to fail. Since the
load cell is one of the more expensive items in a testing machine and
the validity of any test results depends on its accuracy, precautions
1 011eman, Roger D. , Associate Professor of Mechanical Engineer- ing, Oregon State University. Private communication. Corvallis, 1963.

Shielded cable
; is
SIs 1
&,... : \\\ \\ \ \ o 2\ \ \ \ \ \\\\\\ 1 \ ` .` &
Strain member
Strain gage
8.50
Figure 2. Baldwin type U -1 load cell
Housing
5.00
r \,
t
Ul

should be taken to protect the load cell from as much shock environ-
ment as possible.
The objective of this thesis is to analyze the system response
to shock loading on the cryogenic tensile testing machine at Oregon
State University and to develop a means of controlling any peak shock
loads on the load cell.
6

7
THEORY AND ANALYSIS
An analysis of the system response to shock loads incurred
when the specimen fractures must be made so that suitable design
parameters for an energy dissipating device can be determined.
Since all members of the testing machine are affected by the condi-
tions of loading and unloading of the test specimen, the amount that
each member contributes to the shock environment of the load cell
must be found. One method of establishing their relative importance
is to calculate the strain energy of each member of the system under
maximum load.
Strain Energy of System
The strain energy of the system can be determined from the
formula:
Py Strain energy =
where P is the load imposed on the system and y is the total
deflection of all members in the system (12, p. 229).
The deflections of the members of the testing machine, under a
load of 20, 000 pounds, were calculated (see Appendix). The results
of the calculations are as follows:

Member Deflection
Top plate 0. 0040 inches Vertical supports 0. 0010 Reaction beam attachments 0. 0093 Reaction beam 0.0010 Jack screw (fully extended) 0. 0028 Adapter 0. 0018 Load cell 0.0050 Adapter 0. 0018 Tensile rod 0. 1565 Yoke assembly 0.0037 Tensile specimen (approximate) 0.0150 Compressive column 0.0426
Total 0.2465 inches
When a specimen fractures, the load cell will be affected pri-
marily by the energy dissipated in the top plate, jack screw, tensile
rod, yoke assembly, adapters, specimen, and the load cell itself.
These members have a total deflection of 0. 1856 inches, and their
strain energy under the 20, 000 pound load is 1856 inch -pounds. The
tensile rod, tensile rod adapter, yoke assembly and specimen contain
1720 inch -pounds, or 92.6 percent of the strain energy acting upon the
load cell. Therefore, these members constitute the critical area
when determining the response of the system to the shock environ-
ment caused by specimen fracture, and the analysis of the thesis will
be based on this premise.
8

Response of Tensile Rod
For the purpose of analysis it may be assumed that the tensile
rod is rigidly attached to the load cell. The load cell, in turn, is
rigidly mounted to the top plate of the testing machine. The effect of
the jack screw in the following analysis is negligible and the adapter,
yoke assembly and specimen are to be considered as an extension of
the tensile rod.
Since the load cell and top plate are relatively stiff they may be
assumed as rigid members with little error. Thus the problem to be
solved will be that of a long, slender rod, fixed at its upper boundary
and free at its lower boundary, as shown in Figure 3.
Figure 3. Longitudinally vibrating bar with fixed -free end conditions
9
P

10
The axial force, P, initially exists at the free end of the bar. When
this force is suddenly removed, longitudinal vibrations are excited in
the bar, and each increment of length in the bar is alternately com-
pressed and extended. Since the bar is relatively slender, inertia
forces in the lateral direction can be neglected. Plane cross -
sections are assumed to remain plane so that internal forces in the
bar are essentially axial.
The stress - strain relationship is assumed to obey Hooke's
Law and, therefore, can be stated as:2
o- au (x, t) = E e = E ax
The governing differential equation of motion, assuming a con-
stant cross- sectional area, is (22, p. 240):
a2u E a2u
a t2 ax2
Since linear displacement along the longitudinal axis of the rod
is the only space variable there can be only two independent boundary
conditions. They are:
u(o,t) = 0 (displacement at fixed end)
and
au ax )
= L = 0 (stress at free end)
2 Definitions for the symbols used in this thesis can be found in the Nomenclature.
P
x É j
II

11
The initial conditions, from the requirements stated previously, are:
u (x, o) = ex (elongation along the x axis)
and
au at )t = 0
(velocity of tensile rod).
Many authors of vibration textbooks, such as Timoshenko (21,
p. 303) and Tong (22, p. 252), have included the solution to the dif-
ferential equation in their textbooks. Therefore, only the basic
steps leading up to the solution will be outlined below.
Using the separation of variables technique assume that the
displacement, u(x, t), can be written as:
u(x, t) = R(x) S(t)
The differential equation becomes:
R a2S E .a2R
S
a 2 P ax 2
Let E = c 2. Then the equation can be rewritten as:
als a t2
S = c
a2R
2 8 x
= 2
R
where 13 is a constant which must be negative so that S(t) does not
grow with time. Thus, the variables have been separated and can be
written as the two following independent differential equations:
P
0
and
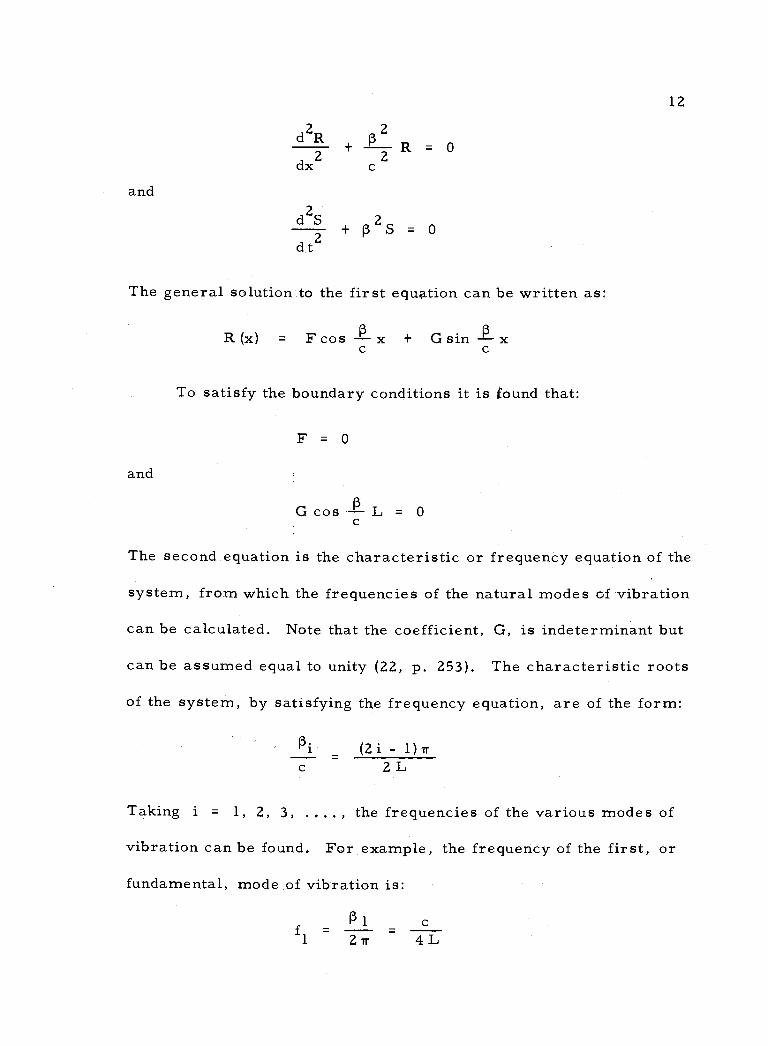
d2R 2 + R = 0
dx
d t2 + ß2S = 0
The general solution to the first equation can be written as:
and
R(x) = Fcos ß x + Gsin ß x c c
To satisfy the boundary conditions it is found that:
= 0
G cos ß L= 0
12
The second equation is the characteristic or frequency equation of the
system, from which the frequencies of the natural modes of vibration
can be calculated. Note that the coefficient, G, is indeterminant but
can be assumed equal to unity (22, p. 253). The characteristic roots
of the system, by satisfying the frequency equation, are of the form:
ßi
c
(2i - 1)7 2L
Taking i = 1, 2, 3, .... , the frequencies of the various modes of
vibration can be found. For example, the frequency of the first, or
fundamental, mode of vibration is:
fl ßl c
2, Tr 4L
2 c
2 d
F

13
The solution to the second differential equation can also be
written in trigonometric form as:
S(t) = C cos (3t + D sin ßt
The general solution for u(x, t) then becomes:
u(x, t) sin ß x [ C cos ß t + D sin ß t]
Using the initial conditions the constants, C and D, can be deter-
mined. They are:
and
8EL( -1)1 -1 for 1, 2, 3, .
(2i -1)2 Tr2
= 0 for 1, 2, 3, ..
The complete series solution for u(x, t), after substituting for C
and 3 , is then:
sin (2i- 1) x 2L
Returning to the assumption that:
au a- (x, t) = E
ax
cos (2i- 1)Trct 2L
the theoretical stress distribution in the rod can be found at any
instant during the period of vibration. Its equation is:
=
.
D. i
i -1 82L ( -1)
1r i
(2i- 1) u(x, t) -
2

o (x, t) _ 4E
Tr
i=1
-1)i - 1
2i - 1 cos
14
2i - 1)rrx (2i - 1) Trct 2L cos 2L
The physical significance of the above equations for deflection
and stress distribution can be better understood if they are inter-
preted graphically. Figure 4 gives the graphical representation for
the displacement and stress distribution as a function of time for
various distances along the length of the rod.
Theoretically, since damping is neglected, the maximum
amplitudes of the motion response and stress wave will remain con-
stant with time; however, because damping actually exists in the
system the peak stresses decay with time. The higher modes of
vibration generally disappear rapidly and the fundamental mode per-
sists for a longer period of time (11, p. 37 -5).
The fundamental frequency of vibration of the tensile rod was
found to be 1570 cycles per second, and the calculations leading to
this result can be found in the Appendix.
Response of Load Cell
Assuming that the load cell is also a fixed - free rod and fol-
lowing the theoretical analysis developed for the tensile rod, the
fundamental frequency of vibration of the load cell was calculated to
be 5940 cycles per second.

u(x, t) ME, A
s----- L
15
x Elongation, u(x, t) - Stress DistributioMr(x, t)
p
u(x, +
t) 0-(x, t) P
2L 4 Op
P
rm A 4L
et r , ct
PL 4AE /
/ A / .
PL 2AE
4...
/// ///
3L
4
3PL r 4AE
re
L
PL AE
-
Figure 4. Displacements and stress distributions for fixed -free rod
\\ }-- P
\`V
o
-
2,L rig-
L
4
2
---I .
. A 0 0
1

16
EXPERIMENTAL STUDIES - PART ONE
The theoretical analysis developed for the response of the
system is, at best, a good approximation of the actual conditions
seen by the system since the theory has been based on assumptions
involving an idealized system. It has, however,supportedthe origi-
nal supposition that peak shock loads caused by rapid stress rever-
sals do exist. Therefore, an experimental study of the actual system
response to shock loading conditions was initiated to verifythe exist-
ence of the problem and to improve uponthe results of the theoretical
analysis, enabling a better design to be made for an energy dissipat-
ing device.
Experimental Setup
The author built and completed the cryogenic tensile testing
machine described in the introduction. This testing machine was
used to initiate the shock loading conditions present upon the fractur-
ing of a tensile specimen. Gray cast iron tensile specimens were
used to insure brittle fracture and notches were machined in the
specimens so that fracture occurred in the loading range of 3000 to
4000 pounds. This range of maximum loading was selected so that
adequate protection would be afforded the load cell against possible
damage from peak stress reversals.

17
Two SR -4 strain gages, type A -18 having a one -eighth inch
gage length, were attached three inches from the upper end of the
tensile rod and one inch above the load cell on the adapter between
the jack and the load cell. These gages were used to determine the
strain reversals below and above the load cell. The strain gages
mounted on the strain member of the load cell form a complete
bridge circuit and were used to obtain a direct reading of the re-
sponse of the load cell.
The change in output voltage in each gage, as a strain wave
passed its position in the loading column, was displayed on the
screen of a cathode ray oscilloscope after being suitably amplified.
A functional diagram of the measuring equipment is shown in
Figure 5.
Shielded leads were used to connect the strain gages to an Ellis
strain gage amplifier, model BAM -1. The SR -4, A -18, strain gages
were connected to the two arm bridge input terminals and a 120 ohm
compensating resistance box was used. Since the load cell is a
complete bridge circuit it was connected to the four arm bridge ter-
minals and no compensating resistance was needed.
The output of the bridge amplifier was connected to the input of
a Tektronix 535 oscilloscope having a 53 -D differential high gain DC
preamplifier. The unbroken test specimen was placed in series with

Adapter
Load Cell
C
A B C D
Ellis BAM -1 Bridge Amplifier
OA QC Q B
OD Q Scope
Tensile Rod
Resistance Box
Specimen
1. 5 volts
II
Tektronix 535 Oscilloscope -
53-D plug -in unit
-0 Scope Input
Ext Trigger
Gnd
Figure 5. Circuit diagram for measuring apparatus
B

19
a 1. 5 volt telephone battery forming a triggering circuit for the
oscilloscope. The fracturing of the specimen broke the circuit,
triggering a single sweep on the oscilloscope screen. A Fairchild
Poloroid oscilloscope camera was used to record the response
curves.
When a test was run the specimen was placed in the loading
column, force was applied through the jackscrew, and the specimen
was fractured. The camera shutter was opened as the load was ap-
plied and closed immediately after fracture.
Only one gage at a time could be connected to the bridge am-
plifier because both the oscilloscope and amplifier were capable of
transmitting only one signal. Thus, in order to get a complete pic-
ture of the response of the loading column, three separate tests had
to be run. Because the specimens did not all break at the same load,
the maximum amplitude differs with each test. This is a point which
should be kept in mind when the records of the various tests are
examined.
The results are essentially strain verses time curves; however,
prior to actual testing, the strain readings were calibrated so that
the vertical scale on the oscilloscope graticule read 1000 pounds of
load per centimeter. Since each strain gage has its own gage factor
-

20
and sensitivity the calibration factor for strain -to -force transforma-
tion varied with each gage.
Results
The results of the experimental study are shown in Figures 6
through 8. Figure 6 shows the response of the tensile rod to the
fracturing of the specimen. This curve is typical of shock motion.
The fundamental frequency can be seen with several higher frequen-
cies superimposed upon it. The fundamental frequency calculated
from this photograph was 1080 cycles per second while the theoreti-
cal fundamental frequency was found to be 1570 cycles per second.
The actual frequency is thus 68.8 percent of the theoretical frequency.
From an energy consideration it is known that the strain energy
varies with the square of the applied load (10, p. 232). The equation
of this relationship is:
Strain energy = 2AE P2 L
By measuring the amplitudes of successive peak loads in Figure 6,
and by using the above formula relating strain energy to applied load,
the approximate percent of strain energy lost per cycle of vibration
can be determined. The experimental data for the tensile rod shows
that an average of 66 percent of the strain energy remaining in the
rod was lost per cycle.

21. 4000
200 ' I 1000 !IWIV./
0 _I11111l1! .°a 1000 --1WF I+
2000 _n -3000 - r1116;
0 0.5 1.0 1.5 2.0 2.5 3.0 3.5 4.0 Time, milliseconds
Figure 6. Response of tensile rod
4000
2000 a.u....m.. 1000 -V
a 0 -®, /111110111111
s 1000 - 1'111 2000 -
-3000 i 1000
a 12-
0 .
á 1000-
2000
-3000-m
I I I I
0 0.5 1.0 1.5 2.0 2.5 3.0 3.5 4.0 4.5 5.0 Time, milliseconds
Figure 7. Response of load cell
3000 - 2000
I 1 I 1 1
0 0.5 1.0 1.5 2.0 2.5 3.0 3.5 4.0 4.5 5.0 Time, milliseconds
Figure 8. Response of adapter above load cell
; ;
1
-1 I i .-40.
3000
; I T TI T
'
, '
x
,! -
i

22
The response of the load cell to the shock motion of the tensile
rod can be seen in Figure 7. This curve is a typical response to the
type of shock environment seen in Figure 6. The fundamental fre-
quency is the same as that found for the tensile rod, and higher
vibration frequencies can be seen superimposed on it. The one
higher mode that can be easily distinguished occurs at a frequency of
3250 cycles per second, and since this mode persists for a relatively
long period of time it can be assumed to be the fundamental frequency
of the load cell.
Figure 8 is the response of the adapter above the load cell to
shock loading conditions. One peak stress reversal occurs one milli-
second after specimen fracture. Two other stress reversals occur
at three and nine milliseconds respectively after fracture.
Discussion
The actual boundary conditions for both the tensile rod and load
cell lie somewhere between the fixed - free boundary conditions of the
idealized theoretical analysis and the boundary conditions of a free -
free rod. The introduction of additional constraints into a system,
such as replacing the free end of a rod with a fixed end, will raise
all the natural frequencies of the system (22, p. 292). Thus, the
natural frequencies of the actual system should be lower than those

23
obtained theoretically, and the experimentally determined funda-
mental frequencies of 1080 cycles per second for the tensile rod and
3250 cycles per second for the load cell may be considered as a good
check on the respective theoretical fundamental frequencies of 1570
and 5940 cycles per second.
The first stress reversal in the load cell resulted in a com-
pressive stress almost as great as the original tensile stress; how-
ever, subsequent stress reversals yielded much lower peak stress
levels. The experimental data shows that material damping in the
system is apparently an important part of the response characteris-
tics of the load cell. After a time elapse of four milliseconds, al-
though stress reversals continue to occur, they are reduced to such
an extent that they can be considered insignificant.
Perhaps the most important result obtained from the response
curve of the load cell is the fact that rapid stress reversals do occur,
substantiating the assumed problem upon which the thesis is based.
The major stress reversals in the adapter that occur three mil-
liseconds and nine milliseconds after specimen fracture give an indi-
cation that some of the strain energy given up by the tensile rod is
transferred to the structural components of the testing machine.
These components apparently become excited in their natural fre-
quencies and, together with the inertia effects of the loading column,
..

24
induce a strain on the adapter as shown in Figure 8.
The strain gages were mounted on the surfaces of the tensile
rod, load cell, and adapter; therefore, the alternate contractions
and expansions in the lateral direction, resulting from Poisson's
effect, are a contributing factor to the response characteristics of
the system (19, p. 33).

25
DESIGN OF ENERGY ABSORBER
Methods of Absorbing Shock
There are basically three methods of reducing the response of
a component to shock (11, p. 1 -3):
1. The natural frequency of the component can be altered to eliminate resonance.
2. An auxilliary mass can be attached to the system by a spring in such a way that the vibration of the system is reduced.
3. The energy in the system can be dissipated through some external or internal means.
Of these three methods, energy dissipation is the most convenient to
apply to the problem of protecting the load cell. The strain energy in
the system can be dissipated by placing a shock absorber in the load-
ing column and by using the structural damping characteristics of the
testing machine.
Shock Absorbers
Shock absorbers are used to cushion the forces of velocity
transition of a moving object, usually from an initial velocity to zero
velocity. Since all moving masses possess energy some means must
be employed to transfer this energy elsewhere when the given mass
is brought to a stop. Shock absorbers accomplish this energy
26
transfer by absorbing the energy themselves or by transferring it to
some other mechanism.
Shock absorbers may be classified as either regenerative or
non -regenerative devices (7, p. 177). In regenerative shock ab-
sorbers the energy is immediately transferred back to the load in
the form of "spring- back" or 'bounce ". Frictional forces within
these devices control the amount of energy reversal and allow them
to be used successfully for most cushioning applications. Examples
of regenerative absorbers include solid springs, elastomers, and
compressible fluids. They are relatively simple to fabricate, inex-
pensive, easy to apply and maintain, and generally have a long life;
however, they do have spring -back and their stopping motion is non-
uniform so that the stopping force increases as the stopping distance
nears its maximum.
Non -regenerative shock absorbers transfer the energy of the
moving load during the stopping stroke into thermal energy. Thus,
if the absorber is correctly designed, the mass is left motionless at
the end of the stroke. Typical examples of non -regenerative shock
absorbers include frictional devices, and constant and variable ori-
fice dampers -- commonly known as dashpots. These energy dissipa-
tors are advantageous when any motion reversal or spring -back is
detrimental to the system. The variable orifice damper provides
..

27
the best possible means of cushioning moving loads that are brought
to rest. Its fabrication, however, can be quite complex.
Material Damping
Another mode of energy dissipation is material, or structural,
damping which refers to the energy dissipation properties of mater-
ials or systems under cyclic stress but excludes energy transfer
devices such as shock absorbers (14, p. 2). Generally, the problem
of energy dissipation in engineering materials and structures can be
solved only in an approximate, simplified form since the exact mode
of damping in any specific case usually is not understood. Practical
considerations dictate the use of damping terms chosen so that the
governing equations of motion can be solved. It is assumed, with
justification in most cases, that the solution thus obtained is a good
approximation to physical reality.
Damping in any material usually can be classified as one or
more of the following: viscous, coulomb, air, hysteresis, complex,
negative, relaxation, magnetic, and slip. A detailed explanation of
these damping modes can be found in Table 1.
In all real vibrating systems a combination of at least two types
of damping will exist. Frequently, however, only one mode is pre-
dominant and the analysis can be based on that mode. Frequency

28
Table 1. Classification and Explanation of Damping Modes (14, p. 2)
(a) Viscous Damping force varies as velocity. Characteristic of low velocity motion in a high viscosity fluid: dashpots, shock absorbers.
(b) Coulomb Damping force is kinetic frictional force. Charac- teristic of dry sliding surfaces: brakes, clutches.
(c) Air
(d) Hysteresis
(e) Complex
(f) Negative
(g) Relaxation
(h) Magnetic
(i) Slip
Damping force varies as square of velocity. Char- acteristic of high velocity motion in low viscosity fluid: body in turbulent air at less than 0.6 Mach.
Damping energy varies as function of maximum stress, usually a power function. Energy loss re- sults from internal friction in solid bodies.
Damping force is proportional to displacement and in phase with velocity. Included as complex stiff- ness coefficient. An artifice to cover all cases of small damping.
Damping force feeds energy into system. Always results in system instability: oscillator with posi- tive feedback.
Damping force with both positive and negative characteristics. Results in the existence of a limit cycle: Prony brake, multivibrators.
Hysteresis energy loss varies as the product of frequency and maximum flux density to 1.6 power. Eddy current energy loss varies as the product of frequency squared and the maximum flux density squared. Used for damping of servo motors and electrical measuring instruments.
Essentially Coulomb damping except that slip dis- tribution gives an energy dissipation which does not, in general, vary as the first power of the am- plitude of motion: built -up structures, joints.

29
response characteristics for a system having viscous or Coulomb
damping can be obtained without much difficulty. Systems having
other forms of damping, on the other hand, are extremely difficult
to analyze even if the exact damping expression is known.
It is well known that in practical cases the damping must be
fairly small and the motion nearly sinusoidal in order to make use
of approximations necessary to solve the problem (14, p. 7). In
these cases the behavior of the theoretical system will often follow
closely that of the actual system. If these approximations for damp-
ing cannot be determined or if a reasonable choice of damping terms
leads to an unmanageable equation of motion, then the emperically
derived expressions for energy loss per cycle or the actual stress-
strain curves for the material must be used.
Since in all practical applications damping is one of the more
elusive variables that a designer must use, it is important that the
extent of the damping approximations be thoroughly investigated for
each case.
Requirements and Selection of Absorber
The ideal shock absorber, for adequate reduction of peak
stress reversals in the load cell, should meet the following require-
ments:

30
1. A large quantity of mechanical energy should be absorbed within a short period of time.
Z. The force transmitted to the load cell should be much smaller in magnitude than the maximum force exerted on the system just prior to specimen fracture.
3. A large part of the material's stress - strain curve should contain a constant stress.
4. The energy released by the shock absorber must not be detrimental to the integrity of the system.
5. The natural frequency of the absorber must be lower than that of the tensile rod so that excitation of both the load cell and tensile rod is small.
6. It must perform its functions within a limited space.
7. Its fabrication should be simple and economical.
8. It should be able to withstand repeated loading with no permanent deformation.
Many practical methods of absorbing and damping the shock loading
were analyzed and their characteristics were compared with the re-
quirements of the system as set forth in this section. After a care-
ful study of various methods it was found that the properties of
cushioning materials, such as the flexible plastic foams, correspond-
ed closely with the system's requirements. Thus, it was decided
that the energy dissipating device be designed around such a
material.
All materials utilized to provide cushioning may be classified
as either elastic (flexible) or inelastic (crushable). Materials placed

31
in the first category have a permanent deformation of not more than
ten percent after compression to a 65 percent strain level (11,
p. 41 -13). In order to satisfy the requirements of the system, the
elastic material should be used, thus eliminating the need to replace
the material after each test.
The excellent compressive energy absorbing properties of a
cushioning material can be employed by designing a shock absorber
having a piston and cylinder arrangement with the cushioning mater-
ial placed between the piston and cylinder head. Such a design for
the application under consideration was first suggested by Gordon
Hull (13, p. 43) and appears to be the simplest and most effective
method adaptable to the system. All further analysis and design of
the shock absorber will be based on this design proposal.
Among the elastic cushioning materials available that can be
incorporated into the shock absorber design are the following: poly-
ester and polyether urethane foam, polyethylene foam, latex hair,
and reclaimed latex foam. Of these materials polyester urethane
and polyethylene foams have the best energy absorbing properties
and will be studied further.
The quantity of cushioning material required for a shock ab-
sorber can be determined by the amount of energy that must be
stored and dissipated by the material. The strain energy stored in

32
a unit volume of the resilient material may be defined in terms of
stress and strain and is equal to the area under the stress - strain
curve. Since the elastic modulus varies with strain for viscoelastic
materials, a graphical integration of the stress - strain curve must
be used to obtain the amount of energy stored for a given strain.
Compressive stress - strain diagrams for polyester and polyethylene
foams are shown in Figures 9 and 10.
Design Parameters
The parameters for the shock absorber design, from both
theoretical and experimental considerations of the system, are as
follows:
1. Strain energy to be dissipated under maximum load 1720 inch - pounds. (Theoretical)
2. First natural frequency of tensile rod - 1080 cycles per second. (Experimental)
3. First natural frequency of load cell - 3250 cycles per second. (Experimental)
4. Approximate reduction per cycle of strain energy in load- ing column when tensile rod is rigidly attached to load cell - 66 percent. (Experimental)
5. Time required for significant stress reversals to damp out - approximately 4 milliseconds. (Experimental)
As noted above, it was found that approximately 66 percent of
the total energy stored at the beginning of each cycle was dissipated

60
U 50
2
F 40 v
ó 30
vi N
i. 20
N
10
o U
0
6
0 10 20 30 40 50 Deflection, Percent
60 70
Figure 9. Compressive stress - strain curve for polyethylene foam (6, p. 3)
80
o 0 10 20 30 40 50
Deflection, Percent 60 70
Figure 10. Compressive stress - strain curve for polyester urethane foam (11, p. 41 -15)
80
33
u 5 ...
m F
H 4
3 a
fIl Q)
2 a)
n1
1
o U
á

34
at the end of that cycle. The maximum compressive stress of the
tensile rod is exerted on the load cell at the end of a half cycle.
Assuming that the amount of energy dissipated internally is a linear
function of the percent of a cycle completed, 33 percent of the energy
initially in the system will be dissipated in the structure by the time
the initial peak compressive stress reaches the load cell. For the
maximum loading condition of 20,000 pounds, the internal energy
dissipation at the end of the first half cycle should amount to 570 inch -
pounds, leaving 1150 inch- pounds to be dissipated either in succeed-
ing cycles or by another means. It should be noted that the basis
for this assumption is the experimental data obtained while the ten-
sile rod was rigidly attached to the load cell.
Shock Absorbant
The volume, V, of energy absorbing material needed to dissi-
pate the strain energy, W, of the system in one cycle is:
V = W
where U represents the energy capacity per unit volume of cushion-
ing material and is equal to the area under the stress - strain curve
of the material. It is desirable to absorb all of the strain energy in
the tensile rod during the first compressive stroke of the shock ab-
sorber and the preliminary design will be calculated on this basis.
U
35
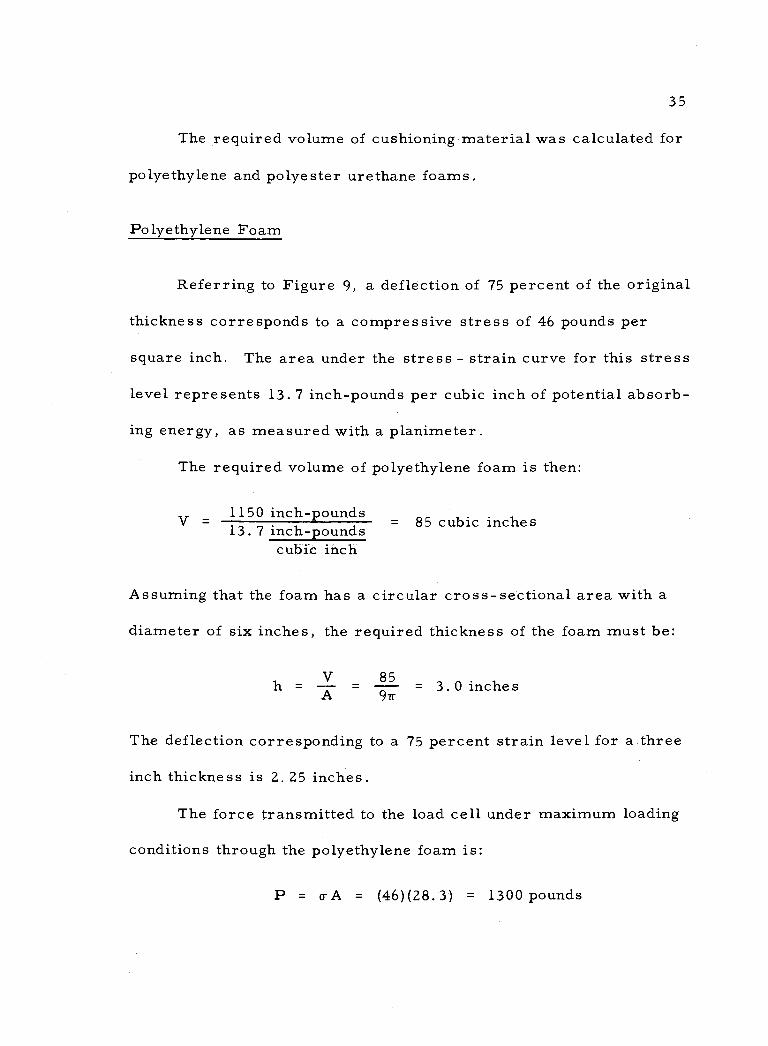
The required volume of cushioning material was calculated for
polyethylene and polyester urethane foams.
Polyethylene Foam
Referring to Figure 9, a deflection of 75 percent of the original
thickness corresponds to a compressive stress of 46 pounds per
square inch. The area under the stress - strain curve for this stress
level represents 13.7 inch -pounds per cubic inch of potential absorb-
ing energy, as measured with a planimeter.
The required volume of polyethylene foam is then:
V = 1150 inch-pounds 13. 7 inch -pounds
cubic inch
= 85 cubic inches
Assuming that the foam has a circular cross - sectional area with a
diameter of six inches, the required thickness of the foam must be:
h = V
= 85
= 3. 0 inches
The deflection corresponding to a 75 percent strain level for a three
inch thickness is 2.25 inches.
The force transmitted to the load cell under maximum loading
conditions through the polyethylene foam is:
P = o-A = (46)(28.3) = 1300 pounds
36
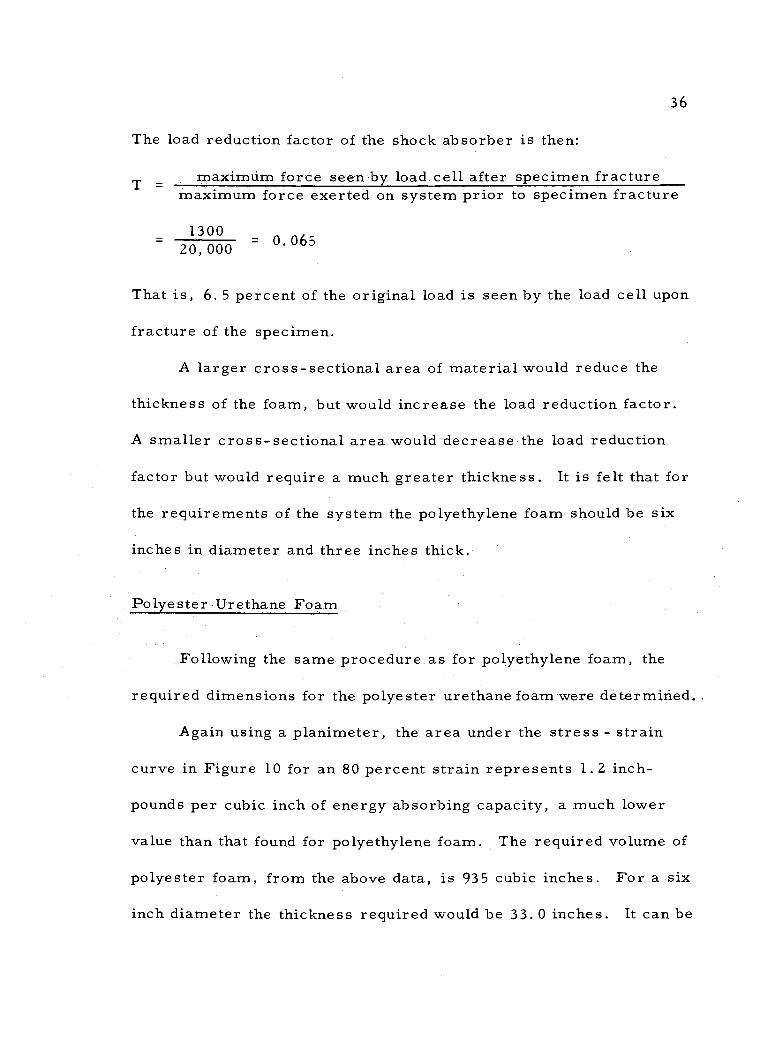
The load reduction factor of the shock absorber is then:
T = maximum force seen by load cell after specimen fracture
maximum force exerted on system prior to specimen fracture
1300 _ 0.065 20,000
That is, 6. 5 percent of the original load is seen by the load cell upon
fracture of the specimen.
A larger cross - sectional area of material would reduce the
thickness of the foam, but would increase the load reduction factor.
A smaller cross - sectional area would decrease the load reduction
factor but would require a much greater thickness. It is felt that for
the requirements of the system the polyethylene foam should be six
inches in diameter and three inches thick.
Polyester Urethane Foam
Following the same procedure as for polyethylene foam, the
required dimensions for the polyester urethane foam were determined.
Again using a planimeter, the area under the stress - strain
curve in Figure 10 for an 80 percent strain represents 1.2 inch -
pounds per cubic inch of energy absorbing capacity, a much lower
value than that found for polyethylene foam. The required volume of
polyester foam, from the above data, is 935 cubic inches. For a six
inch diameter the thickness required would be 33.0 inches. It can be
-

37
seen that polyester foam theoretically is not a suitable shock absorb-
ing medium for the load cell because of the great volume of material
required.
Shock Absorber Assembly
As shown in Figure 11 the basic shock absorber assembly is a
piston and cylinder arrangement. For ease of fabrication the cylinder
was made from seamless steel tubing with flanges welded at both ends.
The cylinder caps were then bolted to the flanges after insertion of
the foam material and piston assembly. The piston was made of one -
half inch steel plate and the piston rod was bolted to the piston.
Cylinder Assembly
The cylinder was made of Shelby seamless thickwalled tubing- -
a cold drawn AISI 1020 steel. Its yield stress is 62,000 pounds per
square inch and its tensile strength is 74, 000 pounds per square inch
(20, p. 495).
Using a cylinder wall thickness of a quarter inch, the cross -
sectional area available for axial loading during the tensile load
application is:
= 21- 2
4 [ (6. 5) - (6.0)2 = 5.03 square inches ]

38
1/2 - NF20 bolt 12 required
. ®/ Flange
Piston %
Ïm ;1 ItW:S
'/. %////%i//,. / Flange
1 -8NC nut
Scale: 1/2 inch = 1 inch
Top cylinder cap
Cylinder
illi
Bottom cylinder cap
Piston rod
Figure 11. Shock absorber assembly
\--

39
The maximum stress is:
T = Á = 25.
000 = 3980 pounds per square inch
The design factor of safety is thus
D. F. 62, 000 3980 = 15.7
Following the procedure used by Gordon Hull for his design
thesis on the cryogenic tensile testing machine (13, p. 83) the design
factor of safety for the shock absorber assembly was established at
2. 0. The axial stresses in the cylinder case are well within this
design factor.
The flanges welded to the cylinder are one half inch thick and
their outside diameter is 8.50 inches. The inside diameter of the
flanges and the outside diameter of the cylinder casing is 6.50 inches.
A one -quarter inch fillet weld was used on both sides of the
flanges to attach them to the cylinder casing. The approximate weld
stress due to shear and bending at maximum load is (20, p. 211):
P 2 (b + d)2 6 da(b+h) 2L +
20,000 2(0.5)2 + (0. 75) - (0.25)(6.57)(0.75) 2
4620 pounds per square inch
2'
=
=

40
Therefore, the use of a one- quarter inch weld is acceptable, as the
American Welding Society recommends a maximum stress of 13, 600
pounds per square inch (18, p. 383). Detail drawings of the flanges
and cylinder assembly are shown in Figures 12 and 13.
One half inch bolts were used to attach the cylinder caps to the
flanges. It is advantageous to preload the bolts so that no separation
will take place between the flanges and cylinder caps at maximum
load. In order to prevent this separation, the preload must be at
least equal to the maximum load. A 30 percent overshoot on pre-
loading is recommended by Shigley (20, p. 203); therefore, a pre-
load of 26, 000 pounds is specified.
The yield strength of SAE grade 5 bolts is 85, 000 pounds per
square inch (20, p. 190). Using the design factor of safety, the
design strength of the bolts is:
Design strength - 85 2000 _ 42, 500 pounds per square inch
The total required cross- sectional area of the bolts, under maximum
load, is:
A P o- 420, 0500 - 0.470 square inches
The stress area for a 1/2 - 20NF bolt is 0. 1597 square inches.
Therefore, the required number of bolts is:
= -
2

0.500 Drill 6 holes, equispaced
7.50 Dia
8.50
Scale: 1/2 inch = 1 inch Material: AISI 1020 mild steel Two required
Figure 12. Flange
41
6.50 Dia
0.50
-1F
i
i i

Flange
1
Flange
I I I
7- Cylinder (Seamless tubing - 1/4 inch wall thickness)
S 1 i
Scale: 1/2 inch = 1 inch
6.00 Dia.
6. SO Dia
8.50 Dia
0.50
1
4.50
Figure 13. Cylinder assembly
f
Om
1
1
1 0. 50
1

43
0. 0 = 2.94 bolts 0.160
Three 1/2 - ZONE bolts are adequate in strength; however, since
there is sufficient room around the flange, six bolts have been used.
The approximate torque necessary to preload each bolt is
(20, p. 190):
M = 0.20 (force on bolt)(bolt diameter)
(0. 20)(20, 000)(0. 50) 6
= 433 inch -pounds
Figures 14 and 15 show detail drawings of the cylinder caps.
Piston Assembly
AISI 4140 cold rolled steel was used for the piston rod. Its
yield strength is 90, 000 pounds per square inch and its tensile
strength is 102, 000 pounds per square inch. The upper end of the
rod is threaded and connected to the piston with a nut as shown in
Figure 11.
Assume a 1 - 8NC thread on the upper end of the piston rod.
The effective shear area per inch of thread length for a 1 - 8NC
thread is 2.36 square inches (13, p. 83). For a maximum load of
20, 000 pounds the shear stress in the threads, using a nut having a
one inch thickness, is:
_

0.75 Drill Tap 1 -8NC -2
0.500 Drill 6 holes, equispaced
7.50 Dia
"I- 2.00 -
li
0.50
8.50
ij I
Ili iii
- 1. 00 0.50
T
Scale: 1/2 inch = 1 inch Material: AISI 1020 mild steel One required
Figure 14, Top cylinder cap
44
elm
i
R

0.500 Drill 6 holes, equispaced
7.50 Dia
1.25 Drill
0.50
8.50
2.00
i
Scale: 1/2 inch = 1 inch Material: .AISI 1020 mild steel One required
Figure 15. Bottom cylinder cap
45
1.4
II I i I Ì I
I
I i
A
I .
}
.50

20,000 - 8500 pounds per square inch 2.36
46
The axial tensile stress in the piston rod is highest at the threads.
The effective stress area for a 1 - 8NC thread is 0.5510 square
inches (13, p. 83). The maximum tensile stress in the rod is then:
v A 055100 - 36,200 pounds per square inch
The design factor based on this tensile stress is:
D. F. = 90, 000 - 2.48 36,200
which is acceptable.
The lower end of the piston rod also has 1 - 8NC threads so
that it can be connected to the tensile rod through an adapter already
in existence. Figures 16 and 17 are detail drawings of the piston
rod and piston.
Since the piston assembly contains a one inch nut on top of the
piston, the thickness of foam must be increased from three to four
inches so that the nut will not bottom out on the top cylinder cap.
The additional thickness of polyethylene foam increases the volume
from 85 cubic inches to 113 cubic inches. The strain energy per
cubic inch that must be absorbed by the foam is now reduced from
13.7 inch -pounds per cubic inch to 9.9 inch -pounds per cubic inch.
From Figure 9 the corresponding stress level is 34 pounds per
A
P

1.00 Dia
1 -8NC -2 ` 1 8NC -2 2 inch thread length 1. 1 inch thread length
2.10
1.00 Dia
Scale: 1 inch = 1 inch Material: AISI 4140 cold rolled steel One required
6.75
1.13 Dia
1.50
Figure 16. Piston rod

48
( I 0. 50
I
Scale: 1/2 inch = 1 inch Material: AISI 1020 mild steel One required
Figure 17. Piston
r I

49
square inch and the strain becomes 0.67 inches per inch. The force
transmitted to the load cell is reduced to:
P = (34)(28.3) = 965 pounds
The load reduction factor of the shock absorber becomes:
965 T
= 20, 000
= 0. 048
The maximum deflection corresponding to a 67 percent strain level
is 2.58 inches. Therefore, theoretically, the piston assembly will
not bottom out on the top cylinder cap.
The primary reason for increasing the foam thickness rather
than decreasing the thickness of the nut protruding above the piston
is that it may be desirable to have a larger volume available within
the cylinder when further testing is done on the shock absorber.
Figure 18 is a photograph of the shock absorber mounted in the
testing machine. The Baldwin U -1 load cell can be seen directly
above the shock absorber. Figure 19 shows the disassembled shock
absorber assembly.

Figure 18. Closeup of shock absorber and load cell as mounted in testing machine
Figure 19. .Shock absorber disassembled
50
ti
r'
.,
-

51
EXPERIMENTAL STUDIES - PART TWO
Experimental Setup
After fabrication of the shock absorber it was necessary to test
it so that its actual effectiveness could be determined. The testing
procedure previously used was followed except that the shock ab-
sorber was placed between the load cell and the tensile rod, as
shown in Figure 20 and response curves were made only for the load
cell. The tensile specimens were machined so that they fractured at
approximately 3000 pounds of load. Tests were run using polyethyl-
ene and polyester urethane foams as the cushioning materials.
Results
Figure 21 shows the response curve for the load cell with poly-
ethylene as the absorbing medium. The initial load release after
fracture is adequately damped; however, three milliseconds after
fracture a peak compressive stress is seen by the load cell. The
small oscillations seen occurred at 3250 cycles per second and cor-
respond with the results of the load cell response found in the initial
experimental studies.
Figure 22 gives the response of the load cell when polyester
foam was used. A peak compressive stress similar to the one in
..

52
Figure 20. Experimental setup with shock absorber (
-- ~

53
4000
3000
2000 II n 1000 100
[ o VIIII IIII 1000 _uuU E
o E 2000
-3000 1 J 1 1, 1 1 1 1
0 0.5 1.0 1.5 2.0 2.5 3.0 3.5 4.0 4.5 Time, milliseconds
Figure 21. Response of load cell using polyethylene as shock ab- sorbing medium
3000 -.1 2000 - 1000 _1111
o NALO 1111111111E11 1000 -ó
2000 -1111©. -3000 -1111
0 0.5 1.0 1.52.0 2.53.03.5 4.0 4.5 Time. milliseconds
Figure 22. Response of load cell using polyester urethane as shock absorbing medium
-1
'
o
-
"
"e
1 1 1 1 1 1 I A I I
&
N

54
Figure 21 can once again be seen. Since the peak compressive
stress found in both tests seem to be consistant both in magnitude
and in time, it was decided that the cause of these stresses was ex-
ternal to the shock absorber,
The apparent explanation for the existence of this peak com-
pressive stress involves the motion of the top plate of the testing
machine after the specimen fractures. It was theorized that the
strain energy initially present in the load cell and jack screw is
transmitted to the top plate and surrounding structure upon specimen
fracture. This additional strain energy in the top plate, together
with the response of the top plate and the inertia effects of the load
cell and jack screw, cause the peak compressive stress to be seen
by the load cell three milliseconds after the load is released.
One means of eliminating this peak compressive stress is to
place another shock absorber between the load cell and the jack; how-
ever, limited space in the loading column prohibits the use of this
solution.
Another solution to the problem would involve spring mounting
the jack to the top plate. Then, when the top plate responds to the
sudden load release, the jack and load cell would not be rigidly at-
tached and the peak compressive stress on the load cell should be
greatly reduced.

55
To establish the validity of this explanation of and solution to
the problem, springs having a stiffness coefficient of 60 pounds per
inch were placed between the top of the jack mounting plate and the
heads of the bolts attaching the jack to the top plate. This arrange-
ment can be seen in Figure 20.
A test was then run using polyethylene foam and Figure 23,
shows the response of the load cell with the jack spring mounted to
the top plate. The specimen broke at about 4000 pounds and the max-
imum compressive load was 600 pounds. This maximum compression
also occurred three milliseconds after fracture and was most likely
due to the response of the top plate. The maximum load reduction
factor for this test was:
T 46000 = 0.150
Figure 24 shows the response of the load cell using polyester foam
in the shock absorber in conjunction with the spring mounted jack.
The large stress reversals are an indication that the polyester foam
bottomed out.
Discussion
The results of the tests made on the system that included the
polyethylene foam in the shock absorber in conjunction with the

56
4000
3000
2000
1000 IIIIINIII 11
1000 1111 2000 i..iiui. 1111
-3000 p í
o i 2 3 4 5 6 7 8 9 10
Time, milliseconds
Figure 23. Response of load cell using polyethylene in shock absorber and spring mounts on the jack
3000
2000 Illnl. l000
o 11111111111111111w111 - 1000 _ ° rrs 2000 -
-3000
Figure 24. Response of load cell using polyester urethane in shock absorber and spring mounts on the jack
o
Tr
s ro
r
11111111111111111111111111
o 1 2 3 4 5 6 7 8 9 10
. Time, milliseconds
a

57
spring mounted jack shows that the strain energy in the system was
adequately dissipated and the load cell saw relatively small stress
reversals. The maximum load reduction factor was 0.150. For an
initial load of 4000 pounds design calculations predict a maximum
load reduction factor of 0.03 and a maximum load of 117 pounds being
imparted on the load cell. The experimental results indicate that the
motion of the top plate increases the magnitude of the stress rever-
sals seen by the load cell after specimen fracture, accounting -for
the higher load reduction factor. If the response curve for the load
cell in Figure 23 is carefully studied, the load reversals present
after the influence of the top plate has subsided have a maximum
amplitude of ZOO pounds. The corresponding load reduction factor
of 0.050 is in satisfactory agreement with the theoretical load re-
duction factor of 0.03 if the effect of the top plate on the response of
the load cell is neglected.
The results of the test using the polyester foam as the shock
absorbing medium in combination with the spring mounted jack pre-
sented evidence that the polyester foam is inadequate in absorbing
the strain energy in the system for loading conditions as small as
3000 pounds.
The fact that the frequency which persisted in the load cell for

58
all tests performed occurred at 3250 cycles per second, as shown in
Figures 21 through 24, further substantiates the conclusion previous-
ly reached that the fundamental frequency of the load cell is 3250
cycles per second.

59
CONCLUSIONS
1. The supposition that peak stress reversals occur in the load cell
upon specimen fracture was verified by experimental evidence.
2. The fact that peak stress reversals actually damage the load cell
has not been proven or disproven although, as noted in the intro-
duction, previous experience indicates that such damage does
occur.
3. The initial assumption that the top plate could be consideredas a
rigid body was proven to be in error.
The theoretical natural frequencies of the tensile rod and load
cell are in satisfactory agreement with those found experimen-
tally.
5. Polyethylene and polyester urethane foams were foundtobe effec-
tive energy absorbers under a shock environment. For the prob-
lem under consideration, however, only polyethylene foam
proved to be a practical and satisfactory solution.
6. The addition of spring mounts on the jack solved the problem of
a peak compressive stress being induced on the load cell three
milliseconds after the strain energy in the system was released.
7. The design of the shock absorber was found to be adequate and
4.

60
was relatively simple to fabricate. Its only disadvantage seems
to be the amount of space it requires in the loading column.
This space requirement is dictated by the volume of foam neces-
sary to dissipate the strain energy of the system.

61
RECOMMENDATIONS
It is recommended that the vibration problem involving the top
plate and jack be investigated further. Availability and convenience
dictated the selection of springs used to damp out the induced vibra-
tion of the top plate. If a proper stiffness value was found for the
springs, even greater damping could be expected. Another problem
to consider when spring mounts are used is the motion of the jack
relative to that of the transmission driving it. The coupling between
these two components should be flexible enough to permit adequate
movement of the jack.
The polyethylene foam should be used as the energy dissipating
medium for the strain energy released in the tensile rod. It has
adequate energy storage capacity and does not become brittle at low
temperatures. It is suggested, however, that the vertical length of
the shock absorber be shortened as much as possible as a matter of
convenience to the operator of the testing machine.

62
BIBLIOGRAPHY
1. Abrahamson, H. N. H. J. Plass and E. A. Ripperger. Stress wave propagation in rods and beams In: Advances in Applied Mechanics 5:111 -194. 1958.
2. Baldwin- Lima -Hamilton Corporation. Type U -1 SR -4 load cell. Philadelphia, 1951. 2 p. (Miscellaneous bulletin no. 324)
3. Chang, C. S. Energy dissipation in longitudinal vibration. In: Proceedings of the Third U. S. National Congress on Applied Mechanics, New York, 1958. New York, American Society of Mechanical Engineers, 1958. p. 109 -116.
4. Crede, Charles E. and Edward J. Lunney. Establishment of vibration and shock tests for missile electronics as derived from the measured environment. Dayton, Ohio, 1956. 49 p. (U. S. Air Force, Wright Air Development Center. Technical report 56 -503)
5. Davids, Norman. (ed.) International symposium on stress wave propagation in materials. New York, Interscience Publishers, 1960. 337 p.
6. Dow Chemical Company. Ethafoam - Dow expanded polyethylene. Midland, Michigan, 1960. 11 p. (Bulletin no. 171- 125B -85C- 461)
7. Ellis, J. T. and Stanley Karbowniczek. Absorbing shock loads for smooth, accurate stopping. Machine Design 34:176 -184. Mar 15, 1962.
8. Fullman, Carl Harvey. The design of a mechanism for tensile testing in a liquid helium dewar. Master's thesis. Corvallis, Oregon State University, 1961. 91 numb. leaves.
9. Gazda, Alvin J. The buckling mode of a tension bar after the load is released. Journal of the Aerospace Sciences 29:487- 488. 1962.
10. Harris, Charles O. Introduction to stress analysis. New York, Macmillan, 1961. 330 p.

63
11. Harris, Cyril M. and Charles E. Crede. (eds.) Shock and vibration handbook. New York, McGraw Hill, 1961. 3 vols.
12. Hartog, J. P. Den. Advanced strength of materials. New York, McGraw Hill, 1952. 379 p.
13. Hull, Gordon Laurance. The design of a variable strain rate, autographic recording, tensile testing machine. Master's thesis. Corvallis, Oregon State University, 1962. 104 numb. leaves.
14. Klumpp, James H. and Benjamin J. Lazan. Frictional damp- ing and resonant vibration characteristics of an axial slip lap joint. Dayton, Ohio, 1954. 33 p. (U. S. Air Force, Wright Air Development Center. Technical report 54 -64).
15. Kolsky, H. Stress waves in solids. Oxford, Cumberlege, 1953. 211 p.
16 Kornhauser, M. Prediction and evaluation of sensitivity to transient accelerations. Journal of Applied Mechanics, Trans- actions of the American Society of Mechanical Engineers 76: 371 -380. 1954.
17. Kropschot, R. H. et al. Low temperature tensile testing equipment and results (300° - 20 °K). 1953. 26 p. (National Bureau of Standards. Report 2708)
18. Popov, E. P. Mechanics of materials. New York, Prentice - Hall, 1952. 441 p.
19. Ripperger, E. A. The propagation of pulses in cylindrical bars - an experimental study. In: Proceedings of the First Midwestern Conference on Solid Mechanics. Urbana, Illinois, University of Illinois, 1953. p. 29 -39.
20. Shigley, Joseph Edward. Machine Design. New York, McGraw Hill, 1956. 523 p.
21. Timoshenko, Steven. Vibration problems in engineering. 3d ed. Princeton, D. Van Nostrand, 1955. 468 p.
22. Tong, Kin N. Theory of mechanical vibration. New York, Wiley, 1960. 348 p.

APPENDIX

64
CALCULATIONS
Deflections of Testing Machine Components
Gordon Hull determined the deflections, under maximum load,
for the top plate, vertical supports, reaction beam attachments
reaction beam, jack screw, and adapters (13, p. 40). The deflection
of the load cell is given in the data sheet accompanying the load
cell (2). These deflections are tabulated on page 8 of the text.
Tensile Rod
The tensile rod, shown in Figure 25, is fabricated from 6A1 -
4Va cold rolled titanium.
Figure 25. Tensile rod
Dia
0.75 Dia
1.0
28.5
0.50 Dia
26. 5
20.5
-1.00
+I 2.

65
Since the actual tensile rod is not of the same cross - sectional
area along its entire length, the deflection calculations must take
this fact into consideration. The equation for the longitudinal de-
flection of a bar having n prismatic cross - sections under an axial
load is:
y E A i = 1
i
Where L. and A. represent the length and area of each prismatic
cross - section of the bar (18, p. 34).
For titanium (8, p. 66):
E = 16 . X 106 pounds per square inch
= 4.25 X 10 -4 pound seconds squared per inches to the fourth power
Under a maximum load of 20, 000 pounds, the longitudinal deflection
of the tensile rod is approximately:
20,000 21.5 5.50 y
16 X 106 0.196 + 0.442
= 0.1565 inches
Yoke Assembly
1.50 0.785
The yoke assembly is made from titanium. Its length is 1.50
i
+
p y

66
inches and its average cross - sectional area is O. 540 square inches
(8, p. 73). The elongation, under maximum load, is:
PL (20, 000) (1. 50) = Y AE = 0. 003 7 inches
(0.54) (16 X 106)
Tensile Specimen
The approximate elongation of a steel tensile specimen having
a cross - sectional area of 0.200 square inches and a length of 4.50
inches is:
Y = PL (20, 000) (4. 50) AE (0.20) (30 x 106)
Compressive Column
= 0. 0150 inches
The compressive column is made from type 304 stainless steel
tubing having a length of 28.5 inches, an outside diameter of 1.88
inches, an inside diameter of 1.71 inches, and a cross - sectional
area of 0. 445 inches (8, p. 67). Under maximum load it is com-
pressed an amount:
PL (20, 000) (28.5) AE = O. 0426 inches
(0.445) (30 x 106)
Strain Energy in Loading Column
Under a maximum load of 20, 000 pounds the total elongation
Y

67
of the part of the loading column in tension is:
y = (0.0040 + 0.0028 + 0.0050 + 0.0018 + 0.1565 +
0.0037 + 0.0100)
= 0. 1856 inches
The strain energy present in this part of the loading column is then:
W Py 2
(20, 000) (0.1856) = 1856 inch- pounds 2
Similarly, the strain energy present in the loading column
between the load cell and the tensile specimen is:
W Py (20,2000) (0.0018 + 0.1565 + 0.0037 + 0.0100) 2
= 1720 inch -pounds
The percent of total strain energy acting on the load cell that this
part of the system represents is:
Percent W = 1720 (100 percent) = 92.6 percent
1856
Response of Tensile Rod
Theoretical Calculations
From the equations derived in the text of the thesis the fre-
quency of the fundamental mode was found to be:
-
- 2

For titanium:
C =
c
1 4L
16 x 106
4.25 X 10
6 1
68
_ -4 = 194, 000 inches per second
The length of the tensile rod assembly is 30.8 inches. Its funda-
mental frequency is then:
194,000 (4) (30.8) = 1570 cycles per second
Experimental Calculations
In Figure 6, the fundamental frequency is:
n cycles of fundamental frequency number o
f1 of units along time axis number of seconds
(needed to complete n cycles I i
unit
2 cycles (18:5 units) (10 -4 seconds
unit
= 1080 cycles per second
Energy Dissipation Per Cycle
The relationship between strain energy and applied load has
been stated in the text of the thesis as:
W P2 L 2AE
Referring to Figure 6, if the magnitude of each successive maximum
f
J E
f 1..

69
compressive load is obtained, the strain energy remaining in the
tensile rod at that time can be calculated from the above equation.
Since the cross - sectional area of the tensile rod assembly is
not constant, an equivalent cross - sectional area should be found so
that the above equation can be applied. The tensile rod assembly was
weighed and found to be 1.60 pounds. The density of titanium is
0. 160 pounds per cubic inch. The volume of the tensile rod assembly
is:
V dens ty 0. 60 = 10.0 cubic inches
The length of the assembly is 30.8 inches. The equivalent cross-
sectional area is then:
A L 30.8 = 0.325 square inches
The strain energy in the tensile rod assembly, for an applied load of
P, is:
2 (30.8) P = 2.96 X 10 -6 P2 inch -pounds
(2)(0.325)(16 X 106)
The maximum compressive load for the first cycle is 4400
pounds. The strain energy in the tensile rod assembly at that time
is then:
W = (2.96 X 10 -6) (4400)2 = 83.0 inch -pounds
=
W =
1.60

70
The maximum compressive loads for the second and third
cycles are 2800 and 1500 pounds respectively, and their correspond-
ing strain energies are 31.0 and 9.4 inch -pounds. Thus, between the
first and second cycle:
Percent energy loss = 83.0 - 31.0 (100 percent) 83.0
= 62.6 percent
Similarly, between the second and third cycles:
Percent energy loss = 31.0 - 9.4 (100 percent) 31.0
= 69.6 percent
The average percent energy loss per cycle for the first three cycles
is:
62.6 + 69.6 = 66.1 percent 2
Response of Load Cell
Theoretical Calculations
Applying the same analysis used for the tensile rod the theoret-
ical fundamental frequency of the load cell can be calculated. For
steel, c = 202, 000 inches per second (10, p. 206). The length of
the load cell is 8. 5 inches. The fundamental frequency is then:
L J
r 1
1

71
f 1 4L (4)(g ) = 5940 cycles per second
Experimental Calculations
Using Figure 7 and the same procedure as for the tensile rod,
the actual fundamental frequency of the load cell is:
f1
fl =
n cycles of fundamental frequency number o of units along time axis (needed to complete n cycles
6 cycles
number of seconds unit
-4 seconds (19.5 units) (10 unit
= 3250 cycles per second
j
=