control of fecal malodor by adsorption onto …
TRANSCRIPT

CONTROL OF FECAL MALODOR
BY ADSORPTION ONTO BIOCHAR
By
KATHLEEN STETINA
A thesis submitted to the
Faculty of the Graduate School of the University of Colorado
in partial fulfillment of the requirement for the degree of
Master of Science
Department of Civil, Environmental, and Architectural Engineering
College of Engineering
University of Colorado at Boulder
2017
This thesis entitled:
Biochar Adsorption for Control of Fecal Malodor
written by Kathleen Stetina
has been approved for the Department of Civil, Environmental and Architectural Engineering
Dr. Karl Linden
Dr. R. Scott Summers
Dr. Shelly Miller
Dr. Tesfayahones Yacob
_______________
Date
The final copy of this thesis has been examined by the signatories, and we find that both the content and
the form meet acceptable presentation standards of scholarly work in the above mentioned discipline.

iii
Stetina, Kathleen (M.S. Civil Engineering, Department of Civil, Environmental, and Architectural
Engineering)
Control of Fecal Malodor by Adsorption onto Biochar Thesis directed by Professor Karl G. Linden
Abstract The provision of sanitation services has been accelerated as part of the Sustainable Development Goals
with increasing focus on the need for solutions within the fecal sludge management services supply chain.
One common constraint in the sanitation value chain is malodor nuisance associated with fecal sludge.
Finding cost-effective ways to minimize end user malodor nuisance from latrines is critical. Adsorption of
malodor onto biochar was hypothesized as one possible technology intervention to malodor nuisance.
Adsorption studies were conducted as part of a project funded by the Bill & Melinda Gates Foundation to
control and mitigate malodors derived from human waste. Biochars derived from bamboo wood, pine
wood, and human feces, and NORIT ROZ 3 activated carbon were used to evaluate adsorption of malodor.
A reconstitution of fecal malodors was used, comprised of four compounds including carboxylic acids,
sulfur and nitrogen containing compounds shown to be responsible for human fecal odor. Both batch and
flow-through adsorption tests were performed. Odor was quantified using ascending concentration series
method of dynamic threshold olfactometry by an odor panel, and a hydrogen sulfide (H2S) meter.
Breakthrough capacities of the adsorbents for both odor reduction (odor units per g of adsorbent) and H2S
reduction (mg/g of adsorbent) were determined for the equilibrium odor levels represented by the
adsorption studies for batch and flow-through methods. Complete odor removal was never achieved;
generally, 40-50% of odor could be removed by adsorption. Results showed that all biochars exhibited
comparable adsorptive characteristics to each other and modified activated carbon. All experiments were
performed at a high relative humidity, as would be typical in many latrine settings. Results indicated
significant fouling by water vapor during continuous flow operation that generally decreased odor capacity
of the chars by an order of magnitude. Specific compounds representing adsorption challenges were
identified. Overall, the results provide baseline engineering data to apply and size biochar filters for
adsorption as a malodor control method in various latrine settings.

iv
Acknowledgements
I would like to thank my advisor, Dr. Karl Linden for ongoing support, advice, and overall guidance
throughout my education and this project. In addition, Dr. Tesfa Yacob has been a consistent and vital
source and knowledge and encouragement throughout this project, even after leaving Colorado. His
impressive knowledge and work laid the foundation for all methods of this project. I am grateful for an
interested, encouraging and helpful committee comprised of Dr. Karl Linden, Dr. Tesfa Yacob, Dr. R. Scott
Summers, and Dr. Shelly Miller. Additionally, this research was successful thanks to a partnership with
Dr. Marc Deshusses and Stewart Farling of Duke University: thank you for consistent support and
willingness to teach me throughout this research. I’d also like to thank all my predecessors on the Sol-Char
Toilet team for the valuable stepping stones their hard work provided in order to launch into this project,
and all my predecessors at CU whose expertise in biochar informed this research and were foundational to
this research. I am grateful to have worked with everyone in the Linden Lab throughout research who have
helped out and answered many questions, despite annoying odor bags littering our bench space. Thank you
to Dr. Sherri Cook for generously sharing a fume hood for a year. I am grateful to Ian Laga and Jeff Tennant
of the Laboratory for Interdisciplinary Statistical Analysis (LISA) at CU for going above and beyond in
catering to this research’s statistical needs by writing pages of R code. I am thankful for a trustworthy,
committed, eager and willing group of odor panelist, whose work ethic were vital to the results of this
research; thank you to Calvin Lincoln, Eleni Vlachos, Michael Reinisch, Rachel Cornwell, Nathan Gayo,
Mythili Isola, Austin Riley, Will Herold, Evan Valencia, Dustin Levine, Emma Herold, Kyle Donahue and
Jeff Tennant. Finally, thank you to fellow students like Ben Greiner, and loving family like Anne Stetina
and Derek Sawyer that have listened to hours of griping and celebrating over the trials of laboratory research
and still are around to support me. Thank you everyone! Furthermore, thank you to the American
Association for University Women (AAUW) who believed in my success and funded me as a 2015-16
Selected Professionals Fellow. This research was made possible by funding from the Bill & Melinda Gates
Foundation, for project OPP1119852.

v
Table of Contents ABSTRACT .................................................................................................................................................. III
ACKNOWLEDGEMENTS.............................................................................................................................. IV
CHAPTER ONE: INTRODUCTION .................................................................................................. - 1 -
1.1 FECAL SLUDGE MANAGEMENT AND THE GLOBAL SANITATION CRISIS .................................... - 2 -
1.1.1 THE REINVENT THE TOILET PROGRAM ......................................................................................... - 2 -
1.2 MALODOR ....................................................................................................................................... - 3 -
1.2.1 MALODOR NUISANCE ....................................................................................................................... - 3 -
1.2.2 TYPICAL LATRINE MALODORANTS ................................................................................................... - 5 -
1.3 ADSORPTION BY CARBONACEOUS ADSORBENTS ......................................................................... - 6 -
1.2.1 ACTIVATED CARBON ........................................................................................................................ - 6 -
1.3.2 BIOCHAR .......................................................................................................................................... - 7 -
1.4 RESEARCH BACKGROUND AND MOTIVATION .............................................................................. - 8 -
1.5 RESEARCH OBJECTIVES ................................................................................................................. - 9 -
CHAPTER TWO: RESEARCH ......................................................................................................... - 10 -
2.1 METHODS ......................................................................................................................................... - 11 -
2.1.1 LATRINE MALODOR SYNTHESIS..................................................................................................... - 11 -
2.1.2 ODOR MEASUREMENT .................................................................................................................... - 17 -
2.1.3 SELECTED CARBON ADSORBENTS ................................................................................................. - 22 -
2.1.4 BATCH EXPERIMENTS .................................................................................................................... - 23 -
2.1.5 FLOW-THROUGH EXPERIMENTS ..................................................................................................... - 27 -
2.2 RESULTS ........................................................................................................................................... - 30 -
2.2.1 PHYSICAL PROPERTIES OF CHARS ................................................................................................... - 30 -
2.2.2 BATCH EXPERIMENTS ..................................................................................................................... - 31 -

vi
2.2.3 FLOW-THROUGH COLUMNS............................................................................................................ - 34 -
2.2.4 ADSORPTION ISOTHERMS ............................................................................................................... - 39 -
2.3 DISCUSSION ...................................................................................................................................... - 44 -
2.3.1 ADSORPTION ABILITY ..................................................................................................................... - 44 -
2.3.2 INFLUENCE OF CHAR AND MALODOR PROPERTIES ......................................................................... - 46 -
2.3.3 IMPORTANCE OF HUMIDITY ........................................................................................................... - 47 -
CHAPTER THREE: IMPLICATIONS ............................................................................................. - 49 -
3.1 GENERAL CONCLUSIONS ................................................................................................................. - 50 -
3.2 POSSIBLE FILTER DESIGNS AND BIOCHAR REQUIREMENTS .......................................................... - 50 -
3.2.1 BIOCHAR CARTRIDGE FILTER FOR ODOR TREATMENT OF VIP LATRINE EXHAUST ........................ - 50 -
3.2.2 BIOCHAR CARTRIDGE FILTER FOR ACTIVE ADSORPTION IN A LATRINE SUPERSTRUCTURE ............ - 52 -
3.2.3 BIOCHAR MESH FILTER FOR PASSIVE ADSORPTION IN A LATRINE SUPERSTRUCTURE .................... - 55 -
3.3 FIELD TRIALS ................................................................................................................................... - 56 -
REFERENCES ..................................................................................................................................... - 59 -
APPENDIX A: BREAKTHROUGH CURVES ............................................................................................. - 62 -
APPENDIX B: ADSORPTION ISOTHERM PLOTS .................................................................................... - 65 -
APPENDIX C: PHOTOS OF LABORATORY SET UPS .............................................................................. - 66 -
APPENDIX D: ADSORPTION EXPERIMENTS DATA TABLES ................................................................. - 68 -

vii
List of Tables
TABLE 1: ODOR DESCRIPTORS, TYPICAL SOURCES, ODOR DETECTION THRESHOLDS, AND
EXPECTED CONCENTRATIONS IN LATRINES FOR MALODORANTS OF INTEREST .................... - 6 -
TABLE 2: SUMMARY OF RESEARCH OBJECTIVES ....................................................................................... - 9 -
TABLE 3: KNOWN PHYSICOCHEMICAL PROPERTIES OF BUTYRIC ACID, INDOLE, P-CRESOL AND H2S
...................................................................................................................................................................... - 13 -
TABLE 4: SUMMARY OF MALODORANTS AND THEIR CONCENTRATIONS THAT WERE SYNTHESIZED
AND TREATED DURING ADSORPTION EXPERIMENTS .................................................................... - 14 -
TABLE 5: PARAMETERS OF LIQUID ODOR SYNTHESIS PROCESS .......................................................... - 17 -
TABLE 6: D/T VALUES FOR THE VARIOUS PLATES OF SM – 100 PLATES. ............................................ - 19 -
TABLE 7: POSSIBLE RANGES OF POSITIONS AND D/T VALUES ASSOCIATED WITH MEASUREMENTS
FROM ADSORPTION EXPERIMENTS OF EACH AIR STEAM ............................................................. - 20 -
TABLE 8: ODOR PANELISTS THAT PARTICIPATED IN EACH SET OF ADSORPTION EXPERIMENTS AND
THE SCREENING ODOR AND CONCENTRATION ............................................................................... - 22 -
TABLE 9: A SIMPLE, FICTITIOUS EXAMPLE TO EXPLAIN ERROR ASSOCIATED WITH CALCULATIONS
PERFORMED IN THE "POSITION SPACE" VERSUS THE "D/T SPACE" ............................................ - 25 -
TABLE 10: COLUMN OPERATING PARAMETERS ........................................................................................ - 28 -
TABLE 11: CHAR PROPERTIES FOR ACTIVATED CARBON, FECAL CHAR, BAMBOO CHAR, AND PINE
CHAR USED IN ADSORPTION EXPERIMENTS .................................................................................... - 31 -
TABLE 12: AVERAGE INITIAL AND TREATED ODOR CONCENTRATIONS FOR ALL TESTED ODOR
SOLUTIONS ................................................................................................................................................ - 34 -
TABLE 13: ADSORPTIVE CAPACITIES FOR H2S ADSORPTION IN FLOW-THROUGH ORS+H2S
ADSORPTION EXPERIMENTS ................................................................................................................. - 43 -
TABLE 14: DESIGN PARAMETERS PROPOSED CARTRIDGE BIOCHAR FILTERS FOR ACTIVE
ADSORPTION OF VIP EXHAUST AND SUPERSTRUCTURE FECAL ODOR .................................... - 54 -
TABLE 15: DESIGN PARAMETERS PROPOSED MESH BIOCHAR FILTERS FOR PASSIVE ADSORPTION
OF SUPERSTRUCTURE FECAL ODOR ................................................................................................... - 56 -

viii
TABLE 16: ODOR PANEL DATA FOR BATCH ADSORPTION.. .................................................................... - 68 -
TABLE 17: ODOR PANEL DATA FOR FLOW-THROUGH ADSORPTION. .................................................. - 69 -

ix
List of Figures
FIGURE 1: HOW IMPORTANT IS MALODOR AS A BARRIER TO LATRINE/TOILET ADOPTION? ......... - 4 -
FIGURE 2: MALODOR NUISANCE RATING BY FSM COMPONENT ............................................................ - 4 -
FIGURE 3: MALODOR IMPACTS ON LATRINE USERS .................................................................................. - 4 -
FIGURE 4: TO WHAT EXTENT ARE ODOR ISSUES CURRENTLY BEING ADDRESSED? ........................ - 5 -
FIGURE 5: SCHEMATIC OF EXPERIMENTAL SET UP: ODOR SYNTHESIS PROCESS AND FLOW-
THROUGH ADSORPTION ......................................................................................................................... - 16 -
FIGURE 6: BATCH ADSORPTION KINETICS EXPERIMENTS. ..................................................................... - 32 -
FIGURE 7: PERCENT REMOVAL OF MALODOR BY OLFACTOMETRY MEASUREMENTS OF D/T ..... - 33 -
FIGURE 8: FLOW-THROUGH KINETIC EXPERIMENT RESULTS .............................................................. - 35 -
FIGURE 9: BREAKTHROUGH CURVES OF FLOW-THROUGH ADSORPTION EXPERIMENTS FOR ALL
ODOR SOLUTIONS TREATED BY ALL CHAR TYPES, NORMALIZED BY INFLUENT ODOR LEVELS.
...................................................................................................................................................................... - 37 -
FIGURE 10: BREAKTHROUGH CURVES FOR H2S IN FLOW-THROUGH ADSORPTION EXPERIMENTS OF
ORS+H2S TREATED BY ALL CHAR TYPES, NORMALIZED BY VARIABLE INFLUENT ODOR
LEVELS ........................................................................................................................................................ - 38 -
FIGURE 11: USE RATE OF EACH CHAR IN TREATMENT OF EACH ODOR SOLUTION ......................... - 39 -
FIGURE 12: ADSORPTION EXPERIMENT DATA PLOTTED ON ISOTHERMS PLOTS FOR ALL FOUR
CHARS’ ADSORPTION OF THE ODOR SOLUTIONS ON A LOG-LOG SCALE ................................. - 42 -
FIGURE 13: ADSORPTIVE CAPACITY, QC, FOR ALL STATIC EXPERIMENT TESTS .............................. - 45 -
FIGURE 14: SCHEMATIC OF AIR FLOW THROUGH A VIP LATRINE AND OUT OF THE THE EXHAUST
VENT ............................................................................................................................................................ - 51 -
FIGURE 15: POSSIBLE VACUUM PUMP FOR ACTIVE ADSORPTION BIOCHAR FILTER ...................... - 53 -
FIGURE 16: BREAKTHROUGH CURVES OF FLOW-THROUGH ADSORPTION EXPERIMENTS FOR ALL
ODOR SOLUTIONS TREATED BY ALL CHAR TYPES, PLOTTED WITH THE VARIABLE INFLUENT
ODOR LEVELS ........................................................................................................................................... - 62 -

x
FIGURE 17: BREAKTHROUGH CURVES OF FLOW-THROUGH ADSORPTION EXPERIMENTS FOR ALL
ODOR SOLUTIONS TREATED BY ALL CHAR TYPES, NORMALIZED BY INFLUENT ODOR LEVELS
...................................................................................................................................................................... - 63 -
FIGURE 18: BREAKTHROUGH CURVES OF FLOW-THROUGH ADSORPTION EXPERIMENTS FOR
ORS+H2S TREATED BY ALL CHAR TYPES, PLOTTED WITH THE VARIABLE INFLUENT H2S
LEVELS ........................................................................................................................................................ - 64 -
FIGURE 19: ADSORPTION EXPERIMENT DATA PLOTTED ON ISOTHERMS PLOTS FOR ALL FOUR
CHARS’ ADSORPTION OF THE ODOR SOLUTIONS ON A LINEAR SCALE .................................... - 65 -
FIGURE 20: ODOR BAG ...................................................................................................................................... - 66 -
FIGURE 21: SM-100 OLFACTOMETER (SCENTROID/IDES, ONTARIO, CA) .............................................. - 66 -
FIGURE 22: ODOR SYNTHESIS PROCESS AND FLOW-THROUGH ADSORPTION COLUMNS SET UP
INSIDE FUME HOOD ................................................................................................................................. - 67 -

xi
List of Equations
EQUATION 1: AIR-OCTANOL PARTITION COEFFICIENT ........................................................................... - 12 -
EQUATION 2: AIR-WATER PARTITION COEFFICIENT ................................................................................ - 12 -
EQUATION 3: ADSORPTION CAPACITY, QC, FOR BATCH EXPERIMENTS ............................................. - 26 -
EQUATION 4: ODOR REMOVAL PERCENT CALCULATION FOR BATCH EXPERIMENTS ................... - 27 -
EQUATION 5: ADSORPTION CAPACITY, QC, FOR FLOW-THROUGH EXPERIMENTS ........................... - 29 -
EQUATION 6: SAMPLE VARIANCE OF FLOW-THROUGH EXPERIMENT RESULTS, FOR ALL ODOR
PANELISTS, OVER ALL TIME STEPS ..................................................................................................... - 29 -
EQUATION 7: STANDARD ERROR FOR QC OF FLOW-THROUGH EXPERIMENTS ................................. - 29 -
EQUATION 8: MARGIN OF ERROR FOR QC OF FLOW-THROUGH EXPERIMENTS ................................ - 30 -
EQUATION 9: CONFIDENCE INTERVAL FOR QC .......................................................................................... - 30 -
EQUATION 10: USE RATE FOR FLOW-THROUGH EXPERIMENTS ............................................................ - 30 -

xii
List of Acronyms BET Brunauer–Emmett–Teller
BVs Bed Volumes
Ce Equilibrium Concentration
CSOs Civil Society Organizations
DI Deionized
D/T Dilution-to-Threshold
FSM Fecal Sludge Management
GAC Granular Activated Carbon
GC-MS Gas Chromatography-Mass Spectrometry
H2S Hydrogen Sulfide
Koa Air-octanol Partition Coefficient
Kow Octanol-water Partition Coefficient
MFC Mass Flow Controller
ODT Odor Detection Threshold
ORS Odor Reconstitution Solution
O.U. Odor Units
qc Adsorption Capacity
RH Relative Humidity
RTT Reinvent the Toilet
SDGs Sustainable Development Goals
SuSanA Sustainable Sanitation Alliance
TLUD Top-lit updraft gasifier
VIP Ventilated Improved Pit
VOC Volatile Organic Compound
VOSC Volatile Organic Sulfur Compound

Control of Fecal Malodor by Adsorption onto Biochar
- 1 -
University of Colorado Boulder | Department of Civil, Architectural and Environmental Engineering
CHAPTER ONE: INTRODUCTION

Control of Fecal Malodor by Adsorption onto Biochar
- 2 -
University of Colorado Boulder | Department of Civil, Architectural and Environmental Engineering
1.1 Fecal Sludge Management and the Global Sanitation Crisis The introduction of safe sanitation is one of the most influential interventions to improve human health.
When not managed appropriately, human waste poses one of the most acute and serious risks to human and
environmental health. Nevertheless, access to safe sanitation remains one of the most pressing global
challenges. 2.4 billion, approximately one in three of our global neighbors, do not use forms of improved
sanitation [1]. Approximately 30% of these people live in urban areas [1], which presents a unique set of
challenges associated with lack of available land for latrine pits. In urban settings that are not connected to
sewerage networks, there is generally greater need to treat and/or transport human waste after it is safely
collected. This collection, transportation, and treatment of human waste represents the field of fecal sludge
management (FSM). FSM is associated with a supply chain of services to safely treat the sludge and carry
it away from users. A wide array of service chain models exist to meet this need, that range in involvement
of users, private sector players, governments, and civil society organizations (CSOs).
The Sustainable Development Goals (SDGs) have set a lofty goal (SDG 6.2) to achieve “adequate and
equitable access to sanitation and hygiene for all” by 2030 [2]. In the scramble to mobilize resources and
find scalable solutions to this goal, fecal sludge management professionals find themselves navigating a
complex web of economic, social, institutional, and technical challenges; safe management of waste is not
simple nor cheap. While there are significant barriers to achieving SDG 6.2, there is room for technological
innovation to affordably improve the FSM services supply chain.
1.1.1 The Reinvent the Toilet Program The Bill & Melinda Gates Foundation Reinvent the Toilet (RTT) program has advanced the design of latrine
systems that safely transform human waste into a usable or harmless form. Many of the RTT designs are
based upon the heating or combustion of human waste, which is known to emit malodors. Ultimately, most
latrine systems will emit malodor associated with human waste, which could be a barrier to system success.
As one example, the pyrolysis of human waste into biochar is one successful method of transforming

Control of Fecal Malodor by Adsorption onto Biochar
- 3 -
University of Colorado Boulder | Department of Civil, Architectural and Environmental Engineering
pathogenic human waste into a useful resource, and is known to emit significant malodor that should be
treated [3]. Technologies that can help minimize or eliminate malodor could positively contribute towards
wider adaption of safer sanitation systems. This research was part of project OPP1119852 of the Bill &
Melinda Gates Foundation.
1.2 Malodor
1.2.1 Malodor Nuisance FSM is a smelly business. Yet, evidence of this has been largely anecdotal and ignored. While this may
be justified due to seemingly more pressing issues in the evolving field, odor remains a defining and
unavoidable characteristic of FSM. Anecdotally, a literature search for latrine malodor studies in poverty
settings produces few results. Quantitatively, a survey performed via the Sustainable Sanitation Alliance
(SuSanA) defined malodor nuisance as a widespread and notable barrier in global sanitation efforts; as part
of this project, research at Duke University and the University of Colorado Boulder developed this survey
to assess locations, causes, intensity and impacts of malodor along the chain of FSM [4]. The survey
received responses from 258 sanitation solution providers, researchers, and users from a range of
developing countries. Key highlights that serve as motivation for this research include:
• 94% of respondents felt that malodor is an important barrier to latrine adoption (Figure 1)
• Malodor is considered unpleasant or very bad at several stages of FSM practices, and is worst when
untreated waste is released (Figure 2)
• Malodor can have many several negative impacts on users, including attracting files or other bugs,
enduring unpleasant odor, or use of open defecation or a different latrine (Figure 3)
• There has not been adequate progress made to address latrine malodor issues (Figure 4)

Control of Fecal Malodor by Adsorption onto Biochar
- 4 -
University of Colorado Boulder | Department of Civil, Architectural and Environmental Engineering
Figure 1: How important is malodor as a barrier to latrine/toilet adoption? Results from a SuSanA survey. [4]
Figure 2: Malodor nuisance rating by FSM component [4]
Figure 3: Malodor impacts on latrine users [4]

Control of Fecal Malodor by Adsorption onto Biochar
- 5 -
University of Colorado Boulder | Department of Civil, Architectural and Environmental Engineering
Figure 4: To what extent are odor issues currently being addressed? [4]
These results serve as motivation for this research; along the chain of FSM, malodor nuisance in a latrine
setting is the most severe. Furthermore, malodor nuisance and its impacts can be severe for users, and on
top of that negatively affect latrine adoption. Finally, this is an important issue that needs to receive more
attention in order to find good solutions.
1.2.2 Typical latrine malodorants It is important to understand the the odorants that are responsible for latrine malodor so that an odor control
can target the behavior or these molecules in air. Specifically, important parameters for the development
of a control technology includes the type of odorant, concentration, and flowrate [5]. Since the 19th century
butyric acid, indole, p-cresol, and skatole have been known as significant odorants associated with human
waste[6]. The presence of sulfur compounds in human waste facilities is also well known. Particularly,
methyl mercaptan and hydrogen sulfide (H2S) are the most significant sulfur compounds [7] [8]. Table 1
summarizes the typical qualities and sources of these malodors of interest in latrine settings.
A study out of the Research and Development Division of Firmenich in Geneva, Switzerland quantitatively
measured odorant molecules present in the headspace above twelve latrines in India, South Africa and
Kenya using gas chromatography-mass spectrometry (GC-MS). Primary odor compounds found were
consistent with literature, and included hydrogen sulfide, butyric acid, methyl mercaptan, p-cresol, indole,
and skatole [9]. Results were somewhat consistent between the twelve ventilated pit, ventilated improved
pit (VIP), or urine-diverting (UD) latrines. Hydrogen sulfide and methyl mercaptan were the most

Control of Fecal Malodor by Adsorption onto Biochar
- 6 -
University of Colorado Boulder | Department of Civil, Architectural and Environmental Engineering
significant contributors to latrine malodor and a smell of sewage [9], but are also highly volatile and
unstable compounds. In latrines that were not well-ventilated, less volatile compounds like p-cresol, butyric
acid, and indole become more important [9].
Table 1: Odor descriptors, typical sources, odor detection thresholds, and expected concentrations in latrines for
malodorants of interest
Malodorant Odor Quality Sources ODT
Hydrogen
sulfide Rotten eggs [10]
Human and animal waste, petroleum
and natural gas, volcanic gases, hot
springs, industrial activities [10]
4 ppb [11]
Methyl
mercaptan
Sharp but disagreeable,
like garlic or rotten
cabbage [12]
Decayed organic matter, animal feces,
oil refineries, pulp mills [12] 4 x 10⁻⁵ μg/L
[9]
Indole
Almost floral and
pleasant in low
concentrations,
unpleasant and like feces
in high concentrations
[13]
Jasmine, insect control, tobacco smoke
[13] 6 x 10⁻⁵ μg/L
[9]
Butyric acid Unpleasant, rancid,
obnoxious [14]
Animal fats, plant oils, fermentation
product [14] 9 x 10⁻⁴ μg/L [9]
p-Cresol Sweet, tarry [15]
Animal, barn-like
Widely distributed in nature, excreted
in urine, human and animal tissue and
fluids, solvents, pesticides, vehicle
exhaust, wood and trash burning,
tobacco smoke [15]
2 x 10⁻⁵ μg/L [9]
Skatole Fecal [16] Feces, beetroot, nectandra wood,
fragrance industry, food additive [16] 5 x 10⁻⁶ μg/L [9]
1.3 Adsorption by Carbonaceous Adsorbents
1.2.1 Activated Carbon One treatment technology that is widely used in air quality applications is adsorption of contaminants by
activated carbon. Activated carbon uses physical and chemical adsorption processes to clean the odor
solution that comes in contact with it. Physical adsorption results from dispersive interactions of the sorbate
with the sorbent surface. Physical adsorption has low binding energy and is reversible. Chemical
adsorption results from a reaction between the sorbent and sorbate, and therefore is high in energy and
usually non-reversible [17].

Control of Fecal Malodor by Adsorption onto Biochar
- 7 -
University of Colorado Boulder | Department of Civil, Architectural and Environmental Engineering
Activated carbon is a highly effective adsorbent and commonly used for treatment of odor emissions with
sulfur compounds in sewage-based wastewater treatments facilities [18][19]. Physical adsorption generally
is enhanced by using a carbonaceous sorbent with high specific surface area (750-1500 m2/g), and a
significant portion of total pore volume in the micropore range (less than 2.5 nm diameter) [20]. However,
other factors include total pore volume of the activated carbon and surface chemistry, and some studies
have shown that the combination of micropore and mesopore volumes are more effective for hydrogen
sulfide removal [21][22].
There is significant literature that details adsorption of sulfur compounds like hydrogen sulfide and methyl
mercaptan. Physical adsorption capacity of hydrogen sulfide of typical carbons is ~0.01 g H2S/cm3 of
carbon [23]. However, chemical adsorption of a sulfur compound like H2S can increase capacity of carbon
[23]. Chemical adsorption of methyl mercaptan can present an even higher adsorptive capacity than H2S
[23]. However, in combination with H2S, methyl mercaptan can have a lower adsorption adsorptive
capacity [24]. Generally, activated carbon provides a high adsorption capacity towards sulfur compounds
and volatile organic sulfur compounds (VOSCs) compared to nitrogen-containing volatile organic
compounds (VOCs) [25]. Of the malodorants in interest for this work, indole and skatole can be classified
as nitrogen-containing VOCs.
1.3.2 Biochar Biomass-based biochars can present a low-cost alternative to activated carbon to remove pollutants from
air or water. Biochar is the product of pyrolysis of organic matter. The pyrolysis process is thermal
decomposition of organic matter at high temperatures and in absence of oxygen. Biochar production
represents a beneficial, widely available, and potentially economic use of agricultural waste. Biochar has
been studied for use as an adsorbent of contaminants in water and air, a fuel source as an alternative to
charcoal, and as a soil amendment to increase crop yields [26] and for carbon sequestration [27].

Control of Fecal Malodor by Adsorption onto Biochar
- 8 -
University of Colorado Boulder | Department of Civil, Architectural and Environmental Engineering
For this work, biochar was evaluated as an adsorbent and deodorant. As with activated carbon, biochar’s
surface properties and chemistry can dictate adsorptive characteristics and effectiveness. The two primary
characteristics in biochar production to affect surface properties and chemistry is biochar feedstock type
and pyrolysis temperature. In general, as pyrolysis temperature increases, surface area and pore distribution
of resulting biochar increase, resulting in an increase of adsorption effectiveness. Asada et al. found that
indole and skatole were better adsorbed onto bamboo biochar pyrolyzed at 1000° C compared to pyrolysis
temperatures of 500° C and 700° C [28].
1.4 Research Background and Motivation Generally, odor emissions from various types of sewage-based wastewater treatment (WWT) settings is
understood and specific characterization of these odor types and sources has been well-studied. Chappuis
et al. has begun to characterize specific malodors in specific latrine settings in India and parts of Africa [9].
A Duke / University of Colorado study has begun to understand the level of malodor nuisance along the
chain of FSM services and anecdotal impacts [4]. There has not been clear, or peer-reviewed,
characterization of malodors along the chain of FSM services, nor a clear understanding of the specific
importance of malodor nuisance in regards sanitation-related development efforts.
Adsorption of VOSCs and other sulfur compounds by activated carbon in a variety of industries has been
well studied. Adsorption of odor emissions containing sulfur compounds by activated carbon from sewage-
based WWT settings has been well studied. Increasingly, adsorption by biochars for various applications
is becoming well-studied. To some extent, adsorption of malodor specifically by biochars have been
included in this. Adsorption by activated carbon or biochar of malodor in latrine settings is not understood.
Based on demonstrated adsorption of malodors in related settings, adsorption onto carbonaceous adsorbents
could be a solution to malodor control in latrines. In addition, biochar could have comparable effectiveness
in these settings to well-understood activated carbon adsorbents.

Control of Fecal Malodor by Adsorption onto Biochar
- 9 -
University of Colorado Boulder | Department of Civil, Architectural and Environmental Engineering
1.5 Research Objectives The objectives of this research were designed to address needs surrounding malodor nuisance in latrines
and fill gaps in literature. A primary, secondary, and related objective were developed, which are called
Objective 1, Objective 2, and Objective 3 for this purposes of this thesis. Objectives are summarized in
Table 2.
Table 2: Summary of research objectives
Objective Importance Description Details
Objective 1 Primary
Preliminarily assess adsorption as
a means of malodor control of
newly identified malodor
compounds present in latrines in
India and parts of Africa.
Effectiveness of biochar
adsorbents will be compared to
that of activated carbon for each of
malodors in singularity and in
combination.
Objective 2 Secondary
Determine adsorption
characteristics of selected
malodors onto selected carbons.
Adsorption characteristics include:
preliminary adsorption isotherms,
adsorption kinetics, and
breakthrough curves.
Objective 3 Related
Relate the determined adsorption
characteristics with the
physicochemical properties of the
selected carbons and malodorants.
Quantify adsorption properties of
biochars in a latrine setting, and
propose adsorption mechanisms
when possible.
Results of this work compare the adsorption four malodors in singularity and in combination onto a
modified activated carbon and three biochars of various feedstocks and pyrolysis temperatures. The four
malodors studied are indole, p-cresol, butyric acid, and H2S. The carbon adsorbents studied are NORIT
ROZ 3 modified activated carbon, fecal char, bamboo char, and pine char.

Control of Fecal Malodor by Adsorption onto Biochar
- 10 -
University of Colorado Boulder | Department of Civil, Architectural and Environmental Engineering
CHAPTER TWO: RESEARCH

Control of Fecal Malodor by Adsorption onto Biochar
- 11 -
University of Colorado Boulder | Department of Civil, Architectural and Environmental Engineering
2.1 Methods
2.1.1 Latrine Malodor Synthesis For laboratory bench-scale tests of latrine malodor adsorption by activated carbon and biochar, a source of
odorous air was needed. Odor solutions were synthesized in a fume hood by dilution then evaporation (for
those in liquid or solid form) of chemicals of interest. Five air steams that were created then treated were
designed to represent various latrine malodors in singularity and in mixture, at constant concentrations.
Selection of malodorants
From the six primary malodors identified by Chappuis et al. [9], four were selected for this research. These
include H2S, butyric acid, indole, and p-cresol. An odor reconstitution solution (ORS) was created as a
mixture of the three non-sulfur-containing malodors: butyric acid, indole, and p-cresol. Methyl mercaptan
and skatole were not used for simplicity sake and because the four selected compounds created a sufficiently
representative odor profile. H2S was decided to be representative of adsorption of the sulfur compounds,
and the relative adsorptive characteristics of H2S and methyl mercaptan are well studied in literature [24]
[23]. Skatole, specifically, was not selected because of a prohibitively low solubility in water, and because
Chappuis et al. [9] consistently measured skatole at the lowest concentrations of the six odorants measured.
Physicochemical properties must be well understood in order to relate adsorption behaviors to
physicochemical properties of selected malodors (Objective 3). Known properties of the four selected
malodors are summarized in Table 3. Of particular importance to adsorption is the air-octanol partition
coefficient, (Kao) which is an indicator of a compound’s likelihood to partition between the gas phase and
the organic dissolved phase, such as soil or or carbonaceous adsorbent. Kao is calculated using Equation 1.
While Kao is a defined property unique to a compound and may be experimentally determined, there is a
lack of reported values in literature. Nevertheless, a calculation of Kao, based on its theoretical relationship
to better known values of octanol-water partition coefficients (Kow) and Henry’s Law Constants (H),
produces an acceptable value [29].
Control of Fecal Malodor by Adsorption onto Biochar
- 12 -
University of Colorado Boulder | Department of Civil, Architectural and Environmental Engineering
Equation 1: Air-octanol partition coefficient
𝐾𝑎𝑜 = 𝐾𝑜𝑤𝑅𝑇
𝐻 ,
where Kow is the octanol-water partition coefficient unique to the compound,
R is the gas constant, in atm-m3/mol-K,
T is the temperature, in Kelvin (K), and
H is Henry’s Law Constant unique to that compound, in atm-m3/mol.
The air-water partition coefficient (Kaw), a measure of a compounds likelihood to partition between the
aqueous phase and gas phase, is important for malodor compounds because all adsorption experiments were
performed at significant relative humidity, to mimic a latrine setting. Kaw is calculated according to
Equation 2.
Equation 2: Air-water partition coefficient
𝐾𝑎𝑤 = 𝐾𝑜𝑤
𝐾𝑎𝑜=
𝐻
𝑅𝑇 ,
where Kaw is the air-water partition coefficient unique to the compound.

Control of Fecal Malodor by Adsorption onto Biochar
- 13 -
University of Colorado Boulder | Department of Civil, Architectural and Environmental Engineering
Table 3: Known physicochemical properties of butyric acid, indole, p-cresol and H2S
Property Butyric Acid Indole p-Cresol Hydrogen Sulfide
Chemical
Formula C4H8O2 C8H7N C7H8O H2S
Structure
Molecular
weight (g/mol) 88.11 117.15 108.13 34.09
Boiling point 164° C 253° C 202° C -60° C
Melting point -7.9° C 52° C 35° C -85° C
pKa at 25° C 4.8 -2.4 (basic) 10.3 pKa1 = 7.4
pKa2 = 11.96
Log Kow* 0.79 2.14 1.94 2.1
Henry’s
Constant
5.35x10⁻⁷ atm-
m3/mole
5.3x10⁻⁷ atm-
m3/mole
1.0x10⁻⁶ atm-
m3/mole
0.0098 atm-
m3/mole
Vapor
Pressure 1.65 mm Hg 0.0122 mm Hg 0.11 mm Hg 1.36x10⁴ mmHg
Solubility in
water at 25° C 6x10⁴ mg/L
3560 mg/L, or in
hot water 2.15x10⁴ mg/L 2.257 m3/m3-water
Log Kaw** -4.66 -4.66 -4.38 -0.393
Log Kao** 5.45 6.80 6.32 2.49
Unless noted otherwise, properties all referenced are information from the substance’s page in the HSDB database
in TOXNET [30]
*Log Kow values from Hansch et al. [31] for organic compounds and from Cuevasanta et al. [32]for H2S
** Log Kao and Kaw values calculated as explained in above section
Tested malodor solutions
Five odorous odor solutions of various malodorants and concentrations were designed for a representative
sample of typical latrine malodors. These five odor solutions are summarized in Table 4. For the purposes
of this thesis, the five odor solutions will be referred to by the malodor(s) present in the odor solution. The
concentrations of butyric acid, p-cresol, and indole in the ORS mixture were set at concentrations
determined directly by the recent findings of Chappuis et al. [9]. All target concentrations are above
reported ODT levels for these compounds, as summarized in Table 1. The odor solutions of the individual
compounds were set at the total concentration of malodor compounds in the ORS mixture for purposes of

Control of Fecal Malodor by Adsorption onto Biochar
- 14 -
University of Colorado Boulder | Department of Civil, Architectural and Environmental Engineering
consistency of equilibrium odor concentrations. H2S deviated slightly from the findings of Chappuis et al.
(which was approximately 72 ppb H2S) due to restrictions in achievable H2S levels based on system
flowrates and H2S source concentrations. Actual delivered concentration was calculated to be 223 ppb (see
Synthesis of odor solutions section below).
Table 4: Summary of malodorants and their concentrations that were synthesized and treated during adsorption
experiments
Odor solution Malodors present Target Concentration Units
ORS
Butyric Acid 5 x 10⁻³ μg/L
p-Cresol 3 x 10⁻³ μg/L
Indole 3 x 10⁻⁴ μg/L
Total ORS 8.3 x 10⁻³ μg/L
ORS+H2S
Butyric Acid 5 x 10⁻³ μg/L
p-Cresol 3 x 10⁻³ μg/L
Indole 3 x 10⁻⁴ μg/L
Total ORS 8.3 x 10⁻³ μg/L
H2S 223 ppb
Butyric Acid Butyric Acid 8.3 x 10⁻³ μg/L
p-Cresol p-Cresol 8.3 x 10⁻³ μg/L
Indole Indole 8.3 x 10⁻³ μg/L
Synthesis of odor solutions
Figure 5 shows a schematic of the odor synthesis process followed by the flow-through experimental set
up. A picture of the actual set up inside a fume hood is shown in Figure 22 in Appendix C: Photos of
Laboratory Set Ups. For each odor solution, these three relevant compounds were diluted in deionized (DI)
water to reach a desired concentration in proportion to the target concentrations of each odor solution.
Indole, however, was obtained in form of solid crystals and has a melting point of 52° C. Therefore, indole
was dissolved in hot water. In order to keep butyric acid speciation consistent, pH for all odor solutions
was kept around 3 by adding a few drops of hydrochloric acid to each solution. All compounds were
maintained at concentrations in water below their solubility limits (See Table 3). Figure 5 explains how
diluted liquid solutions of malodor compounds were synthesized and combined with H2S, when applicable,
within a fume hood. All tubing was comprised of non-odor-sorbing Norprene Food Tubing (Masterflex,
Vernon Hills, IL). Compressed air flowed through an Alicat MCP Moderate Mass Flow Controller (Alicat

Control of Fecal Malodor by Adsorption onto Biochar
- 15 -
University of Colorado Boulder | Department of Civil, Architectural and Environmental Engineering
Scientific, Tuscan, AZ) at a constant rate, passed through a granular activated carbon (GAC) cartridge filter
to ensure cleanliness and remove any residual odor, and enter a closed 4 L vaporization chamber made from
a mason jar. A KDS 230 110 VAC Syringe Pump (KD Scientific, Holliston, MA) pumped a constant rate
of the dilute liquid solution of malodor compounds from a 150 ml plastic syringe through a 16.5 gage needle
and into the vaporization chamber and onto a surface of glass beads. The syringe was refilled approximately
every 24 hours, as needed. Flow-through experiments were paused during the time of syringe refill
(approximately fifteen minutes). The glass beads were contained in a small beaker and suspended in the
vaporization chamber. The glass beads were heated by a 200 watt, 240 volt swaged cartridge heater
(Grainger, Lake Forest, IL) that entered the vaporization chamber also and was controlled by a PID
temperature controller. The PID temperature controller communicated with a temperature sensor that was
placed inside the vaporization chamber, placed in space several centimeters away from the glass bead
surface. For the odor solution with H2S, 246 ppm H2S was delivered from a gas cylinder at a constant rate
of 59 ml/min, the minimum allowable based on the mass flow controller (MFC) technology, which resulted
in a calculated H2S concentration of 223 ppb. The LabVIEW VI program controlled a voltage set point for
a driver, that delivered the desired voltage to a 1000 SCCM H2S MFC (MKS Instruments, Andover, MA)
that controlled flow from an H2S cylinder.

Control of Fecal Malodor by Adsorption onto Biochar
- 16 -
University of Colorado Boulder | Department of Civil, Architectural and Environmental Engineering
Figure 5: Schematic of experimental set up: odor synthesis process and flow-through adsorption
Flow rates of the dilute liquid odor solutions and of cleaned compressed air were maintained for consistency
in water loading rate and relative humidity (RH). Odor levels were varied by the types and concentrations
of liquid malodor compounds being applied. These parameters of the odor synthesis process are
summarized for each set of experiments in Table 5. A “set” refers to both a batch and a flow-through
experiment performed for each odor solution (See Section 2.1.4 Batch Experiments and Section
2.1.5 Flow-through Experiments). For the odor solution of ORS+H2S, ORS was synthesized identically to
the ORS odor solution, then H2S was delivered from a gas cylinder at a constant rate to result in a target
H2S concentration of 223 ppb. The average measured H2S concentration was 235 ppb, which indicates that
actual H2S concentrations reflected the targeted value well.

Control of Fecal Malodor by Adsorption onto Biochar
- 17 -
University of Colorado Boulder | Department of Civil, Architectural and Environmental Engineering
Table 5: Parameters of liquid odor synthesis process
Odor
solution
Quantity of
malodor
compound
diluted in 100
ml DI water (g)
Dilution
factor
Final
concentration
in dilute liquid
odor solutions
(μg/L)
Pump rate
of dilute
liquid odor
solutions
(ml/min)
Flow
rate of
clean air
(SLPM)
Target
Concentration
in air stream
(μg/L)
ORS
Butyric Acid:
0.2 5,000 400 0.1 8 0.005
p-Cresol: 0.12 5,000 240 0.1 8 0.003
Indole: 0.012 5,000 24 0.1 8 0.0003
Butyric
Acid 1.0 15,000 660 0.1 8 0.0083
p-
Cresol 1.0 15,000 660 0.1 8 0.0083
Indole 1.0 15,000 660 0.1 8 0.0083
2.1.2 Odor Measurement Odor is the least well understood of the five senses, and perhaps the most mysterious to measure. Odor
measurement is an incomplete field, and is even regarded as an art, rather than a science by many [33].
Nevertheless, odor measurement is becoming increasingly understood and well recognized methods exist
for a variety of measurement techniques [33][34]. In general, odor measurements fall into the two
categories of sensory and analytical, and it can be difficult to link the two [33]. While some laboratories
may be able to analytically quantify relatively high concentrations of certain odor-causing compounds using
GC-MS, the sensory measurement of olfactometry was chosen as the primary method for this research due
to prohibitive issues in detection limits of the selected compounds using GC-MS. Additionally,
olfactometry measures human perception of malodor, and the goal of this research is to reduce malodor
nuisance, which could be a called a measurement of human perception. Olfactometry is a method of odor
measurement to quantify an odorous air sample in terms of human perception by dilution with clean air
below the odor detection threshold (ODT) until detection is reached. The dilution-to-threshold (D/T)
represents is the lowest dilution at which an odor can either be detected or recognized.

Control of Fecal Malodor by Adsorption onto Biochar
- 18 -
University of Colorado Boulder | Department of Civil, Architectural and Environmental Engineering
Olfactometry
Odor was measured by an SM-100 Olfactometer (Scentroid/IDES, Ontario, Canada). A picture of the
olfactometer is shown in Figure 21 in Appendix C: Photos of Laboratory Set Ups. All measurements of
treated and untreated odorous air in this research were sampled using olfactometry by an odor panel. In
determining detection thresholds with the olfactometer, odor panelists began by being presented with clean,
odor-free air by the olfactometer, which was incrementally adjusted to increasingly lower dilutions of the
odorous sample in clean air. This is termed the ascending concentration series method of dynamic threshold
olfactometry [34]. A panelist records when an odor is first detected odor in a forced Yes/No choice situation
in accordance with standard methods for olfactometry VDI 3882 and EN 13725 [35] [36]. The position of
detection correlates to a D/T, which equates directly to a pseudo-dimension of odor called odor units per
cubic meter (O.U./m3). In creation of this unit, the choice of a cubic meter was arbitrary and must be
handled with care [33]. The odor level in O.U./m3 for each reading was calculated as the geometric mean
between the dilution of detection and the previous dilution.
The limitations associated with olfactometry measurement, used as the primary method of measurement
throughout this research, include variability between odor panelists and the non-linearity and misunderstood
nature of human olfactory senses. Methods to minimize variability between panelists are discussed in the
Odor Panel immediately section below. Methods to account for variability between panelists are discussed
in the Calculations section. However, a person’s response to odor is subjective, and it is expected that
human responses to odor will vary between people, depending on the odor and the concentration [37]
In the olfactometer, two dilution plates with different dilution ranges were used (plate A and plate 3)
depending on the odor solution being treated. Table 6 shows the D/T range for the different plates with
which the SM-100 Olfactometer is compatible. The values in Table 6 refer to the dilution of the sample
with clean air at the position for which odor is first detected. Because steps between positions are discrete,
the actual D/T value associated with a sample reading may be anywhere between the dilution level of the

Control of Fecal Malodor by Adsorption onto Biochar
- 19 -
University of Colorado Boulder | Department of Civil, Architectural and Environmental Engineering
detected position and the dilution level of the previous position. Therefore, D/T value for each reading was
calculated as the geometric mean between the dilutions of the position at which odor was detected and the
previous position.
Table 6: D/T values for the various plates of SM – 100 plates (H, A, 3, 2 and 1). As position increases, the extent of
sample dilution with air decreases. Table supplied by SM-100 vendor (Scentroid/IDES, Ontario, Canada).
Plate A Plate 3
Position Dilution
Level
D/T result based on
geometric mean of
position’s and previous
position’s dilution level
Dilution
Level
D/T result based on
geometric mean of
position’s and previous
position’s dilution level
1 678 - 656 -
2 319 499 328 492
3 176 248 219 274
4 98 137 164 192
5 62 80 131 148
6 35 49 109 120
7 24 30 94 102
8 17 21 82 88
9 13 15 73 78
10 10 12 66 70
11 8 9 60 63
12 7 8 55 58
13 6 7 51 53
14 5 6 47 49
15 4 5 44 46
One dilution plate was used for a single experiment throughout the sampling period. The odor solutions
of singular compounds had relatively lower initial and treated odor levels, and therefore plate A was used

Control of Fecal Malodor by Adsorption onto Biochar
- 20 -
University of Colorado Boulder | Department of Civil, Architectural and Environmental Engineering
in these sets of experiments to reach the finest resolution possible in D/T results. The odor solutions with
ORS had higher starting odor levels had relatively higher initial and treated odor levels, and therefore plate
3 was used in these sets of experiments to reach the finest resolution possible in D/T results. The ranges
of possible dilution of the odor samples and detected D/T values are shown in Table 7, for reference.
Table 7: Possible ranges of positions and D/T values associated with measurements from adsorption experiments of
each air steam
Odor
solution
Plate used in
olfactometer
Range of dilution
of plate
Range of positions
detected (1-15 possible)
Range of D/T
detected
ORS 3 44 - 656 3 - 13 274 - 53
H2S+
ORS 3 44 - 656 2 - 14 492 - 49
Butyric
Acid A 4 - 678 4 - 14 6 - 137
p-
Cresol A 4 - 678 4 - 15 5 - 137
Indole A 4 - 678 6 - 15 5 - 49
Odor Panel
An odor panel used olfactometry to determine the D/T for each sample of odorous air. A minimum of four
people and up to six people participated in each set of adsorption experiments. In literature, generally
between 4-10 panelists are used, with 8 being common [33]. For each of five odor solutions, the same odor
panel sampled all treated and control samples of treated air. A total of 11 panelists participated in all
adsorption experiments, and were assigned letters between A–K for anonymous identifiers. Table 8 shows
which panelists participated in each experiment.
The odor panel, their olfactometry measurements, and the method of presentation conformed with standard
methods according to VDI 3882 and EN 13725 [35] [36]. All panelists were trained. Panelists were
instructed to avoid caffeine and spicy foods before olfactometry measurements. Measurements were
carried out in a distraction-free environment. Panelists were instructed to not participate during times of
obviously inhibited olfactory senses (i.e. when congested). In order to avoid odor fatigue, panelists were
required to take olfactometry measurements for no more than one hour, after which an extended break was

Control of Fecal Malodor by Adsorption onto Biochar
- 21 -
University of Colorado Boulder | Department of Civil, Architectural and Environmental Engineering
required before continuing to take measurements. Panelists’ results were screened for adequate olfactory
sensitivity during each period of olfactometry measurement using an odor bag of particularly high odor
concentrations, called a “screening odorant bag.” In olfactometry literature, it is typical for a kind of
screening with a reference gas to remove individuals outside a set deviation from panelist means
[33][38][39][40]. For this study, the screening odorant was the same odorant or or combination of odorants
used for the odor solution of that set of experiments. The concentration of the screening odorant was
targeted at a concentration five times higher than the target concentration of malodors for that air
experiment’s odor solution (See Table 4 for target concentrations of each odor solution). An exception is
for H2S, which was only increased by a factor of 2 from the original target concentration. A 60 L odor bag
was filled with the 5x-concentrated screening odorant. Panelists’ results were screened for adequate
olfactory sensitivity by measuring the screening odorant bag before and after all other olfactometry
measurements during that testing period. Generally, a set of experiments would produce 40 odor bags for
each panelist to test, and generally 10 bags were sampled during a single testing period. Therefore, panelists
would complete a set of experiments in approximately 4 testing periods, and would measure the screening
odorant bag approximately 10 times. An acceptable range of D/T detection levels were determined based
on the average and standard deviation of all panelists’ measurements [38][39]. Acceptable detection ranges
for each set of experiments is shown in Table 8. In cases in which a panelist’s screening odorant bag
measurement falls outside the acceptable detection range, all of that panelist’s results for that testing period
were removed, as their olfactory sensitivity may have been compromised. Throughout the course of
olfactometry measurements for all adsorption experiments, a total of 91 testing periods were performed by
all panelists. Out of the 91 testing periods, there were 8 instances in which results from a testing period
were removed due to the screening odor bag process. Relatedly, throughout the course of olfactometry
measurements, four panelists out of 15 were deemed to have inadequate olfactory sensitivity to participate
in the odor panel. These panelists were deemed inadequate by an inability to detect odor in the screening
odorant bag after training, on several occasions.

Control of Fecal Malodor by Adsorption onto Biochar
- 22 -
University of Colorado Boulder | Department of Civil, Architectural and Environmental Engineering
Table 8: Odor panelists that participated in each set of adsorption experiments and the screening odor and
concentration
Odor
solution
Size of
odor panel
Panelist
participation
Screening
odorant
Target
concentration of
screening odorant
(μg/L)
Acceptable
detection positions
of screening
odorant bag
ORS 4 A, D, E, F, G ORS
Butyric: 2.5 x 10⁻²
p-Cresol: 1.5 x 10⁻²
Indole: 1.5 x 10⁻³
2 – 4
(plate 3)
H2S+
ORS 6 A, D, I, J, K, L H2S+ORS
Butyric: 2.5 x 10⁻²
p-Cresol: 1.5 x 10⁻²
Indole: 1.5 x 10³
H2S: 400 ppb
3 – 6
(plate 3)
Butyric
Acid 5 A, C, D, E, G
Butyric
Acid 4.2 x 10⁻² 5 – 7
(plate A)
p-Cresol 4 A, B, C, H p-Cresol 4.2 x 10⁻² 7 – 10
(plate A)
Indole 5 A, B, I, J, K Indole 4.2 x 10⁻² 7 – 10
(plate A)
H2S Meter
H2S was measured with a Jerome 621 Gold Film Hydrogen Sulfide Analyzer (Arizona Instrument LLC,
Chandler, AZ) and for odor level using the olfactometer. Input and output H2S were measured for each
time sample, for each flow-through column and batch odor bag. Because of the H2S meter’s old age, it was
calibrated by measuring four bags of varying, known H2S concentrations. A linear trend line was found to
relate all measurements with an R2 value of 0.99. The resulting calibration curve was used to adjust all H2S
measurements.
2.1.3 Selected Carbon Adsorbents The activated carbon selected for adsorption experiments NORIT ROZ 3, ground to pass US 50 mesh size.
NORIT ROZ 3 is an activated, peat-based, carbon, impregnated with minimum 2% potassium iodide [41].
It has a high degree of macro and mesopores [41]. Human fecal char made at 900o C were also used for the
experiments. Wood chars made from pine and bamboo, made at 300o C and 900o C respectively, were also
used initially. All biochars were ground to a size passing US 50 mesh size, and which represented a particle

Control of Fecal Malodor by Adsorption onto Biochar
- 23 -
University of Colorado Boulder | Department of Civil, Architectural and Environmental Engineering
diameter of 0.3 – 0.59 mm. Literature indicates that 0.3-0.4 mm is an ideal biochar particle diameter
for gas-phase adsorption of hydrogen sulfide onto biochar [42].
Relevant char properties such as physical and chemical surface characteristics and packed bed density were
found. Average pH of each biochar was measured to understand the surface chemistry of the chars.
pH measurements were performed by Elizabeth Travis, M.S., of the Linden Lab at the University of
Colorado Boulder. To measure pH, approximately 0.75 g of each sample was added to 15 mL of
deionized water. This solution was placed on a shaker at 200 rpm for twenty-four hours before
filtration by a syringe and 2-micron filter. The pH of the filtrate was then measured using a pH probe.
A Brunauer–Emmett–Teller (BET) surface analysis was performed for the three biochars by Dave
Rutherford at the USGS Lab in Denver, Colorado. In the BET analysis, surface area, pore volume, and
pore size distribution were determined from nitrogen isotherms via a method that uses a five-point N2
gas adsorption technique (ASAP 2020, Micrometrics) in which the relative pressure was run up to 0.98
atm. Analysis was performed by Dave Rutherford at the Unites States Geological Survey Laboratory
in Denver, Colorado. Packed bed density was measured for each column in each flow-through experiment.
The packed bed density reported for each char in this report was determined by averaging all measured
packed bed densities for each that char throughout all experiments. Packed bed density was rather
consistent through experiments; standard deviation between the values averaged values reported here was
a nominal 1.5 to 2.1%. All characteristics, including feedstock and pyrolysis temperature and method, are
summarized in Table 11 in Section 2.2.1 Physical properties of chars.
2.1.4 Batch Experiments A batch adsorption test was performed for each odor solution, for each carbon. Approximately 20 mg of
char was added to aluminum weighing boats and put in the bag (duct tape used to fix it) before sealing the
bag. A mass flow controller was then used to deliver to the odor bags 30 L of odorous air from the odor

Control of Fecal Malodor by Adsorption onto Biochar
- 24 -
University of Colorado Boulder | Department of Civil, Architectural and Environmental Engineering
synthesis process (see Figure 5 in Section 2.1.1 Latrine Malodor Synthesis). The odor bags, serving as
batch reactors for the adsorption process, reacted for a minimum of 48 hours before olfactometry
measurements were taken by the odor panel. This time frame was determined by kinetic experiments (see
Section 2.2.1 Physical properties of chars. The kinetic experiments were performed with varying doses of
char and 30 L of odor solutions of malodor mixtures to conservatively show time to equilibrium for multiple
conditions.
Odor bags
Odor bags were made from rolls of Nalophan bag (Scentroid/IDES, Ontario, Canada). Nalophan is a non-
odor-sorbing plastic with a low odor background. One end of the bags was carefully folded against a piece
of stainless steel tube (1/4-inch diameter) and sealed by using two zip ties. The open end of the bag was
then folded against a piece of hollow stainless steel tube (1/4-inch outer diameter) and sealed by two zip
ties. Norprene food tubing was attached to the stainless steel tube and the flow of air was turned on or off
by pinching the tubing using a clip. All odor samples were collected in an odor bag and measured by the
odor panel within 72 hours of collection. A picture of an odor bag is shown in Figure 20 in Appendix C:
Photos of Laboratory Set Ups.
Calculations
To review, in performing calculations with olfactometry results, and specifically with the pseudo-dimension
of O.U./m3, great care must be taken [34]. All calculations including odor levels in units of O.U./m3
followed the protocol described here. Additionally, each position on the olfactometer correlated to a unique
D/T, and steps between positions were discrete and non-linear; a step between positions one and two
represented a larger difference in D/T than did a step between positions ten and eleven. To be precise, for
typical plate A positions recorded in adsorption experiment, the D/T value of a given position was on
average 72.5% that of the previous position’s D/T value, but the following position’s D/T value was on
average 76.6% that of the recorded position’s D/T value. For typical plate 3 positions recorded in

Control of Fecal Malodor by Adsorption onto Biochar
- 25 -
University of Colorado Boulder | Department of Civil, Architectural and Environmental Engineering
adsorption experiment, the D/T value of a given position was on average 85.2% that of the previous
position’s D/T value, but the following position’s D/T value was on average 87.5% that of the recorded
position’s D/T value. This meant that variability between panelists could be modeled as a normal
distribution in the “position space,” but in the “D/T space” the distribution was an unknown non-normal
distribution. Therefore, any calculations including olfactometry measurements were performed in the
“position space,” then manually converted to a D/T value by interpolation of Table 6. This somewhat
convoluted reasoning for working the “position space” perhaps is best explained by a simple, fictitious
example summarized in Table 9. In the example, four panelists detect odor at positions 4, 6, 5, and 4 in
plate A. The resulting odor level is averaged and upper and lower bound for error found by standard
deviations first in the “position space” with manual conversion to D/T, and second in the “D/T space.” The
results for all calculations are notably different. The “position space” method is the statistically accurate
method of performing calculations with olfactometer readings.
Table 9: A simple, fictitious example to explain error associated with calculations performed in the "position space"
versus the "D/T space"
Panelist A B C D
Position recorded in plate A 4 6 5 4
Dilution level of position (D/T) 98 35 62 98
Corresponding D/T value based on
geometric mean with previous position
(O.U/m3)
137 49 80 137
Average D/T value with upper and lower
bounds based on standard error by
calculation in the “position space” followed
by manual conversion to D/T (O.U/m3)
Lower: 62
Average: 94
Upper: 160
Average D/T value with upper and lower
bounds based on standard error by
calculation in the “D/T space” (O.U/m3)
Lower: 57
Average: 101
Upper: 138
In summary, all calculations of a olfactometer reading output were performed in the “position space” and
manually converted to a D/T value in O.U/m3 before further calculations. In all equations of this report,

Control of Fecal Malodor by Adsorption onto Biochar
- 26 -
University of Colorado Boulder | Department of Civil, Architectural and Environmental Engineering
the variable “position_D/T_conversion” indicates this step. All important calculations and plots included
in this report were performed in RStudio.
The adsorption capacity (qc) of the chars was calculated according to Equation 3. Adsorption capacity is a
primary property that provide information on adsorption characteristics and char’s ability to adsorb odor.
Qc was calculated for each odor panelist’s results for each batch experiment, then all calculated qc values
for a batch experiment were averaged to calculate the final, reported qc value.
Equation 3: Adsorption capacity, qc, for batch experiments
𝑞𝑐 =(𝑃𝑜𝑠𝑖𝑡𝑖𝑜𝑛𝑐𝑜𝑛𝑡𝑟𝑜𝑙– 𝑃𝑜𝑠𝑖𝑡𝑖𝑜𝑛𝑠𝑎𝑚𝑝𝑙𝑒) ∗ 𝑝𝑜𝑠𝑖𝑡𝑖𝑜𝑛_𝐷/𝑇_𝑐𝑜𝑛𝑣𝑒𝑟𝑠𝑖𝑜𝑛 ∗ 𝑉𝑎𝑖𝑟
𝑚𝑎𝑠𝑠𝑐ℎ𝑎𝑟 ;
where Positioncontrol is the olfactometer position at which the panelist detected odor in the untreated batch
control odor bag,
where Positionsample is the olfactometer position at which the panelist detected odor in the treated batch
odor bag,
Vair is the volume of odorous in the treated batch odor bag in m3, and
mc is the mass of char used to treat the batch odor bag, in g.
Confidence intervals for qc in batch experiments were calculated according to Equation 6, Equation 7,
Equation 8, and Equation 9 in Section 2.1.5 Flow-through Experiments with a nt = 1, assumed by modeling
the batch reactor as a single time step in the method of calculating confidence intervals over several time
steps.
In understanding adsorption characteristics, qc must be used intimately with the appropriate equilibrium
concentration, Ce, in that experiment. For batch experiments, Ce was defined as the odor level of the treated
batch odor bag, as determined by averaging the odor panelist’s results as described in Section 2.1.2 Odor
Measurement. The error associated with Ce values for the batch experiments was calculated as the standard
deviation of odor panelist results. Although other sources of error may have influenced experiments, it is

Control of Fecal Malodor by Adsorption onto Biochar
- 27 -
University of Colorado Boulder | Department of Civil, Architectural and Environmental Engineering
expected that variability in the odor panel is, very significantly, the primary source of error and therefore
the only consideration in most error calculations of this report.
The odor removal percent in batch experiment was calculated according to Equation 4. The odor removal
percent was calculated for each odor panelist’s results for each batch experiment, then all calculated odor
removal percent values for a batch experiment were averaged to calculate the final, reported value. The
error associated with odor removal percent values for the batch experiments was calculated as the standard
deviation of odor panelist results.
Equation 4: Odor removal percent calculation for batch experiments
𝑂𝑑𝑜𝑟 𝑟𝑒𝑚𝑜𝑣𝑎𝑙 𝑝𝑒𝑟𝑐𝑒𝑛𝑡 =1 − 𝑃𝑜𝑠𝑖𝑡𝑖𝑜𝑛𝑠𝑎𝑚𝑝𝑙𝑒
𝑃𝑜𝑠𝑖𝑡𝑖𝑜𝑛𝑐𝑜𝑛𝑡𝑟𝑜𝑙∗ 𝑝𝑜𝑠𝑖𝑡𝑖𝑜𝑛_𝐷/𝑇_𝑐𝑜𝑛𝑣𝑒𝑟𝑠𝑖𝑜𝑛 ∗ 100%
2.1.5 Flow-through Experiments A batch adsorption experiments was performed for each odor solution, for each char. The odor solution,
after synthesis was directed to four glass adsorption tubes of 6 mm inner diameter containing char packed
to a height of 30 cm. A Dwyer VFA Flowmeter (Dwyer Instruments, Michigan City, IN) controlled the
flow rate of odorous air into the packed char columns. A flow rate of 189 ml/min was used, which was
made to be above the flow rate of the H2S meter used (150 ml/min) and set to a constant contact time of 2.7
seconds, as determined by kinetics experiments. Synthesized odor that did not pass through the char
columns was wasted to a fume hood, along with column effluent. Column operating conditions are
summarized in Table 10. The schematic in Figure 5 illustrates the flow-through experimental set up. A
picture of the actual set up inside a fume hood is shown in Figure 22 in Appendix C: Photos of Laboratory
Set Ups.

Control of Fecal Malodor by Adsorption onto Biochar
- 28 -
University of Colorado Boulder | Department of Civil, Architectural and Environmental Engineering
The kinetics experiment was performed until identical conditions as subsequent flow-through experiments,
except that activated carbon was used in all columns, and flow rate was varied instead. Flow rate of odorous
air through the columns was varied in order to vary contact time at 0.5, 1.7, and 3.6 seconds. The range of
typical contact times for flow-through adsorption columns is 1-10 seconds. Logistical barriers in
experimental set up (resolution of flow controllers into columns, and time needed to collect adequate
quantity of samples from the column effluent) prohibited a contact time above 3.6 seconds.
Table 10: Column operating parameters
Operating Condition Value Units
Contact time 2.7 seconds
Bed volume 8.5 cc
Aspect ratio 50
Average bed density 0.425 g/cc
Char size: column
diameter ratio 15
Relative Humidity 64%
Water loading rate 2.37 g-water/g-char
Calculations
The adsorption capacity (qc) of the chars was calculated according to Equation 5. This equation describes
mathematically approximated integration of the area between column influent and effluent values over time
until breakthrough (see in Appendix A: Breakthrough Curves), divided by the mass of char in the packed
column. Qc was calculated for each odor panelist’s results for a flow-through experiment’s results, then all
calculated qc values for a batch experiment were averaged to calculate the final, reported qc value.

Control of Fecal Malodor by Adsorption onto Biochar
- 29 -
University of Colorado Boulder | Department of Civil, Architectural and Environmental Engineering
Equation 5: Adsorption capacity, qc, for flow-through experiments
𝑞𝑐 =∑ (𝑃𝑜𝑠𝑖𝑡𝑖𝑜𝑛𝑐𝑜𝑛𝑡𝑟𝑜𝑙,𝑖– 𝑃𝑜𝑠𝑖𝑡𝑖𝑜𝑛𝑠𝑎𝑚𝑝𝑙𝑒,𝑖) ∗ 𝑝𝑜𝑠𝑖𝑡𝑖𝑜𝑛_𝐷/𝑇_𝑐𝑜𝑛𝑣𝑒𝑟𝑠𝑖𝑜𝑛 ∗ 𝑉𝑎𝑖𝑟,𝑖
𝑛𝑖−1
𝑚𝑐 ;
where Positioncontrol,i is the olfactometer position at which the panelist detected odor in the influent odor
bag for the ith time step,
where Positionsample is the olfactometer position at which the panelist detected odor in the effluent odor
bag for the ith time step,
Vair,i is the volume of air assume to flow through the column over the time step of interest according to the
midpoint numerical approximation method of integration, in m3, and
mc is the mass of char in the packed column, in g.
A confidence interval was calculated for each integrated qc value according to Equation 6, Equation 7,
Equation 8, and Equation 9. This process outlines finding the sample variance, standard error, margin of
error, and finally confidence interval for all qc calculations.
Equation 6: Sample variance of flow-through experiment results, for all odor panelists, over all time steps
𝑠2 = 𝑉𝑎𝑟 (∑ 𝑃𝑜𝑠𝑖𝑡𝑖𝑜𝑛𝑖
𝑛𝑡
𝑖=1
) = ∑ 𝑉𝑎𝑟(𝑃𝑜𝑠𝑖𝑡𝑖𝑜𝑛𝑖)
𝑛𝑡
𝑖=1
+ 2 ∑ 𝐶𝑜𝑣(𝑃𝑜𝑠𝑖𝑡𝑖𝑜𝑛𝑖 , 𝑃𝑜𝑠𝑖𝑡𝑖𝑜𝑛𝑗)
𝑖=𝑛𝑡,𝑗=𝑛𝑝
𝑖=1,𝑗=1
;
where nt is the number of time steps,
np is the number of panelists, and
Positioni,j is the D/T result for all odor panelists (i), over all time steps (j).
Equation 7: Standard error for qc of flow-through experiments
𝑆𝐸 = √𝑠2
𝑛𝑞 ;
where SE is the standard error, and
nq is the number of time steps times the number of panelists.

Control of Fecal Malodor by Adsorption onto Biochar
- 30 -
University of Colorado Boulder | Department of Civil, Architectural and Environmental Engineering
Equation 8: Margin of error for qc of flow-through experiments
𝑀𝐸 = 𝑡(1−𝛼),(𝑛𝑞−1) ∗ 𝑆𝐸 ;
where ME is the margin of error, and
is the p-value for a confidence level of (1-)*100%.
Equation 9: Confidence interval for qc
[𝐶𝑜𝑛𝑓𝑖𝑑𝑒𝑛𝑐𝑒 𝑖𝑛𝑡𝑒𝑟𝑣𝑎𝑙 → (𝑞𝑐 − 𝑀𝐸)] ∗ 𝑝𝑜𝑠𝑖𝑡𝑖𝑜𝑛_𝐷/𝑇_𝑐𝑜𝑛𝑣𝑒𝑟𝑠𝑖𝑜𝑛 ≤ 𝑞𝑐
≤ [(𝑞𝑐 + 𝑀𝐸) ∗ 𝑝𝑜𝑠𝑖𝑡𝑖𝑜𝑛_𝐷/𝑇_𝑐𝑜𝑛𝑣𝑒𝑟𝑠𝑖𝑜𝑛]
For flow-through experiments, Ce was defined as the average odor level of the column influent, as
determined by averaging the odor panelist’s results as described in Section 2.1.2 Odor Measurement. The
error associated with Ce values for the batch experiments was calculated as the standard deviation of odor
panelist results for all column influent measurements.
Use rate was calculated according to Equation 10. Use rate is a simple way to interpret one result of a
breakthrough curve; it tells us what quantity char can treat a quantity of air until saturation.
Equation 10: Use rate for flow-through experiments
𝑈𝑠𝑒 𝑟𝑎𝑡𝑒 = 𝑚𝑐
𝑏𝑟𝑒𝑎𝑘𝑡ℎ𝑟𝑜𝑢𝑔ℎ ∗ 𝐵𝑉 ;
where mc is the mass of char in the packed column, in g,
breakthrough is the number of BVs treated until saturation is achieved, as defined by Figure 9, and
BV is the volume of the column’s packed bed, in m3.
2.2 Results
2.2.1 Physical properties of chars The BET surface analysis of the biochars, along with published properties of the manufactured activated
carbon, are summarized in Table 11. Also included in Table 11 are surface pH and pyrolysis information.
Pine char had a notable surface area and pore volume, at one to two orders of magnitude lower than the

Control of Fecal Malodor by Adsorption onto Biochar
- 31 -
University of Colorado Boulder | Department of Civil, Architectural and Environmental Engineering
other chars. Activated carbon had a total pore volume an order of magnitude higher than fecal char and
bamboo char. Bamboo char had a very high fraction of total pore volume in micropores, and pine char’s
micropore volume fraction was very low. While surface pH is unknown for the activated carbon, fecal char
had the most basic surface.
Table 11: Char properties for activated carbon, fecal char, bamboo char, and pine char used in adsorption
experiments
Property Activated carbon
(NORIT ROZ 3)* Fecal Char Bamboo Char Pine Char
Feedstock Peat Human feces Bamboo Pine
Pyrolysis
Temperature - 900° C 900° C 300° C
Pyrolysis
Technology - Furnace Furnace Furnace
pH** - 11.28 9.96 9.59
Surface Area
(m3/g) - 89.9 146 0.7
Pore Volume
(cc/g) 0.84 0.081 0.091 0.001
Micropore
Volume Fraction 0.38 0.26 0.87 0.07
Mesopore Volume
Fraction 0.13 0.68 0.12 0.67
Macropore
Volume Fraction 0.49 0.06 0.01 0.26
Micropore
Volume (cc/g) 0.32 0.021 0.079 0.000070
Mesopore Volume
(cc/g) 0.11 0.055 0.011 0.00067
Macropore
Volume (cc/g) 0.41 0.0049 0.00091 0.00026
Density of packed
bed (g/cc)*** 0.39 0.47 0.35 0.49
Blank cells indicate that value is unknown
* Pore volumes for activated carbon from Boppart, 1996 [41]
**Surface pH values for biochars from Travis, 2014 [3]
*** Packed bed density calculated from results of this research, as explained in Section 1.3.2 Biochar
2.2.2 Batch experiments Batch Kinetics
The batch adsorption kinetics experiments were performed to determine how much time should be allowed
for adsorption to reach equilibrium. The kinetic experiments were performed with varying doses of char

Control of Fecal Malodor by Adsorption onto Biochar
- 32 -
University of Colorado Boulder | Department of Civil, Architectural and Environmental Engineering
and 30 L of odor solutions to conservatively show time to equilibrium for multiple conditions. It was
assumed that kinetics for adsorption of singular malodor compounds, with smaller char doses, would
require the same or shorter time to reach equilibrium. Results for all experiments that adsorption of 30 L
of odorous air reached equilibrium after 48 hours, as shown in Figure 6. This result informed following
batch adsorption experiments in that a minimum of 48 hours was allowed for adsorption before olfactometry
measurements were taken to determine odor removal. Furthermore, odor levels did not significantly
degrade in the odor bags between 48 hours to 72+ hours.
Figure 6: Batch adsorption kinetics experiments.
Percent removal
The batch experiments were considered to show the maximum removal capacity of each char to remove
each malodor because a known amount of char was given time to reach adequate equilibrium with a known
amount of odor. Results are shown in Figure 7. A high removal percent indicates better adsorption by the
char, and better result towards the goal of removing malodor with biochar. All removal percentages ranged
between 20% to approximately 60%, with the median at 42%. ORS and ORS+H2S experienced the highest
removals. Of the individual non-sulfur malodors, butyric acid generally experienced higher removals.
Consistently, pine char has the worst odor removal ability. There was significant error associated with
0
50
100
150
200
250
300
350
0 10 20 30 40 50 60 70 80
Odorlevel(O.U./m
3)
Time(hours)
50mgdoseof
charin30LORS+
H2S500mgdoseof
charin30LORS
5000mgdoseof
charin30LORS

Control of Fecal Malodor by Adsorption onto Biochar
- 33 -
University of Colorado Boulder | Department of Civil, Architectural and Environmental Engineering
these results due to variability in odor panelists’ results. Based on the variability, the removal rates that
possibly were close to non-detectable were bamboo char’s ability to remove indole, and fecal and pine
char’s ability to remove p-cresol.
Figure 7: Percent removal of malodor by olfactometry measurements of D/T. Error bars represent standard error
of odor panel data.
Table 12 shows the starting and lowest treated odor levels achieved by adsorption in the batch experiments
and dynamic experiments. The non-sulfur malodors in mixture (ORS) led to an odor detection threshold
an order of magnitude higher than in singularity, indicating the synergistic quality of some human fecal
malodors. However, there was not a large difference in odor detection threshold when H2S was added to
the mixture, which could indicate an antagonistic quality of H2S odor with the others.
The initial odor levels are important to provide insight to the relationship between concentration of odor
molecules, and odor level perceived by the odor panel olfactometry; despite equal initial concentrations of
odor compounds, different compounds in singularity and in mixture were detected at different levels by the
odor panel. This speaks to the nonlinearity of human olfactory senses, and indicates that odor in mixture
have would lead to worse malodor nuisance, as in case of a latrine. A noteworthy limitation of this research

Control of Fecal Malodor by Adsorption onto Biochar
- 34 -
University of Colorado Boulder | Department of Civil, Architectural and Environmental Engineering
is the low odor levels for the butyric acid, indole and p-cresol odor solutions through experiments. These
low detection levels create a more significant challenge because there is more variability in human olfactory
senses at such low concentrations [37].
Table 12: Average initial and treated odor concentrations for all tested odor solutions
Note: Odor panel did not measure odor levels for flow-through experiments of ORS+H2S adsorption
2.2.3 Flow-through Columns Continuous-flow kinetics
In order to determine an appropriate contact time, a kinetics experiment was performed with three columns
of activated carbon to treat an air stream of the ORS odor solution, as described in Section
2.1.5 Flow-through Experiments. Figure 8 shows the results of this kinetics experiment, which indicate
noticeable differences in the three studied contact times; 0.5 seconds was inadequate to allow for adsorption
processes, 1.7 seconds broke through up to twice as fast as 3.6 seconds. It would be helpful to see how, or
if, this time to breakthrough would change at longer contact times. For this research, 3.6 seconds was the
absolute maximum achievable based on time and flow restrictions in the experimental set up. These results
led to a decision for a 2.7, which was seen as near 3.6 seconds, but significantly more reliable in collection
of adequate sample quantity. However, this decision represents a major limitation of this study; at 2.7
seconds, complete odor removal was not achieved, indicating the possibility of an inadequate time to allow
for full mass transfer. If the contact time could be increased beyond 3.6 seconds and breakthrough curves
were plotted on Figure 8, they may have achieved a continually lower initial breakthrough until zero
Batch experiments Flow-through experiments
Odor Solution Initial D/T level
Lowest treated D/T
level Initial D/T level
Lowest treated D/T
level
ORS 173 73 110 58
ORS+H2S 181 49 - -
Butyric Acid 15 7 34 8
Indole 23 12 18 7
p-Cresol 15 7 23 7
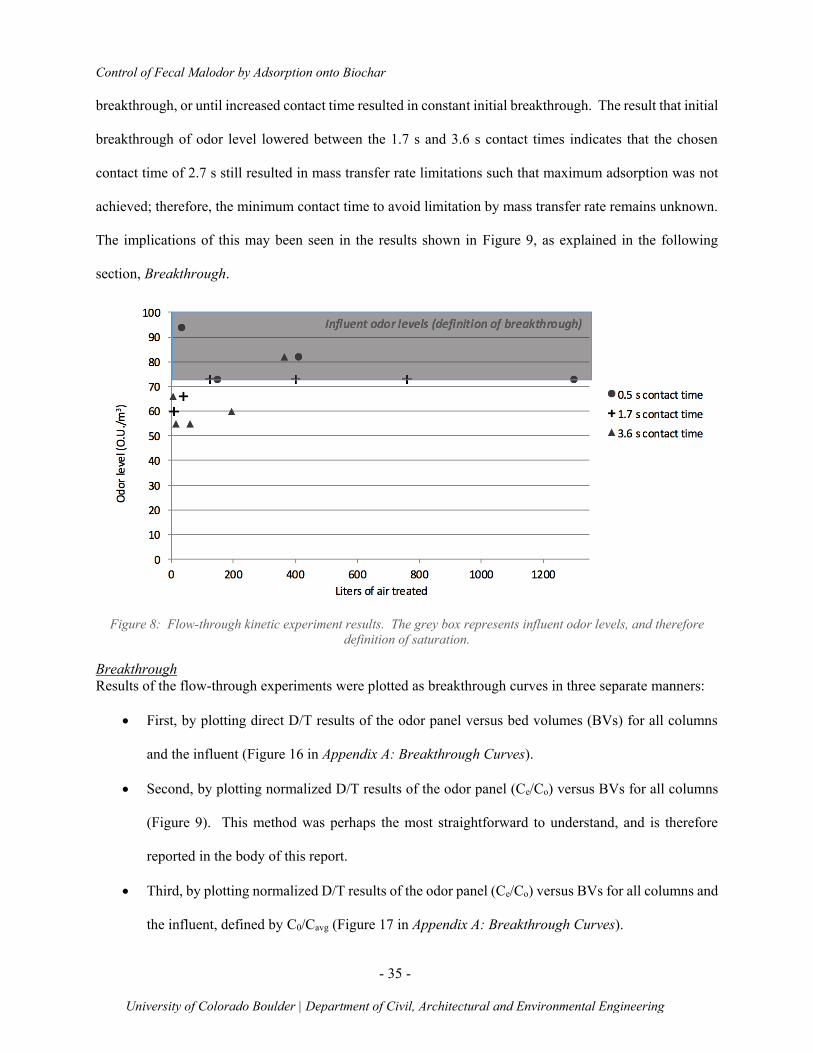
Control of Fecal Malodor by Adsorption onto Biochar
- 35 -
University of Colorado Boulder | Department of Civil, Architectural and Environmental Engineering
breakthrough, or until increased contact time resulted in constant initial breakthrough. The result that initial
breakthrough of odor level lowered between the 1.7 s and 3.6 s contact times indicates that the chosen
contact time of 2.7 s still resulted in mass transfer rate limitations such that maximum adsorption was not
achieved; therefore, the minimum contact time to avoid limitation by mass transfer rate remains unknown.
The implications of this may been seen in the results shown in Figure 9, as explained in the following
section, Breakthrough.
Figure 8: Flow-through kinetic experiment results. The grey box represents influent odor levels, and therefore
definition of saturation.
Breakthrough
Results of the flow-through experiments were plotted as breakthrough curves in three separate manners:
• First, by plotting direct D/T results of the odor panel versus bed volumes (BVs) for all columns
and the influent (Figure 16 in Appendix A: Breakthrough Curves).
• Second, by plotting normalized D/T results of the odor panel (Ce/Co) versus BVs for all columns
(Figure 9). This method was perhaps the most straightforward to understand, and is therefore
reported in the body of this report.
• Third, by plotting normalized D/T results of the odor panel (Ce/Co) versus BVs for all columns and
the influent, defined by C0/Cavg (Figure 17 in Appendix A: Breakthrough Curves).

Control of Fecal Malodor by Adsorption onto Biochar
- 36 -
University of Colorado Boulder | Department of Civil, Architectural and Environmental Engineering
Figure 9 shows that for all chars and odor solutions, there is initially breakthrough around 50%. This is
inconsistent with an expected breakthrough curve, as initially there is normally no breakthrough of an
adsorbent. This is likely due in part to the residual odor of the chars being picked up by the odor panel.
However, the fact that the ORS curve had initial breakthrough significantly above the residual odor level
of the char indicates that there likely must be another, or additional, explanation for immediate breakthrough
around 50%. One likely explanation is that the contact time through the columns was too short to allow
for full removal (see reasoning in Continuous-flow kinetics, above). Another possible explanation is the
non-linearity of the human olfactory senses; it is possible that if a miniscule concentration of a malodor
broke through, an odor panelist would detect this odor at a similar level to a higher concentration. However,
the linearity or lack of in olfactory odor detection is unknown for these particular odorants. Nevertheless,
at particularly low odor concentrations such as those exhibited by the treated odor solutions of singular
compounds, it has been shown in literature that, indeed, olfactory senses are not linear [37]. However, the
linearity, or lack of, in olfactory odor detection is unknown for these odorants.
p-Cresol experienced the highest variability, particularly for adsorption by the three biochars. This may be
explained by the low adsorptive capacity of these chars, as shown in the batch adsorption experiments (see
Section 2.2.2 Batch experiments). If not much is being removed, there may be higher variability in the odor
panel’s results due to nonlinearity and low odor levels.

Control of Fecal Malodor by Adsorption onto Biochar
- 37 -
University of Colorado Boulder | Department of Civil, Architectural and Environmental Engineering
Fig
ure
9:
Bre
akt
hro
ugh c
urv
es o
f fl
ow
-th
rou
gh
ad
sorp
tio
n e
xper
imen
ts f
or
all
od
or
solu
tio
ns
trea
ted b
y a
ll c
ha
r ty
pes
, n
orm
ali
zed b
y (v
ari
ab
le)
infl
uen
t odor
leve
ls.
Theo
reti
cal
def
init
ion
of
bre
akt
hro
ug
h,
or
full
sa
tura
tio
n, is
1.0
. H
ow
ever
, d
ue
to e
rro
r in
od
or
pan
el r
esu
lts,
bre
akt
hro
ug
h
ma
y b
e d
efin
ed a
t C
e/C
0 v
alu
e o
f bet
wee
n 0
.85
- 1
.0 o
r a
bo
ve.
Th
eore
tica
lly,
va
lues
of
Ce/
C0 c
an
no
t ex
ceed
1.0
. H
ow
ever
, to
du
e va
ria
bil
ity
of
infl
uen
t le
vels
ove
r ti
me,
an
d e
rro
r od
or
pa
nel
res
ult
s, e
xcee
da
nce
s o
f C
e/C
0 o
ver
1.0
are
rec
ord
ed.

Control of Fecal Malodor by Adsorption onto Biochar
- 38 -
University of Colorado Boulder | Department of Civil, Architectural and Environmental Engineering
In measurement of breakthrough in ORS+H2S experiments, the odor panel was not used and therefore ODT
and qc in units of O.U./m3 was not found. Instead, only H2S was measured with an H2S meter, and results
are shown Figure 10 below and in Figure 18 in Appendix A: Breakthrough Curves. H2S breakthrough
occurs immediately given the resolution of the sampling frequency. Activated carbon treated the most H2S
until saturation. Fecal char and activated carbon treated much more H2S until saturation compared to the
other two biochars, and did not breakthrough until after a dramatic 250,000 BVs. This is about twice as
many BVs of treatment compared to flow-through adsorption experiments of other malodors, and there was
no immediate breakthrough as in other experiments. Pine char, as in other adsorption experiments,
exhibited the poorest adsorption of malodor.
Figure 10: Breakthrough curves for H2S in flow-through adsorption experiments of ORS+H2S treated by all char
types (normalized by variable influent odor levels). The normalized variable influent odor curved is also shown in
red, which is defined by C0/C0,avg. Definition of saturation is when Ce/C0 passes 1.0.
Use Rate
Use rate was calculated and results shown in Figure 11. Use rate is a simple way to interpret one result of
a breakthrough curve; it tells us what quantity char can treat a quantity of air until saturation. However, it
does not indicate to what level odor was treated until saturation was achieved. Results are consistent with
batch experiments in that pine char consistent shows worst capacity for odor removal (highest use rate),
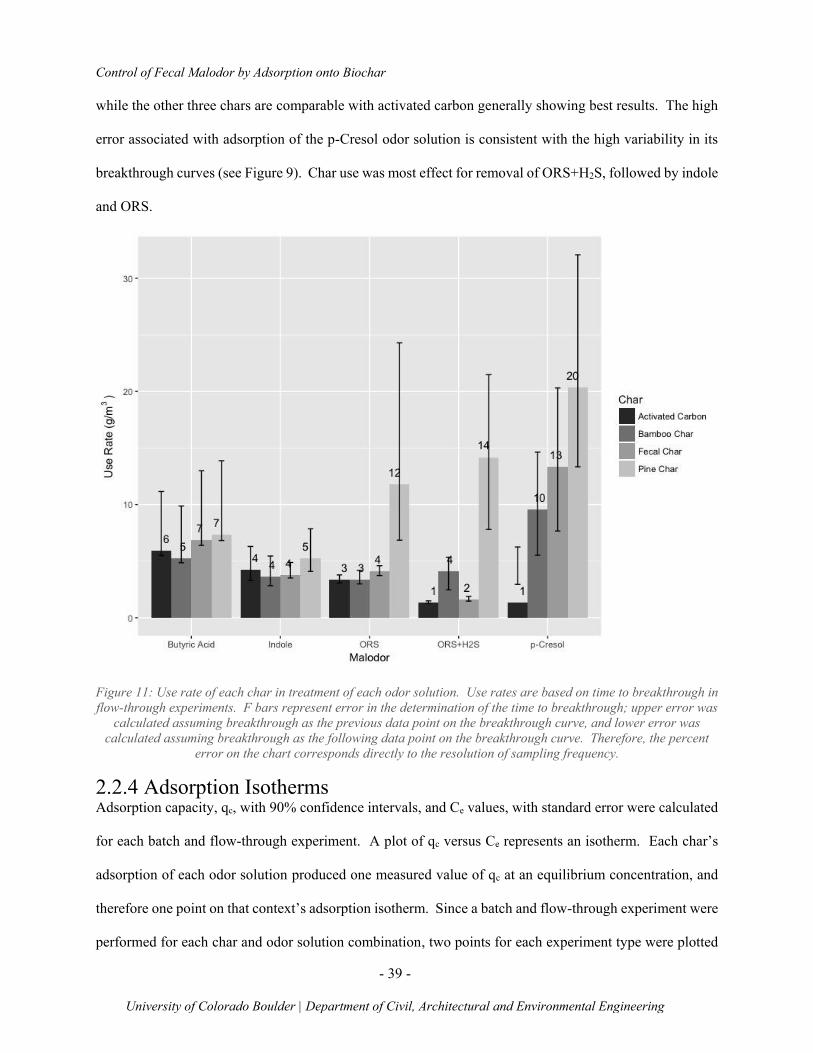
Control of Fecal Malodor by Adsorption onto Biochar
- 39 -
University of Colorado Boulder | Department of Civil, Architectural and Environmental Engineering
while the other three chars are comparable with activated carbon generally showing best results. The high
error associated with adsorption of the p-Cresol odor solution is consistent with the high variability in its
breakthrough curves (see Figure 9). Char use was most effect for removal of ORS+H2S, followed by indole
and ORS.
Figure 11: Use rate of each char in treatment of each odor solution. Use rates are based on time to breakthrough in
flow-through experiments. F bars represent error in the determination of the time to breakthrough; upper error was
calculated assuming breakthrough as the previous data point on the breakthrough curve, and lower error was
calculated assuming breakthrough as the following data point on the breakthrough curve. Therefore, the percent
error on the chart corresponds directly to the resolution of sampling frequency.
2.2.4 Adsorption Isotherms Adsorption capacity, qc, with 90% confidence intervals, and Ce values, with standard error were calculated
for each batch and flow-through experiment. A plot of qc versus Ce represents an isotherm. Each char’s
adsorption of each odor solution produced one measured value of qc at an equilibrium concentration, and
therefore one point on that context’s adsorption isotherm. Since a batch and flow-through experiment were
performed for each char and odor solution combination, two points for each experiment type were plotted

Control of Fecal Malodor by Adsorption onto Biochar
- 40 -
University of Colorado Boulder | Department of Civil, Architectural and Environmental Engineering
on the same plot, but each representative of that experiment type’s adsorption. These plots with isotherm
data are shown in
on a log-log scale, and in Figure 19 in Appendix B: Adsorption Isotherm Plots on a linear scale. In
understanding this data, it is vital to delineate fundamental differences between the batch and flow-through
data points; these two points do not belong on the same isotherm because the parameters for adsorption
were different, and could even have led to different adsorption mechanisms based of forced (flow-through)
versus passive (batch) adsorption. Instead, the data points should be understood as a single data point on
each isotherm, but are placed on the same plot for comparison’s sake. Each data point is expected to be a
point on a linear curve with a positive slope.
shows that flow-through capacities were consistently lower than batch capacities, despite operating at a
higher Ce. The relationship of two data points on each plot indicates that like the flow-through isotherm
lies below the batch isotherm. This leads to the conclusion that batch experiments led to to notably better
adsorption than flow-through experiments. Hypotheses for this includes inadequate contact time in the
column that leads to faster breakthrough, and column fouling by water vapor. Columns and bags were
operating at a RH of 64%. For most GAC adsorbents, water adsorption is significant when RH is above
about 40% [43]. When this happens, capillary condensation occurs in the column, meaning water vapor
condense in the micropores and complete for adsorption sites, which could significantly reduce adsorptive
capacity for odors. However, a high humidity such as this leads to greater water vapor loading onto the
char over a longer time of operation. The water vapor loading rate depended upon column density and time
to breakthrough, but the average column contained 3.60 g of char and the average time to breakthrough was
80.3 BVs, which led to an average water loading rate of 2.37 g-water/g-char ± 0.67 g-water/g-char.
Crittenden et al. [44] developed isotherms for water vapor loading onto several activated carbons. Although
NORIT ROZ 3 was not included, the operating RH of 64.4% for these experiments led to significant
adsorption by the activated carbons studied, up to 0.5 g-water/g-carbon. At 64.4%, all activated carbons

Control of Fecal Malodor by Adsorption onto Biochar
- 41 -
University of Colorado Boulder | Department of Civil, Architectural and Environmental Engineering
had already experience to portion of the isotherm of rapidly increasing adsorption, and neared a maximum
value. Based on this significant water vapor loading rate by a high RH, and known competition of water
vapor with other adsorbates, it is likely that fouling by water vapor occurred in the columns. High humidity
is a likelihood in many latrine settings, and the implications of fouling by water vapor are discussed in more
depth in the discussion of this report. In addition to fouling, there may have been further inhibition by
inadequate contact time (see reasoning in Continuous-flow kinetics, above), but even mass transfer rate
limitations likely would not account for inhibition that resulted in an order of magnitude lower capacity.

Control of Fecal Malodor by Adsorption onto Biochar
- 42 -
University of Colorado Boulder | Department of Civil, Architectural and Environmental Engineering
Fig
ure
12:
Adso
rpti
on e
xper
imen
t data
plo
tted
on
iso
ther
ms
plo
ts f
or
all
fo
ur
cha
rs’
ad
sorp
tio
n o
f th
e o
do
r so
luti
on
s o
n a
log
-lo
g s
cale
. E
ach
iso
ther
m p
lot
ha
s tw
o p
oin
ts o
n i
t: o
ne
for
the
ba
tch a
dso
rpti
on
exp
erim
ent,
an
d o
ne
for
the
flo
w-t
hro
ug
h a
dso
rpti
on
exp
erim
ent.
O
n a
lo
g-l
og
plo
t su
ch a
s th
is,
a t
ypic
al
isoth
erm
should
be
a s
traig
ht
lin
e w
ith
a p
osi
tive
slo
pe.
O
DT
wa
s n
ot
mea
sure
d f
or
OR
S+
H2S
for
flo
w-t
hro
ug
h e
xper
imen
ts

Control of Fecal Malodor by Adsorption onto Biochar
- 43 -
University of Colorado Boulder | Department of Civil, Architectural and Environmental Engineering
An isotherm plot was not created for ORS+H2S experiments in terms of qc in units of mg-H2S/g-char
because batch adsorption experiments did not result in a defined qc value because all H2S was adsorbed in
all experiments. Additionally, the flow-through adsorption experiments operated at the same equilibrium
concentration. Therefore, the adsorptive capacity found for H2S adsorption capacity in mixture with other
odor compounds is summarized for all chars in Table 13. The capacity found for activated carbon is
consistent with both typical values for chemical and physical adsorption of H2S: Bandosz et al. [45] found
chemical adsorption capacity that ranged from 5-295 mg-H2S/mg-char and Turk et al. [23] found physical
adsorption capacity that was around 10 mg-H2S/cm3-char, or ~30 mg-H2S/g-NORIT ROZ 3 activated
carbon. The capacities found for fecal char and bamboo char are similar to values found by Travis, 2014
[3] of 37.6 and 4.97 mg-H2S/mg-char, respectively. The first trial for ORS+H2S flow-through adsorption
experiment experienced a sudden, unplanned interruption in operation, after which pine char had
experienced H2S breakthrough but no other chars had. When the columns were restarted several days later,
pine char continued to adsorb all H2S for until a similar quantity of BVs were treated. This unexpected
result leads to two hypotheses. First, that H2S in the pine char column had been reversed, and all H2S
volatized into the headspace surrounding the column. Reversible adsorption would be indicative of a
physical adsorption process of H2S. A second hypothesis is that during the break in intermittent operation,
adsorption of water vapor was reversed and also volatized into the headspace surrounding the column. In
a sense, this would indicate regeneration of the char by allowing it to “dry out.”
Table 13: Adsorptive capacities for H2S adsorption in flow-through ORS+H2S adsorption experiments
Activated
carbon Fecal Char
Bamboo
Char Pine Char Units
Calculated qc 28.5 ± 2.8 25.6 ± 3.3 7.6 ± 1.8 3.2 ± 1.1 mg-H2S/mg-char
Ce 298 ± 74 298 ± 74 298 ± 74 298 ± 74 ppb H2S
Error associated with reported qc values represent the error in the course sampling frequency over time
in the flow-through experiments. Error associated with reported Ce values represent the standard
deviation of variable influent H2S levels over the course of the experiment.

Control of Fecal Malodor by Adsorption onto Biochar
- 44 -
University of Colorado Boulder | Department of Civil, Architectural and Environmental Engineering
2.3 Discussion
2.3.1 Adsorption ability The adsorption capacities from the batch experiments were used to understand the theoretical ability of
activated carbon and biochar to adsorb latrine odor. The batch results were used in this capacity, and the
flow-through results were ignored for three reasons. First, batch tests were more reliable because they did
not experience significant fouling like flow-through tests did. Second, batch tests represented a theoretical
maximum for adsorption because of reactor configuration. Third, batch tests were more comparable
between odor solutions because Ce for all odor solutions with singular compounds were very close, but
were more varied in flow-through experiments.
Figure 13 displays a simple view of the adsorption capacities found from all static experiments, for sake of
a quick comparison. For the odor solutions of singular malodors, adsorptive capacity ranged between from
non-detectable up to 20.1 ± 10.4 O.U./g, depending on the char and the malodor, at an average Ce of 11.5
± 4.2 O.U. For the mixtures of malodors, capacity averaged an order of magnitude higher, at 146 ± 29
O.U./g, at an average Ce of 83 ± 14 O.U. These results represent a significant reduction of odor for a small
amount of char.
However, in all scenarios, 40-50% of odor was usually removed, with a minimal removal close to 20% and
a maximum removal above 60% (see Figure 7). This also represents a significant reduction in odor levels.
While the quantity of malodor molecules removed is unknown, methods of this research result in a
measurement of reduction of odor detection by humans. A potential reduction in the level of malodor
nuisance of a latrine by half, using adsorption onto biochar, could represent a significant benefit from a
simple technology.

Control of Fecal Malodor by Adsorption onto Biochar
- 45 -
University of Colorado Boulder | Department of Civil, Architectural and Environmental Engineering
Figure 13: Adsorptive capacity, qc, for all static experiment tests. Error bars represent the standard error
associated with odor panel variability.

Control of Fecal Malodor by Adsorption onto Biochar
- 46 -
University of Colorado Boulder | Department of Civil, Architectural and Environmental Engineering
Ignoring some failures of adsorption by pine char, and some failures of adsorption of p-cresol, all malodors
tested were able to be adsorbed by all chars. In continuous-flow operation, saturation was not achieved
until an impressive average of 80,300 BVs, and some biochars achieved well over 100,000 BVs. Despite
differences in adsorption characteristics and adsorptive inefficiencies during continuous-flow operation, all
chars adsorbed odor somewhat comparably to a leading modified activated carbon for gas-phase adsorption.
2.3.2 Influence of char and malodor properties When comparing the chars’ adsorption characteristics, results from the p-Cresol odor solution will be
largely ignored due its relatively low capacity and resulting high variability; at such low values, it is difficult
to delineate differences. In evaluation of the adsorption of each odor solution, errors bars between all chars
overlap and adsorption capacities were similar, for the most part. Therefore, a primary result of this work
is that all char are acceptable adsorbents. Nevertheless, pine char had consistently the lowest adsorptive
capacity. Pine char also had starkly worse surface characteristics for adsorption; pore volume was an order
of magnitude lower than other chars, and surface area was 2-3 orders of magnitude lower than other chars
(see Table 11). This presents a likely explanation for pine char’s poor performance compared to other
chars.
Because the rest of the chars exhibit more acceptable surface area and pore volume, their performance is
compared to each other in regard to adsorption of each malodor. In indole adsorption, performance between
chars is so similar that a definitive conclusion about ideal pore structure is difficult. However, indole has
the largest Kao (see Table 3), which is likely indicative of its overall notably better adsorption than butyric
acid and p-cresol. Similarly, adsorption of p-cresol was non-definitive in comparison between biochars
due to the process’s high variability and low adsorption. In adsorption of butyric acid, fecal char
outperforms activated carbon and bamboo char. Based on the differences in pore volume fractions between
chars, this could indicate an affinity of butyric acid for adsorption in mesopore sites; while activated carbon
has the largest volume in each type of pore, the mesopore volume in fecal char is the only pore volume of

Control of Fecal Malodor by Adsorption onto Biochar
- 47 -
University of Colorado Boulder | Department of Civil, Architectural and Environmental Engineering
a biochar that is on par with that of activated carbon (see Table 11). The importance of mesopore volume
in adsorption is further supported by the evidence of fouling by water vapor; water likely filled the
micropore sites, so that adsorption of malodors primarily occurred in the mesopore. Otherwise, the
consistently high adsorption by activated carbon followed by fecal char is likely a result of activated
carbon’s highest surface area and pore volume.
H2S has the largest Kaw (see Table 3) but smallest Kow, and experienced very good adsorption in relation to
other malodors. The high Kaw may indicate that more of this malodor partitioned into the aqueous dissolved
phase in the presence of humidity before adsorption. Additionally, the low Kow but high adsorption may
be explained by a hypothesis that H2S was not physically adsorbed to the extent that other malodors were,
but instead was chemically adsorbed. For hydrogen sulfide, the likely mechanism for this process is
catalytic oxidation of H2S to elemental sulfur. In this process, after water is adsorbed onto the carbon’s
surface, H2S and oxygen dissolve into the water. Within the water-filled pores, oxygen radicals react with
hydrogen sulfide ions to form elemental sulfur and water [46].
2.3.3 Importance of Humidity This research shows that humidity can have a significant inhibitory effect to odor adsorption by char. For
all experiments, the difference between the flow-through and batch qc was calculated. The median was
89%, meaning the flow-through qc was typically 11% that of the batch qc, or an order of magnitude lower,
despite a higher equilibrium concentration.
This is of particular importance to FSM settings, as generally a latrine pit, depending upon quality of
ventilation, would have very high humidity. In addition, many developing countries experience temperate,
humid climates. While fouling by humidity may have detrimental effects to filter performance, simple
regeneration may also be possible by allowing physical sorption of char vapor to reverse and desorb, then

Control of Fecal Malodor by Adsorption onto Biochar
- 48 -
University of Colorado Boulder | Department of Civil, Architectural and Environmental Engineering
evaporate. To understand the implications of humidity better, and possible regeneration or reversal of water
vapor adsorption, these variables should be included in future field trials.

Control of Fecal Malodor by Adsorption onto Biochar
- 49 -
University of Colorado Boulder | Department of Civil, Architectural and Environmental Engineering
CHAPTER THREE: IMPLICATIONS

Control of Fecal Malodor by Adsorption onto Biochar
- 50 -
University of Colorado Boulder | Department of Civil, Architectural and Environmental Engineering
3.1 General Conclusions This research has served as a proof-of-concept that biochar can effectively adsorb latrine malodor and can
perform as a comparable alternative to modified activated carbon. Furthermore, it was shown that an array
of biochars could adsorb odor successfully, which indicates that type of biochar used in a specific context
is flexible; a latrine user or owner could access biochar made from the most convenient local organic waste
materials, pyrolyzed in the most convenient local technology. Odor control by adsorption using biochar
has potential to provide a radically simple, economic and widely available technology with potential impact
in the global sanitation crisis.
3.2 Possible filter designs and biochar requirements The use rates and efficiencies from this research are useful to develop preliminary filter designs for fecal
odor adsorption in latrines, and inform estimates of filter lifetime for these designs. Three possible designs
in varying settings, and varying adsorption technologies, are described here. All designs are based upon a
superstructure volume of 1.8 m3 [47] and the assumption that the superstructure is full of odorous air at
odor concentrations used for this research. The parameters of design and resulting biochar requirements
are summarized for all three designs in Table 14.
An important note is that all designs are based upon use of the fecal char used in this study. Adsorption
characteristics and performance are based upon fecal char’s results in this study. In comparison to the
activated carbon’s performance determined in this research, activated carbon would perform about 25%
better; the use rate of 4 g/m3-air for fecal char is used for the following design work, while activated carbon
achieved a use rate of `3 g/m3-air (Figure 11).
3.2.1 Biochar cartridge filter for odor treatment of VIP latrine exhaust Ventilated improved pit (VIP) latrines are common in developing country settings, and is designed with an
air exhaust pipe which may lend well to a cartridge filter before to treat exhaust odor. A typical VIP latrine

Control of Fecal Malodor by Adsorption onto Biochar
- 51 -
University of Colorado Boulder | Department of Civil, Architectural and Environmental Engineering
is shown in Figure 14. The careful design for ventilation in a VIP latrine is already aimed to combat
malodor issues, which is a major advantage of the design. Nevertheless, many VIP latrines around the
world do not ventilate properly enough to have acceptable odor; for example, the Chappuis et al. study [9]
included several VIPs with malodor issues in their measurements that founded the odor treatment studied
in this research. Typically, a VIP latrine is recommended to be designed for 6 air changes per hour (ACH)
for acceptable odor control [48][47]. However, this range can vary; 10-20 ACHs will lead to ideal odor
conditions [47], and some guidelines are set at 2 ACH [49], which may be inadequate for odor control.
This preliminary design will assume 2 ACH, to address under-performed VIP latrines.
Figure 14: Schematic of air flow through a VIP latrine and out of the the exhaust vent. Image courtesy of WHO,
1992 [50].
Exhaust gas from a typical VIP may be treated as follows: A biochar cartridge filter, designed similarly to
a typical GAC cartridge filter, is placed inside the upper end of the exhaust pipe (so that it may be more
easily accessed for replacement) but not at the end so that the wind outside, (which is the primary driver
for air flow [47]) still draws air through the ventilation path. Filter diameter may be adjusted according to
existing exhaust pipe diameter, but a typical recommended diameter of 150 mm is used. Assuming a char
use rate of 4 g/m3 (Figure 11) and the typical values described above, the biochar filter would last about 5
days, which would represent a need for a staggering 31 kg of biochar each month. All relevant design

Control of Fecal Malodor by Adsorption onto Biochar
- 52 -
University of Colorado Boulder | Department of Civil, Architectural and Environmental Engineering
parameters and resulting filter lifetimes are described in Table 14. The filter could be containing inside
PVC pipe or whatever material makes up the vent pipe, for ease of integration.
Nevertheless, this design represents a conservative estimate because it assumes a constant odor loading
rate. In actuality, there may be variable odor loading rates when a cartridge is installed and successfully
treating odor; initially after use odor loading may increase, then decrease after further treatment.
Advantages of the biochar cartridge filter for odor treatment of VIP latrine exhaust include the simplicity
to adapt into an, existing common type of latrine with known odor issues. Disadvantages include the
significant, potentially prohibitive, biochar quantity requirements.
3.2.2 Biochar cartridge filter for active adsorption in a latrine superstructure Beyond VIP latrines, many latrine types experience malodor nuisance. Still, biochar can also as a filter to
latrines without a built-in stream of odorous air. One possible design is a cartridge filter like previously
described, but under different operating conditions. A cartridge filter must be designed in a location to
allow for adequate mass transfer for adsorption to occur; there needs to be a forced air stream through the
filter in order to remove odor. A similar, simple cartridge filter could be designed according to the
specifications in Table 14, and contained in an affordable, locally available material such as PVC pipe. The
cartridge filter should be sealed within the ceiling of the superstructure, and a small, solar powered fan
secured on the outside of the biochar cartridge. A small fan like that displayed in Figure 15 could, with
some degree of simplicity be sealed into the superstructure ceiling to pull air into a PVC pipe housing the
char. The ventilation should be placed across from a doorway, in design to draw air to treat from the
superstructure rather than the pit. A fan like the one in Figure 15 would have minimal energy requirements
to be supported by a small solar panel outside the latrine.

Control of Fecal Malodor by Adsorption onto Biochar
- 53 -
University of Colorado Boulder | Department of Civil, Architectural and Environmental Engineering
Figure 15: Possible vacuum pump for active adsorption biochar filter. Image courtesy of Ventilene [51]
In this design for a normal latrine superstructure, the volume of odorous air can be assumed to be less than
a VIP, assuming the flow rate of ventilated air through the structure is less. This preliminary design assumes
use of a family latrine about 10 times per day, and the need to treat the superstructure’s volume of air after
each use assuming the pit is covered. This would result in about 0.5 ACH, with around a 20% factor of
safety. Assuming a char use rate of 4 g/m3 (Figure 11) and the typical values described above, the biochar
filter would need to be replaced every 14 days. All relevant design parameters and resulting filter lifetimes
are described in Table 14.

Control of Fecal Malodor by Adsorption onto Biochar
- 54 -
University of Colorado Boulder | Department of Civil, Architectural and Environmental Engineering
Table 14: Design parameters proposed cartridge biochar filters for active adsorption of VIP exhaust and
superstructure fecal odor
Design parameter Cartridge filter
for VIP exhaust
Superstructure
active adsorption
cartridge filter
Units Source
Char use rate 4 4 g/m3 This report
Volume of
superstructure 1.8 1.8 m3 Mara and Ryan
[47]
Air changes per
hour 2 0.5 ACH ASHRAE [49]
Filter diameter 0.20 0.15 m Mihelcic et al.
[48]m
Ratio of
filter:particle size
diameters
15 15 Set from typical
values
Average diameter
of GAC/PAC
particles
13 10 mm
Flow rate through
column 3.6 0.9 m3/hr
Contact time 10 10 seconds Set from typical
values
Bed depth 0.32 0.14 m
Aspect ratio 1.6 0.9 Set from typical
values
Bed density 469 469 kg/m3 This report
Mass of biochar
inside filter 4.68 1.17 kg
Filter lifetime 4.5 14 days
Biochar
requirement 31 2.6
kg-char/
month
Similarly to the cartridge filter for VIP exhaust described above, this design represents a conservative
estimate because it assumes constant odor loading rate, despite a likely reality that the modeled odor loading
represents an estimate for a maximum concentration of malodors that decreases soon after treatment.
Because these kinetics are not known, the maximum was assumed for these design calculations.

Control of Fecal Malodor by Adsorption onto Biochar
- 55 -
University of Colorado Boulder | Department of Civil, Architectural and Environmental Engineering
Advantages of the biochar cartridge filter for active adsorption of odor in a latrine superstructure include
the lower char quantity requirements, and adaptability to all superstructures. Disadvantages include the
significant, potentially prohibitive, technology and power requirements.
3.2.3 Biochar mesh filter for passive adsorption in a latrine superstructure One of the major findings of this research is the significant difference between a forced-flow continuous
flow column, and passive adsorption in a batch reactor. Given that the batch reactor design gave way to
adsorption capacities an order of magnitude higher, it is worthwhile to propose an odor treatment method
that mimics the process of passive adsorption in a batch reactor. Similar to the batch adsorption experiments
of this report, this filter would be in a location with significant RH, but would not force water vapor onto
biochar at a significant loading rate. Therefore, a lower use rate was assumed for the char in this filter
design at 0.7 g/m3, to mimic the dose of char in the odorous batch experiments.
One filter design that could achieve passive adsorption is a mesh bag with a thin layer of biochar, that would
line the ceiling. A polyester multifilament media is an economic mesh that could contain the ground biochar
down to 100 microns, which would be sufficient for powdered biochar passing US mesh size 50, as in this
research [52]. A simple, square or rectangular frame could be made to match the superstructure’s ceiling
dimensions, and sewn inside a mesh bag of the same dimension in order the keep the resting surface for the
char taut. The lightweight, square mesh bag filter could be easily suspended from or attached to the
superstructure’s ceiling. A very thin layer of powdered biochar could be distributed along the horizontal,
taut surface of the char to allow for passive adsorption of odors in the latrine.
Assuming the need for odor treatment described in the previous section that results in same ACH of 0.5,
and the typical values described above, the biochar filter would need to be replaced approximately once per
month. All relevant design parameters and resulting filter lifetimes are described in Table 15.

Control of Fecal Malodor by Adsorption onto Biochar
- 56 -
University of Colorado Boulder | Department of Civil, Architectural and Environmental Engineering
Table 15: Design parameters proposed mesh biochar filters for passive adsorption of superstructure fecal odor
Design parameter
Superstructure
passive adsorption
mesh filter
Units Source
Char use rate 0.7 g/m3 This report
Volume of
superstructure 1.8 m3 Mara and Ryan
[47]
Ceiling area 0.9 m2 Kunzle and O’Keefe
[53]
Air changes per hour 2 ACH Assumed
Depth of char in
mesh filter 1 mm Assumed
Average bed density 469 kg/m3 This report
Mass of biochar
inside filter 0.42 kg
Filter lifetime 29 days
Biochar requirement 0.43 kg-char/ month
Advantages of the biochar mesh filter for passive adsorption of odor in a latrine superstructure include the
significantly lower char quantity requirements, and adaptability to all superstructures. Disadvantages
include a potential issue for adequate mass transfer in adsorption. This design, and all, have much room
for interpretation and further development in pilot testing.
3.3 Field trials The methods of this proof-of-concept study included the synthesis and treatment of latrine malodor in a
laboratory bench-scale setting. While this method was successful, it is a significant step from an adequate
understanding of this technology’s ability to be a feasible solution to malodor nuisance issues in FSM
supply chains. Results demonstrated that adsorption in continuous-flow was inefficient compared to a
theoretical maximum adsorptive capacity, even under the controlled conditions in a laboratory. Some of
these results indicate a potentially prohibitively high biochar requirement for a cartridge filter. Therefore,
a major conclusion of this study is the necessity of carefully designed field trials to better understand the
resilience of adsorption by biochar under dynamic conditions.

Control of Fecal Malodor by Adsorption onto Biochar
- 57 -
University of Colorado Boulder | Department of Civil, Architectural and Environmental Engineering
Design of field trials should consider investigation of the following variables: humidity, intermittent
operation, dynamic air loading rates, dynamic odor loading rates, latrine type and structure, and filter style
and design specifications. It is hypothesized that high humidity will decrease char lifetime, based on results
of this study (see Section 2.3.3 Importance of Humidity). However, results also suggested that adsorption
of water vapor onto char may be reversible. The ability and feasibility to reverse fouling by water vapor
must be better understood; this study demonstrated a drastic negative affect of fouling on adsorption
performance and capacity. If fouling is better understood, fouling conditions may be better controlled and
then lead to better technology success. Control for fouling could be achieved by a dehumidification process,
or more simply specifications for filter placement in the most well-ventilated areas of a latrine.
Furthermore, regeneration of biochar may be possible but was not purposely investigated in this study.
Results may indicate that if malodor adsorption was achieved by physical adsorption processes, reversal
and volatilization from the char may be simple. Regeneration could significantly extend biochar lifetime.
It is hypothesized that perhaps even intermittent operation may regenerate char from water vapor fouling
or reverse physical adsorption, which would extend char lifetime. Conversely, intermittent operation could
have a nominal effect on filter performance, as in water phase adsorption [54]. Perhaps it is even possible
that dynamic air loading rates may imitate intermittent operation. Based on expected adsorption
characteristics, increased odor loading rate should increase adsorption capacity. Additionally, decreased
odor loading rates, as a result of a decrease in odor level after a malodor event from latrine use has been
treated by the char, could increase char lifetime.
In field trials, odor measurement method should be carefully considered. The primary decision regarding
methods will be between quantitative and qualitative methods. Differences between and opportunities for
these methods are explained in Section 2.1.2 Odor Measurement. Results of this study would inform this
decision based on the demonstrated non-linearity on odor detection throughout results. Since the
concentrations were at relatively low levels in this study (somewhat near their ODT), a higher degree of
Control of Fecal Malodor by Adsorption onto Biochar
- 58 -
University of Colorado Boulder | Department of Civil, Architectural and Environmental Engineering
nonlinearity is such a fashion that as concentration decreases, odor detection would also decrease but at a
decreasing rate. In other words, at low odor levels, a significant reduction in concentration of malodor
molecules would result in a less significant reduction in odor detection. For example, if a quantitative
method is used in a field trial and a 90% reduction in odor concentration is observed, the reduction in
malodor nuisance on the user may still be minimal at low odor levels. Conversely, for example, a 10%
reduction in odor concentration at very high odor levels may be quite dramatic. The degree and
characteristics of nonlinearity of fecal malodors is unknown in the scientific community such that we may
only draw a qualitative description between “high” and “low” odor levels. Unfortunately for adsorption’s
ability to reduce malodor nuisance, odor levels exhibited probably in most latrine settings would fall closer
towards the “low odor” end of the spectrum.
Finally, it must be noted that the implementation of a biochar filter in latrine for malodor treatment may
represent a significant change for latrine users, owners, or other stakeholders. It would represent a
technology intervention that would require a behavior change (to replace or maintain the filter
appropriately). Behavior change in developing world contexts is a complex and important field of study.
As the simplest investigation, willingness of users to use latrines with biochar filters, and willingness of
owners to maintain or replace biochar filters, must be understood for the implementation of this technology
to be successful.

Control of Fecal Malodor by Adsorption onto Biochar
- 59 -
University of Colorado Boulder | Department of Civil, Architectural and Environmental Engineering
References
[1] “Progress on Sanitation and Drinking Water: 2015 Update and MGD Assessment.” WHO / UNICEF
Joint Monitoring Programme, 2015.
[2] “Goal 6 .:. Sustainable Development Knowledge Platform.” [Online]. Available:
https://sustainabledevelopment.un.org/sdg6.
[3] Travis, “Pyrolysis of human feces: odor and odor treatment options,” Master of Science, University of
Colorado, Boulder, CO, 2014.
[4] M. Deshusses, K. Jooss, and K. Linden, “Duke University / University of Colorado Boulder Sanitation
Odor Survey.” 21-Oct-2016.
[5] M. Schlegelmilch, J. Streese, and R. Stegmann, “Odour management and treatment technologies: An
overview,” Waste Management, vol. 25, no. 9, pp. 928–939, 2005.
[6] L. Brieger, “About the volatile constituents of the human excrement,” J. Prakt. Chem., vol. 179, pp.
124–138, 1878.
[7] H. Sato, T. Hirose, T. Kimura, Y. Moriyama, and Y. Nakashima, “Analysis of Malodorous Volatile
Substances of Human Waste: Feces and Urine,” Journal of Health Science, vol. 47, no. 5, pp. 483–
490, 2001.
[8] J. G. Moore, L. D. Jessop, and D. N. Osborne, “Gas-chromatographic and mass-spectrometric analysis
of the odor of human feces,” Gastroenterology, vol. 93, no. 6, pp. 1321–1329, Dec. 1987.
[9] C. J.-F. Chappuis, Y. Niclass, C. Vuilleumier, and C. Starkenmann, “Quantitative Headspace Analysis
of Selected Odorants from Latrines in Africa and India,” Environ. Sci. Technol., vol. 49, no. 10, pp.
6134–6140, May 2015.
[10] “HYDROGEN SULFIDE | CAMEO Chemicals | NOAA.” [Online]. Available:
https://cameochemicals.noaa.gov/chemical/3625.
[11] F. Wilby, “Variation in Recognition Odor Threshold of a Panel,” Journal of the Air Pollution Control
Association, vol. 19, no. 2, pp. 96–100, 1969.
[12] “methanethiol | CH3SH - PubChem.” [Online]. Available:
https://pubchem.ncbi.nlm.nih.gov/compound/878#section=Experimental-Properties.
[13] “indole | C8H7N - PubChem.” [Online]. Available:
https://pubchem.ncbi.nlm.nih.gov/compound/798#section=Color.
[14] “butyric acid | C4H8O2 - PubChem.” [Online]. Available:
https://pubchem.ncbi.nlm.nih.gov/compound/264#section=Natural-Occurring-Sources.
[15] “P-CRESOL | CH3C6H4OH - PubChem.” [Online]. Available:
https://pubchem.ncbi.nlm.nih.gov/compound/2879#section=Surface-Tension.
[16] “3-METHYLINDOLE | C9H9N - PubChem.” [Online]. Available:
https://pubchem.ncbi.nlm.nih.gov/compound/6736#section=Natural-Occurring-Sources.
[17] R. P. Schwarzenbach, P. M. Gschwend, and D. M. Imboden, “Sorption I: General Introduction and
Sorption Processes Involving Organic Matter,” in Environmental Organic Chemistry, John Wiley &
Sons, Inc., 2002, pp. 275–330.
[18] B. Rajbansi, U. Sarkar, and S. E. Hobbs, “Hazardous odor markers from sewage wastewater: A step
towards simultaneous assessment, dearomatization and removal,” Journal of the Taiwan Institute of
Chemical Engineers, vol. 45, no. 4, pp. 1549–1557, Jul. 2014.
[19] K. Corey and L. Zappa, “Odor Control ‘ABC’s: How to Compare and Evaluate Odor Control
Technologies.” Global Environmental Solutions, Inc.
[20] A. Turk and A. Stern, “Adsorption,” in Air Pollution, 3rd ed., vol. IV, Chapter 8, Orlando, FL:
Academic Press, 1977.
[21] W. Feng, S. Kwon, E. Borguet, and R. Vidic, “Adsorption of Hydrogen Sulfide onto Activated Carbon
Fibers: Effect of Pore Structure and Surface Chemistry,” Environ. Sci. Technol., vol. 39, no. 24, pp.
9744–9749, Dec. 2005.

Control of Fecal Malodor by Adsorption onto Biochar
- 60 -
University of Colorado Boulder | Department of Civil, Architectural and Environmental Engineering
[22] A. K. Dalai, M. T. Cundall, and M. De, “Direct oxidation of hydrogen sulphide to sulphur using
impregnated activated carbon catalysts,” The Canadian Journal of Chemical Engineering, vol. 86,
no. 4, pp. 768–777, Aug. 2008.
[23] A. Turk, E. Sakalis, J. Lessuck, H. Karamitsos, and O. Rago, “Ammonia injection enhances capacity
of activated carbon for hydrogen sulfide and methyl mercaptan,” Environ. Sci. Technol., vol. 23, no.
10, pp. 1242–1245, Oct. 1989.
[24] K. Hinokiyama, K. Nishida, M. Osako, and N. Muto, “Adsorbent characteristics of hydrogen sulfide
and methyl mercaptan in single and mixed systems,” International Journal of Environmental Studies,
vol. 38, no. 1, pp. 25–40, Jul. 1991.
[25] Y. Hwang, T. Matsuo, K. Hanaki, and N. Suzuki, “Removal of odorous compounds in wastewater by
using activated carbon, ozonation and aerated biofilter,” Water Research, vol. 28, no. 11, pp. 2309–
2319, Nov. 1994.
[26] J. Lehmann, “A handful of carbon,” Nature, vol. 447, no. 7141, pp. 143–144, May 2007.
[27] D. Day, R. J. Evans, J. W. Lee, and D. Reicosky, “Economical CO2, SOx, and NOx capture from fossil-
fuel utilization with combined renewable hydrogen production and large-scale carbon sequestration,”
Energy, vol. 30, no. 14, pp. 2558–2579, Nov. 2005.
[28] T. Asada, S. Ishihara, T. Yamane, A. Toba, A. Yamada, and K. Oikawa, “Science of Bamboo Charcoal:
Study on Carbonizing Temperature of Bamboo Charcoal and Removal Capability of Harmful Gases,”
Journal of Health Science, vol. 48, no. 6, pp. 473–479, 2002.
[29] W. M. Meylan and P. H. Howard, “Estimating octanol–air partition coefficients with octanol–water
partition coefficients and Henry’s law constants,” Chemosphere, vol. 61, no. 5, pp. 640–644, Nov.
2005.
[30] “HSDB.” [Online]. Available: https://toxnet.nlm.nih.gov/newtoxnet/hsdb.htm.
[31] C. Hansch, A. Leo, and D. Hoekman, “Exploring QSAR, ACS Professional Reference Book,” ACS:
Washington DC, vol. 269, 1995.
[32] E. Cuevasanta, A. Denicola, B. Alvarez, and M. N. Möller, “Solubility and Permeation of Hydrogen
Sulfide in Lipid Membranes,” PLoS ONE, vol. 7, no. 4, p. e34562, Apr. 2012.
[33] P. Gostelow, S. A. Parsons, and R. M. Stuetz, “Odour measurements for sewage treatment works,”
Water Research, vol. 35, no. 3, pp. 579–597, Feb. 2001.
[34] Charles M. McGinley, Michael A. McGinley, and Donna L. McGinley, “‘Odor Basics’, Understanding
and Using Odor Testing.” St. Croix Sensory Inc. / McGinley Associates, P.A., 2000.
[35] “VDI 3882 Part 1. Olfactometry: Determination of Odour Intensity,” VDI: The Association of German
Engineers, Oct. 1992.
[36] “EN 13725 Air Quality - Determination of Odour Concentration by Dynamic Olfactometry.” European
Committee for Standardization (CEN), Brussels (B), 2003.
[37] Christine Vuilleumier, Matthijs van de Waal, Henri Fontannaz, Isabelle Cayeux, and Pierre-Andr6
Rebetez, “Multidimensional Visualization of Physical and Perceptual Data Leading to a Creative
Approach in Fragrance Development,” Perfumer & Flavorist, vol. 23, no. 9, pp. 54–61, Sep. 2008.
[38] P. J. Bliss, T. J. Schulz, T. Senger, and R. B. Kaye, “Odour measurement — factors affecting
olfactometry panel performance,” Water Science and Technology, vol. 34, no. 3, pp. 549–556, Jan.
1996.
[39] G. Leonardos, “Selection of Panelists,” Journal of the Air Pollution Control Association, vol. 30, no.
12, pp. 1297–1297, Dec. 1980.
[40] T. J. Schulz and A. P. van Harreveld, “International moves towards standardisation of odour
measurement using olfactometry,” Water Sci Technol, vol. 34, no. 3–4, p. 541, Aug. 1996.
[41] S. Boppart, “Impregnated carbons for the adsorption of H2S and mercaptans,” ACS Fuels, vol. 41, no.
1, pp. 389–393, Mar. 1996.
[42] G. Shang, G. Shen, L. Liu, Q. Chen, and Z. Xu, “Kinetics and mechanisms of hydrogen sulfide
adsorption by biochars,” Bioresource Technology, vol. 133, pp. 495–499, Apr. 2013.
Control of Fecal Malodor by Adsorption onto Biochar
- 61 -
University of Colorado Boulder | Department of Civil, Architectural and Environmental Engineering
[43] D. W. Hand, D. R. Hokanson, and J. C. Crittenden, “Gas-liquid processes: principles and applications,”
in Water Quality and Treatment: A Handbook on Drinking Water, 6th ed., J. K. Edzwald, Ed. McGraw
Hill: American Water Works Association, 2010.
[44] John C. Crittenden, Timothy J. Rigg, David L. Perram, Shin Ru Tang, and David W. Hand, “Predicting
Gas‐Phase Adsorption Equilibria of Volatile Organics and Humidity,” Journal of Environmental
Engineering, vol. 115, no. 3, Issue: object: doi: . /joeedu.1989.115.issue-3, revision:
rev:1479387476186-13412:doi:10.1061/joeedu.1989.115.issue-3 1061.
[45] T. J. Bandosz, “On the adsorption/oxidation of hydrogen sulfide on activated carbons at ambient
temperatures,” J Colloid Interface Sci, vol. 246, no. 1, pp. 1–20, Feb. 2002.
[46] K. Hedden, L. Humber, and B. R. Rao, “VDI-Bericht 253 S. 37/42.” VDI-verlag, Dusseldorf, 1977.
[47] D. D. Mara and A. B. Ryan, “Ventilated Improved Pit Latrines: Vent Pipe Design Guidelines.” United
Nations Development Programme and World Bank, 1983.
[48] J. R. Mihelcic, L. M. Fry, E. A. Myre, L. D. Phillips, and B. D. Barkdoll, Eds., Field Guide to
Environmental Engineering for Development Workers: Water, Sanitation, and Indoor Air. Reston,
VA: American Society of Civil Engineers, 2009.
[49] ASHRAE Handbook - Fundamentals. Atlanta: ASHRAE, 2005.
[50] R Franceys, J Pickford, and R Reed, “Guide to the Development of On-site Sanitation.” WHO, 1992.
[51] “Ventline Residential Style Bathroom Vent w/ 12V Fan - 9-5/8" Diameter - White Ventline RV Vents
and Fans V2290-50.” [Online]. Available: http://www.etrailer.com/RV-Vents-and-
Fans/Ventline/V2290-50.html?feed=npn&gclid=CPa5y9_bhtECFcq2wAodXhMFAQ.
[52] “Mesh Filter Bags - Les Hall Filter Service.” [Online]. Available:
http://www.leshallfilter.com/products-applications/bag-filtration/mesh-filter-bags/.
[53] Rahel Kunzle and Mark O’Keefe, “Latrine dimensions in Nairobi, Kenya.” Blue Diversion Toilets,
2014.
[54] C. J. Corwin and R. S. Summers, “Adsorption and desorption of trace organic contaminants from
granular activated carbon adsorbers after intermittent loading and throughout backwash cycles,”
Water Research, vol. 45, no. 2, pp. 417–426, Jan. 2011.

Control of Fecal Malodor by Adsorption onto Biochar
- 62 -
University of Colorado Boulder | Department of Civil, Architectural and Environmental Engineering
Appendix A: Breakthrough Curves
Fig
ure
16:
Bre
akt
hro
ugh c
urv
es o
f fl
ow
-th
rou
gh
ad
sorp
tio
n e
xper
imen
ts f
or
all
od
or
solu
tio
ns
trea
ted b
y a
ll c
ha
r ty
pes
, p
lott
ed w
ith
th
e va
riab
le
infl
uen
t odor
leve
ls.
Def
init
ion o
f sa
tura
tion
is
theo
reti
call
y w
hen
a b
rea
kth
roug
h f
or
a c
ha
r cr
oss
es t
he
con
tro
l cu
rve,
bu
t d
ue
to e
rro
r in
od
or
pa
nel
res
ult
s m
ay
als
o b
e d
efin
ed b
etw
een
0.8
-0.9
of
C0

Control of Fecal Malodor by Adsorption onto Biochar
- 63 -
University of Colorado Boulder | Department of Civil, Architectural and Environmental Engineering
Fig
ure
17:
Bre
akt
hro
ugh c
urv
es o
f fl
ow
-thro
ug
h a
dso
rpti
on e
xper
imen
ts f
or
all
od
or
solu
tio
ns
trea
ted b
y a
ll c
ha
r ty
pes
(n
orm
ali
zed
by
vari
ab
le i
nfl
uen
t
od
or
leve
ls).
T
he
norm
ali
zed v
ari
able
infl
uen
t o
do
r cu
rved
is
als
o s
ho
wn
in
red
, w
hic
h i
s d
efin
ed b
y C
0/C
0,a
vg.
Def
init
ion
of
satu
rati
on
is
theo
reti
call
y 1
.0,
bu
t d
ue
to e
rro
r in
od
or
pan
el r
esu
lts
ma
y b
e d
efin
ed b
etw
een
0.8
-0.9
of
C0.

Control of Fecal Malodor by Adsorption onto Biochar
- 64 -
University of Colorado Boulder | Department of Civil, Architectural and Environmental Engineering
Figure 18: Breakthrough curves of flow-through adsorption experiments for ORS+H2S treated by all char types,
plotted with the variable influent H2S levels. Definition of saturation is defined as the point when the breakthrough
curve for a char crosses the control curve.

Control of Fecal Malodor by Adsorption onto Biochar
- 65 -
University of Colorado Boulder | Department of Civil, Architectural and Environmental Engineering
Appendix B: Adsorption Isotherm Plots
Fig
ure
19:
Adso
rpti
on e
xper
imen
t data
plo
tted
on
iso
ther
ms
plo
ts f
or
all
fo
ur
cha
rs’
ad
sorp
tio
n o
f th
e o
do
r so
luti
on
s o
n a
lin
ear
sca
le.
Ea
ch
iso
ther
m p
lot
has
two p
oin
ts o
n i
t: o
ne
for
the
ba
tch
ad
sorp
tio
n e
xper
imen
t, a
nd
on
e fo
r th
e fl
ow
-th
rou
gh
ad
sorp
tio
n e
xper
imen
t.
OD
T w
as
no
t m
easu
red f
or
OR
S+
H2S
fo
r fl
ow
-th
rou
gh
exp
erim
ents
.

Control of Fecal Malodor by Adsorption onto Biochar
- 66 -
University of Colorado Boulder | Department of Civil, Architectural and Environmental Engineering
Appendix C: Photos of Laboratory Set Ups
Figure 20: Odor Bag
Figure 21: SM-100 Olfactometer (Scentroid/IDES, Ontario, CA)

Control of Fecal Malodor by Adsorption onto Biochar
- 67 -
University of Colorado Boulder | Department of Civil, Architectural and Environmental Engineering
Figure 22: Odor synthesis process and flow-through adsorption columns set up inside fume hood

Control of Fecal Malodor by Adsorption onto Biochar
- 68 -
University of Colorado Boulder | Department of Civil, Architectural and Environmental Engineering
Appendix D: Adsorption Experiments Data Tables
Batch Adsorption Experiments Data Tables
Ta
ble
16:
Odor
panel
data
for
batc
h a
dso
rpti
on
. D
ata
is
org
an
ized
by
od
or
solu
tio
n.
Pan
elis
ts' n
am
es a
re t
run
cate
d t
o t
he
firs
t tw
o l
ette
rs.
Da
ta s
ho
w b
oth
the
posi
tion o
n t
he
olf
act
om
eter
at
wh
ich t
he
pa
nel
ists
det
ecte
d o
do
r, a
nd
th
e co
rres
po
nd
ing
D/T
ca
lcu
late
d b
y th
e
geo
met
ric
mea
n o
f th
e bin
din
g d
iluti
on
s.
Th
e d
ata
fo
r th
e sc
reen
ing
ba
g i
s a
lso
sh
ow
n,
an
d r
emo
ved
res
ult
s b
ase
d o
n t
he
scre
enin
g b
ag
read
ing
are
hig
hli
gh
ted i
n r
ed.

Control of Fecal Malodor by Adsorption onto Biochar
- 69 -
University of Colorado Boulder | Department of Civil, Architectural and Environmental Engineering

Control of Fecal Malodor by Adsorption onto Biochar
- 70 -
University of Colorado Boulder | Department of Civil, Architectural and Environmental Engineering
Flow-through Adsorption Experiments Data Tables
Ta
ble
17:
Odor
panel
data
for
flow
-thro
ugh
ad
sorp
tio
n.
Da
ta i
s o
rgan
ized
by
od
or
solu
tio
n.
Pan
elis
ts' n
am
es a
re t
run
cate
d t
o t
he
firs
t tw
o l
ette
rs.
Da
ta s
ho
w b
oth
the
posi
tion o
n t
he
olf
act
om
eter
at
wh
ich t
he
pa
nel
ists
det
ecte
d o
do
r, a
nd
th
e co
rres
po
nd
ing
D/T
ca
lcu
late
d b
y th
e g
eom
etri
c m
ean
of
the
bin
din
g d
iluti
ons.
T
he
data
for
the
scre
enin
g b
ag
is
als
o s
ho
wn
, a
nd
rem
ove
d r
esu
lts
ba
sed
on
th
e sc
reen
ing
ba
g r
ead
ing
are
hig
hli
gh
ted
in r
ed.
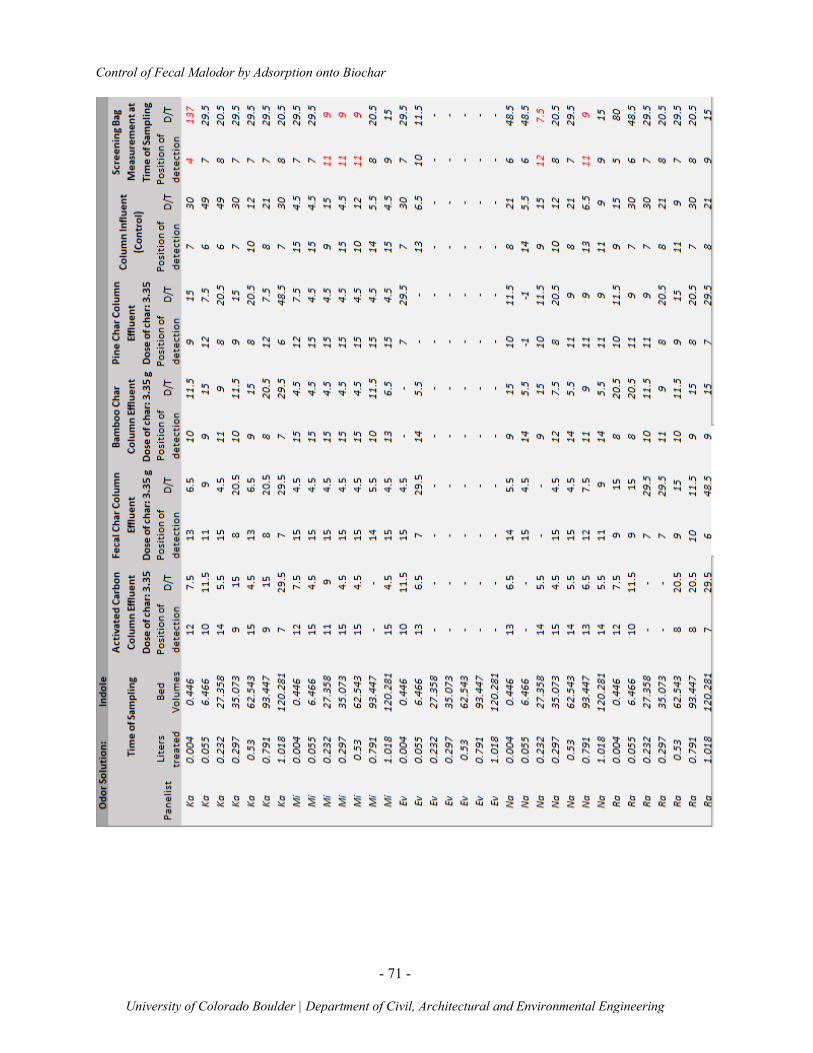
Control of Fecal Malodor by Adsorption onto Biochar
- 71 -
University of Colorado Boulder | Department of Civil, Architectural and Environmental Engineering

Control of Fecal Malodor by Adsorption onto Biochar
- 72 -
University of Colorado Boulder | Department of Civil, Architectural and Environmental Engineering

Control of Fecal Malodor by Adsorption onto Biochar
- 73 -
University of Colorado Boulder | Department of Civil, Architectural and Environmental Engineering