control of e-cadherin function in cell intercalation by er
TRANSCRIPT

Control of E-cadherin Function in Cell
Intercalation by ER Glucosylation
Enzymes
Dissertation
for the award of the degree
“Doctor of Philosophy” (PhD)
Division of Mathematics and Natural Sciences
of the Georg-August-University Goettingen
Submitted by
Yujun Zhang
From Shanxi, China
Goettingen, 2012
Members of the Thesis Committee:
Prof. Dr. Joerg Grosshans (Reviewer)
Developmental Biochemistry, University Medicine
Prof. Dr. Andreas Wodarz (Reviewer)
Stem Cell Biology, University Medicine
Dr. Halyna Shcherbata
Gene Expression and Signaling, MPI-bpc

Affidavit
Herewith I declare that I prepared the PhD thesis “Control of E-cadherin Function in Cell
Intercalation by ER Glucosylation Enzymes” on my own and with no other sources and
aids than quoted.
Submission date
Göttingen, 31.07.2012
Yujun Zhang


Summary ....................................................................................................................... 1
Chapter 1. Introduction ................................................................................................. 2
1.1 Cell intercalation during germ band extension in Drosophila ............................ 2
1.1.1 Drosophila germ band extension ................................................................. 3
1.1.2 Mechanism involved in cell intercalation .................................................... 4
1.2 E-cadherin and its post-translational modification ............................................. 7
1.2.1 E-cadherin and adherens junctions .............................................................. 7
1.2.2 Post-translational modification of E-cadherin ............................................. 8
1.3 ER N-glycosylation ............................................................................................. 8
1.3.1 N-glycosylated protein ................................................................................. 8
1.3.2 ER N-glycosylation ...................................................................................... 9
1.3.3 Protein folding and ER quality control ...................................................... 10
1.4 ER N-glycosylation and embryo development ................................................. 12
1.4.1 Wollknäuel is required for embryo patterning and cuticle differentiation 12
1.4.2 Congenital disorder of glycosylation (CDG) ............................................. 13
Chapter2. Methods and Materials ............................................................................... 14
2.1 Genetic methods................................................................................................ 14
2.1.1 Fly stocks ................................................................................................... 14
2.1.2 Gene mapping with Duplications and Deficiencies ................................... 15
2.1.3 Generation of transgenic flies .................................................................... 16
2.1.4 FLP-FRT system and germline clones ....................................................... 17
2.1.5 Follicle cell clones ..................................................................................... 17
2.2 Molecular biology methods .............................................................................. 17
2.2.1 PCR sequencing of the 3kd segment in the X chromosome 6D region ..... 17

2.3 Biochemistry methods ...................................................................................... 19
2.3.1 Antibody making ....................................................................................... 19
2.3.2 Western blot and N-Glycosidase treatment ............................................... 21
2.4 Immunohistochemistry methods ....................................................................... 26
2.4.1 Embryo fixation and staining ..................................................................... 26
2.4.2 Microscopy and image acquisition ............................................................ 27
2.5 In situ hybridization with alkaline phosphatase ................................................ 27
2.6 RNAi ................................................................................................................. 28
2.6.1 Making Template ....................................................................................... 28
2.6.2 dsRNA amplification ................................................................................. 29
2.6.3 Microinjection ............................................................................................ 30
2.7 Time-lapse imaging and analysis ...................................................................... 31
2.7.1 Microscopy ................................................................................................ 31
2.7.2 Measurement in imageJ ............................................................................. 31
2.7.3 EDGE and embryonic segmentation .......................................................... 32
Chapter3. Results ........................................................................................................ 33
3.1 X-330 is a mutant of ER membrane protein CG4542....................................... 33
3.1.1 Gene mapping and PCR sequencing .......................................................... 33
3.1.2 Genomic DNA of CG4542 could rescue X-330 lethality and its phenotype
............................................................................................................................. 35
3.1.3 CG4542 protein is localized in ER ............................................................ 35
3.2 Germ band extension is abnormal in X-330 mutant ......................................... 39
3.2.1 Germ band extension is abnormal in the mutants of X-330, Wol or Gny . 40
3.2.2 Removing N-glycans from proteins induces germ band extension defect 42
3.2.3 Not all the mutants of N-glycosylation enzymes affect gastrulation ......... 43
3.3 Cell intercalation is abnormal during germ band extension in X-330 mutant .. 44
3.3.1 Cell intercalation is decreased in X-330 mutant ........................................ 44
3.3.2 T1 process is affected in X-330 mutant ..................................................... 46
3.4 Anterior-posterior polarity and planar cell polarity has no obvious defect in X-
330 mutant .............................................................................................................. 47
3.4.1 AP polarity is not obviously affected in X-330 mutant ............................. 47
3.4.2 Planar cell polarity is normal in X-330 mutant .......................................... 48
3.5 E-cadherin is a target of X-330 mutant ............................................................. 49
3.5.1 E-cadherin protein is reduced in adherens junctions in X-330 mutant ...... 50
3.5.2 E-cadherin is partially glycosylated in X-330 mutant ............................... 51
3.5.3 Expression and localization of some ER synthesized membrane proteins
are normal, while the others are abnormal in X-330 mutant .............................. 53
3.5.4 Adherens junctions are normally localized in X-330 mutant .................... 55
3.5.5 Knockdown of E-cadherin induces cell intercalation defect during germ
band extension .................................................................................................... 57
3.6 New horizontal borders are formed by pulsed manner and stabilized by E-
cadherin ................................................................................................................... 58
3.6.1 New horizontal borders extend by pulsed behavior ................................... 58
3.6.2 E-cadherin is gradually accumulated in the new adherens junctions during
the new border formation .................................................................................... 62
3.6.3 Myosin enrichment in vertical junctions is delayed in X-330 mutant ....... 68
3.7 Other phenotypes in X-330 mutant ................................................................... 70
3.7.1 Ventral furrow could not form normally in X-330 mutant ........................ 70
3.7.2 Dorsal-Ventral polarity is abnormal in X-330 mutant ............................... 71
3.7.3 Mesoderm patterning is normal in X-330 mutant ...................................... 72

3.7.4 No obvious defect is shown in X-330 mutant follicle cell clones ............. 73
Chapter4. Discussion ................................................................................................. 76
4.1 Different functions of E-cadherin in Drosophila embryogenesis ..................... 76
4.2 N-glycosylation of E-cadherin affects adherens junctions ............................... 77
4.3 E-cadherin accumulation is not the cause of new contacts formation .............. 78
4.4 Pull and stick model .......................................................................................... 78
4.5 Membrane proteins are affected differently by N-glycosylation defect ........... 80
4.6 Some glycoproteins, which are essential for ventral furrow formation, are
affected by N-glycosylation defect ......................................................................... 81
Appendix ..................................................................................................................... 83
Reference .................................................................................................................... 91
Curriculum Vitae ...................................................................................................... 100
Acknowledgements ................................................................................................... 102

Summary
1
Summary
Three consecutive glucosylations are the last steps in formation of the dolichol-PP-
glycans before the glycans are transferred to nascent proteins in the ER. These three
glucosyl residues are assumed to function in protein folding and ER quality control
since they are consecutively cleaved to allow folding before the mono-glucosyl-
glycan is recognized by the calreticulin/calnexin system. Finally, all glucoses are
clipped off before ER exit. In my studies, the function of these glucosylation
enzymes (Alg5/wol, Alg6/gny and Alg8/X-330) has been analyzed in the movement
and morphogenesis of gastrulation and in Drosophila embryonic development. I
have focused on their function in cell intercalation and found the expression of the
integral membrane protein E-Cadherin strongly reduced and partially glycosylated in
the mutants. Consistently, reduced expression of E-cadherin induced by RNAi leads
to a comparable phenotype, which indicates that E-cadherin is a relevant down
stream target of the X-330 mutant for the cell intercalation defect. To study the
mechanism of new border formation in cell intercalation, I have observed the new
borders extended via pulsed manner with E-cadherin accumulated soon after. E-
cadherin intensity and the length of new borders are anticorrelated. We propose that
E-cadherin could not provide the force for new border extension, but functions to
stabilize the extended borders.
Introduction
2
Chapter 1. Introduction
1.1 Cell intercalation during germ band extension in
Drosophila
In embryonic development of multicellular animals, cell intercalation is a kind of
movement to change the dimensions of cell sheets, including radial intercalation and
mediolateral intercalation. Radial intercalation begins in the midblastula stage and
through gastrulation. It occurs in several cell layers. Inner cells move outwards
(radially) and intercalate into more superficial cells. It contributes to epiboly
thinning and blastoderm spreading in zebrafish and Xenopus (Solnica-Krezel, 2006;
Warga and Kimmel, 1990). Mediolateral intercalation occurs in a single cell layer in
gastrulation stage. The polarized movement of cells is perpendicular to the direction
of elongation of cell sheets (Fig.1). In many vertebrates, cell intercalation shapes the
body axis by convergent extension, like in Xenopus and zebrafish (Keller et al., 2000;
Solnica-Krezel, 2005; Wallingford et al., 2002). It also drives epithelial tissue
elongating in Drosophila germ band (Irvine and Wieschaus, 1994), the ascidian
notochord (Munro and Odell, 2002), the chick primitive streak and organ systems
like the gut, lung, spinal cord and inner ear (Hardin, 1989; Iwaki et al., 2001; Ribeiro
et al., 2004; Wang et al., 2006).
Comparing germ band extension in Drosophila and convergent extension in
Xenopus and zebrafish, first difference is that the former one is within epithelium,
while the latter one is in mesenchyme (Keller, 1980; Warga and Kimmel, 1990).
Second difference is that convergent extension is a very dynamic process, cells have
protrusive activity and the attachments are resolved and re-established very rapidly.
However, in Drosophila germ band extension, cells are tightly packed, the integrity
of epithelium is fully maintained (Hammerschmidt and Wedlich, 2008). Third
difference is that radial intercalation can also contribute to convergent extension,
whereas germ band extension only includes mediolateral intercalation.

Introduction
3
Figure 1. Model of mediolateral cell intercalation. During cell intercalation, several rows of
cells change their relative positions and neighbors by polarized movement (red arrows). The cell
sheet is prolonged along the axis perpendicular to the direction of cell movement.
1.1.1 Drosophila germ band extension
Gastrulation begins three hours after fertilization, which is a universal and important
stage in Drosophila embryo development. This stage only lasts for half an hour.
However, it includes several morphogenetic events: ventral furrow formation,
cephalic furrow formation, germ band extension, midgut invaginations and dorsal
folds formation (Fig.2a, b). At first, ventral cells (presumptive mesoderm) invaginate
inside and form two germ layers (ectoderm and mesoderm), which is driven by cell
shape changes. Between germ band and head, a line of cells get shorter than its
neighbor cells and form the so-called cephalic furrow (Fig.2a). In germ band
extension, directed cell intercalation leads to narrowing in dorsal-ventral (DV) axis
and elongation in anterior-posterior (AP) axis (Hammerschmidt and Wedlich, 2008;
Irvine and Wieschaus, 1994; Leptin, 1995; Zallen and Blankenship, 2008).
The process of germ band extension begins shortly after ventral furrow formation.
Most part of the extension finishes in the beginning 30 minutes, while the remaining
part finishes in the following 70 minutes. This movement includes ectoderm in germ
band region and the underlying mesoderm. Ventral germ band extends around the
posterior end of the embryo, folding over onto the dorsal side of the embryo (Fig.2).
Posterior end folds inward and germ cells move into the midgut. Germ band
extension continues until posterior end moves to approximately the cephalic furrow
position (Leptin, 1995).
Introduction
4
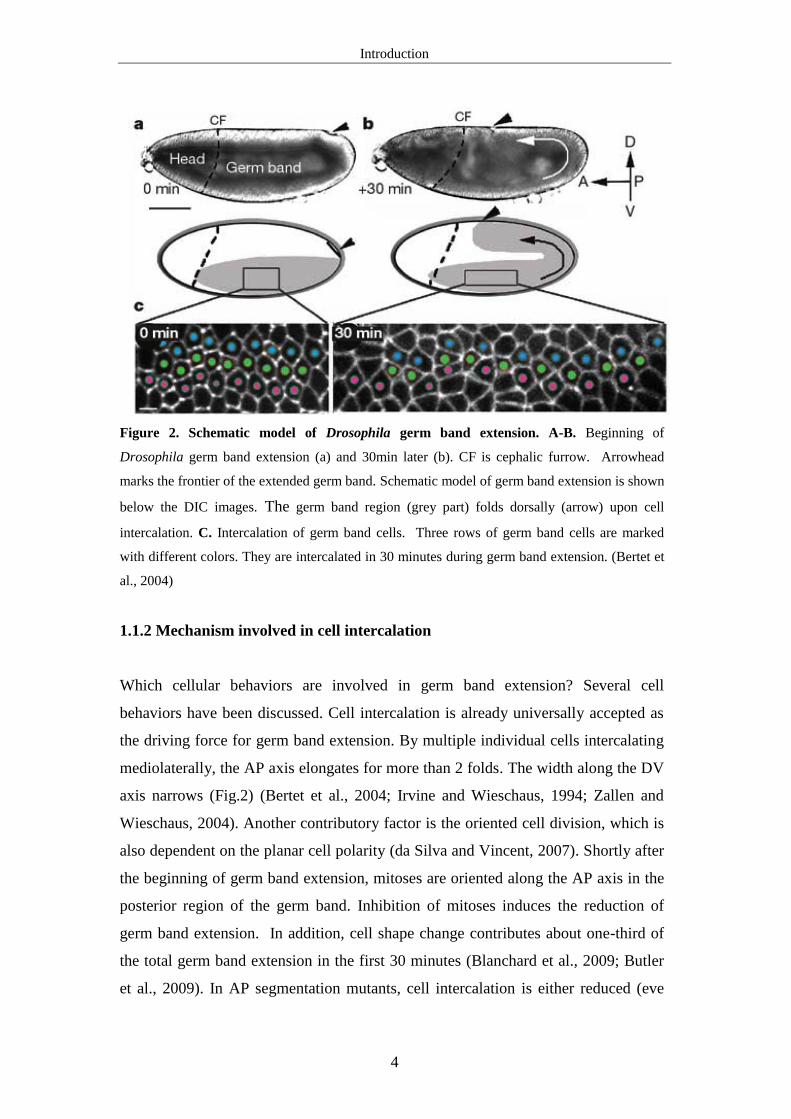
Figure 2. Schematic model of Drosophila germ band extension. A-B. Beginning of
Drosophila germ band extension (a) and 30min later (b). CF is cephalic furrow. Arrowhead
marks the frontier of the extended germ band. Schematic model of germ band extension is shown
below the DIC images. The germ band region (grey part) folds dorsally (arrow) upon cell
intercalation. C. Intercalation of germ band cells. Three rows of germ band cells are marked
with different colors. They are intercalated in 30 minutes during germ band extension. (Bertet et
al., 2004)
1.1.2 Mechanism involved in cell intercalation
Which cellular behaviors are involved in germ band extension? Several cell
behaviors have been discussed. Cell intercalation is already universally accepted as
the driving force for germ band extension. By multiple individual cells intercalating
mediolaterally, the AP axis elongates for more than 2 folds. The width along the DV
axis narrows (Fig.2) (Bertet et al., 2004; Irvine and Wieschaus, 1994; Zallen and
Wieschaus, 2004). Another contributory factor is the oriented cell division, which is
also dependent on the planar cell polarity (da Silva and Vincent, 2007). Shortly after
the beginning of germ band extension, mitoses are oriented along the AP axis in the
posterior region of the germ band. Inhibition of mitoses induces the reduction of
germ band extension. In addition, cell shape change contributes about one-third of
the total germ band extension in the first 30 minutes (Blanchard et al., 2009; Butler
et al., 2009). In AP segmentation mutants, cell intercalation is either reduced (eve
Introduction
5
and kr mutants) or abolished (kni hb), while cell shape change is increased. It is
proposed that cell shape change is driven by some external force dependent on DV
patterning, because it is decreased in the twist mutant. Interestingly, cell intercalation
is also decreased about 30% in twist mutant. It suggests cell intercalation is also
related with the external force. Cell intercalation could release some stress of the
external force. In AP-patterning mutant, the stress could not be released and the cell
shape change is increased (Butler et al., 2009).
1.1.2.1 AP patterning affects cell intercalation
It is found that reducing AP segmentation affects germ band extension and cell
intercalation, while DV patterning is not required for cell intercalation. In Bicoid
Nanos Torso-like (BNT) mutant, AP patterning is disrupted. Germ band cells have
no intercalation behavior. Similar phenotype is observed in knirps, Krüppel or even-
skipped mutant (Irvine and Wieschaus, 1994). In the dorsalized or lateralized
embryos, cell intercalation in epithelium is observed. However, in ventralized
embryos, which make only mesoderm, the germ band extension fails. It indicates
that the rearrangement of mesodermal cells is caused by attaching to ectodermal
cells during germ band extension, instead of active intercalation (Lohs-Schardin et
al., 1979; Roth et al., 1991; Schupbach, 1987). In addition, in the twist and snail
mutant embryos, which are lack of mesoderm, the germ band extension in the
ectoderm is normal (Leptin and Grunewald, 1990; Simpson, 1983).
1.1.2.2 Planar cell polarity is involved in the cell intercalation
Planar cell polarity is found during germ band extension in response to the striped
patterns of the gene expression (Zallen and Wieschaus, 2004). It is marked by planar
polarized proteins, which function in adherens junctions and cytoskeleton. E-
cadherin and its associated proteins Armadillo and Bazooka are more localized in
horizontal cell borders, while actin-myosin network is more enriched in vertical cell
borders (Fig.3). F-actin represents the first break of planar symmetry from stage6
(Blankenship et al., 2006). Planar cell polarity is only limited to the germ band
region and appears shortly before germ band extension. Normal AP patterning is
required for planar cell polarity (Zallen and Blankenship, 2008).

Introduction
6
Figure 3. Planar cell polarity in germ band extension. C. Planar cell polarity is showed in the
central cell. F-actin is the first symmetry-breaking marker (purple) at the vertical borders.
Bazooka (green) and myosinII (red) are accumulated in the complementary domains. By the
onset of intercalation, E-cadherin and Armadillo (blue) are enriched in horizontal cell borders. D.
Confocal image of germ band cells. MyosinII (red) is enriched in the vertical borders, whereas
Bazooka (green) is more localized in the horizontal borders (Zallen and Blankenship, 2008).
1.1.2.3 Cell intercalation depends on myosin-actin network
In either myosin inhibitor (Y-27632) injected embryos or myosin heavy chain (zip)
mutants, cell intercalation is severely affected, which suggests that myosin is
required for cell intercalation (Bertet et al., 2004). However, the junctional myosinII
contributes no constriction force. It is the medial myosinII flow generates the
polarized contractile force for vertical cell border shrinkage, which is oriented by E-
cadherin planar polarity (Rauzi et al., 2010).
1.1.2.4 Adherens junctions and the new border formation
It is well known that the shrinkage of old vertical cell borders is caused by myosin-
actin network. However, how does new horizontal cell borders form is still unclear.
One possibility is that the increased adherens junctions at the new borders could
facilitate the formation of the new borders. Our results give some clues for
answering this question.

Introduction
7
1.2 E-cadherin and its post-translational modification
1.2.1 E-cadherin and adherens junctions
E-cadherin is a conserved protein in multicellular animals, which functions in the
cell-cell adhesion and communication (Knust and Bossinger, 2002; Lecuit and
Wieschaus, 2002). Shotgun gene encodes E-cadherin protein in Drosophila.
Drosophila E-cadherin protein comprises a single-transmembrane domain, 6
repeated domains (EC0 to EC5) (Fig.4). It is predicted to be cleaved between the
EC0 domain and the EC1 domain. Therefore, its mature form should contain no EC0
domain. Its 150kDa band in SDS gel was shown glycosylated (Oda et al., 1994;
Tepass et al., 1996).
By binding of E-cadherin extracellular domains with adjacent cells and forming
homophilic complexes in a calcium-dependent manner, E-cadherin organizes the
adhesion junctions, which play an important role in epithelial cell formation and cell
polarity. Intracellular part of E-cadherin associates with actin cytoskeleton via
catenins. -catenin and -catenin bind directly to E-cadherin cytoplasmic tail in a
mutually exclusive manner. They recruit α-catenin, which links actin cytoskeleton.
Although actin is not required in the binding of extracellular part of E-cadherin, α-
catenin and actin provide strength to adherens junctions by holding together the
clustered E-cadherin at adherens junctional sites (Liwosz et al., 2006).
Figure 4. Schematic model of Drosophila E-cadherin and its associated proteins. In
extracellular part, Drosophila E-cadherin has six cadherin-specific repeats (EC0-EC5). It is
predicted that EC0 is cleaved off during maturation. In addition, it has one epidermal growth
factor-like domain (EGF) and a lamininA globular repeat (laminin). Eight predicted N-
glycosylation sites are marked (purple lines). It has a single transmembrane domain (blue bar).
Introduction
8
Drosophila E-cadherin intracellular part has high similarity with other vertebrate E-cadherin. E-
cadherin interacts with F-actin via Armadillo and α-Catenin.
1.2.2 Post-translational modification of E-cadherin
Post-translational modification of E-cadherin includes phosphorylation, O-
glycosylation and N-glycosylation. Casein kinaseII phosphorylates the cytosolic tail
of E-cadherin and enhances its binding with β -catenin. O-glycosylation of E-
cadherin occurs in ER stress response and prevents E-cadherin to transfer to the cell
membrane. E-cadherin also has several N-glycosylation sites: mouse E-cadherin has
three (one in EC4, two in EC5). Human and canine have four sites (two in EC4, two
in EC5). Drosophila E-cadherin is predicted to have eight sites (Fig. 4) by NetNGlyc
1.0 server (http://www.cbs.dtu.dk/services/NetNGlyc/). Since N-glycans contribute
to 20% of human E-cadherin total mass, it should have some important roles for
regulation of adherens junctions. Some study has been carried out in this area.
Proper N-glycosylation is required for E-cadherin folding, trafficking, expression
and stability of adherens junctions. Removal of N-glycan at Asn633 dramatically
affects E-cadherin stability. N-glycan absence at Asn554 and Asn566 leads to failure
of cell cycle arrest in G1 phase in human cells (Pinho et al., 2011; Zhao et al., 2008a;
Zhao et al., 2008b; Zhou et al., 2008). Extensively modified with N-glycans makes
E-cadherin form dynamic but weak adherens junctions, while diminish of N-
glycosylation promotes the formation of the stable adherens junctions. It is proposed
that N-glycosylation state and intracellular adhesion has inverse correlation (Liwosz
et al., 2006; Vagin et al., 2008).
1.3 ER N-glycosylation
1.3.1 N-glycosylated protein
More than half of all eukaryotic protein species are glycosylated, within which 90%
carry N-linked glycans (Fig.5). The glycans help proteins folding, passing ER
quality control, degradation and secretion. They also function as a “tag” for

Introduction
9
glycoproteins to interact with other lectins, glycosidases and glycosyltransferases. N-
glycans modify proteins at asparagine residues in a sequence Asn-X-Ser/Thr, where
X is any amino acid other than proline. N-glycosylation could help protein to fold
correctly, to increase the solubility, which inhibit protein aggregation. In addition,
N-glycans help protein secretion and affect intracellular signaling.
1.3.2 ER N-glycosylation
Glycans are synthesized in ER and Golgi apparatus. In ER, the glycans are added to
the dolichol-pyrophosphate (lipid carrier) step by step. They form a mature sugar
tree, which is later transferred to nascent peptides (Fig.5). After folding correctly, the
glycoprotein is transferred to the Golgi apparatus, in which the N-glycan is further
modified. This pathway is conserved in eukaryotes (Helenius and Aebi, 2004).
The oligosaccharide unit is made of three glucoses, nine mannoses, and two N-
acetylglucosamines (Glc3Man9GlcNAc2) (Fig.5). The beginning seven steps of N-
glycosylation are on the cytosolic surface of ER (Fig.6). Afterwards, the lipid carrier
flips into the luminal side of ER and goes on the linear stepwise biosynthetic
pathway of the branched oligosaccharide. The last three steps are adding three
glucose residues. The last glucose is needed for efficient recognition by the
oligosaccaryltransferase (OST), which transfers the sugar tree to the nascent protein.

Introduction
10
Figure 5. The N-linked core oligosaccharide. The core glycan has 14 saccharides: 3 glucoses
(red triangles), 9 mannoses (circles), and 2 N-acetylglucosamines (squares). The cleavage sites
of Glucosidase I and II are indicated (red arrows) (Helenius and Aebi, 2004).
Figure 6. Synthesis of the N-linked core oligosaccharide in ER. This schematic model is in
yeast and conserved in all the eukaryotic animals. The glycan synthesis starts from GlcNAc-1-
phosphate transferred to dolichol-pyrophosphate in cytoplasmic side, followed by another
GlcNAc and five mannose residues. Then the sugar tree is flipped into the lumen side of ER and
added three more mannoses and the tip three glucoses. Finally, the finished oligosaccharide is
transferred to the nascent peptide (Helenius and Aebi, 2004).
1.3.3 Protein folding and ER quality control
Folding starts from protein’s synthesis process and continues after its dissociation
from the ribosome. Most of the proteins, which are synthesized in ER, need disulfide
bonds for folding. Correct folding helps proteins pass the ER quality control.
When a core glycan is added to the protein, the glucosidase I and II removes the first
and the second glucose separately (Fig.7). The monoglucosylated ligand binds the
Calnexin (a transmembrane protein) or Calreticulin (a luminal protein). Calnexin and
Calreticulin are molecular chaperons, which function in preventing aggregation of

Introduction
11
proteins, exporting of the incompletely folded proteins and protecting the premature
proteins to be degraded. They exposed proteins to Erp57, which helps them to form a
proper disulfide bond. Proteins are released from the cycle when Glucosidase II
removes the last remaining glucose. Once the protein is folded completely, it would
be exported out of ER and transferred to the Golgi apparatus. Otherwise, it would be
recognized and reglucosylated by UDP-Glc: glycoprotein glucosyltransferase (GT),
which functions as a folding sensor and sends the incompletely folded proteins back
to the Calnexin/Calreticulin cycle. This cycle is so-called quality control. If the cycle
is broken down, the protein-folding rate is increased, but the folding efficiency is
decreased and the incomplete folded protein would be exported out of ER.
Figure 7. The calnexin/calreticulin cycle. The glucosidase I and II removes the first and the
second glucose separately. The monoglucosylated ligand binds the Calnexin or Calreticulin,
which exposes proteins to Erp57 and help them to form a proper disulfide bond. Proteins are
released from the cycle and transferred to Golgi when Glucosidase II removes the last remaining
glucose. If the protein fails to pass quality control, it would be reglucosylated and refolded again.
After certain time remaining in the cycle, misfolded or unassembled proteins would be sent to
ER-associated protein degradation (ERAD). (Helenius and Aebi, 2004)

Introduction
12
If glycoproteins fail to fold or oligomerize, they would retain in ER and eventually
be degraded, namely ER-associated degradation (ERAD). It contains three steps:
recognition of misfolded protein, transferring to cytoplasm and ubiquitin-dependent
degradation by the proteasome. ER may use time length to control the ERAD and
give chances to new proteins to refold and reassemble before degradation. The timer
of ERAD is linked with trimming of mannose. Once the mannoses in B and C
branches are trimmed, the substrates are more likely to go to ERAD instead of being
interacted with GT and glucosidase II and entering calnexin/calreticulin circle.
1.4 ER N-glycosylation and embryo development
1.4.1 Wollknäuel is required for embryo patterning and cuticle differentiation
Wollknäuel (Wol) is an UDP-glucose: dolichol-phosphate glucosyltransferase in
Drosophila, which is the homolog of Alg5 in yeast. Its mutations (2L-284 and 2L-
267) in germline clones cause caudal protein reduction, posterior segmentation
phenotypes, reduced Dpp signaling, impaired mesoderm invagination and germ band
elongation defect in gastrulation stage of Drosophila embryos. The unfolded protein
response is triggered in wol mutant embryos, which may cause the attenuation of
protein translation (Haecker et al., 2008)
Garnysstan (Gny) is the homologue of Alg6, which functions in a common pathway
with wol. The zygotic mutant of wol and gny could produce normally hatched larvae
and wild-type-like cuticle. They eventually die after one moult without any obvious
phenotype. In maternal germline clone of wol mutant and gny mutant, cuticle
formation has a defect. It is caused by affecting glucosylation and protein amounts of
cuticle-organizing factor knickkopf, without affecting its localization. In wol
mutants, transcriptional factor’s mRNAs are down-regulated. Glycosylation of the
total protein extracts is reduced and glucans contain less glucose in wol mutants
(Shaik et al., 2011).
Introduction
13
1.4.2 Congenital disorder of glycosylation (CDG)
N-glycosylation is very essential for embryonic development. The completely
absence of N-glycosylation leads to embryonic lethal (Ioffe and Stanley, 1994).
CDG is a group of disorders of abnormal glycosylation. Glycoproteins are required
for normal growth and basic functions of different tissues and organs. Defect of one
enzyme may cause the whole glycosylation malfunction. Since hundreds of enzymes
are involved in the glycosylation process and glycans are added to thousands of
proteins, it is not easy to make the CDG mechanism clear. Most disorders show in
early development stage and most types are only described in a few cases. Therefore,
understanding of them is limited. It is believed that a lot of patients are
underdiagnosed, because their symptoms resemble other genetic disorders.
19 types of CDG are found with different malfunction enzymes. Most of them are
involved in N-glycosylation. Based on whether the mutant gene functions before
glycan transfers to protein or after, CDG are subdivided to type I and type II. For
example, CDG-Ih is caused by ALG8 mutation. Its key features are hepatomegaly,
protein-losing enteropathy, renal failure, hypoalbuminemia, edema and ascites.
CDG-Ic is caused by Alg6 mutation. Its key features are moderate developmental
delay, hypotonia, esotropia and epilepsy (Haeuptle and Hennet, 2009; Jaeken, 2010;
Theodore and Morava, 2011)

Methods and Materials
14
Chapter2. Methods and Materials
2.1 Genetic methods
2.1.1 Fly stocks
Most fly stocks were obtained from the Bloomington Drosophila Stock Center at
Indiana University (http://flystocks.bio.indiana.edu/) unless otherwise mentioned.
UAS lines were expressed using the Gal4 system (Brand and Perrimon, 1993).
Name Reference
Oregon-R Wild type lab stock
X-330, Frt, Flp/FM7, B from Vogt EMS collection
2L-284(Wol1)/CyO
from Luschnig lab
2L-267(Wol2)/CyO
Gnyf04215
/CyO
Gny f04215
,Wol1/CyO
Cad::GFPubiquitin
(Oda and Tsukita, 2001)
Cad::GFPcadherin
from Luschnig lab
Cad::CherryUASp
/Cyo from our lab
Spaghetti squash (Sqh)-mCherry (Martin et al., 2009)
117GFP GFP exon trap in CG8668
Flp;Ovo2L, Frt 2L/If/Cyo, hishid from Luschnig lab
OvoX, Frt 18E/C(1)/Y (Chou and Perrimon, 1996)
RtulGFP/Cyo; Dr/TM3 From Bloomington
Myo-cherry,117GFP/Cyo
Made by myself X-330/FM7; If/Cyo
X-330/FM7; Dr/TM3
X-330/FM7; moesin/Cyo
X-330/FM7; mat67Gal4
X-330/FM7; Cad::CherryUASp
/Cyo
Methods and Materials
15
X-330/FM7; 117GFP
Made by myself X-330; CG4542/TM3
OvoX, Frt/C(1)/Y; 117GFP/Cyo
OvoX, Frt/C(1)/Y; myo-cherry/Cyo
OvoX, Frt/C(1)/Y; myo-cherry,117GFP/Cyo
OvoX, Frt/C(1)/Y; mat67Gal4/Cyo
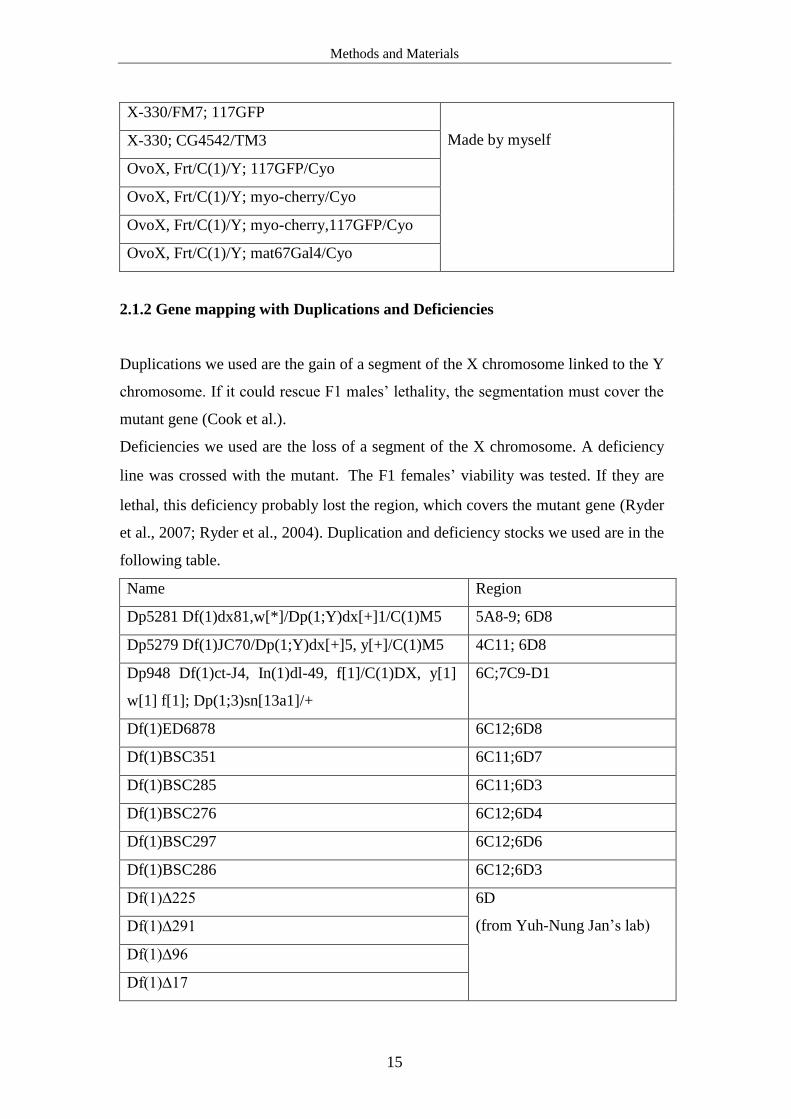
2.1.2 Gene mapping with Duplications and Deficiencies
Duplications we used are the gain of a segment of the X chromosome linked to the Y
chromosome. If it could rescue F1 males’ lethality, the segmentation must cover the
mutant gene (Cook et al.).
Deficiencies we used are the loss of a segment of the X chromosome. A deficiency
line was crossed with the mutant. The F1 females’ viability was tested. If they are
lethal, this deficiency probably lost the region, which covers the mutant gene (Ryder
et al., 2007; Ryder et al., 2004). Duplication and deficiency stocks we used are in the
following table.
Name Region
Dp5281 Df(1)dx81,w[*]/Dp(1;Y)dx[+]1/C(1)M5 5A8-9; 6D8
Dp5279 Df(1)JC70/Dp(1;Y)dx[+]5, y[+]/C(1)M5 4C11; 6D8
Dp948 Df(1)ct-J4, In(1)dl-49, f[1]/C(1)DX, y[1]
w[1] f[1]; Dp(1;3)sn[13a1]/+
6C;7C9-D1
Df(1)ED6878 6C12;6D8
Df(1)BSC351 6C11;6D7
Df(1)BSC285 6C11;6D3
Df(1)BSC276 6C12;6D4
Df(1)BSC297 6C12;6D6
Df(1)BSC286 6C12;6D3
Df(1)∆225 6D
(from Yuh-Nung Jan’s lab) Df(1)∆291
Df(1)∆96
Df(1)∆17

Methods and Materials
16
2.1.3 Generation of transgenic flies
2.1.3.1 Transgenic construct making
We ordered a Drosophila BAC clone from P[acman] (http://www.pacmanfly.org/). It
was attB-P[acman]-CmR-BW with Drosophila genomic DNA region CH321-61D01,
which is in X chromosome from 6614945 to 6722475. The plasmid was extracted
from the BAC clone. To get the 7.1 kb region covering CG4542 gene, restriction
enzymes NotI and Acc65I were used to digest the plasmid (Fig.8). We got a 3 kb
region and a 4.1 kb region, which were inserted into PattB vector separately (Spp
Fig.1). Then the 3 kb insertion was cut out and ligated into the PattB plasmid, which
included the 4.1 kb insertion. A pair of primers (YZ19 and YZ25 in appendix) was
used to do cloning PCR to check the CG4542 gene. The final construct is PattB-
CG4542.
Figure 8. The schematic construction for making transgenic flies. 7.1 kb construct with
CG4542 and Ataxin-1 inside is separated into 3 kb and 4.1 kb regions using restriction enzymes
NotI and Acc65I. Primers used are YZ19, YZ24 and YZ25.
2.1.3.2 Making transgenic flies
AttB/phi-C31 system was used to make site-specific insertion (Bischof et al., 2007).
The transgenic plasmid pAttB-CG4542 was injected into embryos with the target
site and phi-C31 gene. Embryos of attP-zh86Fb/nos-φ-zh102D (integrated in 3rd
chromosome) were used for injection. The embryos were collected from an apple-
juice plate, lined up on an agar plate and transferred to a glass slide. They were dried
for 10 min, covered by 10S voltalef oil. 0.8 µg/µl DNA was injected with a glass
needle into the posterior end of the embryos, in which germ cells still did not form.
Then the injected embryos (G0 generation) were incubated at room temperature with

Methods and Materials
17
high moisture. In the next one or two days, the hatched larvae were transferred from
the oil to a small food vial with yeast. G0 adult flies were crossed with TM3/TM6B
balancer flies. They were flipped over to new vials after 3 to 4 days. The F1 flies
were screened until we got the transgenic flies with red eyes. A stable stock was set
up.
2.1.4 FLP-FRT system and germline clones
The genetic scheme for making germline clones is as follows: First, virgins of a
balanced mutant line were crossed with males of the FRT, ovo/balancer. To induce
germline clones in F1 females, 24 h-72 h larvae were heat-shocked twice: one heat-
shock per day and half an hour each time at 37℃ in water bath. After 10 days, F1
flies came out. Females of FRT, mutation/FRT ovoD were collected and crossed
with the wild type males. We set up a cage to collect embryos and test their
phenotype. (Chou and Perrimon, 1992; Chou and Perrimon, 1996)
2.1.5 Follicle cell clones
Follicle cell clones were generated by the FLP/FRT technique (Chou et al., 1993;
Chou and Perrimon, 1996). X-330-FRT/FM7 females were crossed with nlsGFP-
FRT males. Clones were induced by heat-shocking third instar larvae or adult
females of X-330-FRT/nlsGFP-FRT at 37°C for 2 hours on two consecutive days.
Females were dissected in PBT 1 day after the last heat-shock. Ovaries were fixed in
4% formaldehyde and stained.
2.2 Molecular biology methods
2.2.1 PCR sequencing of the 3 kd segment in the X chromosome 6D region
2.2.1.1 DNA template making
X-330/FM7 and X-220/FM7 flies were used to extract the genomic DNA as the PCR
sequencing template. Several flies were ground in 200 μl buffer A. The tube was
Methods and Materials
18
spun for one minute. The supernatant was removed. The pellet was resuspended in
18 µl buffer B (containing proteinase K). 2 µl 10% SDS was added inside. It was
incubated for 2 hours at 37°C. Afterwards, 3 μl 3M NaCl was added. Then, the
phenol/chloroform extraction was performed with 1:1 volume. The aqua phase was
transferred to a new tube. 50 μl EtOH was added and incubated on ice for 20
minutes. The DNA was precipitated by centrifuging for 10 min at 14,000 rpm and
dissolved into 30 μl TE buffer after washed with 70% EtOH. 1 µl of the solution was
used for PCR to check the DNA. We used the genomic DNA as the template to do
PCR, getting CG4542 gene region (3 kD), which is used for sequencing PCR
template. Primers are YZ19 and YZ25 (Appendix).
Buffer A:
30 mM Tris/HCl [pH 8], 100 mM NaCl, 19 mM EDTA, 0.5% Triton X-100
Buffer B:
30 mM Tris/HCl [pH 8], 100 mM NaCl, 19 mM EDTA
2.2.1.2 PCR sequencing:
We used 3 kb PCR product as the template for sequencing. The reaction system is as
follows:
component amount
PCR -Product 10-30 ng
Primer 8 pmol
Seq-Mix 1.5 μl
Seq-Buffer 1.5 μl
H2O Add to 10 μl
The program for Sequence-PCR is:

Methods and Materials
19
temperature time
96℃ 10 sec
50-55℃ 15 sec
60℃ 4 min
For 25 Cycles
Primers for sequencing are YZ20, YZ21, YZ22, YZ23 and YZ26 (Appendix).
After PCR Sequencing, the product was purified. 1 μl 125mM EDTA, 1 μl 3M NaAc
and 50 μl 100%EtOH were added to the Seq-PCR product. It was gently mixed and
incubated at room temperature for 5 min. Then, it was centrifuged at 14000U/min
for 15 minutes. The supernatant was removed. The pellet was washed with 70 μl
70%EtOH for another 5 minutes and dried for 2 minutes. 15 μl Hidi was added.
Then the following steps were done in cooperation with the sequencing service of
the developmental biochemistry department, GZMB, University of Göttingen.
2.3 Biochemistry methods
2.3.1 Antibody making
2.3.1.1 Expression construct making
We picked two fragments of CG4542 gene to clone into the expression plasmid
pGEX-60H (Spp.Fig.2). The two fragments were frg.1 (26-93aa) and frg.2 (231-
299aa) (Fig.14). They were amplified using PCR from the template plasmid PattB-
CG4542. Primers were designed with restriction enzyme sites. YZ27 and YZ29 were
with NcoI restriction sites. YZ28 and YZ30 were with BglII restriction sites. The
primers for cloning the frg.1 are YZ27 and YZ28 (Appendix, underline marks the
restriction enzyme sites). The primers for cloning the frg.2 are YZ29 and YZ30
(Appendix).
High fidelity PCR was used to get the two fragments. Restriction enzymes of NcoI
and BglII were used to digest the two fragments and the vector pGEX-60H

Methods and Materials
20
separately. The two fragments were ligated into the pGEX-60H vector separately,
getting the two expression vectors: CG4542 frg.1-pGEX-60H and CG4542 frg.2-
pGEX-60H. The two new constructs were transformed into E.coli DH-5 to get
target proteins.
2.3.1.2 Determination the solubility of target proteins
Transformed E.coli DH-5 was inoculated into 10 ml LB and cultured overnight. 2.5
ml overnight cultures was inoculated into 50 ml pre-warmed LB until OD600 = 0.5-
0.7. 1 ml was taken as non-induced sample for SDS-PAGE. IPTG was added into the
system with the concentration of 1 mM. It was incubated for 4-5 hrs. 1ml was taken
as induced sample for SDS-PAGE. For harvesting the cells, it was centrifuged
4000g for 20 min. The cell pellet was re-suspended in 5 ml lysis buffer (50 mM
NaH2PO4, 300 mM NaCl, 10 mM imidazole) for native purification. 1 mg/ml
lysozyme was added into the suspension and it was incubated on ice for 30 minutes.
Sonicate the suspension for 6 times, each time for 20 seconds at 200-300w, keeping
the lysate on ice. The lysate was centrifuged at 10,000×g at 4℃ for 30 minutes. The
supernatant was collected as extract A. The pellet was resuspended in 5 ml lysis
buffer and collected as extract B. SDS-PAGE was done for analysis of the four
samples. If the target protein appeared in extract B instead of extract A, the protein is
insoluble protein.
2.3.1.3 Protein purification under denaturing conditions
CG4542 protein fragments with His-tag were purified under denaturing conditions.
The plasmids were transformed into E.coli BL21, which was incubated in 100 ml LB
in 37℃ on shaker overnight. In the next day, the culture was enlarged to 500 ml plus
Amp. The protein expression was induced by IPTG. After about 4 or 5 hours, the
OD600 value reached 0.7. The cells were collected by centrifugation (20 min, 4000g)
and re-suspended in 25 ml of lysis buffer. A drop of DNase was added. The cells
were lysed by microfluidizer. It was centrifuged for 20 min at 4000g. The pellet was
suspended thoroughly in 25 ml buffer A. 3 ml Ni beads were equilibrated with buffer
A. Carefully removed the supernatant. The solubilised pellet extract was added to the
beads and incubated for 60 minutes at room temperature. It was gently mixed on a
wheel. It was filled into a drop column. The flow through was collected and saved.

Methods and Materials
21
The beads were washed with 3×6 ml buffer C and eluted with buffer E. The elution
was collected in different tubes. The protein would start to elute at 1-2 volumes and
should be collected in total about 15 fractions. Amido Black staining was used on
nitrocellulose to test the protein in fractions. The protein concentration was tested
using NanoDrop.
Lysis buffer: 20 mM Na-Phosphate pH 8, 500 mM NaCl, 20 mM imidazole
Buffer A: 0,1M Na-Phosphate, 10 mM Tris pH 8 (NaOH), 6M GuHCl
Buffer C: 0.1 M Na-Phosphate, 10 mM Tris pH 6.3 (HCl), 8 M urea
Buffer E: 0.1 M Na-Phosphate, 10 mM Tris pH 4.5 (HCl), 8 M urea
2.3.1.4 Protein concentration
To concentrate the protein, dialysis tube was filled with the protein solution and
placed in a beaker, which contains water inside. For every 3 hours, the water was
changed until the white cotton-like protein show up in the tube. The protein
suspension was transferred into a 50 ml tube and centrifuged (20 min, 8500prm). We
carefully removed the supernatant and resolved the pellet in 500 μl buffer E. Test the
concentration by the Bradford method or running a SDS-PAGE gel.
2.3.1.5 Immunization of animals and getting serum
Highly concentrated proteins were sent to a company (Charles River) to inject into a
rabbit and a guinea pig. After several weeks, we got the serum, which contains
antibodies of the proteins.
2.3.2 Western blot and N-Glycosidase treatment
2.3.2.1 Protein sample preparation
Drosophila embryos (3-6 h) were collected on a mesh and treated with 50% klorix
for 1 minute. They were washed and dried on a tissue paper. The embryos were
weighed or counted. They were ground in 2 laemmli buffer (0,09 M Tris-HCl pH
6,8, 6% SDS, 0,6% bromophenol blue, 20% glycerol, 6% ß-mercaptoethanol) and
boiled in 100℃ or 65℃(for E-cadherin and Crumbs) for 10 minutes. The suspension
was centrifuged for 1 minute before use.

Methods and Materials
22
2.3.2.2 SDS-PAGE
The separating gel was prepared based on the protein size. For E-cadherin (150 kDa),
-Catenin (102kDa) and Crumbs (270kDa), we used 6% gel. For Armadillo (96kd-
110kd) and -Tubulin (55kd), we used 8% gel. The gel composition is as the
following table.
components 6% 8% 10% 12%
water 3 µl 2.75 µl 2.5 µl 2.25 µl
1.5M Tris, PH 8.8, 0.4% SDS 1.25 µl 1.25 µl 1.25 µl 1.25 µl
PAA (40%) 0.75 µl 1 µl 1.25 µl 1.5 µl
TEMED 3 µl 3 µl 3 µl 3 µl
APS (10%) 50 µl 50 µl 50 µl 50 µl
The gel was overlaid by 2-Propanol during polymerization for 30 minutes. The
stacking gel (921 µl water, 375 µl 0.5M Tris pH 6.8, 0.4% SDS, 187µl 40%PAA,
1.5 µl TEMED, 15 µl APS) was added with the comb. It was waited for another 30
minutes to remove the comb.
Running buffer (150g Glycin, 10g SDS, 32.8g Tris base, add to 1liter water) was
added to the gel. 12mA was used to run the gel.
2.3.2.3 Wet transfer to membranes
Large proteins are more efficiently transferred by wet transfer.
The following stack was prepared:
- Three Whatman filter papers in cathode buffer
- Gel
- Filter (nitrocellulose or PDVF)
- Three Whatman filter papers in anode buffer
A Pasteur pipette was rolled on the stack back and forth to make sure that no air
bubbles were enclosed. The stack was enclosed into the presoaked sponges and put
into the cassette of the BIORAD apparatus, which filled with transfer buffer. The
proteins were transferred at 110V for 2 hours. The transfer-box was placed into an

Methods and Materials
23
ice container to absorb the heat. A stir bar was used in the transfer-apparatus for
better heat exchange.
Cathode buffer: 0.1 M Tris, 0.1 M Tricine, 0.1% SDS, H2O
Anode buffer: 0.2 M Tris, 500 mL H2O, pH to 8.9 with HCl
Transfer buffer: 25 mM Tris, 190 mM glycine [pH 8.3]
2.3.2.4 Antibodies binding and detection
The membrane was transferred into blocking buffer (5% milk powder in PBT) and
shaken for more than 1 hour. Then, it was transferred to the primary antibody diluted
in PBT and 0.5% BSA, incubated for 2 h at room temperature. It was rinsed 3 times
with PBT and washed 4 x 15 min with PBT. Then membrane was transferred into
the secondary antibody diluted in PBT and incubated for 1 hour. PBT was used to
rinse and wash 4 x 15 min. 1 ml solution A was mixed with 25 µl solution B (ECL
Plus Western Blotting Detection system) to incubate the filter for 1 min. The
membrane was wrapped in a foil. An X-ray film was exposed and developed.
The antibodies used are in the following table.
name type concentration source reference
DCAD1 E-cadherin
first
antibody
1:200 in use Rat from Dr. Tadashi
Uemura’s lab
(Oda et al., 1994;
Oda et al., 1993;
Uemura et al.,
1996)
Cq4 Crumbs
first
antibody
1:500 in use mouse (Tepass et al., 1990)
Armadillo first
antibody
1:1000 in use mouse (Riggleman et al.,
1990)
-Catenin first
antibody
Serum 1:2000
in use
rat (Oda et al., 1993)
-Tubulin first
antibody
3.6 mg/ml
1:500000 in use
mouse B-512 Sigma
T5168

Methods and Materials
24
Second antibodies: Goat-a-rabbit-IgG-POD 1:10000 (pre-absorbed),
Goat-a-mouse-IgG-POD 1:10000 (pre-absorbed),
Goat-a-Rat-IgG-POD 1:10000 (pre-absorbed)
2.3.2.5 Glycosidase treatment
N-Glycosidase F, also known as PNGase F, is an amidase that cleaves between the
innermost GlcNAc and asparagine residues of high mannose, hybrid, and complex
oligosaccharides from N-linked glycoproteins (Fig.9) (Maley et al., 1989; Plummer
and Tarentino, 1991).
Figure 9. PNGase F could cleave between N-glycan and Asn
500 embryos (3-6h) were taken and treated with klorix for 1 minute. They were
lysed and ground in 100 µl lysis buffer in one eppendorf tube. Then, the tube was
left on ice for 10 minutes and centrifuged for 10 minutes. The sample was separated
into two tubes. One was treated with PNGase F, while another one was used as a
control. 9 µl lysed sample was mixed with 1 µl 10 denaturing buffer and incubated
in 60℃ for 10 minutes. Then the reaction system was set up as the following table
and incubated in 37℃ for 1 hour. Western blot was used to compare the treated one
and the control.
components Volume(µl)
Denatured sample 10
10 G7 reaction buffer 2
10% NP40 2
PNGase F 2
H2O 4
Methods and Materials
25
Lysis buffer: 50mM Hepes-NaOH, pH7.5; 150mM NaCl; 1% (v/v) Triton X-100; 10%
(v/v) glycerol; 1.5mM MgCl2; 2mM EGTA; 1mM phenylmethylsulfonyl fluoride,
10µg/ml aprotinin
10 denaturing buffer: 5% SDS; 0.4M DTT; Tris. HCl was added to adjust pH
10 G7 reaction buffer: 50 mM sodium phosphate, pH 7.5
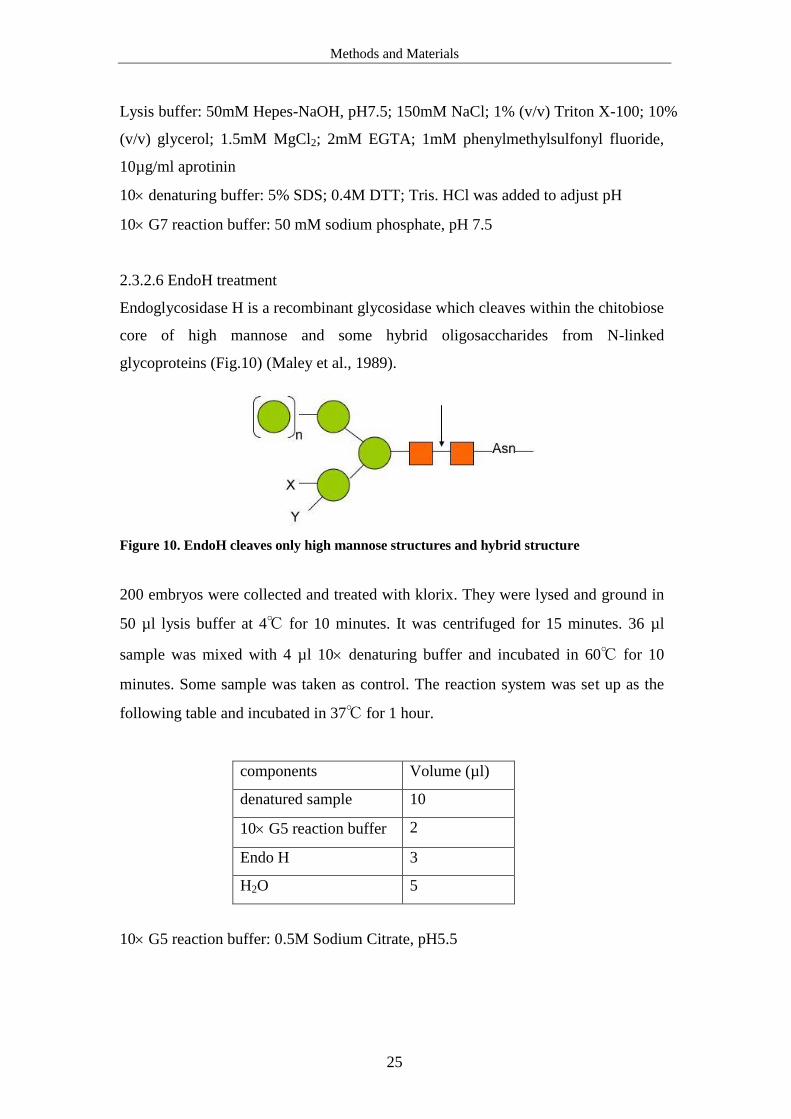
2.3.2.6 EndoH treatment
Endoglycosidase H is a recombinant glycosidase which cleaves within the chitobiose
core of high mannose and some hybrid oligosaccharides from N-linked
glycoproteins (Fig.10) (Maley et al., 1989).
Figure 10. EndoH cleaves only high mannose structures and hybrid structure
200 embryos were collected and treated with klorix. They were lysed and ground in
50 µl lysis buffer at 4℃ for 10 minutes. It was centrifuged for 15 minutes. 36 µl
sample was mixed with 4 µl 10 denaturing buffer and incubated in 60℃ for 10
minutes. Some sample was taken as control. The reaction system was set up as the
following table and incubated in 37℃ for 1 hour.
components Volume (µl)
denatured sample 10
10 G5 reaction buffer 2
Endo H 3
H2O 5
10 G5 reaction buffer: 0.5M Sodium Citrate, pH5.5

Methods and Materials
26
2.4 Immunohistochemistry methods
2.4.1 Embryo fixation and staining
2.4.1.1 Collecting embryos
Embryos of the appropriate stage were collected on an apple juice plate. Klorix
(100%) was added to cover all the embryos, incubating 1-2 minutes. The klorix with
the embryos was poured through a mesh. It was washed with water. The mesh with
the embryos was left on a tissue to remove the remaining liquid.
2.4.1.2 Formaldehyde fixation
The embryos were transferred to a scintillation vial with 5 ml heptane and 4.5 ml
PBS. 0.5 ml formaldehyde (37%) was added to fix the embryos for 20 minutes with
constantly shaking. The lower layer was removed thoroughly. 5 ml methanol was
added inside, shaking vigorously for 30 seconds. After the popped embryos all sank
on the bottom, they were transferred to an eppendorf tube. They were washed twice
with methanol and stored at -20℃.
2.4.1.3 Heat fixation
A scintillation vial was filled with 3 ml salt solution and heated in the microwave for
about 10 seconds. The mesh with embryos was added into the boiling solution and
incubated for 10 seconds. Then ice pieces and cold salt solution were quickly added
inside to make embryos cool down. The mesh was removed. Embryos sank down.
Salt solution was replaced by 5 ml heptane and 5 ml methane. The vial was shaken
vigorously to make embryos pop out. Embryos were washed with methanol and
stored at -20℃.
Salt solution: 0.4% NaCl, 0.03% Triton X-100
2.4.1.4 Fixation for phalloidin staining
Formaldehyde fixation was done without methanol. Embryos were collected in a
mesh and dipped on a paper towel. They were transferred with a fine brush to a
double sticky tape in a small petri dish, covering with PBS buffer. Embryos were

Methods and Materials
27
released from the vitelline membrane with a sharp needle and collected into an
eppendorf tube in PBT.
2.4.1.5 Protein staining
The fixed embryos were rinsed 3 times and washed 5 minutes in PBT. They were
blocked with 5% BSA in PBT for 1 hour. First antibody was diluted in PBT with
0.1%BSA, in which embryos were incubated for 2 hours at room temperature or in 4℃
overnight. Afterwards, embryos were rinsed 3 times and washed 415 min in PBT.
Embryos were incubated for 2 hours in the diluted secondary antibody with
0.1%BSA. Then, they were rinsed 3 times and washed 4×15 min in PBT. They were
stained with DAPI (8mg/ml) for 2-3 minutes and washed in PBT for 5 minutes. Then,
the embryos were lined up and mounted in Aqua-Poly/Mount.
2.4.2 Microscopy and image acquisition
We used Carl Zeiss Imaging System LSM 780 to take images of stained embryos.
Softwares of ImageJ and Photoshop were used to arrange and regulate the images.
2.5 In situ hybridization with alkaline phosphatase
The embryos are collected and dechorionated with 50% Clorox for 1.5 minutes. Then,
they are fixed in the mix of 5 ml 4% formaldehyde in PBS and 5 ml heptanes for 30
min on the shaker. After fixation, they are stored in methanol at -20℃.
When doing the in situ hybridization, rinse once with fresh methanol and wash with
50% methanol/PBT for 5 min. Rinse in PBT for 3 times and wash 2×5 min with
PBT. Wash with 50% hybridization solution (hyb sol) in PBT for 10 min at room
temperature. Then wash with 100% hyb sol for 10 min at room temperature.
Prehybridization with 100% hyb sol for 1 hr at 55°C or higher temperature.
Meanwhile, prepare the probe. Add 2 µl dig-labeled probe and 1 µl tRNA into 20 µl
water and boil for 5 min then chill on ice, then add 200 µl ice-cold hyb sol. Incubate
the embryos in the hyb sol with probe at selected temperature overnight. Rinse 3
times with pre-warned hyb sol and wash 3 times for 30 min. Then rehydrate with

Methods and Materials
28
series of pre-warmed hyb sol and PBT mixture: 80%, 60%, 40% and 20%. Afterward,
block for 30 min with 5% BSA in PBT. Then incubate with Dig antibody at 1 to 1000
dilutions for 1 hr. Rinse 3 times and wash 4 times for 15 min with PBT. Wash 3 times
for 5 min with AP buffer. Incubate the embryos in 1 ml AP buffer with 4.5 µl NBT
and 3.5 µl BCIP until the signal becomes visible. Terminate the reaction with PBT
and dehydrate with ethanol and incubate in 100% ethanol for 20 min to remove the
non-specific staining. Then rehydrate with series of ethanol/PBT mixture with
gradually increased concentration of PBT.
The RNA probe used in this study is Dig α Rho, which is labeled with digoxigenin-
UTP (DIG-UTP).
Hybridisation solution: 50% formamide, 5×SSC, 50µl heparin, 100µg/ml tRNA
NBT/BCIP: 75 mg/ml Nitrobluetetrazolium, 50 mg/ml BCIP (X-phosphate, Sigma)
AP buffer: 100mM NaCl, 50 mM MgCl2, 100 mM Tris pH 9.5, 0.2 % Tween 20
2.6 RNAi
2.6.1 Making Template
The DNA was amplified by PCR to make the template for dsRNA. The components
of the reaction system are listed in the following table:
Ingredient Volume (µl)
up stream primer (10mM) 4
down stream primer (10mM) 4
dNTPs (10mM) 2
10xBuffer (-MgCl2) 10
Template (genomic DNA 1ug/ul) 1
H2O 69
Taq polymerase 2
MgCl2 (25mM) 8
total 100

Methods and Materials
29
The reaction condition is as following table.
temperature Time circle
95℃ 2 min 1
95℃ 30 sec
6
55℃ 1 min
72℃ 1.5 min
95℃ 30 sec
30
55℃ 1 min
72℃ 40 sec
72℃ 5 min 1
The PCR product was purified using QIAquick PCR purification kit (QIAGEN). 5
volumes of Buffer PBI were added into 1 volume of the PCR product and mixed.
The sample was applied to the QIAquick column and centrifuged for 1 min. Flow-
through was discarded. The column was added with 0.75 ml buffer PE and
centrifuged for 1 min. Flow-through was discarded. The column was centrifuged for
additional 1 min. To elute DNA, The column was placed in a new eppendorf tube,
added with 15 μl water and centrifuged for 1 min. NanoDrop was used to test the
DNA concentration. Primers used are E-cad-T7-F, E-cad-T7-R, -Cat-T7-F and -
Cat-T7-R (Appendix) (Rauzi et al., 2010).
PCR Buffer: 750 mM Tris-HCl (pH 8.8 at 25°C), 200 mM (NH4)2SO4, 0.1% (v/v)
Tween 20
2.6.2 dsRNA amplification
T7 RiboMAX Express RNAi System was used to produce the double stranded RNA
(dsRNA). The components of the synthesis system are listed in the following table:

Methods and Materials
30
component Volume(µl)
DNA 2 µg
10 transcription buffer 5 µl
dNTP (ATP, UTP, CTP, GTP) 7.5 mM
RNAase inhibitor (1u/µl) 1.25 µl
100 pyrophosphatase 0.5 µl
T7 RNA polymerase (0.5unit/µl) 2 µl
DEPC water Remaining volume
Total volume 50 µl
The system was incubated in 37℃ for 4 hours. 3 µl DNase I was added and
incubated for 15 min in 37℃ to remove template DNA. The reaction was stopped by
adding 2 µl 0.5M EDTA (PH8.0), incubating 10 min in 65℃.
RNA product was purified using phenol/chloroform extraction and ethanol
precipitation. The RNA product was added with 85 μl DEPC water, 15 μl NaAc (3M)
and phenol/chloroform (1:1). It was vortexed for 1 min and centrifuged for 15 min.
The up-layer was transferred to a new tube and added chloroform (1:1). Then, it was
vortexed and centrifuged again. The up-layer was transferred to a new tube. 2
volumes ethanol was added inside and incubated for 6 hours in -20℃. Afterwards, it
was centrifuged in 4℃ for 20 min. The pellet was washed using cold 70% ethanol
and centrifuged for another 5 min. Ethanol was removed. After drying for 3 min, 50
μl DEPC water was added to dissolve the pellet. NanoDrop was used to measure its
concentration.
Transcription buffer: 50 mM Tris-HCl, pH 7.5; 15 mM MgCl2, 5 mM dithiothreitol
(DTT), 2 mM spermidine, Make 10 stock and store at -20°C.
2.6.3 Microinjection
Embryos (0-30 min) were collected and treated with 50% klorix for 1.5 min. They
were transferred on a piece of apple juice agar using a brush and aligned in two lines
with the same orientation. A cover slide coated with self-made glue was gently
placed on the embryos, sticking them up. The embryos should be placed in a dry

Methods and Materials
31
environment for 10 minutes. Then, the embryos were covered with 10S Voltalef oil
(use as little as possible). dsRNA was injected into the posterior end of the embryos.
2.7 Time-lapse imaging and analysis
Live embryos on an apple juice plate were covered with Voltalef 3S oil. The
embryos in a certain stage were picked by a needle and transferred on a self-made
mesh. They were treated with klorix and washed several times using water. The
embryos were transferred on a piece of apple juice agar using a brush. Then, the
embryos were aligned (lateral side up). A cover slide coated with glue sticked the
embryos up. The embryos were covered with 10S Voltalef oil. The slide with
embryos was taken to the microscope to photo live images.
2.7.1 Microscopy
Image type microscope camera
Differential
interference contrast
microscopy (DIC)
Zeiss Axiovert 200 M Ultra-View
Spinning Dsisc confocal microscope
Camera: Zeiss
AxioCam Icc 1
Spinning disc
confocal microscopy
Zeiss Axiovert 200 M Ultra-View
Spinning Dsisc confocal microscope
Camera: Zeiss
AxioCam MRm
Confocal laser
scanning microscopy
Carl Zeiss Imaging System LSM
780
For confocal images, usually we use the 63 objective. Spinning disc images usually
were taken by the 40 objective. DIC images were taken by the 25 or the 40
objective.
2.7.2 Measurement in imageJ

Methods and Materials
32
Time-lapse images were saved as tiff files. Stack and hyperstack functions in ImageJ
were used to make movies with different channels. Measure function was used for
measuring cell border length, cell area and grey value (signal intensity).
2.7.3 EDGE and embryonic segmentation
Embryo Development Geometry Explorer (EDGE) is a program working in
MATLAB, allowing users to quantitatively analyze embryo development data taken
from the confocal microscopes. The key idea is to identify the cell shapes, track
them across space and time and compute properties related with cell shape.
Additional channels could also be entered.
EDGE program was installed in MATLAB. Sequences of images in tiff format were
imported inside. The parameters were set, like space and time limits. Reference
image was set. Segmentation was processed to the images. Usually, segmentation
was not good enough to be directly used. It needed to be manually corrected. After
correction, segmented images were exported to the EDGE browser with cell shape
property information. Data was analyzed using MATLAB. This work is collaborated
with Prof. Dr. Fred Wolf, Dr. Lars Reichl, and Lutz Künneke.
Results
33
Chapter3. Results
3.1 X-330 is a mutant of ER membrane protein CG4542
3.1.1 Gene mapping and PCR sequencing
To further detect the molecular mechanisms controlling morphogenesis at the
gastrulation stage, we did genetic screens in existing collections of EMS induced
mutation stocks for important and interesting maternal-effect genes affecting early
embryonic patterning in Drosophila Melanogaster (Luschnig et al., 2004). Based on
the FLP-FRT technique to make germline clones, we found several different
phenotypes of maternal-effect mutants. An X-linked lethal mutation X-330, which
shows phenotype at the gastrulation stage, attracted our attention. We used genetic
methods to map this mutant gene. Three duplications (Dp5279, Dp948 and Dp5281)
could rescue the lethality and the phenotype of X-330 (Fig.11B). Their overlapping
region was in 6C to 6D. Deficiencies in this region were crossed with X-330 mutant,
in which Df(1)ED6878, Df(1)BSC351, Df(1)BSC276, Df(1)BSC297 and
Df(1)BSC286 were not complementary with X-330 mutant. This indicates that X-
330 mutant is in their overlapping region. In addition, the mutation is not in the
region of Df(1)BSC285, which is complementary with X-330. Therefore, the
suspicious region was limited to five genes: pod1, iav, Nf-YC, CG4542, Atx-1
(Fig.11B). By another two shorter deficiencies, which are Df(1)pod1(delta225) and
Df(1)delta96, three genes were ruled out. The mutant map was minimized to two
genes: CG4542 and Atx-1. PCR sequencing was used to search the point mutation
site. Genomic DNA of X-330/FM7 adult fly was used as PCR template to clone the
3kb region, which includes CG4542 and Atx-1. X-220/FM7 was used as a wild type
control in the same region. One mutation site was found in CG4542, which changed
the Tyrosine codon (TAT) into a stop codon (TAA) (Fig.11B, C). In X-330 mutant,
truncated CG4542 protein should be 402aa, while the whole length of CG4542 is
511aa.

Results
34
Figure 11. X-330 is a mutation in CG4542. A. The whole X chromosome. B. The 6C-6D
region in X chromosome includes 3 duplications (Dp5279, Dp948 and Dp5281) (blue dotted
lines), which could rescue the phenotype of X-330. Their overlapping region contains five
deficiencies (ED6878, BSC351, BSC276, BSC297 and BSC286) (red lines), which are not
complimentary with the X-330 mutant, and three deficiencies (Ex6240 BSC285 and BSC535)
(blue lines), which are complimentary with the X-330 mutant. By the overlapping region of
deficiencies (yellow bar), five genes (pod1, iav, Nf-YC, CG4542 and Atx-1) are possible to be
the mutant gene X-330. The first three genes are ruled out from the candidates by another two
deficiencies (pod1 (delta225) and delta96). The 3kb region was sequenced, which includes
CG4542 and Atx-1. The point mutation was found in CG4542 coding region (arrow site). C. The
PCR sequencing result of the X-330 mutant (left) and the wild type (right). The mutation site
changed the 403 codon TAT to a stop codon TAA.

Results
35
3.1.2 Genomic DNA of CG4542 could rescue X-330 lethality and its phenotype
7.1kb genomic DNA, which covers CG4542 and Atx-1 gene, was used to make
transgenic flies (Fig.11C). The transgenic construct was inserted into the third
chromosome (86Fb site) and balanced by TM3/TM6B. The CG4542 transgene was
put into X-330 maternal mutant background to test complementation, including
lethality test and phenotype test at the gastrulation stage. With CG4542 transgene,
X-330/Y male flies could survive (n>50), which means X-330 mutant lethality was
rescued by CG4542. In the control group, X-330/Y male flies were lethal. The
phenotype of X-330 mutant at the gastrulation stage was rescued, which was shown
in DIC movies (Fig. 17A). Based on these results, we conclude that X-330 is a
mutant in CG4542. However, we found that, in the rescued embryos, the nuclei were
smaller and more than the wild type ones, indicating that an extra cell cycle may
exist in the rescued embryos. To explain this, a shorter genomic DNA region was
taken to make new transgenic flies. By this test, we could tell if the extra cell cycle is
caused by over-expression effect of CG4542 or Atx-1.
3.1.3 CG4542 protein is localized in ER
Based on the information in the website of FlyBase (http://flybase.org/) and protein
sequence blast, CG4542 was identified as a homologue of Alg8 in yeast and human
(Shaik et al., 2011). CG4542 has 38.7% and 49% similarity with yeast and human
Alg8 respectively (Fig. 12). It has 28% and 30.7% similarity with yeast and human
Alg6 respectively. Alg6 and Alg8 both belong to CAZY family of
glycosyltransferases GT57, which may have function redundancy with each other
(Shaik et al., 2011). By phylogenetic analysis, CG4542 is the homologue of Alg8,
while CG5091/Gny is the homologue of Alg6 (Fig. 13) (Shaik et al., 2011).
CG5091 21 -----------LYSYSGFDSPPMHG-DYEAQRHWQEITVNLAVGEWYTNSSNNDLQYWGL
HsAlg6 23 -----------LNSYSGAGKPPMFG-DYEAQRHWQEITFNLPVKQWYFNSSDNNLQYWGL
ScAlg6 55 -----------LGPYSGKGSPPLYG-DFEAQRHWMEITQHLPLSKWYWY----DLQYWGL
CG4542 1 MKDLFWHLVGIATGLKILLIPAYHSTDFEVHRNWLAITHSLPLNQWYVDAT----SEWTL
HsAlg8 21 -----------VTLLKCLLIPTYHSTDFEVHRNWLAITHSLPISQWYYEAT----SEWTL
ScAlg8 51 -----------TLFLKLLLIPDYFSTDFDVHRNWLAITNKLPISEWYYEHT----SQWTL
CG5091 DYPPLTAYHSYLVGRIGAS--IDPRFVELHKSRGFESKEH--KRFMRATVVSADVLIYLP
HsAlg6 DYPPLTAYHSLLCAYVAKF--INPDWIALHTSRGYESQAH--KLFMRTTVLIADLLIYIP
ScAlg6 DYPPLTAFHSYLLGLIGSF--FNPSWFALEKSRGFESPDNGLKTYMRSTVIISDILFYFP
CG4542 DYPPFFAYFEWLLSQVAKY--VDPRMLVVDNLNYESKATV---YFQRLSVIVTDLVYVLG
HsAlg8 DYPPFFAWFEYILSHVAKY--FDQEMLNVHNLNYSSSRTL---LFQRFSVIFMDVLFVYA
ScAlg8 DYPPFFAYFEWFLSQFVPKSVRDDGCLDIVEIGKFGLPTI---VFQRLTVIFSEILLFVI

Results
36
CG5091 AMLLLAYSLD----KAFRSDDKLFLFTLVAAYPGQTLIDNGHFQ--YNNISLGFAAVAIA
HsAlg6 AVVLYCCCL-----KEISTKKKIANALCILLYPGLILIDYGHFQNIYNSVSLGFALWGVL
ScAlg6 AVIYFTKWLGR--YRNQSPIGQSIAASAILFQPSLMLIDHGHFQ--YNSVMLGLTAYAIN
CG4542 VRSCLGSLG---LGRDTQQ--FFAASMLLLLNVGLIFVDHIHFQ--YNGLLFGILLLSIG
HsAlg8 VRECCKCIDGKKVGKELTEKPKFILSVLLLWNFGLLIVDHIHFQ--YNGFLFGLMLLSIA
ScAlg8 LQIYINTTK---LSERSQS---FVVASSIVLSPGFLIIDHIHFQ--YNGFLFAILIGSIV
CG5091 AILRRRFYAAAFFFTLALNYKQMELYHSLPFFAFLLGECVSQK------SFASFIAEISR
HsAlg6 GISCDCDLLGSLAFCLAINYKQMELYHALPFFCFLLGKCFKKG------LKGKGFVLLVK
ScAlg6 NLLDEYYAMAAVCFVLSICFKQMALYYAPIFFAYLLSRSLLFP------KFN--IARLTV
CG4542 SLIRQRFLWSAFAFAVLLNFKHIFLYMAPAFGVYLLRFYCLEQ-----ASVVSAVGAVVK
HsAlg8 RLFQKRHMEGAFLFAVLLHFKHIYLYVAPAYGVYLLRSYCFTAN-KPDGSIRWKSFSFVR
ScAlg8 AAKNKRYILCAVLYTTAICFKHIFLYLAPCYFVFLLRAYVLNVNNFKFKSYKDFLFLIRW
CG5091 IAAVVLGTFAILWVPWLGS---LQAVLQVLHRLFPVARGVFEDKVAN-VWCAVNVVWKLK
HsAlg6 LACIVVASFVLCWLPFFTE---REQTLQVLRRLFPVDRGLFEDKVAN-IWCSFNVFLKIK
ScAlg6 IAFATLATFAIIFAPLYFLGGGLKNIHQCIHRIFPFARGIFEDKVAN-FWCVTNVFVKYK
CG4542 LLVVGLTPFAVS---FGPFW---QQLPQVLSRLFPFKRGLTHAYWAPNFWALYNAADKLA
HsAlg8 VISLGLVVFLVSALSLGPFLA-LNQLPQVFSRLFPFKRGLCHAYWAPNFWALYNALDKVL
ScAlg8 ANLLKLATVVVGIFTICFLPF-AHQMPQVLSRLFPFSRGLTHAYWAPNFWALYSFMDKIL
CG5091 KHISN-------------------------------------------------DQMALV
HsAlg6 DILPR-------------------------------------------------HIQLIM
ScAlg6 ERFTI-------------------------------------------------QQLQLY
CG4542 AGV-----------------------LKVQDGG----ASTTSGLVQEVRHSVLPAITPPV
HsAlg8 SVIGL--------------------KLKFLDPNNIPKASMTSGLVQQFQHTVLPSVTPLA
ScAlg8 TTVMLKLPYVHTFATKFIKPPLIPQNIKEINERLAANNNGSKGLVQDVFFVILPQIPPKL
CG5091 CIACTLIASLPTNVLLFRRRTNVG---FLLALFNTSLAFFLFSFQVHEKTILLTALPALF
HsAlg6 SFCSTFLSLLPACIKLILQPSSKG---FKFTLVSCALSFFLFSFQVHEKSILLVSLPVCL
ScAlg6 SLIATVIGFLPAMIMTLLHPKKHL---LPYVLIACSMSFFLFSFQVHEKTILIPLLPITL
CG4542 TFALTALFMLPILVKLFRSAKKQSPLVFLRAVVLCGCSSFVFGWHVHEKAILMVLLPLCL
HsAlg8 TLICTLIAILPSIFCLW--FKPQGPRGFLRCLTLCALSSFMFGWHVHEKAILLAILPMSL
ScAlg8 TFILTIFYQVLAVLPLLFDPSFKR---FVGSLTLCGLASFLFGWHVHEKAIMLVIIPFTF
CG5091 LLK----CWPDEMILFLEVTVFSMLPLLARDELLVP-AVVATVAFHL----IFKCFDSKS
HsAlg6 VLS----EIPFMSTWFLLVSTFSMLPLLLKDELLMP-SVVTTMAFFIACVTSFSIFEKTS
ScAlg6 LYSSTDWNVLSLVSWINNVALFTLWPLLKKDGLHLQYAVSFLLSNWLIGNFSFITPRFLP
CG4542 LTLVNR-EDARYAYVLGIAGYFSLFPLLFDADLYIPRYSLYMSYVAMMYGQLYR------
HsAlg8 LSVGKA-GDASIFLILTTTGHYSLFPLLFTAPELPIKILLMLLFTIYSISSLKT------
ScAlg8 LVGFDR-RLLVPFMLVASAGYVSLYPLLYKGQDFFIKTLYTYVWCIIYFAAFRKTTKISS
CG5091 KLSNEYP-------------------LKYIANIS-QILMISVVVASLTVP---APTKYPD
HsAlg6 EEELQLKSFSISVRKYLPCFTFLSRIIQYLFLIS-VITMVLLTLMTVTLD---PPQKLPD
ScAlg6 KSLTPGPSISSINSDYRRRSLLPYNVVWKSFIIGTYIAMGFYHFLDQFVA---PPSKYPD
CG4542 IFPGFR----------------GFHTLEWLYMLGFMAIPLYEHLLSFLLH---LDQRLPF
HsAlg8 LFRKEKP---------------LFNWMETFYLLGLGPLEVCCEFVFPFTS---WKVKYPF
ScAlg8 SVERRIF---------------FLDRLALTYIFSLLPIVTVLQILDEVKWRYSFLQKFEF
CG5091 LWPLIISVTSCGHFFLFF----------LWGNVQQFSS-KLS--------- 475
HsAlg6 LFSVLVCFVSCLNFLFFL----------VYFNIIIMWD-SKSGRNQKKIS- 509
ScAlg6 LWVLLNCAVGFICFSIFW----------LWSYYKIFTSGSKSMKDL----- 544
CG4542 LPLLLTSVYSALGVLYFFGAYYLYALGISWGKVPIASSTSAAAVKRKRKTK 511
HsAlg8 IPLLLTSVYCAVGVTY------------AWFKLYVSVLIDSAIGKTKKQ-- 526
ScAlg8 LGLMIYSVYCSLGIIS------------SWFALSWLYNFDELLWQ------ 577
Figure 12. Alignment of human and yeast Alg6 and Alg8 with Drosophila proteins CG4542
and CG5091. Highlighted parts are amino acid sequence shared by more than 50%. (Shaik et al.,
2011)

Results
37
+---------------CG5091
+----2
+--------------3 +---------------HsAlg6
! !
! +-------------------ScAlg6
--5
! +------------CG4542
! +--------1
+------------4 +------------HsAlg8
!
+---------------------ScAlg8
Figure 13. Phylogeny of CG4542 and CG5091 with their homologues Alg6 and Alg8 in
yeast and human. (Shaik et al., 2011)
CG4542 protein was predicted to be a membrane protein (Fig.14) by online
prediction in Simple Modular Architecture Research Tool (SMART)
(http://smart.embl-heidelberg.de/). It has a 29aa signal peptide in N-terminus,
predicting in SignalP 4.0 Server (http://www.cbs.dtu.dk/services/SignalP/). Based on
previous studies, we knew some structural information about CG4542 ’ s
homologue Alg8 in yeast. It has a large hydrophilic region in the cytoplasm, which
contain active sites. Alg8 was predicted to have two conserved domains: the N-
terminal half (domain A) and the C-terminal half (domain B). From the known
functions of the analyzed proteins, only the processive glycosyltransferases carry
two domains A and B, while those that add a single sugar residue carry only domain
A (Saxena et al., 1995). It is verified that C-terminal transmembrane domain of Alg8
in yeast was critical for the polymerization reaction in vivo (Oglesby et al., 2008). In
X-330 mutant, CG4542 enzyme was made without the C-terminal three
transmembrane domains. This truncated glycosyltransferase may carry impaired
domain B, which is important for its activity.
To make antibody, two fragments of CG4542 (67aa and 69aa) were cloned, which
are 26aa…93aa and 231aa…299aa (Fig.14 red lines). They were expressed in E.coli
BL21 and purified (Fig.15). Mixture of the two fragments (1mg/ml) was injected
into a rabbit. We got the serum, which should contain the CG4542 antibody.

Results
38
Figure 14. CG4542 is predicted to be an ER membrane protein. CG4542 protein has 12
transmembrane domains (blue bars). The grey bar represents the ER membrane. A typical signal
peptide (purple bar) is in N-terminal, which should be cut off from the mature protein. The X-
330 mutation site is marked (TAA box). Two fragments of the protein (red lines) are designed to
be expressed and purified for making the antibody.
Figure 15. Purification of the CG4542 fragments. Fragment 1 is in the left lane and fragment
2 is in the middle lane. The protein marker is in the right lane. The aimed proteins are marked by
arrows.
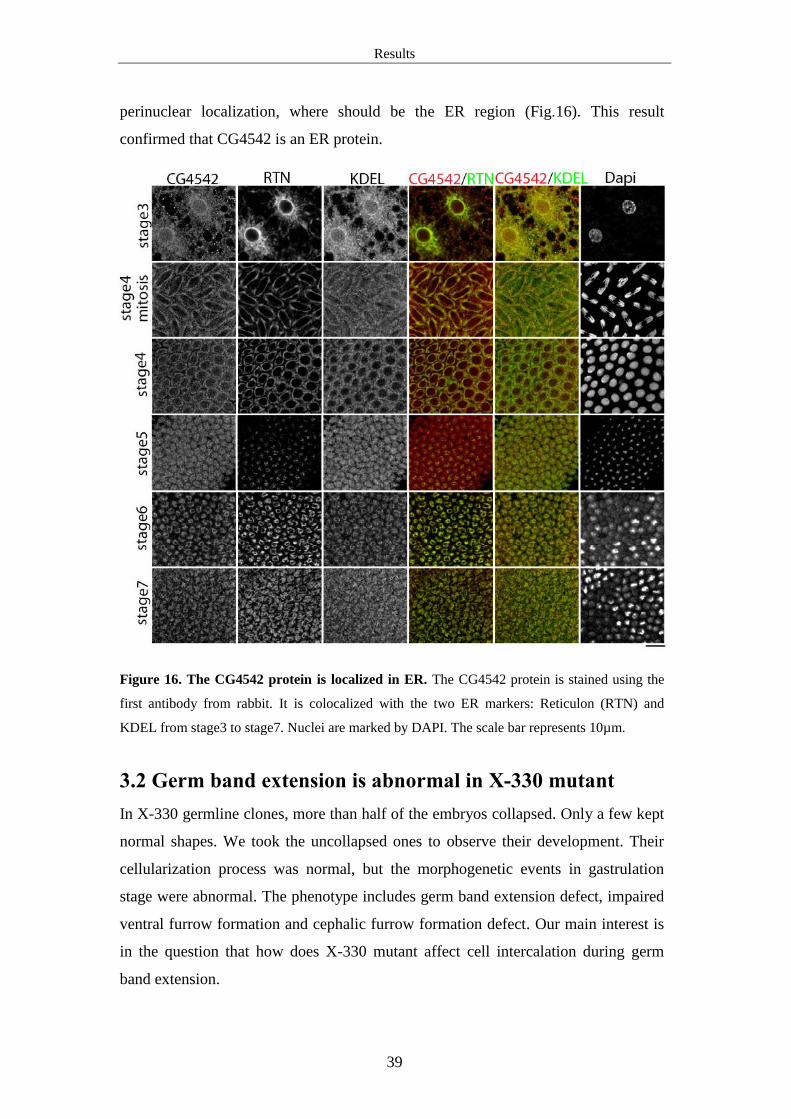
Using the serum from an injected rabbit as the first antibody, we did protein staining
in Drosophila embryos from stage3 to stage7. It was found that CG4542 colocalized
with the two ER markers: Reticulon and KDEL, with each nucleus becoming
surrounded by a single ER membrane system (Frescas et al., 2006). They all have
Results
39
perinuclear localization, where should be the ER region (Fig.16). This result
confirmed that CG4542 is an ER protein.
Figure 16. The CG4542 protein is localized in ER. The CG4542 protein is stained using the
first antibody from rabbit. It is colocalized with the two ER markers: Reticulon (RTN) and
KDEL from stage3 to stage7. Nuclei are marked by DAPI. The scale bar represents 10µm.
3.2 Germ band extension is abnormal in X-330 mutant
In X-330 germline clones, more than half of the embryos collapsed. Only a few kept
normal shapes. We took the uncollapsed ones to observe their development. Their
cellularization process was normal, but the morphogenetic events in gastrulation
stage were abnormal. The phenotype includes germ band extension defect, impaired
ventral furrow formation and cephalic furrow formation defect. Our main interest is
in the question that how does X-330 mutant affect cell intercalation during germ
band extension.

Results
40
3.2.1 Germ band extension is abnormal in the mutants of X-330, Wol or Gny
During the 30 minutes at gastrulation stage, germ band extends along the AP axis. Its
length increases for more than 2 folds in the wild type embryos (Fig.17A). Using
DIC time-lapse images, we measured the distance between germ band moving
frontier and the posterior end of the embryos in every two minutes and counted the
ratio between the distance and the whole embryonic length. A chart was made to
show the curves of ratio values (Fig.17B). In the wild type, germ band extended to
about 53% of the whole length in 40 minutes (Fig.17B, blue line). In X-330 mutant,
germ band extension started normally. However, it stopped in the midgut position
(Fig.17A). In the curve chart, germ band extended to about 28% of the whole length
(Fig.17B, red line).
To examine whether germ band extension defect is specific in X-330 mutant or it is
the same situation in other N-glycosylation enzyme mutants, Wol, Gny and their
double mutant were taken to do germline clones. In gastrulation stage, germ band
extension was stopped in the midgut position in these mutants, which were very
similar with the X-330 mutants (Fig.17A, B). This result indicates that ER N-
glycosylation, at least the three glucosylation, is required for the germ band
extension. The defect in Wol and Gny double mutant is not more severe than the
single mutants, which suggests that the two genes Wol and Gny function in the same
pathway.

Results
41
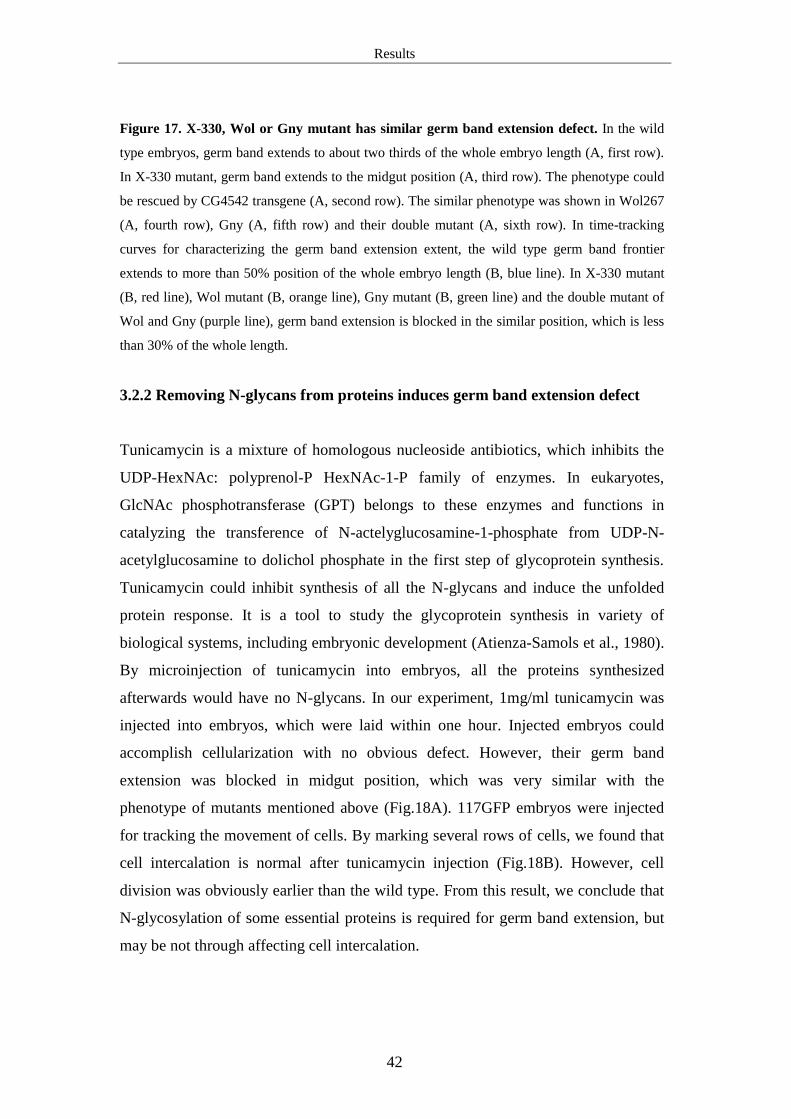
Results
42
Figure 17. X-330, Wol or Gny mutant has similar germ band extension defect. In the wild
type embryos, germ band extends to about two thirds of the whole embryo length (A, first row).
In X-330 mutant, germ band extends to the midgut position (A, third row). The phenotype could
be rescued by CG4542 transgene (A, second row). The similar phenotype was shown in Wol267
(A, fourth row), Gny (A, fifth row) and their double mutant (A, sixth row). In time-tracking
curves for characterizing the germ band extension extent, the wild type germ band frontier
extends to more than 50% position of the whole embryo length (B, blue line). In X-330 mutant
(B, red line), Wol mutant (B, orange line), Gny mutant (B, green line) and the double mutant of
Wol and Gny (purple line), germ band extension is blocked in the similar position, which is less
than 30% of the whole length.
3.2.2 Removing N-glycans from proteins induces germ band extension defect
Tunicamycin is a mixture of homologous nucleoside antibiotics, which inhibits the
UDP-HexNAc: polyprenol-P HexNAc-1-P family of enzymes. In eukaryotes,
GlcNAc phosphotransferase (GPT) belongs to these enzymes and functions in
catalyzing the transference of N-actelyglucosamine-1-phosphate from UDP-N-
acetylglucosamine to dolichol phosphate in the first step of glycoprotein synthesis.
Tunicamycin could inhibit synthesis of all the N-glycans and induce the unfolded
protein response. It is a tool to study the glycoprotein synthesis in variety of
biological systems, including embryonic development (Atienza-Samols et al., 1980).
By microinjection of tunicamycin into embryos, all the proteins synthesized
afterwards would have no N-glycans. In our experiment, 1mg/ml tunicamycin was
injected into embryos, which were laid within one hour. Injected embryos could
accomplish cellularization with no obvious defect. However, their germ band
extension was blocked in midgut position, which was very similar with the
phenotype of mutants mentioned above (Fig.18A). 117GFP embryos were injected
for tracking the movement of cells. By marking several rows of cells, we found that
cell intercalation is normal after tunicamycin injection (Fig.18B). However, cell
division was obviously earlier than the wild type. From this result, we conclude that
N-glycosylation of some essential proteins is required for germ band extension, but
may be not through affecting cell intercalation.

Results
43
Figure 18. Tunicamycin injection induces germ band extension defect. A. After injection of
tunicamycin (1mg/ml), the germ band extension was tracked. 40 minutes after germ cells starting
to move dorsally, germ band extension was blocked in midgut position (arrow). B. Cell borders
were marked by 117GFP. Several rows of cells were marked by different colors. 30min after the
beginning of gastrulation, cell intercalation was normal as the wild type. The scale bar represents
10 µm.
3.2.3 Not all the mutants of N-glycosylation enzymes affect gastrulation
To detect if all the ER N-glycosylation enzymes affect germ band extension in
gastrulation stage, we took some of the ER enzymes’ mutants (p element insertions)
in the N-glycosylation pathway and used FLP-FRT system to make germline clones.
CG4542 mutant (X-330), wol and gny have germ band extension defect as we
showed above. Calnexin 99A mutants could produce no embryos, which indicates
that the mutant affects oogenesis. In calreticulin mutants, the embryos were shorter in
the AP axis than normal ones. In addition, they stopped development in the early
stage before cellularization. CG8412 mutants developed normally. Their germ band
extension was normal in gastrulation stage. Maybe other glycosylation enzymes have
functional redundancy with CG8412 to rescue its mutant phenotype. OstStt3 is only
one subunit of Ost enzyme complex. No obvious phenotype was observed in ostStt3
germline clone mutant. I list the genes, their homologue names in yeast and their
maternal mutant phenotype in the following table. For other ER enzymes I list, their
mutants haven’t been studied. Their function in Drosophila embryogenesis remains
unknown.
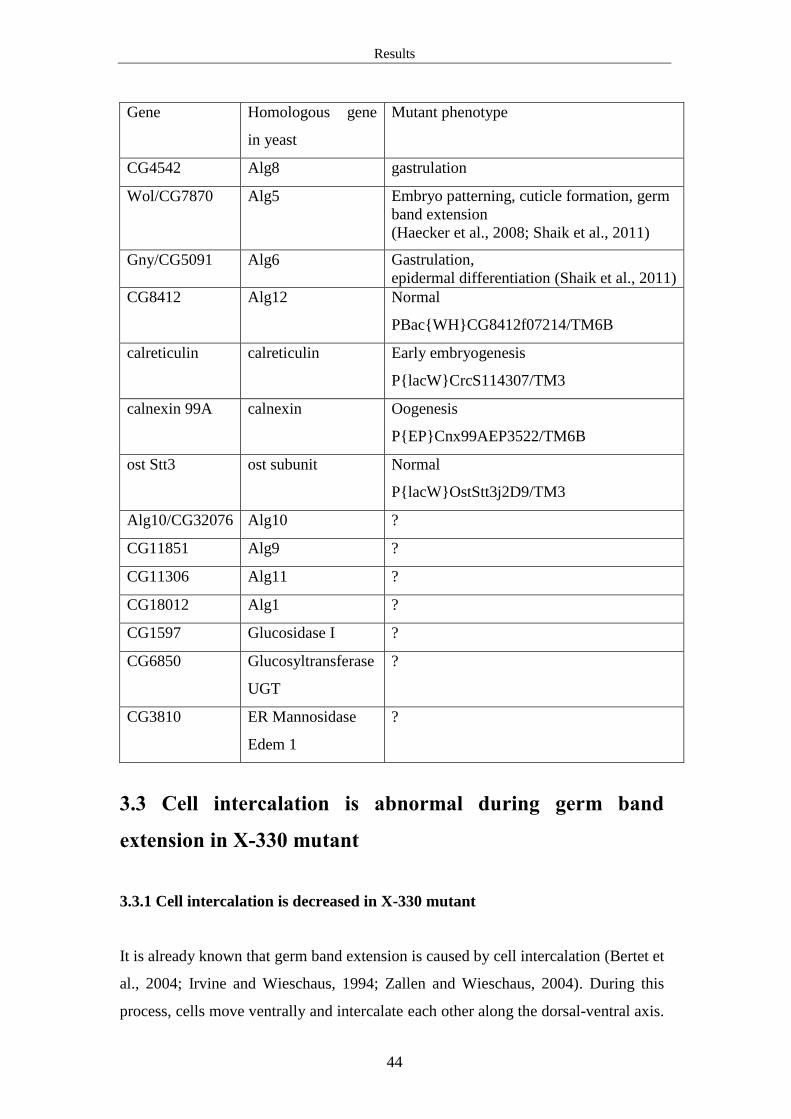
Results
44
Gene Homologous gene
in yeast
Mutant phenotype
CG4542 Alg8 gastrulation
Wol/CG7870 Alg5 Embryo patterning, cuticle formation, germ
band extension
(Haecker et al., 2008; Shaik et al., 2011)
Gny/CG5091 Alg6 Gastrulation,
epidermal differentiation (Shaik et al., 2011)
CG8412 Alg12 Normal
PBac{WH}CG8412f07214/TM6B
calreticulin calreticulin Early embryogenesis
P{lacW}CrcS114307/TM3
calnexin 99A calnexin Oogenesis
P{EP}Cnx99AEP3522/TM6B
ost Stt3 ost subunit Normal
P{lacW}OstStt3j2D9/TM3
Alg10/CG32076 Alg10 ?
CG11851 Alg9 ?
CG11306 Alg11 ?
CG18012 Alg1 ?
CG1597 Glucosidase I ?
CG6850 Glucosyltransferase
UGT
?
CG3810 ER Mannosidase
Edem 1
?
3.3 Cell intercalation is abnormal during germ band
extension in X-330 mutant
3.3.1 Cell intercalation is decreased in X-330 mutant
It is already known that germ band extension is caused by cell intercalation (Bertet et
al., 2004; Irvine and Wieschaus, 1994; Zallen and Wieschaus, 2004). During this
process, cells move ventrally and intercalate each other along the dorsal-ventral axis.
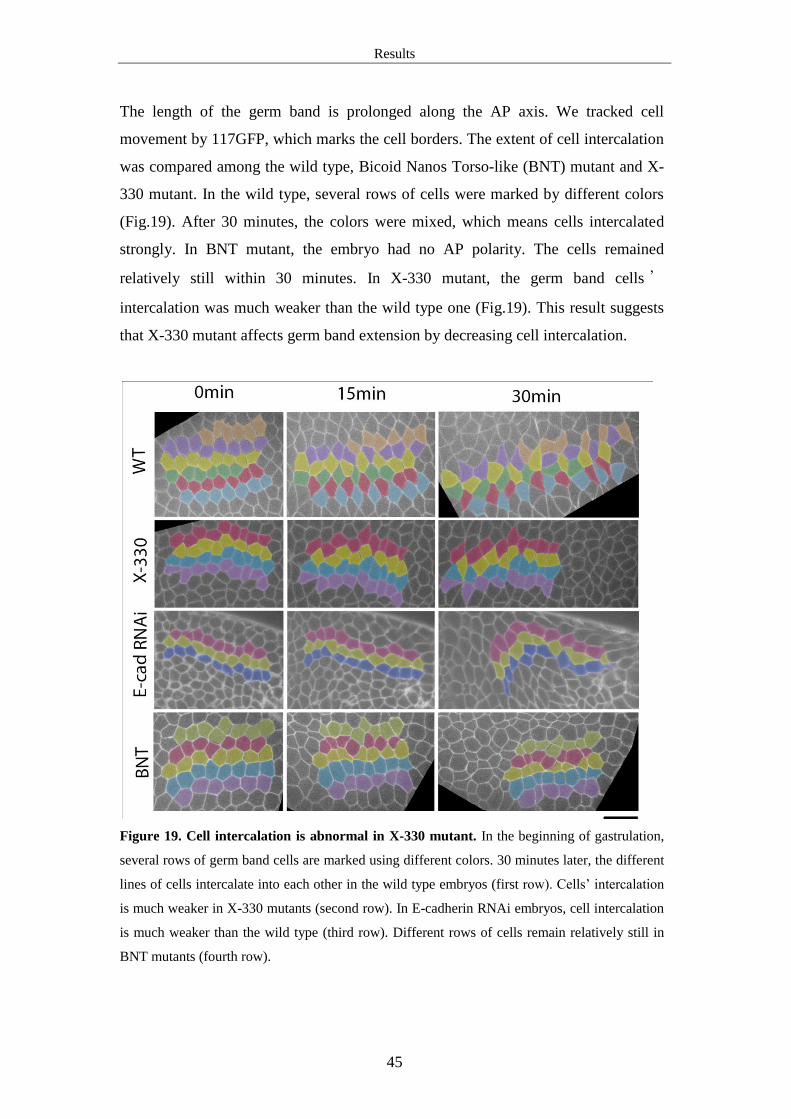
Results
45
The length of the germ band is prolonged along the AP axis. We tracked cell
movement by 117GFP, which marks the cell borders. The extent of cell intercalation
was compared among the wild type, Bicoid Nanos Torso-like (BNT) mutant and X-
330 mutant. In the wild type, several rows of cells were marked by different colors
(Fig.19). After 30 minutes, the colors were mixed, which means cells intercalated
strongly. In BNT mutant, the embryo had no AP polarity. The cells remained
relatively still within 30 minutes. In X-330 mutant, the germ band cells ’
intercalation was much weaker than the wild type one (Fig.19). This result suggests
that X-330 mutant affects germ band extension by decreasing cell intercalation.
Figure 19. Cell intercalation is abnormal in X-330 mutant. In the beginning of gastrulation,
several rows of germ band cells are marked using different colors. 30 minutes later, the different
lines of cells intercalate into each other in the wild type embryos (first row). Cells’ intercalation
is much weaker in X-330 mutants (second row). In E-cadherin RNAi embryos, cell intercalation
is much weaker than the wild type (third row). Different rows of cells remain relatively still in
BNT mutants (fourth row).
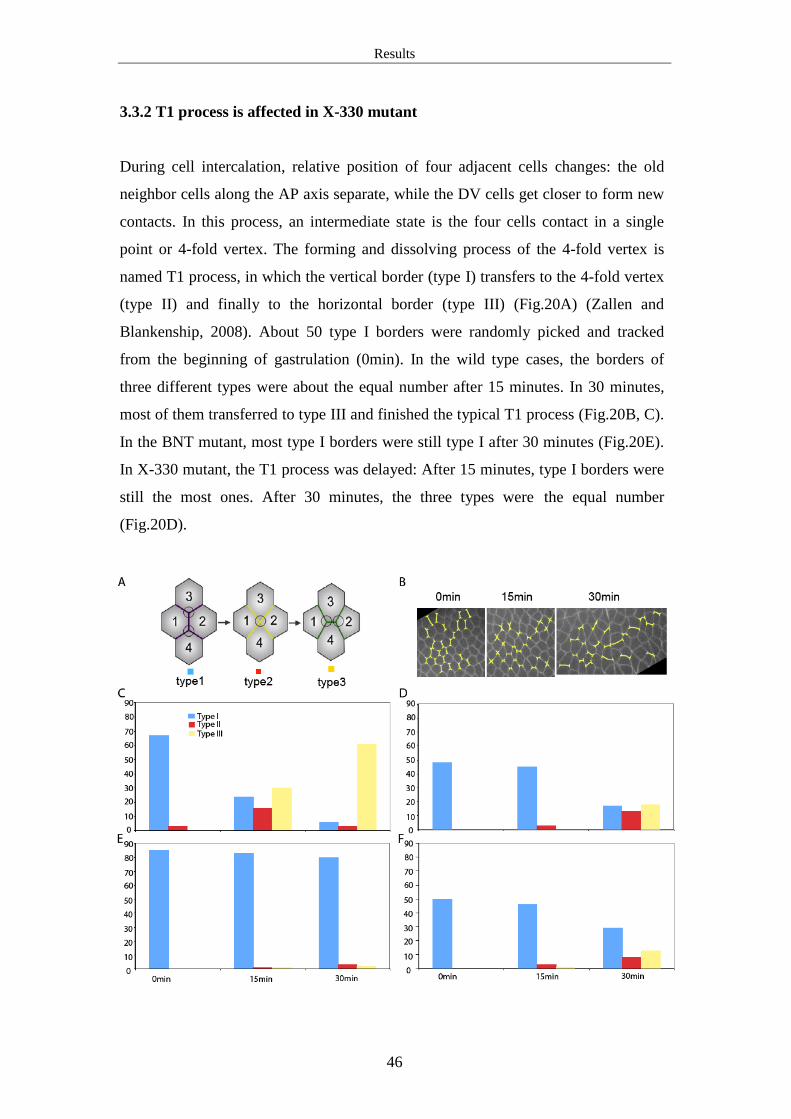
Results
46
3.3.2 T1 process is affected in X-330 mutant
During cell intercalation, relative position of four adjacent cells changes: the old
neighbor cells along the AP axis separate, while the DV cells get closer to form new
contacts. In this process, an intermediate state is the four cells contact in a single
point or 4-fold vertex. The forming and dissolving process of the 4-fold vertex is
named T1 process, in which the vertical border (type I) transfers to the 4-fold vertex
(type II) and finally to the horizontal border (type III) (Fig.20A) (Zallen and
Blankenship, 2008). About 50 type I borders were randomly picked and tracked
from the beginning of gastrulation (0min). In the wild type cases, the borders of
three different types were about the equal number after 15 minutes. In 30 minutes,
most of them transferred to type III and finished the typical T1 process (Fig.20B, C).
In the BNT mutant, most type I borders were still type I after 30 minutes (Fig.20E).
In X-330 mutant, the T1 process was delayed: After 15 minutes, type I borders were
still the most ones. After 30 minutes, the three types were the equal number
(Fig.20D).

Results
47
Figure 20. T1 process is delayed in X-330 mutant. A. T1 process model: During cell
intercalation, vertical borders (type I) transfer to 4-fold vertexes (type II) and then to horizontal
borders (type III). B. T1 process is shown in a wild type embryo. C-F. About 50 cases were
picked and tracked in different embryos. In the wild type, three border types were similar
numbers after 15 minutes. Most cases transferred to type III after 30 minutes (C). In X-330
mutant, this transformation is delayed. 30 minutes later, three types were equal number (D). In
BNT mutant, most type I cases kept still from 0 minute to 30 minutes (E). In E-cadherin RNAi
embryos, the transformation from type I to type II and type III was much delayed, compared
with the wild type, which was similar with the X-330 mutant (F).
3.4 Anterior-posterior polarity and planar cell polarity has
no obvious defect in X-330 mutant
Segmental subdivision along AP axis is essential for germ band extension and its
associated cell intercalation (Irvine and Wieschaus, 1994). Planar polarized junctions
and cytoskeleton proteins are likely to drive the T1 process (Bertet et al., 2004;
Blankenship et al., 2006; Zallen and Wieschaus, 2004). To find out the mechanism
of how X-330 mutation affects cell intercalation, we examined the embryonic
polarity and planar cell polarity in the mutant.
3.4.1 AP polarity is not obviously affected in X-330 mutant
Even-skipped (Eve) protein is a transcriptional repressor, which functions in the
primary segmentation. It is known that mutations affect AP patterning decrease germ
band extension and cell intercalation (Irvine and Wieschaus, 1994). Eve protein was
used as an AP segmentation marker to examine if AP patterning is affected in X-330
mutants. In the wild type embryos, Eve protein formed a symmetrical seven-striped
pattern in cellularization stage (Fig.21A). Similarly, Eve expressed in seven-stripped
pattern in X-330 mutants (Fig.21B). This result suggests AP segmentation is normal
in X-330 mutants.
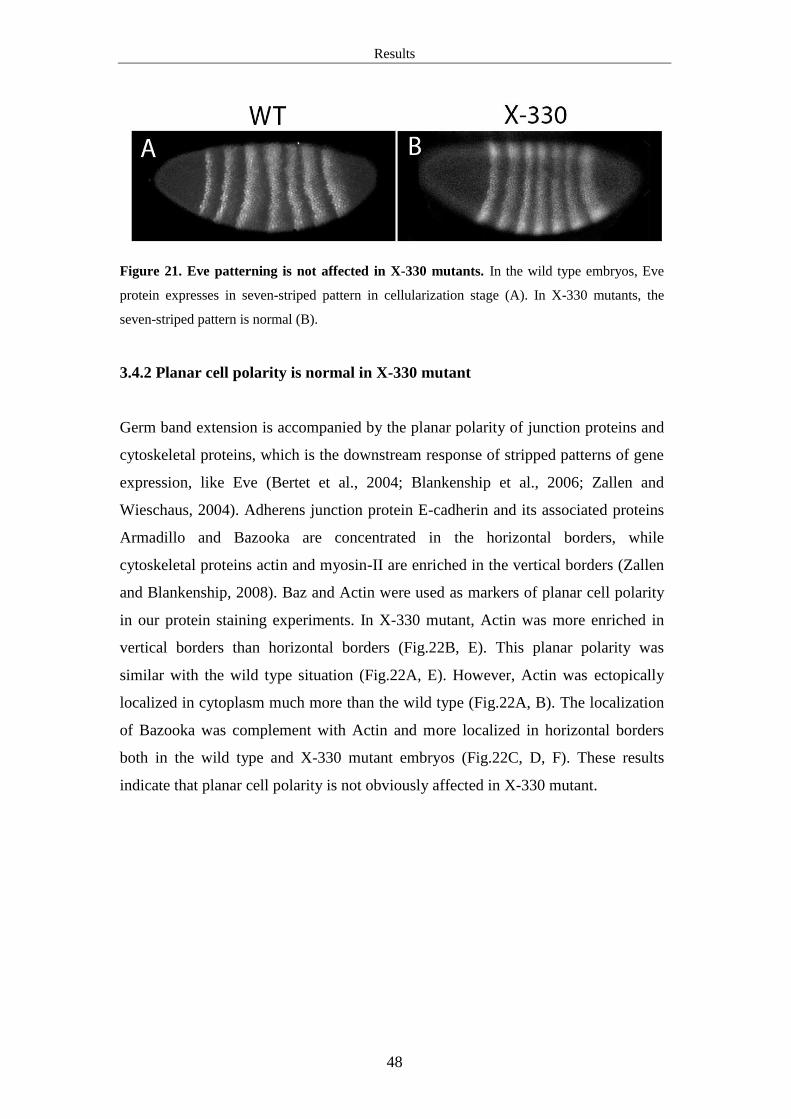
Results
48
Figure 21. Eve patterning is not affected in X-330 mutants. In the wild type embryos, Eve
protein expresses in seven-striped pattern in cellularization stage (A). In X-330 mutants, the
seven-striped pattern is normal (B).
3.4.2 Planar cell polarity is normal in X-330 mutant
Germ band extension is accompanied by the planar polarity of junction proteins and
cytoskeletal proteins, which is the downstream response of stripped patterns of gene
expression, like Eve (Bertet et al., 2004; Blankenship et al., 2006; Zallen and
Wieschaus, 2004). Adherens junction protein E-cadherin and its associated proteins
Armadillo and Bazooka are concentrated in the horizontal borders, while
cytoskeletal proteins actin and myosin-II are enriched in the vertical borders (Zallen
and Blankenship, 2008). Baz and Actin were used as markers of planar cell polarity
in our protein staining experiments. In X-330 mutant, Actin was more enriched in
vertical borders than horizontal borders (Fig.22B, E). This planar polarity was
similar with the wild type situation (Fig.22A, E). However, Actin was ectopically
localized in cytoplasm much more than the wild type (Fig.22A, B). The localization
of Bazooka was complement with Actin and more localized in horizontal borders
both in the wild type and X-330 mutant embryos (Fig.22C, D, F). These results
indicate that planar cell polarity is not obviously affected in X-330 mutant.
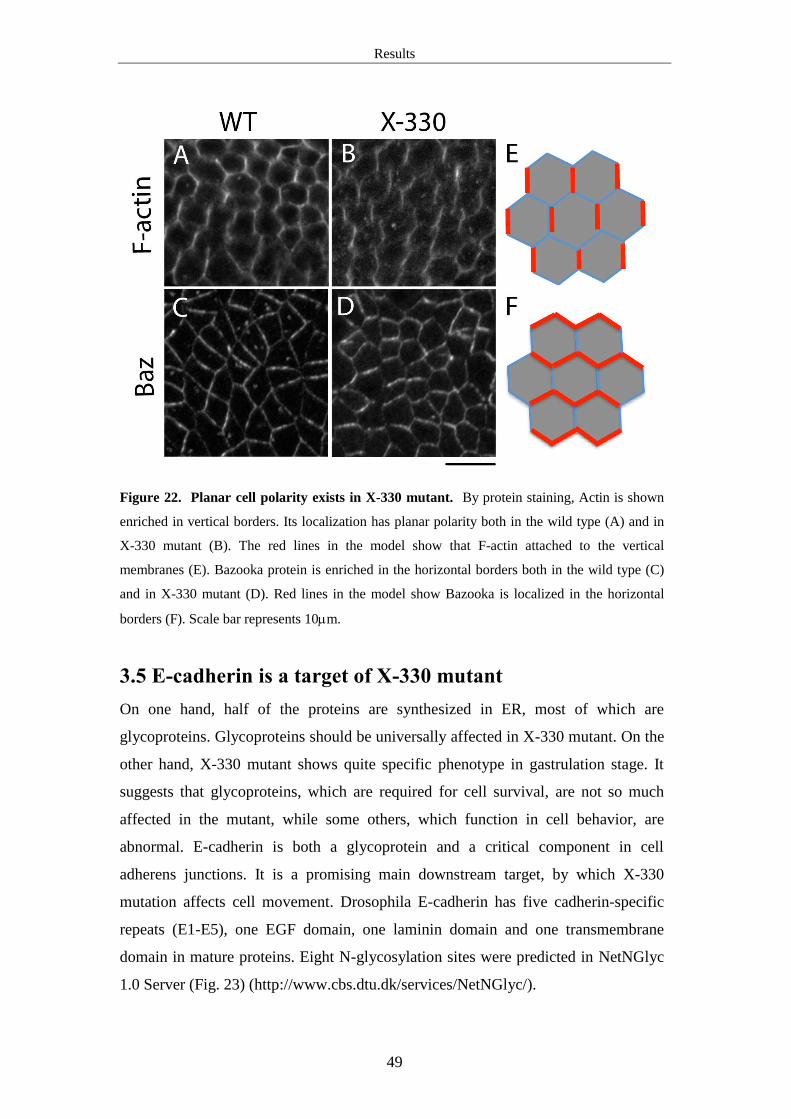
Results
49
Figure 22. Planar cell polarity exists in X-330 mutant. By protein staining, Actin is shown
enriched in vertical borders. Its localization has planar polarity both in the wild type (A) and in
X-330 mutant (B). The red lines in the model show that F-actin attached to the vertical
membranes (E). Bazooka protein is enriched in the horizontal borders both in the wild type (C)
and in X-330 mutant (D). Red lines in the model show Bazooka is localized in the horizontal
borders (F). Scale bar represents 10m.
3.5 E-cadherin is a target of X-330 mutant
On one hand, half of the proteins are synthesized in ER, most of which are
glycoproteins. Glycoproteins should be universally affected in X-330 mutant. On the
other hand, X-330 mutant shows quite specific phenotype in gastrulation stage. It
suggests that glycoproteins, which are required for cell survival, are not so much
affected in the mutant, while some others, which function in cell behavior, are
abnormal. E-cadherin is both a glycoprotein and a critical component in cell
adherens junctions. It is a promising main downstream target, by which X-330
mutation affects cell movement. Drosophila E-cadherin has five cadherin-specific
repeats (E1-E5), one EGF domain, one laminin domain and one transmembrane
domain in mature proteins. Eight N-glycosylation sites were predicted in NetNGlyc
1.0 Server (Fig. 23) (http://www.cbs.dtu.dk/services/NetNGlyc/).
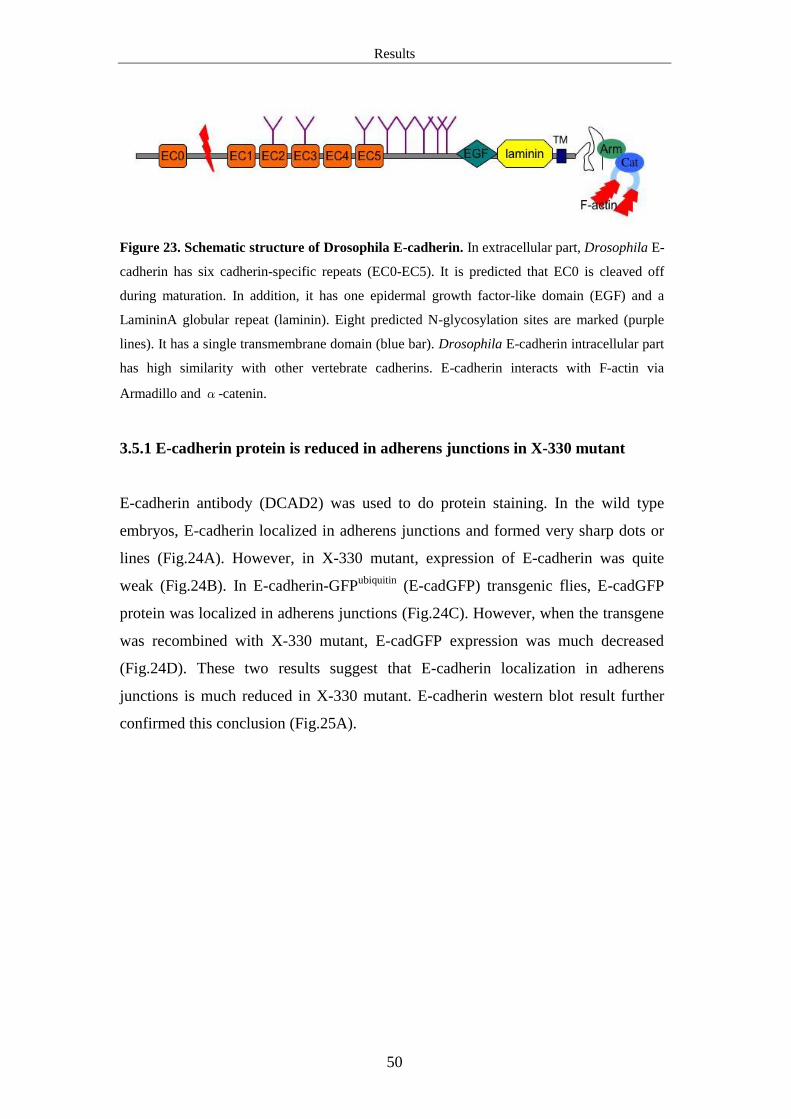
Results
50
Figure 23. Schematic structure of Drosophila E-cadherin. In extracellular part, Drosophila E-
cadherin has six cadherin-specific repeats (EC0-EC5). It is predicted that EC0 is cleaved off
during maturation. In addition, it has one epidermal growth factor-like domain (EGF) and a
LamininA globular repeat (laminin). Eight predicted N-glycosylation sites are marked (purple
lines). It has a single transmembrane domain (blue bar). Drosophila E-cadherin intracellular part
has high similarity with other vertebrate cadherins. E-cadherin interacts with F-actin via
Armadillo and α-catenin.
3.5.1 E-cadherin protein is reduced in adherens junctions in X-330 mutant
E-cadherin antibody (DCAD2) was used to do protein staining. In the wild type
embryos, E-cadherin localized in adherens junctions and formed very sharp dots or
lines (Fig.24A). However, in X-330 mutant, expression of E-cadherin was quite
weak (Fig.24B). In E-cadherin-GFPubiquitin
(E-cadGFP) transgenic flies, E-cadGFP
protein was localized in adherens junctions (Fig.24C). However, when the transgene
was recombined with X-330 mutant, E-cadGFP expression was much decreased
(Fig.24D). These two results suggest that E-cadherin localization in adherens
junctions is much reduced in X-330 mutant. E-cadherin western blot result further
confirmed this conclusion (Fig.25A).

Results
51
Figure 24. E-cadherin is reduced in adherens junctions in X-330 mutant. In protein staining,
E-cadherin is localized in adherens junctions. The fluorescence signal is concentrated in sharp
lines in the wild type embryos, stage7 (A). E-cadherin signal is very weak in X-330 mutant. No
sharp lines are seen in junction position (B). E-cadGFP is localized in adherens junctions in the
wild type background (C). In X-330 mutant background, E-cadGFP could hardly be seen (D). In
the model, E-cadherin should be localized in adherens junctions and more enriched in the
horizontal borders (E).
3.5.2 E-cadherin is partially glycosylated in X-330 mutant
In Western blot, E-cadherin was reduced in X-330 mutant (Fig.25A). -Tubulin was
used as a control for protein loading amount. Interestingly, E-cadherin protein size
was decreased in X-330 mutant, compared to the wild type one (Fig.25A). It
indicates the glycosylation state of E-cadherin is affected. To further detect its N-
glycosylation, we used N-Glycosidase F (GaseF) to treat the protein samples, which
could remove all the N-glycans from proteins. Western blot was used to test protein
size of different samples. After GaseF treatment, E-cadherin band shifted to the same
position both in the wild type and X-330 mutant (Fig.25B). It suggests that E-
cadherin protein without N-glycans is the normal size in X-330 mutant. However, in
X-330 mutant, E-cadherin band was in the middle position between the wild type

Results
52
band and the enzyme treated one (Fig.25B). It suggests that E-cadherin does not
completely lose N-glycans in X-330 mutant. Instead, N-glycans are partially reduced.
Figure 25. E-cadherin protein amount is reduced and its N-glycosylation is affected in X-
330 mutant. E-cadherin protein size is about 150kb. In western blot, E-cadherin band in X-330
mutant is much weaker than the wild type (A up layer). α-Tubulin (Tub) is used to show that
the loading amount of protein is comparable between the wild type and the mutant (A down
layer). After GaseF treatment, E-cadherin bands in the wild type and the mutant are both in the
same position (B, second and forth lane). The size of E-cadherin in X-330 mutant is between the
wild type band and the enzyme treated one (B, third lane), which indicates its N-glycosylation is
partially impaired.
N-glycosylation firstly synthesized the core pentasaccharide in ER, Man3GlcNAc2
(Fig.5). The glycoprotein was transferred to Golgi for further processing
modification, producing three main classes of N-linked glycan classes: High-
mannose, Hybrid and complex. The High-mannose glycans contain 5 to 9 mannose.
To examine whether Golgi apparatus modification function is affected or not, EndoH
was used to treat the protein extraction from the wild type and mutant embryos.
EndoH only cleaves within the chitobiose core of high mannose and some hybrid
oligosaccharides from N-linked glycoproteins. It means, only with Golgi
modification, glycan could be cleaved by EndoH. The western blot result showed
that E-cadherin bands in the two mutants without enzyme treatment were localized
between the wild type one and the EndoH treated one. They shifted to the common
lower position after EndoH treatment in the wild type, X-330 mutant and Wol267

Results
53
mutant (Fig.26). This result indicates that function of Golgi apparatus is not
obviously affected by X-330 or Wol267 mutant.
Figure 26. Modification of E-cadherin protein in Golgi may not be affected in the mutants.
E-cadherin band was marked by arrow in every lane. After EndoH treatment (+), the band shifted
to the same position in the wild type (WT) and the mutants (X-330 and Wol267).
3.5.3 Expression and localization of some ER synthesized membrane proteins
are normal, while the others are abnormal in X-330 mutant
Since the reduction of E-cadherin protein is detected in X-330 mutant, our question
is whether the other membrane proteins are affected or not. We examined another
three membrane proteins: 117GFP (CG8668), Neurotactin and Crumbs (Hortsch et
al., 1990; Tepass et al., 2001). 117GFP transgenic fly was made by GFP inserted
into the membrane protein CG8668 site (inverse PCR sequence is provided by Dr.
Alain Debec). In the wild type embryos, 117GFP was localized in cell junctions and
formed sharp fluorescent lines (Fig.27A). In X-330 mutant, its localization and
intensity was both normal (Fig.27B). Neurotactin is another membrane protein,
which expresses in cellularization stage. Protein staining result showed that
Neurotactin was localized in cytoplasm membrane both in the wild type and X-330
mutant (Fig.27C, D).
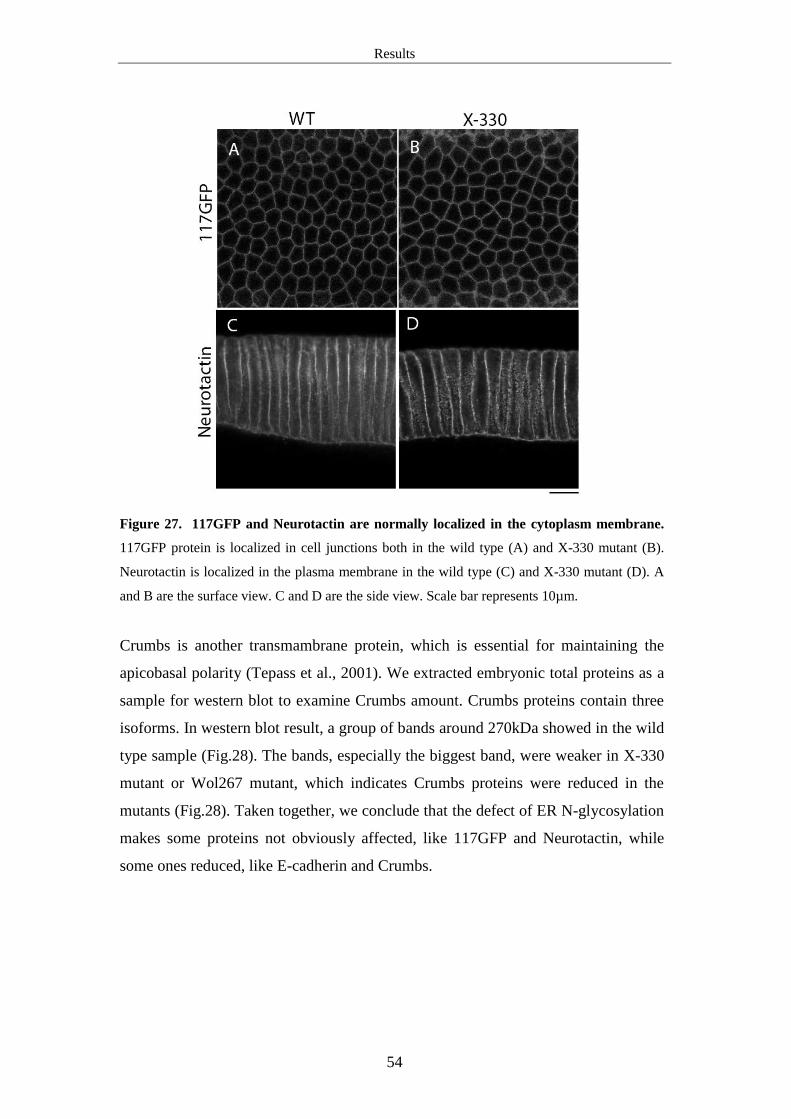
Results
54
Figure 27. 117GFP and Neurotactin are normally localized in the cytoplasm membrane.
117GFP protein is localized in cell junctions both in the wild type (A) and X-330 mutant (B).
Neurotactin is localized in the plasma membrane in the wild type (C) and X-330 mutant (D). A
and B are the surface view. C and D are the side view. Scale bar represents 10µm.
Crumbs is another transmambrane protein, which is essential for maintaining the
apicobasal polarity (Tepass et al., 2001). We extracted embryonic total proteins as a
sample for western blot to examine Crumbs amount. Crumbs proteins contain three
isoforms. In western blot result, a group of bands around 270kDa showed in the wild
type sample (Fig.28). The bands, especially the biggest band, were weaker in X-330
mutant or Wol267 mutant, which indicates Crumbs proteins were reduced in the
mutants (Fig.28). Taken together, we conclude that the defect of ER N-glycosylation
makes some proteins not obviously affected, like 117GFP and Neurotactin, while
some ones reduced, like E-cadherin and Crumbs.

Results
55
Figure 28. Crumbs is reduced in X-330 mutant and Wol267 mutant. In western blot,
Crumbs show a group of bands around 270kDa: a stronger one (arrowhead) and two weaker ones.
The bands in the mutants are in the same position, but weaker than the wild type. -Tubulin
(Tub) is used as a loading control.
3.5.4 Adherens junctions are normally localized in X-330 mutant
Reduction of E-cadherin in X-330 mutant may affect adherens junctions' formation.
To detect whether adherens junctions are affected or not, some other junction
proteins were examined in stage7. Result showed that -Catenin (cat), Armadillo
(arm) and Bazooka (baz) were all localized in adherens junctions (Fig.29A) (Tepass
et al., 2001). Their expression was not apparently different from the wild type
situation. Western blot was used to further examine the amount of proteins.
Armadillo is about 105-110kDa (Peifer, 1993). -Catenin is 102kDa. In X-330
mutant, Armadillo was slightly reduced, while -Catenin was normal (Fig.29B). In
Wol267 mutant, the protein amount of Armadillo and -Catenin were all in the same
level with the wild type (Fig29B). These results indicate that the adherens junctions'
formation and localization are not obviously affected in X-330 mutant or Wol267
mutant.

Results
56
Figure 29. Adherens junctions are normally localized in X-330 mutant. In the wild type
embryos of stage7, α-Catenin (cat), Armadillo (arm) and Bazooka (baz) are all localized in
junctional sites. In X-330 mutant, the three proteins’ localization and their amount are similar
with the wild type (A). In western blot, Armadillo is a group of bands in 110kDa. The bands in
the wild type and Wol267 mutant are similar, while the bands in X-330 mutant are slightly
weaker (B, left image). For α-Catenin, it is a band in 102kDa. The band position and intensity
are all similar in the wild type and the mutants (B, right image).

Results
57
3.5.5 Knockdown of E-cadherin induces cell intercalation defect during germ
band extension
In germ band extension, cells change their neighbors and set up new adherens
junctions without breaking down the integrity of the cell sheet. However, the
mechanism involved is not clear until now. E-cadherin, as the main component of
adherens junctions, should function in this process. Therefore, reduction of E-
cadherin may be the direct reason why X-330 mutant has cell intercalation defect
during germ band extension. E-cadherin may be the downstream target of CG4542
and other N-glycosylation enzymes, through which the mutants cause the specific
phenotype in gastrulation. To examine our hypothesis, we did E-cadherin RNAi to
knockdown E-cadherin in early stage embryos (within one hour after laying) and
observed their development. After E-cadherin dsRNA injection, we picked the
embryos, which could develop to cellularization stage normally, and took DIC
movies. In about 68% embryos (n=25), germ band extension stopped in the midgut
position, which was quite similar with the phenotype of X-330 mutant, Wol mutant
and Gny mutant (Fig.30, Fig.17A). It suggests that E-cadherin is the target of N-
glycosylation enzymes, by which the mutants affect cell intercalation during germ
band extension.
0min 40min
Figure 30. E-cadherin RNAi induces germ band extension defect. After injection of E-
cadherin dsRNA in the wild type embryos, germ band extension was blocked in the midgut
position (arrow). 0 min represents the germ cells start to move dorsally.
To characterize the T1 process in the E-cadherin knockdown embryos, we did E-
cadherin RNAi in the 117GFP embryos, in which cells were marked and their
movement could be tracked. We quantified borders of three types as mentioned
before and found the T1 process was delayed like in X-330 mutant (Fig.20F). Most

Results
58
Type I could not transform to Type II or Type III within 30 minutes. This result
indicates that E-cadherin is the downstream substrate of X-330 to induce the cell
intercalation defect during germ band extension.
In addition, we tried to rescue the phenotype by overexpression of E-cadherin in X-
330 mutant background, using X-330/FM7; Cad::CherryUASp
/Cyo and OvoX,
Frt/C(1)/Y; mat67Gal4/Cyo. However, the germline clones were quite weak. It was
very hard to get the embryos, which were not collapsed. Only a few (n=6) could
develop and all of them showed the germ band extension defect. It suggests that E-
cadherin overexpression could not rescue the phenotype of X-330 mutant.
3.6 New horizontal borders are formed by pulsed manner
and stabilized by E-cadherin
During cell intercalation, the T1 process involves two steps: vertical border
constriction and new horizontal border extension. It is already known that the
recruitment of medial myosin to junctional site causes the shrinkage of vertical
borders (Rauzi et al., 2010). However, it is still remained unclear how the horizontal
borders extend. Our result shows that E-cadherin is required for cell intercalation. It
is possible that E-cadherin functions in horizontal border extension and new adherens
junctions' formation. To examine this hypothesis, we tracked and analyzed the
formation of new borders and E-cadherin dynamics.
3.6.1 New horizontal borders extend by pulsed behavior
Using 117GFP transgenic Drosophila, we recorded the cell intercalation during germ
band extension by time-lapse images in the confocal microscope. We manually
picked 30 T1 process cases in the wild type and X-330 mutant separately and
measured their border length in every 30 seconds using ImageJ. Vertical border
constriction and horizontal border extension were separated and made charts (Fig.31,
40). As for the new border extension, it was very efficient in the wild type cases. 90%
of them extended to more than 1.1µm within 10 minutes (Fig.31B). However, in X-
330 mutant, the new formed borders could not extend fast, but always extended a
little bit and shrank back to the 4-fold vertex. Sometimes, they even jumped back to
vertical borders. 10 minutes after the border extension starts, only 30% cases were
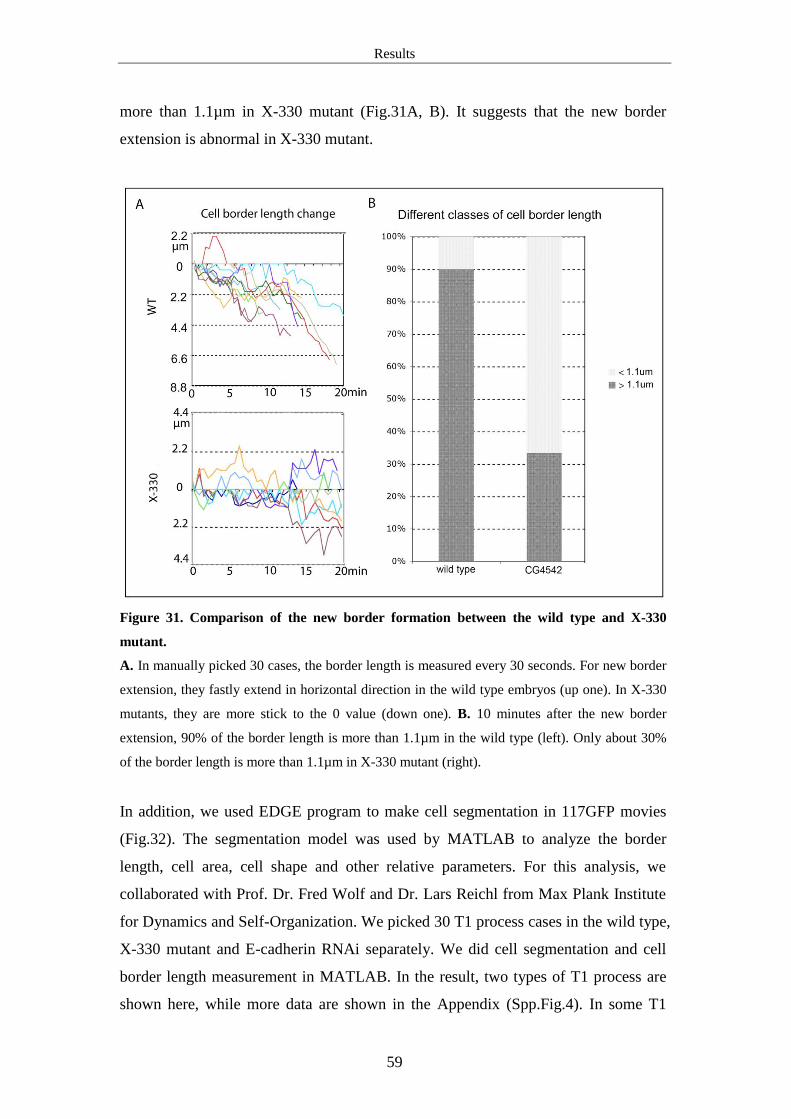
Results
59
more than 1.1µm in X-330 mutant (Fig.31A, B). It suggests that the new border
extension is abnormal in X-330 mutant.
Figure 31. Comparison of the new border formation between the wild type and X-330
mutant.
A. In manually picked 30 cases, the border length is measured every 30 seconds. For new border
extension, they fastly extend in horizontal direction in the wild type embryos (up one). In X-330
mutants, they are more stick to the 0 value (down one). B. 10 minutes after the new border
extension, 90% of the border length is more than 1.1µm in the wild type (left). Only about 30%
of the border length is more than 1.1µm in X-330 mutant (right).
In addition, we used EDGE program to make cell segmentation in 117GFP movies
(Fig.32). The segmentation model was used by MATLAB to analyze the border
length, cell area, cell shape and other relative parameters. For this analysis, we
collaborated with Prof. Dr. Fred Wolf and Dr. Lars Reichl from Max Plank Institute
for Dynamics and Self-Organization. We picked 30 T1 process cases in the wild type,
X-330 mutant and E-cadherin RNAi separately. We did cell segmentation and cell
border length measurement in MATLAB. In the result, two types of T1 process are
shown here, while more data are shown in the Appendix (Spp.Fig.4). In some T1
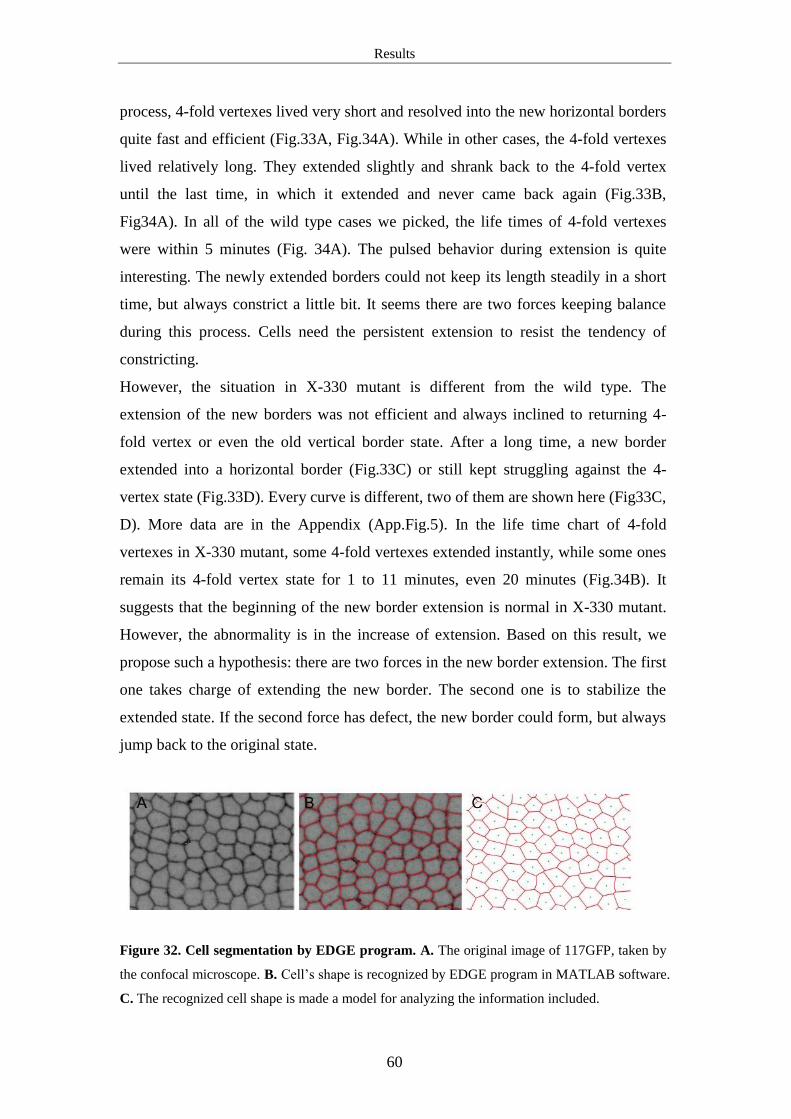
Results
60
process, 4-fold vertexes lived very short and resolved into the new horizontal borders
quite fast and efficient (Fig.33A, Fig.34A). While in other cases, the 4-fold vertexes
lived relatively long. They extended slightly and shrank back to the 4-fold vertex
until the last time, in which it extended and never came back again (Fig.33B,
Fig34A). In all of the wild type cases we picked, the life times of 4-fold vertexes
were within 5 minutes (Fig. 34A). The pulsed behavior during extension is quite
interesting. The newly extended borders could not keep its length steadily in a short
time, but always constrict a little bit. It seems there are two forces keeping balance
during this process. Cells need the persistent extension to resist the tendency of
constricting.
However, the situation in X-330 mutant is different from the wild type. The
extension of the new borders was not efficient and always inclined to returning 4-
fold vertex or even the old vertical border state. After a long time, a new border
extended into a horizontal border (Fig.33C) or still kept struggling against the 4-
vertex state (Fig.33D). Every curve is different, two of them are shown here (Fig33C,
D). More data are in the Appendix (App.Fig.5). In the life time chart of 4-fold
vertexes in X-330 mutant, some 4-fold vertexes extended instantly, while some ones
remain its 4-fold vertex state for 1 to 11 minutes, even 20 minutes (Fig.34B). It
suggests that the beginning of the new border extension is normal in X-330 mutant.
However, the abnormality is in the increase of extension. Based on this result, we
propose such a hypothesis: there are two forces in the new border extension. The first
one takes charge of extending the new border. The second one is to stabilize the
extended state. If the second force has defect, the new border could form, but always
jump back to the original state.
Figure 32. Cell segmentation by EDGE program. A. The original image of 117GFP, taken by
the confocal microscope. B. Cell’s shape is recognized by EDGE program in MATLAB software.
C. The recognized cell shape is made a model for analyzing the information included.

Results
61
Figure 33. The length change of cell borders in the T1 process. EDGE program in MATLAB
was used to do segmentation for 117GFP marked cell images. The border length was measured in
every 5 seconds. In the wild type movies, new borders extend instantly or shortly after the 4-fold
vertex formed (A, B). The extension is in a kind of pulsed behavior. In X-330 mutant, the pulsed
behavior is more obvious. The new border extension is not as stable as the wild type, but always
goes back to the 4-fold vertex or even to the vertical borer state (C, D). In E-cadherin RNAi
embryos, the new border extension is similar with X-330 mutant (E, F).

Results
62
Figure 34. The Life time of 4-fold vertex in the T1 process of the wild type and X-330
mutant. In the wild type embryo, some 4-fold vertexes live shorter than 1 minute, while others
live from 1 minute to 5 minutes (A). In X-330 mutant, the 4-fold vertexes live longer than the
wild type ones. A few of them live less than 1 minute, similar with the wild type ones. Most
others are scattered from 2.5 minutes to 20 minutes (B).
Knockdown of E-cadherin leads to the cell intercalation defect. To further
characterize this phenotype, the cell border length was tracked during the T1 process
(Fig. 33E, F and Spp.Fig.6). The curves in E-cadherin RNAi showed the length of
the new borders was inclined to stick to 0 value or jump back to the vertical borders
again. It indicates that the extension force is not enough to resist the constricting
tendency. These curves are more like X-330 mutant ones, which indicates they may
have the same defect during the T1 process. This result further suggests that E-
cadherin is required for the T1 process and the new border extension. Its function
may be for stabilizing the extended new borders.
3.6.2 E-cadherin is gradually accumulated in the new adherens junctions during
the new border formation
E-cadherin is important for the T1 process. However, how it is involved in this
process is unknown. There are two possibilities: One is that E-cadherin actively
contributes to new border extension. Its accumulation in the new borders provides
force to stick the new neighbor cells together. The other possibility is that E-cadherin
is passively accumulated after the new borders’ formation. It does not provide force
for the new border extension. To examine which possibility is true, we tracked E-

Results
63
cadherin dynamics during T1 process. In the Cad::GFPcadherin
transgenic fly,
Cadherin::GFP was knocked into the original E-cadherin gene position, which means
the Cad::GFP amount should be the same with E-cadherin in the wild type embryos.
We recorded time-lapse images of Cad::GFPcadherin
in stage7 and measured the green
fluorescence intensity during the new horizontal border extension. In 20 cases
randomly picked, about 50% showed that GFP intensity obviously increased during
the new border extension (Fig.35A, B). In the beginning of the 4-fold vertexes
extending to the short horizontal borders, the GFP intensity suddenly decreased,
gradually recovered and got stronger and stronger (Fig.35A). 10 cases in one movie
were collected to show that the GFP intensity increased about 2 folds in 5 minutes
(Fig.35B). This result indicates that E-cadherin could not provide the force for cell
border extension. Instead, it is involved in forming the new adherens junctions,
which may facilitate stabilizing the extended new borders.
Fluorescence recovery after photo bleaching (FRAP) was used to further examine the
dynamics of E-cadherin. Laser bleaching decreased the E-cadGFP fluorescence to
about 20% of the original intensity (Fig.36). Within 2 minutes, the signal recovered
to about 50% of the original intensity both in the vertical borders and the horizontal
borders. It indicates that the dynamic turnover of E-cadherin protein is very fast,
which means it has the ability to accumulate in the new adherens junctions rapidly.
However, the real case is that E-cadherin is first diluted by the length extension and
accumulates later. This result further suggests that E-cadherin is not required for the
new border extension, but may function in stabilizing the extended borders.

Results
64
Figure 35. E-cadherin is accumulated gradually in the new formed junctions. E-cad::GFP
represents the in vivo E-cadherin expression without any does effect. Time-lapse images were
taken to track the dynamics of E-cad::GFP during the new cell border formation. E-cad::GFP was
quite weak in the beginning of the new border extension. Within 5 minutes, it is accumulated and
get stronger and stronger (A). 10 cases were collected to make a chart for the E-cad::GFP signal
intensity during 5 minutes. E-cad::GFP increased about 2 folds in 5 minutes (B).

Results
65
Figure 36. E-cadherin recovers quite fast after photo bleaching. In FRAP experiment, the
fluorescence decreased to about 20% of the original intensity by laser bleach. It recovered to
about 50% in 2 minutes. Blue line represents a horizontal border. Red line represents a vertical
border.
To further study the correlation between E-cadherin amount and the length of newly
formed cell borders, we picked 32 cases from 3 single movies and measured both the
GFP intensity and the new border length. With the help of our collaborator, we made
curves to show their correlation (Fig.37 up row, Spp.Fig.3). Interestingly, the
anticorrelation was found between the two curves. To make the result more clear, we
also made the detrended curves, in which the linear trend was subtracted from the
original curves (Fig.37 low row, Spp.Fig.3). Almost all of the C values were negative,
which means the two curves are anticorrelation (Fig.37, 38A). We also made a heat
chart to show the anticorrelation of GFP intensity and the length of newly formed
borders, using red color to represent high value and blue color to represent low value
(Fig.38B). This result further confirmed that the new border extension is earlier than
E-cadherin accumulation. Cell border extension makes E-cadherin diluted. More E-

Results
66
cadherin protein is accumulated afterwards, possibly functioning in stabilizing new
borders.
Figure 37. E-cadherin protein amount and the new border length are anticorrelated. E-
cad::GFP’s fluorescence intensity and the new cell border length are in the same chart. They two
curves have anticorrelation (up row for two cases). In each chart, Y axis of GFP intensity (Grey
value from 0 to 255) is in the left side, while Y axis of cell border length is in the right side. X
axis shows the time scale. The blue curves represent E-cadherin intensity. The black curves
represent the border length. Detrended curves are made to clearly show the anticorrelation (low
row for the upper cases).

Results
67
Figure 38. E-cadherin protein amount and the new border length are anticorrelated. A. C
value of thirty cases is almost all negative values, only with two exceptions. B. Different colors
are used to represent the different values in heat bars. From blue to red, the values increase. For
every two color bars, the upper one shows E-cadherin intensity, while the lower one shows the
new border length. The colors between the two bars are complementary to each other, indicating
that they are anticorrelated.

Results
68
3.6.3 Myosin enrichment in vertical junctions is delayed in X-330 mutant
Myosin-II flows from the medial region to the vertical junctions drive the vertical
border shrinkage (Martin et al., 2009; Rauzi et al., 2010). The shortening of border
length is stabilized by junctional myosin (Fernandez-Gonzalez et al., 2009; Rauzi et
al., 2008). To examine whether the localization of myosin in X-330 mutant is normal
or not, Myosin::Cherryubiquitin
transgenic flies were used to track the myosin
dynamics. In stage 7, shortly after the ventral furrow formation, myosin appeared in
the germ band region (Fig.39A). Its signal was weak and random. 10 minutes later,
myosin was enriched in the junctional sites with stronger localization in the vertical
borders (Fig.39C). In 20 minutes, myosin signal was very strong and sharp in the
vertical borders (Fig.39D). Myosin’s weak signal appeared in the normal time in
X-330 mutants (Fig.39E, I). However, it could not accumulate in the junction sites
within 10 minutes (Fig.39G, K). In 20 minutes, the medial myosin was still
randomly localized in X-330 mutant (Fig.39H, L). In some embryos, junctional
myosin could not be detected, only medial myosin tethered near the cell borders
(Fig.39H). While in other ones, the localization of junctional myosin could be
weakly detected with planar polarity (Fig.39L). It suggests that the recruitment of
medial myosin to junctional sites is blocked in X-330 mutant. In addition, vertical
border constriction was tracked by measuring the randomly picked 30 cases. In the
wild type, most cases finished the constriction within 10 minutes (Fig.40A). The
times were concentrated in about 5 minutes (Fig.40B). In X-330 mutant, vertical
border constriction was delayed. They could accomplish shrinkage within 20
minutes (Fig.40A). The times were more scattered than the wild type ones (Fig.40B).
The delayed vertical border constriction could be explained by the defect of medial
myosin’s recruitment to junctional sites in X-330 mutant.

Results
69
Figure 39. Medial myosin’s recruitment to junctions is inhibited and delayed in X-330
mutant. In the wild type embryos, medial myosin is gradually increased and recruited to
junctions (A-D). For two cases of X-330 mutant: X-330 (1) and X-330 (2), their myosin
accumulation is both delayed. The medial myosin in the mutant is stronger than the wild type one
(E-H, I-L). For X-330 (1), junctional myosin is not detectable (H). For X-330 (2), junctional
myosin is weak (arrow) with the planar polarity (L).

Results
70
Figure 40. The constriction of vertical borders is delayed in X-330 mutant. A. In manually
picked 30 cases, the border length is measured every 30 seconds. Based on the curves of border
length change, vertical border constriction is mostly within 10 minutes in the wild type embryos
(up one). In X-330 mutant, the constriction time is prolonged to 15 to 20 minutes (down one). B.
In this chart, every point represents the time of each vertical border constriction. The times are
concentrated to about 6 minutes in the wild type (left). In X-330 mutant, the average time is
about 13 minutes (right). The times are more scattered than the wild type ones.
3.7 Other phenotypes in X-330 mutant
3.7.1 Ventral furrow could not form normally in X-330 mutant
In 117GFP transgenic flies, cell borders are marked, which makes the cell movement
and cell shape change tractable. We recorded the time-lapse images of ventral
furrow formation (Fig.41A). In the wild type embryos, the presumptive mesoderm
invaginated, caused by the cell’s apical constriction. 10 minutes after the apical
constriction starts, internalization of the mesodermal precursors formed the ventral
furrow. Within 30 minutes, ventral furrow closed completely. The mesoderm and the
ectoderm were separated (Fig.41A, up row). In X-330 mutant, apical constriction of
ventral cells could start normally. However, the mesodermal precursors ’
invagination and the ventral furrow’s closure were inhibited (Fig.41A, down row).
We measured the single cells’ area in the ventral side in every 2.5 minutes. It was
shown that the apical constriction of presumptive mesoderm cells in X-330 mutant
was delayed, especially in 7.5 to 10 minutes (Fig.41B).
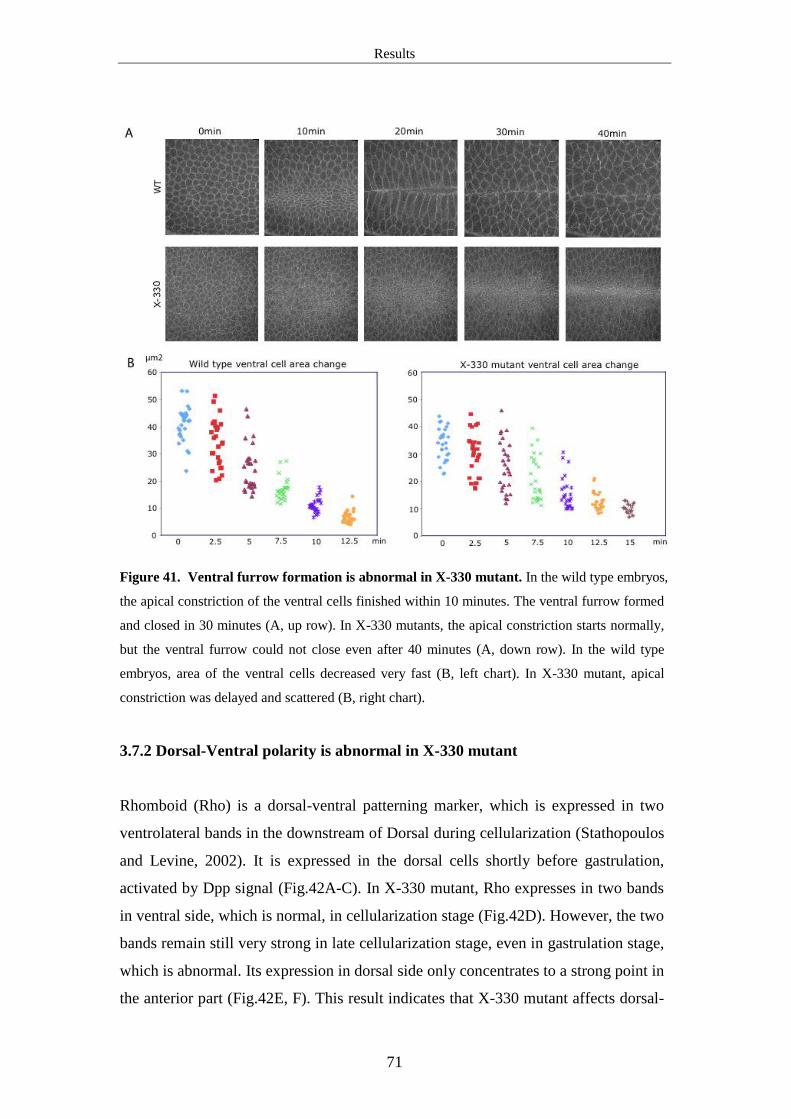
Results
71
Figure 41. Ventral furrow formation is abnormal in X-330 mutant. In the wild type embryos,
the apical constriction of the ventral cells finished within 10 minutes. The ventral furrow formed
and closed in 30 minutes (A, up row). In X-330 mutants, the apical constriction starts normally,
but the ventral furrow could not close even after 40 minutes (A, down row). In the wild type
embryos, area of the ventral cells decreased very fast (B, left chart). In X-330 mutant, apical
constriction was delayed and scattered (B, right chart).
3.7.2 Dorsal-Ventral polarity is abnormal in X-330 mutant
Rhomboid (Rho) is a dorsal-ventral patterning marker, which is expressed in two
ventrolateral bands in the downstream of Dorsal during cellularization (Stathopoulos
and Levine, 2002). It is expressed in the dorsal cells shortly before gastrulation,
activated by Dpp signal (Fig.42A-C). In X-330 mutant, Rho expresses in two bands
in ventral side, which is normal, in cellularization stage (Fig.42D). However, the two
bands remain still very strong in late cellularization stage, even in gastrulation stage,
which is abnormal. Its expression in dorsal side only concentrates to a strong point in
the anterior part (Fig.42E, F). This result indicates that X-330 mutant affects dorsal-

Results
72
ventral patterning upstream of Dpp. It is consistent with the result that Rho has the
similar expression pattern in Wol284 mutant (Haecker et al., 2008). We conclude
that N-glycosylation affects the DV patterning.
Figure 42. Dorsal-ventral patterning is abnormal in X-330 mutant. A-C. In the wild type
embryos, Rho expressed in two ventrolateral bands in cellularization stage (A). In the beginning
of gastrulation, it is expressed in one band in the middle of the dorsal side (B). This dorsal
expression is stronger in stage7 (C). D-F. In X-330 mutant, Rho expressed in two ventral bands,
which is normal (D). In the beginning of gastrulation stage, the ventral expression is still quite
strong with one strong point expression in the anterior-dorsal part (E). In stage7, the ventral
expression is still abnormal (F).
3.7.3 Mesoderm patterning is normal in X-330 mutant
Since ventral furrow formation is impaired in X-330 mutant, the question is proposed
that whether the mesoderm specification is affected or not. Twist is a ventral
mesoderm marker, which is expressed in about 20 rows of nuclei in the ventral cells
in cellularization stage (Fig.43A) (Leptin and Grunewald, 1990; Thisse et al., 1988).
In X-330 mutant, Twist expression in the ventral cells is normal (Fig.43B). It
indicates that the mesoderm specification may be normal in X-330 mutant.

Results
73
Figure 43. Twist protein is normally expressed in X-330 mutant. DAPI is blue fluorescence.
Twist is green fluorescence. In the wild type, twist protein localizes in about 20 rows of ventral
cell’s nuclei in cellularization stage (A). In X-330 mutant, this expression pattern is normal (B).
3.7.4 No obvious defect is shown in X-330 mutant follicle cell clones
It is mentioned previously that many germline clones of X-330 mutant collapsed
especially after long-time heat shocks (21h). This indicates that the phenotype may
be related with the size of the follicle cell clones. To examine if there is some
abnormality in X-330 mutant follicle cell clones, we did protein staining to test the
expression and localization of adherens junctions and cytoskeleton molecules. In the
follicle cells, X-330 homozygous mutant clones have no green fluorescence, while
X-330/GFP heterozygous clones and GFP homozygous clones have green
fluorescence, based on which we could distinguish different genotypes. The egg
chambers in stage10 of oogenesis were used. Dlg is a lateral membrane marker.
Armadillo and Bazooka are adherens junctions' markers. Actin is a cytoskeleton
marker. In X-330 mutant clones, protein expression and the localization of all the
markers were normal as the wild type clones (Fig.44). This result further confirmed
that X-330 mutant does not affect cell adherens junctions' formation and cell polarity.
We conclude that epithelium formation has no obvious defect in X-330 mutant in

Results
74
early oogenesis stage. The defect that leads to collapsed embryos may appear in later
stage.
Figure 44. Adherens junctions and cytoskeleton have no obvious defect in the follicle clones
of X-330 mutant. In follicle cells, X-330 homozygous mutant clones have no green fluorescence,
while X-330/GFP heterozygous clones have weak green fluorescence. GFP homozygous clones
have strong green fluorescence. Dlg is used as a lateral membrane marker, which is red.
Armadillo and Bazooka are adherens junctions' markers, which are both red. Actin is a

Results
75
cytoskeleton marker, which is white. The egg chambers we stained are in stage10. In X-330
mutant clones, all the markers' expression is similar with the other clones.

Discussion
76
Chapter4. Discussion
4.1 Different functions of E-cadherin in Drosophila
embryogenesis
In germline clones of shotgun alleles, no egg is discovered or the eggs only produce
small patches of cuticle, suggesting that maternal E-cadherin is essential for
oogenesis and embryogenesis (Tepass et al., 1996). By dominant negative E-
cadherin construct, which uses maternally active driver lines, maternal E-cadherin
is knocked down. It leads to germ layers forming irregular double or triple layers of
rounded cells that lack zonula adherens in blastoderm stage and cell mitosis being
abnormal (Wang et al., 2004). These results indicate that E-cadherin functions in
formation and maintenance of the epithelial cell structure.
In shotgun zygotic mutant, the appearance of defects and morphogenetic movements
has the correlation in time and place. Epithelial integrity is lost where and when the
tissues undergo dramatic morphogenesis, like the neurectoderm, malpighian tubules
and the midgut epithelium. In contrast, the tissues less active are more stable. Using
the genetic manipulation to reduce the morphogenetic activity of different tissues,
shotgun mutant phenotype is substantially reduced. In addition, the malfunction of
these organs could be rescued by overexpression of E-cadherin cDNA under a heat
shock promoter (Uemura et al., 1996). It is proposed that zygotic expression of E-
cadherin is required during cell rearrangement in morphogenetic active epithelia
(Tepass et al., 1996).
In Tepass' model, zygotic E-cadherin is required for forming new cell-cell contacts in
active cells, while maternal E-cadherin is enough to maintain tissue integrity in less
active cells. In our result, knockdown of E-cadherin by RNAi leads to cell
intercalation defect, which gives further evidence for this model.
However, how E-cadherin functions in cell intercalation still remains an open
question. There are three possibilities: First, it functions by affecting adherens
junctions' formation. Second, it affects the intracellular actin-myosin network. Third,
it could stabilize the newly formed cell-cell contacts. The three functions are not
mutually exclusive.

Discussion
77
Our results give clues to the three possibilities. First, protein expression and
localization of Armadillo and Bazooka is normal in X-330 mutant embryos and
follicle cell clones, which indicates adherens junctions' formation is not affected.
Second, medial myosin's recruitment to junction part is inhibited in X-330 mutant. In
addition, part of actin filaments is mislocalized in cytoplasm. These results indicate
that actin-myosin network is affected in X-330 mutant. It is known that planar
polarity of E-cadherin is required to orient actomyosin flows to vertical junctions
(Rauzi et al., 2010). Therefore, it is possible that E-cadherin expression defect
induces actin-myosin recruitment inhibition in the mutant. Third, the extension of
new borders could not be stabilized in X-330 mutant. Instead, they always shrink to
4-fold vertexes or vertical borders. We propose that E-cadherin may function in
stabilizing newly formed borders.
4.2 N-glycosylation of E-cadherin affects adherens junctions
Tunicamycin was used as an N-glycosylation inhibitor to incubate with
teratocarcinoma cells. The result showed that adherens junctions still exist, which
indicates that N-glycans are not the adhesive structures (Helenius and Aebi, 2004;
Shirayoshi et al., 1986). However, N-glycosylation could regulate E-cadherin's
adhesive function. In the yeast Saccharomyces cerevisiae, attenuation of protein N-
glycosylation causes increased cell aggregation effect (Kukuruzinska and Lennon,
1995). GPT (ALG7) is the enzyme which initiates the synthesis of lipid-linked
oligosaccharide precursor in ER. In mouse submandibular glands or hamster
embryos, when GPT's expression is high, E-cadherin is in unstable cell-cell contacts.
When GPT is down-regulated, E-cadherin forms stable adherens junctions
(Fernandes et al., 1999; Menko et al., 2002). In MDCK cells, sparse cells produce E-
cadherin modified with complex N-glycans and form unstable adherens junctions. In
dense cells, E-cadherin is scarcely modified with N-glycan and forms stable
adherens junctions (Liwosz et al., 2006). In CHO cells, removal of N-glycan from
EC4 could increase interaction of E-cadherin-catenin complex with vinculin and the
actin cytoskeleton. This effect was enhanced by deletion of N-glycan of site3 in EC5.
It is proposed that N-glycosylation destabilize adherens junctions by affecting their
molecular organization (Liwosz et al., 2006). Not every potential N-glycan site is
Discussion
78
modified. Frequently, variants exist in numbers of actual N-glycan sites and their
composition. By modification of N-glycosylation, cells' state is regulated. Our result
shows N-glycosylation of E-cadherin is decreased in X-330 mutant, which may
affect cell intercalation behavior. To study the correlation of cell intercalation and N-
glycosylation of E-cadherin, we need to do more work to answer this question.
4.3 E-cadherin accumulation is not the cause of new
contacts formation
It still remains unclear how does the DV cells form a new contact. One possibility is
the enrichment of E-cadherin could cause new contacts formation. Using time-lapse
imaging, we observed the new contacts formed before E-cadherin accumulation. It is
consistent with the report that Bazooka is not detectable until several minutes after
the new border forms in Drosophila embryos (Blankenship et al., 2006). These
results indicate that E-cadherin is not the force that promotes new contacts' formation.
However, when E-cadherin is knocked down in E-cadRNAi or X-330 mutant, the
new formed borders could not stabilize its length and always shrink to 4-fold
vertexes or even go back to vertical borders between AP cells. This result suggests
that E-cadherin may function in stabilizing the length of new extended borders and
inhibiting shrinkage once they form.
As for how does E-cadherin accumulate in new junctions, there are three possible
mechanisms. E-cadherin may come from de novo synthesis or transferred within
membrane or endocytosis recycling. To distinguish the first and the latter two
possibilities, we could use the photoswitchable GFP to mark all the existing E-
cadherin and test if the E-cadherin on new borders is with or without the marker. By
marking the E-cadherin in cytoplasm and following its dynamics, we could tell if the
E-cadherin on the new borders is from recycling or transferring within the membrane.
4.4 Pull and stick model
We try to give a model for new border extension. In the wild type, some force, which
may be provided by actin-myosin network, drives the 4-fold vertexes extending to

Discussion
79
the horizontal borders (Fig.45A). It is not clear whether this force is provided by the
pulling force from the AP cells (Fig.45, red arrow) or the pushing force from the DV
cells (Fig.45, blue arrow). We observed the pulsed behavior of new borders'
formation both in the wild type and X-330 mutant, which indicates that the newly
extended borders have the tendency to shrink. With some stabilizing factor, the wild
type new borders could steadily increase the length. However, new borders in X-330
mutant are lack of the stabilizing factor and could not steadily increase the length. E-
cadherin may provide such stabilizing function by its gradual accumulation in the
new borders (Fig.45A, green bar). With low amount of E-cadherin, the extended
borders could not be stabilized in X-330 mutant and E-cadherin RNAi embryos
(Fig.45B). They keep extending and shrinking movement. The length of them could
not increase steadily. Because another force separates the AP cells apart and E-
cadherin sticks the new neighbor cells together, we call this model "pull and stick
model".
Figure 45. Model of the new border formation. A. In the wild type, certain force along AP axis
(red arrows) or along DV axis (blue arrows) drives the new horizontal border extension. The
extended border has tendency to shrink. With the increase of E-cadherin, the newly formed
border is steadily extended. B. In X-330 mutant and E-cadherin RNAi situation, a kind of force
Discussion
80
could drive the new border extension. However, the length of the new borders could not increase
steadily because of lacking the sticky force of E-cadherin.
4.5 Membrane proteins are affected differently by N-
glycosylation defect
Our results indicate that N-glycan is not equally important for different protein
folding and secretion. Defect of N-glycosylation makes some protein folded
inefficiently and functioning abnormally, while many others proteins are not affected.
It means the importance of N-glycan is different to different proteins. Generally, the
more N-glycan sites a protein has, the more important role the N-glycan plays for the
protein. In our result, E-cadherin and Crumbs carry many N-glycosylation sites
(Fig.46). Their expression is decreased in X-330 mutant. For Neurotactin and
CG8668, their glycosylation sites are less. Their expression and localization are not
obviously affected by X-330 mutant.
Although it is still not clear how N-glycosylaion affect protein expression. Here, we
propose some possibilities: First, OST enzyme may have problem to recognize the
incomplete N-glycans, which could not be transferred from dolichol to nascent
proteins. Second, proteins may not be folded correctly or efficiently without the
complete glycans. Third, proteins may not pass through the ER quality control and
finally be degraded. This is quite possible in X-330 mutant, because western blot
result showed that E-cadherin and Crumbs are both reduced. Forth, modification of
glycans in Golgi apparatus may be affected. Fifth, proteins function abnormally. To
examine these possibilities, more work should be done to give evidences. We could
distinguish if the protein folding process is affected or the protein functions
abnormally by testing protein expression. If the folding processing has problem, the
protein would be degraded and its expression level is reduced, like E-cadherin and
Crumbs in X-330 mutant. Otherwise, the protein activity maybe affected even it
could localize in the normal position.
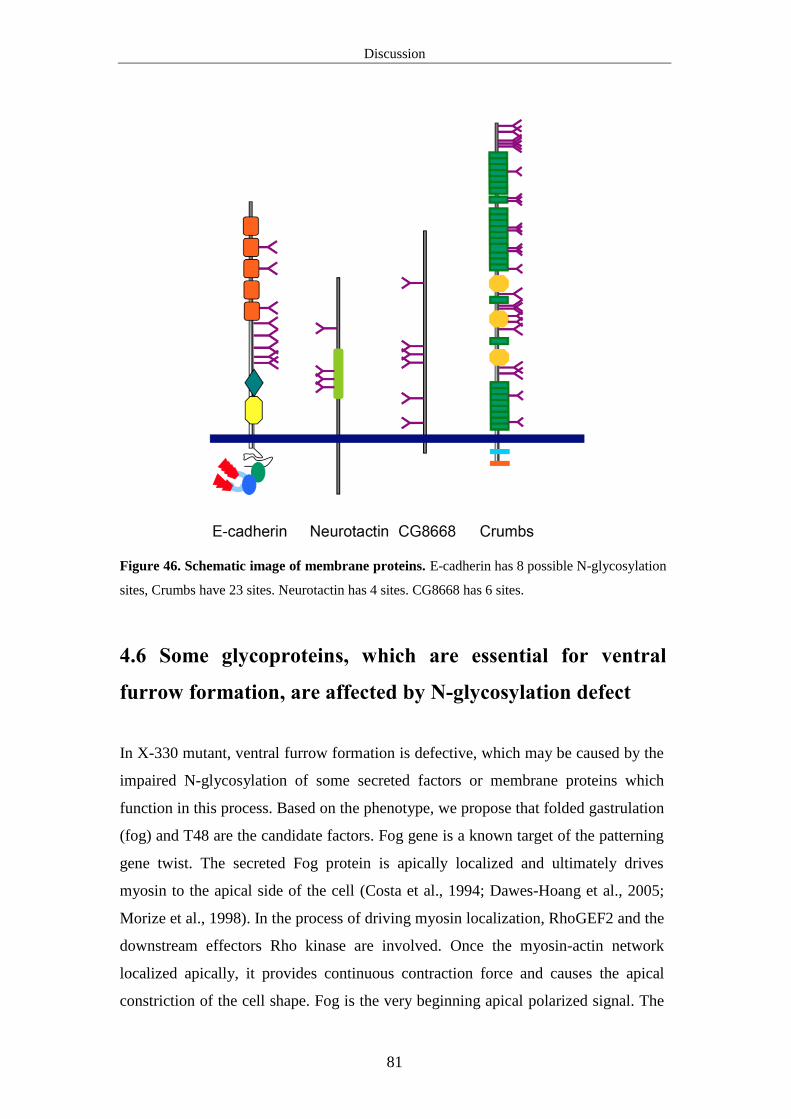
Discussion
81
Figure 46. Schematic image of membrane proteins. E-cadherin has 8 possible N-glycosylation
sites, Crumbs have 23 sites. Neurotactin has 4 sites. CG8668 has 6 sites.
4.6 Some glycoproteins, which are essential for ventral
furrow formation, are affected by N-glycosylation defect
In X-330 mutant, ventral furrow formation is defective, which may be caused by the
impaired N-glycosylation of some secreted factors or membrane proteins which
function in this process. Based on the phenotype, we propose that folded gastrulation
(fog) and T48 are the candidate factors. Fog gene is a known target of the patterning
gene twist. The secreted Fog protein is apically localized and ultimately drives
myosin to the apical side of the cell (Costa et al., 1994; Dawes-Hoang et al., 2005;
Morize et al., 1998). In the process of driving myosin localization, RhoGEF2 and the
downstream effectors Rho kinase are involved. Once the myosin-actin network
localized apically, it provides continuous contraction force and causes the apical
constriction of the cell shape. Fog is the very beginning apical polarized signal. The
Discussion
82
N-glycosylation defect of fog or the unknown fog receptor may lead to the
impairment of ventral furrow formation. Another candidate for X-330 mutant
downstream target is T48, which is a transmembrane protein and a downstream
target of twist. Together with G protein signaling, T48 recruits adherens junctions
and the cytoskeleton regulator RhoGEF2 to the apical constriction sites, which lead
to the apical constriction and cell shape change (Kolsch et al., 2007). As a
transmembrane protein, T48 should be synthesized in ER. The N-glycosylation
defect may affect the normal function of T48.

Appendix
83
Appendix
List of DNA oligos
YZ19: 5’-GCTAACTGGCTACTTCCAAG-3’
YZ24: 5’-ACAGTAGTGAGGATAGACTG-3’
YZ25: 5’-AGCTACTTTAAACTTTATTTCAG-3’
YZ20: 5’-CACAATCGACAATCGCATTC-3’
YZ21: 5’-CATACTGCTCCTGAGCATC-3’
YZ22: 5’-GAAGGAATCCTACTAACAGG-3’
YZ23: 5’-TCCGATCGGCACAATGGAC-3’
YZ26: 5’-TGTAAATGCGTGGCGTACTC-3’
YZ27: 5’-GGGCCATGGGAACGGATTTCGAAGTCCATCG-3’
YZ28: 5’-GGGAGATCTGGTGGCCTTGGACTCGTAATTC-3’
YZ29: 5’-GGGCCATGGGATCTTTCGGACCCTTCTGGC-3’
YZ30: 5’- GGGAGATCTCAGCACCGAGTGCCTGACC-3’
E-cad-T7-F:
TAATACGACTCACTATAGGGAGACCACGAGTCTCTTTGATAATGGCGAG
C
E-cad-T7-R:
TAATACGACTCACTATAGGGAGACCACGGTTTCCATCGTTCTGGTGAATC
-Cat-T7-F:
TAATACGACTCACTATAGGGCACAATGTCAGTTGAAAAAACACTTG
-Cat-T7-R:
TAATACGACTCACTATAGGGGTTGGGATGACTTTCCTTGG

Appendix
84
Plasmid maps
Supplemental figure 1. pAttB plasmid for making the transgenic construct.
Supplemental figure 2. pGEX-60H plasmid for expression of the target protein
!
!

Appendix
85
Complete data

Appendix
86
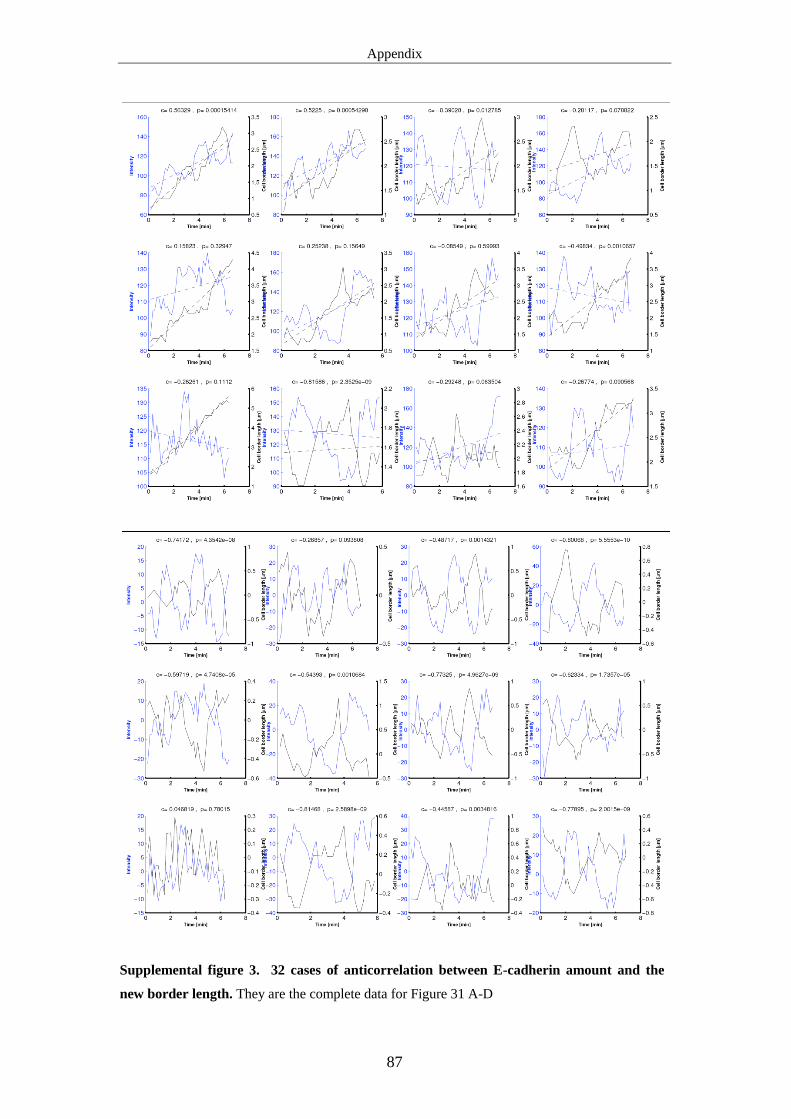
Appendix
87
Supplemental figure 3. 32 cases of anticorrelation between E-cadherin amount and the
new border length. They are the complete data for Figure 31 A-D

Appendix
88
Supplemental figure 4. 4 cases of cell border length change in the wild type T1 process.
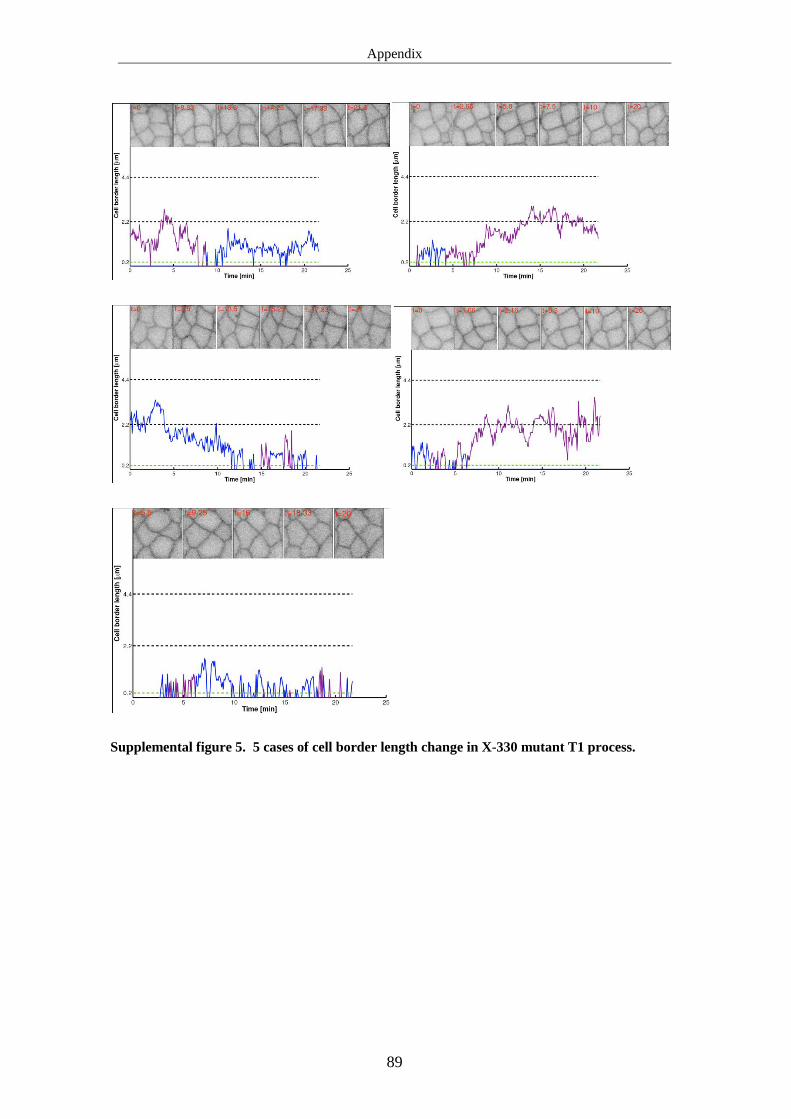
Appendix
89
Supplemental figure 5. 5 cases of cell border length change in X-330 mutant T1 process.
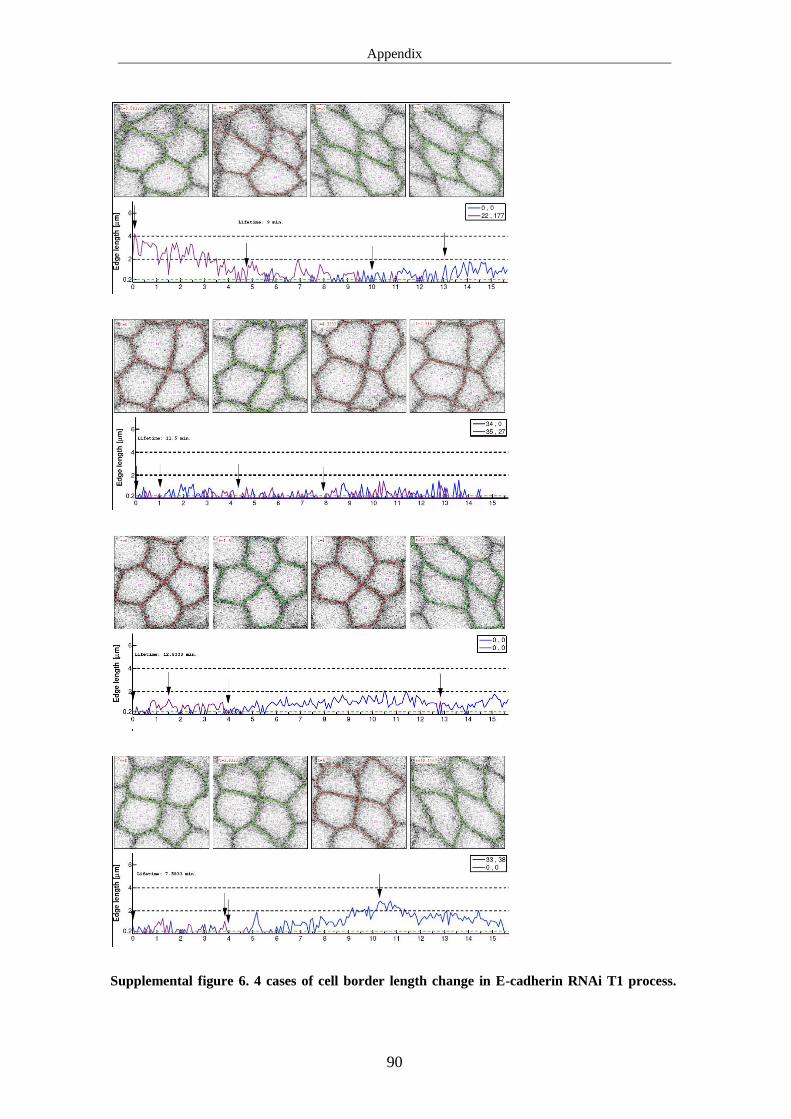
Appendix
90
Supplemental figure 6. 4 cases of cell border length change in E-cadherin RNAi T1 process.

Reference
91
Reference
Atienza-Samols, S. B., Pine, P. R. and Sherman, M. I. (1980). Effects of
tunicamycin upon glycoprotein synthesis and development of early mouse embryos.
Dev Biol 79, 19-32.
Bertet, C., Sulak, L. and Lecuit, T. (2004). Myosin-dependent junction remodelling
controls planar cell intercalation and axis elongation. Nature 429, 667-71.
Bischof, J., Maeda, R. K., Hediger, M., Karch, F. and Basler, K. (2007). An
optimized transgenesis system for Drosophila using germ-line-specific phiC31
integrases. Proc Natl Acad Sci U S A 104, 3312-7.
Blanchard, G. B., Kabla, A. J., Schultz, N. L., Butler, L. C., Sanson, B.,
Gorfinkiel, N., Mahadevan, L. and Adams, R. J. (2009). Tissue tectonics:
morphogenetic strain rates, cell shape change and intercalation. Nat Methods 6, 458-
64.
Blankenship, J. T., Backovic, S. T., Sanny, J. S., Weitz, O. and Zallen, J. A.
(2006). Multicellular rosette formation links planar cell polarity to tissue
morphogenesis. Dev Cell 11, 459-70.
Brand, A. H. and Perrimon, N. (1993). Targeted gene expression as a means of
altering cell fates and generating dominant phenotypes. Development 118, 401-15.
Butler, L. C., Blanchard, G. B., Kabla, A. J., Lawrence, N. J., Welchman, D. P.,
Mahadevan, L., Adams, R. J. and Sanson, B. (2009). Cell shape changes indicate a
role for extrinsic tensile forces in Drosophila germ-band extension. Nat Cell Biol 11,
859-64.
Chou, T. B., Noll, E. and Perrimon, N. (1993). Autosomal P[ovoD1] dominant
female-sterile insertions in Drosophila and their use in generating germ-line chimeras.
Development 119, 1359-69.
Chou, T. B. and Perrimon, N. (1992). Use of a yeast site-specific recombinase to
produce female germline chimeras in Drosophila. Genetics 131, 643-53.
Reference
92
Chou, T. B. and Perrimon, N. (1996). The autosomal FLP-DFS technique for
generating germline mosaics in Drosophila melanogaster. Genetics 144, 1673-9.
Cook, R. K., Deal, M. E., Deal, J. A., Garton, R. D., Brown, C. A., Ward, M. E.,
Andrade, R. S., Spana, E. P., Kaufman, T. C. and Cook, K. R. A new resource for
characterizing X-linked genes in Drosophila melanogaster: systematic coverage and
subdivision of the X chromosome with nested, Y-linked duplications. Genetics 186,
1095-109.
Costa, M., Wilson, E. T. and Wieschaus, E. (1994). A putative cell signal encoded
by the folded gastrulation gene coordinates cell shape changes during Drosophila
gastrulation. Cell 76, 1075-89.
da Silva, S. M. and Vincent, J. P. (2007). Oriented cell divisions in the extending
germ band of Drosophila. Development 134, 3049-54.
Dawes-Hoang, R. E., Parmar, K. M., Christiansen, A. E., Phelps, C. B., Brand, A.
H. and Wieschaus, E. F. (2005). folded gastrulation, cell shape change and the
control of myosin localization. Development 132, 4165-78.
Fernandes, R. P., Cotanche, D. A., Lennon-Hopkins, K., Erkan, F., Menko, A. S.
and Kukuruzinska, M. A. (1999). Differential expression of proliferative,
cytoskeletal, and adhesive proteins during postnatal development of the hamster
submandibular gland. Histochem Cell Biol 111, 153-62.
Fernandez-Gonzalez, R., Simoes Sde, M., Roper, J. C., Eaton, S. and Zallen, J. A.
(2009). Myosin II dynamics are regulated by tension in intercalating cells. Dev Cell
17, 736-43.
Frescas, D., Mavrakis, M., Lorenz, H., Delotto, R. and Lippincott-Schwartz, J.
(2006). The secretory membrane system in the Drosophila syncytial blastoderm
embryo exists as functionally compartmentalized units around individual nuclei. J
Cell Biol 173, 219-30.
Haecker, A., Bergman, M., Neupert, C., Moussian, B., Luschnig, S., Aebi, M.
and Mannervik, M. (2008). Wollknauel is required for embryo patterning and
Reference
93
encodes the Drosophila ALG5 UDP-glucose:dolichyl-phosphate glucosyltransferase.
Development 135, 1745-9.
Haeuptle, M. A. and Hennet, T. (2009). Congenital disorders of glycosylation: an
update on defects affecting the biosynthesis of dolichol-linked oligosaccharides. Hum
Mutat 30, 1628-41.
Hammerschmidt, M. and Wedlich, D. (2008). Regulated adhesion as a driving
force of gastrulation movements. Development 135, 3625-41.
Hardin, J. (1989). Local shifts in position and polarized motility drive cell
rearrangement during sea urchin gastrulation. Dev Biol 136, 430-45.
Helenius, A. and Aebi, M. (2004). Roles of N-linked glycans in the endoplasmic
reticulum. Annu Rev Biochem 73, 1019-49.
Hortsch, M., Patel, N. H., Bieber, A. J., Traquina, Z. R. and Goodman, C. S.
(1990). Drosophila neurotactin, a surface glycoprotein with homology to serine
esterases, is dynamically expressed during embryogenesis. Development 110, 1327-
40.
Ioffe, E. and Stanley, P. (1994). Mice lacking N-acetylglucosaminyltransferase I
activity die at mid-gestation, revealing an essential role for complex or hybrid N-
linked carbohydrates. Proc Natl Acad Sci U S A 91, 728-32.
Irvine, K. D. and Wieschaus, E. (1994). Cell intercalation during Drosophila germ
band extension and its regulation by pair-rule segmentation genes. Development 120,
827-41.
Iwaki, D. D., Johansen, K. A., Singer, J. B. and Lengyel, J. A. (2001). drumstick,
bowl, and lines are required for patterning and cell rearrangement in the Drosophila
embryonic hindgut. Dev Biol 240, 611-26.
Jaeken, J. (2010). Congenital disorders of glycosylation (CDG): it's (nearly) all in it!
J Inherit Metab Dis 34, 853-8.

Reference
94
Keller, R., Davidson, L., Edlund, A., Elul, T., Ezin, M., Shook, D. and Skoglund,
P. (2000). Mechanisms of convergence and extension by cell intercalation. Philos
Trans R Soc Lond B Biol Sci 355, 897-922.
Keller, R. E. (1980). The cellular basis of epiboly: an SEM study of deep-cell
rearrangement during gastrulation in Xenopus laevis. J Embryol Exp Morphol 60,
201-34.
Knust, E. and Bossinger, O. (2002). Composition and formation of intercellular
junctions in epithelial cells. Science 298, 1955-9.
Kolsch, V., Seher, T., Fernandez-Ballester, G. J., Serrano, L. and Leptin, M.
(2007). Control of Drosophila gastrulation by apical localization of adherens
junctions and RhoGEF2. Science 315, 384-6.
Kukuruzinska, M. A. and Lennon, K. (1995). Diminished activity of the first N-
glycosylation enzyme, dolichol-P-dependent N-acetylglucosamine-1-P transferase
(GPT), gives rise to mutant phenotypes in yeast. Biochim Biophys Acta 1247, 51-9.
Lecuit, T. and Wieschaus, E. (2002). Junctions as organizing centers in epithelial
cells? A fly perspective. Traffic 3, 92-7.
Leptin, M. (1995). Drosophila gastrulation: from pattern formation to morphogenesis.
Annu Rev Cell Dev Biol 11, 189-212.
Leptin, M. and Grunewald, B. (1990). Cell shape changes during gastrulation in
Drosophila. Development 110, 73-84.
Liwosz, A., Lei, T. and Kukuruzinska, M. A. (2006). N-glycosylation affects the
molecular organization and stability of E-cadherin junctions. J Biol Chem 281,
23138-49.
Lohs-Schardin, M., Cremer, C. and Nusslein-Volhard, C. (1979). A fate map for
the larval epidermis of Drosophila melanogaster: localized cuticle defects following
irradiation of the blastoderm with an ultraviolet laser microbeam. Dev Biol 73, 239-
55.

Reference
95
Luschnig, S., Moussian, B., Krauss, J., Desjeux, I., Perkovic, J. and Nusslein-
Volhard, C. (2004). An F1 genetic screen for maternal-effect mutations affecting
embryonic pattern formation in Drosophila melanogaster. Genetics 167, 325-42.
Maley, F., Trimble, R. B., Tarentino, A. L. and Plummer, T. H., Jr. (1989).
Characterization of glycoproteins and their associated oligosaccharides through the
use of endoglycosidases. Anal Biochem 180, 195-204.
Martin, A. C., Kaschube, M. and Wieschaus, E. F. (2009). Pulsed contractions of
an actin-myosin network drive apical constriction. Nature 457, 495-9.
Menko, A. S., Zhang, L., Schiano, F., Kreidberg, J. A. and Kukuruzinska, M. A.
(2002). Regulation of cadherin junctions during mouse submandibular gland
development. Dev Dyn 224, 321-33.
Morize, P., Christiansen, A. E., Costa, M., Parks, S. and Wieschaus, E. (1998).
Hyperactivation of the folded gastrulation pathway induces specific cell shape
changes. Development 125, 589-97.
Munro, E. M. and Odell, G. M. (2002). Polarized basolateral cell motility underlies
invagination and convergent extension of the ascidian notochord. Development 129,
13-24.
Oda, H. and Tsukita, S. (2001). Real-time imaging of cell-cell adherens junctions
reveals that Drosophila mesoderm invagination begins with two phases of apical
constriction of cells. J Cell Sci 114, 493-501.
Oda, H., Uemura, T., Harada, Y., Iwai, Y. and Takeichi, M. (1994). A Drosophila
homolog of cadherin associated with armadillo and essential for embryonic cell-cell
adhesion. Dev Biol 165, 716-26.
Oda, H., Uemura, T., Shiomi, K., Nagafuchi, A., Tsukita, S. and Takeichi, M.
(1993). Identification of a Drosophila homologue of alpha-catenin and its association
with the armadillo protein. J Cell Biol 121, 1133-40.

Reference
96
Oglesby, L. L., Jain, S. and Ohman, D. E. (2008). Membrane topology and roles of
Pseudomonas aeruginosa Alg8 and Alg44 in alginate polymerization. Microbiology
154, 1605-15.
Peifer, M. (1993). The product of the Drosophila segment polarity gene armadillo is
part of a multi-protein complex resembling the vertebrate adherens junction. J Cell
Sci 105 ( Pt 4), 993-1000.
Pinho, S. S., Seruca, R., Gartner, F., Yamaguchi, Y., Gu, J., Taniguchi, N. and
Reis, C. A. (2011). Modulation of E-cadherin function and dysfunction by N-
glycosylation. Cell Mol Life Sci 68, 1011-20.
Plummer, T. H., Jr. and Tarentino, A. L. (1991). Purification of the
oligosaccharide-cleaving enzymes of Flavobacterium meningosepticum.
Glycobiology 1, 257-63.
Rauzi, M., Lenne, P. F. and Lecuit, T. (2010). Planar polarized actomyosin
contractile flows control epithelial junction remodelling. Nature 468, 1110-4.
Rauzi, M., Verant, P., Lecuit, T. and Lenne, P. F. (2008). Nature and anisotropy of
cortical forces orienting Drosophila tissue morphogenesis. Nat Cell Biol 10, 1401-10.
Ribeiro, C., Neumann, M. and Affolter, M. (2004). Genetic control of cell
intercalation during tracheal morphogenesis in Drosophila. Curr Biol 14, 2197-207.
Riggleman, B., Schedl, P. and Wieschaus, E. (1990). Spatial expression of the
Drosophila segment polarity gene armadillo is posttranscriptionally regulated by
wingless. Cell 63, 549-60.
Roth, S., Hiromi, Y., Godt, D. and Nusslein-Volhard, C. (1991). cactus, a maternal
gene required for proper formation of the dorsoventral morphogen gradient in
Drosophila embryos. Development 112, 371-88.
Ryder, E., Ashburner, M., Bautista-Llacer, R., Drummond, J., Webster, J.,
Johnson, G., Morley, T., Chan, Y. S., Blows, F., Coulson, D. et al. (2007). The
DrosDel deletion collection: a Drosophila genomewide chromosomal deficiency
resource. Genetics 177, 615-29.
Reference
97
Ryder, E., Blows, F., Ashburner, M., Bautista-Llacer, R., Coulson, D.,
Drummond, J., Webster, J., Gubb, D., Gunton, N., Johnson, G. et al. (2004). The
DrosDel collection: a set of P-element insertions for generating custom chromosomal
aberrations in Drosophila melanogaster. Genetics 167, 797-813.
Saxena, I. M., Brown, R. M., Jr., Fevre, M., Geremia, R. A. and Henrissat, B.
(1995). Multidomain architecture of beta-glycosyl transferases: implications for
mechanism of action. J Bacteriol 177, 1419-24.
Schupbach, T. (1987). Germ line and soma cooperate during oogenesis to establish
the dorsoventral pattern of egg shell and embryo in Drosophila melanogaster. Cell 49,
699-707.
Shaik, K. S., Pabst, M., Schwarz, H., Altmann, F. and Moussian, B. (2011). The
Alg5 ortholog Wollknauel is essential for correct epidermal differentiation during
Drosophila late embryogenesis. Glycobiology 21, 743-56.
Shirayoshi, Y., Nose, A., Iwasaki, K. and Takeichi, M. (1986). N-linked
oligosaccharides are not involved in the function of a cell-cell binding glycoprotein
E-cadherin. Cell Struct Funct 11, 245-52.
Simpson, P. (1983). Maternal-Zygotic Gene Interactions during Formation of the
Dorsoventral Pattern in Drosophila Embryos. Genetics 105, 615-32.
Solnica-Krezel, L. (2005). Conserved patterns of cell movements during vertebrate
gastrulation. Curr Biol 15, R213-28.
Solnica-Krezel, L. (2006). Gastrulation in zebrafish -- all just about adhesion? Curr
Opin Genet Dev 16, 433-41.
Stathopoulos, A. and Levine, M. (2002). Dorsal gradient networks in the
Drosophila embryo. Dev Biol 246, 57-67.
Tepass, U., Gruszynski-DeFeo, E., Haag, T. A., Omatyar, L., Torok, T. and
Hartenstein, V. (1996). shotgun encodes Drosophila E-cadherin and is preferentially
required during cell rearrangement in the neurectoderm and other morphogenetically
active epithelia. Genes Dev 10, 672-85.

Reference
98
Tepass, U., Tanentzapf, G., Ward, R. and Fehon, R. (2001). Epithelial cell polarity
and cell junctions in Drosophila. Annu Rev Genet 35, 747-84.
Tepass, U., Theres, C. and Knust, E. (1990). crumbs encodes an EGF-like protein
expressed on apical membranes of Drosophila epithelial cells and required for
organization of epithelia. Cell 61, 787-99.
Theodore, M. and Morava, E. (2011). Congenital disorders of glycosylation: sweet
news. Curr Opin Pediatr 23, 581-7.
Thisse, B., Stoetzel, C., Gorostiza-Thisse, C. and Perrin-Schmitt, F. (1988).
Sequence of the twist gene and nuclear localization of its protein in endomesodermal
cells of early Drosophila embryos. Embo J 7, 2175-83.
Uemura, T., Oda, H., Kraut, R., Hayashi, S., Kotaoka, Y. and Takeichi, M.
(1996). Zygotic Drosophila E-cadherin expression is required for processes of
dynamic epithelial cell rearrangement in the Drosophila embryo. Genes Dev 10, 659-
71.
Vagin, O., Tokhtaeva, E., Yakubov, I., Shevchenko, E. and Sachs, G. (2008).
Inverse correlation between the extent of N-glycan branching and intercellular
adhesion in epithelia. Contribution of the Na,K-ATPase beta1 subunit. J Biol Chem
283, 2192-202.
Wallingford, J. B., Fraser, S. E. and Harland, R. M. (2002). Convergent extension:
the molecular control of polarized cell movement during embryonic development.
Dev Cell 2, 695-706.
Wang, F., Dumstrei, K., Haag, T. and Hartenstein, V. (2004). The role of DE-
cadherin during cellularization, germ layer formation and early neurogenesis in the
Drosophila embryo. Dev Biol 270, 350-63.
Wang, J., Hamblet, N. S., Mark, S., Dickinson, M. E., Brinkman, B. C., Segil, N.,
Fraser, S. E., Chen, P., Wallingford, J. B. and Wynshaw-Boris, A. (2006).
Dishevelled genes mediate a conserved mammalian PCP pathway to regulate
convergent extension during neurulation. Development 133, 1767-78.

Reference
99
Warga, R. M. and Kimmel, C. B. (1990). Cell movements during epiboly and
gastrulation in zebrafish. Development 108, 569-80.
Zallen, J. A. and Blankenship, J. T. (2008). Multicellular dynamics during
epithelial elongation. Semin Cell Dev Biol 19, 263-70.
Zallen, J. A. and Wieschaus, E. (2004). Patterned gene expression directs bipolar
planar polarity in Drosophila. Dev Cell 6, 343-55.
Zhao, H., Liang, Y., Xu, Z., Wang, L., Zhou, F., Li, Z., Jin, J., Yang, Y., Fang, Z.,
Hu, Y. et al. (2008a). N-glycosylation affects the adhesive function of E-Cadherin
through modifying the composition of adherens junctions (AJs) in human breast
carcinoma cell line MDA-MB-435. J Cell Biochem 104, 162-75.
Zhao, H., Sun, L., Wang, L., Xu, Z., Zhou, F., Su, J., Jin, J., Yang, Y., Hu, Y.
and Zha, X. (2008b). N-glycosylation at Asn residues 554 and 566 of E-cadherin
affects cell cycle progression through extracellular signal-regulated protein kinase
signaling pathway. Acta Biochim Biophys Sin (Shanghai) 40, 140-8.
Zhou, F., Su, J., Fu, L., Yang, Y., Zhang, L., Wang, L., Zhao, H., Zhang, D., Li,
Z. and Zha, X. (2008). Unglycosylation at Asn-633 made extracellular domain of E-
cadherin folded incorrectly and arrested in endoplasmic reticulum, then sequentially
degraded by ERAD. Glycoconj J 25, 727-40.

Curriculum Vitae
100
Curriculum Vitae
Personal data
Name: Yujun Zhang
Date of Birth: April 12, 1982
Place of Birth: Shanxi, China
Address: Kellnerweg12, App115, 37077 Göttingen, Germany
Email: [email protected]
Education
From 02/ 2009 PhD student at the Department of Developmenta
Biochemistry, University of Göttingen
PhD thesis title: “E-cadherin Functions in Extension of New
Cell Borders during Cell Intercalation in Drosophila”
Supervisor: Prof.Dr.Joerg Grosshans; International PhD
program; Genes and Development (GGNB)
09/ 2005 – 12/ 2008 Master student at the Max-Planck Junior Scientist Group on
Developmental Biology, Kunming institute of Zoology,
Chinese Academy of Sciences
Master degree thesis title: “Expression and Functional
Analysis of Dkk and Kremen Genes in Amphioxus”
09/ 2001 – 07/2005 Studies of biology, Shanxi University
Specialization: Biology Science
Graduation: Bachelor in biology
09/1998 – 07/2001 High school, No.15 Middle School of Taiyuan, Shanxi, China

Curriculum Vitae
101
Publications
Zhang Y, Mao B, (2010), Embryonic expression and evolutionary analysis of the
amphioxus Dickkopf and Kremen family genes. J. Genet. Genomics, 37:637-645
Zhang Y, Mao B (2009), Developmental expression of an amphioxus
(Branchiostoma Belcheri) gene encoding a GATA transcription factor, Zool Res. 30:
137-143。
Wei Y, Zhang Y, Chen Y, Mao B (2009), Expansion of the actin gene family in
amphioxus, Zool Res., 30:473-479。
Acknowledgements
102
Acknowledgements
First, I’m grateful to my supervisor Prof. Dr. Joerg Grosshans for giving me such
interesting topic, continuous support and inspiring supervisions. From him, I have
learned not only the experimental considerations, but also the sincere attitude to do
work. He was kind and patient to help me with all my questions and ideas. His smile
and passion for science deeply impressed me. Many thanks for his support and
guidance during these years.
I would like to thank Prof. Dr. Andreas Wodarz and Dr. Halyna Shcherbata for their
long-term concerns and helpful suggestions as members of my thesis committee.
I would also like to thank my collaboration partners Prof. Dr. Fred Wolf, Dr. Lars
Reichl and Lutz Künneke.Thank Deqing Kong for helping me to do part of western
blot work (Fig.26, 28, 29B) as a master student.
I want thank Dr. Stefan Luschnig, Prof. Dr. Yuh-Nung Jan and Dr. Tadashi Uemura
for the flies and the DCAD1 antibody. I thank the Bloomington Drosophila stock
center at the University of Indiana for sending numerous fly stocks. I thank GGNB
for providing me the opportunity to learn more knowledge in different areas and
various opportunities to communicate with different people.
I want to thank all the present and previous lab members and the collegues in our
department with whom I have lots of happy memories. Dr. Takuma Kanesaki taught
me a lot about microscopy and gave me suggestions about my project. Dr. Shuling
Yan, Dr. Hung-Wei Sung and Dr. Christian Wenzl gave me good advices and helped
me to slove a lot of problems in my study and personal life. I also want to thank our
technician Kristina Hänecke and Johannes Sattmann for arranging the experimental
facilities well for us. I’m very lucky to be friend with Zhiyi Lv, Sreemukta Acharya,
Dr. Maria Polychronidou, Dr. Mahesh Gummalla, Roman Petrovsky, Franziska
Winkler, Saskia Spangenberg and Marija Kojic.
I want to thank my mentor of master study Dr. Bingyu Mao. Because of his guidance,

Acknowledgements
103
I was leaded into the magic science world.
I have to express my great gratitude to my parents for their long-term unconditional
support for my study and my life. Special thanks to my husband Xin Zou for his
support and love.