contrasting nitrogen uptake by diatom and phaeocystis-dominated phytoplankton assemblages in the...
TRANSCRIPT

www.elsevier.com/locate/jembe
Journal of Experimental Marine Biology and Ecology
292 (2003) 19–41
Contrasting nitrogen uptake by diatom and
Phaeocystis-dominated phytoplankton
assemblages in the North Sea
Clavery Tungarazaa,*, Veronique Rousseaub, Natacha Briona,Christiane Lancelotb, John Gichukia, Willy Baeyensa, Leo Goeyensa
aVrije Universiteit Brussel, Laboratorium Analytische Chemie, Pleinlaan 2, 1050 Brussel, BelgiumbUniversite Libre de Bruxelles, Groupe de Microbiologie des Milieux Aquatiques, C.P. 221,
1050 Bruxelles, Belgium
Received 29 May 2002; received in revised form 2 March 2003; accepted 11 March 2003
Abstract
This paper documents ambient concentrations of nutrients in the Belgian coastal waters of the
North Sea during the spring of 1996 and 1997. The paper elaborates the differences of uptake rates of
oxidised nitrogen (NO3�) and reduced nitrogen (NH4 and urea) by Phaeocystis and diatoms. The
nitrogen concentrations were dominated by NO3� with a maximum concentration of 30 AM (January
1997) and 40 AM (March 1996). In 1996, Phaeocystis dominated the spring biomass with a
maximum of 521 Ag C l� 1, while maximum diatom biomass was 174 Ag C l� 1. In 1997, the
maximum Phaeocystis spring biomass was 1600 Ag C l� 1 and diatom maximum biomass was below
100 Ag C l� 1. A maximum bacteria biomass of about 55 Ag C l� 1 was observed in mid-May 1996.
The maximum nitrogen uptake rates were recorded during spring and were dominated by NO3�
(0.005 h� 1 in 1996 and 0.032 h� 1 in 1997). Maximum specific NH4 uptake rates were between
0.005 h� 1 in May 1996 and 0.006 h� 1 in April 1997. The NO3� uptake rates displayed exponential
decrease versus increasing ambient reduced nitrogen concentrations (ammonium and urea), whereas
the reduced nitrogen uptake increased but never compensated the decreased nitrate uptake. The NH4
uptake kinetics of diatoms displayed lower vmax compared to Phaeocystis. Consequently,
Phaeocystis showed ability to increase their NH4 uptake capacity when more NH4 became available
while diatoms failed to do so, after ammonium had exceeded their saturation concentration (>1 AM).
Although reduced nitrogen has a negative effect on the uptake of NO3�, Phaeocystis have more
0022-0981/03/$ - see front matter D 2003 Elsevier Science B.V. All rights reserved.
doi:10.1016/S0022-0981(03)00145-X
* Corresponding author. Faculty of Science, Sokoine University of Agriculture (SMC), P.O. Box 3038,
Morogoro, Tanzania. Fax: +255-23-2603404.
E-mail address: [email protected] (C. Tungaraza).

C. Tungaraza et al. / J. Exp. Mar. Biol. Ecol. 292 (2003) 19–4120
advantage than diatoms on the uptake of ammonium. This might be contributing to the biomass
domination shown by Phaeocystis over extended periods in spring.
D 2003 Elsevier Science B.V. All rights reserved.
Keywords: Ammonium uptake rates; Diatoms; Inhibition effects; Nitrate uptake rates; Phaeocystis
1. Introduction
The Southern Bight of the North Sea is a prominent example of marine coastal systems
submitted to discharges of domestic, industrial and agricultural wastewater, which cause a
major concern for the sustainable management of the environmental quality. Rivers as well
as the English Channel have a significant contribution to the nutrient load of this area
(North Sea Task Force, 1993). The pollution problems in this area include, among others,
excess nutrient input. This has resulted to subsequent high primary production (Baeyens et
al., 1984; Hesse, 1988), and increasing frequency of phytoplankton blooms (Cadee, 1986),
dominated by flagellates (Owens et al., 1990). In general, accelerated primary production
due to over enrichment of nutrients has occasionally led to oxygen depletion problem in
some areas, as was observed in the German Bight (Gerlach, 1984).
In the Southern Bight of the North Sea, the undesirable developments of Phaeocystis is
known to have been generated by the perturbed nutrient patterns, which have changed the
relative availability of Si in relation to N (Lancelot et al., 1987; Billen et al., 1991;
Lancelot and Rousseau, 1994) resulting into the decrease of the food quality for the marine
herbivores (Hansen and Van Boekel, 1991). In addition, two to threefold increase in
phytoplankton biomass, following upon excess input of nitrogen in the southeastern North
Sea were observed by Bauerfeind et al. (1990).
The Belgian coast is greatly under the influence of the Scheldt river. In addition to
considerable riverine supply, an elaborated monitoring program in the Belgian coastal area
revealed predominance of DIN advection through the English Channel. Seasonal concen-
tration fluctuations were largely related to variable autotrophic removal of nutrients and to
significant pelagic and benthic remineralization (Van Bennekom et al., 1975; Baeyens et
al., 1984). In spring and summer, the Belgian coastal waters are generally characterized by
two distinct peaks of diatom abundance, which are separated by an intensive Phaeocystis
development (Rousseau et al., 1996).
The trend of major nutrients (nitrate and silicate) in the Belgian coast and their
corresponding uptake regime are almost completely governed by the two major phyto-
plankton communities, the diatoms and Phaeocystis, which bloom during spring. Appa-
rently, the Phaeocystis biomass dominates the season through an extended bloom period.
However, there is a remarkable interannual variability in peak intensities and timing.
Higher phytoplankton biomass in Belgium coastal water at the end of April was also
reported by Joint and Pomroy (1993), which was associated with an extensive bloom of
the Phaeocystis sp.
The parameters governing the diatoms–Phaeocystis succession and the possible
reason for the dominance of Phaeocystis blooms are insufficiently understood. Reid
et al. (1990) explained an early appearance of diatoms to be due to the presence of

C. Tungaraza et al. / J. Exp. Mar. Biol. Ecol. 292 (2003) 19–41 21
Si and when depleted, Phaeocystis starts blooming. This is not always observed and
early appearance of Phaeocystis has been reported while Si is still available (Bakker
et al., 1990; Veldhuis et al., 1986). A work by Cadee and Hegeman (1986) excluded
water temperature as a triggering factor of Phaeocystis bloom in spring. Peperzak et
al. (1998) investigated the relationship of Si depletion and diatoms-Phaeocystis
spring bloom succession by testing two theories related to spring bloom. They
followed light threshold at which Phaeocystis starts blooming under nitrogen and
phosphorus replete condition. Their results did not support the Si depletion theory,
but a light threshold of 100 W h m� 2 day� 1 was found to be a triggering factor
for Phaeocystis bloom.
The study area was on the Belgian coastal zone in the Southern Bight of the North Sea.
This area is characterised by strong along shore tidal currents, resulting in well mixed
water masses (Creutzberg and Postma, 1979). The area is under the influence of the
Scheldt river (Van Bennekom and Wetsteijn, 1990) and has a bathymetric depth of about
17 m. The water discharge of river Scheldt is estimated to be at an average of 129 m3 s� 1
and maximum discharge can be as high as 753 m3 s� 1 (Lenhart et al., 1996).
Average total nutrient input supplied by river Scheldt to the Belgian coast was compiled
by Lenhart et al. (1996) for the period between 1977 and 1993. Between 1990 and 1993,
the maximum annual total nitrogen load was reported to be 34 kt (in 1993) and the
maximum load of NO3� was 20 kt (in 1992), whereas NH4 was 5 kt in 1991. The
phosphate annual load from 1990 to 1993 remained at an average of 1 kt, although in the
1980s about 2 kt were observed to be the average input. Silicate maximum contribution of
about 14 kt was observed in 1992.
Although the enhancement of nutrients is a key for the appearance of eutrophication, it
cannot be correctly understood neither can it be remedied without a sound understanding
of the processes behind it. In this study, the emphasis is on the seasonal patterns in diatoms
and Phaeocystis biomass in relation to their uptake rates of the major nitrogenous
nutrients, viz. NO3�, NH4 and CO(NH2)2.
2. Material and methods
Sampling was done at station 330 (51j26.05VN, 2j48.50VE; Fig. 1). Surface water
samples were collected between late winter and early summer (i.e., January to June) in
1996 and 1997. Measurements of uptake rates were performed during spring (March to
May), a period of high biological activities. The samples were collected from surface water
by using a plastic bucket aboard RV Belgica, then maintained at ambient water temperature
and transported to the laboratory for analyses. This technique warrants minimal disruption
of fragile Phaeocystis colonies.
2.1. Nutrient measurements
Samples for determination of Si, PO43�, NO3
� and NO2� concentrations were filtered
through Whatman glassfibre filters (GF/F), preserved in plastic bottles and frozen
immediately until analyses. Silicates samples were analysed by the silico-molybdic

Fig. 1. Reference sampling area, station 330. Rivers and their catchment area (broken line). Arrows indicate
directions of localised water currents.
C. Tungaraza et al. / J. Exp. Mar. Biol. Ecol. 292 (2003) 19–4122
complex formation method (detection limit 0.1 AM) according to Koroleff (1983b).
Phosphate concentrations were analysed by the phospho-molybdic complex formation
method (detection limit 0.08 AM) described by Koroleff (1983a). Nitrate and NO2�
concentrations were determined by an automated diazotation method (detection limit
0.1 AM; D’Elia, 1983; Elskens and Elskens, 1989). Ammonium and urea samples
were kept in glass bottles and fixed by immediate addition of the reagents. The
concentrations of ammonium were determined by the indophenol-blue method (detec-
tion limit 0.03 AM) according to Koroleff (1969) and urea concentrations were
determined by an adapted diacetylmonoxime method (detection limit 0.1 AM; Goeyens
et al., 1998). All sample concentrations were measured in duplicate. Reagents used in
the analyses and standards preparation were analytical grade. Solutions were prepared
in deionised water from a Millipore Milli-Q ion exchange unit.

2.2. Chlorophyll a and phytoplankton enumeration
The quantification of chlorophyll a was performed by the classical spectrophotometric
method of Lorenzen (1967). Seawater samples were filtered through Whatman glassfibre
filters (GF/F; 47 mm diameter) under low suction. Filters were immediately wrapped in a
clean aluminium foil and stored in a deep freezer for further laboratory analysis. The
filtered volumes of seawater were between 50 and 1000 ml, depending on the quantity of
particulate matter (PM) in the sample.
The extractions of chlorophyll a from the filters were done in 90% acetone at f 5 jCand for a minimum of 1 h. Samples were then centrifuged for 10 min at 300 rpm followed
by immediate recording of absorbance and determination of chlorophyll a concentrations,
as described by Strickland and Parsons (1972).
Phytoplankton samples for species composition analyses were preserved in a lugol-
glutaraldehyde solution (1%). The abundances of diatoms and Phaeocystis were deter-
mined by an inverted microscope (Leitz Fluovert) according to the Utermohl method
(Hasle, 1978). Counting was done on 10–100 ml subsamples after 12 h sedimentation.
Diatoms were identified and counted at � 100 or � 200 magnification; Phaeocystis cells
and colonies were enumerated according to the method described by Rousseau et al.
(1990). The carbon biomasses of both diatoms and Phaeocystis were calculated from
microscopic counts and biovolumes. The carbon biomass of Phaeocystis colonies was
defined by the equations recommended by Rousseau et al. (1990); for diatoms, we used a
conversion factor of 0.11 pg C Am� 3 of plasma volume (Edler, 1979).
2.3. Bacteria biomass
Bacteria abundance and biomass enumerations were only performed during the 1996
spring season. Samples were preserved in formalin (2% final concentration) and stored at 4
jC. The abundance and biomass of free living bacteria was determined by epifluorescence
microscopy (Leitz, Laborlux D). Before enumeration 1–5 ml of water sample were stained
with 4,6-diamidino-2-phenylindole (DAPI) to make the final concentration of 0.1 Ag l� 1
for 15 min (Porter and Feig, 1980). Stained bacteria were then collected by filtration on 0.2
Am pore-size black polycarbonate filters (Nuclepore), which were mounted on micro-
scopic slides and stored at � 20 jC until examination. Bacteria were enumerated on a
minimum of 20 different fields at � 1000 magnification. Their cell volume was calculated
from the measurement of the shortest and longest axes, considering rods and cocci as
cylinders and spheres, respectively. Between 300 and 600, bacteria were measured for
each sample and estimation of carbon biomass was done by a biovolume-dependent
carbon conversion factor of Simon and Azam (1989).
2.4. POC/PON analysis
The analyses of particulate organic nitrogen (PON) and carbon (POC) were
performed on particulate matter collected by filtration on precombusted (8 h at 450
jC) Whatmank glassfibre filters (GF/F; 47 mm diameter). PON and POC concen-
trations were analysed simultaneously by using a Carlo Erba NA 1500 CN Analyser.
C. Tungaraza et al. / J. Exp. Mar. Biol. Ecol. 292 (2003) 19–41 23

C. Tungaraza et al. / J. Exp. Mar. Biol. Ecol. 292 (2003) 19–4124
The analysis combines conversion of PON and POC into N2 and CO2, separation on a
chromatographic solid phase column and detection by thermal conductivity (Pella,
1990). Concentrations of PON and POC were obtained by standardization with
acetanilide.
2.5. Nitrogen uptake experiments
The uptake rates of NO3�, NH4 and urea by phytoplankton were measured using the
15N tracer technique introduced by Dugdale and Goering (1967). Polycarbonate
incubation bottles (2 l) were filled with seawater and incubation experiments were
launched by the addition of labelled nutrients, i.e., NO3� (99.5% 15N), NH4 (99.8%
15N)
and urea (99% 15N). The tracer additions did not exceed 10% of the ambient
concentration. The samples were incubated at constant irradiance (340 A E m� 2 s� 1,
12:12-h light/dark cycle) and at their ambient sea water temperatures. At the end of each
experiment, the concentrations of each nutrient were measured for detection of possible
regeneration. PM, collected on pre-combusted Whatman glassfibre filters (GF/F) after
incubation, was converted to dinitrogen by a modified Duma’s method (Fiedler and
Proksch, 1975) and its 15N abundance was measured by emission spectrometry using
Jasco NIA-1 or N-151 15N Analysers. Calibration was done with certified standards
(Goeyens et al., 1985). The following uptake parameters were calculated: specific and
absolute uptake rates (Dugdale and Goering, 1967; Dugdale and Wilkerson, 1986).
Values for specific uptake rates were expressed as the amount of nitrogen taken up by
the phytoplankton per unit of particulate nitrogen, implying that the uptake rates
normalized to phytoplankton biomass (PON) and f-ratios (the ratio of NO3� uptake to
total nitrogen uptake; Eppley and Peterson, 1979).
3. Results
3.1. Seasonal changes of nutrient concentrations
The seasonal distributions of nutrient concentrations are presented in Fig. 2a–f.
Phosphate concentrations ranged from 0.1 to 3.4 AM and from 0.3 to 1.7 AM in 1996 and
1997, respectively. The concentration levels in both years displayed poor seasonal patterns
(Fig. 2a) with the highest concentration in mid-May 1996 and at the end of March in 1997.
The concentrations of Si showed a clear seasonal changes with high concentrations in
winter (with the maximum of f 30 AM at the end of February 1996 and in January 1997)
and early spring, and much lower concentrations were measured at the end of spring and
during summer (Fig. 2b). Minimum concentrations were f 3 AM in 1996, whereas in
1997 the concentrations were close to the detection limit (f 0.2 AM).
The seasonal variation of NO3� concentrations correlated that of Si. Following winter
replenishment, high concentrations occurred during late winter and early spring (f 40 AMin March 1996 and f 30 AM in January 1997), whereas late spring and summer were
characterised by low values (f 6 AM) in late April 1996 and below detection limit (f 0.1
AM) in late April 1997 (Fig. 2c).

a. b.
d.c.
e. f.
Fig. 2. Temporal nutrient concentrations during 1996 (open circles) and 1997 (closed circles) sampling periods.
C. Tungaraza et al. / J. Exp. Mar. Biol. Ecol. 292 (2003) 19–41 25
Ammonium concentrations and timing were slightly different in these 2 years (Fig. 2d).
From late winter of 1996, there was a slow increase in concentration, reaching amaximum of
f 8 AM in early spring (in March). From the maximum, the concentration decreased to the
minimum of 0.2 AM before increasing again to f 6 AM in late May. Sudden decrease was
observed at the end of May. In 1997, there were higher concentrations in mid winter and by
the beginning of spring, in early March, the concentration had decreased to f 1 AM. The

C. Tungaraza et al. / J. Exp. Mar. Biol. Ecol. 292 (2003) 19–4126
lowest concentration of 0.2 AM was measured in mid-April. In the similar way as in 1996,
from the minimum, the concentration increased to the maximum of 10 AM at the end of
May 1997.
Urea concentrations (Fig. 2e) remained < 1 AM throughout the sampling seasons of
1996. Between February and April 1996, urea concentrations varied from 0.3 to 0.8 AMthen decreased tof 0.3 AM in early May. This concentration was maintained until the end
of June. In 1997, the concentrations varied from 0.9 AM in March to the minimum of
f 0.2 AM in April, before increasing to the highest level of the season, 6 AM in May. This
highest concentration was remarkably exceptional and coincided with a similar increase
observed in the NH4 concentration.
The variations in NO2� concentrations were identical during both years (Fig. 2f). The
maximum concentration was 0.5 AM at the end of March 1996, whereas it was 0.8 AM in
the middle of March 1997. There were persistent fluctuations of concentrations throughout
the sampling periods with a decreasing trend from early spring to early summer. Both
years had elevated concentrations in summer.
3.2. Seasonal changes in phytoplankton biomass
In 1996, chlorophyll a concentrations (Fig. 3) remained less than 2 Ag l� 1 from
February to mid-March and increased to a maximum value of 18 Ag l� 1 between 25 April
and 5 May. In late spring, the chlorophyll a concentrations decreased and remained
constantly low during second half of May and June. In 1997, a threefold denser bloom
developed from early February to late April, with a maximum chlorophyll a concentration
of 52 mg l� 1.
The spring bloom was initiated by diatoms but dominated by the Phaeocystis colonies
in both years (Fig. 4). Diatom appeared in different community assemblages that
composed of different species. Early assemblage composed of Asterionella glacialis,
Fig. 3. Chlorophyll a concentrations following seasonal development, in 1996 (open circles) and in 1997 (closed
circles) season.
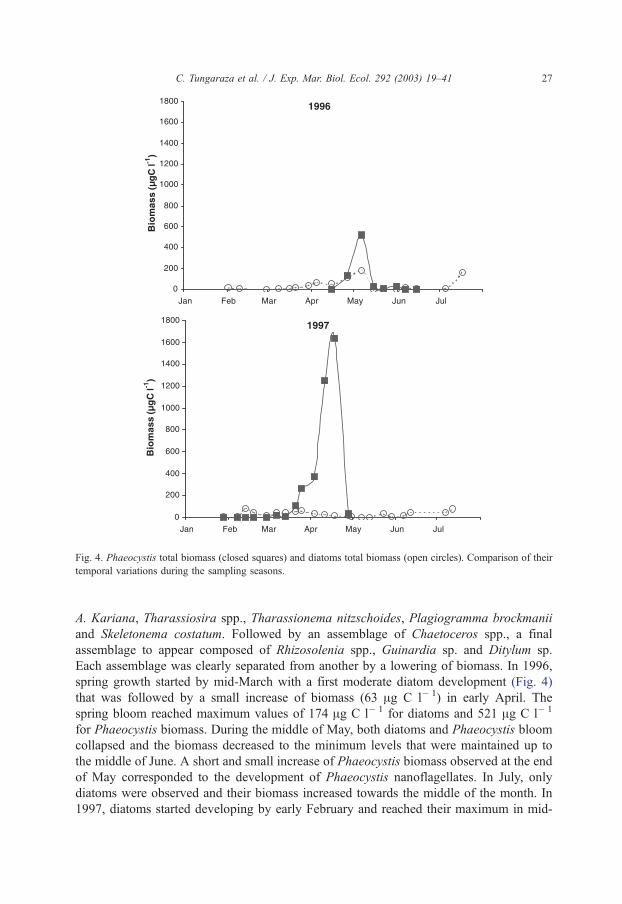
Fig. 4. Phaeocystis total biomass (closed squares) and diatoms total biomass (open circles). Comparison of their
temporal variations during the sampling seasons.
C. Tungaraza et al. / J. Exp. Mar. Biol. Ecol. 292 (2003) 19–41 27
A. Kariana, Tharassiosira spp., Tharassionema nitzschoides, Plagiogramma brockmanii
and Skeletonema costatum. Followed by an assemblage of Chaetoceros spp., a final
assemblage to appear composed of Rhizosolenia spp., Guinardia sp. and Ditylum sp.
Each assemblage was clearly separated from another by a lowering of biomass. In 1996,
spring growth started by mid-March with a first moderate diatom development (Fig. 4)
that was followed by a small increase of biomass (63 Ag C l� 1) in early April. The
spring bloom reached maximum values of 174 Ag C l� 1 for diatoms and 521 Ag C l� 1
for Phaeocystis biomass. During the middle of May, both diatoms and Phaeocystis bloom
collapsed and the biomass decreased to the minimum levels that were maintained up to
the middle of June. A short and small increase of Phaeocystis biomass observed at the end
of May corresponded to the development of Phaeocystis nanoflagellates. In July, only
diatoms were observed and their biomass increased towards the middle of the month. In
1997, diatoms started developing by early February and reached their maximum in mid-

C. Tungaraza et al. / J. Exp. Mar. Biol. Ecol. 292 (2003) 19–4128
February. The total diatom biomass remained always < 100 Ag C l� 1. Furthermore, an
intensive Phaeocystis bloom (1600 Ag C l� 1) occurred in mid-April (Fig. 4).
The POC and PON concentrations are given in Table 1. For the period between 29
March and 31 May 1996, the C/N ratios were close to the Redfield ratio (f 6.6). This
suggested that there was no pronounced influence of non-phytoplanktonic particulate
matter in the organic matter composition. In 1997, we observed a significant departure
from the Redfield value between 3 April and 25 April. This could be due to the influence
of detrital materials but also to the build-up of Phaeocystis colonies exceeding that of
1996. Indeed, the polysaccharide mucous, formed by Phaeocystis, is a source of excess
carbon to the biomass values (Van Boekel, 1992; Thingstand and Billen, 1994; Lancelot
and Rousseau, 1994).
3.3. Nitrogen uptake rates
Incubation experiments were carried out between 29 March and 31 May in 1996 and
between 13 March and 7 May in 1997 (Fig. 5a–c). Nutrient concentrations measured in
the incubation bottles after 24 h showed that the regeneration of ammonium and nitrate
was sufficiently low (see estimations in the annex) such that the uptake rates could
reasonably be approached by the classical equations of Dugdale and Goering (1967) and
Dugdale and Wilkerson (1986).
In 1996, specific NO3� uptake rates (mNO3
) varied between 0.001 and 0.005 h� 1 with no
particular trend, except some small fluctuations (Fig. 5a). In 1997, mNO3decreased from
0.032 h� 1 at the end of March to a minimum of < 0.001 h� 1 at the beginning of May.
Similar variation patterns were observed for the absolute NO3� uptake rates (qNO3
), with
the maximum uptake rates of 0.031 AM h� 1 in early May 1996 and of 0.197 AM h� 1 in
mid-March in 1997, respectively.
The specific uptake NH4 rates (mNH4) varied in similar seasonal trends during both years
(Fig. 5b). A maximum mNH4of 0.0046 h� 1 was observed on 22 May 1996 and of 0.0056
h� 1 on 25 April 1997. The corresponding qNH4were 0.0154 and 0.070 AM h� 1 in 1996
and 1997, respectively. In both years, the minimum uptake of NH4 was in April and a peak
value was developing in late spring (April–May). The lag in the trend of 1996 uptake as
compared to 1997 was a result of late development of bloom of both diatom and
Phaeocystis in 1996.
Table 1
Particulate organic nitrogen and carbon during days of incubation experiment for 2 years
Date PON
(AM)
POC
(AM)
C/N
ratio
Date PON
(AM)
POC
(AM)
C/N
ratio
29 March 1996 3.54 28.18 7.97 7 March 1997 6.44 48.09 7.47
4 April 1996 5.32 46.12 8.68 13 March 1997 6.15 49.32 8.02
15 April 1996 2.04 14.60 7.14 21 March 1997 7.50 53.54 7.14
26 April 1996 8.56 51.74 6.05 3 April 1997 12.20 123.23 10.10
6 May 1996 7.58 53.43 7.05 18 April 1997 13.47 132.62 9.84
22 May 1996 3.40 19.47 5.73 25 April 1997 12.44 138.79 11.16
31 May 1996 3.31 20.07 6.06 7 May 1997 4.49 35.97 8.01

Fig. 5. Specific and absolute uptake rates determined by 15N incubation experiment for the 1996 (open circles)
and 1997 (closed circles) spring season.
C. Tungaraza et al. / J. Exp. Mar. Biol. Ecol. 292 (2003) 19–41 29
The urea uptake rates had no specific seasonal patterns (Fig. 5c). However, a slight
trend for a maximum uptake was observed during late April. When the uptake trends were
compared to the biomass of planktonic bacteria in 1996 (Fig. 6), there was a good
correspondence but not with the trend of available urea concentrations (Fig. 2e). The
maximum absolute urea uptake rate was 0.0097 AM h� 1 in April 1996 and 0.0191 AMh� 1 in late April 1997.

Fig. 6. Seasonal trend of bacteria biomass in the 1996 sampling period.
C. Tungaraza et al. / J. Exp. Mar. Biol. Ecol. 292 (2003) 19–4130
3.4. Bacteria biomass
The development of bacteria biomass (Fig. 6) was similar to diatoms from early
February, and increased to the maximum together with the diatom and Phaeocystis spring
bloom. The highest biomass of bacteria was observed between 26 April and 31 May 1996.
Although the highest range of biomass (50–54 Ag C l� 1) was far small to influence the
total microbial biomass (diatoms + Phaeocystis + bacteria), the simultaneous bloom
appearance with the phytoplankton should be indicating dependence or preferences for
the same environmental factors. The maximum biomass of bacteria was maintained even
after the Phaeocystis bloom. Possibly, that appearance was also supported by other organic
compounds. Examples hereof are the photosynthetic products, excreted from the Phaeo-
cystis cells mainly in the form of small molecules, which can directly be utilised by
planktonic bacteria (Lancelot and Mathot, 1987). These favour bacterial growth at a period
of Phaeocystis bloom and even later, when there is mucous release resulting from colony
disintegration.
4. Discussion
The observed elevated nutrient concentrations at station 330 are not startling, since the
Belgian coastal region is largely affected by anthropogenic nutrient inputs. Especially in
winter when biological uptake is at the lowest, the nutrient levels are significantly
enhanced. The typical winter values measured in the North Atlantic waters entering the
North Sea are 12 AM of NO3�, 0.8 AM of PO4
3� and 6 AM of Si (North Sea Task Force,
1993). In comparison with this, the maximum winter concentrations of f 40 AM for
NO3�, f 1.5 AM for PO4
3� and f 30 AM for Si measured at Station 330 signify a
doubled PO43� concentration and threefold to fivefold increases in NO3
� and Si con-
centrations. Riverine supply is presumably the first reason for enhanced nutrient concen-

C. Tungaraza et al. / J. Exp. Mar. Biol. Ecol. 292 (2003) 19–41 31
trations. The phytoplankton development in these coastal waters has been related to the
nutrient enrichment (Billen et al., 1991; Riegman et al., 1992; Lancelot, 1995). However,
year to year variations in the phytoplankton biomass development were observed to occur
even when similar increase in the nutrients was experienced during 1996–1997 sampling
years.
4.1. Phytoplankton and nutrient dynamics
Figs. 2 and 4 show that variations of spring nutrient concentrations were under the
classical control of biological uptake. This is particularly clear for NO3�, NO2
� and Si
whose highest concentrations are recorded before the growth season. The sharp decrease
of Si, NO3�, NO2
� and NH4 observed in early March 1996 was due to the development of
the first diatom community. The development of Phaeocystis and diatoms started when Si
and NH4 were at low levels (4 and 0.3 AM, respectively) and when NO3� concentration
was 28 AM. When Phaeocystis bloom was declining, NH4 and PO43� concentrations
increased strongly, suggesting a significant mineralization. In 1997, there was a poor
development of diatoms, but in contrast, higher biomass and earlier appearance of
Phaeocystis were experienced. Phaeocystis developed the highest biomass when nutrient
concentrations were at the lowest levels (NO3� 1.2 AM, NO4 0.2 AM and urea 1.2 AM) and,
generally, the ambient concentrations were lower than those of 1996.
The difference in uptake patterns is well illustrated by both the specific and absolute
NO3� uptake rates (Fig. 5a), the corresponding ambient NO3
� concentrations available for
phytoplankton uptake as well as by the stock to uptake rate ratios. As a matter of fact,
dividing the ambient stock by the corresponding uptake rate gives the time required for
complete exhaustion of the stock, assuming that phytoplankton continued removing NO3�
at a constant rate. The period would amount to some 80 days (approximately 12 weeks) in
1996 and to 5 days in 1997. Indeed, the observed high NO3� abundance in 1996 requires
the theoretical prolonged period for exhaustion of the NO3� pool. Similarly, low NO3
�
concentrations and exhaustion in 1997 are in agreement with rapid removal. These
observations connote regulation of the autotrophic processes by something else other
than NO3� concentration (and PO4
3�, which remained above 0.1 AM in 1996 and above 0.5
AM in 1997 throughout spring).
4.2. Phaeocystis and diatoms dominance
In 1996, it was observed that the development of the diatoms bloom appeared at the
same time as Phaeocystis and that the bloom collapsed in spite of non-limiting Si
concentrations (>5 AM). Apart from several other governing parameters, strong photo-
inhibition, which is likely to happen during late spring, may have induced the collapse of
diatoms in 1996 when Si were sufficiently available. Diatoms are known to be affected by
high light intensities (Lancelot and Mathot, 1987).
In 1997, however, the diatoms bloom occurred earlier before the Phaeocystis develop-
ment and their biomass decrease mirrored the lowering of Si concentrations. This early
appearance of diatoms, where they were followed by Phaeocystis before the appearance of
their second peak, has been explained to be a characteristic of the station (Rousseau et al.,

C. Tungaraza et al. / J. Exp. Mar. Biol. Ecol. 292 (2003) 19–4132
1996). Considering lower ambient Si and NO3� concentrations in spring 1997 as compared
to 1996, a poor diatom development was reasonably understandable, but it was difficult to
understand the development of Phaeocystis biomass, which was three times higher than
that of 1996, while NO3� concentrations were much less.
In 1997, there was intensive NO3� uptake which was followed by NO3
� depletion,
during late spring (Figs. 2c and 5a). Contrary to that, in 1996, high NO3� availability
coincided with poor NO3� uptake and there was no NO3
� depletion. The pertinent question
for understanding the ecosystem’s functioning is why did phytoplankton fail to consume
NO3�? Several factors are known to impair NO3
� uptake and subsequently lowering
primary production (Cullen, 1991; Dugdale and Wilkerson, 1991, 1992). It is believed that
uptake by phytoplankton is lowered when NH4 availability exceeds a threshold value.
Earlier studies in different environments such as the Subarctic Pacific (Wheeler and
Kokkinakis, 1990), the North Atlantic (Elskens et al., 1997) and the Southern Ocean
(Goeyens et al., 1995) have already explained this role of NO4 in regulating phytoplankton
production.
In this study, the difference between incomplete and complete exhaustion of NO3�
corresponds to high and poor abundances of NH4. Highest uptake rates were measured in
March and April 1997, a period that was characterised by the absence of enhanced NH4
and urea. Any inhibition of oxidised nitrogen (Nox, mainly NO3�) uptake by enhanced
reduced nitrogen (Nred) is, therefore, unlikely during that particular period. The Nox/Nred
ratios (Fig. 7) demonstrate a change of trend from higher values (>10) during early spring,
to lower values at the end of the sampling season, with few values being < 1. Additionally,
a graph of specific NO3� uptake rates versus Nred illustrates the inhibiting effect of the Nred
(Fig. 8). The lowest values (V 0.001 h� 1) indicate very poor capacity of the phytoplankton
to utilise NO3� as their nitrogen source. These cannot be explained as a consequence of
exhaustion, since these lowest uptake rates (observed in 1996) occurred NO3� at
concentrations exceeding 5 AM. On the contrary, the hyperbolic trend of mNO3versus
Nred in Fig. 8 suggests a considerable inhibition at higher Nred availability (>2 AM). The
Fig. 7. Logarithmic change of seasonal variation of nutrient ratios between oxidized nitrogen concentrations and
reduced nitrogen concentrations for 1996 (closed circles) and 1997 (open circles).

Fig. 8. Scatter plot showing the relationship between specific nitrate uptake rate versus the concentration of total
reduced nitrogen.
C. Tungaraza et al. / J. Exp. Mar. Biol. Ecol. 292 (2003) 19–41 33
highest Nred concentrations generally occurred during late spring (May 1996 and April–
May 1997), with some smaller increases in late winter and early spring (March 1996 and
March 1997).
The pronounced decreases in NO3� uptake rates, observed in 1997, were not compen-
sated by similar increases in Nred uptake. When the decrease of qNO3
� was f 0.2 AM h� 1,
the increase of qNH4
+ and urea were only f 0.05 and f 0.02 AM h� 1, respectively.
The variability in nitrogen uptake rates is shown by the f-ratios, which vary strongly
from 1 year to the other (Table 2, p. 35). Bacteria are well known to manifest great
preferences for urea. Moreover, NH4 can be utilised by bacteria as well and its uptake have
occasionally been observed to represent 20–75% of the total uptake (Laws et al., 1985;
Harrison et al., 1992; Kirchman et al., 1989, 1994). In the North Atlantic Ocean, 4–14%
of the total NO3� uptake was attributed to bacterial consumption (Kirchman et al., 1994).
Therefore, bacteria inherently present in every sample could have obscured the phyto-
plankton uptake patterns. The agreement between planktonic bacteria peak abundances
and high urea uptake rates suggests that bacteria contributed especially to the uptake of
Table 2
f-ratio for 1996 and 1997 samples calculated by considering contribution of the three nitrogenous nutrients, NO3�,
NH4 and urea
Date of sampling f-ratio f-ratioa Date of sampling f-ratio f-ratio*
29 March 1996 0.3 0.3 13 March 1997 0.9 0.9
4 April 1996 0.2 0.2 21 March 1997 0.8 0.9
15 April 1996 0.8 0.9 3 April 1997 0.8 0.9
26 April 1996 0.3 0.5 18 April 1997 0.7 0.8
6 May 1996 0.6 0.7 25 April 1997 0.3 0.4
23 May 1996 0.2 0.2 7 May 1997 0.0004 0.001
31 May 1996 0.2 0.3
a f-ratio = f-ratio when urea is excluded.

C. Tungaraza et al. / J. Exp. Mar. Biol. Ecol. 292 (2003) 19–4134
urea. However, there is very little difference between f-ratios calculated with and without
the uptake of urea (Table 2), which signified that urea uptake rates by phytoplankton and
bacteria were low compared to the total N uptake. Therefore, bacteria uptake did,
probably, not affect significantly the uptake rate results.
At this study area, there is no clear distinction between new and regenerated production
(Dugdale and Goering, 1967), since autochthonous and allochthonous sources supply both
Nox and Nred (see the nitrate and ammonium load of the Schelde River mentioned in
Section 1). Therefore, C-ratios are only used to illustrate the contribution of NO3� in the
total nitrogen uptake. In 1996, f-ratios remained almost constant < 0.5 (predominance of
Nred uptake) with the exception of a short period from mid-April to early May. On the
contrary, in 1997 all ratios were >0.5 (predominance of NO3� uptake), except those at the
very end of the season. When f-ratios were plotted versus the Nred concentration, they
displayed a pronounced decreasing trend with increasing Nred values (Fig. 9). This is
largely due to the effect of ambient Nred concentrations to NO3� uptake rate (herein).
Different types of phytoplankton living in well-mixed coastal waters show distinct
requirements for nutrient assimilation and growth (Hutchinson, 1961), especially in
conditions of nutrient deficiency. We assumed that the observed nitrogen uptake regime
is a representative of the biological activities of the dominant phytoplankton community,
which we defined as that accounting for more than 50% of the phytoplankton biomass. In
this investigation, only two communities were considered; diatoms and Phaeocystis.
Obviously, other communities could also be important. However, however it is generally
understood that diatoms and Phaeocystis are the major components of the phytoplankton
assemblage in the Belgian coastal waters during spring.
The general characteristics of the N uptake regime, inhibition of NO3� uptake by
increased Nred availability (Fig. 8) and uptake do not apply in a similar way for these
Fig. 9. Phaeocystis sp. dominated samples (open circles) and diatoms dominated samples (closed circles). The
influence of reduced nitrogen (Nred) to the f-ratios. Circle size represents percentage of biomass of a community to
the total phytoplankton biomass.

C. Tungaraza et al. / J. Exp. Mar. Biol. Ecol. 292 (2003) 19–41 35
two communities. Both groups displayed an intensive NO3� uptake capacity during
periods of abundant NO3� and deficient Nred, with diatoms being probably favoured in
comparison with the Phaeocystis. Really, in Phaeocystis-dominated assemblages, the
maximum mNO3� was 0.0104 h� 1, whereas that of diatom-dominated was 0.0320 h� 1. On
the other hand, when the mNH4
+ of Phaeocystis and diatom-dominated assemblages were
compared with the increase of concentrations (Fig. 10a and b), both communities
displayed ability to increase the uptake rate, but Phaeocystis showed higher uptake
ability than diatoms. The maximum specific uptake rate (mmax) of Phaeocystis was not
reached even when the concentration of NH4 was about 6 AM, whereas diatoms showed
lower mmax value and the saturation point was reached when NH4 concentration was
about 1 AM. Therefore, it can be understood that diatoms are characterised by lower Ks
Fig. 10. Phaeocystis sp. and diatom dominated communities. Trends of specific NH4 uptake rates at different
concentrations of NH4. (a) When >50% of biomass are Phaeocystis (or < 50% are diatoms); (b) when >50% of
biomass are diatoms (or < 50% are Phaeocystis).

C. Tungaraza et al. / J. Exp. Mar. Biol. Ecol. 292 (2003) 19–4136
and mmax values compared to Phaeocystis. Consequently, Phaeocystis showed ability to
increase their NH4 uptake capacity when more NH4 became available while diatoms
failed to do so as they were already at saturating ammonium concentration.
However, as explained earlier, this increase of NH4 uptake rates does not compensate
for the inhibitory effect on the NO3� uptake rate, with a total N uptake rates remaining
lower in Nred rich environments. The limited number of data appeals for extreme care with
the interpretation of the values, but, equally important, low uptake capacity at low
concentration (< 0.7 AM) and high concentration (>2.5 AM) of NH4 support a different
nitrogen uptake regime of diatoms when compared to Phaeocystis.
These different responses of the two communities to the variable Nred concen-
trations can be used to explain the observed phytoplankton biomass patterns. In 1996,
Si limitation to diatom growth did not really occur, but in spite of this, the diatom
community was out-competed by Phaeocystis. The diatom bloom collapsed at the end
of spring (Fig. 4). A similar observation was reported earlier by Escavarage et al.
(1995). These authors carried out mesocosm experiments and demonstrated that in
spite of high ambient Si concentrations in their samples, the diatom bloom collapsed
and was subsequently replaced by a more intensive Phaeocystis bloom. Investigating
natural environments, Peperzak et al. (1998) also found that the termination of a
diatom bloom in the Dutch coastal zone and its substitution by a denser Phaeocystis
bloom could not be explained by silicate limitation. Several possible explanations
were forwarded, including competition for light, selective grazing of diatoms, vitamin
deficiencies and as previously mentioned, the limitation of diatom growth by high
light intensity. We add another regulatory parameter to this far from exhaustive list of
controls of phytoplanktonic processes, the increasing concentration of Nred. Indeed, in
1996, we observed that the proportion of Nred increased drastically from early April
till mid-May and during the bloom of both communities the Nox/Nred ratio changed
from 47 to f 0.2. The combination of silicate exhaustion and a higher Ks and mmax
for Nred made Phaeocystis the successful competitor in Belgian coastal waters. Their
massive colonies formed during their peak of bloom are not grazed efficiently and,
therefore, Phaeocystis are hindering efficiency of energy transfer to the higher trophic
levels.
5. Conclusion
The bloom biomass of both diatoms and Phaeocystis are particularly supported by
NO3�, which is the major dissolved form of nitrogen. When the concentrations of NH4
are low, diatoms shows higher NO3� uptake ability than Phaeocystis. In this case, it is
generally observed that the uptake rates of NO3� by Phaeocystis and diatoms decrease
when the concentrations of Nred increase and, therefore, lessening the importance of in
primary production. Phaeocystis can increase their NH4 uptake rates as the NH4
concentration increases, but not enough to compensate the reduced rate on NO3�,
whereas diatoms increasing uptake ability were limited to low NH4 concentrations.
Diatoms failure to take-up the increasing NH4 concentrations was a result of their lower
Ks and mmax, which is reached at lower NH4 concentrations. This also disfavoured

C. Tungaraza et al. / J. Exp. Mar. Biol. Ecol. 292 (2003) 19–41 37
diatoms in the use of nitrogen at elevated NH4 concentrations. It is therefore, important
to note that the increase of Nred concentration, especially NH4, destabilises the natural
nitrogen uptake behaviour of diatoms and Phaeocystis. These changes give some
advantages to the Phaeocystis development. They can also be added to the list of
important factors controlling succession and domination between these two commun-
ities.
Acknowledgements
The present study framework is within the objectives of the EC research programme
COMWEB (CT960052) and the national Belgian research programme ‘‘Sustainable
Management of the North Sea’’. Our thanks to all crews of Belgica ship for their
contribution in the sampling. We also acknowledge the contribution of Jean-Yves Parent
for analysis of the samples. [RW]
Appendix A. Annex
A.1. Estimation of ammonium regeneration rates
This estimates the influence of ammonium regeneration during 24-h incubations on our
ammonium uptake rate results. It is true that, depending on the season, 24-h incubations
can have influence on the NH4 uptake rates due to high regeneration rates and hence
isotope dilution of the ammonium pool. Some experimental works have shown that effects
are particularly important when nutrient concentrations are low (Harrison, 1978; Glibert,
1982).
The measured concentrations of ammonium, before incubation and at the end of the
incubation, helped us to establish the possible error on uptake rates at the end of each
incubation, introduced by the regenerated ammonium. In all the experiments, the final
concentrations were lower than the initial concentration except in one experiment which
was found with 9% excess NH4 (see the table below).
Ammonium concentrations before (Ci) and after (Cf) incubation for 24 h in the 1996
and 1997 incubation experiments
Date Ci Cf Date Ci Cf
29 March 1996 4.25 3.01 13 March 1997 0.81 0.34
4 April 1996 2.91 1.96 21 March 1997 1.21 0.47
15 April 1996 0.56 0.24 3 April 1997 0.31 0.34
26 April 1996 0.82 0.33 18 April 1997 0.65 0.55
6 May 1996 1.41 0.68 25 April 1997 0.49 0.38
23 May 1996 5.97 5.31 7 May 1997 6.51 5.83
31 May 1996 2.75 1.02

C. Tungaraza et al. / J. Exp. Mar. Biol. Ecol. 292 (2003) 19–4138
Taking the results on 3 April 1997 as an extreme case of NH4 regeneration, we can
make a simple calculation to estimate the introduced error, by considering the following
equation for balanced processes:
Cf ¼ Ci þ RDt � UDt
where Ci = initial concentration of ammonium, Cf = final concentration of ammonium,
R = regeneration rate of NH4, U = absolute uptake rate and Dt = incubation time.
From this, we can calculate R for different results and correct values of 15-N abundance
due to dilution.
In our worst case scenario, initial concentration was 0.31 AM and after the incubation it
was 0.34 AM. The corresponding absolute uptake rate was 0.008 AM h� 1.
Then from the above equation:
R ¼ Cf � Ci þ UDt
Dt
R ¼ 0:03ðAMÞ þ 0:19ðAMÞ24 h
R ¼ 0:009 AM h�1:
Assuming R was constant throughout the experiment and the regenerated ammonium
had the natural abundance for nitrogen, then the average 15N abundance after 24 h was
26.3% instead of 35.65%, which was the initial abundance.
Hence, the uptake rate, corrected for regeneration, changed from 0.008 to 0.0108 AMh� 1. This rate is 25% higher than the one uncorrected for regeneration.
All calculated uptake rates can be corrected, but they will all be lower, reasonably much
lower than 25%. In any case, regeneration does not have a major influence on the reported
difference of diatoms and Phaeocystis ammonium uptake rate behaviours. The difference in
highest ammonium uptake rate between diatoms and Phaeocystis is at a factor of about 2–3.
References
Baeyens, W., Mommaerts, J.P., Goeyens, L., Dehairs, F., Dedeurwaerder, H., Decadt, G., 1984. Dynamic patterns
of dissolved nitrogen in the Southern Bight of the North Sea. Est. Coast. Shelf Sci. 18, 499–510.
Bakker, C., Herman, P.M.J., Vink, M., 1990. Changes in seasonal succession of phytoplankton induced by the
storm-surge barrier in the Oosterschelde (S.W. Netherlands). J. Plankton Res. 12, 947–972.
Bauerfeind, E., Hickel, W., Ulrich, N., Westernhagen, H.V., 1990. Phytoplankton biomass and potential nutrient
limitation of phytoplankton development in the South-eastern North Sea in spring 1985 and 1986. Neth. J. Sea
Res. 5, 131–142.
Billen, G., Lancelot, C., Meybeck, M., 1991. N, P and Si retention along the aquatic continuum from land to
ocean. In: Mantoura, R.F.C., Martin, J.M., Wollast, R. (Eds.), Ocean Margin Processes in Global Change.
Wiley, Chichester, pp. 19–44.
Cadee, G.C., 1986. Increased phytoplankton primary production in the Marsdiep area (Western Dutch Wadden
Sea). Neth. J. Sea Res. 20, 229–285.

C. Tungaraza et al. / J. Exp. Mar. Biol. Ecol. 292 (2003) 19–41 39
Cadee, G.C., Hegeman, J., 1986. Seasonal and annual variation in Phaeocystis pouchetii (Haptophyceae) in the
westernmost inlet of the Wadden Sea during the 1973 to 1985 period. Neth. J. Sea Res. 20, 29–36.
Creutzberg, F., Postma, H., 1979. An experimental approach to the distribution of mud in the southern North Sea.
Neth. J. Sea Res. 13, 99–116.
Cullen, J.J., 1991. Hypotheses to explain high nutrient conditions in the open sea. Limnol. Oceanogr. 36,
1578–1599.
D’Elia, C.F., 1983. Nitrogen determination in seawater. In: Carpenter, E.J., Capone, D.G. (Eds.), Nitrogen in the
Marine Environment. Academic Press, NY, pp. 731–762.
Dugdale, R.C., Goering, J.J., 1967. Uptake of new and regenerated forms of nitrogen in primary production.
Limnol. Oceanogr. 12, 196–206.
Dugdale, R.C., Wilkerson, F.P., 1986. The use of 15N to measure nitrogen uptake in the eutrophic oceans;
experimental considerations. Limnol. Oceanogr. 31, 673–689.
Dugdale, R.C., Wilkerson, F.P., 1991. Low specific nitrate uptake rate: a common feature of high-nutrient, low-
chlorophyll marine ecosystems. Limnol. Oceanogr. 36, 1678–1688.
Dugdale, R.C., Wilkerson, F.P., 1992. Nutrient limitation of new production in the sea. In: Falkowski, P.G.,
Avril, A.D. (Eds.), Primary Production and Biogeochemical Cycles in the Sea. Plenum, New York, pp.
107–122.
Edler, L., 1979. Recommendations for marine biological studies in the Baltic Sea, phytoplankton and chlorophyll.
Baltic Mar. Biol. Publ. 5, 1–38.
Elskens, I., Elskens, M., 1989. Handleiding voor de bepaling van nutrienten. Zeewater met een Autoanalyser IIrm
system. Vrije Universiteit Brussel, Brussels, Belgium, p. 50.
Elskens, M., Baeyens, W., Goeyens, L., 1997. Contribution of nitrate to the uptake of nitrogen by phytoplankton
in an ocean margin environment. Hydrobiologia 353, 139–152.
Eppley, R.W., Peterson, B.J., 1979. Particulate organic matter flux and planktonic new production in the deep
ocean. Nature 282, 677–680.
Escavarage, V., Peperzak, L., Prins, T.C., Peeters, J.C.H., Joordens, J.C.A., 1995. The development of a Phaeo-
cystis bloom in a mesocosm experiment in relation to coexisting algae. Ophelia 42, 55–74.
Fiedler, R., Proksch, G., 1975. The determination of nitrogen-15 by emission and mass spectrometry in bio-
chemical analysis: a review. Anal. Chim. Acta 78, 1–62.
Gerlach, S.A., 1984. Oxygen depletion 1980–1983 in coastal waters of Federal Republic of Germany. First
Report of the Working Group ‘‘Eutrophication of the North Sea and the Baltic’’. Ber. Inst. Meeresk. Univ.
Kiel, vol. 130, pp. 10–87.
Glibert, P.M., 1982. Regional studies of daily, seasonal, and size fraction variability in ammonium remineraliza-
tion. Mar. Biol. 70, 209–222.
Goeyens, L., Stichelbaut, L., Post, E., Baeyens, W., 1985. Preparation method for solid samples with low
nitrogen content for spectrometric nitrogen-15 analysis. Analyst 110, 135–139.
Goeyens, L., Treguer, P., Baumann, M.E.M., Baeyens, W., Dehairs, F., 1995. The leading role of ammonium in
the nitrogen uptake regime of Southern Ocean marginal ice zones. J. Mar. Syst. 6, 345–361.
Goeyens, L., Kindermans, N., Muhammad, A.Y., Elskens, M., 1998. A room temperature procedure for the
manual determination of urea in seawater. Est. Coast. Shelf Sci. 47, 415–418.
Hansen, F.C., Van Boekel, W.H.M., 1991. Grazing pressure of the calanoid copepod Temora longicornis on a
Phaeocystis-dominated spring bloom in a Dutch tidal inlet. Mar. Ecol. Prog. Ser. 78, 123–129.
Harrison, W.G., 1978. Experimental measurements of nitrogen remineralization in coastal waters. Limnol.
Oceanogr. 23, 684–694.
Harrison, W.G., Harris, L.R., Karl, D.M., Knauer, G.A., Redalje, D.G., 1992. Nitrogen dynamics at the Vertex
time-series site. Deep-Sea Res. 39, 1535–1552.
Hasle, G.R., 1978. Settling: the inverted-microscope method. In: Sournia, A. (Ed.), Phytoplankton manual
UNESCO monographs on oceanographic methodology. UNESCO, Paris, pp. 88–96.
Hesse, K., 1988. Zur Okologie des Phytoplankton in Fronten und Wassermassen der Deutschen Bucht. PhD
Dissertation, Universitat Kiel. 153 pp.
Hutchinson, G.E., 1961. The paradox of the plankton. Am. Nat. 882, 137–145.
Joint, I., Pomroy, A., 1993. Phytoplankton biomass and production in the southern North Sea. Mar. Ecol. Prog.
Ser. 99, 169–182.

C. Tungaraza et al. / J. Exp. Mar. Biol. Ecol. 292 (2003) 19–4140
Kirchman, D.L., Keil, R.G., Wheeler, P.A., 1989. The effect of amino acids on ammonium utilization and
regeneration of heterotrophic bacteria in the subarctic Pacific. Deep-Sea Res. 36, 1763–1776.
Kirchman, D.L., Ducklow, H.W., McCarthy, J.J., Garside, C., 1994. Biomass and nitrogen uptake by heterotrophic
bacteria during the spring phytoplankton bloom in the North Atlantic Ocean. Deep-Sea Res. 41, 879–895.
Koroleff, F., 1969. Direct determination of ammonia in natural waters as indophenol blue. CM ICES/C 9,
19–22.
Koroleff, F., 1983a. Determination of phosphorus. In: Grasshoff, K., Ehrhardt, M., Kremling, K. (Eds.), Methods
of Sea Water Analysis, 2nd ed. Verlag Chemie, Weinheim, pp. 125–139.
Koroleff, F., 1983b. Determination of silicon. In: Grasshoff, K., Ehrhardt, M., Kremling, K. (Eds.), Methods of
Seawater Analysis. Verlag Chemie, Basel, pp. 174–183.
Lancelot, C., 1995. The mucilage phenomenon in the continental coastal waters of the North Sea. Sci. Total
Environ. 165, 83–102.
Lancelot, C., Mathot, S., 1987. Dynamic of Phaeocystis-dominated spring bloom in the Belgian coastal waters: I.
Phytoplanktonic activities and related parameters. Mar. Ecol. Prog. Ser. 37, 239–248.
Lancelot, C., Rousseau, V., 1994. Ecology of Phaeocystis: the key role of colony forms. In: Green, J.C.,
Leadbeater, B.S.C. (Eds.), The Haptophycean Algae, Systematics Association, vol. 51. Oxford Univ. Press,
Oxford, pp. 225–245.
Lancelot, C., Billen, G., Sournia, A., Weisse, T., Colijn, F., Vedhuis, M.J.W., Davies, A., Wassman, P., 1987.
Phaeocystis blooms and nutrient enrichment in the continental coastal zones of the North Sea. Ambio 16,
38–46.
Laws, E.A., Harrison, W.G., DiTullio, G.R., 1985. A comparison of nitrogen assimilation rates based on 15N
uptake and autotrophic protein synthesis. Deep-Sea Res. 32, 85–95.
Lenhart, H.J., Patsch, J., Radach, G., 1996. Daily Nutrient Loads of the European Continental Rivers for the
Years 1977–1993. Institut fur Meereskunde Bibliothek, Hamburg, Germany.
Lorenzen, G.J., 1967. Determination of chlorophyll and phaeopigments: spectrophotometric equations. Limnol.
Oceanogr. 12, 343–346.
North Sea Task Force, 1993. North Sea Quality Status Report (QSR). Oslo and Paris Commissions, London and
International Council for the Exploration of the Sea, Copenhagen.
Owens, N.J.P., Woodward, E.M.S., Aiken, J., Bellan, I.E., Rees, A.P., 1990. Primary production and nitrogen
assimilation in the North Sea during July 1987. Neth. J. Sea Res. 25 (1/2), 143–154.
Pella, E., 1990. Elemental organic analysis: Part 2. State of the art. American Laboratory. Aug. 22:28–32.
Peperzak, L., Colijn, F., Gieskes, W.W.C., Peeters, J.C.H., 1998. Development of the diatom-Phaeocystis spring
bloom in the Dutch coastal zone of the North Sea: the silicon depletion versus the daily irradiance threshold
hypothesis. J. Plankton Res. 20 (3), 517–537.
Porter, K.G., Feig, Y.S., 1980. Use of DAPI for identifying and counting aquatic microflora. Limnol. Oceanogr.
25, 943–948.
Reid, P.C., Lancelot, C., Gieskes, W.W.C., Hagmeier, E., Weichart, G., 1990. Phytoplankton of the North Sea and
its dynamics: a review. Neth. J. Sea Res. 26, 295–331.
Riegman, R., Noordeloos, A., Cadee, G.C., 1992. Phaeocystis blooms of the continental zones of the North Sea.
Mar. Biol. 112, 479–484.
Rousseau, V., Mathot, S., Lancelot, C., 1990. Calculating carbon biomass of Phaeocystis sp. from microscopic
observations. Mar. Biol. 107, 305–314.
Rousseau, V., Dandois, J.M., Lancelot, C., 1996. Impact of rainfall on the diatom Phaeocystis succession in the
eutrophicated continental coastal waters of the North Sea. Environmental Research Programme. Biogeochem-
istry of Phaeocystis Colonies and Other Derived Aggregates, vol. 1, pp. 2–18. Manuscript.
Simon, M., Azam, F., 1989. Protein content and protein synthesis rates of planktonic marine bacteria. Mar. Ecol.
Prog. Ser. 51, 201–213.
Strickland, J.D.H., Parsons, T.R., 1972. A practical Handbook of Seawater Analysis. Canadian Government
Publishing Centre. Ottawa, Canada.
Thingstand, F., Billen, G., 1994. Microbial degradation of Phaeocystis material in the water column. In: Lancelot,
C., Wassmann, P. (Eds.), Ecology of Phaeocystis-dominated ecosystems. J. Mar. Syst., vol. 5, pp. 55–66.
Van Bennekom, A.J., Wetsteijn, F.J., 1990. The winter distribution of nutrients in the Southern Bight of the North
Sea (1961–1978) and in the estuaries of the Scheldt and the Rhine/Meuse. Neth. J. Sea Res. 25 (1/2), 75–87.

C. Tungaraza et al. / J. Exp. Mar. Biol. Ecol. 292 (2003) 19–41 41
Van Bennekom, J., Gieskes, W.W., Tijssen, S.B., 1975. Eutrophication of Dutch coastal waters. Proc. R. Soc.
Lond., B 189, 359–374.
Van Boekel, W.H.M., 1992. Phaeocystis colony mucus components and the importance of calcium ions for
colony stability. Mar. Ecol. Prog. Ser. 87, 301–305.
Veldhuis, M.J.W., Colijn, F., Venekamp, L.A.H., 1986. The spring bloom of Phaeocystis pouchetii (Haptophy-
ceae) in Dutch coastal waters. Neth. J. Sea Res. 20, 37–48.
Wheeler, P.A., Kokkinakis, S.A., 1990. Ammonium recycling limits nitrate use in the oceanic Subarctic Pacific.
Limnol. Oceanogr. 35 (6), 1267–1278.