contrasting effects of different anthropogenic source
TRANSCRIPT

Contrasting effects of different anthropogenic
source types on ozone formation in Houston
T.B. Ryerson, M. Trainer, D.K. Nicks Jr., A.J. Neuman, R.W. Dissly, J.S.Holloway, R.O. Jakoubek, D.D. Parrish, G.J. Frost, C. Wiedinmyer, D.T.Sueper, W.C. Kuster, P.D. Goldan, G. Huebler, W.M. Angevine, and F.C.Fehsenfeld
Aeronomy Laboratory, NOAA, Boulder, CO
S.G. Donnelly, S. Schauffler, E. Atlas, A.J. Weinheimer, F. Flocke, B.P.Wert, W.T. Potter, and A. Fried
Atmospheric Chemistry Division, NCAR, Boulder, CO
C.J. Senff, L.S. Darby, R.M. Banta, R.J. Alvarez
Environmental Technology Laboratory, NOAA, Boulder, CO
Additional thanks for:
Surface ozone and wind observations (TNRCC)Twin Otter ozone data (Baylor University)

30.5
30.0
29.5
29.0
Lat
itu
de
-96.0 -95.5 -95.0 -94.5Longitude
30.5
30.0
29.5
29.0
Lat
itu
de
-96.0 -95.5 -95.0 -94.5Longitude
30.5
30.0
29.5
29.0
Lat
itu
de
-96.0 -95.5 -95.0 -94.5Longitude
Sunday, August 27(87 ppbv at Conroe)
Monday, August 28(112 ppbv at Conroe)
TexAQS 2000: Electra flight data used to:
• differentiate between source typespetrochemical, urban, and power plant
• assess observed differences inozone production rateozone production yield
• contrast non-exceedance with exceedance days
Friday, August 25(194 ppbv at Crawford)

30.5
30.0
29.5
29.0
Lat
itu
de
-96.0 -95.5 -95.0 -94.5
Longitude
Sweeny Freeport BFreeport A
Choc. Bayou
TX CityParish
29.6
29.4
29.2
29.0
Lat
itu
de
-96.0 -95.8 -95.6 -95.4 -95.2
Longitude
20 ppbv
Sweeny
Freeport B
Freeport A
Choc. Bayou
Parish
Track (3*NOy) Ozone
40
30
20
10
0
EN
Ox , kto
ns/year
543210ENMOC, ktons/year
Use Aug. 27 & 28 to study: • isolated petrochemical plumes S. of Houston • coalesced Ship Channel and TX City plume • contrast source types:
power planturbanpetrochemical
Prompt ozone formation observed downwind ofisolated complexes
• use (speciated VOC)/NOx:- compare to inventories- contrast effects on HOx
• estimate plume ozone
formation rates & yields

12
10
8
6
4
2
0
NO
x, p
rop
ene,
eth
ene
, pp
bv
6:50 PM8/27/00
6:54 PM 6:58 PM 7:02 PM 7:06 PM
70
60
50
40
30
20
10
Ozo
ne, p
pb
v
Sweeny Freeport ChocolateBayou
Ethene
Propene
NOx
Evaluation of alkene emissions inventories
• use measured (ethene/NOx) and (propene/NOx)
• TNRCC PSDB predicts much, much lower(alkene/NOx) ratios from these sources:
(Total NMOC)/NOx, mol/mol:Choc. Bayou: 0 .3Freeport: 0 .1Sweeny: 0 .2
using average NMOC mass of 58 g/mol (C4H10)
Order of magnitude estimates:
measured (propene/NOx) ~ 1measured (ethene/NOx) ~ 1
25
20
15
10
5
0
NO
, NO
2 , and
NO
y , pp
bv
6:50 PM8/27/00
6:54 PM 6:58 PM 7:02 PM 7:06 PM
Time, GMT
70
60
50
40
30
20
10
Ozo
ne, p
pb
v
0.1
2
4
6
81
2
4
6
810
2
k OH *
[X
]
Sweeny Freeport ChocolateBayou
Σ(VOC)
NO2
NO2
NO2
Σ(VOC)Σ(VOC)
Σ(VOC)
25
20
15
10
5
0
NO
y , pp
bv
6:50 PM8/27/00
6:54 PM 6:58 PM 7:02 PM 7:06 PM
Time, GMT
10
8
6
4
2
0
HC
HO
, pp
bv
0.1
2
4
6
81
2
4
6
810
2
k OH *
[X
]
all (kOH*X) data are plotted
isoprene
ethene
propene
HCHO
etheneisoprene
HCHO
ethene
isoprene
propene
etheneisobutane
HCHO
hexane1,3-butadiene
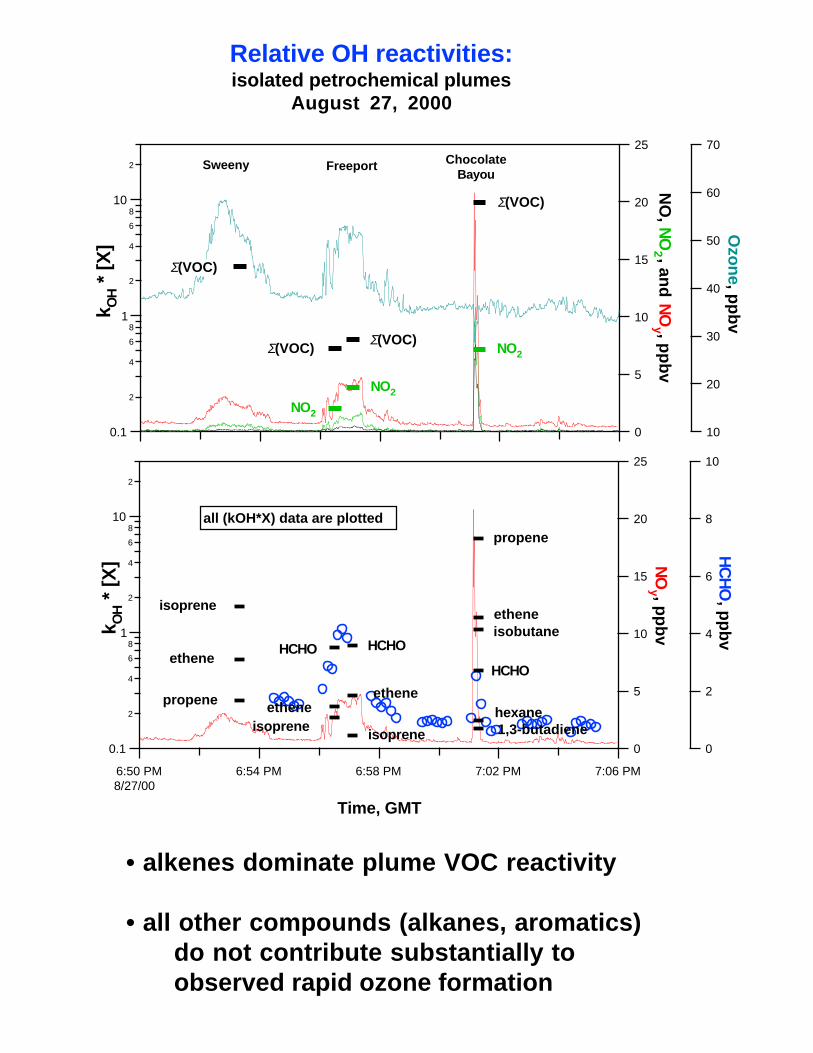
Relative OH reactivities:isolated petrochemical plumes
August 27, 2000
• alkenes dominate plume VOC reactivity • all other compounds (alkanes, aromatics)
do not contribute substantially toobserved rapid ozone formation

25
20
15
10
5
0
NO
, NO
2 , and
NO
y , pp
bv
6:10 PM8/28/00
6:14 PM 6:18 PM 6:22 PM 6:26 PM
Time, GMT
70
60
50
40
30
20
10
Ozo
ne, p
pb
v
0.1
2
4
6
81
2
4
6
810
2
k OH *
[X
]
Sweeny Freeport ChocolateBayou
Σ(VOC)
NO2
Σ(VOC)
NO2
25
20
15
10
5
0
NO
y , pp
bv
6:10 PM8/28/00
6:14 PM 6:18 PM 6:22 PM 6:26 PM
Time, GMT
0.1
2
4
6
81
2
4
6
810
2
k OH *
[X
]
10
8
6
4
2
0
HC
HO
, pp
bv
HCHOHCHOisoprene
ethene
propeneethene
isoprene
Similar picture on the following dayAugust 28, 2000
• No reported emissions upsets on either day • Emissions representative of business-as-usual

Isolated petrochemical plumesAugust 27 and 28, 2000
Rapid photooxidation observed;ozone formed in very high yield
1.0
0.8
0.6
0.4
0.2
0.0
HN
O3/N
Oy
543210
Plume age, hours
1.0
0.8
0.6
0.4
0.2
0.0
NO
x/N
Oy
20
15
10
5
0
O3/(
NO
y-N
Ox)
NOx decayτ =1.5 ± 0.5 hours
HNO3 formation
Ozone yield
0 8 / 2 7 0 8 / 2 8Choc. BayouFreeportSweeney

Source comparisonData from 1995, 1999, and 2000
20
15
10
5
0
Ozo
ne
yiel
d
1086420
Urban plumes(Nashville, TN)
20
15
10
5
0
Ozo
ne
yiel
d
1086420
Power plants
20
15
10
5
0
Ozo
ne
yiel
d
1086420
Plume age, hours
Petrochemicalfacilities
Sweeny
Choc. Bayou
Freeport

8
6
4
2
0
NO
y, p
pb
v
-96.0 -95.8 -95.6 -95.4
Longitude (deg)
NOy
4
3
2
1
0
HN
O3,
pp
bv
-96.0 -95.8 -95.6 -95.4
Longitude (deg)
HNO3
70
60
50
40
30
Ozo
ne,
pp
bv
-96.0 -95.8 -95.6 -95.4
Longitude
Ozone
Lagrangian plume model results(M. Trainer, NOAA)
• Model dispersion and emissions ratios
constrained by Aug. 28 Electra data
SweenyEethene = 5 x ENOx
Epropene = 2 x ENOx
(no alkenes)
FreeportEethene = ENOx
Epropene = ENOx
(no alkenes)
• OH chemistry only;model simulates theobserved HNO3, PANs,HCHO, and ozone
• Rapid ozone formationis consistent withobserved ratios of(alkene/NOx) inthese plumes

30.5
30.0
29.5
29.0
Lat
itu
de
-96.0 -95.5 -95.0 -94.5Longitude
1.0
0.8
0.6
0.4
0.2
0.0
alkene fractio
n
20151050sum(kOHxVOC), s
-1
Coalesced Ship Channel and TX City plumes:relative OH loss rates
WAS and in-situ GC samples below 1500mentire TexAQS mission, August-September
• Reactivity over petrochemical source regionsis extremely high
• Dominated by propene, ethene, 1,3-butadiene • Enhancements consistent with LaPorte data
throughout the TexAQS study period

30.5
30.0
29.5
29.0
Lat
itu
de
-96.0 -95.5 -95.0 -94.5Longitude
Aug. 27
14121086420HCHO, ppbv
30.5
30.0
29.5
29.0
Lat
itu
de
-96.0 -95.5 -95.0 -94.5Longitude
Aug. 28
Formaldehyde data
August 27 and 28, 2000
• HCHO not emitted insubstantial amounts;
• Produced as a result of
(alkene+OH) reactions • Distributions of alkenes,
aldehydes, and ozoneconsistent with differentformation & decay rates

120
110
100
90
80
70
60
50
Ozo
ne,
pp
bv
1086420(NOy - NOx), ppbv
Parishyield ~ 2
Ship Channel/TX Cityyield ~ 12
Houstonyield ~ 5
Ozone yield comparisonElectra data, August 28, 2000
• plumes characterized by (NOx/NOy) = 0.20
• Coalesced Ship Channel/TX City ozone yieldsimilar to those derived in isolated petrochemical plumes on the same day
• No reported upsets at these times;interpreted as "business as usual"for both days
• Large co-located emissions of reactive alkenes
and NOx consistently result in rapid and efficient ozone formation downwind

200
150
100
50
0
Ozo
ne,
pp
bv
12:00 AM8/27/00
6:00 AM 12:00 PM 6:00 PM 12:00 AM8/28/00
Time of day, CST
August 27, 2000TNRCC surface ozone network
120 ppbv
Houston Regional OfficeCrawford
August 27 and 28, 2000:
• ozone concentrations nothing to write home about
• What's so different about an exceedance day?

Preliminary conclusions
• Measurements strongly suggest alkene emissionsare not accurately included in inventories
- models will not accurately simulate observationsuntil the alkene inventories are realistic
• Measurements and models further suggest that, ingeneral, routine emission of alkenes, appropriatemeteorology, and OH chemistry alone aresufficient to explain the observed ozone
- upsets may play a part, but business-as-usualemissions appear to be sufficient
- exceedances are possible on a daily basis; actualoccurrence is dependent upon meteorology
• Anthropogenic emission of large amounts of veryreactive alkenes (ethene, propene, 1,3-butadiene)co-located with NOx emission is the primarycause of ozone exceedances above 200 ppbv inthe Houston area