contour grass filter strips: hydrology and water quality...3.2 water quality sampling and analysis 9...
TRANSCRIPT

Contour grass filter strips: hydrology and water quality
NIWA Client Report: HAM2008-134 July 2008 NIWA Project: BOP07207/CRBQ072

All rights reserved. This publication may not be reproduced or copied in any form without the permission of the client. Such permission is to be given only in accordance with the terms of the client's contract with NIWA. This copyright extends to all forms of copying and any storage of material in any kind of information retrieval system.
Contour grass filter strips: hydrology and water quality Lucy McKergow Kerry Costley Graham Timpany
NIWA contact/Corresponding author
Lucy McKergow
Prepared for
Environment Bay of Plenty NIWA Client Report: HAM2008-134 July 2008 NIWA Project: BOP07207/CRBQ072
National Institute of Water & Atmospheric Research Ltd Gate 10, Silverdale Road, Hamilton P O Box 11115, Hamilton, New Zealand Phone +64-7-856 7026, Fax +64-7-856 0151 www.niwa.co.nz

Contents
1. Introduction 1 1.1 Background 1 1.2 Filter strips 1 1.3 Objectives 2
2. Study sites 4
3. Experimental design and methods 5 3.1 Contour GFS 5 3.2 Water quality sampling and analysis 9 3.3 Data analysis 11
4. Results 13 4.1 Soil structure 13 4.2 Hydrology 15 4.3 Hillslope runoff quality and loads 18 4.4 GFS performance 20
5. Discussion 25 5.1 Hillslope runoff quality and loads 25 5.2 GFS performance and water quality mitigation 26
6. Recommendations 28
7. References 30
8. Acknowledgements 31
9. Appendix 1 – Kaharoa event water quality data (BOP07207) 32
10. Appendix 2 – Soil structure report 35 ______________________________________________________________________
Reviewed by: Approved for release by:
Chris Tanner Kit Rutherford
Formatting checked

Contour grass filter strips: hydrology and water quality iv
Executive Summary
Grass filter strips (GFS) are a potential tool to improve runoff water quality on grazed pastures. Filter
strips, located on contours at mid-slope locations (close to source) rather than in riparian zones, are
used overseas to remove pollutants from surface runoff on cropped planar hillslopes. Riparian filter
strips or paddock edge filter strips may be some distance from the source and as runoff moves
downslope, surface runoff tends to converge into small channels which can bypass or locally inundate
riparian filter strips. This report presents the final results for contour GFS trials on a dairy farm at
Lake Rerewhakaaitu and a drystock farm at Kaharoa, near Lake Rotorua.
The trial compared adjacent 3 m wide GFS of retired ryegrass and Phalaris aquatica versus unfenced
controls. The inputs and outputs of surface runoff and suspended sediment (SS), total phosphorus
(TP), total nitrogen (TN) and E. coli were measured at each GFS after runoff events.
Surface runoff (>1L) was generated on 19 days at Rerewhakaaitu (Sep 06-Jun 08) and 10 days at
Kaharoa (Jan 07-Jun 08). At Rerewhakaaitu about 10% of rainfall became surface runoff. However,
most of the runoff occurred during the winter (mid July-mid August) when at least 35% of rainfall
became surface runoff. At Kaharoa surface runoff was a smaller component (6%) of rainfall.
Pollutant concentrations in surface runoff were similar at both sites despite different land uses.
Suspended sediment concentrations were between 10 and 4000 mg/L, median TN concentrations
between 4 and 6 mg/L and median TP concentrations were less than 2 mg/L. E. coli concentrations
ranged between 400 and 1.4×10⁴ MPN/100 mL at Rerewhakaaitu, and between 10 and 5×10⁶
MPN/100 mL at Kaharoa. High (104-106) E. coli concentrations were measured at Kaharoa for three
events after recent sheep grazing.
The ryegrass GFS generally performed better than the planted phalaris GFS. Pollutant trapping
efficiency generally declined for larger-sized runoff events for both ryegrass and phalaris. For the
Rerewhakaaitu control the median concentration of pollutants increased particularly for E. coli.
Suspended sediment, TN and TP loads were reduced by 35-87% compared with the control, and by a
smaller amount compared with the inflow. The Kaharoa control reduced median concentrations,
probably due to infiltration. Suspended sediment, TN and TP concentrations were reduced by 60-80%
compared with the inflow and by <15-54% compared with the control.
These results suggest that hillslope GFS may be a useful best management practice (BMP) to remove
pollutants from surface runoff close to the point of generation. However, GFS are only likely to be a
practical and cost effective attenuation tool in those environments where surface runoff occurs, flow
convergence is minimal and alternative attenuation tools are not available.
The trials have provided valuable data on the frequency, quantity and quality of surface runoff from
two grazed pasture sites in the Rotorua lakes area. The key recommendations are:

Contour grass filter strips: hydrology and water quality v
1. Surface runoff attenuation tools are important for the Rerewhakaaitu area where soils are
dominated by low permeability Rotomahana muds and surface runoff comprises >35% of the
rainfall during winter, increasing the risk of pollutant mobilisation.
2. Surface runoff attenuation tools are not so important for Kaharoa Ash soils where soils are
more permeable and surface runoff is a minor component of the total water balance.
3. Grass filter strips need to be actively maintained to retain a dense sward near the ground
surface and maintain the desired species.
4. Prior to filter strips being adopted at a site the following issues should be considered:
• the importance of surface runoff as a pollutant transporter;
• the timing of surface runoff generation relative to the vigour of filter species;
• landscape suitability for GFS (e.g., evidence of flow convergence); and
• the practicality and performance of GFS versus other surface runoff attenuation tools
(e.g., ponds, dams, wetlands, and sediment traps).
Contour grass filter strips: hydrology and water quality 1
1. Introduction
1.1 Background
Several lakes within the Rotorua district have degraded water quality, mainly as a
result of nutrient enrichment and faecal contamination. Environment Bay of Plenty
requires information on the quality of surface runoff in the Rotorua district and the
performance of BMPs. A wide range of BMPs are being explored to reduce the
loading of nutrients and faecal microbes from farms so as to improve lake condition.
As surface runoff moves over the soil surface it mobilises sediment, nutrients and
faecal microbes. Contamination of runoff will depend on several key factors –fertiliser
history, grazing history, amount of groundcover, slope, soils and climate. Grass filter
strips (GFS) are a potential best management practice (BMP) designed to intercept
surface runoff. This report contains the results from two trials, one established with
NIWA Capability Funds and the other funded by Environment Bay of Plenty.
1.2 Filter strips
Filter strips can remove sediment and pollutants bound to the surface of the sediment
from surface runoff. The key removal processes include deposition, physical filtering,
and infiltration. In addition, some dissolved pollutants, colloids and clays may be
removed from surface runoff by binding to the filter strip soil and vegetation surfaces
(Dosskey 2001). Nutrient and sediment generation may also be reduced within retired
filter strips due to the cessation of cropping or grazing (e.g., Moorby and Cook, 1992).
The majority of research on GFS comes from cropped land where they can be an
effective water quality tool, significantly reducing sediment loads and concentrations
in surface runoff (Dosskey 2001). Filter strips have been tested on land draining
pasture, either with or without manure or effluent additions. Typically between 40 and
80% of the SS load is retained, but the variability in performance is large (e.g.,
(Magette et al. 1989; Schellinger & Clausen 1992; Smith 1989). Nutrients can also be
removed from surface runoff, but the nutrient form will affect removal. Removal of
particulate or sediment-associated nutrients from surface runoff is generally lower
than that of sediment (e.g., Magette et al. 1989; Smith 1989). Significant amounts of
particulate P can be removed from surface runoff if it is associated with large particles
with short settling times, but if P is moving with clay particles or colloids then longer
settling times are required. Dissolved pollutants transported by surface runoff (e.g.,
nitrate, FRP) are generally reduced the least. Filter strips may also be useful for
reducing faecal microbe concentrations, although load and concentration reductions
can vary between 0 and 99% and efficacy decreases with increasing flow (Collins et
al. 2004; Tate et al. 2006; Tate et al. 2004).

Contour grass filter strips: hydrology and water quality 2
Grass filter strips have been trialled on pasture in New Zealand. Smith (1989)
established retired pasture filter strips on a Waikato drystock farm and monitored them
for two years. Flow-weighted mean concentrations were reduced by between 40 and
50% for most parameters. Smith (1989) does not include data on infiltration of surface
runoff, and suggests that the high trapping of dissolved nutrients (e.g., NO3-N) was
probably due to a reduced supply of nutrients within the retired strips. Collins et al.
(2004) conducted a series of rainfall simulator experiments (40 minute duration) to
evaluate the ability of filter strips to retain faecal microbes from effluent and
concluded that trapping was a function of flow rate. Under high flow rates (13 l/min)
trapping varied between 0-85%, while at low flow rates (4 l/min) trapping was much
greater (>95%). The grass filter strips were a temporary store for some of the microbes
trapped - they were mobilised and washed out of the filter strip in a subsequent event,
5 days later.
Maximum pollutant trapping by GFS can be expected when surface runoff is
uniformly dispersed across the strip and the top edge of the filter strip should follow
the elevation contour. GFS are typically located in riparian areas, however, surface
runoff entering riparian areas is unlikely to be dispersed, sheet flow. As water moves
downslope, surface runoff tends to converge into small channels which can bypass or
locally inundate riparian filter strips (Dillaha et al. 1989).
Ideally, GFS should intercept contaminants before channelisation occurs. This study
has trialled GFS at alternative, mid-slope, locations in the landscape. The potential
advantages of this location are the close proximity of the GFS to pollutant sources and
little or no opportunity for flow convergence, providing conditions suitable for high
pollutant removal. In these positions there may be no need for GFS to be permanently
fenced, so at times of low runoff risk the GFS could be grazed. Additionally,
harvesting vegetation from filter strips could reduce the chances of nutrient saturation
and weed invasion. However, on pasture susceptible to pugging and compaction, the
soil structure under permanent contour GFS may improve and increase opportunities
for runoff to infiltrate into the soil.
1.3 Objectives
This study investigates the potential of contour GFS to reduce yields of sediment,
nutrients and faecal microbes in surface runoff generated by natural rainfall on
intensively grazed pasture. Specific research questions are:
1. What volumes of surface runoff are generated on grazed pasture and under
what conditions?
2. What is the water quality of surface runoff from grazed pasture?

Contour grass filter strips: hydrology and water quality 3
3. How effective are contour GFS under field conditions?
4. Are stiff-stemmed phalaris GFS more effective at improving surface runoff
water quality than retired pasture grass GFS?
Contour grass filter strips: hydrology and water quality 4
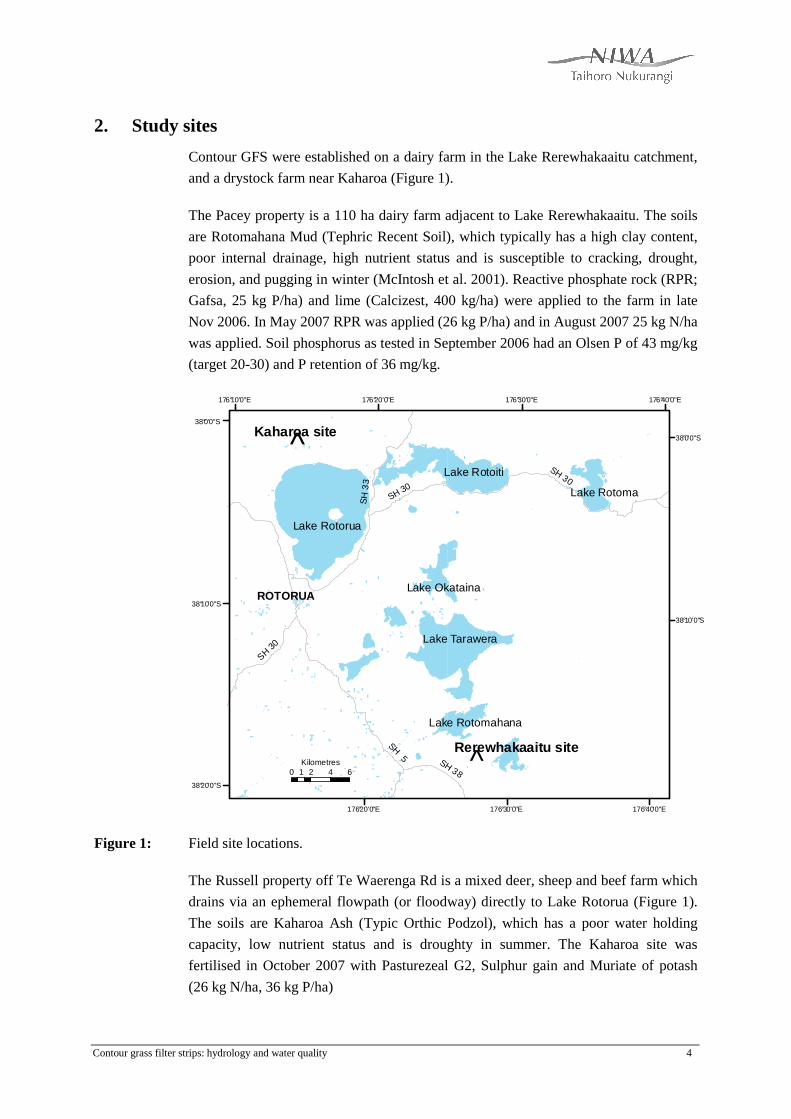
2. Study sites
Contour GFS were established on a dairy farm in the Lake Rerewhakaaitu catchment,
and a drystock farm near Kaharoa (Figure 1).
The Pacey property is a 110 ha dairy farm adjacent to Lake Rerewhakaaitu. The soils
are Rotomahana Mud (Tephric Recent Soil), which typically has a high clay content,
poor internal drainage, high nutrient status and is susceptible to cracking, drought,
erosion, and pugging in winter (McIntosh et al. 2001). Reactive phosphate rock (RPR;
Gafsa, 25 kg P/ha) and lime (Calcizest, 400 kg/ha) were applied to the farm in late
Nov 2006. In May 2007 RPR was applied (26 kg P/ha) and in August 2007 25 kg N/ha
was applied. Soil phosphorus as tested in September 2006 had an Olsen P of 43 mg/kg
(target 20-30) and P retention of 36 mg/kg.
Lake Tarawera
Lake Rotorua
Lake Rotoiti
ROTORUALake Okataina
^
^
Lake Rotomahana
Lake Rotoma
Kaharoa site
Rerewhakaaitu siteSH 5
SH 30
SH
33
SH 38
SH 30
SH 30
176°10'0"E
176°20'0"E
176°20'0"E
176°30'0"E
176°30'0"E
176°40'0"E
176°40'0"E
38°20'0"S
38°10'0"S
38°10'0"S
38°0'0"S
38°0'0"S
0 2 4 61Kilometres
Figure 1: Field site locations.
The Russell property off Te Waerenga Rd is a mixed deer, sheep and beef farm which
drains via an ephemeral flowpath (or floodway) directly to Lake Rotorua (Figure 1).
The soils are Kaharoa Ash (Typic Orthic Podzol), which has a poor water holding
capacity, low nutrient status and is droughty in summer. The Kaharoa site was
fertilised in October 2007 with Pasturezeal G2, Sulphur gain and Muriate of potash
(26 kg N/ha, 36 kg P/ha)

Contour grass filter strips: hydrology and water quality 5
3. Experimental design and methods
3.1 Contour GFS
The experimental design incorporates three metre wide (perpendicular to the slope)
retired pasture and phalaris (Phalaris aquatica cv. Maru) filter strips and adjacent
controls on planar hillslopes (Figure 2). The controls were open to normal farm
grazing practice and consequently had variable pasture cover throughout the trial.
Figure 2: Schematic of the contour GFS experimental design (not to scale) with collectors numbered 1-12.
Phalaris (Harding grass or bulbous canary grass) was chosen for the trial as it is tall
and stiff-stemmed with a dense sward suitable for trapping sediment. It is a perennial
grass that has vigorous growth during autumn, winter and spring and is semi-dormant
during summer. The phalaris was grown in a nursery until it had reached a height of
15 cm. It was planted as plugs and over-sown with ryegrass. At Rerewhakaaitu the
retired pasture strip was a mixture of perennial ryegrass (Lolium perenne), white
clover (Trifolium repens) and browntop (Agrostis capillaris). At Kaharoa the retired
pasture GFS is a mixture of predominantly ryegrass and white clover, with yorkshire
fog (Holcus lanatus), cocksfoot (Dactylis glomerata), browntop (Agrostis capillaris)
and sweet vernal (Anthoxanthum odoratum).
At Rerewhakaaitu, runoff collectors were installed in the retired pasture GFS in May
2006 and monitoring of the GFS performance commenced in September 2006 when
the grass had grown. Some water quality samples and runoff volumes were collected
at the inflow of the rye grass filter at Rerewhakaaitu during July and August 2006,
before the filter strips were established. These results are not included in the analysis.
The site was closed in June 2008, 22 months later. At Kaharoa, monitoring started in
December 2006 and ceased in June 2008 (19 months). The data logger was damaged
by lightening in March 2008 and rainfall and runoff time series data are missing
between 5 March 2008 and 16 April 2008.
The sites were surveyed in detail using a total station (Geodimeter 464). Digital
elevation models were constructed in ArcGIS and the catchment areas estimated using
Pasture controls
Grass 1
Grass 2
Runoff collector
Electric fence
1 3 5 7 9 11
2 4 6 8 10 12

Contour grass filter strips: hydrology and water quality 6
the Spatial Analyst tools ‘Flow Direction’ and ‘Watershed’. The catchment areas
draining to the inflow collectors are 160 m² and 170 m² for Kaharoa and
Rerewhakaaitu, respectively (Figure 3, Figure 4). At Kaharoa the contributing area has
slopes between 1 and 20%, with a flatter area at the top of the catchment grading into
a zone of 5-10% slopes and then an area with 10-20% slopes near the runoff collectors
(Figure 3). At Rerewhakaaitu the slope is mostly 10-20%, with the steepest zone
being the 20 m upslope of the runoff collectors (Figure 4).

Contour grass filter strips: hydrology and water quality 7
Figure 3: Catchment boundaries and 0.5 m contours at Kaharoa.
!(
!(
!(
!(
!(
!(
!(
!(
!(
!(!(
!(
EE
EE
E
E
E
E
E
E
E
E
E
EE
E
EE
EEE
E E E
EEE
E E E E
EEEE
EE
EE
EE
EE
EE
E
EE
E
E
EE
EEE
E
E
E
E
E
EE
E
E
E
E
E
E
E
EE
E
E
E
E
E
E
E
E
E
E
E
E
E
EE
E
E
E
E
E
E
E
E
E
E
E
E
E
EE
E
E
E
EEEEEEEEE
E E E E E E E E E
EEEEEEE
E E E E E E E
EEEEE
E E E E E E
EEEEEEE
E EE E E E E
EEEE
EE
E E E E E
EEE
E E E
E
E
E
E
E
E
E
E
E E
E
E
E
E
E
E
E
E
E
EE
0.5 m contour
!( collectors
catchment boundary
E survey point
0 5 10 15 202.5Metres±
Kaharoa

Con
tou
r gr
ass
filte
r st
rips:
hyd
rolo
gy
and
wa
ter
qua
lity
8
Fig
ure
4:
Cat
chm
ent
boun
dari
es a
nd 0
.5 m
con
tour
s at
the
Rer
ew
haka
aitu
site
.
E
E
E
E
E
E
E
E
E
E
E
E
E
E
EE
EE
EE
EE
EEEEE
E
E
E
E
E
E
E
E
E
E
E
E
E
E
E
E
E
E
E
E
E
E
E
E
E
EE
E
E
E
E
E E
E
EE
EE
EE
E
E
E
E
EE
E
E
EEE
E
E
E
E
E
E
E
EE
E
E
E
EEE
EE
EE
EE
EE
EE
EE
EE
EE
EE
EE
EE
EE
EE
EE
EE
EE
EE
EE
EE
EE
EE
EE
EE
EE
EE
EE
EE
EE
EE
EE
EE
EE
EE
EE
EE
EE
EE
EE
EE
EE
EE
E
E
E
E
E
E
E
E
E
E
E
E
EE
E
E
E
E
E
E
E
EE
E
E
EE
EE
E
E
E
EE
E
E
E
E
E
E
E
EE
E
E
E
E
E
E
E
E
E
E
E
EE
E
E
E
E
E
E
E
E
E
E
E
E
E
E
E
E
E
E
E
E
EE
E
E
E
E
E
E
E
E
E
E
E
E
E
E
E
EE
E
E
E
E
E
E
E
E
EE
E
E
E
E
E
E
E
E
EE
E
E
E
E
E
E
E
E
E
E
E
E
E
E
E
E
E
E
E
E
E
E
E
E
E
E
E
E
EE
E
E
E
E
E
E
E
E
E
E
E
E
E
E
E
E
E
E
E
E
E
E
EE
EE
E
E
EE
EE
E
E
E
E
E
E
E
EE
EE
E
E
E
E
E
E
EE
EE
E
E
E
E
E
E
EE
E
E
!( !(
!(
!(!(
!(!(
!(!(
!(
!(
!(
Pac
ey
±0.
5 m
con
tour
!(co
llect
ors
catc
hmen
t bou
ndar
y
Esu
rve
y po
int
05
1015
202.
5M
eter
s

Contour grass filter strips: hydrology and water quality 9
3.2 Water quality sampling and analysis
Twelve 30 cm wide surface runoff collectors were installed to capture runoff which is
diverted to a 64 L storage trough (Figure 5). The surface runoff volumes in each
trough were measured after a runoff event and a sample collected for analysis. During
several of the larger events at Rerewhakaaitu the storage container capacities were
exceeded. The runoff volumes, concentration data and load estimates for these events
contain some uncertainty, particularly the nutrient data. We can reasonably assume
that a large proportion of the SS remained in the sample containers. So while the SS
concentrations and volume values contain uncertainty, the load estimates are probably
reasonable. The nutrient loads for these events are likely to be underestimated.
Figure 5: Inflow (foreground) and outflow collectors on the Phalaris plot at Rerewhakaaitu (Lucy McKergow, 21 July 2007).
Surface runoff hydrographs were also measured by tipping bucket flow gauges
(Unidata, 6506H) on two retired pasture collectors at each site (Figure 6).

Contour grass filter strips: hydrology and water quality 10
Figure 6: Tipping bucket flow gauge over runoff trough at Rerewhakaaitu (Graham Timpany, 30 July 2007).
Rainfall was measured on site by tipping bucket rain gauges (Ota 0.2 mm tip at
Rerewhakaaitu and Unidata 6212 0.2 mm tip at Kaharoa) and daily rainfall records
were also available from the farmers.

Contour grass filter strips: hydrology and water quality 11
All samples were stored on ice and sent to NIWA's Chemistry Lab in Hamilton for
analysis. Samples were analysed for, suspended sediment (SS), total nitrogen (TN),
total phosphorus (TP) and a samples collected within 36 hours were analysed for E.
coli and filterable reactive phosphorus (FRP). Table 1 summarises the analysis
methods and detection limits.
Table 1: Water quality analysis methods.
Analyte Method description Units and detection limit
Method code
Suspended sediment (SS)
Gravimetric determination after filtration & drying at 104°C
0.5 mg/L APHA 2540D
E. coli IDEXX Laboratories Inc Colilert Test Kit 1 MPN/100mL APHA 9223B
Total nitrogen (TN) Persulphate digest, auto cadmium reduction, FIA 10 µg/L Lachat
Total phosphorus (TP)
Acid persulphate digestion, molybdenum blue colorimetry
1 µg/L NWASCO 38
Filterable reactive phosphorus (FRP)
filtered through 0.45 µm filter, FIA 1 µg/L Lachat
Soil samples were collected at both sites from the retired pasture GFS and the pasture
contributing areas on 20 June 2008. Soil samples were taken between a depth of 20
and 40 mm using rings 20 mm high and 50 mm diameter. Three sample rings were
taped together and the bottom and top rings were cut away in the lab and the middle
ring (20-40 mm below the surface) analysed. In the retired pasture the sampling
locations were pre-selected by randomly generated coordinates on a grid pattern, while
in the paddock samples were taken at pre-selected random points along a line. All
cores were carefully carved into the soil following trimming of the grass to the ground
surface. Cores were used for total porosity, macroporosity and bulk density
determinations and analysis was conducted by NZ Labs in Hamilton. Pore-size
distribution was measured using pressure plates (pores >60 and >30 µm at 10 kPa).
All cores were saturated before measurement.
3.3 Data analysis
Various graphical and statistical methods are used to summarize data and facilitate
comparisons between the sites and GFS treatments. Boxplots are used to show the
distribution of the concentration or soil structure data in a format that allows for easy
comparison. Non-parametric statistics are used because of small outflow sample sizes
and non-normal distributions. The statistical analyses used include basic descriptive
statistics and Kruskal-Wallis and Kolmogorov-Smirnov tests. All statistical analysis
was conducted using SYSTAT version 11. Exploratory data analysis included
inspections for normality. For each parameter a Kruskal Wallis One Way ANOVA on
Ranks was used to detect differing distributions between inflow and outflow samples.

Contour grass filter strips: hydrology and water quality 12
If the distributions were significantly different a Kolmogorov-Smirnov Two Sample
Test (K-S) was used to identify differing pairs.
To assess the overall importance of surface runoff as a pollutant source and transport
pathway the exports entering the trial (all inflow collectors, kg/ha) and the surface
runoff (mm) were calculated. There are six inflow collectors with a total sampling
width of 1.8 m. At Rerewhakaaitu the total trial width is 23.4 m, so the measured loads
were scaled by a factor of 13 and then converted to kg/ha. At Kaharoa the total trial
width is 21 m, so the measured loads were scaled by a factor of 11.7.
Filter strip effectiveness can be evaluated using either pollutant concentrations or
loads and trapping efficiencies can be reported for either individual events or entire
monitoring periods. Filters can be sinks for pollutants when the data shows a: (i)
decrease in the average signal, (ii) decrease in the range, or (iii) decrease in the
maximum (Viaud et al. 2004). Effectiveness analysis compares the combined inflow
dataset with combined outflow samples from the pairs of control and GFS collectors.
In this paper, load reductions on individual events are not examined; however, the
variability in trapping between events can be large, with larger proportions of the
incoming load trapped in smaller events. Load reductions were calculated and then
assessed relative to the controls. During many smaller events no outflow samples were
collected, presumably due to infiltration between collector pairs. The total loads
analysis includes the inflowing data for these events.

Contour grass filter strips: hydrology and water quality 13
4. Results
4.1 Soil structure
At Rerewhakaaitu all three soil structure indices show an improvement in soil
structure with 2 years of pasture retirement. The macroporosity of the paddock
samples ranged between 3 and 22 % (Figure 7), with a median of 12 %, just above the
critical threshold for pasture growth (10%). In contrast, in the retired GFS
macroporosity values were all above 10%, with a median of 19%. The median total
porosities were 64 and 60% for the retired GFS and paddock, respectively. The soil
bulk densities were higher in the paddock, with a median of 0.94 g/m³ compared to
0.84 g/m³ in the retired pasture GFS (Figure 7).
At Kaharoa there were no statistical differences between the structure indices between
the paddock and retired GFS. The paddock macroporosity range was smaller than the
retired pasture GFS range (Figure 7). The median total porosities were 73 and 72% for
the retired GFS and paddock, respectively. The soil bulk densities were low,
reflecting the porous nature of the soil, with medians of 0.66 g/m³ in the paddock and
0.62 g/m³ in the retired pasture GFS.

Contour grass filter strips: hydrology and water quality 14
GFS Paddock
0
10
20
30
40
Mac
ropo
rosi
ty (
%, V
/V)
GFS Paddock
0
10
20
30
40
Mac
ropo
rosi
ty (
%, V
/V)
GFS Paddock
50
60
70
80
Tot
al P
oros
ity (
%, V
/V)
GFS Paddock
50
60
70
80
Tot
al P
oros
ity (
%, V
/V)
GFS Paddock
0.0
0.5
1.0
1.5
Bul
k de
nsity
(g/
cm3)
GFS Paddock
0.0
0.5
1.0
1.5
Bul
k de
nsity
(g/
cm3)
Figure 7: Boxplots of soil structure results for (a) Rerewhakaaitu and (b) Kaharoa. Box represents the median with 25th and 75th percentiles, whiskers are the appropriate quartile ± 1.5 x IQR and outliers are shown as stars. p-values ≤ 0.05 indicate a statistically significant difference between the distributions (Mann Whitney test).
p=0.000 p=0.013
p=0.000 p=0.016
p=0.000 p=0.062
(a) Rerewhakaaitu (b) Kaharoa

Contour grass filter strips: hydrology and water quality 15
4.2 Hydrology
The mean annual rainfall at Rerewhakaaitu (station B86242, 1977-2002) is 1345 mm,
with average winter (June-August) rainfalls over 130 mm/month. The annual totals
during the monitoring period were below average; in 2006 the farm rain gauge
recorded 1250 mm and in 2007 the total was 1045 mm. Daily totals were generally
less than 25 mm, with the exception of 8 events between the end of March and mid
August 07 (Figure 8). The maximum rainfall intensities recorded (to the end of 2007)
were: 5 mm/5 min, 8 mm/10 min, 11 mm/30 min and 15 mm/1 hr.
At Kaharoa the annual rainfall is around 1900 mm (station B86033, 1975-2007 1920
mm/y, station B86011, 1966-2005, 1826 mm/y). The 2007 annual total was 1947 mm.
Fourteen daily totals were ≥50 mm (Figure 9) and the maximum rainfall intensities
recorded during 2007 were: 5.4 mm/5 min, 10 mm/10 min, 21.8 mm/ 30 min and 30.4
mm/1 hr.
Surface runoff was generated on 37 days at Rerewhakaaitu (as recorded by tipping
bucket on trough 7), but 19 of these days had only traces of runoff (<1L; Figure 8).
Runoff was recorded on 15 days at Kaharoa, with volumes >1 L on 10 days (Figure 9).
At Rerewhakaaitu more than 100 mm of runoff entered the trial over the monitoring
period (Sep 06- June 08) and so at least 10% of rainfall becomes surface runoff. The
runoff:rainfall ratio calculation is a minimum value because of the collectors
overflowing. However, during 2007 most of the surface runoff occurred during the
winter (mid July-mid August) and during this period at least 35% of rainfall became
surface runoff (94 mm runoff, 266 mm rainfall).
Surface runoff was a smaller component of the water balance at Kaharoa. During 2007
the total runoff depth entering the trial was estimated as 94 mm and so the 2007
annual runoff:rainfall ratio was 0.06.

Contour grass filter strips: hydrology and water quality 16
0
20
40
60
80
100
120
1Sep06 1Nov06 1Jan07 1Mar07 1May07 1Jul07 1Sep07 1Nov07 1Jan08 1Mar08 1May08 1Jul08
Dai
ly r
ainf
all t
otal
(m
m) a
1
10
100
1000
10000
100000
1000000
10000000
Dai
ly in
flow
tota
l (L)
Figure 8: Daily rainfall totals and runoff totals (note reversed axis numbering and log scale) for the inflow ryegrass collector at Rerewhakaaitu (1 Sep 2006-19 June 2008).

Contour grass filter strips: hydrology and water quality 17
0
50
100
150
200
1Jan07 1Mar07 1May07 1Jul07 1Sep07 1Nov07 1Jan08 1Mar08 1May08 1Jul08
Dai
ly ra
infa
ll to
tal (
mm
)
0
100
200
300
Dai
ly in
flow
tota
l (L/
30 c
m ru
noff
colle
ctor
5)
gap in data
Figure 9: Daily rainfall totals and runoff totals (note reversed axis numbering) for the inflow ryegrass collector at Kaharoa (1 Jan 2007-19 June 2008).

Contour grass filter strips: hydrology and water quality 18
One event at Rerewhakaaitu (17 Aug 07) resulted in 1030 L passing through the
inflow tipping bucket in a 24 hour period. Other events generated less surface runoff,
with seven events over 70 L/d and the remainder less than 20 L/d. At Kaharoa three
events generated more than 30 L/d, with the largest generating 165 L/d. The remaining
eight events resulted in a small amount of surface runoff (< 15 L/d) at the tipping
bucket.
At Rerewhakaaitu almost all of the inflowing surface runoff recorded at trough 7
(96%) was generated between 20 July and 19 August 2007 (Figure 8). The paddock
was grazed between 13 and 17 July and on July 30 the pasture was 50 mm high. Daily
rainfall totals in excess of 6 mm all generated surface runoff. Rainfall intensities
generating surface runoff were variable, for example, during the first event on 4
August (14 mm) the max 5 min rainfall intensity was 0.5 mm/5 min and 63 L of runoff
was measured at trough 7 (Figure 10). The second event (11.5 mm) had marginally
higher intensities (1.5 mm/5 min) and 160 L of runoff was measured.
0
50
100
150
200
250
4/08/2007 6:00 4/08/2007 12:00 4/08/2007 18:00 5/08/2007 0:00
Cum
ulat
ive
flow
(L)
a
0
5
10
15
20
25
30
Cum
ulat
ive
rain
fall
(mm
) aoutflow
inflowrainfall
Figure 10: Cumulative rainfall and runoff for trough 7 at Rerewhakaaitu on 4 August 2007.
4.3 Hillslope runoff quality and loads
Suspended sediment concentrations were higher at Rerewhakaaitu (median 430 mg/L)
than Kaharoa (median 129 mg/L). Median TN concentrations were the same at both
sites and the TN concentration ranges were similar. Total P concentrations were
higher at Kaharoa, between 835 and 62400 µg/L (Table 2). Phosphorus transport is
dominated by particulate P (particles > 0.45 µm, 90%) at Rerewhakaaitu, while at
Kaharoa the particulate fraction ranges from 7-92% (Table 2).
E. coli concentrations were high at Kaharoa than Rerewhakaaitu, with a median
concentration of 2.2×10⁴ MPN/100 mL at Kaharoa (Table 2). High (104-106) E. coli

Contour grass filter strips: hydrology and water quality 19
concentrations were measured in surface runoff at Kaharoa on 31 March 07 and 5 and
17 August 07, during or after sheep had grazed the paddock.
Table 2 also contains summary statistics for the troughs at Rerewhakaaitu that did not
overflow. The median concentrations are lower than for the entire dataset, but in the
same ball park. Lower concentrations could be expected for these events as the runoff
events were smaller (and did not cause the troughs to overflow).
The majority of the inflowing sediment and nutrient loads were measured during 2007
(Table 2) at both sites. The incoming loads for Rerewhakaaitu contain considerable
uncertainty due to the underestimated runoff volumes and the actual loads are likely to
be considerably higher.
Table 2: Summary statistics for all inflowing sample (control, rye and phalaris combined) concentrations and loads for the entire monitoring period and 2007.
SS E. coli TN TP FRP FRP:TP
(mg/L) (MPN/100 mL) (µg/L) (µg/L) (µg/L)
Rerewhakaaitu N 40 22 40 40 20 20
(All troughs) min 34.4 413 2350 69 73 0.018
max 4090 1.4×10⁴ 29500 5950 577 0.515
median 350 2654 5065 953 277 0.11
load (kg/ha/22 months) 1414 10.5 2.3
2007 load (kg/ha/y) 1409 10.4 2.3
Rerewhakaaitu N 24 6 24 24 9 9
(Troughs that did not overflow) min 34.4 413 2350 69 73 0.085
max 2350 1.1×10⁴ 12200 4030 577 0.515
median 271 1246 4315 830 325 0.150
load (kg/ha/22 months) 279 2.3 0.5
2007 load (kg/ha/y) 274 2.3 0.5
Kaharoa N 53 34 52 52 45 45
min 4.2 10 1500 798 119 0.07
max 875 5.5×10⁶ 22400 62400 4900 0.92
median 129 2.2×10⁴ 6330 1940 586 0.61
load (kg/ha/19 months) 283 7.5 1.07
2007 load (kg/ha/y) 272 5.8 0.95

Contour grass filter strips: hydrology and water quality 20
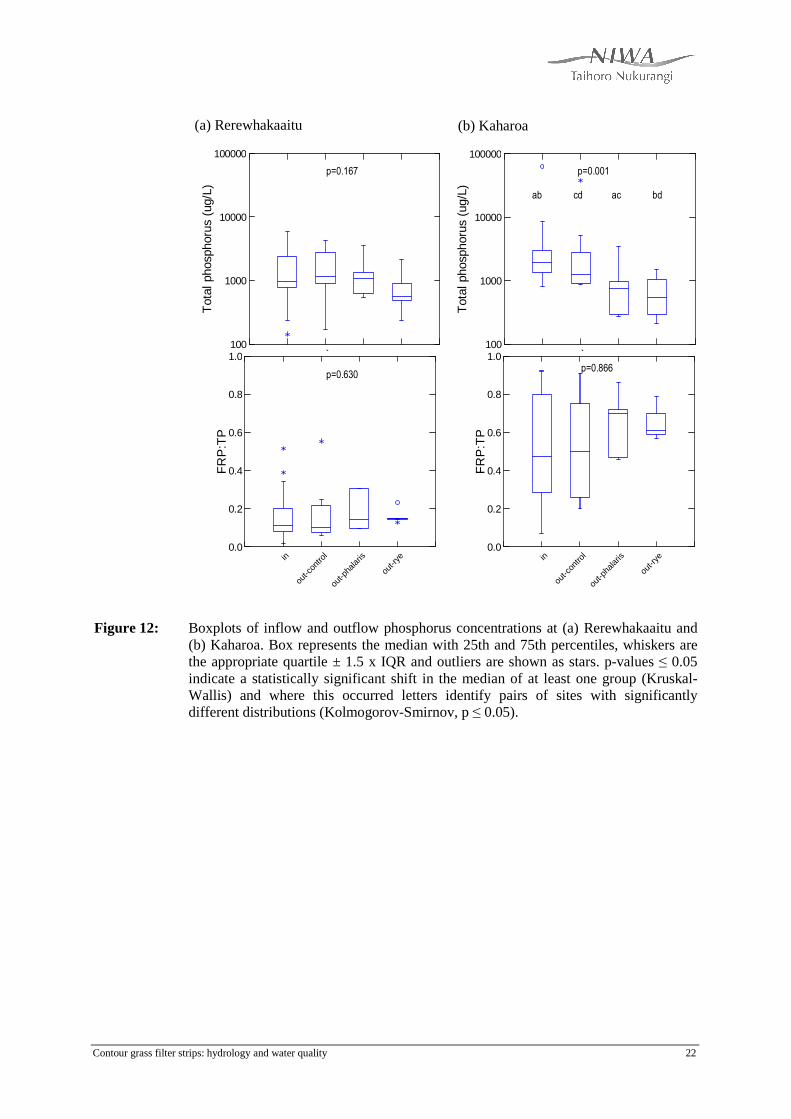
4.4 GFS performance
The ryegrass GFS generally performed better than the planted phalaris GFS, reducing
the concentrations by a greater amount (Figure 11, Figure 12). In addition, over time
observations show that the phalaris was outcompeted by weeds and clover.
At Kaharoa no significant statistical differences were detected between the combined
inflows and control outflow concentrations (Figure 11b, Figure 12b). Both GFS
reduced the median SS concentration by >80% compared to the combined inflow
median. In addition the SS range was reduced and most of the outflow samples had
concentrations less than 40 mg/L. There is no evidence that the GFS successfully
reduced E. coli concentrations, although 50% of the ryegrass samples had
concentrations less than 10000 MPN/100 mL. Rabbit diggings were observed in the
phalaris GFS and may explain the increase in E. coli concentration. TN and TP
median concentrations were reduced by 70% in the ryegrass GFS and 60% in the
phalaris GFS, compared to the combined inflow median.
At Rerewhakaaitu median concentrations increased between the combined inflow and
outflow for all pollutants, particularly E. coli (Figure 11a, Figure 12a). The median E.
coli concentration increased 350% between the combined inflows and control outflow.
This increase for the control is probably due to dung deposition on the unfenced
control. While there is no statistical evidence of decreases in SS, TN or TP for the
ryegrass GFS, the concentrations were typically lower (Figure 11a, Figure 12a).

Contour grass filter strips: hydrology and water quality 21
out-c
ontro
l1
10
100
1000
10000
Sus
pend
ed s
edim
ent
(mg/
L)
out-c
ontro
l1
10
100
1000
10000
Sus
pend
ed s
edim
ent
(mg/
L)
out-c
ontro
l1
10
100
1000
10000
100000
1000000
10000000
E.
coli
(MP
N/1
00 M
L)
out-c
ontro
l1
10
100
1000
10000
100000
1000000
10000000
E. c
oli (
MP
N/1
00 M
L)
in
out-c
ontro
l
out-p
halar
is
out-r
ye
1000
10000
Tot
al n
itrog
en (
ug/L
)
in
out-c
ontro
l
out-p
halar
is
out-r
ye
1000
10000
Tot
al n
itrog
en (
ug/L
)
Figure 11: Boxplots of inflow and outflow surface runoff concentrations at (a) Rerewhakaaitu and (b) Kaharoa. Box represents the median with 25th and 75th percentiles, whiskers are the appropriate quartile ± 1.5 x IQR and outliers are shown as stars. p-values ≤ 0.05 indicate a statistically significant shift in the median of at least one group (Kruskal-Wallis) and where this occurred letters identify pairs of sites with significantly different distributions (Kolmogorov-Smirnov, p ≤ 0.05).
(a) Rerewhakaaitu (b) Kaharoa
p=0.468
a ab b
ab c ac b
ab a b
p=0.021
p=0.011 p=0.671
p=0.042 p=0.01
Contour grass filter strips: hydrology and water quality 22
out-c
ontro
l100
1000
10000
100000
Tot
al p
hosp
horu
s (u
g/L)
out-c
ontro
l100
1000
10000
100000
Tot
al p
hosp
horu
s (u
g/L)
in
out-c
ontro
l
out-p
halar
is
out-r
ye
0.0
0.2
0.4
0.6
0.8
1.0
FR
P:T
P
in
out-c
ontro
l
out-p
halar
is
out-r
ye
0.0
0.2
0.4
0.6
0.8
1.0
FR
P:T
P
Figure 12: Boxplots of inflow and outflow phosphorus concentrations at (a) Rerewhakaaitu and (b) Kaharoa. Box represents the median with 25th and 75th percentiles, whiskers are the appropriate quartile ± 1.5 x IQR and outliers are shown as stars. p-values ≤ 0.05 indicate a statistically significant shift in the median of at least one group (Kruskal-Wallis) and where this occurred letters identify pairs of sites with significantly different distributions (Kolmogorov-Smirnov, p ≤ 0.05).
ab cd ac bd
p=0.167 p=0.001
p=0.630
(a) Rerewhakaaitu (b) Kaharoa
p=0.866

Contour grass filter strips: hydrology and water quality 23
Load reductions between the inflow and outflow collectors were highly variable
between events so only total loads are presented (Figure 13). The general trend for SS,
TN and TP at both sites are load reductions (from the average inflow load) by the
GFS.
At Kaharoa total load reductions were less than 55% (relative to control), with larger
reductions for SS (40% relative to control) and TN (54% relative to control) than TP
(15% relative to control). Runoff volumes were reduced by around 70-80% in the GFS
and 50% for the control. The 20-30% greater reduction in the GFS could be the result
of improved soil structure without grazing.
At Rerewhakaaitu the control loads all increased from the average inflow load by
between -5 and -20 %. Load reductions between the median average inflow collectors
and GFS outflow collectors of SS, TN and TP at Rerewhakaaitu were in the order of
30 and 65%, although there is uncertainty in these figures due to the overflowing
troughs. Given the fact that the control loads increased (negative trapping), the
reductions relative to control were 35-87%. Given the small reductions in runoff
volume (around 10% in both GFS), the trapping is likely to be dominated by
concentration reductions.

Contour grass filter strips: hydrology and water quality 24
0
0.4
0.8
1.2
av.
inflo
w
ou
t-co
ntr
ol
out-
ph
ala
ris
ou
t-ry
e
av.
inflo
w
ou
t-co
ntr
ol
out-
ph
ala
ris
ou
t-ry
e
av.
inflo
w
ou
t-co
ntr
ol
out-
ph
ala
ris
ou
t-ry
e
runoff (m3) SS (kg) TP (g)
0
1
2
3
4
5
av. i
nflo
w
out-
cont
rol
out-
phal
aris
out-
rye
TN (g)
0
0.2
0.4
0.6
av.
inflo
w
ou
t-co
ntr
ol
ou
t-p
ha
lari
s
ou
t-ry
e
av.
inflo
w
ou
t-co
ntr
ol
ou
t-p
ha
lari
s
ou
t-ry
e
av.
inflo
w
ou
t-co
ntr
ol
ou
t-p
ha
lari
s
ou
t-ry
e
runoff (m3) SS (kg) TP (g)
0
1
2
3
4
av.
inflo
w
ou
t-co
ntr
ol
ou
t-p
ha
lari
s
ou
t-ry
e
TN (g)
Figure 13: Total measured runoff (m3), SS (kg), TP (g), and TN (g) average inflow (6 collectors / 3) and outflow loads for the control and GFS during the monitoring periods at (a) Rerewhakaaitu (22 months) and (b) Kaharoa (19 months).
(b) Kaharoa
(a) Rerewhakaaitu

Contour grass filter strips: hydrology and water quality 25
5. Discussion
5.1 Hillslope runoff quality and loads
The concentration data collected in this study has similar nutrient concentrations to
other New Zealand studies on surface runoff water quality from grazed systems.
Previously measured TP concentrations in surface runoff range between 0.2 to 18 mg/
L (Table 3), while total Kjeldahl N concentrations range between 0.03 to 1100 mg/L.
The maximum concentrations measured in this study are well within this range (Table
2). Grazing, accompanied by treading damage can increase total nitrogen (TN) and
total phosphorus (TP) losses in surface runoff. For example, Nguyen et al. (1998)
measured 89% increases in TN losses and >94 % increase in TP losses from heavily
grazed steep land at Whatawhata, Waikato, compared with undamaged areas, largely
due to increased suspended sediment mobility.
Table 3: Measured surface runoff SS, N and P concentrations for a range of NZ farming types and climates.
Reference Location/stock/terrain/ soil
Parameter Concentration range (mg/L)
Load (kg/ha/y)
Smith & Monaghan 2003
Southland, dairy, flat, silt loam
NO3-N NH4-N
TP FRP
0-12 0-12 0.5-6 0.5-3
max 0.23
Monaghan (unpublished data cited in Monaghan et al. 2007)
Dairy, pallic soil FRP:TP ratio 0.45 0.42
Cooke 1988; Cooke & Cooper 1988
Waikato, drystock, rolling-moderately steep, silt loam over gleyed silt clay loam
NO3-N TKN TP
TFPa
FRP
0.01-9.2 0.83-151 0.35-18
0.13-16.7 0.05-15.7
Sharpley & Syers 1979
Palmerston North, dairy, flat-rolling, 40-50 m2 plots
TP SS
0.31 1220
McColl & Gibson 1979
Hutt Valley, sheep, steep, silt loam, approx 40 m2 unbounded plots
TP TKN TSS
0.2-30b
0.2-1100 b 35-6000 b
0.11 0.59
a TFP = total filterable phosphorus or total dissolved P (TDP) b Estimated from Figure 1 McColl & Gibson, 1979b
Estimated nutrient loads in this study are higher than those measured in previous New
Zealand surface runoff studies, where nutrient losses from undrained grazed pastures
without effluent irrigation have been estimated to be in the range of 0.1 to 0.3 kg
P/ha/y and up to 0.6 kg TKN/ha/y. The 2007 loads entering both trials are an order of

Contour grass filter strips: hydrology and water quality 26
magnitude higher than those reported in Table 3. Sediment loads entering the
Rerewhakaaitu site are similar (although they may be underestimates) to the 1200 kg
TSS/ha/yr (Table 3) measured by Sharpley and Syers (1979) on grazed dairy pasture.
The 2007 total SS loads entering the trial at Kaharoa are significantly lower (270
kg/ha/y), probably due to the lower runoff volumes and coarser textured soils. Loads
estimated in this study must be used with caution, because (i) there is uncertainty in
some of the runoff volumes and concentrations due to overflowing troughs and
consequently the inflowing loads at Rerewhakaaitu are likely to be underestimates and
(ii) they are dependent on the measurement scale and location (Beven et al. 2005). At
smaller scales exports can be significantly higher than those actually delivered to
channels, due to intermediate storages and transformations along the delivery
pathway.
Stream E. coli concentrations dominate the New Zealand literature, with limited
studies of faecal pathogens in surface runoff. This study shows that runoff from sheep
and beef grazed pasture can have similar or higher E. coli concentrations than grazed
dairy pasture (in the absence of effluent irrigation). The E. coli concentrations
measured in this study are similar to those previously reported for surface runoff from
grazed pasture. For example, Collins et al. (2005) used a rainfall simulator to generate
surface runoff on steep sheep grazed pasture in the Waikato and measured peak
concentrations between 103 and 107 MPN/100 mL, equating to 105 to 108 E. coli per
m2 of hillside. We measured the highest E. coli concentration at Kaharoa during or
shortly after sheep grazing. This is consistent with the study of Collins et al. 9205)
who found that E. coli concentrations in surface runoff from sheep grazed hill country
pasture decreased with time since grazing. This suggests that the risk of E. coli
transport by surface runoff is likely to vary widely, depending on the co-incidence of
rainfall and grazing.
5.2 GFS performance and water quality mitigation
The ryegrass GFS generally performed better at retaining pollutants than the planted
phalaris GFS at both sites. Possible explanations include the clumpy nature of the
transplanted phalaris allowing channels to form, together with the soil disturbance
cause by transplanting. At Rerewhakaaitu the phalaris GFS was cultivated prior to
transplanting of the plants, but the similar inflow and outflow runoff volumes suggest
that this did not increase the infiltration capacity of the soil significantly compared
with the retired pasture GFS. Over the longer term the phalaris did not manage to
retain its vigour and weeds and clover were able to out-compete the grass.
The porosity and bulk density results for Rerewhakaaitu suggest that the soil structure
improved in the retired pasture GFS during the monitoring period. Over time, with

Contour grass filter strips: hydrology and water quality 27
further improvement in soil structure, infiltration of surface runoff might become an
important GFS function.
Data from this study suggests that natural event durations may reduce the ability of
GFS to retain and inactivate E. coli. Collins et al. (2004) demonstrated that grass filter
strips could be useful for trapping E. coli at low flow rates (<4 L/min) on 10-15 degree
slopes. Flow rates in this study were up to 3.25 L/min, but most events were long
duration or events were closely spaced in time allowing limited intervals for natural
inactivation of faecal microbes.
Contour grass filter strips: hydrology and water quality 28
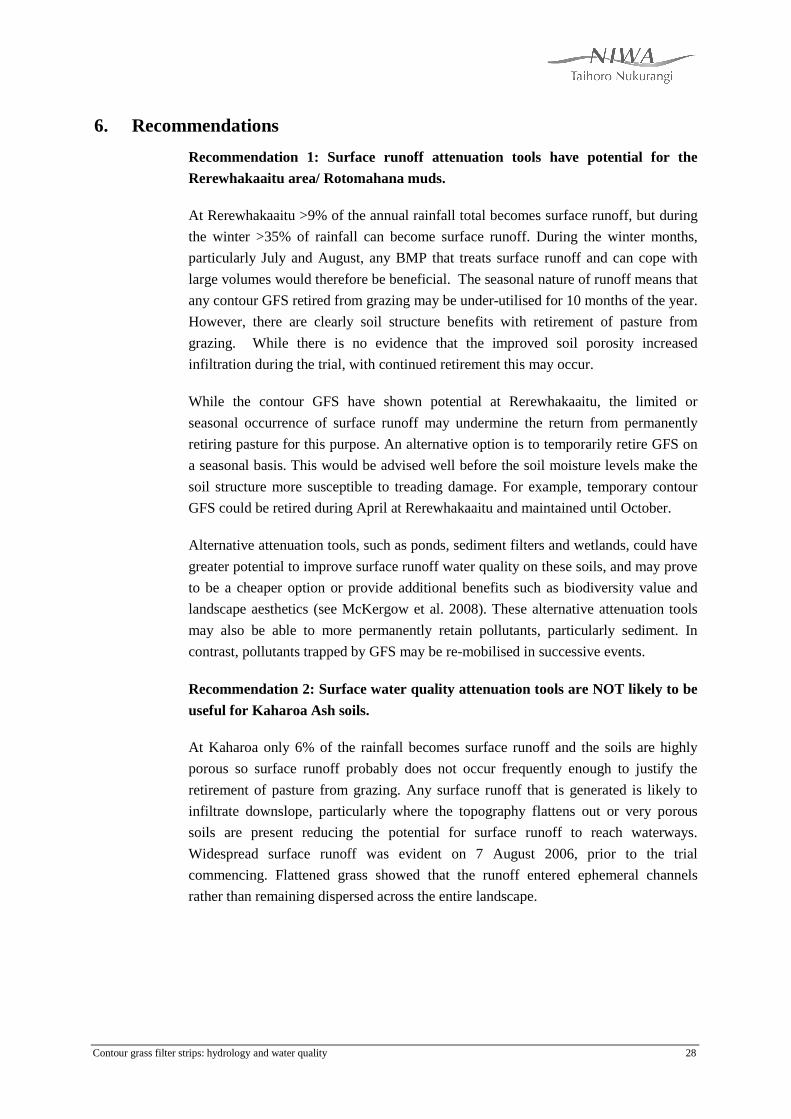
6. Recommendations
Recommendation 1: Surface runoff attenuation tools have potential for the
Rerewhakaaitu area/ Rotomahana muds.
At Rerewhakaaitu >9% of the annual rainfall total becomes surface runoff, but during
the winter >35% of rainfall can become surface runoff. During the winter months,
particularly July and August, any BMP that treats surface runoff and can cope with
large volumes would therefore be beneficial. The seasonal nature of runoff means that
any contour GFS retired from grazing may be under-utilised for 10 months of the year.
However, there are clearly soil structure benefits with retirement of pasture from
grazing. While there is no evidence that the improved soil porosity increased
infiltration during the trial, with continued retirement this may occur.
While the contour GFS have shown potential at Rerewhakaaitu, the limited or
seasonal occurrence of surface runoff may undermine the return from permanently
retiring pasture for this purpose. An alternative option is to temporarily retire GFS on
a seasonal basis. This would be advised well before the soil moisture levels make the
soil structure more susceptible to treading damage. For example, temporary contour
GFS could be retired during April at Rerewhakaaitu and maintained until October.
Alternative attenuation tools, such as ponds, sediment filters and wetlands, could have
greater potential to improve surface runoff water quality on these soils, and may prove
to be a cheaper option or provide additional benefits such as biodiversity value and
landscape aesthetics (see McKergow et al. 2008). These alternative attenuation tools
may also be able to more permanently retain pollutants, particularly sediment. In
contrast, pollutants trapped by GFS may be re-mobilised in successive events.
Recommendation 2: Surface water quality attenuation tools are NOT likely to be
useful for Kaharoa Ash soils.
At Kaharoa only 6% of the rainfall becomes surface runoff and the soils are highly
porous so surface runoff probably does not occur frequently enough to justify the
retirement of pasture from grazing. Any surface runoff that is generated is likely to
infiltrate downslope, particularly where the topography flattens out or very porous
soils are present reducing the potential for surface runoff to reach waterways.
Widespread surface runoff was evident on 7 August 2006, prior to the trial
commencing. Flattened grass showed that the runoff entered ephemeral channels
rather than remaining dispersed across the entire landscape.

Contour grass filter strips: hydrology and water quality 29
Recommendation 3: Grass filter strips need to be actively maintained to retain a
dense sward near the ground surface and maintain the desired species.
During the summer months the grass filter strips required active maintenance and the
grass was cut back to less than 10 cm every 5-8 weeks to help maintain a dense sward
close to the ground. The cut grass was removed from the filter strips by raking. During
the 5-8 weeks between cutting the grass grew to heights of up to 45 cm. Clover
growth was also noted at both sites, particularly during the summer.
Recommendation 4: Process for evaluating the potential of filter strips
In order to maximise the water quality benefits from grass filter strips at a specific site
the following steps should be taken:
1. Evaluate the importance of surface runoff as a pollutant transporter. If surface
runoff is not an important flowpath, then source control and attenuation tools
that address the main flowpaths should be evaluated.
2. Consider the timing of surface runoff generation, for example, seasonality. If
surface runoff is only generated during the winter, then permanent retirement
of pasture from grazing may be unnecessary and temporary GFS might be
more appropriate.
3. Examine the landscape and assess the likelihood of flow convergence
occurring. Once runoff concentrates into channels a large amount of the
surface runoff is able to bypass the GFS. For example, Dosskey et al. (2002)
modelled sediment removal by GFS on four farms and estimated removals in
the range of 41-90% from paddock runoff for uniformly distributed runoff.
However, because of topographically driven non-uniform runoff leading to
channelised flow, only 15 to 43% would actually be removed. Other
attenuation options that target flow convergence zones or channel may be
more appropriate in these areas.
4. Compare the likely performance, fate of trapped pollutants, ease of
application, maintenance requirements and cost of GFS with other surface
runoff attenuation tools, such as wetlands, sediment traps, dams and ponds.

Contour grass filter strips: hydrology and water quality 30
7. References
Beven, K.; Heathwaite, A.L.; Haygarth, P.M.; Walling, D.E.; Brazier, R.; Withers,
P.J.A. (2005). On the concept of delivery of sediment and nutrients to stream
channels. Hydrological Processes 19: 551-556.
Collins, R.C.; Donnison, A.; Ross, C.; McLeod, M. (2004). Attenuation of effluent-
derived faecal microbes in grass buffer strips. New Zealand Journal of
Agricultural Research 47: 565-574.
Collins, R.C.; Elliott, A.H.; Adams, R. (2005). Overland flow delivery of faecal
bacteria to a headwater pastoral stream. Journal of Applied Microbiology 99: 126-
132.
Cooke, J.G. (1988). Sources and sinks of nutrients in a New Zealand hill pasture
catchment II: Phosphorus. Hydrological Processes 2: 123-133.
Cooke, J.G.; Cooper, A.B. (1988). Sources and sinks of nutrients in a New Zealand
hill pasture catchment. III. Nitrogen. Hydrological Processes 2: 135-149.
Dillaha, T.A.; Reneau, R.B.; Mostaghimi, S.; Lee, D. (1989). Vegetative filter strips
for agricultural non-point source pollution control. Transactions of the American
Society of Agricultural Engineers 32(2): 491-496.
Dosskey, M.G. (2001). Toward quantifying water pollution abatement in response to
installing buffers on crop land. Environmental Management 28(5): 577-598.
Magette, W.L.; Brinsfield, R.B.; Palmer, R.E.; Wood, J.D. (1989). Nutrient and
sediment removal by vegetated filter strips. Transactions of the American Society
of Agricultural Engineers 32: 663-667.
McColl, R.H.S.; Gibson, A.R. (1979). Downslope movement of nutrients in hill
pasture, Taita, New Zealand. II. Effects of season, sheep grazing, and fertiliser.
New Zealand Journal of Agricultural Research 22: 151-161.
McIntosh, J.J.; Ngapo, N.; Stace, C.E.; Ellery, G.R.; Gibbons-Davies, J. (2001). Lake
Rerewhakaaitu Project. Environment B O P Environmental Reports 2001/15.
McKergow, L.A.; Tanner, C.; Monaghan, R.; Anderson, G.C. (2008). Stocktake of
diffuse pollution attenuation tools for New Zealand pastoral farming systems.
NIWA Client Report HAM2007-161.

Contour grass filter strips: hydrology and water quality 31
Monaghan, R.M.; Hedley, M.J.; Di, H.J.; McDowell, R.M.; Cameron, K.C.; Ledgard,
S.F. (2007). Nutrient management in New Zealand pastures - recent developments
and future directions. New Zealand Journal of Agricultural Research 50: 181-201.
Moorby, H. & Cook, H.F. (1992). The use of fertiliser free grass strips to protect dyke
water from nitrate pollution. Aspects of Applied Biology 30: 231-234.
Nguyen, M.L.; Sheath, G.W.; Smith, C.M.; Cooper, A.B. (1998). Impact of cattle
treading on hill land. 2. Soil physical properties and contaminant runoff. New
Zealand Journal of Marine and Freshwater Research 41: 279-290.
Schellinger, G.R.; Clausen, J.C. (1992). Vegetative filter treatment of dairy barnyard
runoff in cold regions. Journal of Environmental Quality 21: 40-45.
Sharpley, A.N.; Syers, J.K. (1979). Phosphorus inputs into a stream draining an
agricultural watershed II: Amounts contributed and relative significance of runoff
types. Water, Air and Soil Pollution 11: 417-428.
Smith, C.M. (1989). Riparian pasture retirement effects on sediment, phosphorus, and
nitrogen in channelised surface run-off from pastures. New Zealand Journal of
Marine and Freshwater Research 23: 139-146.
Smith, L.C.; Monaghan, R.M. (2003). Nitrogen and phosphorus losses in overland
flow from a cattle-grazed pasture in Southland. New Zealand Journal of Marine
and Freshwater Research 46: 225-237.
Tate, K.W.; Atwill, E.R.; Bartolome, J.W.; Nader, G. (2006). Significant Escherichia
coli attenuation by vegetative buffers on annual grasslands. Journal of
Environmental Quality 35: 795-805.
Tate, K.W.; Pereira, M.D.G.C.; Atwill, E.R. (2004). Efficacy of vegetated buffers
strips for retaining Cryptosporidium parvum. Journal of Environmental Quality
33(6): 2243-2251.
Viaud, V.; Mérot, P.; Baudry, J. (2004). Hydrochemical buffer assessment in
agricultural landscapes: From local to catchment scale. Environmental
Management 34(4): 559-573.
8. Acknowledgements
We thank Mac and Lynda Pacey, and Barry Russell and Phillip Parker for their time,
enthusiasm, and allowing access to their farms. This research was funded by NIWA
Capability Fund (Rerewhakaaitu: CRBQ062/072) and Environment Bay of Plenty
(Kaharoa: BOP07207).

Contour grass filter strips: hydrology and water quality 32
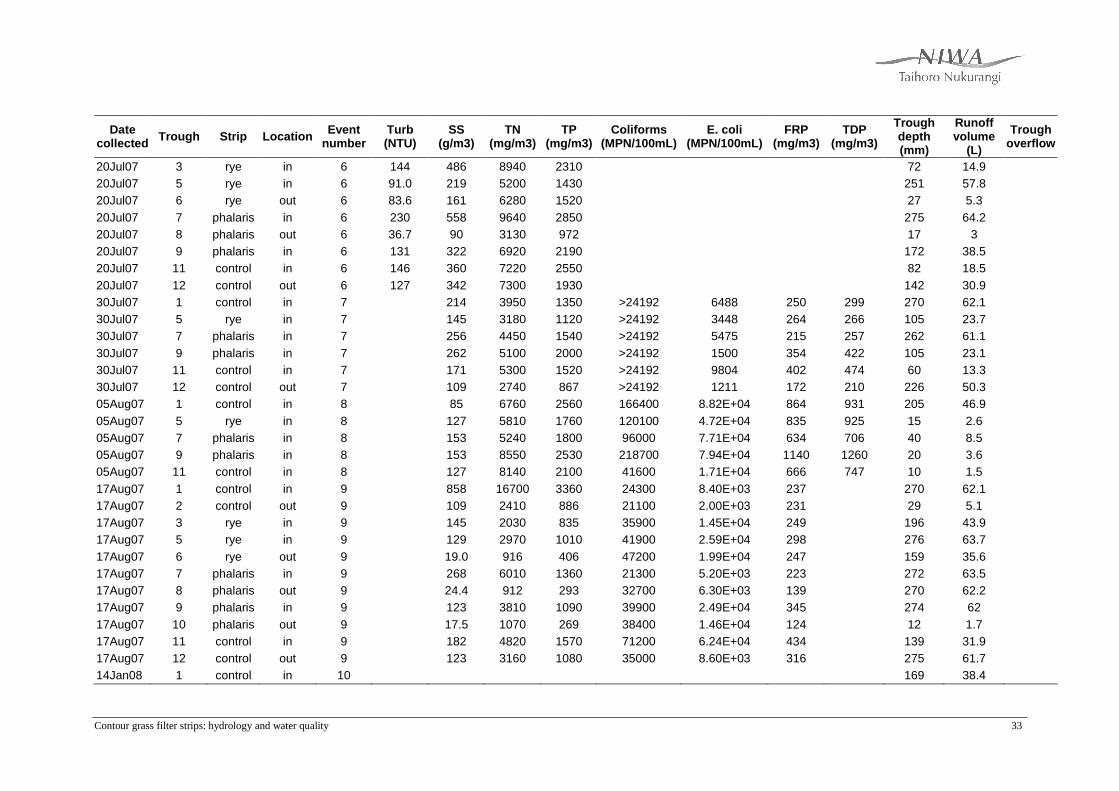
9. Appendix 1 – Kaharoa event water quality data (BOP07207)
Date collected Trough Strip Location Event
number Turb (NTU)
SS (g/m3)
TN (mg/m3)
TP (mg/m3)
Coliforms (MPN/100mL)
E. coli (MPN/100mL)
FRP (mg/m3)
TDP (mg/m3)
Trough depth (mm)
Runoff volume
(L)
Trough overflow
17Jan07 5 rye in 1 2.0 9.2 4500 1570 >2419.2 235.9 1400 55 12 17Jan07 6 rye out 1 2.2 7.6 1800 210 >2419.2 4.1 119 143 32 17Jan07 7 phalaris in 1 14.6 110 11600 5740 >24192 350 4900 20 3.7 17Jan07 9 phalaris in 1 5.2 47 8140 2940 >24192 2613 2710 35 7 30Mar07 1 control in 2 37.8 37 2320 1330 6131000 5.48E+06 1060 204 46.6 30Mar07 2 control out 2 8.1 11 1800 1060 >241920 1.55E+05 966 17 2.3 30Mar07 3 rye in 2 25.9 44 1500 1100 >241920 1.99E+05 836 119 25.9 30Mar07 5 rye in 2 25.3 27 1770 1020 >241920 1.99E+05 822 275 63.4 30Mar07 6 rye out 2 17.5 23 1670 739 1081000 8.13E+05 586 218 49.2 30Mar07 7 phalaris in 2 41.2 49 2360 1250 4884000 3.65E+06 950 273 63.7 30Mar07 8 phalaris out 2 27.6 35 3520 777 >2419200 2.42E+06 561 273 62.9 30Mar07 9 phalaris in 2 39.2 41 4480 1880 >2419200 1.99E+06 1620 273 61.7 30Mar07 10 phalaris out 2 19.7 22 2220 726 >2419200 1.73E+06 508 97 21.5 30Mar07 11 control in 2 46.6 45 3050 1830 3654000 3.08E+06 1470 42 9 30Mar07 12 control out 2 19.2 55 2320 885 1467000 1.08E+06 662 143 31.1 30Jun07 5 rye in 3 14.8 2046 10 15 2.6 30Jun07 6 rye out 3 9.4 3873 <10 30 6 30Jun07 11 control in 3 26.0 8670 3130 >241920 31300 10 1.5 30Jun07 12 control out 3 16.2 6650 1730 >241920 4800 20 2.7 06Jul07 1 control in 4 875 10400 6400 267 61.4 06Jul07 3 rye in 4 595 9930 4590 28 4.6 06Jul07 5 rye in 4 313 7980 3650 90 20.2 06Jul07 7 phalaris in 4 580 9560 6120 210 48.8 06Jul07 9 phalaris in 4 507 9840 7040 110 24.3 06Jul07 11 control in 4 765 11400 8630 57 12.6 06Jul07 12 control out 4 540 9510 5150 61 12.2 13Jul07 11 control in 5 428 11800 8580 0.3 13Jul07 12 control out 5 258 13900 4340 5 1.125 20Jul07 1 control in 6 135 428 9780 2370 275 63.3 20Jul07 2 control out 6 38.1 135 4160 1270 16 2.1
Contour grass filter strips: hydrology and water quality 33
Date collected Trough Strip Location Event
number Turb (NTU)
SS (g/m3)
TN (mg/m3)
TP (mg/m3)
Coliforms (MPN/100mL)
E. coli (MPN/100mL)
FRP (mg/m3)
TDP (mg/m3)
Trough depth (mm)
Runoff volume
(L)
Trough overflow
20Jul07 3 rye in 6 144 486 8940 2310 72 14.9 20Jul07 5 rye in 6 91.0 219 5200 1430 251 57.8 20Jul07 6 rye out 6 83.6 161 6280 1520 27 5.3 20Jul07 7 phalaris in 6 230 558 9640 2850 275 64.2 20Jul07 8 phalaris out 6 36.7 90 3130 972 17 3 20Jul07 9 phalaris in 6 131 322 6920 2190 172 38.5 20Jul07 11 control in 6 146 360 7220 2550 82 18.5 20Jul07 12 control out 6 127 342 7300 1930 142 30.9 30Jul07 1 control in 7 214 3950 1350 >24192 6488 250 299 270 62.1 30Jul07 5 rye in 7 145 3180 1120 >24192 3448 264 266 105 23.7 30Jul07 7 phalaris in 7 256 4450 1540 >24192 5475 215 257 262 61.1 30Jul07 9 phalaris in 7 262 5100 2000 >24192 1500 354 422 105 23.1 30Jul07 11 control in 7 171 5300 1520 >24192 9804 402 474 60 13.3 30Jul07 12 control out 7 109 2740 867 >24192 1211 172 210 226 50.3 05Aug07 1 control in 8 85 6760 2560 166400 8.82E+04 864 931 205 46.9 05Aug07 5 rye in 8 127 5810 1760 120100 4.72E+04 835 925 15 2.6 05Aug07 7 phalaris in 8 153 5240 1800 96000 7.71E+04 634 706 40 8.5 05Aug07 9 phalaris in 8 153 8550 2530 218700 7.94E+04 1140 1260 20 3.6 05Aug07 11 control in 8 127 8140 2100 41600 1.71E+04 666 747 10 1.5 17Aug07 1 control in 9 858 16700 3360 24300 8.40E+03 237 270 62.1 17Aug07 2 control out 9 109 2410 886 21100 2.00E+03 231 29 5.1 17Aug07 3 rye in 9 145 2030 835 35900 1.45E+04 249 196 43.9 17Aug07 5 rye in 9 129 2970 1010 41900 2.59E+04 298 276 63.7 17Aug07 6 rye out 9 19.0 916 406 47200 1.99E+04 247 159 35.6 17Aug07 7 phalaris in 9 268 6010 1360 21300 5.20E+03 223 272 63.5 17Aug07 8 phalaris out 9 24.4 912 293 32700 6.30E+03 139 270 62.2 17Aug07 9 phalaris in 9 123 3810 1090 39900 2.49E+04 345 274 62 17Aug07 10 phalaris out 9 17.5 1070 269 38400 1.46E+04 124 12 1.7 17Aug07 11 control in 9 182 4820 1570 71200 6.24E+04 434 139 31.9 17Aug07 12 control out 9 123 3160 1080 35000 8.60E+03 316 275 61.7 14Jan08 1 control in 10 169 38.4

Contour grass filter strips: hydrology and water quality 34
Date collected Trough Strip Location Event
number Turb (NTU)
SS (g/m3)
TN (mg/m3)
TP (mg/m3)
Coliforms (MPN/100mL)
E. coli (MPN/100mL)
FRP (mg/m3)
TDP (mg/m3)
Trough depth (mm)
Runoff volume
(L)
Trough overflow
14Jan08 3 rye in 10 20 2.7 14Jan08 5 rye in 10 122 27.6 14Jan08 7 phalaris in 10 201 46.6 14Jan08 9 phalaris in 10 170 38.1 14Jan08 12 control out 10 40 7.3 22Feb08 1 control in 11 4.2 7650 2480 40 8.1 22Feb08 2 control out 11 370 14000 38000 251 55.5 22Feb08 3 rye in 11 13 10200 3170 53 10.4 22Feb08 5 rye in 11 8 8280 3200 205 47.1 22Feb08 7 phalaris in 11 15 8550 2680 255 59.4 22Feb08 9 phalaris in 11 12 9370 2590 256 57.8 22Feb08 11 control in 11 210 22400 62400 50 10.9 22Feb08 12 control out 11 17 9750 2830 120 25.8 16Apr08 1 control in 12 78 2030 1070 >24192 15530.7 796 208 47.6 16Apr08 3 rye in 12 47 1920 798 >241920 155307 586 55 10.9 16Apr08 5 rye in 12 76 5740 1770 24191.7 17328.7 1340 91 20.4 16Apr08 6 rye out 12 5 0.2 16Apr08 7 phalaris in 12 30 2390 1190 >241920 241917 981 158 36.4 16Apr08 8 phalaris out 12 20 7920 3430 >24192 14136 2950 69 15.1 16Apr08 9 phalaris in 12 190 3950 1060 >241920 198628 889 107 23.6 16Apr08 11 control in 12 31 5200 832 >24192 19862.8 551 50 10.9 16Apr08 12 control out 12 170 3100 921 >2419200 461100 656 118 25.3

Contour grass filter strips: hydrology and water quality 35
10. Appendix 2 – Soil structure report