continuous improvement to the distribution of · pdf filecontinuous improvement to the...
TRANSCRIPT

Continuous improvement to the distribution of perishable goods for a food bank on the basis of its
physical space (Bin packing)
Ricardo Hernández-Santos 1, Alberto Ochoa2, Alberto Hernández3, Liliana Mar4
1Instituto Tecnológico Superior de Naranjos
2Maestría En Cómputo Aplicado, UACJ
3FCAeI, Universidad Autónoma del Estado de Morelos
Abstract
The present work shows how you can make the distribution of perishable foods, based on the classic model of
vehicle routing problem known as VRP to try to make continuous improvement with regard to the supply and/or
distribution of food products from the basic basket using the algorithm of the nearest neighbor. The distribution
of perishable foods of a particular company as is Diconsa has different restrictions and/or variants on the basis
of the VRP. As far as logistics of the distribution, the distribution and delivery, since the transport and its
capacity, up to the routes and the amount of vehicles that are required for compliance are of vital importance in
the companies and the aim is to show that the algorithm of the nearest neighbor with the Matlab software can
be used to solve problems in the distribution companies and finally the expected results are shown.
Key Words: Distribution of perishable foods, Matlab, PVR, algorithm of the nearest neighbor.
1. Introduction
Today the logistics is of vital importance for the provisioning process and/or distribution of products and/or
services, by what the establishment of routes for vehicles in the most optimal manner has generated a great
investigative interest. Has three subsystems that are: logistics of attorney: that has to do with the activities that
companies must undertake to procure the inputs for producing, internal logistics: you have to see how they are
produced to the inside of the company products and distribution logistics: arrive with the products to the
customers [3]. The problems of routing of vehicles commonly known as PVR, trying to solve problems such as
the one that is living in the real world as the distribution of products, the VRP comes from a family of problems
that has customers with demands, and a fleet that departing from cellar(s) along the distributing/collecting
products, Which aims at finding the optimal path for each vehicle in the tank and /or warehouse, complying
with the demand and restrictions of the customers, the capacity of having a fleet of vehicles homogeneous and
minimizing the total cost. In the management of operations one of the important areas of study is logistics,
which is often defined as the set of features that allow companies to get their products to the customers [1].
The problem of PVR is one of the most common in the optimization of logistics operations and is one of the
most studied today, for certain companies that distribute their products; it raises the search for the optimal
solution with different restrictions such as: Number of vehicles, its capacity, duty stations customers and
customer demand, among others, and one formulation of this type may include a large number of variables and
various parameters [5].Investigations have suggested a large number of models that cover the problem of the
VRP in order to improve the logistics performance. Do mention that the first problem was the VRP type of TSP
(traveling salesman problem) introduced by flood in 1956.Some of the first considerations of the generalized
TSP can be assumed as a VRP and can be seen as a CVRP (Capacited PVR), a routing problem vehicles where
the capacity of the fleet becomes a restriction for the formulation.
One of the functions of the CVRP is to minimize the total cost to distribute and/or take to all consumers, this
type of problem of CVRP, shows consumers they have an deterministic demand, in the identifications all
vehicles are equal and out of a distribution center. The CVRP found an exact quantity of paths with minimum
cost defined as the sum of the costs of the arcs belonging to the paths that will be under way in question to the
distribution, In such a way that each tour will visit the distribution center, that each center of consumption is
visited exactly by a vehicle and the sum of the demands of the Center for the consumption i to another center
of consumption j is equal to the cost of going from the center of consumption j to the center i [ 5]. The routing
problem vehicles naturally arises as the central problem in the fields of transportation, distribution and logistics

and distribution of the food bank of the perishable products of a fleet of vehicles based on its physical space
(bin packing), it is essential knowing their restrictions to distribute these products. Such is the case of the
company Diconsa, a company that is majority state, which belongs to the Social Development Sector and that
has the purpose of helping to overcome the food poverty, through the supply of commodities and
complementary to rural locations of high and very high marginalization.
It mentioned a list of products that are called (basket), which are: corn, table salt, beans, oats, rice pasta to soup,
standard sugar, wheat flour, corn flour, chocolate powder, edible vegetable oil, Biscuits Marias and topiary,
Tuna, laundry soap, sardine, soap, milk powder, toilet paper, canned Chiles, detergent powder, soluble coffee
and toothpaste [10]. There are several basic baskets, since various institutions, both public and private, can
generate and generate their own baskets and, depending on the purpose of the same can be classified as: a) real
baskets. Compiled from surveys on what people consumed daily and serves for the changes in the purchasing
power of wages and b) recommended baskets. Developed to indicate what to consume in order to achieve a
certain social welfare. The basic food basket, understood as a subset of the products included in the calculation
of the National Consumer Price Index, is a set of 82 products, which are determined on the basis of the National
Survey of Household Income and Expenditure (ENIGH), by the Institute National of Geographic e Informatic
(INEGI) [9].
Today, many institutions have problems to optimize and it is necessary the use of computational tools to solve
these problems, which are able to adapt to different scenarios and get good results without consume high
volumes of resources. This distribution will take you to have transport problems and to find a distribution in
such a way as to cover the demand of all customers within a certain number of routes [8]. However, there are
times that the allocation of the routes does not always lead to find the kittens already costs in the majority of
cases the problems are addressed without taking into account the optimization of the space within each vehicle
based on the accommodate the objects and/or articles that are transported, which is accomplished by using the
cvrp method [8]. Unos de los problemas de optimización es la distribución de objetos en contenedores
comúnmente conocido BPP, que por sus siglas en ingles se denomina Bin Packing problem y la asignación de
carga será representada como un BPP [4]. Bin packing or BPP (bin packing problem), is to pack n items
indivisible, pesos wi concrete, in the shortest possible number of boxes of finite capacity c.
In this issue of packaging there are numerous variants, it is understood is that it wants to minimize the ability
of a specific number of boxes, can be seen at two or three dimensions, etc. On the other hand mention that the
BPP has numerous applications in the present because it allows you to make, among other situations, the loading
of trucks with weight limitations, storage situations, and the design of pages of newspapers, among others [7].
MATLAB was developed in 1984 by Jack Little and Cleve grind those who founded the company The
Mathworks, inc. In Natick, Massachusetts [2]. MATLAB is a powerful system of very high level designed for
technical computation in same environment very easy to use calculations, displays and programming. Some of
the most common uses of computing technical are: Mathematical calculations, algorithm development,
modeling and simulation, data acquisition, data analysis, obtaining graphics, development of graphical user
interfaces, graphical programming with Simulink and interface with spreadsheets.
Matlab is the acronym stands for Matrix Laboratory and was originally developed to perform operations with
matrices. As well it can also be seen as a powerful programming language called language-m and an editor are
associated with Matlab. To the program files generated with this language they are known as files-m. This
programming language-m more powerful than languages such as FORTRAN, C, C, C#, Basic, or Visual Basic,
to mention some [2].
2. Mathematical Modeling of the VRP
The mathematical model most commonly used to represent this problem was proposed by Miller-Tuckin
Zemlin:

The routing problem vehicles is composed of two major types of very complex decisions which is the allocation
of customers to vehicles and establish the proper sequence of visit to the clients who must perform a seller or
vehicle (traveling salesman problem or TSP).
Figure 1. Simple solution of a VRP.
Some variants of the VRP are: [6].
CVRP, Routing problem Vehicles with Capacity
MDVRP, Routing problem Vehicles with Multiple Deposits
VRP periodic (PVRP)
SDVRP, Routing problem delivery vehicles Divided
SVRP, Routing problem Vehicles Stochastic
VRPPD, Routing problem Vehicles with pick ups and deliveries
VRPB, Routing problem Vehicles with Backhaul
VRPTW, Routing problem Vehicles with time windows

Due to the type of problem is CVRP selection for the distribution of a food bank to distribute food products
from the basic basket in delegations margins Guerrero state.
3. Methodology
The algorithm of the nearest neighbor was first introduced by J. G. Skellam, which used half of the instances
observed to determine if the data are grouped together. The bulk of the work done for this algorithm was made
by P. J. Clark and F. C. Evnas in 1954 and was in computer science, one of the first algorithms used to determine
a solution to the problem of the traveller. As a general rule, if the last steps in the path are comparable in length
to that of the first steps, the route is reasonable; if these are much higher, then it is likely that there are much
better roads.
4. Algorithm of the nearest neighbor
NumberOfRoutes=n
TotalDistance=TotalDistance
img = imread ('mapa.jpg.png'); %<==File name of your map min_x = 0; max_x = 100; min_y = 0; max_y = 100; x=Problem (:,2); y=Problem (:,3); figure x_min = min_x; x_max = max_x; y_min = min_y; y_max = max_y;
imagesc ([x_min x_max ], [y_min y_max], img);
%Colouring Line for tyt=1: n hold on shortestPath=Routes{1,tyt}; colour=mod(tyt,6); xd=[x(shortestPath)]; yd=[y(shortestPath)]; for i=2:length(shortestPath)-1
text(xd(i),yd(i),['Comedor A. ',num2str(shortestPath(i))]);
end
text(xd (1), yd(1),[' Banco De Alimentos ']); if
colour==1 plot (xd,yd,'-
cs','LineWidth',2,'MarkerEdgeColor','k',...
'MarkerFaceColor','g',...
'MarkerSize',10)
Plot(x(1),y(1),'MarkerEdgeColor','k',...
'MarkerFaceColor','k',...
'MarkerSize',10)
hold on elseif colour==3 plot(xd,yd,'-
ys','LineWidth',2,'MarkerEdgeColor','k',...
'MarkerFaceColor','y',... 'MarkerSize',10) plot(xd(1),yd(1),'MarkerEdgeColor','k',... 'MarkerFaceColor','k',... 'MarkerSize',10) hold on elseif colour==4 plot(xd, yd,'-ks','LineWidth',2,'MarkerEdgeColor','k',... 'MarkerFaceColor','w',... 'MarkerSize',10) plot(xd(1),yd(1),'MarkerEdgeColor','k',... 'MarkerFaceColor','k',... 'MarkerSize',10) hold on elseif colour==5 plot (xd, yd,'-bs','LineWidth', 2,'MarkerEdgeColor','k',... 'MarkerFaceColor','b',... 'MarkerSize',10) plot(xd(1),yd(1),'MarkerEdgeColor','k',...
'MarkerFaceColor','k',... 'MarkerSize',10) hold on elseif colour==0 plot(xd,yd,'-ms','LineWidth',2,'MarkerEdgeColor','k',... 'MarkerFaceColor','m',... 'MarkerSize',10) plot(xd(1),yd(1),'MarkerEdgeColor','k',... 'MarkerFaceColor','k',... 'MarkerSize',10) hold on
end end
Title (['Total Distance = ', num2str (TotalDistance),’ | Number of Routes = ', num2str (NumberOfRoutes)]);
Table 1. Displays the instances of (x, y)
Instances
Number of output x y Demand
1 52 55 0
2 76 66 10
3 73 74 15
4 79 64 10
5 80 60 20
6 80 55 30
7 78 73 10
8 80 78 20
9 74 56 30
10 86 77 20
11 85 68 25
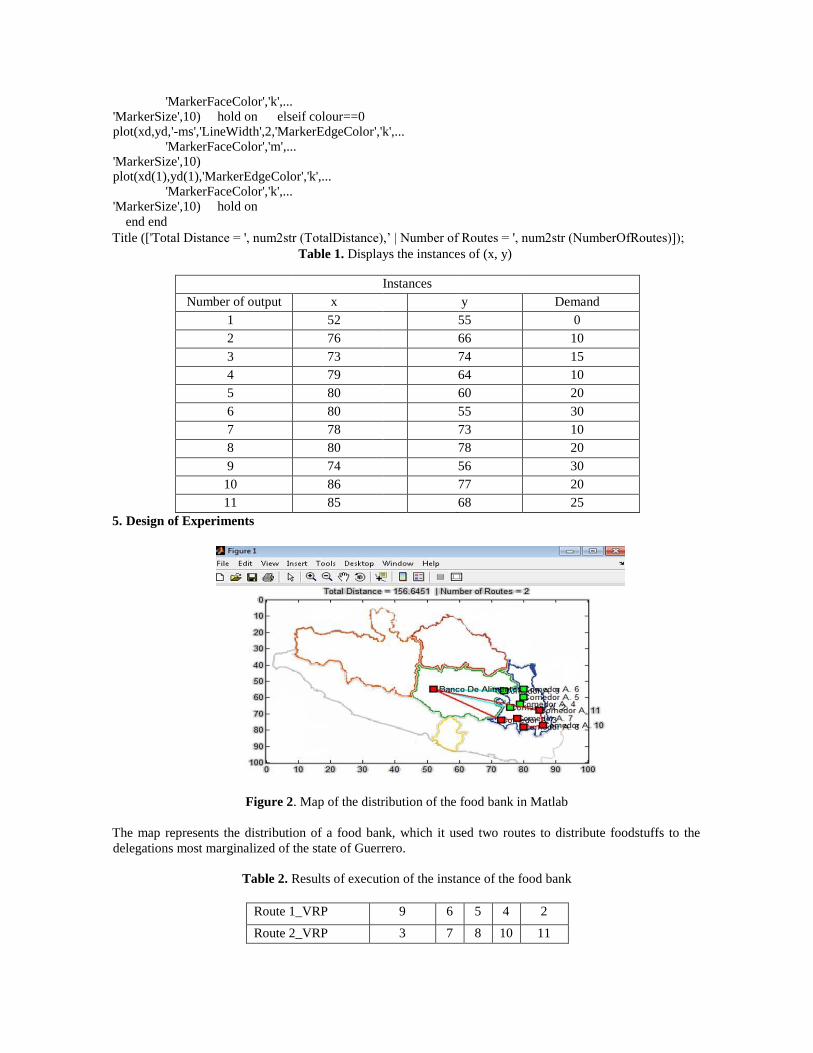
5. Design of Experiments
Figure 2. Map of the distribution of the food bank in Matlab
The map represents the distribution of a food bank, which it used two routes to distribute foodstuffs to the
delegations most marginalized of the state of Guerrero.
Table 2. Results of execution of the instance of the food bank
Route 1_VRP 9 6 5 4 2
Route 2_VRP 3 7 8 10 11

Vehicles 2
Capacity 12 Tons
Number of routes 2
Total Distance
156.6451
Figure 3. Closed Container-maximum capacity of 12 tons.
Program of the C ++ of Ant Colony to determine the total time for distribution to a food bank
include <stdio.h> #include
<math.h>
#include <stdlib.h>
#include <assert.h>
#include <time.h>
#include "common/rand.h"
//#define NUM_ANTS 1002
#define NUM_ANTS 11
#define NUM_CITIES 11
//#define NUM_CITIES 1002
//#define EDGE_SIZE 100
#define NUM_ITERATIONS (NUM_CITIES * 100)
#define BASE_PHEROMONE (double)(1.0 / (double)NUM_CITIES) const double alpha = 1.0; const double beta = 1.0; const double rho = 0.9;
const double qval = 60;
typedef struct {
int node; float x; float y; } CITY_T; typedef struct { int current_city; int next_city;
Loading
39 m 3
2.40 mts
34 cm
6.50 mts
2.50 mts

// unsigned char tabu[NUM_CITIES];
unsigned int tabu[NUM_CITIES];
int tour_index;
// unsigned char tour[NUM_CITIES];
unsigned int tour[NUM_CITIES];
double tour_length;
} ANT_T;
CITY_T cities[NUM_CITIES];
ANT_T ants[NUM_ANTS];
double pheromone[NUM_CITIES][NUM_CITIES];
double precomputed_distance[NUM_CITIES][NUM_CITIES];
int best_index; double best_tour = 100000.0; //double best_tour = 300000.0; void cargar (void)
{
FILE *fp;//apuntador de archivo register
int i;
int MAX=NUM_CITIES;
int x,y,z;
//se abre el archivo a280.tsp con permisos de escritura if((fp=fopen("a280.tsp",
"r"))==NULL){
printf("No se puede abrir el archivo.\n");
return;
}
Table 3a 11
Table 3b
delegations 11 delegations 60% of ants 60% of ants
Beta=1 Beta=1
Rho=0.9 Rho=0.95
Table 3c
Table
3d
11
delegations 11 delegations
Númber of runs Iteration Results
1 220 179.88
2 187 179.017
3 55 179.017
4 33 180.493
5 110 176.827
6 66 183.607
7 66 179.017
8 55 179.017
9 88 182.736
Númber of runs Iteration Results
1 44 183.607
2 154 182.736
3 88 179.017
4 66 183.607
5 594 179.017
6 33 179.88
7 1089 186.044
8 418 179.017
9 22 179.017

60%of ants
60% of
ants
Beta=5 Beta=5
Rho=0.9 Rho=0.95 Table 4a Table 4b
11
delegations 11 delegations
80% of ants 80% of ants
Beta=1 Beta=1
Rho=0.9 Rho=0.95
Table 4c
Table
4d
11
delegations 11 delegations
80% of ants 80% of ants
10 33 189.756 10 297 179.017
Númber of runs Iteration Results
1 33 179.017
2 33 179.017
3 55 179.017
4 11 179.017
5 44 179.017
6 88 179.017
7 22 179.017
8 22 179.017
9 44 179.017
10 33 179.017
Númber of runs Iteration Results
1 11 179.017
2 44 179.017
3 33 179.017
4 44 179.017
5 44 179.017
6 55 179.017
7 110 179.017
8 33 179.017
9 44 179.017
10 33 179.017
Númber of runs Iteration Results
1 66 179.017
2 396 183.607
3 33 179.017
4 319 179.888
5 22 179.888
6 132 176.827
7 33 185.45
8 44 179.017
9 99 179.017
10 88 176.827
Númber of runs Iteration Results
1 66 188.234
2 33 176.827
3 396 179.017
4 176 179.017
5 55 179.017
6 44 179.88
7 66 185.629
8 33 186.695
9 121 179.017
10 22 183.607

Beta=5 Beta=5
Rho=0.9 Rho=0.95 Table 5a Table 5b
11
delegations 11 delegations
100% of ants 100% of ants
Beta=1 Beta=1
Rho=0.9 Rho=0.95
Number of runs Iteración Results Number of runs Iteration Results
1 55 179.017 1 66 182.736
2 22 187.691 2 176 179.888
3 55 180.547 3 22 185.45
4 132 179.888 4 143 188.478
5 132 179.017 5 22 184.52
6 165 188.478 6 88 176.827
7 341 179.888 7 33 179.017
8 55 180.493 8 66 179.017
9 209 179.017 9 77 179.017
10 396 183.762 10 33 179.888
Number of runs Iteration Results
1 22 179.017
2 33 179.017
3 11 179.017
4 22 179.017
5 77 179.017
6 11 179.017
7 22 179.017
8 99 179.017
9 11 179.88
10 44 179.017
Number of runs Iteration Results
1 33 179.017
2 88 179.017
3 88 179.017
4 33 179.017
5 22 179.017
6 55 179.017
7 33 179.017
8 22 179.017
9 44 179.017
10 55 179.017

Table 5c
11 delegations
100% of ants
Beta=5
Rho=0.9
Table 5d
11
delegations
100% of
ants
Beta=5
Rho=0.95
Number of
runs
Iteration Results Number Iteration Results
1 33 179.017 1 33 179.017
2 22 179.017 2 88 179.017
3 55 179.017 3 33 179.017
4 22 179.017 4 187 179.88
5 22 179.017 5 11 179.017
6 33 179.017 6 33 179.017
7 220 179.017 7 66 179.017
8 44 179.017 8 66 179.017
9 275 176.827 9 44 179.017
10 11 179.017 10 44 179.017
Table 6 Summary of experiments
( instances of 11 delegations )
% of ants Beta Rho Iteration Results
60% 1 0.9 88 179.017
60% 1 0.95 110 176.827
60% 5 0.9 11 179.017
60% 5 0.95 33 179.017
80% 1 0.9 33 176.827
80% 1 0.95 132 176.827
80% 5 0.9 33 179.017
80% 5 0.95 22 179.017
100% 1 0.9 55 179.017
100% 1 0.95 88 176.827

100% 5 0.9 275 176.827
100% 5 0.95 33 179.017
The first column shows the percentage of ants, the values that were used were:
60% Ant = 6.6
80% Ant =8.8
100 Ant=11
The second column shows the values of the variable beta, which are 1 and 5. Third column shows the values of
the variable rho, which are 0.9 and 0.95. The fourth column shows that iteration is found the optimum result of
the tour. The last column shows the result of the optimal tour.
Remarked The results show the best of all the experiments. On the basis of these results it was found that the
best values for beta, rho and the percentage of ants:
Beta = 5
Rho = 0.9
Percentage of ants =100%
Time of the distribution of the 2 paths is 176,827 with a total distance of 156.6451 with a maximum load of 12
tons.
6. Conclusions and future reserch
In the present work was carried out a problem that is within the field of study of the logistics that the PVR with
a mathematical formulation of the nearest neighbor in the software using Matlab, which made it possible to
reach the optimal solution for the distribution of a food bank and to determine the time of distribution program
was used for the C to determine the total time and distance was obtained with the Matlab software.
Significantly was demonstrated the results with the use of a mathematical model as it is the nearest neighbor
that can be used to reduce the solution of many VRP variants with regard to the Bin packing.
The problem of routing of vehicles is presented in a food bank of Diconsa distributor which is located in the state of Guerrero that distributes its products in the basket to the delegations of the mountain which have a
social status quite marginalized.
During this work only consider to distribute the products of the basic basket of a food bank considering 2
delegations of the state of Guerrero, however were not considered the time windows, nor much less the costs
that will be generated during the distribution of such products. For future work is to continue with the
implementation of the PVR and with its various restrictions.
7. Acknowledgments
First I thank God for letting me in that I've been given this opportunity to come to this summer scientific in this
city of Cuernavaca Morelos at the Universidad Autónoma del Estado de Morelos, on the other hand my family
mainly to my lord father Severo Hernández Castillo and my lady mother Aristea Santos Francisco , Dr. Alberto
Ochoa, Dr. Alberto Hernandez , to my colleagues who were also in this course as it is Maria Guadalupe ,
Fernando, Marlene , Eric Joel as well also i thank the higher technical institute of Naranjo’s for having made
the invitation to come to this summer scientific.
8. References

[1] Aida Calviño Martinez “Cooperation in the problems of the traveler (TSP) and routes of vehicles (VRP): an
overview”, Santiago de Compostela, to June 28 of 2011.
[2]David Báez López, Ofelia Cervantes Villagómez” Matlab with applications to engineering, physics and
finance" 2nd edition, Alfaomega Group Editor, Mexico, September 2012.
[3]. Garey, M.R., Johnson, D.S.: Computer and intractability: a Guide to the Theory of
NPCompleteness, WH Freeman, New York 1979.
[4] Isc. Diana Maritza Nieto Yáñez, “Hybridization of metaheuristicos algorithms for bin packing
problems", Cd Madero, Tam. Mexico December of 2007.
[5] Rocha, L.; González, C. y Orjuela, J. (2011). “A revision to the state of the art of the routing problem
vehicles: historical evolution and methods of solution”. In: Engineering, Vol. 16, No. 2, P. 35 – 55.
[6]Leonora Bianchi, Mauro Birattari, Marco Chiarandini, Max Manfrin y Monaldo Mastrolilli, “Metaheuristics
for the Vehicle Routing Problem with Stochastic Demands”, Lecture Notes in Computer Science, Vol 3242,
2004, pp 450-460.
[7] Mª del Carmen Delgado, Pablo Cortés, Alejandro Escudero, Jesús Muñuzuri, “A tabu search for the
Bin Packing Problem”, International Conference on Industrial Engineering & Industrial Management - CIO
2007.
[8] W. W. Garvin, H. W. Crandall, J.B. John y R. A. Spellman, “Aplications of Linear Programming in the
Oil Industry”, Management Science, Vol.3, 1957, pp 407. Mencionado por Prawda, J. (2002).
[9]http://www.inegi.org.mx/est/contenidos/Proyectos/INP/Default.aspx?_file=ponderadoresencadenamiento.x
lsx.
[10]http://www.diconsa.gob.mx/index.php/transparencia/transparencia-
focalizada/serviciosyproductos/productos-canasta-basica.html.