contents · the maruti model: features and ... the value chain as a determinant of competitiveness...
TRANSCRIPT

vii
Contents
List of Figures and Tables xii
List of Appendices xiv
Acknowledgements xv
Acronyms xvii
Currency Exchange Rates xix
1 Introduction 1
The infrastructure debate: practioners versus academics 3
Moving beyond the debate 6
Developing a new analytical framework 6
Supply-side variables – technological indivisibilities 8and institutional arrangements
Impact – external economies and direct benefits 10Response – user-devised strategies to offset impacts of 12poor infrastructure
Putting together the supply–impact–response framework 14
The focus of inquiry and unit of analysis 15The Indian automobile industry 18The major case study: Maruti-Suzuki 20Structure of the book 23
2 Innovative strategies for tackling power problems 28
The main arguments 29
The power problem and conventional solutions 30
The power problem in India 30The government’s new approach: encourage private investment 31and self-generation
World Bank’s critique of self-generation 32The Bank’s solution: unbundling and private competition 32

Maruti upgrades from generators to captive plant 35Selecting gas turbines: a revolutionary technology 36Negotiating access to natural gas 37
Demolishing the myth of high self-generation costs 38
(a) Maruti’s price compares favorably with IPPs 39(b) Maruti’s low cost is not unique – a comparison 43
with Nigerian and Indonesian firms(c) Self-generation meets demand for quality at low cost 44(d) Maruti’s energy expenditures are lower than 47
other assemblersSelf-generation as a preferred alternative 49
Maruti’s power-sharing arrangements 51
Supplying power to adjacent joint-venture suppliers 52Selling electricity to the state grid 53Expanding the customer pool 54
India’s largest car maker runs an efficient electric utility 55
Transmission and distribution system 55Billing and collection 57Tariff structure, sales revenue, and a “cross subsidy” 58for HSEB
The Maruti model: features and insights 59
How unreliable power affects supply chains 60and competitiveness
Output losses and disruptions in production plans 60Loss of material and variation in product quality 61Inventories as a “solution” to supply-chain unpredictability 62Impacts cascade through the supply chain 62
Conclusion 63
3 Effects of poor transportation on industrial 77competitiveness
Transportation and competitiveness: insights 78from the literature
Development practitioners’ view of India’s 78transportation problem
The value chain as a determinant of competitiveness 80
viii Contents

Lean production, supply-chains, and just-in-time delivery 81Transportation systems: the missing variable in the 84competitiveness literature
Combining insights from different strands of literature 85The total logistics cost equation as an analytical approach 86
Case study: Maruti’s logistics costs 87
Maruti’s supply and distribution chains and its 87transportation demand
Effect of the transportation system on logistics costs 88Freight expenditures 89Cost of goods damaged in transit 89How the transportation system affects inventory levels 90Struggling to get lean: Maruti’s inventory problem 92The “fat” is in the supply chain 93The international supply chain is anything but lean 95
The domestic supply chain: only local suppliers 99can deliver JIT
Ford’s logistics plan and insights into transportation 99problems
Inventories increase with distance: some quantitative 102evidence
The correlation between distance and inventories 103
Conclusions 105
4 Clustering as an infrastructure solution 112
Maruti’s localization strategy and the 115creation of a Delhi auto district
Maruti’s mandate, its location decision, and creation 115of a local supply base
Encouraging suppliers to cluster near its assembly plant 119Facilitating localization: Maruti’s supplier park and 121“incentives package”
Are the incentives exceptional? 125The “model” supplier-park deal and why government 126also wins
Positive spillovers: Gurgaon as a diversified 129industrial district
Summarizing the benefits of clustering 130
Contents ix

Ford, Hyundai, and the growth of the Chennai auto district 133
Ford’s location decision 133Ford’s transportation solutions: logistics planning 135and localization
Hyundai’s localization strategy 136
The emerging geography of production 137
The geography of the US auto industry 137How and why the geography of production differs in India 140
5 The supply–impact–response framework 145
Introduction 145
Recapitulating and explaining the findings 147using the framework
Solving the power problem 148
Captive self-generation is a solution that works well 148Self-generation combined with power sharing works better 150
Solving the transportation problem 152
Transportation impacts: it’s not just freight 152costs that matter
Assemblers’ response: logistics planning and clustering 154Comprehensive transport solutions are 156not easy to implement
Identifying better infrastructure solutions 158Partnering with the state: better solutions, broader benefits 159
The Maruti–HSIDC partnership offers lessons for 160industrial park development
The Maruti–HSEB partnership creates a replicable 161power solution
The state as a “developmental” deal-maker 164
6 Conclusions and policy implications 165
Ameliorating infrastructure problems: 168a non-traditional approach
x Contents

Contents xi
Proposed industrial infrastructure approach for India 168An alternative industrial targeting strategy 169
Notes 172
References and Selected Bibliography 188
Index 194
1
1Introduction
Industrial firms in developing countries have to contend with acuteshortages of physical infrastructure. Users in many of these countriesface problems such as “brownouts and blackouts in power systems,intermittent water supplies from municipal systems, long waiting peri-ods for telephone service connections, and increasing traffic conges-tion” (World Bank 1994a: p. 7). Not only has the quantity of publicinfrastructure stock and services failed to keep pace with demand, butthe quality of the service that gets provided also is often poor. As aresult, the subset of industrial users with access to public infrastructurestill have to contend with highly unreliable and poor quality service.Nonetheless, industrial firms in developing countries do manage toproduce and survive without access to infrastructure, such as reliableelectric power and freight transportation systems. Indeed, in countriessuch as China and India, industrial firms appear to be not just surviv-ing but also thriving, and often competing successfully in world mar-kets, despite severe infrastructure deficiencies.
This book examines the paradox of increasing industrial develop-ment and improving industrial performance in the face of severe – and,allegedly, worsening – deficiencies in physical infrastructure. It isimportant to resolve this paradox because it lies at the center of adebate between the new academic literature and development “practi-tioners,” in particular, governments of developing countries and agen-cies such as the World Bank. On the one hand, the new academicliterature fails to show conclusively that good infrastructure correlateswith better industrial performance, and the precise links between infra-structure and development remain open to debate (Gramlich 1994;World Bank 1994a). On the other hand, the practitioners – while noting

that the evidence from the literature is inconclusive – continue tobelieve that good infrastructure is critical for industrial competitivenessand economic growth, and are earmarking billions of dollars for addi-tional infrastructure investments (e.g., India Infrastructure Report 1996;World Bank 1994a). That is, the practitioners are allocating scarce pub-lic and private resources to ameliorating the infrastructure “problem”without really understanding how and in what ways, if at all, infra-structure affects industry. This study offers a way to bridge this gap inour understanding and build a more differentiated view of the linksbetween infrastructure and industrial performance. Specifically, it analyzes the infrastructure “black box” and focuses on the questions:How does poor infrastructure, in particular, unreliable power and inad-equate freight transportation systems, affect the costs and competitive-ness of firms? How do firms cope?
The illustrative case study is the automobile industry in India, whichhas been growing rapidly at a time when the Indian government, inter-national lending agencies, the media, and analysts have been empha-sizing that the country is experiencing an infrastructure “crisis.”1 Thisanalysis shows not only that infrastructure is a key variable affectingthe performance of firms but also – and more importantly – how andthrough what mechanisms infrastructure affects industrial perfor-mance and competitiveness. Precisely because infrastructure is a criticaldeterminant of performance, firms often devise ingenious solutions toinfrastructure problems. Their solutions include, but are not limited to,self-provision of infrastructure. This study dissects some of these user-devised innovations – it analyzes why they were required, how theywork, and the role that the government has played in facilitating theirimplementation and enhancing their effectiveness.
Overall, this analysis helps improve our understanding of the linksbetween infrastructure and industrial performance in three ways. First,it provides some insights into the nature of the infrastructure problemand demand for services from the perspective of industrial users them-selves. These insights suggest how we might link infrastructure andproductivity in academic studies, and how practitioners can better target the problem. Second, it reveals how industry copes with infra-structure deficiencies and which solutions work well and why. It, thus,identifies a set of non-traditional infrastructure solutions that policy-makers can use in conjunction with more traditional ones. Third, itoffers some lessons on how governments and industry can partner inthe process of improving infrastructure provision and, thereby, inenhancing industrial development more generally.
2 Innovating with Infrastructure

Introduction 3
The infrastructure debate: practitioners versus academics
Physical infrastructure, broadly defined, produces basic services with-out which primary, secondary, and tertiary productive activities cannotfunction. Physical infrastructure includes transport, electric power,telecommunications, water, sanitation, and waste disposal. It is oftenreferred to as economic infrastructure to distinguish it from socialinfrastructure, which produces services such as health, education, andlaw and order. The discussion below – and, in general, this book –focuses on the debates surrounding physical infrastructure.
Development practitioners – policymakers, governments of develop-ing countries, and international lending agencies – believe that poorinfrastructure is a key bottleneck to industrial development and eco-nomic growth (e.g., India Infrastructure Report 1996; World Bank 1994a).To ameliorate these deficiencies, developing countries invest aboutUS$200 billion a year – four percent of their national output and a fifthof their total investment – in new infrastructure (World Bank 1994a).Nonetheless, development practitioners argue that this is not suffi-cient, that governments need to aim for higher levels of investment ininfrastructure and for higher levels of quality in the services that areprovided.
India’s approach to the infrastructure problem is illustrative of howgovernments of developing countries tend to perceive and address theissue. The India Infrastructure Report (1996), a policy document preparedby a government-appointed expert committee, offers some insights.The report starts with the belief that “the availability of infrastructureis imperative for overall economic development.” It calculates thatinfrastructure investments need to increase from their current level of5.5 percent of GDP to about 7.0–8.0 percent of GDP. In absolute terms,this translates into a target of US$330–345 billion in new infrastructureinvestments over the ten-year period 1996–2006. The report developsthe policy approaches and mechanisms through which the govern-ment can achieve these investment targets. It singles out one sector ofthe economy – the industrial sector – for special targeting while thenew approaches to infrastructure provision are being implemented.
Such analyses and efforts by governments of developing countriesare strongly supported and, often, led by international developmentagencies, such as the World Bank. Indeed, according to the WorldDevelopment Report (World Bank 1994a), it is critical for developingcountries to focus on infrastructure investments and capital stock andon the quality of infrastructure services in the economy because
“the adequacy of infrastructure helps determine one country’s successand another’s failures … (and) good infrastructure raises productivityand lowers production costs” (p. 2).
By contrast, much of the recent academic literature appears to beliethe notion that infrastructure is strongly correlated with industrial pro-ductivity or national growth. The following discussion delineates howthe infrastructure issue is perceived in three different strands of acade-mic literature, that is, the macroeconomic literature on growth andindustrialization, the more micro literature on industrial performance,and a set of macro-level regression studies focusing on the correlationbetween infrastructure and industrial productivity.
The new literature on industrialization in developing countries andmacroeconomic growth pays minimal attention to physical infrastruc-ture and its potentially important role in industrial investment, growth,and competitiveness. For example, few of the analyses of the East Asianindustrialization “miracles,” such as South Korea and Taiwan, highlightinfrastructure as a component of these success stories (e.g., Amsden1989; Wade 1990; World Bank 1994b).2 Even mainstream neoclassicalmacroeconomics and growth theories appear to be moving away fromtheir traditional emphasis on capital accumulation and infrastructureinvestment as the engine of economic growth. Indeed, the “new”growth theories stress the relative importance of human capital, tech-nological ability, and knowledge spillovers as key variables that affecteconomic growth, and contend that these variables might help explainthe lack of convergence between the growth rates of developing andadvanced industrialized countries (e.g., Romer 1994; Solow 1994).
Similarly, the literature on industrial performance and productivity,despite its micro level and firm-specific research, fails to identify physi-cal infrastructure as a variable in determining performance. Rather, thisliterature focuses on “softer” variables – such as management attitudeand aptitude, assembler-supplier relations, industrial relations, andinter-firm networks – and argues, albeit implicitly, over their relativesalience in explaining industrial success and dynamism.3 For example,the lean production model identifies management attitude as the keyvariable affecting performance (Womack, Jones and Roos 1990).4 Bycomparison, the literature on industrial districts attributes the compet-itiveness of small firms, grouped in particular locations, to the exis-tence of strong networks among these firms (Piore and Sabel 1984;Sengenberger and Pyke 1991). These networks – usually, horizontalrelations between a core of more-or-less equal small enterprises – allow
4 Innovating with Infrastructure

specialization and subcontracting which, in turn, induce efficiency andpromote collective capability (see Humphrey 1995).5
A flurry of infrastructure studies, focusing on advanced industrializedcountries, has failed to rekindle a broader academic interest in the infra-structure question, perhaps because the results have been ambiguous.Since David Aschauer (1989) started a debate by arguing that the slow-down in productivity in the United States during the 1970s could beexplained by the slowdown in infrastructure investment, economistshave conducted more than 40 macro-level regression studies. Thesestudies focus explicitly on the links between infrastructure and industrialproductivity and, generally, examine this relationship at the national,regional, or state level in advanced industrialized countries. Specifically,these studies deploy different econometric techniques to analyze therelationship between infrastructure (measured in terms of either invest-ment or public capital stock) and economic growth or industrial outputor production costs.6 In his review essay, Gramlich (1994) argues thatthese macro-level studies are inconclusive, that is, there is no persuasiveevidence that public infrastructure is correlated with higher industrialproductivity in advanced industrialized countries.7
In sum, there is an implicit conflict between the new academic litera-ture and the development practitioners over the role that infrastructureplays in determining industrial performance and, by extension, theextent of industrial demand for public infrastructure. The new macro-level academic literature on economic growth and industrialization indeveloping countries does not focus on the infrastructure question. Andthe micro-level literature on industrial performance, including that onlean production and industrial districts, does not identify infrastructureas a key variable in determining performance. Finally, recent academicregression studies that focus on the links between infrastructure andindustrial productivity (primarily in advanced industrialized countries)are inconclusive. Overall, the new academic literature does not suggestthat there are any strong links between infrastructure and industrialperformance and does not shed much light on the types of connectionsthat may exist between the two.
The practitioners continue to assume that economic growth andindustrial competitiveness suffer in the face of infrastructure deficien-cies. They are, thus, focusing on how the quantity and quality of infra-structure can be improved by restructuring or altering service provisionarrangements. Apart from financing additional infrastructure invest-ments and trying to improve incentives for government-owned utilities,
Introduction 5

the practitioners are also devising ways to encourage private firms tofinance and manage these investments. In other words, the practition-ers are spending billions of dollars in ameliorating supply-side con-straints, creating new policies and institutional arrangements tofacilitate infrastructure restructuring, and worrying about solving theinfrastructure problem – especially for industry – without understand-ing the nature of the problem or the perspective of industrial users.
Moving beyond the debate
The practitioners and the academics are partially right. The practition-ers are right in assuming that infrastructure affects competitiveness,but they may be making serious mistakes in estimating the extent ofthe infrastructure gap and in selecting their solutions, policies, and pri-orities. The academics are right in finding that public infrastructureand productivity may not always be strongly correlated, but they maybe wrong in their interpretation of the result. This study reaches con-clusions that stand counter to much conventional wisdom because itdevelops and uses a new analytical framework to examine the infra-structure problem and relies on a different methodology and unit ofanalysis to understand how infrastructure – in particular, electric powerand freight transportation systems – affects the costs and competitive-ness of firms and how they cope.8
Unlike previous studies that examine individual firms in differentindustries, this study focuses on firms in one industry and broadensthe unit of analysis to include the supply chain of a firm. It empiricallyexamines the infrastructure problems that industrial users face, howthese deficiencies affect their performance, and the solutions that firmsdevise. It is through an inductive analysis of these data that this studyattempts to reveal the multiple – direct and indirect – mechanismsthrough which infrastructure affects industrial performance, to explainhow firms survive without access to public infrastructure, and to iden-tify features of infrastructure services that play a particularly importantrole in determining competitiveness.
Developing a new analytical framework
This section develops a framework that helps analyze, first, the mecha-nisms through which a deficient infrastructure service imposes costson firms and, second, how we would expect firms to act given theproblems in that service. This framework represents one approach tounderstanding, at the micro or firm level, both the impact of and
6 Innovating with Infrastructure

response to inadequacies in different types of infrastructure services. Inthis book, I show how the framework works in the case of two infra-structure problems, that is, power and freight transportation; arguably,it can be used to explain outcomes in the case of other infrastructureservices, such as water supply, as well.
The framework has three components (see Figure 1.1). For a particu-lar infrastructure service and a given firm, we need to examine the fol-lowing three issues: (a) the “supply-side” variables that structure theprovision of the service; (b) the “impact” that this service has on afirm, that is, the direct and external benefits/costs that it creates; and(c) the “response” or the strategies that firm devises to offset inadequa-cies in that service. Each of these components of the framework – for
Introduction 7
User or firmresponse to poor
service
– Technology– Institutions– Service and equipment providers
Direct andexternal costsand benefits
Influences firm demandfor public infrastructure
Impact
Supply-side factors
Response
Influences firm demandfor infrastructure
Figure 1.1 The supply–impact–response framework: understanding a firm’sdemand for infrastructure

convenience the “supply–impact–response” framework – is discussed inturn below. The framework is built by combining insights from earlydevelopment theory with those from the more recent literature oninfrastructure restructuring that examines alternative arrangements forsupply of infrastructure services.
Supply-side variables – technological indivisibilities and institutional arrangements
The technology and institutional arrangements through which aninfrastructure service is supplied together determine the quantity andquality of service provided. The technology embodied in productionand provision determines the extent of technical “indivisibilities” andscale economies in that service. As we will see below, the concepts ofindivisibilities, scale economies, and institutional arrangements lie atthe center of both old and new ideas about how infrastructure shouldbe supplied and the arguments over government versus market provi-sion of services. We bring these concepts into our new theoreticalframework and, unlike the existing literature, which uses them to makearguments about the supply side of the infrastructure equation, we usethem to understand the demand side of the equation. The discussionbelow, therefore, leads to the first component of the theoretical frame-work and involves, specifically, an examination of how these concepts –the extent of scale economies and indivisibilities, and the institutionalarrangements for service provision – shape industrial demand for infra-structure and influence user-responses to poor service.
Infrastructure or “social overhead capital” can be defined as:
… comprising those basic services without which primary, sec-ondary, and tertiary productive activities cannot function. In awider sense, it includes all public services from law and orderthrough education to transportation, communications, power andwater supply, as well as agricultural infrastructure such as irrigationand drainage systems. (Hirschman 1958)
Hirschman (1958) argues, however, that the hard “core” of the con-cept of social overhead capital can probably be limited to transporta-tion and power because the technology embodied in the provision ofthese services is characterized by technical indivisibilities (lumpiness)as well as by a high capital–output ratio.9 By definition, a commodityis indivisible if the minimum size at which it is available is large – forexample, to carry any freight from New York to Chicago, a railroad
8 Innovating with Infrastructure

must lay a rail track that is about 1000 miles long.10 The need for indi-visible equipment (as in the railroad example) is the source of largefixed costs, and indivisible inputs by nature yield economies of scaleand scope. A key problem with indivisibilities is that they serve as animpediment to efficient pricing and, in particular, make marginal costpricing unprofitable. For early development theorists, the existence ofindivisibilities and large scale economies in power and transport –combined with the fact that they produce large benefits for otherindustries and various sectors of the economy – creates an exception-ally strong argument for according high priority to these investmentsand also for government provision of these services.11
According to the more recent literature on infrastructure restructur-ing, two fundamental changes are forcing revisions in how infrastruc-ture is perceived and how it is provided. First, changes in technologyare reducing the economies of scale in such services as power genera-tion and telecommunications, making it possible for multiple suppliersto coexist. Simultaneously, computers and information technology arecreating unprecedented possibilities, such as the ability to create “spotmarkets” for electricity and to collect tolls electronically, thereby, making it easier to check free-riders and ameliorate other market failuresin infrastructure provision.
Second, innovations in institutional arrangements and regulatoryframeworks – often pioneered by and tested in advanced industrializedcountries – are making it possible to unbundle or separate differentaspects of service provision and to introduce competition into varioussegments. In the case of electricity, for example, it is now both techni-cally and institutionally feasible to separate generation, transmission,and distribution. Once unbundled, it is feasible to treat each service segment independently, to allow different public and private entities toown each of the components, and to introduce competition in manyof these service segments. Thus, it is now technically and institution-ally feasible to not treat different types of infrastructure, even coreinfrastructure, as a monolithic system with high indivisibilities andlarge scale economies. For proponents of restructuring, this means it istime to move away from public and private monopolies and towardinfrastructure markets where multiple suppliers compete with eachother.
Changes in supply-side variables – new technological and institu-tional developments – are altering old perceptions and constraintsassociated with core infrastructure. The restructuring literature focuseson how these developments are driving or should drive a revolution in
Introduction 9
who supplies infrastructure. But it fails to note that these develop-ments are also affecting industrial demand for public infrastructure.For example, as scale economies fall, industrial users may find it cheapto opt for self-provision and lower their demand for publicly providedservice. Similarly, new institutional and regulatory arrangements thatfacilitate unbundling and allow for a greater menu of supply-side solu-tions involving private participation also create the space for a new setof user responses; thus, it is possible for industrial users to enter intonew types of contracts and infrastructure deals with other firms as wellas government agencies.
In sum, the first component of the supply–impact–response frame-work involves an examination of how changes in supply-side variables –the technology and institutional arrangements – affect industrial users,specifically, how these alter industrial demand for infrastructure and the strategies that industrial users can devise to cope with poor infrastructure.
Impact – external economies and direct benefits
Theories in development economics during the 1940s and 1950semphasized that the external economies associated with infrastructureare key to understanding its importance and role in industrialization ofdeveloping countries. By contrast, the new literature tends to focus onquantifiable direct benefits of infrastructure. The “impact” segment ofthis framework includes both the direct benefits and external economiesand shows how these together shape not only the demand for infra-structure but also the responses to inadequacies in service. Thus, a morecomplete examination of the type and magnitude of the benefits/costsforms the second component of the theoretical framework.
Early development theorists, such as Rosenstein-Rodan (1963) andRostow (1963), have argued that social overhead capital is a prerequi-site for industrial investment, which, in turn, is the engine of eco-nomic growth. Their main rationale lies in their notion of externaleconomies. In the narrow, modern sense in which they are currentlyused, external economies in production include the unpaid side effectsof one producer’s output or inputs on other producers (New Palgrave1987: p. 261). (For example, external economies arise in a case where a dam constructed by a hydroelectric plant eliminates flooding offarmers’ crop fields.) For early development theorists, however, exter-nal economies included both unpaid and paid (or price) effects – technological and pecuniary external economies, respectively – of producer activities.12 These theorists argued that the external economies
10 Innovating with Infrastructure

of social overhead capital – that is, its complementarity with other indus-tries or its forward and backward linkages13 – were particularly largerelative to the direct benefits that these infrastructure investments created (Rosenstein-Rodan 1963; Scitovsky 1963; Singer 1984). Hence,“investment in social overhead capital is advocated not because of itsdirect impact on final output but because it permits and, in fact,invites directly productive activities [or industrial investment] to comein” (as summarized by Hirschman 1958).
While early development theory emphasized the broader impacts orexternal economies of infrastructure rather than its direct benefits andimpact on final output, much of the recent infrastructure literaturetends to focus only on the direct benefits of more and better infrastruc-ture services. This is particularly true for the macro econometric studiesthat focus on the links between infrastructure and industrial productiv-ity.14 It is also true for the work done by practitioners. Although practi-tioners argue strongly that infrastructure has broad impacts, theythemselves rely on narrowly defined direct benefits as the basis forselecting among different infrastructure projects. Further, because it ishard to assess all types of direct benefits, both academic analyses andpractitioners’ project feasibility studies tend to measure only those thatare most obvious and more easily quantifiable.
For example, in evaluating the benefits of the stock of transportationinfrastructure, such as roads, academic regression studies measurewhether or not this stock is related to changes in a particular depen-dent variable, such as an industry’s unit costs of production (e.g., Nadiriand Mamuneas 1994) or the total industrial output in a particular stateor region (e.g., Munnel 1990, cf. Munnel 1992). Similarly, practitioners,such as those at the World Bank, select transport projects on the basisof a single benefit, that is, savings in vehicle operating costs that arelikely to result from improved road infrastructure. But both the acade-mic and the practitioner are, usually, unable to capture or isolate theeffects of other direct benefits resulting from attributes such as greaterspeed, freedom from seasonality, smaller risk of loss, and direct rout-ing.15 For instance, these studies tend to ignore the possibility thatgreater speed and regularity of transportation can combine to reducethe average amount of inventory required per unit, and this, in turn,reduces the amount of tied up working capital. These are direct bene-fits, but they may not be captured in the variables that are measured.That is, a direct benefit, such as lower inventory costs, may not trans-late into a reduction in freight prices or savings in vehicle operatingcosts or even a reduction in the unit costs of production. In other
Introduction 11

words, newer studies appear to take a narrow view of the benefits asso-ciated with infrastructure, and it is exceptionally narrow when com-pared to the view adopted by early development theorists.
The assessment of “impact” – direct and external costs/benefits – represents the second part of the framework. Specifically, it involvesidentification of the types of direct benefits and external economies16
of infrastructure (or, conversely, the direct and external costs imposedby poor infrastructure) that affect industrial users, the magnitude ofdirect versus external costs/benefits, and whether certain kinds ofcosts/benefits are more pertinent than others at the firm level. Gettingbetter quantitative estimates on costs or benefits, alone, will not, how-ever, help us understand how it is that certain industries and areas con-tinue to grow in the face of severe infrastructure deficiencies. For this,we need to examine the coping strategies that firms devise.
Response – user-devised strategies to offset impacts of poor infrastructure
The third component of the framework calls for an analysis of theresponses, solutions, or coping strategies that industrial firms devise tolimit the adverse impact of poor infrastructure. Such an inductive analy-sis is important not only because it is likely to shed light on how firmssurvive without access to reliable infrastructure but also because it islikely to reveal how firms perceive the problem, the relative importancethey attach to different kinds of costs, and the priorities that they set indevising solutions. The literature provides limited insights into howfirms are likely to respond to infrastructure deficiencies, and this compo-nent offers a point of departure from current thinking on infrastructure.
In his classic The Strategy of Economic Development, Hirschman (1958)outlined two paths to providing infrastructure or social overhead capi-tal – the excess capacity approach, in which infrastructure investmentleads industrial demand, and the shortage approach, in which infra-structure investment follows demand. Hirschman argued against thethen-dominant excess capacity approach and, hence, against thenotion that infrastructure investment is a prerequisite to industrialinvestment. He presented the shortage approach as an alternative pathto infrastructure development, and argued that infrastructure can fol-low industrial demand.
The shortage approach to infrastructure, Hirschman argued, is moreeconomical and less prone to mistakes. Poor infrastructure may nothave a serious adverse impact on dynamic industrial centers (andindustries) because firms in these areas will not fail to invest in
12 Innovating with Infrastructure

infrastructure, such as power and transportation. Further, these glaringshortfalls in social overhead capital, and pressure from the firms with“large unmet demands,” will force government to invest in infrastruc-ture and ameliorate the situation. Thus, the sequence in which infra-structure investment leads industrial investment could well be reversedwithout causing undue damage because industry will devise creativeresponses, such as opting for self-provision and/or forcing governmentto step in and close the gap between demand and supply of infrastruc-ture. For Hirschman, then, development via the infrastructure shortageapproach represented a self-correcting imbalance, and was unlikely tolead to industrial stagnation. In fact, an extreme outcome like stagna-tion is conceivable “only in a community whose behavior has becomethoroughly irrational and where creative responses have been chokedoff” (Hirschman 1958: p. 97).
In hindsight, we know that many developing countries have de factofollowed a shortage approach, but that governments have not reallybeen able to close the infrastructure gap (e.g., World Bank 1994a).Empirical observations as well as infrastructure literature suggest thatself-provision is almost ubiquitous in developing countries, and thatindustrial firms invest in their own power generators, captive powerplants, tubewells, and water treatment plants. This is seen as a problem,however, because these investments often entail high capital and oper-ating costs. Some studies have found, for example, that the unit costs ofself-provision are several times higher than the unit costs that resultfrom efficient public utilities (World Bank 1994a; Lee, Anas and Oh1996). Other forms of private provision – where unregulated privateproviders have entered the infrastructure business to fill gaps in govern-ment provision – also tend to entail high costs and inefficiencies. Forexample, water supplied by water vendors tends to cost users severaltimes more than the prices charged by public water utilities (e.g.,Briscoe et al. 1990; Whittington et al. 1991). Similarly, private operatorsof bus services often charge higher prices for providing service in areaswith inadequate public transportation. Thus, both self-provision andmany forms of unregulated private provision are considered moreexpensive and less efficient than efficiently provided public services.
Overall, infrastructure shortages have been more severe and less self-correcting than those that Hirschman had in mind, and, according torecent literature, self-provision and certain other forms of private provi-sion have been expensive and inefficient. Yet, developing countries con-tinue to boast of dynamic areas and industries. Have the responses ofindustrial users, perhaps, been far more creative than even Hirschman
Introduction 13

anticipated? Or has industry been able to force government to step inand provide infrastructure, but only in certain areas and industries? Areself-provision and other user-devised solutions, perhaps, more efficientand cost-effective than the literature admits? Do user-devised solutionscreate external economies and, if so, can firms act to internalize some ofthese benefits? It is these questions that the third component of thesupply–impact–response framework attempts to answer. Specifically, the“response” component involves a detailed analysis of some user-devisedsolutions to gain an insight into the menu of potential responses toinfrastructure problems and the extent to which these are, indeed,short-term, inefficient, and high-cost solutions.
Putting together the supply–impact–response framework
The three components of the framework – supply-side variables, thenature and magnitude of impact that a service has on a firm, and theresponse that a firm devises – interact to shape the outcome (Figure 1.1).That is, they determine together the extent to which deficiencies in aninfrastructure service affect the performance of industrial firms. At thecore of the supply–impact–response framework lies the following set ofarguments or propositions:
� Supply-side variables. The ability of firms to respond depends on,among other things, supply-side variables. The supply variables alsodetermine the nature and scale of adverse impacts on a firm becausethey affect the quality and quantity of service.
� Impact. The willingness of firms to respond to deficiencies in a par-ticular infrastructure service depends, in part, on the extent of theadverse impacts – the direct costs and external diseconomies –caused by weaknesses in that service. The higher and/or more obvi-ous the negative impacts, the stronger the incentives for a firm todevise a response to the problem.
� Response. The extent and effectiveness of firm responses, in turn,determine the net impact of poor service on a firm.
This framework, then, provides one approach to understanding howan infrastructure service is likely to affect an industrial user and to pre-dicting how this user might respond to service inadequacies.
Extending previous conceptual models
Neither the pieces of the framework nor the complementarity among itsparts is entirely new. Rather, two of its components – supply technology
14 Innovating with Infrastructure

and costs imposed by poor infrastructure – build directly on ideas fromthe early and new literature. In fact, theorists use these two componentstogether to make their arguments about how infrastructure should beperceived and how it should be provided. Thus, early development the-orists argued for government provision because of indivisibilities in thetechnology combined with their notion of large external economies asso-ciated with infrastructure. More recently, proponents of restructuringargue that there is no longer a rationale for government provisionbecause economies of scale have fallen and because direct benefits ofinfrastructure are large enough to encourage investment by privateproviders. It is possible to unbundle, privatize provision, and create mar-kets for infrastructure services.
The framework in this study extends previous conceptual models inthree ways: First, it reintroduces old concepts and uses them in combi-nation with new ideas and developments to analyze infrastructureissues. Taken together, these concepts offer a more complete frameworkfor examining the links between infrastructure and competitivenessand for analyzing and understanding empirical observations, such asthose in this study.
Second, this framework includes an important concept that both theearly and recent literature underrate – that industrial users devisestrategies to cope with poor infrastructure and these are, potentially,highly innovative and efficient solutions. It is due to the introductionof this component – user responses to poor infrastructure – that theframework begins to lead to a different understanding of the infrastruc-ture problem and possible solutions.
Third, by opting for a user perspective, this framework reverses theway in which previous models set up the infrastructure problem andtry to resolve it. Specifically, existing literature argues about the extentto which markets might fail in providing services and, hence, abouthow the supply side of the market should be organized to mitigatethese failures. By contrast, this framework examines the types of prob-lems that industrial users actually face when infrastructure provision ispoor, and uses their understanding to identify the more debilitatingsupply side failures that need to be fixed. It then identifies somelessons on how these infrastructure problems could be fixed.
The focus of inquiry and unit of analysis
The discussion in the previous section suggests that any study attempt-ing to link infrastructure with industrial performance should try to
Introduction 15
capture both the direct benefits and the external economies of infra-structure. This calls for an analytical approach that lies in between themicro and the macro approaches – that is, it needs to be larger than aset of individual firms to allow us to capture external economies, butsmaller than a whole region or the national economy to allow for agood assessment of the direct benefits. Further, the analytical approachneeds to be sufficiently micro to allow analyses of firm-level responsesto infrastructure problems. In this study, then, the focus of inquiry is aparticular industry, and the unit of analysis is the firm and its supplychain. This section discusses, in greater detail, the rationale for thisanalytical approach.
In selecting industry as the focus of inquiry, I borrow from the litera-ture on industrial performance and competitive strategy, which arguesthat firms compete within industries (and not in states or nations), andthat competitive advantage is won or lost at the industry level (Porter1990). The illustrative case in this study is the automobile industry inIndia. The next section presents a brief overview of the industry, buthere it is important to note some of the reasons for focusing on auto-mobiles. First, the auto industry has grown rapidly, in fact, significantlyfaster than Indian industry as a whole, despite severe infrastructure constraints. Second, there is no apriori reason for believing that thisindustry is exceptionally sensitive to the quantity or quality of infra-structure services and, hence, it might offer lessons that can be general-ized to other manufacturing industries. Third, competition in thisindustry is getting increasingly intense, due to the entry of severalworld-class auto assemblers into the market, and this allows us theopportunity to examine whether and how infrastructure is a variable indetermining differential performance among firms. Fourth, there is anextensive literature on the auto industry in developing and advancedindustrialized countries that serves as an important base for comparingand contrasting the findings on the Indian auto industry. This lastadvantage is worth emphasizing. The existence of this literature meansthat we know rather well what we should expect to see in the Indianauto industry, and we can be relatively confident about the extent towhich the findings in this study are unique or general.
The unit of analysis in this study is the firm and its supply chain.The supply chain of a firm can be defined as the network of suppliersthat provides the inputs – in particular, the parts and raw materials –needed to manufacture its product. A detailed firm-level analysis allowsfor a better understanding of the direct benefits of infrastructure, andan analysis of the supply chain allows for an examination of how
16 Innovating with Infrastructure

infrastructure might affect the external economies in the system. Thejustification for selecting this unit of analysis comes, first, from the lit-erature on international competitiveness and, second, from the autoindustry itself.
The literature on strategy and industrial competitiveness emphasizesthat efficient and well-managed “value chains” are critical in determin-ing competitive success in global industry (e.g., Porter 1990; Gereffiand Korzeniewicz 1994). According to Porter (1990), “a firm’s valuechain is an interdependent system or network of activities, connectedby linkages. Linkages occur when the way in which one activity is per-formed affects the costs or effectiveness of other activities.” The valuechain, or “commodity chain” as it is referred to by authors such asGereffi and Korzeniewicz (1994), comprises the sequential stages ofinput acquisition, manufacturing, distribution, marketing, and con-sumption.17 The better the firm organizes each of these stages and thegreater the value that it creates, not just in each activity but in thechain as a whole, the better its performance and competitiveness.
In the automobile industry, the efficiency and effectiveness of thesupply chain, that is, the first stage of the value or commodity chain inwhich the inputs are acquired and organized, is particularly critical forgood performance. This is because the automobile industry is charac-terized by complex supply chains where hundreds of suppliers providethe thousands of parts required in a single vehicle. This means that thesupply chain accounts for a majority of the expenses of auto assem-blers and its organization represents, perhaps, the most complex taskin producing a vehicle (see Womack et al. 1990). In the Indian autoindustry, for example, the supply chain accounts for about 62–78 per-cent of total expenditures by auto assemblers (see Chapter 3, Figure 3.1).Cost data for supplier firms shows similar trends. For example, for asample of nine supplier firms, parts and raw materials procured fromtheir sub-suppliers accounted for 49–84 percent of their total costs (seeChapter 3, Figure 3.2). In other words, differential performance of autoassemblers depends not just on the performance at their own plantsbut on the collective capability of their entire production network – inparticular, on the efficiency of their supply chains.
In summary, the focus of inquiry in this study is the Indian automo-bile industry and the unit of analysis is the auto assembler and its sup-ply chain. Specifically, this study examines the mechanisms throughwhich poor infrastructure affects the costs of auto assemblers and theefficiency of their supply chains, and how assemblers act to offset theseadverse impacts. By examining supply chains, and not just plant-level
Introduction 17
performance of individual firms, this study aims at identifying thenature and magnitude of at least a subset of the external economiesassociated with infrastructure.
The Indian automobile industry
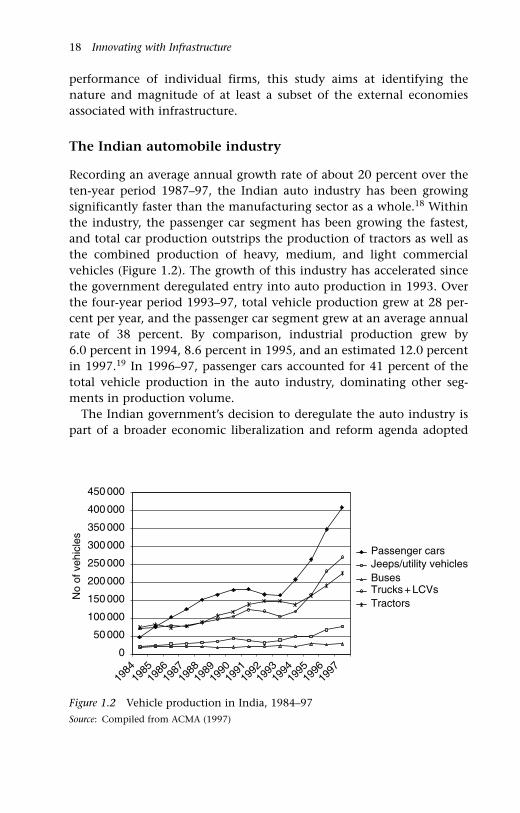
Recording an average annual growth rate of about 20 percent over theten-year period 1987–97, the Indian auto industry has been growingsignificantly faster than the manufacturing sector as a whole.18 Withinthe industry, the passenger car segment has been growing the fastest,and total car production outstrips the production of tractors as well asthe combined production of heavy, medium, and light commercialvehicles (Figure 1.2). The growth of this industry has accelerated sincethe government deregulated entry into auto production in 1993. Overthe four-year period 1993–97, total vehicle production grew at 28 per-cent per year, and the passenger car segment grew at an average annualrate of 38 percent. By comparison, industrial production grew by 6.0 percent in 1994, 8.6 percent in 1995, and an estimated 12.0 percentin 1997.19 In 1996–97, passenger cars accounted for 41 percent of thetotal vehicle production in the auto industry, dominating other seg-ments in production volume.
The Indian government’s decision to deregulate the auto industry ispart of a broader economic liberalization and reform agenda adopted
18 Innovating with Infrastructure
0
50 000
100 000
150 000
200 000
250 000
300 000
350 000
400 000
450 000
1984
1985
1986
1987
1988
1989
1990
1991
1992
1993
1994
1995
1996
1997
No
of v
ehic
les
Passenger carsJeeps/utility vehiclesBusesTrucks + LCVsTractors
Figure 1.2 Vehicle production in India, 1984–97
Source: Compiled from ACMA (1997)
in 1991 in response to a balance of payment crisis. By 1993, the gov-ernment had not only deregulated entry into the auto industry butalso had jettisoned the use of licenses to control output levels and sig-nificantly reduced import tariffs on auto components. Prior to thesereforms, there were only four car assemblers in the country, andMaruti-Suzuki, the leader held a 62 percent share in the passenger carmarket.20 Following deregulation, 12 foreign firms entered the market.The players include most of the major car companies in the world,such as Mercedes-Benz, Ford, General Motors, Honda, Toyota, Fiat,Hyundai, and Daewoo. Together, these assemblers made commitmentsfor new investments amounting to several billion US dollars. Analystsestimated that these investments would boost India’s annual produc-tion capacity to about 1.2 million vehicles by 2000, up from 325 000passenger cars and utility vehicles in 1995.
In contrast to the projected production capacity of 1.2 million cars,domestic demand was projected to reach only about 0.5 to 0.8 millioncars in 2000.21 In general, supply is expected to exceed demand for carswidely, and increasing competition is forcing assemblers to restructureto lower costs and improve quality.22 The projected excess supply situa-tion also means that assemblers have to compete successfully not onlyin the domestic market but also perhaps in international markets toutilize their production capacities fully and maintain economies ofscale. To improve their competitiveness, auto assemblers are adoptingproven strategies, such as lowering the cost of their assembly opera-tions, rationalizing their supply base, moving from cost plus to targetprices for components, and attempting to institute just-in-time produc-tion systems.
The rapid and seemingly unfettered growth of the passenger carindustry makes it a good candidate for examining the following kindsof questions: How do the infrastructure inadequacies plaguing thenation as a whole affect auto firms? Do these firms have different levelsof access to good infrastructure? If so, does differential access to ser-vices play a role in determining differential performance of firmswithin the industry? To answer these questions, I examine and com-pare the operations of, and infrastructure strategies adopted by, severalcar assemblers in India – including Maruti-Suzuki, Ford, Hyundai,Daewoo, and Telco – and 23 auto component firms that supply one ormore of these assemblers. The detailed case study is Maruti-Suzuki andits supply chain; the next section provides some background on thisfirm and presents the primary reasons for selecting it as the major casefor analysis.
Introduction 19

The major case study: Maruti-Suzuki
Maruti-Suzuki is India’s largest carmaker and has been the undisputedmarket leader in the passenger car segment since the mid-1980s. It hasalso maintained a stellar performance record since its inception.Created in late 1982 as a joint venture between government of Indiaand the Suzuki Motor Company of Japan, Maruti began full scale pro-duction in 1984–85. Within two years, Maruti had gained a 50 percentshare of the car market and its share has been steadily increasing. By1996–97, Maruti had increased its share to an astonishing 81 percent inthe face of increasing competition from several world-class auto assem-blers that had entered the Indian market (Figure 1.3).
For the government of India – the partner with 74 percent of theequity at inception – the main goal of creating Maruti was to push forthe modernization and expansion of the country’s small and anti-quated auto industry. In 1983–84, the year before Maruti started fullscale operations, total car production in the country was about 47 000vehicles, and these models were technically obsolete. Through theMaruti project, the government was aiming to introduce the latest carproduction technology, to increase vehicle production, and to developalmost from scratch a modern, indigenous auto components base forpassenger cars. Maruti started production with a new Suzuki model andwas required to increase output to 100 000 cars over five years. Further,
20 Innovating with Infrastructure
Figure 1.3 Maruti dominates the Indian passenger car industry, 1988–97
Source: Compiled from ACMA (1997) and company annual reports
81%75%75%
62%59%
0
50 000
100 000
150 000
200 000
250 000
300 000
350 000
400 000
450 000
1988 1989 1990 1991 1992 1993 1994 1995 1996 1997
Tot
al v
ehic
le p
rodu
ctio
n in
Indi
a (n
o.)
0
10
20
30
40
50
60
70
80
90
Mar
uti's
mar
ket s
hare
(%
)
India – production volume Maruti's market share

it was mandated to increase the local content in its Japanese product to95 percent over the same period, and for this it needed to create adomestic supply base within five years.
Maruti is credited with having catalyzed and led the modernization ofthe Indian passenger car industry since its inception. Over the nextseven years, investments in the passenger car industry increased, com-bined output grew more than threefold from 47000 in 1984 to 190000in 1991, and several new models were introduced. At the same time, the(nominal) value of production in the auto components industry alsoincreased three fold (ACMA 1997).23 By 1991, Maruti’s own productionhad grown to 123000 vehicles, the local content of its best-selling modelhad reached its target level of 95 percent,24 and the assembler hadincreased its market share in the passenger car segment to 62 percent.25
In 1991–92, a balance of payment crisis caused the government toadopt a plan aimed at economic liberalization. The changing economicenvironment resulted in two major consequences for Maruti. First, in1992, the government allowed Suzuki to increase its equity stake to 50 percent. This changed Maruti’s status from a state-owned enterprise(SOE) to a private firm that, despite 50 percent government ownership,did not need to follow bureaucratic rules – for example, on employ-ment, salaries, and investment – by which SOEs have to abide. Second,by 1993, the national economic liberalization program and specificreforms, such as declining import duties on auto components andelimination of entry barriers, were transforming the nature and extentof competition within the passenger car industry. Specifically, severalof the world’s major auto companies decided to enter the Indian mar-ket and are now competing directly with Maruti.
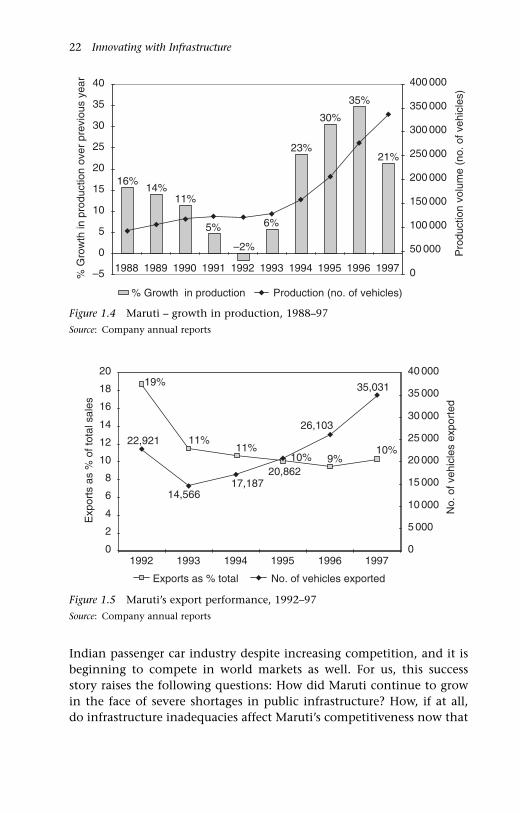
In response to deregulation and increasing competition, Marutiadopted an aggressive expansion program. It more than doubled (almosttripled) its production over six years, increasing output from 123000vehicles in 1990–91 to 340000 vehicles in 1996–97 (Figure 1.4). Over thesame period, it increased its market share from 62 percent to 81 percent(Figure 1.3),26 and its sales revenues for the year 1996–97 reached US$2.2 billion. Maruti started exporting in 1992, and its export volumehas risen slowly but steadily from 14500 vehicles in 1993 to 35000 vehi-cles in 1997 (Figure 1.5). Over the five-year period 1992–97, exportsaccounted for an average of about 10 percent of Maruti’s total vehiclesales and sales revenue. In 1997, Maruti was installing additional capac-ity that would allow it to assemble a half-million cars by 2000.
The discussion above suggests that Maruti has performed exception-ally well in its first 15 years. The assembler continues to dominate the
Introduction 21
Indian passenger car industry despite increasing competition, and it isbeginning to compete in world markets as well. For us, this successstory raises the following questions: How did Maruti continue to growin the face of severe shortages in public infrastructure? How, if at all,do infrastructure inadequacies affect Maruti’s competitiveness now that
22 Innovating with Infrastructure
Figure 1.4 Maruti – growth in production, 1988–97
Source: Company annual reports
16%
23%
30%
35%
21%
6%5%
14%11%
–2%
–5
0
5
10
15
20
25
30
35
40
1988 1989 1990 1991 1992 1993 1994 1995 1996 1997
% G
row
th in
pro
duct
ion
over
pre
viou
s ye
ar
0
50 000
100 000
150 000
200 000
250 000
300 000
350 000
400 000
Pro
duct
ion
volu
me
(no.
of v
ehic
les)
% Growth in production Production (no. of vehicles)
Figure 1.5 Maruti’s export performance, 1992–97
Source: Company annual reports
19%
11%11%
10% 9%10%
22,921
14,56617,187
35,031
26,103
20,862
0
2
4
6
8
10
12
14
16
18
20
1992 1993 1994 1995 1996 1997
Exp
orts
as
% o
f tot
al s
ales
0
5 000
10 000
15 000
20 000
25 000
30 000
35 000
40 000
No.
of v
ehic
les
expo
rted
Exports as % total No. of vehicles exported
the firm is competing directly with world-class producers in both itshome market and in world markets? What infrastructure problemsaffect Maruti and how does the firm cope? The study focuses on thesequestions and compares findings at Maruti with observations at othermajor car assemblers, in particular, Ford, Hyundai, Daewoo, and Telco.
Structure of the book
Each chapter in this book is a self-contained piece and can be readindependently. Chapters 2 and 3 focus on power and transportationissues, respectively. They analyze the problem from the perspective ofindustrial firms and examine the solutions that the firms have devisedto offset infrastructure problems. Chapter 4 presents the “clustering”solution to the infrastructure problem and reveals some of the linksbetween infrastructure and development of industrial clusters. Theclustering strategy is presented in a separate chapter because it hasimplications for the nature and geography of industrial developmentand because it is a broader solution that can help offset the problemsassociated with different infrastructure deficiencies, including poorpower, transportation, and water supply. Although Chapters 2, 3, and 4discuss many of the concepts that underlie the supply–impact–response framework, these chapters can be read without understandingthe framework itself.
Chapter 5 returns to the supply-impact-response framework and usesit to bring together the empirical observations presented in Chapter 2,3, and 4. Chapter 5 demonstrates how the framework serves as a toolfor infrastructure analysis and for distinguishing between good andbad solutions. It highlights the role that governments have played inhelping firms devise some superior infrastructure solutions. Chapter 5also serves as an executive summary.
Chapter 6 presents the broader conclusions and implications of thestudy. It suggests that governments can take a non-traditional approachto ameliorating infrastructure problems for industry and explores whatan alternative strategy might look like.
Introduction 23

Appendix 1.1 Study methodology
The unit of analysis in this study is the firm and its supply chainwithin a specific industry. This unit of analysis allows for an examina-tion of the direct and some of the indirect or external mechanismsthrough which poor infrastructure affects the performance of firms. By contrast, previous studies have tended to select random samples offirms from different industries; have examined only a subset of thedirect costs imposed on firms by poor infrastructure; tended to ignoreany external effects, including those on the efficiency of firm networksand supply chains; and have, often, aggregated results at the macro(state or national) level.27
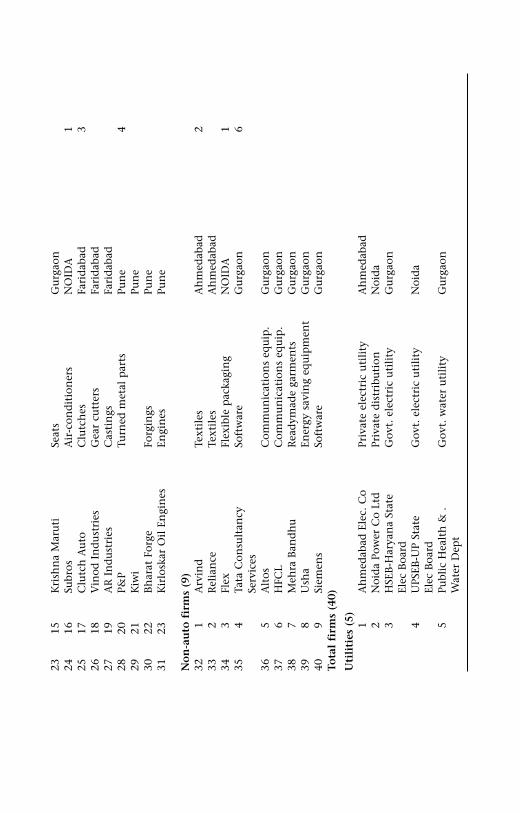
This is an empirical study, and it takes an inductive approach. It isbased on a combination of quantitative data on costs with qualitativedata from semi-structured interviews with firms. Primary data wasgathered from a total of 31 auto firms – 23 component suppliers andeight assemblers.28 The major case study is of Maruti-Suzuki – thelargest and most successful passenger car assembler in India – and itssupply chain. The study also includes less detailed case studies of Ford,Hyundai, Daewoo, and Telco. These case studies are designed to allowfor some comparative analysis. All of the suppliers that were selectedsupply either to Maruti and/or another major car assembler. Of the 23supplier plants, 13 are located near Delhi (nine in Gurgaon, one inNoida, three in Faridabad), six in Chennai, and the remaining four inPune. (Table A1.1 presents a list of all firms included in the study.)Apart from auto firms, the study involved visits to and interviews withthe following:
� Government officials in local, state, and central agencies. Of thelocal/state agencies, the state industrial development corporations(SIDCs) in Haryana and Uttar Pradesh (UP) are particularly impor-tant. The central agencies and research institutes include theNational Council for Applied Economic Research, Ministry of UrbanDevelopment, National Institute of Urban Affairs, and the Centerfor Policy Research;
� Senior managers of the Association of Indian Auto Manufacturers(AIAM) and Auto Component Manufacturers’ Association (ACMA);
� Managers of nine non-auto firms (in various different industries) to ascertain the extent to which some of the findings are industry-specific; and
� Four electric power utilities and one water utility.
24 Innovating with Infrastructure
The major data sources used in this study are personal interviews,company annual reports, specific data that the firms provided uponrequest, data published by AIAM and ACMA, Government of IndiaStatistics, and articles in Indian newspapers and magazines.
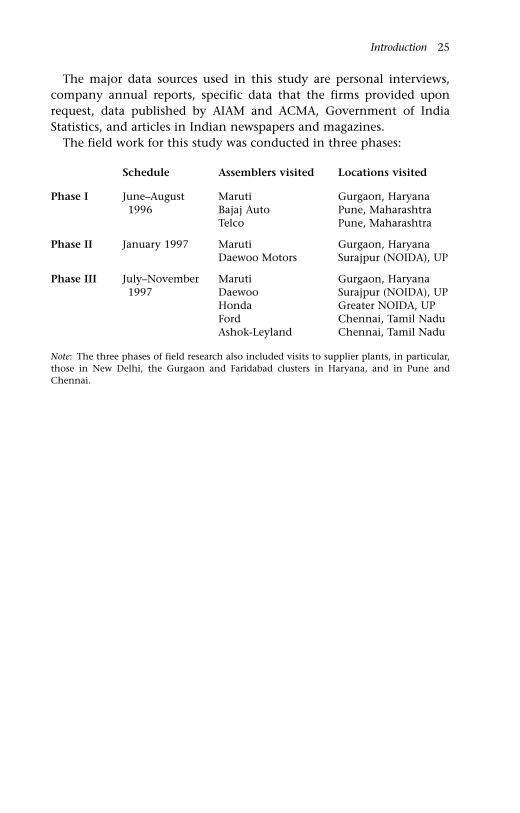
The field work for this study was conducted in three phases:
Introduction 25
Schedule Assemblers visited Locations visited
Phase I June–August Maruti Gurgaon, Haryana1996 Bajaj Auto Pune, Maharashtra
Telco Pune, Maharashtra
Phase II January 1997 Maruti Gurgaon, HaryanaDaewoo Motors Surajpur (NOIDA), UP
Phase III July–November Maruti Gurgaon, Haryana1997 Daewoo Surajpur (NOIDA), UP
Honda Greater NOIDA, UPFord Chennai, Tamil NaduAshok-Leyland Chennai, Tamil Nadu
Note: The three phases of field research also included visits to supplier plants, in particular,those in New Delhi, the Gurgaon and Faridabad clusters in Haryana, and in Pune andChennai.

Tabl
e A
1.1
List
of
firm
s in
clu
ded
in
stu
dy
S.n
oFi
rmSe
gmen
t/m
ain
pro
du
cts
Loca
tion
By
loca
tion
Ass
emb
lers
(6
��2)
1M
aru
tiPa
ssen
ger
cars
G
urg
aon
2D
aew
ooPa
ssen
ger
cars
G
reat
er N
OID
A3
Hon
da
Siel
Pass
enge
r ca
rs
Gre
ater
NO
IDA
4FO
RD
Pass
enge
r ca
rs
Ch
enn
ai5
Hyu
nd
aiPa
ssen
ger
cars
C
hen
nai
6Te
lco
Tru
cks,
bu
ses,
car
s Pu
ne
7A
shok
-Ley
lan
dTr
uck
s, b
use
sC
hen
nai
8B
ajaj
Au
to
2-w
hee
ler
veh
icle
sPu
ne
Au
to c
om
po
nen
t su
pp
lier
s (2
3)9
1Lu
cas-
TV
SEl
ectr
ical
sC
hen
nai
610
2Lu
cas-
FIE
Fuel
in
ject
ion
eq
uip
men
tC
hen
nai
113
Ran
e B
rake
Lin
ings
Bra
ke l
inin
gsC
hen
nai
124
Sun
dar
am B
rake
Lin
ings
Bra
ke l
inin
gsC
hen
nai
135
Sun
dra
m F
aste
ner
sFa
sten
ers,
rad
iato
r ca
ps
Ch
enn
ai14
6R
ane
(Mad
ras)
Ch
enn
ai15
7So
na
Stee
rin
g St
eeri
ng
colu
mn
Gu
rgao
n9
168
Lum
axEl
ectr
ical
sG
urg
aon
179
Dyn
amic
Up
hol
ster
yG
urg
aon
1810
Ju-s
hin
Shee
t m
etal
par
tsG
urg
aon
1911
Mu
nja
l Sh
owa
Shoc
k ab
sorb
ers
Gu
rgao
n20
12Su
n V
acPl
asti
c m
ould
ings
Gu
rgao
n21
13B
har
at S
eats
Seat
sG
urg
aon
2214
Mar
k A
uto
Fuel
tan
ks,
axle
sG
urg
aon
2315
Kri
shn
a M
aru
tiSe
ats
Gu
rgao
n24
16Su
bros
Air
-con
dit
ion
ers
NO
IDA
125
17C
lutc
h A
uto
Clu
tch
esFa
rid
abad
326
18V
inod
In
du
stri
esG
ear
cutt
ers
Fari
dab
ad27
19A
R I
nd
ust
ries
Cas
tin
gsFa
rid
abad
2820
P&P
Turn
ed m
etal
par
tsPu
ne
429
21K
iwi
Pun
e30
22B
har
at F
orge
Forg
ings
Pun
e31
23K
irlo
skar
Oil
En
gin
esEn
gin
esPu
ne
No
n-a
uto
fir
ms
(9)
321
Arv
ind
Text
iles
Ah
med
abad
233
2R
elia
nce
Text
iles
Ah
med
abad
343
Flex
Flex
ible
pac
kagi
ng
NO
IDA
135
4Ta
ta C
onsu
ltan
cy
Soft
war
eG
urg
aon
6Se
rvic
es36
5A
ltos
Com
mu
nic
atio
ns
equ
ip.
Gu
rgao
n37
6H
FCL
Com
mu
nic
atio
ns
equ
ip.
Gu
rgao
n38
7M
ehra
Ban
dh
uR
ead
ymad
e ga
rmen
tsG
urg
aon
398
Ush
aEn
ergy
sav
ing
equ
ipm
ent
Gu
rgao
n40
9Si
emen
sSo
ftw
are
Gu
rgao
nTo
tal
firm
s (4
0)
Uti
liti
es (
5) 1A
hm
edab
ad E
lec.
Co
Priv
ate
elec
tric
uti
lity
Ah
med
abad
2N
oid
a Po
wer
Co
Ltd
Priv
ate
dis
trib
uti
onN
oid
a3
HSE
B-H
arya
na
Stat
e
Gov
t. e
lect
ric
uti
lity
Gu
rgao
nEl
ec B
oard
4U
PSEB
-UP
Stat
e G
ovt.
ele
ctri
c u
tili
tyN
oid
aEl
ec B
oard
5Pu
blic
Hea
lth
& .
Gov
t. w
ater
uti
lity
Gu
rgao
nW
ater
Dep
t

194
ACMA (Auto ComponentsManufacturers’ Association)20–1, 26, 117
AEC (Ahmedabad ElectricityCompany) 25, 27
Ahmedabad 25, 178power 38; Electricity Co 25, 27see also Arvind Mills; Reliance
AIAM (Association of Indian AutoManufacturers) 26
Allied Signal 50Altaf, A. 166Amsden, A.H. 4, 172analysis see supply-impact-response
framework; unit of analysisAnas, A. 13, 77, 166, 175
power 28, 40, 43–4, 49, 76, 177–8Arun, J. 182Arvind Mills 25
power 29, 30, 40, 41, 47, 74–5Aschauer, D. 5, 173, 175Ashok-Leyland 24, 27, 41, 48, 82,
176Association of Indian Auto
Manufacturers 26Auto Components Manufacturers’
Association 20–1, 26, 117automobile industry in India 2, 16,
17, 18–20cost structure of assemblers and
suppliers 82deregulated (1993) 18–19list of firms in study 24–5major case study see Maruti-Suzukiproduction capacity in 19, 21,
133, 134, 137, 178see also clustering; power;
supply-impact-response;transportation
Bajaj Auto 24, 27, 48–9, 176Bangalore 90, 100, 135, 154
firm in see Toyotabank loan rates 92benefits
of clustering, summarized130–3
direct 7, 10–12, 14external see external economiessocial 51, 159, 167; see also
spilloversBharat Seats 24, 82, 143Bhargava, R.C. 57, 176BHEL 49, 148Bombay/Mumbai 90
see also MumbaiBright Brothers 120Briscoe, J. 13Britain 37, 93, 99, 153, 175budgets see costsbuffers see inventoriesbuses 13, 18
see also Ashok-Leyland; Telco
C&RM (components and rawmaterials) inventory 92–5, 96,98, 182
see also supply chainscapital
opportunity cost of 92, 181social overhead see SOCstock, public 172–3
Caplice, C. 181captive generation of power
see self-generationcars
demand and sales 19, 175, 179manufacturers of 18, 19prices 179, 183
Index
Note: all references are to automobile industry in India, except where otherwiseindicated. Page references for major treatments of topics are emboldened

cars – continuedproduction capacity 19, 21, 133,
134, 137, 178see also Daewoo; Ford; Hindustan;
Hyundai; Maruti-Suzuki; TelcoCasten, T. 36–7CCGTs (combined cycle gas turbines)
36–7, 44, 50Chapman, M. 132, 184, 186Chennai
auto district 133–7, 140, 141;compared to others 116, 177,186
distance to and travel time 90–1firms in 24, 26, 27; see also
Ashok-Leyland; Ford; Hyundai;Mitsubishi; SBL
Chrysler 92–3CKD (completely-knocked-down)
88, 97clusters
automobile 141, 183; see also autodistrict under Delhi, Chennai
diversified industrial, in Gurgaon130
literature on 4, 5, 112–14targeting, as an infrastructure
strategy 169–71clustering 23, 107, 112–44, 168,
183–6approaches/strategies; co-locating
with other assemblers 107,140, 141; co-location as asupplier selection criterion135, 136, 155–6; developmentof supplier parks 121, 133,156; location decisions ofassemblers 116, 117, 113–15
benefits of 130–3, 160dynamics (or process) of, 158; Ford,
Hyundai and growth ofChennai auto district 133–7;Maruti-Suzuki and creation of aDelhi auto district 115–33
and resulting geography ofproduction 137–42
as solution to transportationproblems 155–6
state subsidies for see incentives
strategy of, see under Maruti-Suzuki;Ford; Daewoo; Hyundai
see also local suppliersClutch Auto 25, 82CMS-Neyveli 40, 41CNC (computer-numerically-
controlled) machines 46, 50, 61,148–9
Coimbatore 120commercial vehicles 176
see also buses; truckscommodity (value) chain 17, 80–1communications see IT; transportationcompetition
in auto industry 9, 16, 175co-operative 172
competitive asset 51competitiveness
of industrial districts 113literature 16, 17of Maruti-Suzuki 20, 21models of, 113effect of unreliable power on 60–3see also private power;
transportationcomponents and raw materials
see C&RMcontinuous process manufacture 50,
61, 149, 179co-operative competition 172cost structure of assemblers and
suppliers 17, 82costs 19, 166
and/or benefits of infrastructure10–12, 79
direct 10–12, 77, 158–9, 165; seealso TLC (total logistics costs)
of industrial plots/land 122,128–9, 134, 184, 186
opportunity, of capital 92, 181power see under powerand prices of cars 179, 183self-provision 13stock-out 91supply chain 17transport see under transportation
cross-docking 100cross-subsidy for HSEB 58–9Cusumano, M.A. 180
Index 195

DabholEnron in 33, 41–3Power Company 41–3
Daewoo 19, 24, 26, 27clustering strategy 112, 117, 133,
140, 141, 155, 156domestic content 107, 116, 136,
183power 29, 30, 40, 41, 45–7, 148transportation solutions 112, 156see also clustering above
Dahiya, J. 185damage in transit, cost of 89–90,
108decentralization of supplier base
checked 139see also clustering; JIT
Delhiareas near see Faridabad; Gurgaon;
NOIDAauto district 140; maps of 118,
131, 141distance and transit time from 90Ford’s collection hubs in 100, 135Maruti’s role in creation of
115–33see also Daewoo; Honda; IMT;
Maruti-Suzukidemand
for cars 19, 175for power 51–60; high quality
50; see also sharingsee also sales
DHL 97Diamond, D. 77, 175Diamond-Star 184, 186diesel see liquid fueldistance and inventories correlation
102–5, 111distribution of vehicles 88, 90, 108
districts, industrial see clustersdomestic content 107, 116, 136,
183see also exports; sales
drainage see waterDyer, J. 92n, 183Dynamic (supplier) 24dynamic gains from lean production
83, 154
East and South-East Asia 1, 4power 33, 39, 43–4, 49, 76, 172,
175, 177–8efficiency of supply chain see under
supply chainselectricity see powerElectricity Supply Act (1948) 31employment see laborenergy see powerEnron 33, 41–3Europe 37, 45, 172, 175, 179
transportation 85, 91, 93, 99, 106,153, 180, 181
excess capacity approach toinfrastructure 12
expenditure see costsexports 21–2, 88, 108
from Gurgaon 130see also distribution; ships
external economiesdefined 174–5of infrastructure 7, 10–12, 14policy implications of 166, 167,
170role of state in creation of 159,
164see also spillovers
Faridabad, firms in 25, 26, 178clustering 116–19 passim, 127, 183
Fernald, J. 173Fiat 19, 141field work schedule and phases 27finance see costsFishlow, A. 174Five-Year Plan, Eighth 30FOB (free on board) 95focus of inquiry 15–18Ford Motor Company 19, 24, 26, 27
clustering strategy 133–6, 141,155–6, 158; compared toMaruti 160
and Chennai auto district 133–7,140
domestic content 183inventory 92, 93, 102local content 137localization of supply chain
135–6
196 Index
Ford Motor Company – continuedlocation decision and incentives
133–5logistics plan, JIT, and delivery
schedules 99–102, 154–6supplier selection criteria 135–6,
155–6and insight into transportation
problems 78, 152–4in UK 93in USA 138
foreign firms 31freight expenditures 89, 106
and logistics costs 88, 89, 106,138–9
role in geography of US autoindustry 138–9
see also costs under transportation
GAIL (Gas Authority of India Ltd)37–8, 49, 54, 162, 176
Gakenheimer, R. 175gas
access to 37–8, 162, 176–7Gas Authority of India Ltd see GAILturbines 36–7, 44, 50
General Electric 49, 148General Motors 19, 97, 137, 141
inventory 84, 92–3in USA 138
geography of production 137–43in industrial districts model
113–14literature/theory 113methodology for mapping 183in lean production model 113–14see also clusters, clustering
Gereffi, G. 17, 60, 80government see stateGramlich, E.M. 1, 5, 173, 187GRIDCO (Grid Corporation, Orissa)
33, 34growth theories, neoclassical and
“new” 4Gujarat see AhmedabadGulyani, S. 175, 184Gurgaon
creation of auto supply base in115–33
and Delhi auto district 117–19diversification of industrial base of
129–32employment in 130exports from 130firms in 24, 25, 26, 27, 130see also Maruti-Suzuki
Halol 141Haryana
clustering see auto district underDelhi
firms in 26, 48–9, 82; see alsoFaridabad; Gurgaon
power 30, 34, 38; State ElectricityBoard see HSEB
State Industrial DevelopmentCorporation see HSIDC
Hero-Honda 48–9, 82hierarchy in networks 114Hindustan Motors 48, 82, 175Hirschman, A. 8, 11, 12–13, 169,
173–4Holtz-Eakin, D.J. 174Honda 19, 27, 183
clustering and location strategy117, 133, 140, 141
Hero-Honda 48–9, 82Honda SIEL 24
Hopewell (Hong Kong) 33horizontal integration see clustering;
JIT; supply chainsHSEB (Haryana State Electricity Board)
25, 35–6, 63, 176costs and prices 44–5, 49, 53–4,
178inadequate and low quality power
45and Maruti 29, 31, 39, 43, 51–60;
passim, 151, 161–4transmission 55–7and World Bank 163
HSIDC (Haryana State IndustrialDevelopment Corporation)121–9, 132, 134, 156, 164, 184,185, 186
see also IMThubs, transport (Ford) 100, 135Humphrey, J. 5, 83, 113, 172, 180
Index 197

Hunt, S. 36Hyderabad 103Hyundai 19, 24, 26, 183
clustering strategy 112, 133–7passim, 140, 141, 155–6, 160
IIPs (integrated industrial parks)113, 168–9, 180
see also clustering; IMT; supplierparks
impact in supply-impact-responseframework 7, 10–12, 14, 146, 147,
149–50, 157imports 88, 91
inventory penalties of 95–9, 107,109–10, 182
see also domestic content, oceanfreight
IMT (Industrial Model Township atManesar) 118, 121–9 passim,132, 144, 156, 160–1, 185, 187
incentives and subsidies, clustering115, 121–9, 132, 134–7, 160–1,184
independent power producers see IPPsIndia see automobile industryIndia Infrastructure Report 3, 30, 79,
152, 168–9, 181, 185, 187Indian Railways see railwaysindivisibilities or lumpiness in
infrastructure technology 7,8–10, 14–15, 147, 152, 174
Indonesia, power in 39, 43–4, 49,76, 175, 177–8
industrial districts see clusters, IIPsIndustrial Model Township see IMTinformation technology see ITinfrastructure 1
defined 8demand for see impact, response,
power, transportationindustrial, alternative strategy for
improving 169–71literature and theory 1–15, 145,
147, 165–68, 172–4; see alsoIndia Infrastructure Report
methodology used forunderstanding impact of16–17, 24–5
a new analytical/theoreticalframework for; seesuply-impact-responseframework
and role of government 165–8;see also state
supply, innovations in technologyand institutions of seesupply-side
see also clustering; power;transportation
innovative strategies for tacklingpower problems seeself-generation
institutional and technologicaldevelopments in infrastructure7, 8–10, 14–15, 152
inventoriesC&RM 92–5, 96, 98, 182closing stock 95–6distance correlation 102–5, 111import penalties 96–9in lean production 83–7low see JITas “solution” to supply-chain
unpredictability 62transit time and delivery frequency
93–5, 120–1and transportation system 89–99
passim, 142, 153, 154, 180–2passim
to sales ratio 92–3investment 3, 21
see also capital; costsIPPs (independent power producers)
33–5, 39–44, 63, 163see also Maruti-Suzuki; power
IT (information technology) andtelecommunications 9–10, 100,
166, 187firms 25, 130
Japan 38, 52firms from; Nissan 92, 93, 180; see
also Mitsubishi; Suzuki; Toyotajoint venture see Maruti-Suzukikanban system see JITtransport from 91, 97and USA 138, 186
198 Index

Jimenez, E. 173, 187JIT (just-in-time) system
and lean production 81–4, 86–8,106; as drivers of clustering112, 114, 140–2; shift toward165
and role/performance of localsuppliers 98–105, 107, 109–10
in supply-impact-responseframework 157
see also clustering, lean productionjoint ventures 119–20, 133
power supplied to 51, 52–3, 57, 178Joshi, M. 177Ju-shin (supplier) 24just-in-time system see JITJVs see joint ventures
Kadam, O.P. 176kanban system see JITKML (Krishna Maruti) 25, 57, 143Krishna Maruti (KML) 25, 57, 143Krugman, P. 174, 186
labor availability and employment116, 130
costs 82, 139, 142, 180Lakshaman, T.R. 173Land Acquisition Act (1894) 184land subsidies and clustering 112,
121–2, 125, 126, 128, 134, 160,184
lean production 81–4compared to industrial districts
model 113–14definition and features of 83power unreliability as an obstacle
62–3Toyota as pioneer of 81see also JIT
Lee, K.S. 13, 77, 166, 175power 28, 40, 43–4, 49, 76, 177–8
legislation see regulationLevy, D.I. 83, 182Lieberman, M. 84, 93, 106linkages
backward and forward 11, 118,143, 174
see also networks
liquid fuel generators 28, 31–2, 35,36, 45, 46, 57, 149
loans, bank 92local suppliers and JIT 81–4, 87,
98–105, 107, 109–10see also clustering
logistics and transportation 99clustering as solution 155–6costs 85–6; Ford 99–102, 135–6,
154–5; Maruti-Suzuki 87–99,105, 108; TLC (total logisticscost) 86–91, 105–6, 153–4
defined 85Lucas-FIE 24Lucas-TVS 24, 120–1Ludhiana 90Lumax 24, 82, 120, 143
Madras see ChennaiMaharashtra 88, 177
Nashik 133, 134State Electricity Board 42, 48see also Dabhol
Mahindra & Mahindra 133Malhotra, R.L. 185Manesar see IMTMark Auto 24, 178
cost structure and supply chain82, 143
inventory performance 98, 110,120
power 55Marshall, A./Marshallian economics
132, 186Maruti-Suzuki 19, 20–3, 24, 27
cost structure 82clustering and localization strategy
112, 115–33, 155–6, 158, 187;see also auto district under Delhi
distribution of vehicles 88, 89,90–1, 105, 108
as dominant carmaker 20government; collaboration with
see GAIL, HSIDC, see also HSEBbelow; equity in 20–1;objectives in creation of 20–1,115–16
power, self-generated 148–9;costs 29–30, 38–51, 64–5, 148,
Index 199
Maruti-Suzuki – continued176–7; financial analysis66–73; gas turbines 35–8; andHSEB 29, 31, 39, 43, 51–60passim, 151, 161–4; output andsales 64–5, 178; supplying seesharing
prices of vehicles 107, 179supply chain 82, 93–9; see also
clustering abovetransportation 78, 92, 180–3;
demand 87–8; impacts,summarized 152–3; logisticscosts (freight costs, damages,inventory) 88–99, 105–6, 108;supplier park as solution to,see clustering above
Memorandum of Understanding 31,34–5, 42
Mercedes-Benz 19, 141methodology
of study 24–7; see also unit ofanalysis; focus of inquiry
for plotting geography of supplychain 183
Ministriesof Industries 121of Power 31, 41, 59of Urban Development 26
Mitsubishi 134–5, 137, 140, 141,186
MODVAT (modified value-added tax)125–6, 132
MOP (Ministry of Power) 31, 41,59
MoU (Memorandum ofUnderstanding) 31, 34–5, 42
MSEB (Maharashtra State ElectricityBoard) 42, 48
Mumbaisupplier and industrial base 99,
103, 117, 119, 141firms in 19, 141, 175power, BSES 178
Munjal Showa 24, 82, 143Munnel, A.H. 11, 175
Nadiri, I.M. 11Nashik 133, 134
National Thermal Power Corporation40, 41, 59
natural gas see gasNava Sheva Port 88, 90networks and linkages between firms
80–1, 113–14, 174see also clustering; local suppliers
new analytical framework seesupply-impact-response
Neyveli 40, 41Nigeria, power in 39, 43–4, 49, 76,
175, 177–8Nissan 92, 93, 180NOIDA and Greater Noida industrial
areas 25, 26, 27clustering in 117, 118, 119, 140Power Company Ltd 25, 45–6
NPCL (Noida Power Company Ltd)25, 45–6
NTPC (National Thermal PowerCorporation) 40, 41, 59
NUMMI (GM-Toyota) plant 84
ocean freight or transport 91, 97,107, 182
see also imports, exportsOHPC (Orissa Hydro Power
Corporation) 33, 34oil see liquid fuelOkhla 117, 118, 119, 183Orissa
GRIDCO (Grid Corporation) 33,34
Hydro Power Corporation 33, 34power 30, 33–4State Electricity Board 33
Osborne, T. 181output see productivityoverhead see SOC
performance see productivity;competitiveness
Philippines 177Piore, M. 4, 113, 114, 172, 180policy implications 23, 165–71,
187 alternative strategy for improving
industrial infrastructure169–71
200 Index

policy implications – continuedlessons for industrial park
development 126–33power sector 63, 152transport sector 156–8see also state
polluting fuels see liquid fuelPorter, M.E. 16, 17, 60, 80, 173ports 77, 88
see also ocean freightPosco 172power 9, 23, 26, 28–76, 166, 176–9
as a clustering or co-locationincentive 123–4, 160
conventional solutions 30–5costs and prices 29–30, 59, 64–5,
148, 176–7; comparisons withother countries 39, 43–4, 49,76, 175, 177–8; public 44–5,49, 50–1, 53–4, 178; publicutility function of Maruti56–9; and textile firms 74–5;see also under self-generation
efficiency see under qualityimpact (of unreliability) on supply
chains and competitiveness60–3
in supply-impact-responseframework 148–52
supplying see sharingsee also private power;
self-generation and underWorld Bank
Power Sector Restructuring Project(Orissa) 33
PPA (power purchase agreement) 42,54
Premier Automobiles Ltd 141, 175prices see under costsPricol 120private power companies 31, 32–5,
176AEC 25, 27, 47NPCL 25, 45–6unregulated 13World Bank on 33, 34–5
productivity and performance,industrial 2, 4, 5, 11, 175,187
of Maruti-Suzuki 21–2, 116–17,178
public sector see statePune
firms in 25, 27; Bajaj Auto 24,27, 48–9, 176; Mercedes-Benz19, 141; see also Telco
power 48–9, 175, 176supplier and industrial base 116,
117, 119transportation plan for Ford
suppliers in 99, 100, 154
qualityof power; demand for 50–1high, self-generated 29, 36and losses in transmission and
distribution 30–1, 35, 179poor public 28, 29, 45–6and production losses 60–1poor transportation 77, 78–80, 91,
105, 186total quality management 83, 172of vehicles produced 61
railways 8–9, 79, 106, 129, 174, 186Rajasthan 30, 34Rane Brake Linings 24, 82, 120regional transport hubs (Ford) 100,
135regulation and legislation 9, 31, 33,
148, 184see also state
Reliance Industries 25, 38Reliance Power 33, 152
response in supply-impact-responseframework 7, 12–14, 146–7,149–50, 157
Rico 56, 57roads 11, 88, 91, 100, 130, 179–80,
185inadequate 77, 78–80, 105, 186see also buses; cars; trucks;
two-wheelerRomer, P.M. 4Rosenstein-Rodan, P. 10, 11Rostow, W.W. 10Rubenstein, J.M. 137–9, 140, 142Rubin, L.S. 173
Index 201
Sabel, C. 4, 113, 114, 172, 180safety net see inventoriessales
revenues 180; energy costs aspercentage of 48; and logisticscosts 105
tax concessions and clustering112, 122–3, 125–6, 134, 160
to inventory ratio 92–3see also demand; distribution
SBL (Sundaram Brake Linings) 24,82, 102–4, 105
Scitovsky, T. 11, 174sea transport see ocean freightSEBs (State Electricity Boards) 25,
30–3, 63see also HSEB; MSEB
self-generation of power 13, 31arguments against 28–9costs 29–30, 36–8, 49, 64–5, 148,
176–7; myth of 38–51as preferred alternative 49–51in supply-impact-response
framework 148–52, 158–9supplying see sharingtechnology 49–50World Bank views on 30, 32–34see also power under Maruti-Suzuki
self-provision of infrastructure 2, 13,166
power see self-generationSengenberger, W. 4, 113, 172services, basic see utilitiessewerage see watersharing, supplying and selling self-
generated power 64–5, 150–2, 158,159, 169–70
HSEB 29, 31, 39, 43, 51–60 passim,151, 161–4
Sharma, S. 184shortage approach to infrastructure
12–13SIDCs (state industrial development,
corporations) 26Singer, H.W. 11SKD (semi-knocked-down) 88, 97SOC (social overhead capital) defined
8, 173–4see infrastructure
social perspective 160–1, 163Sohna 118, 119Solow, R.M. 4Sona Steering 24, 82, 143South Korea 4, 172
see also Daewoo; Hyundaispillovers 132, 159, 164, 166, 167
from clustering 129–30state 2, 3, 159–64
role in clustering and supplier parkdevelopment 115, 121–9, 132,160–4; investment and locationincentives 134–5; see alsoHSIDC
industrial developmentcorporations 26, 156; see alsoHSIDC
joint venture with Suzukisee Maruti-Suzuki
power 31, 161–4; ElectricityBoards see HSEB; SEBs
strategy for industrial infrastructure168–71
see also policy implications;regulation
steel industry 172Sun Vac (supplier) 24Sundaram Brake Linings 24, 82,
102–4, 105Sundram Fasteners 24, 97–8, 109supplier parks 134–7, 156, 159–61
see also clustering; IIPs; IMTsupply chains/suppliers
costs, and share in expenditure17, 82
efficiency of 60, 78, 81, 106, 114,158, 165
importance of 17, 81inventories, JIT and transportation;
in theory 81–7; empirical data92–6, 99–102
location near assembly plant 112,114, 117, 119–21; see alsoclustering
map of 118Maruti-Suzuki 82, 93–9and power; sharing 51–3, 54–7,
59, 166; unreliability effects60–3
202 Index
supply chains/suppliers – continuedselection; process for Maruti
supplier park 127–9; criteria,Ford and Hyundai 135–7
in supply-impact-responseframework 151–2, 156,159–61
transportation see under inventoriesabove
see also local suppliers; unit ofanalysis
supply-side variables insupply-impact-responseframework 7, 8–10, 14, 145–50passim, 157
supply-impact-response framework6–15, 23, 145–64, 186–7
and analysis of power solutions148–52
and transportation solutions 152–9see also impact; response;
supply-side variablesSurajpur see DaewooSuzuki Motor Company of Japan 20,
21, 35, 52CKD/SKD from 88, 97
see also Maruti-Suzuki
Taiwan 4Takaoka plant of Toyota 84Tamil Nadu 120
location and investment incentives133–4
see also Chennaitax
concessions and clustering 112,122–3, 125–6, 134, 160
road 79value-added 125–6, 132, 185
technologyindivisibilities in 7, 8–10, 15power 49–50, 148–9see also IT
Telco 19, 24, 26, 27, 141cost structure 82power 48–9, 175, 176
telecommunications see ITTenebaum, B.T. 37, 179textile firms 25
power problems and solutions 29,30, 40, 41, 47, 74–5
see also Arvind; RelianceThailand, power in 43–4, 175, 177–8thermal power, coal-fired 36–7third-party access (‘wheeling’) 31,
59, 179TLC (total logistics cost) and
transportation systems 86–91,105–6, 153–4
Toyota 19, 141lean production pioneered by 81inventory and delivery frequency
83, 84, 92, 93, 180TPA (third-party access) 31, 59, 179TQM (Total Quality Management)
83, 172tractors 18, 116transmission of electricity 55–7, 179transportation 23, 77–111, 179–83
and competitiveness, a theory of78–87
costs 11, 77, 105–6, 138–9, 152–4,180–1; damage 89–90, 108;see also under logistics
impact on JIT and lean production;local suppliers, JIT andinventories 98–105, 109–10;in theory 81–4, 85–7
inadequate and poorly maintained77, 78–80, 91, 105, 186
mitigating adverse impacts ofsee clustering
solutions, summarized 152–6;implementation problems156–8
in supply-impact-responseframework 8–9, 11–12, 152–9
systems and transit/travel time 11,79–80, 90–1, 97, 100, 106, 153,181, 182, 186
see also inventories; railways; roads;ocean freight
trucks, manufacturers of seeAshok-Leyland; Telco
two-wheeler vehicles, manufacturersof 116
Hero-Honda 48–9, 82see also Bajaj Auto
Index 203

unit of analysis (the firm and itssupply chain) 16–18, 23
United Kingdom 37, 93, 99, 153,175
United Statesauto industry; geography of
137–40, 142, 186; inventories92–3; JIT delivery in 99,139–40; plants 84, 184, 186
interest rates 182Japan and 138, 186power 37, 42, 179; costs 47–8;
independent production 33;self-generation 50
productivity and infrastructure 5,172–73, 175
transportation infrastructure, transittime, and lean production 91,106, 180, 182
UPSEB-UP State Electricity Board 25utilities and basic services 133, 160
see also power; waterutility vehicles 18, 19Uttar Pradesh 26, 140, 183
clustering in see auto district underDelhi
Industrial DevelopmentCorporation 156
see also Daewoo; NOIDA
value-added tax (VAT) 125–6, 132, 185
chain 17, 80–1creation 160
Venkataramani, R. 175, 183vertical integration 80–1
lack of see Maruti-Suzuki
Wade, R. 4Wärtsilä-Diesel 49, 148water supply, drainage and sewerage
25, 26, 166, 170infrastructure for firms 124, 129,
130, 134, 185Wheeler, D. 132“wheeling” (TPA) 31, 59, 179Whittington, D. 13, 166Womack, J. 4, 17, 81, 83, 84, 106,
180World Bank: infrastructure 1–2, 3–4,
13, 166, 172power 34, 163costs and losses 34, 35–6, 38,
39–40, 43, 59, 176in Philippines 177recommended solutions to problem
30, 32–5self-generation 28–9, 32, 38,
59unbundling and private
competition 32–5transportation 11, 77, 78–9, 85,
92, 152, 179–80, 181Water Team 170
204 Index