contents · pdf filecontents page mayor’s ... 5. analysis of budgeted cash position 37...
TRANSCRIPT
.
2
Contents Page
Mayor’s introduction 3
Chief Executive Officer’s summary 5
Budget processes 11
Overview
1. Linkage to the Council Plan 12
2. Services, initiatives and service performance indicators 14
3. Budget influences 24
Budget analysis
4. Analysis of operating budget 28
5. Analysis of budgeted cash position 37
6. Analysis of capital budget 40
7. Analysis of budgeted financial position 46
Long term strategies
8. Strategic resource plan and financial performance indicators 49
9. Rating information 56
10. Other strategies 58
Appendices
A Budgeted statements 62
B Rates and charges 69
C Capital works program 80
D Fees and charges schedule 86
E Schedule of amendments from Draft Budget

3
Mayor’s introduction
I am pleased to present Council's 2015/16 Budget. This is this Council's third Budget for our term,
and demonstrates our continued commitment to delivering services, assets and programs for the
benefit of our communities while restoring our financial position.
Like previous years, we have had to balance a number of complex factors including the need to
build Council's working capital, undertake renewal works, build new and upgraded infrastructure
and deliver services to meet your expectations. It is never easy, but I am confident that we are on
the right track.
We remain committed to eroding underlying budget deficits, reducing overheads, and returning
this Council to a sustainable financial position. While this has meant that we have not been able
to accommodate all worthy projects or initiatives in the short term, it will be the positive legacy that
this Council leaves for future generations, setting us up well for the future.
On reading this document you will see that we will continue to invest significant resources in
preparing for the high levels of growth anticipated in parts of our Shire. We have $1.11 million in
the 2016 budget to invest in developing Structure Plans for the key townships of Kilmore,
Wandong, Heathcote Junction and Seymour and in the implementation of the Wallan Structure
Plan. A further $1 million has been allocated to support strategic land acquisition in growth areas.
This year we have continued to review our forecasts and the assumptions that underpin our
financial models. As a result we are confident that the revised four-year Strategic Resource Plan
(SRP) reflects realistic expectations when set against Mitchell Shire's current and emerging social
and environmental context.
The key influences underpinning the 2015/16 Budget include:
Continuing to build a strong financial foundation, including replenishing cash reserves and
increasing working capital;
The need to minimise rate increases - which has been somewhat achieved by taking a
much more constrained financial outlook and continues to contain costs;
Balancing the need to invest in ageing infrastructure with the need to deliver new
infrastructure; and
A significant reduction in external grant funding both from State and Federal Governments.
The effort to keep rates affordable while meeting the need for infrastructure and services has not
been easy or simple. We have restricted operating expense increases to less than 2% of 2014/15
adopted budget levels and staff costs have decreased by 3.6%. This has enabled us to propose
an increase to Council's declared rates and charges revenue of 6.9% rather than the 8.5%
foreshadowed in last year's budget. This is still higher than we would have preferred, but we have
also forecast a much lower increase of 4.5% increase per annum from 2016/17 which will need
to be achieved through service redesign and further cost efficiencies.
We are proposing a capital works program of $10.55 million, in addition to an expected $5.35
million carry over which adds up to a total program of $15.9 million. This program includes $1.25
million additional borrowings to support further strategic land purchases in the South of the Shire,
and the Seymour Flood Levee project. It is expected that $3.5 million of the current $4 million
budgeted within the 2014/15 budget for land in the south will form part of the carry forward
amount. Decisions are currently being made on the purchase.
Continuing efforts will be made to seek funding opportunities in line with Council's advocacy
framework to maximise infrastructure across many areas of Council.

4
Highlights of the total spend on the capital works program (see appendix C for further details),
funded by Council in partnership with State and Commonwealth grants include:
Building renewal and upgrade works - $185,000
Drainage upgrade works - $95,000
Footpath renewal works - $85,000
Bridge renewal works - $500,000 ($150,000 grant funded)
Recreation renewal works - $515,000
Roads renewal works (rural and urban) - $2,237,000 ($1.5 million grant funded)
Additional Land purchases - $1 million (funded by Council borrowings)
Information technology renewal works - $255,000
Seymour Flood Levee - $250,000 (funded by Council borrowings)
New Footpath Construction - $300,000
Early Learning Facility in Wallan - $2,000,000 (fully grant funded)
Sports Pavilion Broadford Leisure Centre Precinct - Stage 1 - $645,000 ($350,000 grant
and contribution funded)
We are conscious that everyone is facing tight financial times and are determined to deliver
operating efficiencies and cost savings. In the approach to the 2014 State Government Election,
Labor made a clear commitment to the Victorian community of their intention to introduce a model
of rate capping, ensuring that all local governments justify any rate increase above a certain level.
While the details of the rate capping framework are still being developed by the Essential Services
Commission, it is highly probable that the outcome will put further constraints on our financial
position from 2016/17 onwards. In anticipation, we have already commenced a process of service
planning to ensure that any decisions to revise priorities or to reduce services is based on real data
and informed by your views and input. We expect that difficult decisions will need to be made.
As part of those reviews we will:
Work with you to review and prioritise the services that we provide and the level of service
that are desired and can be afforded; and
Decide which assets and staff will be required to undertake our prioritised services and
reduce and/or rationalise them accordingly.
In closing, I would like to reiterate that I am confident that this 2015/16 Budget is financially
responsible, recognising our tight financial circumstances and relative priorities both now and for
the future. We look forward to receiving your feedback through the consultation and submissions
process.
Cr Rodney Parker
Mayor

5
Chief Executive Officer’s summary
This 2015/16 Budget seeks to balance demand for services and infrastructure with revenue. It is
always a challenging task, particularly as we are also seeking to build our short term cash
position and improve our long term financial sustainability. Despite the challenges, I am
confident that this budget continues the corrective effort that we have commenced in recent
years and sets us on a stronger path for the future.
As CEO I am committed to leading a high performing organisation and supporting the Council by
delivering good value for money to you, our community. Improving Council’s own internal
efficiency has been a key part of that. Over the last 12 months we have reduced staffing costs
by around $1.9 million in real terms, through restructuring and other cost containment
measures. We have reduced the annual staffing budget from $24.24 million to $23.35 million
and have absorbed the cost of the 3% enterprise bargaining increase and Award based
incremental progression. This also means that the ratio of staffing costs to rates revenue ratio
in the 2015/16 budget has improved to 65%, a strong sign that we are heading in the right
direction. More importantly however, this has also supported the reduced rate increase for the
2015/16 year.
On reading the budget you will also notice that our recurrent budget for 2015/16 has increased
by less than 2% from the 2014/15 adopted budget. If you exclude depreciation, the increase is
a low 0.3%. By keeping cost escalation to the absolute minimum, we have been able to absorb
the impact of unavoidable increases in contracts and utilities. Despite these constraints we have
also been able to include new expenditure of $0.12 million for an Environmental Grants Program
(replacing the old land management rebate that was suspended in 2014 ) and accommodate
increased investment in strategic land use planning of $0.46 million (compared to the 2014/15
budget) to meet the planning needs of our growing communities.
Of course the hard work doesn’t stop here. We will continue to explore how we can reduce the
cost of doing business, while maintaining service standards to professional standards. As
outlined in the Mayor’s introduction, our short term financial outlook is changing as a result of
decreases in previously guaranteed State and Federal grant funding and the prospect of rate
capping. Over the coming months, and as we lead into next year’s 2016/17 Budget, we will
need to critically review all of our assets and services and work with you to set new priorities that
reflect those changed circumstances.
Key budget information is provided below about Council’s rate increase, operating result,
services, cash and investments, capital works, financial position, financial sustainability and
strategic objectives.

6
1. Rates and Charges
A = Actual F = Forecast B = Budget SRP = Strategic Resource Plan estimates
It is proposed that total declared revenue from rates and charges increase by 6.9% over 2014/15
levels for the 2015/16 year, exclusive of supplementary revenue resulting from growth in rateable
properties, raising total rate revenue of $36.01 million. The total rates and charges revenue
includes $0.22 million generated from supplementary rates.
While the State Government’s rate capping framework is still in development, there has been a
clear commitment that it will be implemented with effect from the 2016/17 financial year. The
framework will require all Councils to justify any rate increase above a certain level which could
be as low as CPI. CPI is not always the best indicator of cost escalation in local government as
CPI measures the increase in cost of a basket of household goods, whereas local government
costs are predominantly comprised of utilities, contracts and wages, all of which traditionally
increase by more than CPI.
It is recognised by Government that rural, regional and growth municipalities such as Mitchell
face unique challenges which may be worthy of special consideration in a rate capping
environment if local service delivery and infrastructure management are not to be compromised
to unacceptable levels. We are committed to working with you to develop a shared
understanding of where those tolerances should sit, and to determine whether a case should be
made to the Government and Essential Services Commission for an exemption should CPI be the
rate capping level set by Government.
Modelling our current plan against lower rate revenue, Mitchell Shire would experience a
significant decline in overall sustainability with a rate lower than 4.5%. In this scenario,
Council would need to significantly reduce our costs of operation even further, in order to remain
financially sustainable, meaning that maintenance standards will need to slip even further and
direct services will need to be reduced to reflect the reduction in staff resources and contractors
used for delivering services. This is despite the work already done to reduce costs and drive up
efficiency.

7
2. Operating result
The expected operating result for the 2015/16 year is a surplus of $8.41 million, which is an
increase of $1.81 million from 2014/15. This is primarily due to an increase in depreciation
($0.44M) and financing costs ($0.2M), a decrease in user fees ($0.49M) and operating grants
($0.42M), offset by an increase rates revenue ($2.61M) and capital grants ($0.61M).
3. Services
The net cost of services delivered to the community in 2015/16 year is expected to be $45.60
million which is an increase of $1.72 million over 2014/15. The main contributors to the increased
net cost are an increase of $0.44 million in depreciation costs, $0.20 million in borrowing costs
and a reduction of $0.48 million in user fees and charges and a decrease of $0.40 million in the
budgeted operating grants. Over the coming four years operations expenditure has been
constrained to direct as much funding as possible into the renewal of Council’s assets and
replenishment of cash balances to a more sustainable level. Future assumptions include additional
expenditure relating to growth, as growth is experienced forecasts are revised.

8
The chart below shows how much is allocated to each broad service area for every $100 dollars
that Council spends.
4. Cash and investments
Cash and investments are expected to increase by $0.79 million during the year to $10.29
million as at 30 June 2016. This includes anticipated unexpended grants of $1.32 million, which
are expected to be received by 30 June 2016 but not spent until the 2016/17 financial year. The
cash balance at 30 June 2016 incorporates all of the carried forward component of the 2014/15
capital works program being fully delivered in 2015/16. At 30 June 2016 cash reserves remain
Capital Works & Engineering services,
$28
Asset management and property, $1
Roads, Footpaths, Drains and Buildings,
$11
Waste collection, Landfill Operation and
Resource Recovery Centres, $7 Parks, Gardens,
Playgrounds, Arboriculture &
Environment, $5
Family, Children and Community Services,
$9
Statutory Planning and Building, $2
Recreation, Leisure and Openspace
Planning, $9
Strategic Planning , $3
Corporate Support, $12
Debt Servicing, $5
Local Laws, School Crossings, Fire Prevention, $3
Governance, Councillors and Executive, $2
Customer and Library Services, Art and
Culture, $3
$100

9
low and replenishment of reserves remains a key focus within the current Strategic Resource
Plan. 5. Capital works
The $15.90 million capital works program is funded by:
$4.13 million in grants and contributions;
$4.75 million in borrowings;
$0.87 million in proceeds from sale of assets;
$4.73 million cash generated from operations;
$0.20 million cash held in reserve (grant received in prior year); and
$1.22 million cash for net carried forward projects from 2014/15.
The capital expenditure program has been set and prioritised based on a rigorous process of
consultation that has enabled Council to assess needs and develop sound business cases for each
project (Capital works delivery is forecast to be $13.33 million for the 2014/15 year). The 2015/16
capital works program includes $5.35 million relating to projects to be carried forward from
2014/15 ($3.5 million of which relates to the strategic land purchase in the South of the Shire
which is currently under consideration by Council, refer to 6.1.1). Disappointingly, the
discontinuation of Country Roads and Bridges State Government funding has resulted in a reduced
investment in road and bridges of $1 million compared to previous years. We remain hopeful that
this situation may change once the State Government’s Budget is announced.
6. Financial position
The financial position is expected to improve with net assets (net worth) to increase by $8.41
million to $408.99 million and net current assets (working capital) will improve slightly by $0.17
million over the 2014/15 forecast levels to negative $0.09 million as at 30 June 2016. This is a
vast improvement on the 2014/15 budgeted position which projected working capital to be
negative $3.04 million.

10
7. Financial sustainability
A revised Strategic Resource Plan (SRP) has been prepared for the four year period ending 30
June 2019. The SRP is in turn set within a 10 year model developed this year to assist Council to
adopt a budget within a longer term prudent financial framework. The key objective of the Plan is
financial sustainability in the medium to long term, while still achieving the Council’s strategic
objectives. The adjusted underlying result, which is a measure of financial sustainability, however
shows a declining underlying position over the four year period.
These projections differ significantly from last year’s updated SRP model which showed Council
returning to underlying surpluses by 2016/17. The primary driver is the reduction in planned
annual rate increases to 4.5% pa from 2016/17 onwards based on our current expectations around
the as yet undefined, system of rate capping. The assumption in the SRP is that Council will seek
special consideration for a higher than CPI rate increase on the basis of additional costs and
infrastructure obligations associated with Melbourne’s urban growth and our peri-urban status.
Continued underlying deficits are unsustainable. They indicate that, within a rate capping
environment, Council needs to work with the community to:
Review and prioritise the services that we provide;
Determine the level of service that can be afforded;
Determine which assets are required to undertake the prioritised services;
Determine any surplus assets that can be decommissioned or rationalised; and
Determine where staffing resources may need to be realigned to deliver the shift in
prioritised services.
I am pleased with the progress that has been made to make our organisation more efficient and to
reduce the cost of doing business in order to deliver reduced rate increases. This work will
continue as we move into a revised financial context in 2016/17. This budget has been developed
through a rigorous process of consultation and review and I endorse it as financially responsible.
More detailed budget information is available throughout this document.
Rebecca Mckenzie
Chief Executive Officer

11
Budget processes
This section lists the budget processes to be undertaken in order to adopt the Budget in
accordance with the Local Government Act 1989 (the Act) and Local Government (Planning and
Reporting) Regulations 2014 (the Regulations).
Under the Act, Council is required to prepare and adopt an annual budget for each financial year.
The budget must include certain information about the rates and charges that Council intends to
levy as well as a range of other information required by the Regulations.
The 2015/16 budget is for the year 1 July 2015 to 30 June 2016 and is prepared in accordance
with the Act and Regulations. This document includes budgeted financial statements
(Comprehensive Income Statement, Balance Sheet, Statement of Changes in Equity, Statement of
Cash Flows and Statement of Capital Works). These statements have been prepared for the year
ending 30 June 2016 in accordance with the Act and Regulations, and consistent with the annual
financial statements which are prepared in accordance with Australian Accounting Standards. The
budget also includes information about the rates and charges to be levied, the capital works
program to be undertaken, the human resources required, and other financial information Council
requires in order to make an informed decision about adoption of the budget.
In preparing the budget, officers first review and update Council's long term financial projections.
Financial projections for at least four years are included in Council's Strategic Resource Plan, which
is the key medium-term financial plan produced by Council on a rolling basis. Officers then
prepare the operating and capital components of the annual budget during January and February.
A draft consolidated budget is considered by Council at informal briefings in March and April.
Once all changes are incorporated a ‘proposed’ budget is submitted to Council in April for approval
’in principle’. Council is then required to give 28 days’ public notice that it intends to adopt the
budget. During this time the budget must be available for inspection at its offices and on its web
site. A person has a right to make a submission on any proposal contained in the budget and any
submission must be considered before adoption of the budget by Council.
The final step is for Council to adopt the budget after receiving and considering any submissions.
The budget must be adopted by 30 June and a copy submitted to the Minister within 28 days after
adoption. The key dates for the budget process are summarised below:
Budget process Timing
1. Officers update Council's long term financial projections Nov/Jan
2. Officers prepare operating and capital budgets Feb/Mar
3. Councillors consider draft budgets at informal briefings Mar/Apr
4. Proposed budget submitted to Council for approval April
5. Public notice advising intention to adopt budget April
6. Budget available for public inspection and comment April/May
7. Public submission process undertaken May
8. Submissions period closes (28 days) May
9. Submissions considered by Council/Committee Jun
10. Budget and submissions presented to Council for adoption Jun
11. Copy of adopted budget submitted to the Minister Jul
12. Revised budget where a material change has arisen Sep-Jun

12
1. Linkage to the Council Plan
This section describes how the Annual Budget links to the Council Plan within an overall strategic
planning framework. This framework guides the Council in identifying community needs and
aspirations over the long (Community Plan), medium (Council Plan) and short term (Annual
Budget) and then in holding itself accountable (Audited Statements).
1.1 Strategic planning and accountability framework
The Strategic Resource Plan (SRP), which is, included in the Council Plan, is a rolling four year
plan outlining the financial and non-financial resources that Council requires to achieve the
strategic objectives described in the Council Plan. The Annual Budget is framed within the SRP
and specifies how Council will resource the delivery of services and initiatives on a year-by-year
basis in order to achieve its Strategic Objectives. The diagram below depicts the planning and
accountability framework that applies to local government in Victoria.
Source: Department of the Environment, Land, Water & Planning
The Council Plan, including the SRP, is required to be completed by 30 June following a general
election and is reviewed each year prior to the Annual Budget process.

13
1.2 Our purpose
Our vision - “Together with the community, creating a sustainable future”
Our mission - Working with our communities to build a great quality of life.
Mitchell Shire Council:
is committed to providing good governance and compassionate leadership;
is committed to supporting our diverse community;
values community involvement and vigour and diversity of opinion;
recognises the commitment of our staff;
will protect and enhance our natural environment;
will plan for and promote our future; and
will promote economic development within our municipality.
Our Values
Innovation – inspiring innovation and creativity for positive community outcomes.
Collaboration – working together enthusiastically to achieve shared goals.
Excellence – pursuing excellence in everything that we do.
Accountability – enhancing transparency and accountability in our work.
Integrity – demonstrating high personal and professional standards.
We strive to exceed community expectations and continuously work to improve our performance.
We are committed to governance processes that are fair, open and transparent.
1.3 Strategic objectives
Council delivers services and initiatives under 21 major service categories. Each contributes to the
achievement of one of five Strategic Objectives in the Council Plan 2013-17 (reviewed 2015),
which are listed below.
Strategic
Objective Description
1. Sustainable
growth and
development
Shaping the future of our communities through forward planning and
well built and maintained facilities and infrastructure
2. Healthy and
vibrant
communities
Providing and supporting programs and services to build vibrant and
healthy communities where people are proud to live
3. Strong
reputation and
economy
Developing a strong regional reputation and supporting local tourism
and economic development opportunities
4. Environmental
resilience
Responding to changing environmental conditions and protecting
our natural environment to ensure long term sustainability
5. Organisational
capacity and
performance
Excellent and innovative performance underpinned by good
governance and responsible financial management.

14
2. Services, initiatives and service performance indicators
This section describes the services and initiatives to be funded in the Budget for the 2015/16 year
and explains how these will contribute to achieving the Strategic Objectives specified in the Council
Plan. It also includes a number of initiatives, major initiatives and service performance outcome
indicators. The SRP is part of and prepared in conjunction with the Council Plan. The relationship
between these components and the Annual Report, is shown below.
Source: Department of the Environment, Land, Water & Planning
A significant effort has been made to ensure that the annual budget and the medium term plan
(SRP) put Council on a path to an affordable and sustainable future. A summary of the revised
SRP can be found in Section 8 of this document.
2.1 Strategic Objective 1: Sustainable Growth and Development
To achieve our objective of Sustainable Growth and Development, over the period of the current
Council Plan we will:
plan for future growth and new communities to ensure sustainable and quality outcomes;
build community pride by enhancing the look and feel of townships;
plan for a mix of housing types;
ensure Council assets and infrastructure support current and future needs; and
manage and deliver the capital works program.

15
The services, initiatives, major initiatives and service performance indicators for each business
area are described below.
Services
Expenditure
Business area (Revenue)
Net Cost
$'000
1,510
(538)
972
1,940
(19)
1,921
18,069
(1,746)
16,323
1,482
(217)
1,265
3,252
(138)
3,114
Strategic Planning
Statutory
Planning &
Building
This service processes statutory planning applications and building
approvals; and also provides control and compliance under the relevant
legislation.
Strategic
Planning
This service delivers positive land use planning outcomes for current and
future generations. It is also responsible for Growth Area Planning
including planning and managing Section 173 Agreements and Precinct
Structure Plans.
Operations This service is responsible for maintenance of the Shire’s infrastructure
assets except parks and gardens. It includes roads, footpaths, bridges,
drainage, street furniture and buildings. It also manages the Council's plant
and vehicle fleet. Waste management is also included in this area, which
incorporates kerbside collection, operation of landfill sites and resource
recovery centres, waste eduction and strategies.
Capital Initiatives - see appendix C for a detailed listing of proposed works
Kilmore Lancefield Road Footpath Construction - construction of footpath to connect the
Willowmavin Estates west of Kilmore to the school crossing on Kilmore-Lancefield Road
Description of services provided
Engineering
Services
This service is responsible for providing Civil Engineering services for
capital projects. It also incorporates subdivision plan checking and strategic
transport assessments.
Parks and
Assets
This service is responsible for maintenance of the Shire's parks and
gardens, playgrounds, arboriculture, sportsfield maintenance and
environment and conservation. It also manages the Shire's assets and tracks
asset renewal expenditure and targets including the capital works projects.
Continuing major Initiative
Completion of Kilmore, Wandong and Heathcote Junction Structure planning (commenced
in 2014/15), implementation of Wallan Structure Plan and Commencement of Seymour
Structure Plan. $1.1 million
Initiatives funded within the draft 2015/16 Budget
Service level planning and review of maintenance standards for roads and facilities.
Comencement of implemention of waste strategy actions, including a focus on reducing
dumped rubbish and litter.
Operations
Seymour Flood Levee (Stage 2) - Stage 2 involves strategic planning for the acquisition
of land and construction of the Seymour Flood Levee.
Engineering

16
2.2 Strategic Objective 2: Healthy and Vibrant Communities
To achieve our objective of Healthy and Vibrant Communities, over the period of the current
Council Plan we will:
enhance Council infrastructure to foster healthy and vibrant communities;
undertake service improvements to ensure programs and activities promote community
connectedness and wellbeing;
support initiatives that foster cultural inclusion and celebrate diversity;
promote and support volunteers and community leadership;
promote opportunities to support active and involved communities;
continue to build strong partnerships with committees of management, health and
community service providers; and
actively engage with our communities to improve collaboration and consultation outcomes.
The services, initiatives, major initiatives and service performance indicators for each business
area are described below.
Service Indicator
Statutory
planning
Decision making
Roads Satisfaction
Performance Indicators
Performance Measure Computation
Council planning decisions
upheld at VCAT
(Percentage of planning
application decisions subject
to review by VCAT and that
were upheld in favour of the
Council)
[Number of VCAT decisions
that upheld Council’s
decision in relation to a
planning application /
Number of decisions in
relation to planning
applications subject to
review by VCAT] x100
Satisfaction with sealed local
roads
(Community satisfaction
rating out of 100 with how
Council has performed on the
condition of sealed local
roads)
Community satisfaction
rating out of 100 with how
Council has performed on
the condition of sealed local
roads.
ServicesExpenditure
Business area (Revenue)
Net Cost
$'000
2,146
(1,962)
184
264
(12)
252
Description of services provided
Children's
Services
This service is responsible for the management of eight licensed
kindergartens, providing high quality education that enhances the health and
wellbeing of children and families within the community.
Youth Services This service provides support for young people. Key activities include policy
formation, community development, referral, social education, participation
programs, and skills development (such as leadership skills).
17
ServicesExpenditure
Business area (Revenue)
Net Cost
$'000
1,547
(508)
1,039
1,322
(104)
1,218
4,248
(1,956)
2,292
2,250
(314)
1,936
32
(8)
24
899
(45)
854
1,718
(852)
866
Description of services provided
Customer &
Library Services
This service delivers four integrated customer service and library sites, and
a call centre within the Shire. The service also provides outreach services
to aged facilities, the house bound, and schools, as well as children's and
youth activities. The Kilmore Library provides an extended service that
includes Vic Roads, VLine, the sale of fishing and mining licenses and
visitor information.
Arts & Culture This service undertakes planning and community engagement to encourage
community members to access and partake in arts and culture opportunities
across the Shire, including public art, community events and activities.
Recreation &
Open Space
This service, either directly or in partnership with community based
committees, manages recreation and sporting facilities including stadiums,
parks, sportsgrounds, open space, skate/BMX parks and playgrounds. The
service works with committees, clubs and user groups to provide a diverse
range of opportunities for the Mitchell community. The team also undertakes
planning for the future recreation and open space needs of the Community.
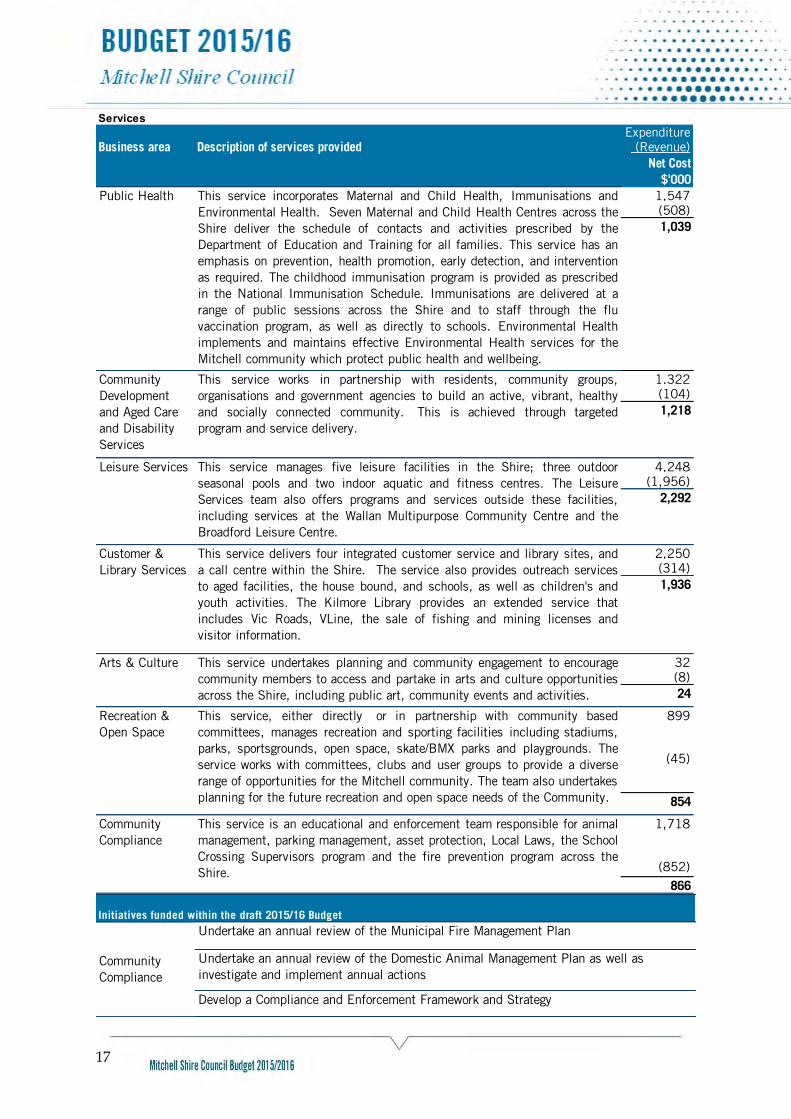
Public Health This service incorporates Maternal and Child Health, Immunisations and
Environmental Health. Seven Maternal and Child Health Centres across the
Shire deliver the schedule of contacts and activities prescribed by the
Department of Education and Training for all families. This service has an
emphasis on prevention, health promotion, early detection, and intervention
as required. The childhood immunisation program is provided as prescribed
in the National Immunisation Schedule. Immunisations are delivered at a
range of public sessions across the Shire and to staff through the flu
vaccination program, as well as directly to schools. Environmental Health
implements and maintains effective Environmental Health services for the
Mitchell community which protect public health and wellbeing.
Community
Development
and Aged Care
and Disability
Services
This service works in partnership with residents, community groups,
organisations and government agencies to build an active, vibrant, healthy
and socially connected community. This is achieved through targeted
program and service delivery.
Leisure Services This service manages five leisure facilities in the Shire; three outdoor
seasonal pools and two indoor aquatic and fitness centres. The Leisure
Services team also offers programs and services outside these facilities,
including services at the Wallan Multipurpose Community Centre and the
Broadford Leisure Centre.
Community
Compliance
This service is an educational and enforcement team responsible for animal
management, parking management, asset protection, Local Laws, the School
Crossing Supervisors program and the fire prevention program across the
Shire.
Community
Compliance
Undertake an annual review of the Municipal Fire Management Plan
Undertake an annual review of the Domestic Animal Management Plan as well as
investigate and implement annual actions
Develop a Compliance and Enforcement Framework and Strategy
Initiatives funded within the draft 2015/16 Budget

18
Children's
Services
Leisure Services
Capital Initiatives - see appendix C for a detailed listing of proposed works
Early Learning Facility at Wallan Primary School - construction of a two room Early
Learning Facility in Wallan.
Sports Pavilion Broadford Leisure Centre Precinct (Stage 1) - provide a relocatable
change room pavilion to service the needs of soccer in Broadford.
Strategic Land Acquisition in the South of Shire to enable future development of
community infrastructure and open space.
Service Indicator
Libraries Participation
Animal
Management
Health and safety
Home and
Community Care
Participation Participation in HACC service
(Percentage of the municipal
target population that receive
a HACC service)
[Number of people that
received a HACC service /
Municipal target population
for HACC services] x100
Participation in HACC service
by Culturally and
Linguistically Diverse (CALD)
people
(Percentage of the municipal
target population in relation to
CALD people that receive a
HACC service)
[Number of CALD people
who receive a HACC service
/ Municipal target population
in relation to CALD people
for HACC services] x100
Performance Indicators
Performance Measure Computation
Active library members
(Percentage of the municipal
population that are active
library members)
[Number of active library
members / municipal
population] x100
Pool Facilities Utilisation Utilisation of pool facilities
(The number of visits to pool
facilities per head of
municipal population)
Number of visits to pool
facilities / Municipal
population
Maternal and
Child Health
Participation Participation in MCH key ages
and stages visits
(Percentage of children
attending the MCH key ages
and stages visits)
Number of actual MCH
visits / Number of expected
MCH visits] x100
Participation in MCH key ages
and stages visits by Aboriginal
children
(Percentage of Aboriginal
children attending the MCH
key ages and stages visits)
[Number of actual MCH
visits for Aboriginal children
/ Number of expected MCH
visits for Aboriginal
children] x100
Animal management
prosecutions
(Number of successful animal
management prosecutions)
Number of successful
animal management
prosecutions

19
2.3 Strategic Objective 3: Strong Reputation and Economy
To achieve our objective of strong reputation and economy over the period of the current Council
Plan we will:
• promote and support business and employment opportunities
• promote industry diversification and support key Mitchell's industries including
manufacturing, defence, agriculture, transport, construction, retail and education.
• strongly advocate for the interests of the municipality
• support Mitchell’s recognition as a tourist destination; and • review/revise the Mitchell Economic Development Strategy.
The services, initiatives, major initiatives and service performance indicators for each business
area are described below.
Service Indicator
Food safety Health and safety
Performance Indicators
Performance Measure Computation
Critical and major non-
compliance notifications
(Percentage of critical and
major non-compliance
notifications that are followed
up by Council)
[Number of critical non-
compliance notifications and
major non-compliance
notifications about a food
premises followed up /
Number of critical non-
compliance notifications and
major non-compliance
notifications about food
premises] x100
Serv ices
Expenditure
B usiness area (Revenue)
Net C ost
$'000
740
(4)
736
D escription of serv ices prov ided
Economic
Development
and Tourism
This service is responsible for ensuring the organisation continues to
position itself favourably as a tourism destination. It is also responsible for
harnessing, encouraging and supporting economic development
opportunities that deliver beneficial community outcomes through
investment and employment.
Economic
Development
Initiatives funded within the draft 2015/16 Budget
Revise the Mitchell Economic Development Strategy and implement key year 1
recommendations: $15,000

20
2.4 Strategic Objective 4: Environmental Resilience
To achieve our objective of Environmental Resilience, over the period of the current Council Plan
we will:
provide relief and recovery support to communities during extreme weather events such as
fires and floods;
work with communities to assist them to plan for emergencies and extreme weather events;
improve the sustainability of Council operations;
provide efficient and effective waste management;
build infrastructure and processes to support community resilience in the face of climate
change; and
encourage environmental best practice.
The services, initiatives, major initiatives and service performance indicators for each business
area are described below.
Serv ice Indicator
Economic
Development
Economic activity
Performance Indicators
Performance Measure C omputation
Change in number of
businesses
(Percentage change in the
number of businesses with an
ABN in the municipality)
[Number of businesses with
an ABN in the municipality at
the end of the financial year
less the number of
businesses at the start of
the financial year / Number
of businesses with an ABN
in the municipality at the
start of the financial year]
x100
Services
Expenditure
Business area (Revenue)
Net Cost
$'000
4,164
(1,601)
2,563
578
(2)
576
334
(164)
170
This service is responsible for conservation and achieving an
environmentally healthy and sustainable Council.
Emergency
Management
Mitchell Shire Council plays an important role in emergency management,
both in partnership with others, and through its own legislated emergency
management obligations.
Mitchell Shire Council must have a Municipal Emergency Management
Planning Committee that includes representatives of the Council, response
agencies (such as Victoria Police), recovery agencies (such as the
Department of Human Services), and local community groups involved in
emergency management issues.
This committee oversees the development and maintenance of a Municipal
Emergency Management Plan (MEMP) that outlines the strategies for how
we will prevent, prepare for, respond to, and recover from emergencies
within the Shire.
Waste
Management
This service incorporates kerbside collection, operation of landfill sites and
resource recovery centres, waste eduction and strategies.
Description of services provided
Environment

21
2.5 Strategic Objective 5: Organisational capacity and performance
To achieve our objective of Organisational Capacity and Performance Council will focus on:
Improving reporting and accountability;
• Improving organisational systems and processes; and
Planning for the delivery and improvement of high quality, cost effective, accessible and
responsive services.
The services, initiatives, major initiatives and service performance indicators for each business
area are described below.
Services
Expenditure
Business area (Revenue)
Net Cost
$'000
4,164
(1,601)
2,563
578
(2)
576
348
(164)
184
Environment
Service Indicator
Waste collection Waste diversion
Environment
This service incorporates kerbside collection, operation of landfill sites and
resource recovery centres, waste eduction and strategies.
Initiatives funded within the draft 2015/16 Budget
Introduction of Environmental Grants Program ($0.12 million)
Description of services provided
This service is responsible for conservation and achieving an
environmentally healthy and sustainable Council.
Emergency
Management
Mitchell Shire Council plays an important role in emergency management,
both in partnership with others, and through its own legislated emergency
management obligations.
Mitchell Shire Council must have a Municipal Emergency Management
Planning Committee that includes representatives of the Council, response
agencies (such as Victoria Police), recovery agencies (such as the
Department of Human Services), and local community groups involved in
emergency management issues.
This committee oversees the development and maintenance of a Municipal
Emergency Management Plan (MEMP) that outlines the strategies for how
we will prevent, prepare for, respond to, and recover from emergencies
within the Shire.
Waste
Management
Kerbside collection waste
diverted from landfill
(Percentage of garbage,
recyclables and green organics
collected from kerbside bins
that is diverted from landfill)
[Weight of recyclables and
green organics collected
from kerbside bins / Weight
of garbage, recyclables and
green organics collected
from kerbside bins] x100
Performance Indicators
Performance Measure Computation

22
Services
Expenditure
Business area (Revenue)
Net Cost
$'000
1,241
-
1,241
3,909
(863)
3,046
1,379
(11)
1,368
3,622
0
3,622
Communications
Information
Services
Finance
Description of services provided
Councillors,
Chief Executive
Officer and
Executive Team
This service includes the Mayor, Councillors, and the Chief Executive
Officer and associated support which cannot be otherwise attributed to the
direct service provision areas.
Finance This service is responsible for Financial services such as procurement,
financial accounting, management accounting and rates administration.It
also includes finance costs and interest income as these are managed by
financial accounting.
Improve Council's website accessibility for customers to meet the AA standard and
prepare to achieve the AAA standard
Plan and deliver a significant upgrade of Council's records management system to
support increased mobile working
Continual review and improvements to finance systems and processes (such as
introduction of electronic land management certificates and investigation of feasibility of
move to electronic rates notices).
Initiatives funded within the draft 2015/16 Budget
Organisational
Development
This service incorporates people and culture, governance and risk
management. People and culture is responsible for human resources
strategy, learning and development, employee relations, human resource
services and payroll. The role of the governance team is to ensure that
Mitchell Shire Council meets its legislative responsibilities by providing an
ethical basis for good governance which facilitates informed and transparent
decision making. The role of the Risk and Compliance team is to help ensure
a safe workplace and protect Council from negative outcomes through good
risk management processes; and to provide services with a fair and
consistent application of legislation and processes to ensure that employees
and community enjoy a safe and sustainable environment.
Business
Transformation
This service includes information systems, information services, marketing
and communications, corporate planning and performance continuous
improvement. It delivers appropriate and cost effective technology, which
supports Mitchell Shire Council and its employees in delivering services to
the community. The Information Services unit provides vital services
concerning the management, maintenance and disposal of all corporate
information according to government legislation, Council strategy, policy,
established procedures and business rules. Corporate planning and
performance assists with capacity building at an organisational level.
Continuous improvement helps facilitate progress and process enhancement.
The Communications and Marketing unit oversees all marketing and public
relations activities associated with the organisation.

23
2.7 Performance Statement
The service performance indicators detailed in the preceding pages will be reported in the
Performance Statement. This is prepared at the end of the year as required by section 132 of the
Act and included in the 2015/16 Annual Report. The Performance Statement will also include
reporting on prescribed indicators of financial performance (outlined in Section 8) and sustainable
capacity, which are not included in this budget report. The full set of prescribed performance
indicators is audited each year by the Victorian Auditor General who issues an audit opinion on the
Performance Statement. The major initiatives detailed above will be reported in the Annual Report
in the form of a statement of progress in the report of operations.
2.8 Reconciliation with budgeted operating result
* General Grants Commission Grants and Cash and Non Cash Capital Contributions
Information
Systems
Service Indicator
Governance Satisfaction
Service Performance Outcome Indicators
Capital Initiatives - see appendix C for a detailed listing of proposed works
Add Kilmore Maternal Child Health (MCH) Centre to microwave network - upgrade of
internet connection at the Kilmore MCH centre.
Performance Measure Computation
Satisfaction with Council
decisions
(Community satisfaction
rating out of 100 with how
Council has performed in
making decisions in the
interests of the community)
Community satisfaction
rating out of 100 with how
Council has performed in
making decisions in the
interests of the community
Net Cost
(Revenue) Expenditure Revenue
$’000 $’000 $’000
23,595 26,253 (2,658)
8,663 14,424 (5,761)
736 740 (4)
3,323 5,090 (1,767)
9,277 10,151 (874)
45,594 56,658 (11,064)
(12,807)
32,787
36,005
5,193
41,198
8,411
Deficit before funding sources
Funding sources:
Rates & charges
Capital grants
Total funding sources Surplus for the year
Healthy and vibrant communities
Strong reputation and economy
Environmental resilience
Organisational capacity and performance
Total services and initiatives
Other non-attributable *
Sustainable growth and development

24
3. Budget influences
This section sets out the key budget influences arising from the internal and external environment
within which Council operates.
3.1 Snapshot of Mitchell Shire
Location
The southern part of Mitchell Shire lies within Melbourne’s designated growth boundary, while the
central and northern parts of the Shire retain a largely rural landscape, requiring us to plan for and
balance the needs of very diverse populations. In addition, Mitchell Shire is on the nationally
significant transport corridor between Melbourne and Sydney.
Along with easy access into Melbourne and an enviable country lifestyle, we have a long and
diverse history, established communities and a depth of culture and heritage. Our increasing
integration with metropolitan Melbourne is driving population growth, making Mitchell one of the
fastest growing municipalities in Victoria
Mitchell Shire covers an area of 2,864 square kilometres and is one of the largest geographic
municipalities in Victoria. The Shire incorporates the townships of Beveridge, Broadford, Heathcote
Junction, Kilmore, Puckapunyal, Pyalong, Reedy Creek, Seymour, Tallarook, Tooborac, Wallan
and Wandong as well as extensive rural areas.
Mitchell shares boundaries with Hume and Whittlesea to the south, Macedon Ranges, Mount
Alexander and Greater Bendigo to the west, Strathbogie to the north and Murrindindi to the east.
Population
In 2013, Mitchell was home to just over 37,366 residents across a mix of urban and rural
communities and is forecast to grow at around 3-4% per annum. By 2036 the population is
forecast to grow to 89,214, which will see 51,818 new residents move to Mitchell Shire between
2011 and 2036. More than 80% of this growth is expected to occur around Wallan and Beveridge,
and in the new suburbs of Lockerbie and Lockerbie North. Our Shire is comprised of 35% of
residents aged below 25 whilst less than 18% of the population are aged over 60 years.
Cultural Diversity
As we grow, our community will become increasingly culturally and linguistically diverse. The 2011
Census identified that 3,806 people living in Mitchell Shire were born overseas and 15% arrived
in Australia within the last 5 years. Of these, 6% of people speak a language other than English at
home, predominantly Italian, Greek or Maltese.
Households
At the 2011 Census, there were 13,844 dwellings in Mitchell with just over 90% being separate
houses.
Overall, family households account for just over 46% of total households in Mitchell, whilst single
person households account for one in five (20%). Couples without children make-up just over 25%
of households with is slightly higher than the average for metropolitan Melbourne.
Over recent years the Shire has experienced growth in residential development, mainly in new
estates within Kilmore, Wallan and Beveridge.

25
Industry and Economy
Key industry sectors by employment include construction, manufacturing, retail, agriculture and
defence. The Puckapunyal Army Base is the largest employer in the municipality, followed by
Council.
The majority of businesses in Mitchell Shire are sole-traders and the micro-small business sector
constitutes the majority of all business activity.
Balancing Needs
In preparing our capital programs we must balance asset renewal against upgrade and build new
infrastructure to meet the needs of our growing community. In doing so, Council takes into account
the projected future increase in population and also the demographics within that population (e.g.
there is a projected 59% increase in people of retirement age living in Mitchell Shire by 2021).
3.2 External influences
This section explains Council’s approach to maintaining its financial sustainability in both the short
and longer-term. This involves the management of short-term budget influences within the context
of longer-term challenges.
Financial sustainability is a key challenge for all governments.
Council manages its finances through an annual budget, which identifies the expected revenue
and expenditure for each year. The Budget is the means by which Council makes a formal
commitment of resources to provide funding for services and projects.
A medium-term perspective is provided by the Strategic Resource Plan (SRP), which forms part
of the Council Plan. This provides a four-year forecast of revenues and expenditures based on a
series of assumptions. It identifies the resources necessary to implement the Council Plan over
the next four years.
In preparing the Proposed 2015/16 Budget, a number of external influences have been taken into
consideration as they are likely to impact significantly on the services delivered by Council in the
budget period. These are outlined below:
• Superannuation – Council has an ongoing threat to fund any investment shortfalls in the
Defined Benefits Scheme. The last call on Local Government was in the 2012/13. Mitchell
was required to pay $2.6 million to top up its share of the Defined Benefits Scheme. The
amount and timing of any liability is dependent on the global investment market. At present
the actuarial ratios are at a level that additional calls from Local Government are not expected
in the next 12 months. Given Council’s current financial constraints, additional borrowing
would be required to be drawn should a call be made in relation to unfunded Defined Benefits
Scheme contributions.
• Cost Shifting - The largest source of government funding to Council is through the annual
Victorian Grants Commission allocation. The overall State allocation is determined by the
Federal Financial Assistance Grants to which a freeze on general indexation has been applied
resulting in a loss of expected revenue to Council. Furthermore the level of State and Federal
Government funding towards recurring services such as school crossing or libraries services

26
has lost pace in real terms, as cost increases are higher than revenue increases, resulting in
a further reliance on rates revenue to meet service delivery expectations.
Cost shifting remains a real concern for local government. As other tiers of government
change or implement new legislation it creates a need for council to allocate resources
accordingly, which in turn can mean a real impact is felt at a local level. Together with
reduction in revenues, the shift of service or reporting responsibilities onto local government
without adequate funding places additional strain on council finances and staffing resources.
• Enterprise Bargaining Agreement (EBA) – Council’s current EBA is for the 3 years ending 30
June 2017 which provides annual wage increases to staff at a level of 3% per annum.
• Rate Capping - In the approach to the 2014 State Government Election, Labor made a clear
commitment to the Victorian community of their intention to introduce a model of rate capping,
ensuring that all local governments justify any rate increase above a certain level. Although
rate capping does not come into effect until the 2016/17 year it has effected the medium term
projections in which the budget has been prepared.
• Population growth - Challenges in this area include having sufficient capacity to provide the
infrastructure and services to these growing communities within the timeframes and level
expected.
3.3 Internal influences
As well as external influences, there are a number of internal influences which are expected to
impact on the 2015/16 Budget. These include:
• Landfill Provision – During the 2014/15 financial year a Waste Review was undertaken and
updated future cost estimates for landfill rehabilitation work required to be completed over the
short to long term were provided. The updated financial requirements caused an increase in
both the current and non-current landfill provision. This increase also impacted Council’s
liquidity ratio. As Capital expenditure for rehabilitation is undertaken in the future the provision
will be reduced. The revised estimates have resulted in a $2.99 million provision increase to
the 2014/15 forecast. Council will be undertaking further work during 2015 to ensure future
expenditure requirements are as accurate as possible.
• Underlying Result - In order to continue to address Council’s historic trend of running
underlying deficits and insufficient cash backing of reserves, while remaining mindful of the
impact on residents, Council has proposed a rate increase of 6.9%. Although this increase is
higher than preferred is nevertheless a reduction from the 8.5% proposed in last year’s
Strategic Resource Plan.
• Cash reserves - While Council rebuilds its cash reserves it will receive less revenue from
interest on investments, as well as being unable to commit to capital works that were to be
funded from discretionary reserves, which current cash levels do not adequately fund.
• Working Capital - Council requires a certain level of cash to be able to meet its daily obligations
(working capital). Current levels of cash do not adequately cover our short term requirements.

27
• Operating expenditure - To minimise the proposed rate increase, Council has contained costs
and reduced planned expenditure to the point where overall operating costs for 2015/16 are
projected to increase by 0.3% of the 2014/15 adopted budget levels (excluding depreciation).
• Restructure - Council undertook an organisational restructure in 2014/15, designed to reflect
its operational needs over the next 2 - 4 years. This resulted in an employee cost savings of
over $1 million and is reflected in the 2015/16 budget and future year estimates in the SRP.
• Service Planning - The current SRP reflects the cost of Council’s services at existing service
levels. Within the financial constraints of rate capping from 2016/17, financial modelling
highlights that this mix of services is no longer affordable. Council will need to review and
prioritise its service planning and delivery, taking community consultation into account.
Improved operating position is required to enable provision of sufficient funds to renew existing
assets required to deliver its services as well as provision of new infrastructure in the urban
growth zone. Without changes to existing service delivery, current cost containment measures
are likely to only have a small impact.
• Shire Demographics – Some pockets of the Shire include a lower socio-economic
demographic reflecting disadvantaged communities requiring higher levels of support.
3.4 Budget principles
In response to these influences, guidelines were prepared and distributed to all Council officers
with budget responsibilities. The guidelines set out the key budget principles upon which the
officers were to prepare their budgets. The principles include:
• Existing fees and charges to be increased by no more than 3%
• Grants to be based on confirmed funding levels;
• New revenue sources to be identified where possible;
• Service levels to be maintained at 2014/15 levels with an emphasis on innovation and
efficiency;
• Salaries and wages have been increased based on the Enterprise Bargaining Agreement and
reduced based on staffing levels determined by the organisational restructure in 2014/15;
• Construction and material costs to increase in line with the Engineering Construction Index;
• Real savings in expenditure and increases in revenue identified in 2014/15 to be preserved;
and
• Operating revenues and expenses arising from completed 2014/15 capital projects to be
included.

28
3.5 Long term strategies.
Including a number of long term strategies and contextual information helps Council to prepare
the Budget in a proper financial management context. These include a Strategic Resource Plan
for 2015/16 to 2018/19 (Section 8), Rating Information (Section 9) and Other Long Term Strategies
(Section 10) including borrowings and infrastructure.
4. Analysis of operating budget
This section analyses the operating budget including Council’s expected income and expenses for
the 2015/16 year.
4.1 Budgeted income statement
4.1.1 Adjusted underlying deficit ($1.33 million decrease)
The adjusted underlying result is the net surplus or deficit for the year adjusted for non-recurrent
capital grants, non-monetary asset contributions, and capital contributions from other sources. It
is a measure of financial sustainability and Council’s ability to achieve its service delivery objectives
as it is not impacted by capital income items which can often mask the operating result. The
adjusted underlying result for the 2015/16 year is a deficit of $3.11 million which is an
improvement of $1.33 million from the 2014/15 year. In calculating the adjusted underlying result,
Council has excluded grants received for capital purposes which are non-recurrent and capital
contributions from other sources. Furthermore, contributions of non-monetary assets are excluded
as the value of assets assumed by Council is dependent on the level of development activity each
year.
Note, the adjusted underlying deficit includes revenue from recurrent capital grants (regular grant
funding which must be utilised for capital works expenditure) of $1.65 million.
Forecast Budget VarianceRef 2014/15 2015/16
$’000 $’000 $’000Total income 4.2 62,727 65,104 2,377Total expenses 4.3 (56,138) (56,693) (555)
6,589 8,411 1,8224.2.6 (3,281) (3,543) (262)
(7,377) (7,500) (123)4.2.4 (375) (478) (103)
(4,444) (3,110) 1,334Adjusted underlying surplus (deficit)
Surplus (deficit) for the yearGrants - non-recurrent capital Contributions - non-monetary assetsCapital contributions - other sources

29
4.2 Income
Source: Appendix A
Forecast Budget VarianceIncome Types Ref 2014/15 2015/16
$’000 $’000 $’000Rates and charges 4.2.1 33,396 36,005 2,609Statutory fees and fines 4.2.2 523 530 7User fees 4.2.3 6,013 5,535 (478)Contributions - monetary 4.2.4 375 478 103Contributions - non-monetary assets 4.2.5 7,377 7,500 123Grants - operating 4.2.6 9,688 9,266 (422)Grants - capital 4.2.7 4,583 5,193 610
4.2.8 - - - Other income 4.2.9 772 597 (175)Total income 62,727 65,104 2,377
Net gain on disposal of property, infrastructure, plant & equip.

30
4.2.1 Rates and charges ($2.61 million increase)
Total revenue from rates and charges is projected to be $36.01 million, an increase of 7.8% from
the 2014/15 forecast. This is inclusive of 6.9% increase to the 2014/15 base plus 0.9% from
growth in rateable properties. It is proposed the garbage charge ($305 pa full service) and the
municipal charge ($299) will be held at 2014/15 levels. Section 9 “Rating Information” includes a
more detailed analysis of the rates and charges to be levied for 2015/16.
Information on rates and charges specifically required by the Regulations is included in Appendix
B.
4.2.2 Statutory fees and fines ($0.007 million increase)
Statutory fees and fines relate to fees and fines levied in accordance with legislation and include
Public Health and Wellbeing Act 2008 registrations, animal control, and parking fines, as well as
town planning permits and subdivision fees.
Increases in statutory fees are made in accordance with legislative requirement and are not set by
Council. Income from Statutory fees and fines are in line with estimates in the 2014/15 forecast.
Some statutory fees are not being increased.
4.2.3 User fees ($0.48 million decrease)
User charges relate mainly to the recovery of service delivery costs through the charging of fees to
users of Council’s services. These include separate rating schemes, use of leisure, entertainment
and other community facilities and the provision of community services such as kindergartens. In
setting the budget, the key principle for determining the level of user charges has been to align
increases with CPI or market levels.
Revenue from user charges is projected to decrease by 7.9% or $0.48 million compared to
2014/15. The main area contributing to the decrease is Waste management ($0.32 million),
predominantly as a result of a neighbouring shire no longer using the Mitchell landfill for its
operations. This will be partially offset by a reduction in EPA levy expenditure. Other decreases
include: $50K reduction in ex-gratia income, $90K reduction in recovery of legal fees (with
equivalent reduction in debt collection costs), $27K reduction in relation to emergency
management (sponsorship and contributions towards the regenerate event included in 2014/15).
A detailed listing of fees and charges is included in Appendix D.
4.2.4 Contributions - cash ($0.1 million increase)
Contributions relate to monies paid by developers in regard to public recreation, drainage and car
parking in accordance with planning permits issued for property development.
Contributions are projected to be higher than 2014/15 levels at $0.48 million based on expected
development activity. These contributions can only be used for specific purposes and monies
collected are to be directed to new capital in the townships in which the contributions were
collected. These contributions are tracked via statutory reserves. Any unspent contributions are
transferred into reserves for the township to which they relate.

31
4.2.5 Contributions – Non-Monetary Assets ($0.12 million increase)
Developer Contributions (non-cash) are those assets that form part of the new developments that
are given to Council at handover for ongoing maintenance (e.g. roads, drainage and open
space). Accounting Standards require non-cash developer contributions to be shown as income.
Developer contributions have fluctuated over recent years. The amounts included in the
2015/16 Budget and SRP 2016-19 are based on current year forecasts and expected continued
development in the Shire.
4.2.6 Grants - operating ($0.42 million decrease)
Operating grants include all monies received from State and Federal sources for the purposes of
funding the delivery of Council’s services. Overall, the level of operating grants has decreased by
4.4% or $0.42 million compared to 2014/15. A list of operating grants by type and source,
classified into recurrent and non-recurrent, is included below.
4.2.7 Grants - capital ($0.61 million increase)
Capital grants include all monies received from State, Federal and community sources for the
purposes of funding the capital works program. Overall the level of capital grants have increased
by 13.3% or $0.61 million compared to 2014/15 due mainly to the mix of projects undertaken and
Forecast Budget VarianceOperating Grant Funding Type 2014/15 2015/16
$’000 $’000 $’000Recurrent - Commonwealth Government
6,422 6,551 129 9 9 - 5 2 (3) 44 45 1
1,598 1,619 21 359 348 (11) 275 269 (6) 60 60 - 45 62 17 44 28 (16) 9 - (9) 8,870 8,993 123
319 164 (155) 100 14 (86)
Strategic Planning 147 - (147) 106 - (106) 66 12 (54) 25 37 12 6 - (6) 4 - (4) 4 4 - 1 1 - 40 41 1 818 273 (545)
9,688 9,266 (422)
Community services Aged care Environmental planning Total recurrent grants
Recurrent - State Government
Family and children Maternal and child health Libraries School crossing supervisors
Victorian Grants Commission * Maternal and child health Family and children Other (Roads of Access)
Non-recurrent - State Government
Local laws Family and children Other (Fire Services Property Levy) Total non-recurrent grants
Total Operating Grants
Recreation Libraries
Emergency management Environmental planning
Community services Youth services Maternal and child health

32
their specific funding. Section 6. “Analysis of Capital Budget” includes a more detailed analysis of
the grants and contributions expected to be received during 2015/16.
The most significant loss in capital works funding is the Country Roads and Bridges grant ($1
million p.a) that will not be renewed for the 2015/16 year. Over the recent years, Council has
come to rely on the funding to contribute towards to the renewal and upkeep of its roads and
bridges. In addition, there has been no continuation of the Local Government Infrastructure
program into 2015/16 (which funded $0.48 million in capital works in the 2014/15 year).
Increases to the funding include $0.83 million Roads to Recovery funds. Past funding of this
program was set at $1 million per annum, however the current funding agreement has been
reduced to $0.82 million per annum with a double allocation in 2015/16 at $1.65 million. Other
increases include $2 million for a new early learning facility and $1 million in relation to the
Seymour Flood Levee (which relates to land acquisition for the flood levee scheduled in the
2016/17 capital works program).
Mitchell Shire has been identified as one of 7 growth Councils specifically earmarked to absorb
Melbourne’s future urban growth and development and major transport interchanges, yet our
current budget base is significantly lower than all other growth councils. This highlights the need
for Victorian and Federal Government funding to enable us to plan strategically for the long and
medium term and provide the infrastructure requirements of our growing populations. Mitchell
Shire Council is committed to advocating on behalf of it’s Community to achieve the required
funding.
4.2.8 Net gain on sale of assets
Proceeds from the sale of Council assets is forecast to be $0.87 million for 2015/16 and relates to
the planned cyclical replacement of part of the plant and vehicle fleet ($0.47million) and sale of
property surplus to Council’s requirements ($0.40). The written down value of assets sold is
forecast to be $0.87 million. Note, the property sales formed part of the funding of the 2014/15
Forecast Budget Variance2014/15 2015/16
$’000 $’000 $’000Recurrent - Commonwealth Government
823 1,650 827 - - -
479 - (479) 1,302 1,650 348
1,000 - (1,000) Other Bridge funding - 148 148 Drainage 73 49 (24)
10 - (10) 211 - (211) 150 30 (120) 207 - (207) 250 1,066 816 1,333 - (1,333)
Recreational, leisure and community facilities - 2,250 2,250 47 - (47) 3,281 3,543 262
4,583 5,193 610
Recurrent - State Government Local Government Infrastructure Program
Total Capital Grants
Waste Roads
Total recurrent grants
Non-recurrent - State Government
Country Roads & Bridges
Road Safety Land Acquisition*
Libraries
Parks and Open Space
Other Capital Total non-recurrent grants
Capital Grant Funding Type and Source
Roads to Recovery

33
budget, however due to delayed timing of the sale, are now anticipated to be received in the
2015/16 year and part fund the carried forward projects from the 2014/15 capital works program.
4.2.9 Other income ($0.17 million decrease)
Other income relates to a range of income items including interest revenue on investments and
rate arrears, rent income, facility hire and reimbursements.
Other income is forecast to decrease by 22% or $0.17 million compared to 2014/15.
Reimbursements are expected to decrease by $0.13 million from the 2014/15 forecast. Of this,
$45K relates to a change in the way the State Revenue Office charges Council for the general
revaluation of properties (reflected in an offsetting reduction in expenditure), $15K is as a result of
reduced training subsidies. Interest on unpaid rates is forecast to decrease by $30K compared to
2014/15 following an anticipated decrease in the level of unpaid rates during 2015/16. Interest on
investments is forecast to decrease by $15K.
4.3 Expenses
Source: Appendix A
Forecast Budget VarianceExpense Types Ref 2014/15 2015/16
$’000 $’000 $’000Employee costs 4.3.1 23,271 23,349 (78)Materials and services 4.3.2 18,441 18,221 220Bad and doubtful debts 4.3.3 39 34 5
4.3.4 11,548 11,988 (440)Borrowing costs 4.3.5 902 1,103 (201)Other expenses 4.3.6 1,937 1,998 (61)Total expenses 56,138 56,693 (555)
Depreciation and amortisation

34
2015/2016 Budgeted Expenses
4.3.1 Employee costs ($0.08 million increase)
Employee costs include all labour related expenditure such as wages and salaries and on-costs
such as allowances, leave entitlements, employer superannuation, rostered days off, etc.
Employee costs are forecast to increase by 0.3% or $0.08 million compared to the 2014/15 end
of financial year forecast. This increase relates to:
Vacancies throughout the year not being included in the forecast for 2014/15 (some, but
not all of which, would have been backfilled using contract labour and not reflected in the
employee costs line);
One off costs associated with the organisational restructure are included in the 2014/15
forecast;
Increases in relation to Council’s Enterprise Bargaining Agreement (EBA) have been
applied; and
The cost of Fringe Benefits Tax has been increased to reflect changed calculation rates.
A summary of human resources expenditure categorised according to Council’s structure is
included below:
Budget Permanent PermanentDepartment 2015/16 Full Time Part Time
$'000 $'000 $'000Executive 361 361 - Sustainable Communities 9,787 5,700 4,087 Engineering & Infrastructure 6,490 6,093 397 Corporate Services 3,843 3,471 372
20,481 15,625 4,856 2,868
Capitalised labour costs 501 Total expenditure 23,850
Comprises
Total permanent staff expenditureCasuals and other expenditure

35
During the 2014/15 budget process Council’s CEO announced an organisational restructure to be
effected during 2014/15. The restructure was designed to reflect Council’s business needs for the
next 2-4 year period, recognising that Council is experiencing medium-term financial challenges.
The target of $1 million in savings in employee costs was achieved in 2014/15 and is reflected in
the forecast when compared to 2014/15 budget of $24.24 million. The current structure is
reflected in the 2015/16 budget for employee costs. Council will evaluate vacancies and team
structures as the opportunity arises with a view to continuously ensuring fit for purpose and where
possible achieving efficiencies and savings.
A summary of the number of full time equivalent (FTE) Council staff in relation to the above
expenditure is included below:
4.3.2 Materials and services ($0.22 million decrease)
Materials and services include the purchases of consumables, payments to contractors for the
provision of services and utility costs. Materials and services are forecast to decrease by 1.20% or
$0.22 million compared to 2014/15. Many small efficiencies and alterations were achieved and
material changes include a:
Major increase of $0.63 million in strategic planning projects (including town structure
planning and implementation)
Reduction in debt collection costs of $0.15 million due to a backlog in 2015 which affected
the 2014/15 year only.
Reductions due to a once off projects included in the 2014/15 contractors forecast for the
Kilmore Flood Mitigation $0.13 million, Kilmore Town Centre Revitalisation project $0.18
million, Economic Development $0.07 million, Kilmore Wallan bypass $0.08million, Wallan
& Seymour hub Feasibility study $0.08 million, Cyber Tattoo Program $0.03 million,
Heritage grants/signs $0.06 million, Emergency Response $0.05 million.
Increase to Information Technology Software and licences of $0.20 million
4.3.3 Bad and doubtful debts
Bad and doubtful debts are in line with 2014/15 forecast projections.
4.3.4 Depreciation and amortisation ($0.44 million increase)
Depreciation is an accounting measure which attempts to allocate the value of an asset over its
useful life for Council’s property, plant and equipment including infrastructure assets such as roads
and drains. The increase of $0.44 million for 2015/16 is due mainly to the completion of the
2015/16 capital works program, the full year effect of depreciation on the 2014/15 capital works
Budget Permanent PermanentDepartment FTE Full Time Part TimeExecutive 2 2 - Sustainable Communities 118 60 58 Engineering & Infrastructure 82 76 6 Corporate Services 42 37 5
Total 244 175 69 Casuals and other 30 Capitalised labour costs 7 Total staff 281
Comprises

36
program and contributed assets. Refer to section 6. ‘Analysis of Capital Budget’ for a more detailed
analysis of Council’s capital works program for the 2015/16 year.
4.3.5 Finance costs ($0.20 million increase)
Borrowing costs relate to interest charged by financial institutions on funds borrowed. The increase
in borrowings costs relate to additional borrowings to be drawn down at the end of 2014/15 and
during 2015/16. Refer to section 10.1 for further details in relation to new borrowings.
4.3.6 Other expenses ($0.06 million increase)
Other expenses relate to a range of unclassified items including contributions to community
groups, councillor allowances, EPA landfill levy and other miscellaneous expenditure items. Other
expenses have increased less than 2% compared to 2014/15.
5. Analysis of budgeted cash position
This section analyses the expected cash flows from Council’s operating, investing and financing
activities for 2015/16. Budgeting cash flows for Council is a key factor in setting the level of rates
and providing a guide to the level of capital expenditure that can be sustained with or without using
existing cash reserves.
The analysis is based on three main categories of cash flow:
Operating activities - Refers to the cash generated or used in Council’s normal service delivery
functions. Cash remaining after paying for the provision of services to the community may be
available for investment in capital works, or repayment of debt
Investing activities - Refers to cash generated or used in the enhancement or creation of
infrastructure and other assets. These activities also include the acquisition and sale of other
assets such as vehicles, property and equipment
Financing activities - Refers to cash generated or used in the financing of Council functions
and include borrowings from financial institutions and advancing of repayable loans to other
organisations. These activities also include repayment of the principal component of loan
repayments for the year.

37
5.1 Budgeted cash flow statement
Source: Appendix A
Forecast Budget VarianceRef 2014/15 2015/16
$’000 $’000 $’000Cash flows from operating activities 5.1.1Receipts
Rates and charges 34,711 35,833 1,122User fees and fines 6,645 6,065 (580)Grants - operating 9,688 9,266 (422)Grants - capital 6,272 5,193 (1,079)Interest 425 415 (10)Other receipts 722 660 (62)
58,463 57,432 (1,031)Payments
Employee costs (23,447) (23,334) 113Other payments (20,256) (20,092) 164
(43,703) (43,426) 27714,760 14,006 (754)
Cash flows from investing activities 5.1.2Payments for property, infrastructure, plant & equipment (13,334) (15,896) (2,562)Proceeds from sale of property, infrastructure, plant & equipment 698 872 174Payments for investments - - - Proceeds from investments - - - Loans and advances made - - - Repayments of loans and advances - - -
(12,636) (15,024) (2,388)
Cash flows from financing activities 5.1.3 Finance costs (902) (1,103) (201)Proceeds from borrowings 500 4,750 4,250Repayment of borrowings (1,534) (1,842) (308)
(1,936) 1,805 3,741188 787 599
9,310 9,498 188Cash and cash equivalents at end of the year 5.1.4 9,498 10,285 787
Net decrease in cash and cash equivalents Cash and cash equivalents at the beginning of the year
Net cash provided by operating activities
Net cash used in investing activities
Net cash used in financing activities

38
5.1.1 Operating activities ($0.75 million decrease)
The decrease in cash inflows from operating activities is due an decrease in total receipts of $1.03
million, mainly as a result of $1.12 million increase in rates receipts, a decrease in grant receipts
of $1.50 million and a decrease in user fees of $0.58 million. The increase in rate receipts
compared to the 2014/15 forecast is less than a 6.9% increase in rate revenue because of the
anticipated reduction in outstanding rates. An increased focus on debt recovery has commenced
during the 2014/15 year.
The net cash flows from operating activities does not equal the surplus (deficit) for the year as the
expected revenues and expenses of the Council include non-cash items which have been excluded
from the Cash Flow Statement. The budgeted operating result is reconciled to budgeted cash flows
available from operating activities as set out in the following table.
5.1.2 Investing activities – net cash used ($2.39 million increase)
The increase in payments for investing activities represents 2014/15 projects that will be carried
forward and completed in 2015/16 and the new capital works projects for 2015/16 as detailed in
section 6. Proceeds from sale of assets reflect the expected cash flow from asset sales including
the deferral of $0.4 million property sales from 2014/15 into 2015/16 to fund the 2014/15 capital
works program.
5.1.3 Financing activities ($3.74 million increase)
The increase is due to the borrowings in relation to strategic land purchases in the South of the
Shire ($4.5 million, being $3.5 million deferred from the 2014/15 budget and $1 million
additional funding required) and stage 2 of the Seymour Flood Levee ($0.25M). Finance costs
and repayment of borrowings have increased as a result of the full year effect of the new
borrowing in 2014/15 and new borrowings during 2015/16.
5.1.4 Cash and cash equivalents at end of the year ($0.79 million increase)
Overall, total cash and investments is forecast to increase by $0.79 million to $10.29 million as at
30 June 2016. Council is currently focused on building cash levels to an appropriate level and
this can be seen in reduced capital works programming from 2015/16 onwards.
5.2 Restricted and unrestricted cash and investments
Cash and cash equivalents held by Council are restricted in part, and not fully available for
Council’s operations. The budgeted cash flow statement above indicates that Council is estimating
it will have cash and investments of $10.29 million at 30 June 2016, which is restricted as shown
in the following table.
Forecast Budget Variance2014/15 2015/16
$’000 $’000 $’000Surplus (deficit) for the year 6,589 8,411 1,822Depreciation 11,548 11,988 440Loss (gain) on disposal of property, infrastructure,plant & equipment
- - -
Finance costs 902 1,103 201Non cash contribution (7,377) (7,500) (123)Net movement in current assets and liabilities (excluding landfill provision which is non cash) 3,098 4 (3,094)
14,760 14,006 (754)Cash flows available from operating activities

39
The above reconciliation shows that while Council has sufficient funds to undertake operations, it
is using restricted cash balances to do so. This is further evidence of the need to build cash
levels and focus on building working capital in the immediate future.
5.2.1 Statutory reserves ($5.45 million)
These funds must be applied for specified statutory purposes in accordance with various
legislative requirements. While these funds earn interest revenues for Council, the funds are not
available for other purposes. During the 2015/16 year $1.55 million is budgeted to be transferred
to Statutory Reserves which represents $0.48 million developer contributions forecast to be
received during the year and $1.07 million unspent grant for Seymour flood levee expected to be
received in 2015/16 and spent in 2016/17. $0.2 million is budgeted to be transferred out of
Statutory Reserves being LGIP funding already received to be used to partially fund the
Broadford Sports Pavilion in 2015/16.
5.2.2 Cash held to fund carry forward capital works ($1.21 million)
An amount of $1.21 million is forecast to be held at 30 June 2015 to fund capital works budgeted
but not completed in the 2014/15 financial year. This represents total capital works carried
forward into 2015/16 ($5.35 million) less carried forward funding sources of grants ($0.23 million),
borrowings ($3.5 million) and property sale proceeds ($0.4 million). Refer to section 6 for further
details.
5.2.3 Unrestricted cash and investments ($2.62 million)
Council’s projected cash position at 30 June 2016 shows a balance of unrestricted cash of $2.62
million. This is forecast closing cash balance at 30 June 2015 less cash required to be held for
statutory reserves and trust funds.
Forecast Budget VarianceRef 2015 2016
$’000 $’000 $’000Total cash and investments 9,498 10,285 787Restricted cash and investments- Statutory reserves 5.2.1 (4,108) (5,453) (1,345)- Cash held to carry forward capital works 5.2.2 (1,213) - 1,213- Trust funds and deposits (2,209) (2,209) - Unrestricted cash and investments 5.2.3 1,968 2,623 655
- Discretionary reserves 5.2.4 (8,552) (9,222) (670)Unrestricted cash adjusted for discretionary reserves 5.2.5 (6,584) (6,599) (15)
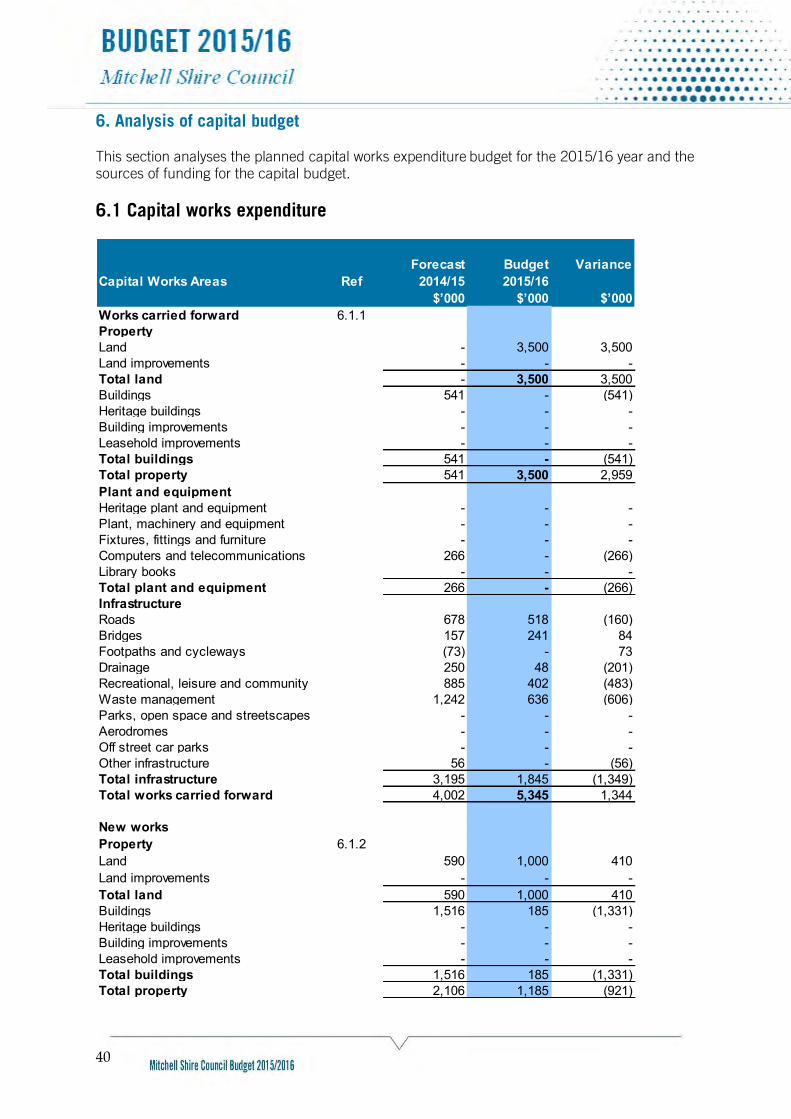
40
6. Analysis of capital budget
This section analyses the planned capital works expenditure
budget for the 2015/16 year and the
sources of funding for the capital budget.
6.1 Capital works expenditure
Forecast Budget VarianceCapital Works Areas Ref 2014/15 2015/16
$’000 $’000 $’000Works carried forward 6.1.1PropertyLand - 3,500 3,500 Land improvements - - - Total land - 3,500 3,500 Buildings 541 - (541)Heritage buildings - - - Building improvements - - - Leasehold improvements - - - Total buildings 541 - (541)Total property 541 3,500 2,959 Plant and equipmentHeritage plant and equipment - - - Plant, machinery and equipment - - - Fixtures, fittings and furniture - - - Computers and telecommunications 266 - (266)Library books - - - Total plant and equipment 266 - (266)InfrastructureRoads 678 518 (160)Bridges 157 241 84 Footpaths and cycleways (73) - 73 Drainage 250 48 (201)Recreational, leisure and community 885 402 (483)Waste management 1,242 636 (606)Parks, open space and streetscapes - - - Aerodromes - - - Off street car parks - - - Other infrastructure 56 - (56)Total infrastructure 3,195 1,845 (1,349)Total works carried forward 4,002 5,345 1,344
New worksProperty 6.1.2Land 590 1,000 410 Land improvements - - - Total land 590 1,000 410 Buildings 1,516 185 (1,331)Heritage buildings - - - Building improvements - - - Leasehold improvements - - - Total buildings 1,516 185 (1,331)Total property 2,106 1,185 (921)

41
2015/16 Budgeted Capital Works Expenditure
Source: Appendix A. A detailed listing of the capital works program is included in Appendix C.
Forecast Budget VarianceCapital Works Areas Ref 2014/15 2015/16
$’000 $’000 $’000Plant and equipment 6.1.3Heritage plant and equipmentPlant, machinery and equipment 1,668 1,350 (318)Fixtures, fittings and furniture - - - Computers and telecommunications 313 348 35 Library books 160 150 (10)Total plant and equipment 2,141 1,848 (293)Infrastructure 6.1.4 - Roads 2,781 2,237 (544)Bridges 782 500 (282)Footpaths and cycleways 110 385 275 Drainage 217 345 129 Recreational, leisure and community 1,082 3,160 2,078 Waste management 8 636 628 Parks, open space and streetscapes - 220 220 Aerodromes - - - Off street car parks - - - Other infrastructure 106 35 (71)Total infrastructure 5,086 7,518 2,433 Total new works 9,333 10,551 1,218
Total capital works expenditure 13,334 15,896 2,562
Represented by:New asset expenditure 6.1.5 3,087 7,715 4,628 Asset renewal expenditure 6.1.5 7,982 6,814 (1,168)Asset upgrade expenditure 6.1.5 1,580 1,292 (288)Asset expansion expenditure 6.1.5 685 75 (610)Total capital works expenditure 13,334 15,896 2,562

42
6.1.1 Carried forward works ($5.35 million)
At the end of each financial year there are projects which are either incomplete or not commenced
due to factors including planning issues, weather delays and extended consultation. For the
2014/15 year it is forecast that $5.35 million of capital works will be incomplete and be carried
forward into the 2015/16 year. The more significant projects include:
• Strategic property purchase in the South of the Shire ($3.50 million, decision pending,
currently under consideration by Council);
• Smiths Bridge Replacement ($0.04 million This project is being managed by Bendigo City
Council as part of a border agreement . The total cost of this project has been reduced
considerably from its original estimates as a result $0.2 million grant funding from LGIP
has been reallocated to the Broadford Sports pavilion in the 2015/16 budget;
• Old Goulburn River Bridge Safety Works ($0.09 million, Works suspended due to safety
concerns with heritage structure);
• Willowmavin Road Bridge Replacement ($0.11 million, manufacturing of pre-cast bridge
beams to minimise closure of road during works will delay anticipated start and completion
date);
• Mill Street (Streetscape Upgrade) ($0.36 million, delay in service relocation and detailed
design work);
• Kings Lane Pavement Improvement ($0.16 million, funding was allocated to Minton Street
before a re-assessment of priorities was undertaken early 2015 – detailed design currently
underway, tender will be advertised in May);
• Rehabilitation of Seymour Landfill ($0.64 million, project delays due to EPA requirements);
and
• Hadfield Park, Wallan - AAA Playground ($0.40 million, partnership opportunities being
explored to significantly broaden the scope of the project).
A full listing of carried forward capital works projects can be found at Appendix C. Final capital
works carry forwards will be included in the June Finance report and then amended in the 2015/16
Q1 forecast.
6.1.2 Property ($1.19 million)
The property class comprises land, land improvements, buildings and building improvements and
heritage buildings.
For the 2015/16 year, $1.19 million will be expended on new property projects. This includes an
amount of $1.0 million set aside for a strategic property purchase in the South of the Shire,
Broadford pound drainage and flooring ($0.04 million), Heating, ventilation and air conditioning
works at 3 sites $(0.13 million) and Municipal Office upgrade ($0.02 million).
6.1.3 Plant and equipment ($1.85 million)
Plant and equipment includes plant, machinery and equipment, computers and
telecommunications, and library books.
For the 2015/16 year, $1.85 million will be expended on this asset class. The more significant
projects include ongoing cyclical replacement of the plant and vehicle fleet ($1.35 million),
upgrade and replacement of information technology ($0.35 million) and library material purchases
($0.15 million).
43
6.1.4 Infrastructure ($7.52million)
Infrastructure includes roads, bridges, footpaths and cycleways, drainage, recreation, leisure and
community facilities, parks, open space and streetscapes, off street car parks and other structures.
For the 2015/16 year, $2.24 million will be expended on road renewal projects. The more
significant projects include William Street (West) Wallan – pavement renewal ($0.46 million), Kings
Lane – Pavement Improvement ($0.43 million), William Street (East) Wallan – pavement renewal
($0.23 million), Re-sheeting programs for Panyule Road - Pyalong ($0.16 million), Queen
Street/Windham Street Wallan – Intersection pavement renewal ($0.12 million), Re-sheeting
programs for Sungarrin Road – Hilldene ($0.11 million), Shoulder repair programme for Minton
Street – Beveridge ($0.11 million)
In 2015/16, $0.50 million will be expended on Bridges. These include the Highlands Road Bridge
($0.35 million) and Manse Hill Road/Northwood Road Bridge ($0.15 million).
Expenditure on Footpaths and Cycleways will be $0.39 million. The more significant of these
include Kilmore Lancefield Road footpath construction ($0.30 million) and Arrowsmith Street,
Beveridge Footpath Renewal ($0.03 million)
$3.16 million will be expended on Recreational, Leisure and Community Facilities, including $2.0
million for the Early Learning Facility at Wallan Primary School, Sports Pavilion Broadford Leisure
Centre Precinct ($0.65 million), Tennis and Netball Court Surface Renewal ($0.20 million) and
Harley Hammond Oval Renovation - Stage 1 ($0.12 million).
Parks Openspace and Streetscapes expenditure of $0.22 million is primarily $0.20 million for
playground renewal,
Expenditure on Waste Management will be $0.64 million with $0.53 million being spent on
upgrade of two leachate ponds at Kilmore and Seymour landfill sites.
Other infrastructure expenditure of $0.04 million is for the upgrade of the Wandong Hall Disabled
Parking Bay.
6.1.5 Asset renewal ($6.81 million), new assets ($7.72 million), upgrade ($1.29
million) and expansion ($0.08 million)
A distinction is made between expenditure on new assets, asset renewal, upgrade and expansion.
Expenditure on asset renewal is expenditure on an existing asset, or on replacing an existing asset
that returns the service of the asset to its original capability. Expenditure on new assets does not
have any element of expansion or upgrade of existing assets but will result in an additional burden
for future operation, maintenance and capital renewal.
The major projects included in the above categories, which constitute expenditure on new assets,
are strategic property purchase in the South of the Shire $4.50 million, Early Learning Facility at
Wallan Primary School $2.0 million and Sports Pavilion Broadford Leisure Centre Precinct $0.65
million. The major projects included constituting renewal expenditure are Roads ($2.24 million),
Plant and Fleet Renewal ($1.35 million), Bridges ($0.85 million), Footpaths and Cycleways ($0.09
million), Buildings ($0.17 million), Information Technology and Systems ($0.26 million) Library
Books ($0.15 million), Recreational, Leisure and Community Facilities ($0.52 million) , Waste
Management ($1.18 million) and Parks, open space and Leisure ($0.22 million). Capital
expenditure representing expansion of existing assets include: Mitchell Landfill Movable Litter Nets
$0.05 million & Corporate Information Systems $0.03 million.

44
The major projects included as upgrades are the existing High Street, Seymour – K&C and
Drainage $0.10 million, Mill Street Streetscape upgrade $0.36 million, Kings Lane pavement
improvement $0.16 million, Old Goulbourn River Bridge $0.09 million and Hadfield Park
playground $0.40 million.
6.2 Funding sources
* Council cash includes unspent grant funding in relation to 2014/15 capital works program.
Forecast Budget VarianceSources of funding Ref 2014/15 2015/16
$’000 $’000 $’000Works carried forwardCurrent year funding
Grants 1,348 232 (1,116)Contributions - - - Borrowings - 3,500 3,500 Council cash- operations - - - - proceeds on sale of assets - 400 400 - reserve cash and investments - - - - unrestricted cash and investments 2,653 1,213 (1,440)Total works carried forward 6.2.1 4,002 5,345 1,343
New worksCurrent year funding
Grants 6.2.2 3,236 3,895 659 Contributions - - - Borrowings 6.2.3 500 1,250 750 Council cash- operations 6.2.4 4,901 4,734 (167)- proceeds on sale of assets 6.2.5 697 472 (225)- reserve cash and investments 6.2.6 - 200 200 - unrestricted cash and investments - - - Total new works 9,334 10,551 1,217 Total funding sources 13,336 15,896 2,560
Source: Appendix A

45
Source: Appendix A
6.2.1 Carried forward works ($5.35 million)
At the end of each financial year there are projects which are either incomplete or not commenced
due to factors including planning issues, weather delays and extended consultation. For the
2014/15 year it is forecast that $5.35 million of capital works will be incomplete and be carried
forward into the 2015/16 year.
Grant funding expected to be received in 2015/16 in respect of works carried over from 2014/15
total $0.23 million. This is made up of Old Goulburn River Bridge Safety Works ($0.15 million),
Seymour Flood Levee ($0.05 million) and Mill Street (Streetscape Upgrade) ($0.03 million).
Borrowings for land acquisition in the South of the Shire ($3.50 million) will be deferred to
2015/16 as will proceeds from sale of property $0.40 million. The balance is funded from
Council’s cash balances ($1.41 million)
6.2.2 Grants ($3.90 million)
Capital grants include all monies received from State and Federal sources for the purposes of
funding the capital works program. Grant funding for new projects for the year totals $3.90 million.
Of this, $2.15 million is to fund new assets including: Early Learning Facility at Wallan Primary
School ($2.0 million) and Sports Pavilion Broadford Leisure Centre Precinct ($0.15 million).
The bulk of the renewal program funded from grants is the Roads to Recovery (R2R) program
($1.65 million). Projects identified for renewal under this program include: William Street (West)
Wallan – Pavement Renewal ($0.46 million), Kings Lane - Pavement Improvement – Kilmore
($0.43 million), William Street (East) Wallan – Pavement Renewal ($0.23 million), Manse Hill
Road/Northwood Road – Bridge renewal ($0.15 million), Re-sheeting Programme for Panyule
Road – Pyalong ($0.16 million) and Queen Street/Windham Street Intersection – Pavement
Renewal ($0.12 million). The remaining renewal project with grant funding is Harley Hammond
oval renovation – stage 1 ($0.09 million).
6.2.3 Borrowings ($1.25 million)
Borrowings for new projects includes an additional $1 million for strategic land purchase in the
South of the Shire and $0.25 million for Stage 2 of the Seymour Flood Levee project (Refer to
section 10.1 for further information on Council’s borrowing strategy)
6.2.4 Council cash - operations ($4.73 million)
Council generates cash from its operating activities, which is used as a funding source for the
capital works program. It is forecast that $4.73 million generated from operations will be used to
fund the 2015/16 capital works program. Cash generated from operations is adjusted for capital
grants that are required to be spent for the purpose of funding, developer contributions that we
will hold until such time that we undertake the works, principle debt repayments and borrowing
costs.
6.2.5 Council cash - proceeds from sale of assets ($0.47 million)
Proceeds from sale of assets include plant and motor vehicle sales in accordance with Council’s
fleet renewal policy of $0.47 million.

46
7. Analysis of budgeted financial position
This section analyses the movements in assets, liabilities and equity between 2014/15 and
2015/16. It also considers a number of key performance indicators.
7.1 Budgeted balance sheet
Source: Appendix A
7.1.1 Current Assets ($0.96 million increase) and Non-Current Assets ($9.40
million increase)
Cash and cash equivalents include cash and investments such as cash held in the bank and in
petty cash and the value of investments in deposits or other highly liquid investments with short
term maturities of three months or less. These balances are projected to increase by $0.79 million
during the year.
Forecast Budget VarianceRef 2014/15 2015/16
$’000 $’000 $’000Current assets 7.1.1Cash and cash equivalents 9,498 10,285 787Trade and other receivables 4,481 4,653 172Financial assets - - - Other assets 224 224 - Total current assets 14,203 15,162 959
Non-current assets 7.1.1Trade and other receivables 23 23 - Investments in joint ventures 5 5 - Property, infrastructure, plant and equipment 421,524 430,879 9,355 Total non-current assets 421,552 430,907 9,355 Total assets 435,755 446,069 10,314
Current liabilities 7.1.2Trade and other payables 5,764 5,941 (177)Trust funds and other deposits 2,209 2,209 - Provisions 4,645 5,413 (768)Interest-bearing loans and borrowings 1,842 1,685 157Total current liabilities 14,460 15,248 (788)
Non-current liabilities 7.1.2Provisions 7,129 5,179 1,950Interest-bearing loans and borrowings 13,589 16,654 (3,065)Total non-current liabilities 20,718 21,833 (1,115)Total liabilities 35,178 37,081 (1,903)Net assets 400,577 408,988 8,411
Equity 7.1.4Accumulated surplus 193,919 200,315 6,396Reserves 206,658 208,673 2,015Total equity 400,577 408,988 8,411
47
Trade and other receivables are monies owed to Council by ratepayers and others. Short term
debtors are expected to increase by $0.17 million from the 2014/15 forecast level. This reflects
the effect of a 6.9% increase on expected balances as at 30 June 2016. Council will continue
efforts to reduce debtor balances, which when collected improve Council’s cash position. Property, infrastructure, plant and equipment is the largest component of Council’s worth and
represents the value of all the land, buildings, roads, vehicles, equipment, etc. which has been
built up by Council over many years. The increase in this balance is attributable to the net result
of projected non cash developer contributions ($7.5 million), the completion of the 2015/16 capital
works program ($15.90 million) the decrease in provision for landfill rehabilitation ($1.18 million),
depreciation of assets ($11.99 million) and sale of property, plant and equipment ($0.87 million).
7.1.2 Current Liabilities ($0.79 million increase) and Non-Current Liabilities ($1.12
million increase)
Trade and other payables are those to whom Council owes money as at 30 June. These liabilities
are budgeted to remain consistent with 2014/15 levels.
Provisions include accrued long service leave, annual leave and rostered days off owing to
employees. These employee entitlements have been held constant due to more active
management of entitlements despite factoring in an increase for Collective Agreement outcomes.
Interest-bearing loans and borrowings are borrowings of Council. Council is budgeting to undertake
new borrowings of $4.75 million and repay loan principal of $1.84 million over the year.
Provision for landfill rehabilitation has been reviewed based on revised assessments of the
rehabilitation required over the next 10 years. Any increase in the provision reflects an increase
in land improvement assets. Capital expenditure for rehabilitation is used to reduce the provision.
An adjustment has been made in the 2014/15 forecast ($2.99 million increase) and the provision
is reduced via capital works expenditure in 2015/16 ($1.18 million). During 2015 Council will be
undertaking a further review of the closed landfill sites to further refine current assessments.
7.1.3 Working Capital ($0.17 million increase)
Working capital is the difference between current assets and current liabilities.
Working capital is forecast to be negative in 2015/16. This means that current liabilities are
more than our current assets. Council therefore runs the risk of not being able to pay its creditors
during the year when they are due. A bank overdraft facility will be activated to cover any cash flow
problems that Council may experience, however council will closely monitor the cash flow during
the year to reduce the need for utilising this facility.

48
The table below shows further restrictions on the use of Council’s cash assets.
Council is still addressing the shortfall in unrestricted funds due to past decisions, the main reason
for the current position is:
Payment of unfunded defined benefits superannuation in full from cash balances of $2.6
million (April 2013);
Council was unable to recover funding from the state government to compensate for the $1.66
million of expenditure incurred in relation to the 2009 Bushfire Recovery; and
In the past, borrowings have been linked to funding the capital works program and then not
drawn down to the level budgeted when the works were undertaken.
The $6.8 million combined effect of the three points above have eroded Councils cash
balances over time, leaving it with poor working capital levels to carry out its day to day
operations. If Council needs to draw on these funds in the short term it will need to be funded
from further borrowings until such time that council has rebuilt cash and cash equivalents to
an appropriate level.
In addition to the restrictions above council also holds notional discretionary reserves in the
financial statements. These reserves are not cash backed at this time and council through its
long term planning will rebuild cash levels over time.
Working capital is expected improve slightly from the 2015 forecast by $0.17 million.
However, this is reflective of a greater improvement as it incorporates the completion of both
the 2014/15 carry forward capital works ($1.21 million Council cash contribution) as well as
the full allocation of the 2015/16 capital works program.
7.1.4 Equity ($8.41 million increase)
Total equity always equals net assets and is made up of the following components:
Asset revaluation reserve which represents the difference between the previously recorded
value of assets and their current valuations.
Other reserves that are funds that Council wishes to separately identify as being set aside to
meet a specific purpose in the future and to which there is no existing liability. These
amounts are transferred from the Accumulated Surplus of the Council to be separately
disclosed.
Accumulated surplus which is the value of all net assets less Reserves that have
accumulated over time. The increase in accumulated surplus of $6.40 million results
Forecast Budget Variance2014/15 2015/16
$’000 $’000 $’000Current assets 14,203 15,162 959Current liabilities 14,460 15,248 (788)Working capital (257) (86) 171Restricted cash and investmentcurrent assets - Statutory reserves (4,108) (5,453) (1,345) - Cash used to fund carry forward capital works (1,213) - 1,213 - Trust funds and deposits (2,209) (2,209) -Unrestricted working capital (7,787) (7,748) 39

49
directly from the surplus for the year ($8.41 million) less the net amount transferred to
reserves ($2.02 million).
During the year an amount of $1.54 million is budgeted to be transferred to statutory
reserves from accumulated surplus. This reflects the developer contributions that are
forecast to be received and not spent in 2015 as well as capital grants expected to be
received and not spent based on anticipated project milestones. And $0.2 million transferred
from statutory reserves being LGIP grant received and held to part fund the Broadford Sports
Pavilion project in 2015/16.
The anticipated net transfer to non-statutory reserves is $0.67 million representing the net
movement in the waste reserve.
7.2 Key assumptions
In preparing the Budgeted Balance Sheet for the year ending 30 June 2016 it was necessary to
make a number of assumptions about assets, liabilities and equity balances. The key
assumptions are as follows:
The capital works program for 2015/16 will be $15.90 million with a net cost to Council of
$11.77 million.
Borrowings of $4.75 million will be undertaken to fund the capital works program.
Debtors and creditors to remain consistent with 2014/15 levels
Employee entitlements to be remain consistent with 2014/15 levels
Repayment of loan principal to be $1.84 million
8. Strategic resource plan and financial performance indicators
This section includes an extract of the adopted Strategic Resource Plan to provide information on
the long term financial projections of the Council.
8.1 Plan development
Council has prepared this SRP for the four years 2015-16 to 2018-19. The SRP takes the
strategic objectives and strategies as specified in the Council Plan and expresses them in
financial terms for the next four years. In preparing the SRP, Council has also been mindful of
the need to comply with the following principles of sound financial management as contained
in the Act:
prudently manage financial risks relating to debt, assets and liabilities
provide reasonable stability in the level of rate burden
consider the financial effects of Council decisions on future generations
provide full, accurate and timely disclosure of financial information
In the preparation of this document, a 10 year model was also developed to ensure that the
four years represented were in consideration of a longer period. This is particularly important
given the Victorian Government’s recent announcement to introduce rate capping within the
2016/2017 year.
Through the review and redevelopment of this plan, Council has remained focused on
addressing legacy financial challenges including, low cash levels, underlying operating deficits,
renewing existing assets, addressing the need for capital upgrades and expansions, as well as
servicing an existing community whilst addressing the needs of a growing community.
This plan has been prepared with the best known information to affect Mitchell Shire Council
at this time. An important part of the plan is the assumptions used to inform the financial

50
modelling. Council’s previous SRP had indicated future rate increases in the order of 8.5 per
cent for a 3-4 year period. Council remained focused on reducing this increase and for the
2015/16 year proposes an average rates and charges increase of 6.9 per cent.
During the budget deliberation process the Victorian Government has confirmed it will introduce
rate capping to local government. It has been suggested that the level of capping proposed
could link to CPI, however at the time of releasing this SRP there is no confirmation available
as to the framework configuration.
In preparing this SRP Council considered a number of financial models, including a model
based on an average CPI. Taking account of current service levels and standards, this clearly
showed a deteriorating financial position that is unsustainable. It is therefore likely that Council
will need to apply a multi-pronged approach to the introduction of rate capping. This SRP has
been produced proposing a rate increase of 4.5 per cent annually from the 2016/17 year
onwards. As Council understands it, this would be subject to an approval process that is yet to
be determined.
Mitchell Shire Council has a number of key challenges that support the need for the SRP to
contain rate increases above CPI. Our Shire comprises both rural and urban areas with strong
growth expected particularly in the South. This brings with it requirement to plan appropriately,
build new infrastructure for our new communities as well as to then provide appropriate services
to these communities. Other challenges include supporting general development across the
shire which often requires a substantial financial or in-kind contribution, addressing pockets of
socio economic disadvantage, providing support to communities that are prone to natural
disasters and offsetting the continued reduction in key government grant programs such as
Country Roads and Bridges and in real terms decrease in grants commission funding.
It is important to note that following the release of the final framework for rate capping
(expected around October 2015); Council will need to reconsider its SRP and long term
projections. It is difficult to undertake a comprehensive review of the SRP while there is
uncertainty around key income streams. It is therefore expected that this SRP will require
significant review when a more detailed understanding of the Victorian Government’s rating
policy position is known and other funding streams are confirmed. This review will need to
include consideration of the proposed rate increase for future years, the levels of services and
standards provided and capital needs relating to existing and new assets. Much of the work
needed to support this review has begun and will continue over the coming months in
preparation for 2016/2017 budget cycle. This will include advocacy for increased external
funding from both State and Federal Governments.

51
8.2 Financial resources
The following table summarises the key financial results for the next four years as set out in the
SRP. Appendix A includes a more detailed analysis of the financial resources to be used over the
four year period.
+ Forecasts improvement in Council Performance/financial position indicator.
The financial indicators above show a decrease in annual surplus’s due to expenditure
increasing at a higher rate than revenue. A higher surplus in the 2015/16 year is due to
expected grant funding being recieved but not spent until the following year. There are many
contributing factors to the decling trend in surplus. Key factors resulting in reduced revenue
include a freeze on the annual indexation of Financial Assitance Grants, a reduction in
government grants such as Country Roads and Bridges and lower rate increases proposed to
ratepayers over the life of the SRP. Operating expenses have been constrained over the past
two years with measures put in place to reduce costs and gain efficiencies however the
provision of existing service levels results in some costs rising at a higher level than revenue.
The impact of reducing revenues and increasing expenditure results in a worseing financial
result.
Cash and investments are moving in a positive direction to meet the objective of improving
current unsatisfactory cash levels and improving liquidity. This increase is necessary, however
it is not achieved without decreasing the funds utilised in asset renewal and expanding into
our growth areas.
With a declining trend in the cash available from operations, Council is faced with the need
to advocate strongly for additional external funding, increase borrowings, consider service
level reductions and / or rate capping exemptions.
Budget TrendForecast
Indicator 2014/15 2015/16 2016/17 2017/18 2018/19 +/o/-$’000 $’000 $’000 $’000 $’0006,589 8,411 3,949 3,183 2,939 -
(4,444) (3,110) (4,129) (4,795) (5,039) -9,498 10,285 12,301 14,129 15,250 +
14,760 14,006 10,169 9,766 9,630 -13,334 15,896 8,275 9,380 7,990 -
Surplus/(deficit) for the yearAdjusted underlying resultCash and investments balanceCash flows from operationsCapital works expenditure
ProjectionsStrategic Resource Plan
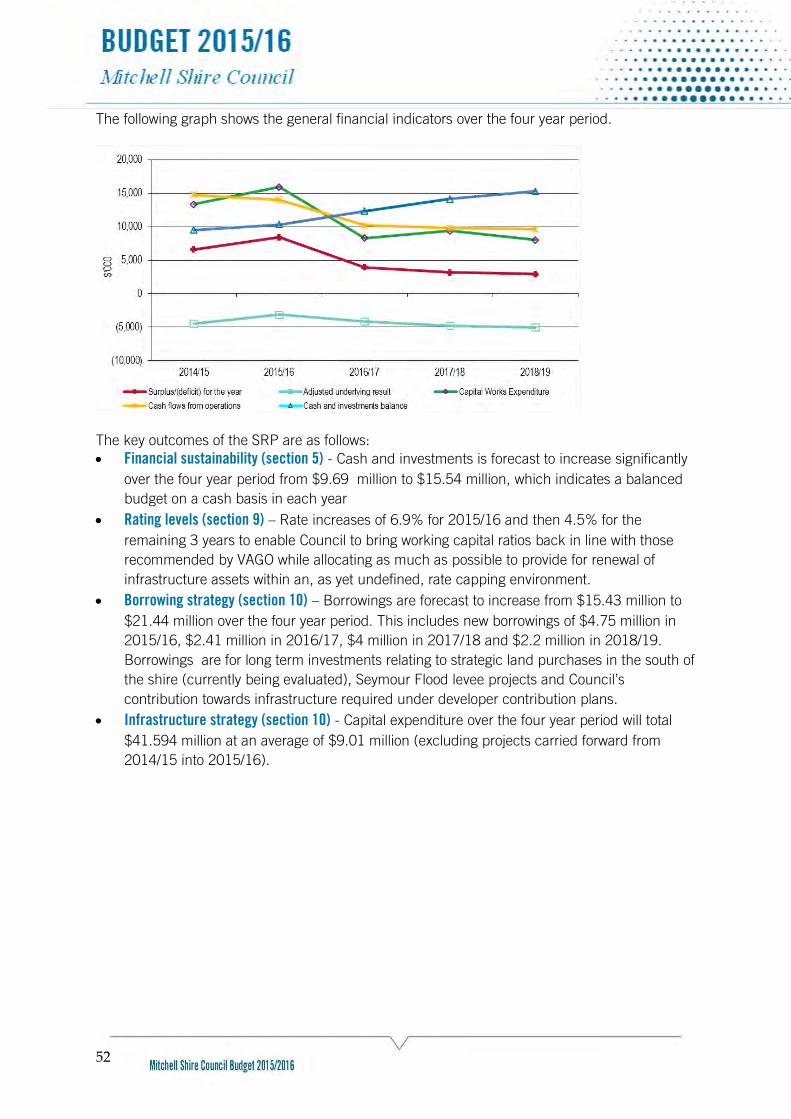
52
The following graph shows the general financial indicators over the four year period.
The key outcomes of the SRP are as follows:
Financial sustainability (section 5) - Cash and investments is forecast to increase significantly
over the four year period from $9.69 million to $15.54 million, which indicates a balanced
budget on a cash basis in each year
Rating levels (section 9) – Rate increases of 6.9% for 2015/16 and then 4.5% for the
remaining 3 years to enable Council to bring working capital ratios back in line with those
recommended by VAGO while allocating as much as possible to provide for renewal of
infrastructure assets within an, as yet undefined, rate capping environment.
Borrowing strategy (section 10) – Borrowings are forecast to increase from $15.43 million to
$21.44 million over the four year period. This includes new borrowings of $4.75 million in
2015/16, $2.41 million in 2016/17, $4 million in 2017/18 and $2.2 million in 2018/19.
Borrowings are for long term investments relating to strategic land purchases in the south of
the shire (currently being evaluated), Seymour Flood levee projects and Council’s
contribution towards infrastructure required under developer contribution plans.
Infrastructure strategy (section 10) - Capital expenditure over the four year period will total
$41.594 million at an average of $9.01 million (excluding projects carried forward from
2014/15 into 2015/16).

53
8.3 Financial performance indicators
The following table highlights Council’s current and projected performance across a range of key
financial performance indicators. These indicators provide a useful analysis of Council’s financial
position and performance and should be used in the context of the organisation’s objectives.
Key to Forecast Trend:
+ Forecast improvement in Council's financial performance/financial position indicator
o Forecasts that Council's financial performance/financial position indicator will be steady
- Forecast deterioration in Council's financial performance/financial position indicator
Indicator Measure Forecast Budget Trend2014/15 2015/16 2016/17 2017/18 2018/19 +/o/-
Operating position
Adjusted underlying result
Adjusted underlying surplus (deficit) / Adjusted underlying revenue
1
-8.6% -5.8% -7.5% -8.3% -8.4% -
Liquidity
Working CapitalCurrent assets / current liabilities
2 98.2% 99.4% 111.3% 127.8% 137.7% +
Unrestricted cashUnrestricted cash / current liabilities
-21.9% -28.8% -9.5% -0.4% 1.0% +
Loans and borrowings
Interest bearing loans and borrowings / rate revenue
3
46.2% 50.9% 50.5% 53.6% 51.7% +
Loans and borrowings
Interest and principal repayments on interest bearing loans and borrowings / rate revenue
7.3% 8.2% 7.4% 7.7% 7.8% +
IndebtednessNon-current liabilities / own source revenue
50.9% 51.2% 45.5% 45.5% 42.1% +
Asset renewalAsset renewal expenditure / depreciation
469.1% 56.8% 33.2% 32.6% 39.8% -
Stability
Rates concentration
Rate revenue / adjusted underlying revenue
560.7% 63.0% 68.0% 68.5% 68.9% -
Rates effort
Rate revenue / CIV of rateable properties in the municipality
0.5% 0.5% 0.5% 0.6% 0.6% -
Efficiency
Expenditure level Total expenditure / no. of property assessments
$3,096 $3,097 $3,223 $3,356 $3,468 -
Revenue level
Residential rate revenue / No. of residential property assessments
$1,445 $1,557 $1,629 $1,703 $1,779 -
Workforce turnover *
No. of permanent staff resignations & terminations / average no. of permanent staff for the financial year
20.6% o
Note
s Strategic Resource Plan Projections
Obligations

54
Council was assessed by the Victorian Auditor General’s Office in terms of sustainability as a
medium risk council at the completion of the 2013/14 financial year. Council is expected to
remain a medium risk council over the medium to long term due to the widening renewal gap
and the low amount of funding available for capital replacement.
Notes to indicators
1 Adjusted underlying result – An indicator of the sustainable operating result required to
enable Council to continue to provide core services and meet its objectives. A decline in the
underlying result is expected over the coming 4 years showing a reliance on Council's cash
reserves or increased debt to maintain current service levels. This is largely due to rate capping,
reduction or loss of grant revenue and the gradual increase in operating costs at levels that are
outstripping revenue increases. On our current long term planning assumptions it is believed
that the underlying result will peak at 8.4% in 2018/19 and then gradually decline over the
longer term. Opportunities to redress this through service and asset rationalisation and
prioritisation will be explored across the coming year.
2 Working Capital – With a focus on building cash and investments council’s working capital
will improve over the coming years. Current assets will sufficiently cover Council operations and
current liabilities.
3 Debt compared to rates – Councils current plan includes future borrowings for developer
contribution capital expenditure in the growth areas including Wallan, Beveridge and Lockerbie
as well as land acquisition in the South Ward and funds for the Seymour Flood Levy. These
additional borrowings cause a slight increase in loans and borrowings compared to rate revenue.
It is expected that Council’s indebtedness ratio will peak in the 2015/16 year at 51.2% and to
then decline over the longer term. This ratio will be dependent upon Council’s capital works
requirements and will be refined each year as the growth is realised.
4 Asset renewal - This percentage indicates the extent of Council's renewals against its
depreciation charge (an indication of the decline in value of its existing capital assets). A
percentage greater than 100 indicates Council is maintaining its existing assets, while a
percentage less than 100 means its assets are deteriorating faster than they are being renewed
and future capital expenditure will be required to renew assets.
Council’s expenditure on asset renewal will decline with the combined impact of rate capping,
increased service demands and the need for new and upgraded assets. Mitchell Shire is unique
in that the location offers urban, peri-urban and rural landscapes. Being a council balancing
the needs of growth, interface and rural adds pressure for new and renew as Council strives to
balance the individual town needs.
The level of asset renewal achievable within the plan is detrimental to the asset base within
the shire. Strategies will need to be developed and services reviewed to enable increased funds
being directed to the renewal of assets.
5 Rates concentration - Reflects extent of reliance on rate revenues to fund all of Council's
on-going services. Trend indicates Council will become more reliant on rate revenue compared
to all other revenue sources. This increase in trend is due to an anticipated reduction in Grants
and Contributions being received from other levels of Government. During 2015/16 the
Financial Assistance Grants will not increase in line with CPI and the Country Roads and
Bridges funding has ceased. There is a direct correlation between the loss of funding and the
decline in asset renewal funding.

55
8.4 Non-financial resources
Council recognises that our staff are a valuable asset and critical to the delivery of quality
services and facilities to our community.
A summary of Council’s anticipated human resources requirements for the 2015/16 year and
beyond is shown below:
FTE for the 2014/15 Forecast incorporates all approved permanent staff positions at
30 June 2015 including efficiencies, casual positions which have been calculated
based on actual hours worked to the end of February 2015.
The restructure completed during 2014/15 has been incorporated in the budgets and
FTE numbers.
From 2017/18 onwards the above figures reflect a small increase in staff required in
service delivery however is dependent upon assumed growth being achieved.
Staffing levels are provided as an indication only and are confirmed as part of each
annual budget cycle.
One FTE concluding as part of the Emergency Management funding in 2015/16.
It is not envisaged that staffing numbers will alter greatly over the four year outlook period and
future increases will rely on community growth and need.
Council is the second largest employer in the Shire (Puckapunyal Army Base being the largest),
an onus Council takes seriously. Over two thirds of our staff live within the Mitchell Shire.
Coupled with their experience in the job, a large number of our staff offer a unique quality,
bringing local perspective and knowledge. These qualities strengthen the services we provide
to our community.
An Employee Opinion Survey was undertaken during March 2015. This survey will guide
Council in developing strategies to ensure staff are engaged, motivated and efficient.
The recent introduction of headline reporting will ensure we continually manage and bench
mark our practices with the aim being to continually improve organisational performance.
Indicator Forecast Budget 2014/15 2015/16 2016/17 2017/18 2018/19
- Operating 23,271 23,349 24,719 26,220 28,078 - Capital 480 501 516 532 548 Total 23,751 23,850 25,235 26,752 28,626
281 281 280 285 292
Strategic Resource Plan Projections
Employee costs ($'000)
Employee numbers (FTE)

56
9. Rating information
This section contains information on Council’s past and foreshadowed rating levels along with
Council's rating structure. This section should be read in conjunction with Appendix B.
9.1 Rating context
In developing the Strategic Resource Plan (referred to in Section 8.), rates and charges were
identified as an important source of revenue, accounting for 55% (62% of total income excluding
non-monetary contributions). This percentage is trending upward based on decreasing external
funding sources available. Rates will continue to be an important source of revenue for Council.
9.3 Rating structure
Differential Rating - Section 161 Local Government Act:
Council will raise general rates by the application of differential rates because it considers that
the differential rates will contribute to the equitable and efficient distribution of rate burden.
Council no longer offers land management rate rebates. However, the 2015/16 budget includes
expenditure of $0.12 million for land management grants. Work is currently being undertaken in
relation to the operation and implementation of this new program.
General Objectives of Differential Rating
Council has a diverse mix of geographically located land and land uses. The establishment of
differential categories ensures greater equity and contribution from rates according to land use
characteristics in relation to affordability and taxation principles. The general objective of each of
the differential rates is to ensure that all rateable land makes an equitable financial contribution
to the cost of carrying out the functions of Council, including:
• advocating for and promoting proposals which are in the best interests of the local
community;
• planning for and providing services and facilities for the local community;
• providing and maintaining community infrastructure in the municipal district;
• undertaking strategic and land use planning for the municipal district;
• raising revenue to enable the Council to perform its functions;
• making and enforcing local laws;
• exercising, performing and discharging the duties, functions and powers of Councils
under the Act and other Acts;
• any other function relating to the peace, order and good government of the municipal
district; or
• a specific objective as described within the differential characteristic.
Council has determined that the rating objectives described above support equitable rating having
regard to the principle of taxation by property wealth, land use groupings, other revenue raising
strategies, government funded concessions and legislative provisions and requirements

57
The following differential ratios will be applied to each differential rate category:
Differential Category Ratio
General Land 1.0
Vacant Land 2.0
Rural Agricultural Land (40ha-100ha) 0.9
Rural Agricultural Land (greater than 100ha) 0.8
Subdivisional Land 2.0
Service Rate and Charges - Section 162 of the Local Government Act:
The Council will levy a service charge for the collection and disposal of refuse or for any other
prescribed service. Council’s waste charge is raised in order to recover not only the operation of
the waste service and landfill sites but also full lifecycle costs of active, closed and future landfills
including provision for rehabilitation at the end of their useful life and any strategic objectives
relating to the service.
Municipal Charge - Section 159 of the Local Government Act:
Council will levy a municipal charge to ensure some of its fixed administrative costs are recovered
as a uniform contribution by all of its ratepayers. The amount of the municipal charge is $299,
and is within the maximum allowable limit of 20% of total general rate and municipal charge
revenue.
Basis of Rating - Section 157 of the Local Government Act:
The Council will use the capital improved value system of valuation as the basis of calculating
general rates.
Interest on Overdue Rates - Section 172 of the Local Government Act:
The Council will charge interest on overdue rates at the rate prescribed by the Penalty Interest
Rates Act 1983
The following table summarises the rates to be determined for the 2015/16 year. A more detailed
analysis of the rates to be raised is contained in Appendix B ‘Statutory Disclosures’.
Please note that the table above reflects a rate rise of 6.9% however with holding the waste and
municipal charges at the 2014/15 levels and a nil increase, the advalorem is increased in its
place.
Rate type How applied 2014/15 2015/16
General Land Cents/$CIV 0.3446 0.3782Vacant Land Cents/$ CIV 0.6892 0.7564Rural Agricultural Land (40ha-100ha)
Cents/$ CIV 0.3102 0.3404
Rural Agricultural Land (greater than100ha)
Cents/$ CIV 0.2757 0.3026
Subdivisional Land Cents/$ CIV 0.6892 0.7564Municipal charge $/ property 299.00 299.00Garbage Charge (full service) $/ property 305.00 305.00Garbage Charge (extra service) $/ property 195.00 195.00Recycling Charge (extra service) $/ property 110.00 110.00

58
Previous year rate increases:
Historically Council’s rate increases have included the following:
10. Other strategies
This section sets out summaries of the strategies that have been developed and incorporated into
the Strategic Resource Plan including borrowings and infrastructure.
10.1 Borrowings
In developing this year’s revised Strategic Resource Plan (SRP) (see Section 8), it was noted that
borrowings will, in the future, be an important means of expanding Council’s infrastructure base
in the south of the Shire as the growing population requires more community facilities. This
infrastructure is likely to be required prior to a time when the increased rate base of that growing
population can provide a funding source. Therefore in order to have the borrowing capacity for
this purpose, borrowings should only be considered appropriate when linked to specific
infrastructure projects.
Borrowings will be used to fund capital projects of a magnitude that could not otherwise be funded
from ongoing income sources and that provide benefit across generations. Council borrowings will
be set at a financially sustainable level and within agreed limits.
The Strategic Resource Plan includes planned borrowings for the Seymour Flood Levee, strategic
land purchase in the south of the Shire as well as capital expenditure associated with growth and
developer contributions.
This year’s revised SRP takes into account the need for future expansion required in the medium
to long term, however it undertakes to provide for renewal of infrastructure from cash generated
from operations. The SRP also seeks to replenish Council’s cash balances to provide for sufficient
working capital and also provide funds for future capital works.
Council needs to ensure that when population growth requires additional infrastructure in the south
it is able to provide those community assets and not already be at a maximum level of borrowings.
In the past, borrowings have been linked to funding the capital works program and then not drawn
down to the level budgeted when the works were undertaken. This has eroded Council’s cash
balances over time, leaving it with poor working capital levels to carry out its day to day operations.
In the budget for 2015/16 borrowings of $4.75 million have been included to allow the strategic
purchase of land in the south as well as stage 2 of the Seymour Flood Levee project. In addition
$0.5 million is forecast in 2014/15 as a deposit for the purchase of land in the South. The timing
of these initial borrowings is uncertain as we approach the end of financial year and if not
Year
Rate increase
% Year
Rate increase
%
2001/02 4.20 2009/10 4.95
2002/03 2.55 2010/11 7.85
2003/04 2.90 2011/12 9.00
2004/05 4.50 2012/13 7.00
2005/06 3.50 2013/14 11.00
2006/07 13.75 2014/15 8.50
2007/08 7.50 2015/16 6.90
2008/09 6.00

59
undertaken prior to 30 June 2015 will be undertaken in 2015/16. These borrowings will only be
drawn down if such a project goes ahead.
The table below shows the borrowings identified in the current SRP:
The table below shows information on borrowings specifically required by the Regulations.
10.2 Infrastructure
Council has developed an Asset Management Framework that includes an Asset Management
Policy, Asset Management Strategy and various Asset Management Plans for its infrastructure.
This framework sets out Council’s capital expenditure requirements for the next 10 years by class
of asset and is a key input to the long term financial plan. It predicts infrastructure consumption;
renewal needs and considers infrastructure needs to meet future community service expectations.
The framework has been developed through a rigorous process of evaluation as follows:
Long term capital works planning process which integrates with the Council Plan, Strategic
Resource Plan and Annual Budget processes.
Identification of capital projects through the preparation of asset management plans.
Prioritisation of capital projects within classes on the basis of evaluation criteria.
Methodology for allocating annual funding to classes of capital projects.
A key objective of the Asset Management Plan is to maintain or renew Council’s existing assets
at desired condition levels. If sufficient funds are not allocated to asset renewal then Council’s
investment in those assets will reduce, along with the capacity to deliver services to the
community.
At present, Council is similar to a number of municipalities in that it is unable to fully fund asset
renewal requirements identified in the Asset Management Plans.
The SRP continues a focus on renewal of Council's assets over the creation and /or purchase of
new assets. It endeavours to close the gap between annual renewal requirements and the
renewal program delivered. However, it will take time to return Council to a position where it can
fully meet all its asset renewal requirements.
Principal InterestPaid Paid
$’000 $’000 $’000 $’0002014/15 500 1,534 902 15,431 2015/16 4,750 1,842 1,103 18,339 2016/17 2,410 1,685 1,103 19,064 2017/18 4,000 1,836 1,222 21,228 2018/19 2,200 1,986 1,234 21,442
Year New Borrowings
Balance 30 June
2014/15$
2015/16$
16,464,819 15,430,907 500,000 4,750,000
(1,533,912) (1,842,160)15,430,907 18,338,747
Total amount borrowed as at 30 June of the prior yearTotal amount proposed to be borrowedTotal amount projected to be redeemedTotal amount of borrowings as at 30 June

60
The table below shows the proposed capital program over the period of the SRP and respective
funding sources.
Only confirmed capital grants are included in the SRP. In 2015/16 $0.82 million is included for
Roads to Recovery (R2R) grant and $0.1 final payment for the Seymour Flood Levee (stage 3 –
land acquisitions). From 2016/17 only Roads to Recovery Funding has been included. No
allowance for grant funding in relation to Country Roads and Bridges (CRBI) has been included
It should be noted that in recent years this funding source has contributed $1.0 million per
annum. If this funding is replaced by an alternative funding stream for 2015/16 and future years
it would significantly increase Council's capacity to meet its road and bridge renewal needs.
The net capital works spending is calculated based on the funds that can be provided from
operations, plus any grant funding. Council's cash balances are insufficient in the short to
medium term to add to these further, leaving borrowings and external funding as the only
remaining option (refer to section 10.1).
Year Total Capital Program
$(000)
Grants
$(000)
Council Cash
$(000)
Borrowings
$(000)
2014/15 13,334 4,583 8,251 500 2015/16 15,946 5,343 5,853 4,750 2016/17 8,275 923 4,942 2,410 2017/18 9,380 823 4,557 4,000 2018/19 7,990 823 4,967 2,200
Summary of funding sources

61
Appendices
The following appendices include voluntary and statutory disclosures of information which
provide support for the analysis contained in sections 1 to 10 of this report.
This information has not been included in the main body of the budget report in the interests of
clarity and conciseness. Council has decided that while the budget report needs to focus on the
important elements of the budget and provide appropriate analysis, the detail upon which the
annual budget is based should be provided in the interests of open and transparent local
government.
The contents of the appendices are summarised below:
Appendix Nature of information Page
A Financial statements 62 B Rates and charges 69 C Capital works program 80 D Fees and charges schedule 87
E Schedule of changes from the Draft Budget 2015/16 102

62
Appendix A
Budgeted Statements
This appendix presents information in regard to the Budgeted Financial Statements and
Statement of Human Resources. The budget information for the years 2015/16 to 2018/19 has
been extracted from the Strategic Resource Plan.
At the end of each financial year Council is required to include in the Financial Statements in its
Annual Report a comparison of actual income and expenditure compared with the income and
expenditure in the financial statements in the Budget,
The appendix includes the following budgeted information:
Budgeted Comprehensive Income Statement
Budgeted Balance Sheet
Budgeted Statement of Changes in Equity
Budgeted Statement of Cash Flows
Budgeted Statement of Capital Works
Budgeted Statement of Human Resources

63
Budgeted Comprehensive Income Statement
For the four years ending 30 June 2019
2014/15 2015/16 2016/17 2017/18 2018/19$’000 $’000 $’000 $’000 $’000
IncomeRates and charges 33,396 36,005 37,749 39,571 41,475Statutory fees and fines 523 530 577 552 563User fees 6,013 5,535 5,724 5,905 6,090Grants - Operating 9,688 9,266 9,579 9,902 10,194Grants - Capital 4,583 5,193 923 823 823Contributions - monetary 375 478 478 478 478Contributions - non-monetary 7,377 7,500 7,500 7,500 7,500Net gain/(loss) on disposal of property, infrastructure, plant and equipment
- - - - -
Fair value adjustments for investment property
- - - - -
Share of net profits/(losses) of associates and joint ventures
- - - - -
Other income 772 597 969 1,014 1,065Total income 62,727 65,104 63,499 65,745 68,188
ExpensesEmployee costs 23,271 23,349 24,719 26,220 28,078Materials and services 18,441 18,221 19,045 20,183 20,701Bad and doubtful debts 39 34 34 34 34Depreciation and amortisation 11,548 11,988 12,556 12,800 13,090Borrowing costs 902 1,103 1,103 1,222 1,233Other expenses 1,937 1,998 2,093 2,103 2,113Total expenses 56,138 56,693 59,550 62,562 65,249
Surplus/(deficit) for the year 6,589 8,411 3,949 3,183 2,939
Other comprehensive incomeItems that will not be reclassified to surplus or deficit in future periods:Net asset revaluation increment /(decrement) - - - - - Share of other comprehensive income of - - - - - Items that may be reclassified to surplus or deficit in future periods(detail as appropriate)
- - - - -
Total comprehensive result 6,589 8,411 3,949 3,183 2,939
Strategic Resource PlanProjections
Forecast Budget

64
Budgeted Balance Sheet
For the four years ending 30 June 2019
2015 2016 2017 2018 2019$’000 $’000 $’000 $’000 $’000
AssetsCurrent assetsCash and cash equivalents 9,498 10,285 12,301 14,129 15,250Trade and other receivables 4,481 4,653 4,773 4,899 5,030Other financial assets - - - - - Inventories 76 76 76 76 76Non-current assets classified as held for sale - - - - - Other assets 148 148 148 148 148Total current assets 14,203 15,162 17,298 19,252 20,504
Non-current assetsTrade and other receivables 23 23 23 23 23 Investments in associates and joint ventures 5 5 5 5 5 Property, infrastructure, plant & equipment 421,524 430,879 431,648 433,323 434,123 Investment property - - - - - Intangible assets - - - - - Total non-current assets 421,552 430,907 431,676 433,351 434,151 Total assets 435,755 446,069 448,974 452,603 454,655
LiabilitiesCurrent liabilitiesTrade and other payables 5,764 5,941 6,123 6,309 6,309Trust funds and deposits 2,209 2,209 2,209 2,209 2,209Provisions 4,645 5,413 5,368 4,563 4,273Interest-bearing loans and borrowings 1,842 1,685 1,836 1,986 2,101Total current liabilities 14,460 15,248 15,536 15,067 14,892
Non-current liabilitiesProvisions 7129 5,179 3,274 2,174 1,364Interest-bearing loans and borrowings 13,589 16,654 17,228 19,242 19,341Total non-current liabilities 20,718 21,833 20,502 21,416 20,705Total liabilities 35,178 37,081 36,038 36,483 35,597Net assets 400,577 408,988 412,936 416,120 419,058
EquityAccumulated surplus 193,919 200,315 205,160 207,930 209,957Reserves 206,658 208,673 207,776 208,190 209,101Total equity 400,577 408,988 412,936 416,120 419,058
Forecast Budget Strategic Resource PlanProjections

65
Budgeted Statement of Changes in Equity
For the four years ending 30 June 2019
TotalAccumulated
SurplusRevaluation
ReserveOther
Reserves$’000 $’000 $’000 $’000
2016Balance at beginning of the financial year 400,577 193,919 193,997 12,661Surplus/(deficit) for the year 8,411 8,411 - - Net asset revaluation increment/(decrement) - - - - Transfer to other reserves - (3,487) - 3,487Transfer from other reserves - 1,472 - (1,472)Balance at end of the financial year 408,988 200,315 193,997 14,676
2017Balance at beginning of the financial year 408,988 200,315 193,997 14,676Surplus/(deficit) for the year 3,949 3,949 - - Net asset revaluation increment/(decrement) - - - - Transfer to other reserves - (2,370) - 2,370Transfer from other reserves - 3,267 - (3,267)Balance at end of the financial year 412,937 205,161 193,997 13,779
2018Balance at beginning of the financial year 412,937 205,161 193,997 13,779Surplus/(deficit) for the year 3,183 3,183 - - Net asset revaluation increment/(decrement) - - - - Transfer to other reserves - (2,319) - 2,319Transfer from other reserves - 1,905 - (1,905)Balance at end of the financial year 416,120 207,930 193,997 14,193
2019Balance at beginning of the financial year 416,120 207,930 193,997 14,193Surplus/(deficit) for the year 2,939 2,939 - - Net asset revaluation increment/(decrement) - - - - Transfer to other reserves - (2,264) - 2,264 Transfer from other reserves - 1,353 - (1,353)Balance at end of the financial year 419,059 209,958 193,997 15,104

66
Budgeted Statement of Cash Flows
For the four years ending 30 June 2019
2014/15 2015/16 2016/17 2017/18 2018/19$’000 $’000 $’000 $’000 $’000
Inflows Inflows Inflows Inflows Inflows(Outflows) (Outflows) (Outflows) (Outflows) (Outflows)
Cash flows from operating activitiesRates and charges 34,711 35,833 37,629 39,446 41,343Statutory fees and fines 523 530 577 552 563User fees 6,122 5,535 5,723 5,905 6,090Grants - operating 9,688 9,266 9,579 9,902 10,194Grants - capital 6,272 5,193 923 823 823Contributions - monetary 375 478 478 478 478Interest received 425 415 512 546 587Dividends received - - - - - Trust funds and deposits taken - - - - - Other receipts 347 182 457 468 478Net GST refund / payment - - - - - Employee costs (23,447) (23,334) (24,703) (26,203) (28,078)Materials and services (18,280) (18,060) (18,879) (20,014) (20,701)Trust funds and deposits repaid - - - - - Other payments (1,976) (2,032) (2,127) (2,137) (2,147)Net cash provided by/(used in) operating activities 14,760 14,006 10,169 9,766 9,630
Cash flows from investing activitiesPayments for property, infrastructure, plant and equipment (13,334) (15,896) (8,275) (9,380) (7,990)
Proceeds from sale of property, infrastructure, plant and equipment 698 872 500 500 500Payments for investments - - - - - Proceeds from sale of investments - - - - - Loan and advances made - - - - - Payments of loans and advances - - - - - Net cash provided by/ (used in) investing activities (12,636) (15,024) (7,775) (8,880) (7,490)
Cash flows from financing activities Finance costs (902) (1,103) (1,103) (1,222) (1,233)Proceeds from borrowings 500 4,750 2,410 4,000 2,200Repayment of borrowings (1,534) (1,842) (1,685) (1,836) (1,986)Net cash provided by/(used in) financing activities (1,936) 1,805 (378) 942 (1,019)
Net increase/(decrease) in cash & cash equivalents 188 787 2,016 1,828 1,121Cash and cash equivalents at thebeginning of the financial year 9,310 9,498 10,285 12,301 14,129Cash and cash equivalents at the end of the financial year 9,498 10,285 12,301 14,129 15,250
Forecast BudgetStrategic Resource Plan
Projections

67
Budgeted Statement of Capital Works
For the four years ending 30 June 2019
2014/15 2015/16 2016/17 2017/18 2018/19$’000 $’000 $’000 $’000 $’000
PropertyLand 590 4500 2145 20 2230Land improvements - - - - - Total land 590 4500 2145 20 2230Buildings 2,057 185 1,350 1,350 500Heritage buildings - - - - - Building improvements - - - - - Leasehold improvements - - - - - Total buildings 2,057 185 1,350 1,350 500Total property 2,647 4,685 3,495 1,370 2,730Plant and equipmentHeritage plant and equipment - - - - - Plant, machinery and equipment 1,668 1,350 742 742 1,007Fixtures, fittings and furniture - - - - - Computers and telecommunications 579 348 150 150 300Library books 160 150 80 80 150Total plant and equipment 2,407 1,848 972 972 1,457InfrastructureRoads 3459 2,755 908 1,733 1,000Bridges 939 741 200 200 500Footpaths and cycleways 37 385 150 50 50Drainage 466 393 250 3,050 100Recreational, leisure and community facilities 1967 3782 100 100 800Waste management 1250 1272 1950 1905 1353Parks, open space and streetscapes - - - - - Aerodromes - - - - - Off street car parks - - - - - Other infrastructure 162 35 250 - - Total infrastructure 8,280 9,363 3,808 7,038 3,803Total capital works expenditure 13,334 15,896 8,275 9,380 7,990
Represented by:New asset expenditure 3,087 7,715 4,103 5,203 2,783Asset renewal expenditure 7,982 6,814 4,172 4,177 5,207Asset expansion expenditure 685 75 - - - Asset upgrade expenditure 1,580 1292 - - - Total capital works expenditure 13,334 15,896 8,275 9,380 7,990
Forecast Budget Strategic Resource PlanProjections

68
Budgeted Statement of Human Resources For the four years ending 30 June 2019
2014/15 2015/16 2016/17 2017/18 2018/19$’000 $’000 $’000 $’000 $’000
Staff expenditureEmployee costs - operating 23,271 23,349 24,719 26,220 28,078Employee costs - capital 480 501 516 532 548 Total staff expenditure 23,751 23,850 25,235 26,752 28,626
FTE FTE FTE FTE FTEStaff numbersEmployees 281 281 280 285 292 Total staff numbers 281 281 280 285 292
Forecast Budget Strategic Resource PlanProjections

69
Appendix B
Rates and charges
This appendix presents information about rates and charges which the Act and the Regulations
require to be disclosed in the Council’s annual budget.

70
Rates and charges
1. Rates and charges
1.1 The rate in the dollar to be levied as general rates under section 158 of the Act for each
type or class of land compared with the previous financial year
1.2 The estimated total amount to be raised by general rates in relation to each type or class of
land, and the estimated total amount to be raised by general rates, compared with the
previous financial year
1.3 The number of assessments in relation to each type or class of land, and the total number
of assessments, compared with the previous financial year
1.4 The basis of valuation to be used is the Capital Improved Value (CIV)
2014/15 2015/16cents/$CIV cents/$CIV
General Land 0.3446 0.3782Vacant Land 0.6892 0.7564Rural Agricultural Land (40ha-100ha) 0.3102 0.3404Rural Agricultural Land (Greater than100ha) 0.2757 0.3026Subdivisional Land 0.6892 0.7564
Type or class of land
2014/15 2015/16$ $
General Land 17,948,132 19,979,706Vacant Land 1,957,216 2,131,441Rural Agricultural Land (40ha-100ha) 1,127,555 1,246,515Rural Agricultural Land(Greater than100ha) 1,740,583 1,915,586Subdivisional Land 656,441 713,965Total amount to be raised by general rates 23,429,927 25,987,213
Type or class of land
2014/15 2015/16
General Land 15,453 15,667Vacant Land 1525 1,472Rural Agricultural Land (40ha-100ha) 688 691Rural Agricultural Land (Greater than100ha) 449 455Subdivisional Land 20 19
Total number of assessments 18,135 18,304
Type or class of land

71
1.5 The estimated total value of each type or class of land, and the estimated total value of
land, compared with the previous financial year
1.6 The municipal charge under section 159 of the Act compared with the previous financial
year
1.7 The estimated total amount to be raised by municipal charges compared with the previous
financial year
1.8 The rate or unit amount to be levied for each type of service rate or charge under section
162 of the Act compared with the previous financial year
1.9 The estimated total amount to be raised by each type of service rate or charge, and the
estimated total amount to be raised by service rates and charges, compared with the
previous financial year
2014/15 2015/16 Percentage$ $ Change
General Land 5,208,615,000 5,282,309,000 1.41%Vacant Land 283,995,000 281,797,000 -0.77%Rural Agricultural Land (40ha-100ha) 363,504,000 366,201,000 0.74%Rural Agricultural Land (Greater than100ha) 631,340,000 633,050,000 0.27%Subdivisional Land 95,247,000 94,390,000 -0.90%
Total value of land 6,582,701,000 6,657,747,000 1.14%
Type or class of land
Per Rateable Property
Per Rateable Property
Type of Charge 2014/15 2015/16 Change$ $
Municipal 299.00 299.00 0.00%
Type of Charge 2014/15 2015/16$ $
Municipal 5,333,562 5,366,153
Type of Charge Per Rateable Property
Per Rateable Property
2014/15 2015/16 Change$ $
Garbage Charge (full service) 305.00 305.00 0.00%Garbage Charge (Optional extra service) 195.00 195.00 0.00%Recycling Charge (Optional extra service) 110.00 110.00 0.00%
Type of Charge 2014/15 2015/16$ $
Garbage Charges 4,346,805 4,430,590Total 4,346,805 4,430,590

72
1.10 The estimated total amount to be raised by all rates and charges compared with the
previous financial year
1.11 Proposed percentage change in the rate in the dollar for each type of rate to be levied,
compared to the previous year
Note, the percentage change to the rate in the dollar is impacted by holding the municipal
charge and garbage charges constant, while raising the revenue raised by rates by 6.9%.
1.12 Any significant changes that may affect the estimated amounts to be raised by rates and
charges
There are no known significant changes which may affect the estimated amounts to be raised by
rates and charges. However, the total amount to be raised by rates and charges may be affected
by:
The making of supplementary valuations including general and waste increases {2015/16:
estimated $220,000 (allowing for valuation objections) forecast for 2014/15: $285,500}
The variation of returned levels of value (e.g. valuation appeals)
Changes in use of land such that rateable land becomes non-rateable land and vice versa
Changes in use of land such that rural agricultural land becomes general land (residential)
2. Differential rates
2.1 Definition of Land
In this clause, the term “land” means a parcel or multiple parcels of land for which a single
valuation has been returned pursuant to the Valuation of Land Act 1960 and upon which a single
rate notice is issued by Council.
Type of Charge 2014/15 2015/16$ $
General Rates 23,429,927 25,987,213
Garbage Charges 4,395,878 4,430,590
Municipal Charges 5,333,562 5,366,153
Supplementary rates and charges 285,581 220,000
Total rates and charges 33,444,948 36,003,956
Type or class of land 2014/15 2015/16
General Land 6.46% 9.75%Vacant Land 6.46% 9.75%Rural Agricultural Land (40ha-100ha) 6.49% 9.74%Rural Agricultural Land (Greater than100ha) 6.49% 9.74%Subdivisional Land 6.46% 9.75%

73
2.2 General Land Differential Rate
2.2.1 Definition of the type or classes of land which are subject to the General Land Differential
Rate:
General Land is all rateable land which is not subject to any other differential rate.
2.2.2 Statement of reasons for the use and level of the General Land Differential Rate in relation
to those types or classes of land:
The General Land Differential Rate is the default rate in instances where land does not
meet the characteristics of any other differential rate. As such, it is has a differential ratio
of 1.0 and is the base around which all other differential rate ratios are determined.
The objective of the General Land Differential Rate is to ensure that the land makes an
equitable financial contribution to cost of carrying out the functions of Council in
accordance with the general objectives of differential rating adopted by Council.
Identification of the types or classes of land which are subject to the General Land Differential
Rate in respect of:
uses of the land:
Any use which is consistent with the definition of General Land.
geographic location of the land:
Anywhere within Council’s municipal district.
planning scheme zoning of the land:
Any zone within the Mitchell Planning Scheme.
types of buildings on the land:
Any buildings which are consistent with the definition of General Land.
any other criteria relevant to the General Land Differential Rate:
Nil
2.2.3 The characteristics of the land which are the criteria for declaring the General Land
Differential Rate:
General Land is rateable land which is not subject to any other differential rate.
2.3 Vacant Land Differential Rate:
2.3.1 Definition of the type or classes of land which are subject to the Vacant Land Differential
Rate:
Vacant Land is rateable land located wholly or partly in one of the planning zones listed
below where -
there is no building constructed on the land; or
any buildings located on the land are considered to be -
- in the case of a dwelling, unfit for human habitation; or
- in the case of any other building, unfit for use for the purpose for which it was originally
constructed -
by Council’s municipal building surveyor or another officer of Council authorised for this
purpose -

74
but excludes any land that:
is subject to the Rural Agricultural Land (40ha to 100ha) Differential Rate; or
is subject to the Rural Agricultural Land (greater than 100ha) Differential Rate ;or
is subject to the Subdivisional Land Differential Rate.
2.3.2 Statement of reasons for the use and level of the Vacant Land Differential Rate in relation
to those types or classes of land:
The Vacant Land Differential Rate applies to land situated in a planning zone in which
residential, commercial or industrial development is encouraged and supported. As vacant
land valuations are typically one-half of developed land, the ratio applied to this rate
represents an equalisation factor between the Vacant Land Differential Rate and General
Land Differential Rate.
The objective of the Vacant Land Differential Rate differential rate is to ensure that land
makes an equivalent contribution towards the services and facilities invested in by the
Council, as there is an expectation that these services and facilities will be immediately
available upon development of the land.
2.3.3 Identification of the types or classes of land which are subject to the Vacant Land
Differential Rate in respect of:
uses of the land:
Any use.
geographic location of the land:
Anywhere in Council’s municipal district, which is wholly or partially within one or more
of the planning zones listed below.
planning scheme zoning of the land:
Land which is wholly or partially within one or more of the following planning zones under
the Mitchell Planning Scheme:
BZ1 Business 1
B2Z Business 2
B4Z Business 4
CDZ1 Comprehensive Development Schedule 1
CDZ2 Comprehensive Development Schedule 2
IN13ZIndustrial 1
IN1Z Industrial 1
IN3Z Industrial 3
LDRZ Low Density Residential
MUZ Mixed Use
R1Z Residential 1
RLZ Rural Living
types of buildings on the land:
As per the definition of Vacant Land above.
any other criteria relevant to the Vacant Land Differential Rate:
The Vacant Land Differential Rate excludes Rural Agricultural Land (40ha to 100ha)
Differential Rate or the Rural Agricultural Land (greater than 100ha) Differential Rate due
the reduced demand and supply of services and facilities in rural localities.
75
The Vacant Land Differential Rate excludes Subdivisional Land as the existence of a
planning permit to subdivide is a precursor to the application of the Vacant Land
Differential Rate.
2.3.4 The characteristics of the land which are the criteria for declaring the Vacant Land
Differential Rate:
Rateable land located wholly or partly in one of the planning zones listed below where -
there is no building constructed; or
any building located on the land is considered to be –
in the case of a dwelling, unfit for human habitation; or
in the case of any other building unfit for use for the purpose for which it was originally
constructed -
by Council’s municipal building surveyor or another officer of Council authorised for this
purpose -
but excludes any land that:
is subject to the Rural Agricultural Land (40ha to 100ha) Differential Rate; or
is subject to the Rural Agricultural Land (greater than 100ha) Differential Rate; or
is subject to the Subdivisional Land Differential Rate.
2.4 Rural Agricultural Land (40ha to 100ha) Differential Rate:
2.4.1 Definition of the type or classes of land which are subject to the Rural Agricultural Land
(40ha to 100ha) Differential Rate:
Rural Agricultural Land (40ha to 100ha) is rateable land -
that is cumulatively across all land owned by the ratepayer not less than 40 hectares and
not greater than 100 hectares in area;
that is wholly contained within, or is contiguous with land outside of, the municipal district;
that is used primarily for grazing (including agistment), dairying, pig-farming, poultry-
farming, fish-farming, tree-farming, bee-keeping, viticulture, horticulture, fruit-growing or
the growing of crops of any kind or for any combination of those activities; and
that is used by a business-
- that has a significant and substantial commercial purpose or character;
- that seeks to make a profit on a continuous or repetitive basis from its activities
on the land;
- that is making a profit from its activities on the land, or that has a reasonable
prospect of making a profit from its activities on the land if it continues to operate
in the way that it is operating; and
- that is registered with the Australian Taxation Office as a primary producer.
2.4.2 Statement of reasons for the use and level of the Rural Agricultural Land (40ha to 100ha)
Differential Rate in relation to those types or classes of land:
The objective of the Rural Agricultural Land (40ha to 100ha) Differential Rate is set at a
lower rate than the General Land Differential Rate in recognition that occupiers of the Rural
Agricultural Land (40ha to 100ha) tend to utilize and consume Council assets and services
at a lower rate, relative to the land occupied by them, than occupiers of General Land.

76
The Rural Agricultural Land (40ha to 100ha) Differential Rate is also intended to provide
incentive for the retention of Rural Agricultural Land (40ha to 100ha) within the municipal
district in agricultural usage.
2.4.3 Identification of the types or classes of land which are subject to the Rural Agricultural
Land (40ha to 100ha) Differential Rate in respect of:
uses of the land:
As per the definition above of Rural Agricultural Land (40ha to 100ha).
geographic location of the land:
Anywhere within Council’s municipal district which is consistent with the definition of
Rural Agricultural Land (40ha to 100ha).
planning scheme zoning of the land:
FZ Farming Zone
UGZ Urban Growth Zone
types of buildings on the land:
Any buildings consistent with the definition of Rural Agricultural Land (40ha to 100ha).
any other criteria relevant to the Rural Agricultural Land (40ha to 100ha) Differential
Rate:
Nil
2.4.4 The characteristics of the land which are the criteria for declaring the Rural Agricultural
Land (40ha to 100ha) Differential Rate:
Rural Agricultural Land (40ha to 100ha) is rateable land - that is cumulatively across all land owned by the ratepayer not less than 40 hectares and
not greater than 100 hectares in area;
that is wholly contained within, or is contiguous with land outside of, the municipal district;
that is used primarily for grazing (including agistment), dairying, pig-farming, poultry-
farming, fish-farming, tree-farming, bee-keeping, viticulture, horticulture, fruit-growing or
the growing of crops of any kind or for any combination of those activities; and
that is used by a business –
- that has a significant and substantial commercial purpose or character;
- that seeks to make a profit on a continuous or repetitive basis from its activities
on the land;
- that is making a profit from its activities on the land, or that has a reasonable
prospect of making a profit from its activities on the land if it continues to operate
in the way that it is operating; and
- that is registered with the Australian Taxation Office as a primary producer.
2.5 Rural Agricultural Land (greater than 100ha) Differential Rate:
2.5.1 Definition of the type or classes of land which are subject to the Rural Agricultural Land
(greater than 100 ha) Differential Rate:
Rural Agricultural Land (greater than 100ha) is rateable land –
that is cumulatively across all land owned by the ratepayer greater than 100 hectares in area;
and
that is wholly contained within, or is contiguous with land outside of, the municipal district;

77
that is used primarily for grazing (including agistment), dairying, pig-farming, poultry-
farming, fish-farming, tree-farming, bee-keeping, viticulture, horticulture, fruit-growing or the
growing of crops of any kind or for any combination of those activities; and
that is used by a business –
- that has a significant and substantial commercial purpose or character;
- that seeks to make a profit on a continuous or repetitive basis from its activities
on the land;
- that is making a profit from its activities on the land, or that has a reasonable
prospect of making a profit from its activities on the land if it continues to operate
in the way that it is operating; and
- that is registered with the Australian Taxation Office as a primary producer.
2.5.2 Statement of reasons for the use and level of Rural Agricultural Land (greater than 100
ha) Differential Rate in relation to those types or classes of land:
The objective of the Rural Agricultural Land (greater than 100ha) is set at a lower rate than
the General Land Differential Rate in recognition that occupiers of the Rural Agricultural
Land (greater than 100ha) tend to utilize and consume Council assets and services at a
lower rate, relative to the land occupied by them, than occupiers of General Land.
The Rural Agricultural Land (greater than 100ha) Differential Rate is also intended to provide
incentive for the retention of Rural Agricultural Land (greater than 100ha) within the
municipal district in agricultural usage.
2.5.3 Identification of the types or classes of land which are subject to the Rural Agricultural
Land (greater than 100 ha) Differential Rate in respect of:
uses of the land:
As per the definition above of Rural Agricultural Land (greater than 100ha).
geographic location of the land:
Anywhere within Council’s municipal district that is consistent with the definition of Rural
Agricultural Land (greater than 100ha).
Strategic Resource Plan planning scheme zoning of the land:
FZ Farming Zone
UGZ Urban Growth Zone
types of buildings on the land:
Any buildings that are consistent with the definition of Rural Agricultural Land (greater
than 100ha).
any other criteria relevant to the Rural Agricultural Land (greater than 100 ha)
Differential Rate:
Nil
2.5.4 The characteristics of the land which are the criteria for declaring the Rural Agricultural
Land (greater than 100 ha) Differential Rate:
Rural Agricultural Land (greater than 100ha) is rateable land:
that is cumulatively across all land owned by the ratepayer greater than 100 hectares in
area; and
that is wholly contained within, or is contiguous with land outside of, the municipal district;

78
that is used primarily for grazing (including agistment), dairying, pig-farming, poultry-
farming, fish-farming, tree-farming, bee-keeping, viticulture, horticulture, fruit-growing or
the growing of crops of any kind or for any combination of those activities; and
that is used by a business –
- that has a significant and substantial commercial purpose or character;
- that seeks to make a profit on a continuous or repetitive basis from its activities on
the land;
- that is making a profit from its activities on the land, or that has a reasonable
prospect of making a profit from its activities on the land if it continues to operate
in the way that it is operating; and
- that is registered with the Australian Taxation Office as a primary producer.
2.6 Subdivisional Land Differential Rate:
2.6.1 Definition of the type or classes of land which are subject to the Subdivisional Land
Differential Rate:
Subdivisional Land is rateable land for which -
a planning permit to subdivide the land into three (3) or more lots has been issued and
has not lapsed; and
a separate certificate of title has not been issued for any of those lots.
but excludes any land that:
is subject to the Rural Agricultural Land (40ha to 100ha) Differential Rate; or
is subject to the Rural Agricultural Land (greater than 100ha) Differential Rate.
2.6.2 Statement of reasons for the use and level of Subdivisional Land Differential Rate in
relation to those types or classes of land:
Subdivisional Land by definition is the originator of land before it becomes subject to Vacant
Land Differential Rate.
It is considered Subdivisional Land should make the same equitable contribution towards
the services and facilities invested in by the Council as the Vacant Land Differential Rate.
The objective of the Subdivisional Land Differential rate is to ensure makes an equitable
financial contribution towards direct and indirect costs attributable to land development
within Council’s municipal district, including increases in:
utilisation of Council road infrastructure; and/or
noise, dust and environment monitoring; and/or
local law compliance; and/or
provision of services and facilities by Council; and/or
administration costs for rateable properties created by the Subdivisional Land.
2.6.3 Identification of the types or classes of land which are subject to the Subdivisional Land
Differential Rate in respect of:
uses of the land:
Any use
geographic location of the land:
Anywhere in Council’s municipal district

79
planning scheme zoning of the land:
Nil
types of buildings on the land:
Any buildings
any other criteria relevant to the Subdivisional Land Differential Rate:
The Subdivisional Land Differential Rate excludes Rural Agricultural Land (40ha to
100ha) Differential Rate or the Rural Agricultural Land (greater than 100ha) Differential
Rate due the reduced demand and supply of services and facilities in rural localities.
2.6.4 The characteristics of the land which are the criteria for declaring the Subdivisional Land
Differential Rate:
Subdivisional Land is rateable land for which -
a planning permit to subdivide the land into three (3) or more lots has been issued and
has not lapsed; and
a separate certificate of title has not been issued for any of those lots.
but excludes any land that:
is subject to the Rural Agricultural Land (40ha to 100ha) Differential Rate; or
is subject to the Rural Agricultural Land (greater than 100ha) Differential Rate.

80
Appendix C
Capital works program
This appendix presents a listing of the capital works projects that will be undertaken for the
2015/16 year:
$(‘000)
Carry forward Projects 5,345 (Page 81)
New Projects 10,551 (Page 82-85)
Total 15,896

81
2015/16 Capital Works Program – Carry Forward works for 2015/16 1. Carry forwards
Project Cost New Renewal Upgrade ExpansionGrants /
ContributionsSales Council Cash Borrowings
$'000 $'000 $'000 $'000 $'000 $'000 $'000 $'000 $'000
Land
Property Sales - - - - - 400 - -
Strategic Land Acquisition / Matched Funding in South of Shire 3,500 3,500 - - - - - 3,500
To ta l fo r Land 3,500 3,500 - - - - 400 - 3,500
Roads
Kings Lane Pavement Improvement 157 - - 157 - - 157 -
Mill Street (Streetscape Upgrade) 361 - - 361 30 - 331 -
Minton Street Seal Widening - - - - - - - -
To ta l fo r Roads 518 - - 518 - 30 - 488 -
Bridges
Smiths Bridge Replacement * 40 - 40 - - - 40 -
Willowmavin Road Bridge Replacement 110 - 110 - 110 - - -
Old Goulburn River Bridge Safety Works 91 - - 91 148 - -57 -
To ta l fo r B r idges 241 - 150 91 - 258 - - 17 -
Drainage
Seymour Flood Levee 48 - - 48 48 - - -
To ta l fo r Dra inage 48 - - 48 - 48 - - -
Recreational , Le isure and Community Faci l i ties
Greenhill Netball Court 5 5 - - - 5 - - -
To ta l fo r Rec rea t iona l, Le isure and Community Fac ilit ie s 5 5 - - - 5 - - -
Waste Management
Seymour Landfill Rehabilitation 636 - 636 - - - 636 -
To ta l fo r Waste Management 636 - 636 - - - - 636 -
Parks, Open Space and Streetscapes
Hadfield Park AAA Playground 397 - - 397 - - 397 -
To ta l fo r Pa rks, Open Space and St ree tscapes 397 - - 397 - - - 397 -
Tota l fo r Capita l Works Program 5,345 3,505 786 1,054 - 341 400 1,504 3,500
Capita l Wo rks
Funding sourcesAsse t e xpenditure
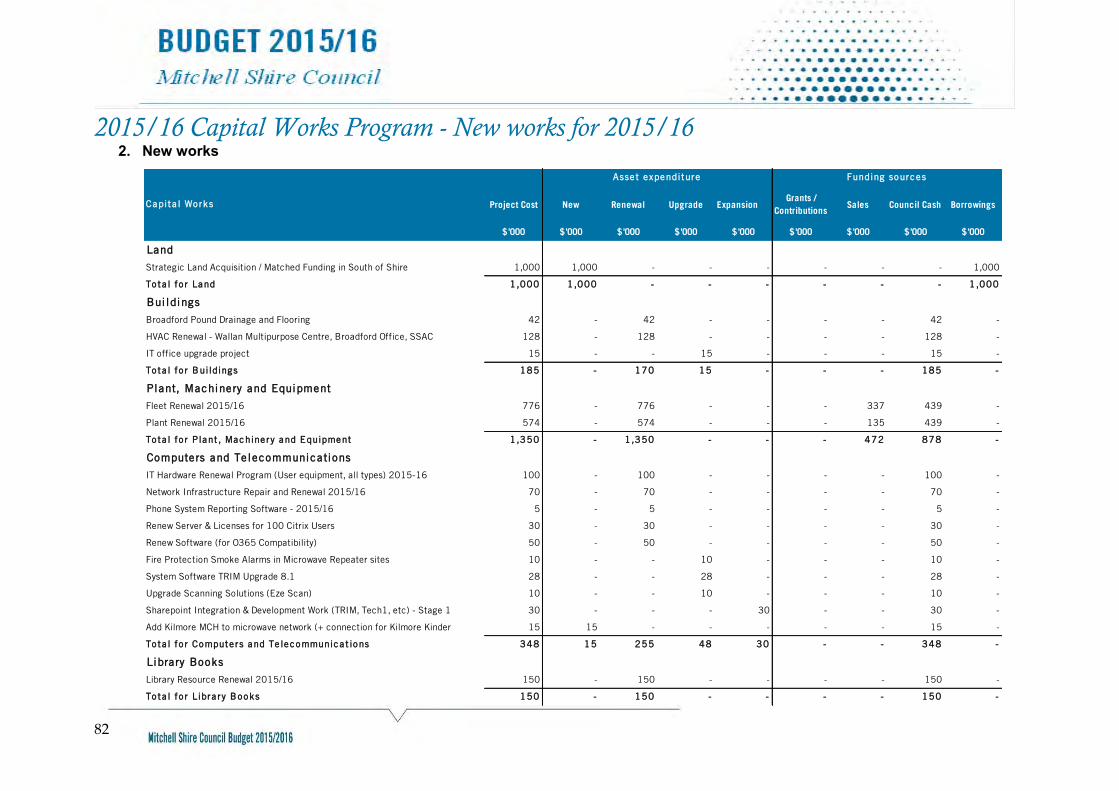
82
2015/16 Capital Works Program - New works for 2015/16 2. New works
Project Cost New Renewal Upgrade ExpansionGrants /
ContributionsSales Council Cash Borrowings
$'000 $'000 $'000 $'000 $'000 $'000 $'000 $'000 $'000
Land
Strategic Land Acquisition / Matched Funding in South of Shire 1,000 1,000 - - - - - - 1,000
To ta l fo r Land 1,000 1,000 - - - - - - 1,000
Buildings
Broadford Pound Drainage and Flooring 42 - 42 - - - - 42 -
HVAC Renewal - Wallan Multipurpose Centre, Broadford Office, SSAC 128 - 128 - - - - 128 -
IT office upgrade project 15 - - 15 - - - 15 -
To ta l fo r Buildings 185 - 170 15 - - - 185 -
Plant, Machinery and Equipment
Fleet Renewal 2015/16 776 - 776 - - - 337 439 -
Plant Renewal 2015/16 574 - 574 - - - 135 439 -
To ta l fo r Plant , Machine ry and Equipment 1,350 - 1,350 - - - 472 878 -
Computers and Telecommunications
IT Hardware Renewal Program (User equipment, all types) 2015-16 100 - 100 - - - - 100 -
Network Infrastructure Repair and Renewal 2015/16 70 - 70 - - - - 70 -
Phone System Reporting Software - 2015/16 5 - 5 - - - - 5 -
Renew Server & Licenses for 100 Citrix Users 30 - 30 - - - - 30 -
Renew Software (for O365 Compatibility) 50 - 50 - - - - 50 -
Fire Protection Smoke Alarms in Microwave Repeater sites 10 - - 10 - - - 10 -
System Software TRIM Upgrade 8.1 28 - - 28 - - - 28 -
Upgrade Scanning Solutions (Eze Scan) 10 - - 10 - - - 10 -
Sharepoint Integration & Development Work (TRIM, Tech1, etc) - Stage 1 30 - - - 30 - - 30 -
Add Kilmore MCH to microwave network (+ connection for Kilmore Kinder 15 15 - - - - - 15 -
To ta l fo r Compute rs and Te lecommunica t ions 348 15 255 48 30 - - 348 -
Library Books
Library Resource Renewal 2015/16 150 - 150 - - - - 150 -
To ta l fo r Libra ry Books 150 - 150 - - - - 150 -
Asse t e xpenditure Funding sources
Capita l Wo rks

83
Project Cost New Renewal Upgrade ExpansionGrants /
ContributionsSales Council Cash Borrowings
$'000 $'000 $'000 $'000 $'000 $'000 $'000 $'000 $'000
Roads
Kings Lane - Pavement Improvement (R2R) 430 - 430 - - 430 - - -
Queen Street/Windham Street Intersection - Pavement Renewal (R2R) 120 - 120 - - 120 - - -
Re-sheeting Programme for Bromfields Road 70 - 70 - - - - 70 -
Re-sheeting Programme for Ghin Ghin Road (Kobyboyn rd to Chetwynd Road) 42 - 42 - - - - 42 -
Re-sheeting Programme for Hume & Hovell Road 53 - 53 - - - - 53 -
Re-sheeting Programme for Kellys Lane 22 - 22 - - - - 22 -
Re-sheeting Programme for McDonalds Road (Coulsons Road to Freeway) 71 - 71 - - - - 71 -
Re-sheeting Programme for Mia Mia Road 22 - 22 - - - - 22 -
Re-sheeting Programme for Old Sydney Road (Darraweit Road to Stockdale
Road) 64 - 64 - - - - 64 -
Re-sheeting Programme for Old Sydney Road (Northern Highway to Darraweit
Road) 74 - 74 - - - - 74 -
Re-sheeting Programme for Panyule Road (R2R) 159 - 159 - - 159 - - -
Re-sheeting Programme for Selection Road (Red Gum Road to Broadford
Glenaroua Road) 29 - 29 - - - - 29 -
Re-sheeting Programme for Sungarrin Road 106 - 106 - - - - 106 -
Re-sheeting Programme for Three Chain Road between Longs Lane to Slatterys
Road) 77 - 77 - - - - 77 -
Re-sheeting Programme for Union Lane (Mill Road to Northern Highway) 72 - 72 - - - - 72 -
Re-sheeting Programme for Wallan Heights Road 35 - 35 - - - - 35 -
Shoulder Repair Programme for Minton Street (R2R) 106 - 106 - - 106 - - -
William Street (East) – Pavement Renewal (R2R) 230 - 230 - - 230 - - -
William Street (West) – Pavement Renewal (R2R) 455 - 455 - - 455 - - -
To ta l fo r Roads 2,237 - 2,237 - - 1,500 - 737 -
Bridges
Highlands Road Bridge 1411 - Replacement Works 350 - 350 - - - - 350 -
Manse Hill Road/Northwood Road – Bridge 1421 – Renewal (R2R) 150 - 150 - - 150 - - -
To ta l fo r B r idges 500 - 500 - - 150 - 350 -
Asse t e xpenditure Funding sources
Capita l Wo rks

84
Project Cost New Renewal Upgrade ExpansionGrants /
ContributionsSales Council Cash Borrowings
$'000 $'000 $'000 $'000 $'000 $'000 $'000 $'000 $'000
Footpaths and Cycleways
Abdallah Road, Seymour – Footpath Renewal/new 5 - 5 - - - - 5 -
Anzac Avenue, Seymour – School crossing relocation 15 - 15 - - - - 15 -
Anzac Avenue, Seymour Footpath Renewal 20 - 20 - - - - 20 -
Arrowsmith Street, Beveridge Footpath Renewal 25 - 25 - - - - 25 -
High Street, Seymour - Pedestrian fencing near Whiteheads Creek bridge 20 - 20 - - - - 20 -
Kilmore Lancefield Road Footpath Construction 300 300 - - - - - 300 -
To ta l fo r Foo tpa ths and Cyc leways 385 300 85 - - - - 385 -
Drainage
High Street, Seymour – K&C and Drainage 95 - - 95 - - - 95 -
Seymour Flood Levee - Stage 2 250 250 - - - - - - 250
To ta l fo r Dra inage 345 250 - 95 - - - 95 250
Recreational , Le isure and Community Faci l i ties
Harley Hammond Oval Renovation - Stage 1 120 - 120 - - 90 - 30 -
Kilmore Memorial Hall Replacement Of Bifold Doors 14 - 14 - - 5 - 9 -
Pool Plant Renewal - Central Region 35 - 35 - - - - 35 -
Pool Plant Renewal - North Region 42 - 42 - - - - 42 -
Program Painting 26 - 26 - - - - 26 -
Tallarook Hall Building Improvements 78 - 78 - - - - 78 -
Tennis and Netball Court Surface Renewal 200 - 200 - - - - 200 -
Early Learning Facility at Wallan Primary School 2,000 2,000 - - - 2,000 - - -
Sports Pavilion Broadford Leisure Centre Precinct * 645 645 - - - 150 - 495 -
To ta l fo r Rec rea t iona l, Le isure and Community Fac ilit ie s 3 ,160 2 ,645 515 - - 2 ,245 - 915 -
Waste Management
Mitchell Landfill Fencing Renewal 15 - 15 - - - - 15 -
Upgrade two (2) Leachate Ponds - Seymour and Hilldene Landfills 531 - 531 - - - - 531 -
Mitchell Landfill Weighbridges Access Security And Transaction Compliance
Checking 45 - - 45 - - - 45 -
Mitchell Landfill Movable Litter Nets 45 - - - 45 - - 45 -
To ta l fo r Waste Management 636 - 546 45 45 - - 636 -
Asse t e xpenditure Funding sources
Capita l Wo rks
* Council Cash includes $200K LGIP funding already received by Council (reallocated from
Smilths Bridge project).

85
Project Cost New Renewal Upgrade ExpansionGrants /
ContributionsSales Council Cash Borrowings
$'000 $'000 $'000 $'000 $'000 $'000 $'000 $'000 $'000
Parks, Open Space and Streetscapes
General Playground Development 200 - 200 - - - - 200 -
Park Furniture Renewal 10 - 10 - - - - 10 -
Playground Renewal Program 10 - 10 - - - - 10 -
To ta l fo r Pa rks, Open Space and St ree tscapes 220 - 220 - - - - 220 -
Off Street Car Parks
Wandong Hall Disabled Parking Bay Upgrade 35 - - 35 - - - 35 -
To ta l fo r Of f St ree t Ca r Pa rks 35 - - 35 - - - 35 -
Tota l fo r Capita l Works Program 10,551 4,210 6,028 238 75 3,895 472 4,934 1,250
Asse t e xpenditure Funding sources
Capita l Wo rks

86
Appendix D
Fees & Charges Schedule Building ......................................................................................................................................................................................... 88
Permits - Commercial Works ..................................................................................................................................... 88 Permits - Miscellaneous ............................................................................................................................................... 88 Permits - Outbuildings ................................................................................................................................................... 88 Permits - Residential ...................................................................................................................................................... 88 Permits - Swimming Pools & Safety Barriers .................................................................................................. 89
Planning ........................................................................................................................................................................................ 89 Excludes fees subject to Planning & Environment (Fees) Regs 2000 ............................................ 89 Excludes fees subject to Planning & Environment (Fees) Regs 2004 ............................................ 89 Photocopying & Plan Printing ................................................................................................................................... 89 A4 Black and White ......................................................................................................................................................... 89
Strategic Planning ..................................................................................................................................................................... 89 Development Plan Applications (DPO) ............................................................................................................... 89 Planning Scheme Amendments .............................................................................................................................. 89
Infrastructure Works ............................................................................................................................................................... 90 Road Opening Permits - Municipal Roads <50kph - No GST .............................................................. 90 Road Opening Permits - Municipal Roads >50kph - No GST .............................................................. 90
SubDivisions ................................................................................................................................................................................ 90 Inspections and Checking ........................................................................................................................................... 90
Corporate Services ................................................................................................................................................................... 90 Rates & Charges .............................................................................................................................................................. 90
Facilities ........................................................................................................................................................................................ 91 Broadford Hall..................................................................................................................................................................... 91 Broadford, Wandong and Seymour Sports and Aquatic Centre Stadiums ................................... 91 Chittick Park Community Place ............................................................................................................................... 91 Clonbinane Hall Centre ................................................................................................................................................ 91 Events...................................................................................................................................................................................... 91 Facility Cleaning ................................................................................................................................................................ 91 Kilmore Family Centre ................................................................................................................................................... 92 Kilmore and Wallan Library meeting rooms ..................................................................................................... 92 Open Space Hire .............................................................................................................................................................. 92 Goulburn Park Rotunda Hire ..................................................................................................................................... 92 Classification A Playing Field Hire – Greenhill Reserve upper and lower ovals ....................... 92 Classification B Playing Field Hire – JJ Clancy Reserve oval, LB Davern Reserve oval and Chittick oval .......................................................................................................................................................................... 93 Classification C Playing Field Hire – Bennet oval ........................................................................................ 93 Seymour Sports & Aquatic Centre ......................................................................................................................... 93 Wallan Multi-Purpose Community Centre ......................................................................................................... 93 Wallan Secondary College ......................................................................................................................................... 94
Leisure Centres .......................................................................................................................................................................... 94 Kilmore Leisure Centre - (KLC) and Seymour Sports and Aquatic Centre - (SSAC) ............ 94 Birthday Parties (KLC and SSAC) ......................................................................................................................... 94 Fitness Assessments (KLC and SSAC) ............................................................................................................. 94 Instructor Hire Group Bookings (KLC and SSAC) ....................................................................................... 94 Memberships (KLC and SSAC) ............................................................................................................................... 95 Memberships (KLC and SSAC) (continued) .................................................................................................... 95 Miscellaneous (KLC and SSAC) ............................................................................................................................. 95 Personal Training (KLC and SSAC) ..................................................................................................................... 96 Programs (KLC and SSAC) ....................................................................................................................................... 96

87
Room hire (KLC and SSAC) ...................................................................................................................................... 96 Short courses (KLC and SSAC) .............................................................................................................................. 96 Swim School (KLC and SSAC) ................................................................................................................................ 96 Swimming (KLC and SSAC) ...................................................................................................................................... 97 Broadford Leisure Centre ............................................................................................................................................ 97 Wallan Leisure Centre ................................................................................................................................................... 97
Outdoor Pools ............................................................................................................................................................................ 97 Broadford/Seymour/Tallarook Swim Pool ......................................................................................................... 97
Stadiums ....................................................................................................................................................................................... 98 Seymour Sports and Aquatic Centre .................................................................................................................... 98
Libraries......................................................................................................................................................................................... 98 Broadford/ Kilmore/ Seymour/ Wallan Library ................................................................................................ 98
Community Services ................................................................................................................................................................ 98 Aged & Disabled Services .......................................................................................................................................... 98 Childrens Services ........................................................................................................................................................... 98
Environmental Health ............................................................................................................................................................. 98 Environment Protection Act 1970 ........................................................................................................................... 98 Food Act 1984 – Food Act Registration ............................................................................................................. 99 Public Health & Wellbeing Act 2008 ..................................................................................................................... 99 Residential Tenancies Act 1997 ............................................................................................................................. 99
Community Compliance ......................................................................................................................................................... 99 1.7 Derelict/Abandoned Vehicle Removal ........................................................................................................ 99 Dog & Cat Registration ................................................................................................................................................. 99 Domestic Animal Business ......................................................................................................................................... 99 Fire Prevention Works ................................................................................................................................................... 99 Local Laws Fees ............................................................................................................................................................... 99 Local Laws Fees (continued.)................................................................................................................................ 100 Pet Expo ............................................................................................................................................................................. 100 Pound Fees ....................................................................................................................................................................... 100 Uncontained Animals/Livestock ........................................................................................................................... 100
Waste Management ............................................................................................................................................................. 101 Waste Operations ......................................................................................................................................................... 101

88
Service Description
GST (Y/N)
Unit Of
Measure
2015/16 (GST Incl
if applicable)
Building
Permits - Commercial Works
Shop Fit out (Cost less than $20,000) Y Permit 500.00 Class 5-9 over $300,000
Y
Permit
0.04% of building cost + $860 to
0.04% of building cost + $885
Class 5-9 up to $300,000
Y
Permit
0.08% of building cost + $495
Permits - Miscellaneous
Title Search Y Permit 36.00 Change of Permit or certificate Details Y Permit 63.00 Copy of Building Permit or Occupancy Permit (recall request) Y Permit 68.00 Copy of Residential Plans (recall request) Y Permit 79.00 Re-Inspections or Additional inspections Y Permit 131.00 Copy of Commercial Plans (recall request) Y Permit 152.00 Building Permit Extension of Time Y Permit 175.00 Weekend inspections Y Permit 190.00 Change of use (no building work) Y Permit 500.00 Combining of Essential Safety Measures Schedule Reg 1206 Y Permit 280.00 Application for Occupancy Permit - Circus Y Permit 280.00 Application for Occupancy Permit - Public event on Land Y Permit 280.00 Change of use (building work required) Y Permit 500.00 Application for Occupancy Permit - Public Building Y Permit 470.00
Permits - Outbuildings
<$20,000 including steel garages, carports, verandas, decks, retaining walls etc Y Permit 470.00 Brick Garages Y Permit 530.00 Sheds over $20,000 up to $100,000 (over $100,000 commercial rates) Y Permit 885.00
Permits - Residential
Minor Dwelling Alterations (removal of internal wall, increasing a window size) Y Permit 470.00 Demolitions (where protection work not required) Y Permit 550.00 Protection Work Notices where a basement/large excavation >1.5 metres or con Y Permit 595.00 Multi-Unit Development (each) Y Permit 805.00 Dwelling Extensions/Alterations (all) Registered Builders (Up to $100,000) Y Permit 885.00 Dwelling Extensions/Alterations (All) Owner Builder (Up to $100,000) Y Permit 1,220.00 New Dwelling (Up to $150,000) Registered Builders Y Permit 1,435.00 New Dwelling ($150,000 to $300,000) Registered Builders Y Permit 1,725.00 New Dwelling (Up to $150,000) Owner Builder Y Permit 1,795.00 New Dwelling ($150,000 to $300,000) Owner Builder Y Permit 2,160.00 New Dwellings ($300,000-$500,000) Registered Builder Y Permit 2,440.00 New Dwellings ($300,000-$500,000) Owner Builder Y Permit 3,045.00 New dwellings (Over $500,000) - Price on Application
Y
Permit
Price on Application

89
Service Description
GST (Y/N)
Unit Of
Measure
2015/16 (GST Incl
if applicable)
Permits - Swimming Pools & Safety Barriers
Safety Barrier permit Y Permit 290.00 Above/ Inground pools (Fibreglass) Y Permit 470.00 In-ground pools (Concrete Only) Y Permit 655.00
Planning
Excludes fees subject to Planning & Environment (Fees) Regs 2000
Advertising fee for each letter required Y Occasion 6.30 File Retrieval fee Y File 45.00 Supplying a copy of Planning Permit (no plans) or copy of plans alone (includes file retrieval)
Y
Permit
65.00
Advertising Fee per sign Y Occasion 75.00 Supplying a copy of a Planning Permit with plans (includes file retrieval) Y Permit 95.00 Request for secondary consent Y Occasion 135.00 Extension of time request Y Occasion 215.00 Preparing a Sect. 173 Agreement Y Plan Fee At Market Cost Amend or Removal of a Sect.173 Agreement Y Plan Fee 285.00
Excludes fees subject to Planning & Environment (Fees) Regs 2004
Provision of written advice (50% of the $90 will be removed from the planning application fee if the advice indicates a permit is needed and an application is lodged)
Y
Occasion
90.00
Photocopying & Plan Printing
A4 Black and White Y Page 0.30
A3 Black and White Y Page 0.50 A4 Colour page Y Page 1.65 A3 Colour page Y Page 2.15
Strategic Planning
Development Plan Applications (DPO)
Application fee for a Development Plan which includes the subdivision of land Y Application 600.00 Application fee for all other Development Plan types Y Application 400.00 Application fee for an amended Development Plan Y Application 400.00 Newspaper advertising
Y
Occasion
Cost recovery + 20%
Advertising fee for each letter required Y Occasion 6.15
Planning Scheme Amendments
Newspaper advertising
Y
Occasion
Cost recovery + 20%
Advertising fee for each letter required Y Occasion 6.15

90
Service Description GST (Y/N)
Unit Of Measure
2015/16 (GST Incl if applicable)
Infrastructure Works
Road Opening Permits - Municipal Roads <50kph - No GST
Major Works (A) Reinstatement Fee Y Permit Actual cost + GST Major Works (B) Reinstatement Fee Y Permit Actual cost + GST Minor Works (A) Reinstatement Fee Y Permit Actual cost + GST Minor Works (B) Reinstatement Fee Y Permit Actual cost + GST
Road Opening Permits - Municipal Roads >50kph - No GST
Major Works (A) Reinstatement Fee Y Permit Actual cost + GST Major Works (B) Reinstatement Fee Y Permit Actual cost + GST Minor Works (A) Reinstatement Fee Y Permit Actual cost + GST Minor Works (B) Reinstatement Fee Y Permit Actual cost + GST
SubDivisions
Inspections and Checking
Supervision of Civil Works:(eg.changes to Council's assets or internal property works as a requirement of Planning Permit conditions) $0 - $9,999 Y Application 338.00 Inspection of connections to Council's easement drains Y Inspection 138.50 Design checking of internal property drainage designs incl. on-site detentions Y Application 267.00 Supervision of Civil Works:(eg.changes to Council's assets or internal property works as a requirement of Planning Permit conditions) $10,000 - $29,999 Y Application 666.00 Design checking for civil works (e.g. changes to Council's assets or internal property works as a requirement of Planning Permit conditions) Y Application 343.00 Supervision of Civil Works:(eg.changes to Council's assets or internal property works as a requirement of Planning Permit conditions) $30,000+ Y Application 2.10%
Inspection Fees Y Inspection Actual cost + 10% +
GST
Concrete Footpath 75mm Depth (Per sqm) Y Inspection Actual cost + 10% +
GST
Concrete Footpath 125 - 150mm Depth (Per sqm) Y Inspection Actual cost +10% +
GST
Deep Lift asphalt road/asphalt concrete road base (Per sqm) Y Inspection Actual cost +10% +
GST
Bitumen Roads (Per Square Metre) Y Inspection Actual cost +10% +
GST
Kerb & Channel (Per Metre) Y Inspection Actual cost +10% +
GST
Corporate Services
Rates & Charges
Rate notice reprint (mailed) Y Occasion 11.60 Rate notice reprint (fax, email or pickup) Y Occasion 23.10 Dishonoured payment (cheque, direct debit) - administration fee Y Occasion 34.90 Land Information Certificate (Same day including admin fee) N Assessment 45.10 Search fee – historical ratepayer information (per hour – minimum 1 hour) Y Hour 56.00

91
Service Description GST (Y/N)
Unit Of Measure
2015/16 (GST Incl if applicable)
Facilities
Broadford Hall
Broadford Hall - Hall( Incl Supper Room & Kitchen) -Casual- Community/School Y Hour 48.00 Broadford Hall - Hall( Incl Supper Room & Kitchen) -Casual- NFP/Govt Y Hour 67.00 Broadford Hall - Hall( Incl Supper Room & Kitchen) -Casual- Commercial/Private Y Hour 96.00 Broadford Hall - Hall( Incl Supper Room & Kitchen) -1/2 Day or Evening Y 4hrs 263.00 Broadford Hall - Hall( Incl Supper Room & Kitchen) - full day Y 8hrs 525.00
Broadford, Wandong and Seymour Sports and Aquatic Centre Stadiums
stadium court hire (per court) PEAK (4.00pm – 10pm Mon to Fri and all day Sat) – Regular user/Association
Y Hour $28.00
stadium court hire (per court) PEAK (4.00pm – 10pm Mon to Fri and all day Sat) – Junior club Regular user/Association
Y Hour $21.00
stadium court hire (per court) PEAK (4.00pm – 10pm Mon to Fri and all day Sat) – casual user
Y Hour $35.00
stadium court hire (per court) PEAK (4.00pm – 10pm Mon to Fri and all day Sat) – Junior club casual user
Y Hour $26.00
stadium court hire (per court) OFF PEAK (8.00am – 4.00pm Mon to Fri and all day Sun) – Regular user/Association
Y Hour $24.00
stadium court hire (per court) OFF PEAK (8.00am – 4.00pm Mon to Fri and all day Sun) – Junior club Regular user/Association
Y Hour $18.50
stadium court hire (per court) OFF PEAK (8.00am – 4.00pm Mon to Fri and all day Sun) –casual user
Y Hour $30.00
Broadford stadium court hire (per court) OFF PEAK (8.00am – 4.00pm Mon to Fri and all day Sun) – Junior club casual user
Y Hour $22.50
Broadford stadium Multi purpose activity room – Casual user – Commercial/Private Y Hour $20.00 Broadford stadium Multi purpose activity room - Casual user – Community/school Y Hour $11.00 Broadford stadium Multi purpose activity room - Regular user – Commercial/Private Y Hour $18.00 Broadford stadium Multi purpose activity room - Regular user – Community/school Y Hour $8.50 Squash court hire (per court) - casual user Y Hour $12.00 Squash court hire (per court) - regular user Y Hour $11.00
Chittick Park Community Place
Community Place building – community group – regular user Y Hour $13.00 Community Place building – community group – casual user Y Hour $21.00 Community Place building – Commercial/Private Y Hour $70.00 Large Meet room – functions (4 hours plus) Y Session $250.00
Clonbinane Hall Centre
Casual -NFP/Govt Y Hour 10.80 Casual -Commercial/Private Y Hour 15.90 Ongoing - Commercial/Private Y Hour fee by negotiation Ongoing - NFP/Government Y Hour fee by negotiation Casual - Community/School Y Hour fee by negotiation Ongoing - Community/School Y Hour fee by negotiation
Events
Events – Small (less than 200 pax) Y Day $210.00 Events – Large (over 200 pax) Y Day $368.00
Facility Cleaning
Facility Cleaning- Weekday Y Hour 46.00 Facility Cleaning- Weekend Y Hour 56.00

92
Service Description GST (Y/N)
Unit Of Measure
2015/16 (GST Incl if applicable)
Kilmore Family Centre
Kilmore Fam/Cnt- Gath Space-Ongoing - Community/School Y Hour 14.40 Kilmore Fam/Cnt- Consul.Room-Ongoing - Community/School Y Hour 14.40 Kilmore Fam/Cnt- Gath Space-Casual - Community/School Y Hour 17.90 Kilmore Fam/Cnt-Consul.Room-Casual - Community/School Y Hour 17.90 Kilmore Fam/Cnt-Gath Space-Ongoing -NFP/Govt Y Hour 21.50 Kilmore Fam/Cnt-Consul.Room-Ongoing -NFP/Govt Y Hour 21.50 Kilmore Fam/Cnt- Gath Space-Casual -NFP/Govt Y Hour 25.00 Kilmore Fam/Cnt- Consul.Room-Casual -NFP/Govt Y Hour 25.00 Kilmore Fam/Cnt- Gath Space -Ongoing -Commercial/Private Y Hour 32.30 Kilmore Fam/Cnt- Consul.Room-Ongoing -Commercial/Private Y Hour 32.30 Kilmore Fam/Cnt- Gath Space-Casual -Commercial/Private Y Hour 36.00 Kilmore Fam/Cnt- Consul.Room-Casual -Commercial/Private Y Hour 36.00
Kilmore and Wallan Library meeting rooms
Small Meet Room – community group – regular or casual user Y Hour $7.50 Small Meet Room – commercial/private Y Hour $30.00 John Taylor Room – community group – regular user Y Hour $13.00 John Taylor Room – community group – casual user Y Hour $21.00 John Taylor Room – Commercial/Private Y Hour $70.00 John Taylor Room – functions (4 hours plus) Y Session $250.00
Open Space Hire
Personal Training Open Space Fee - Casual Y Hour 13.00 Personal Training Open Space Fee - Annual Subscription Y Annual 630.00
Goulburn Park Rotunda Hire
Goulburn Park Rotunda – casual booking – weddings and ceremonies – up to 1 hour Y Hour $50.00 Goulburn Park Rotunda – casual booking – weddings and ceremonies – up to 2 hours Y First 2 hours $100.00 Goulburn Park Rotunda – casual booking – weddings and ceremonies – up to ½ day (up to 4 hours)
Y Half day $200.00 Cancellation fee for any booking (less than 1 week from the booking date) Per
cancellationNo refund
Cancellation fee for any booking (less than a month from booking date) Y Per cancellation
50% refund Cancellation fee for any booking (over a month from booking date) Y Per
cancellation100% refund
Classification A Playing Field Hire – Greenhill Reserve upper and lower ovals
Playing field Hire – 2015 winter season training Y Session $13.30 Playing field Hire – 2015 winter season fixtured games Y Game $13.30 Playing field Hire – finals Y Hour $26.70 Playing field Hire – 2015 summer season and 2016 winter season (fixtured games and training)
Y Season $1,350.00 Playing field Hire – 2015 summer season and 2016 winter season – junior club (fixtured games and training)
Y Season $1,012.50 Playing field Hire – casual hire – full day Y Day $170.00 Playing field Hire – casual hire – half day Y Half Day $85.00 Playing field Hire – casual hire – Junior activities, inter school sports/intra school carnivals - full day
Y Day $127.50 Playing field Hire – casual hire – Junior activities, inter school sports/intra school carnivals - half day (up to 4 hours)
Y Half Day $63.75 Playing field Hire – Intra school physical education/sporting use during school hours (Mitchell schools)
No charge

93
Service Description
GST (Y/N)
Unit Of
Measure
2015/16 (GST Incl
if applicable)
Classification B Playing Field Hire – JJ Clancy Reserve oval, LB Davern Reserve oval and Chittick oval
Playing field Hire – 2015 winter season training Y Session $13.30 Playing field Hire –2015 winter season fixtured games Y Game $13.30 Playing field Hire – finals Y Hour $26.70 Playing field Hire – 2015 summer season and 2016 winter season (fixtured games and training)
Y Season $1,125.00 Playing field Hire – 2015 summer season and 2016 winter season – junior club (fixtured games and training)
Y Season $843.75 Playing field Hire - casual hire – full day Y Day $170.00 Playing field Hire – casual hire – half day Y Half Day $85.00 Playing field Hire – casual hire – Junior activities, inter school sports/intra school carnivals - full day
Y Day $127.50 Playing field Hire – casual hire – Junior activities, inter school sports/intra school carnivals - half day (up to 4 hours)
Y Half Day $63.75 Playing field Hire – Intra school physical education/sporting use during school hours (Mitchell schools)
No charge
Classification C Playing Field Hire – Bennet oval
Playing field Hire– 2015 winter season training Y Session $13.30 Playing field Hire –2015 winter season fixtured games Y Game $13.30 Playing field Hire –finals Y Hour $26.70 Playing field Hire –2015 summer season and 2016 winter season (fixtured games and training) Y Season $855.00 Playing field Hire –2015 summer season and 2016 winter season – junior club (fixtured games and training)
Y Season $641.25 Playing field Hire –casual hire – full day Y Day $170.00 Playing field Hire - casual hire – half day Y Half Day $85.00 Playing field Hire –casual hire – Junior activities, inter school sports/intra school carnivals - full day
Y Day $127.50 Playing field Hire – casual hire – Junior activities, inter school sports/intra school carnivals - half day (up to 4 hours)
Y Half Day $63.75 Playing field Hire – Intra school physical education/sporting use during school hours (Mitchell schools)
No charge
Seymour Sports & Aquatic Centre
Small Meet Room – community group – regular or casual user Y Hour $7.50 Small Meet Room – commercial/private Y Hour $30.00 Large Meet Room – community group – regular user Y Hour $13.00 Large Meet Room – community group – casual user Y Hour $21.00 Large Meet Room – commercial/private Y Hour $70.00 Large Meet room – functions (4 hours plus) Y Session $250.00
Wallan Multi-Purpose Community Centre
WMPC - Large Meeting Room -Ongoing - Community/School Y Hour 15.40 WMPC - Hall - Ongoing - Community/School Y Hour 18.20 WMPC - Large Meeting Room -Casual - Community/School Y Hour 19.00 WMPC - Hall - Casual -NFP/Govt Y Hour 31.80 WMPC - Large Meeting Room -Ongoing -NFP/Govt Y Hour 22.80 WMPC - Large Meeting Room -Casual -NFP/Govt Y Hour 26.70 WMPC - Hall - Casual - Community/School Y Hour 22.60 WMPC - Hall/Kitch/Foyer -Ongoing - Community/School Y Hour 29.70 WMPC - Hall - Ongoing -Commercial/Private Y Hour 41.00 WMPC - Large Meeting Room -Ongoing -Commercial/Private Y Hour 34.10 WMPC - Hall/Kitch/Foyer -Casual - Community/School Y Hour 37.40 WMPC - Large Meeting Room - Casual -Commercial/Private Y Hour 37.90 WMPC - Hall - Ongoing -NFP/Govt Y Hour 27.20 WMPC - Hall/Kitch/Foyer -Ongoing -NFP/Govt Y Hour 45.00 WMPC - Hall - Casual -Commercial/Private Y Hour 45.00 WMPC - Hall/Kitch/Foyer -Casual -NFP/Govt Y Hour 52.50 WMPC - Hall/Kitch/Foyer -Ongoing -Commercial/Private Y Hour 67.00 WMPC - Hall/Kitch/Foyer - Casual -Commercial/Private Y Hour 75.00

94
Service Description
GST (Y/N)
Unit Of
Measure
2015/16 (GST Incl
if applicable)
Wallan Secondary College
Wallan Secondary College- Crt Hire- Ongoing -Community/School Y Hour 7.20 Wallan Secondary College- Crt Hire- Casual -Community/School Y Hour 8.20 Wallan Secondary College- Crt Hire with lights- Ongoing -Community/School Y Hour 10.80 Wallan Secondary College- Crt Hire- Ongoing -NFP/Govt Y Hour 11.80 Wallan Secondary College- Crt Hire with Lights- Casual -Community/School Y Hour 12.30 Wallan Secondary College- Crt Hire- Casual -NFP/Govt Y Hour 13.30 Wallan Secondary College- Crt Hire with Lights- Ongoing -NFP/Govt Y Hour 17.90 Wallan Secondary College- Crt Hire with Lights- Casual -NFP/Govt Y Hour 20.00 Wallan Secondary College- Crt Hire- Ongoing -Commercial/Private Y Hour 23.60 Wallan Secondary College- Crt Hire- Casual -Commercial/Private Y Hour 26.70 Wallan Secondary College- Crt Hire with Lights- Ongoing -Commercial/Private Y Hour 35.90 Wallan Secondary College- Crt Hire with Lights- Casual -Commercial/Private Y Hour 40.00
Leisure Centres
Kilmore Leisure Centre - (KLC) and Seymour Sports and Aquatic Centre - (SSAC) Leisure Centre – Aerobics (KLC and SSAC) Fit for Life Y Occasion 6.00 Sweats Y Occasion 6.00 Strong for Life Y Occasion 6.00 Aerobic Casual Y Occasion 13.80 Aquafit Casual Y Occasion 13.80 Aquanauts Casual Y Occasion 13.80 Gym Casual Y Occasion 16.60
Birthday Parties (KLC and SSAC)
Birthday parties Option 1 per child Y Occasion 17.90 Birthday parties Option 2 per child Y Occasion 23.60 Birthday parties Option 3 per child (SSAC only) Y Occasion 6.00
Fitness Assessments (KLC and SSAC)
Non Member fitness assessment Y Assessment 39.00 Non-Member program show Y Occasion 39.00
Instructor Hire Group Bookings (KLC and SSAC)
Swim per hour Y Hour 42.00 Fitness per session Y Session 54.00

95
Service Description
GST (Y/N)
Unit Of
Measure
2015/16 (GST Incl
if applicable)
Memberships (KLC and SSAC)
Direct Debit Swim concession (per month) Y Month 25.00 Direct Debit Adult Swim (per month) Y Month 31.80 10 session pass - child/concession swim membership Y Pass 36.40 10 session pass - adult swim membership Y Pass 45.00 Direct Debit Lifestyle membership concession/off peak Y Month 52.00 10 session senior’s pass (seniors classes only) Y Pass 59.00 Direct Debit Lifestyle membership Y Month 59.00 Direct Debit Premium membership concession/off peak Y Month 59.00 Secondary Schools membership 10 weeks lap swim Y Program 68.00 Direct Debit Premium membership Y Month 69.00 30 session pass – child concession swim membership Y Pass 86.50 Membership joining fee (3 people 50% discount,4 people 75% each, 5 people 100%) Y Membership 88.00
Memberships (KLC and SSAC) (continued)
Secondary School membership 10 week lifestyle Y Program 95.00 30 session pass – swim membership Y Pass 115.50 Family Direct Debit Premium membership Y Month 122.00 Specialised Programs – 6 weeks Y Program 154.00 Workcover Swim 3 months Y Program 159.50 3 Month Lifestyle membership concession/off peak Y Membership 180.00 3 Month Lifestyle membership Y Membership 220.00 Workcover Lifestyle 3 months Y Program 295.00 6 Month Lifestyle membership concession/off peak Y Membership 345.00 6 Month Lifestyle membership Y Membership 420.00 Workcover Lifestyle 6 months Y Program 557.00 12 month Lifestyle membership concession/off peak Y Membership 609.00 12 month Premium membership concession/off peak Y Membership 726.00 12 month Lifestyle membership Y Membership 783.00 12 month Premium membership Y Membership 957.00 12 Month Premium Family Y Membership 1,520.00 1 Month Lifestyle Y Month 88.00 10 Session Sauna Pass - Non Member (KLC only) Y Pass 149.50 10 Session Sauna Pass - Member (KLC only) Y Pass 123.50 Lifestyle 3 Month Membership Corporate Y Membership 198.00 Lifestyle 6 Month Membership Corporate Y Membership 378.00 Lifestyle 12 Month Membership Corporate Y Membership 705.00 Lifestyle Direct Debit Corporate per month (minimum 6 months) Y Membership 53.10 Premium (all Centres) Term 12 month Corporate Y Membership 861.00 Premium Direct Debit per month Corporate (minimum 6 months) Y Membership 62.00
Miscellaneous (KLC and SSAC)
Lockers Y Occasion 3.30 K.L.C. Advertising Signs Y Occasions 473.00

96
Service Description
GST (Y/N)
Unit Of
Measure
2015/16 (GST Incl
if applicable)
Personal Training (KLC and SSAC)
Members 30 minutes Y Occasion 41.00 Non members 30 minutes Y Occasion 47.70 Members 60 minutes Y Occasion 59.00 Non members 60 minutes Y Occasion 65.50 Member 10 x ½ hour Personal Training pass Y Pass 354.00 Non members 10 x ½ hour Personal Training pass Y Pass 384.00 Member 10 x 1 hour Personal Training pass Y Pass 496.00 Non members 10 x 1 hour Personal Training pass Y Pass 532.00
Programs (KLC and SSAC)
School entry – Fitness Y Entry 4.90 Kids Programs per session Y Session 6.00 Teen gym per session Y Session 6.00 Crèche (per child) 1.5 hours Y Child 6.70 Children’s holidays programs per session Y Session 8.50 Crèche (per child) 2 hours Y Child 8.50 Crèche (per child) 10 x 2hr session pass Y Pass 76.50 Teen gym 10 session pass Y Pass 59.00 Crèche (per child) 10 x 1.5hr session pass Y Pass 63.00 Sauna Session - Non Member (KLC only) Y Session 16.60 Sauna Session - Member (KLC only) Y Session 13.70 Occasional Care (Per Hour) Y Hour 8.50
Room hire (KLC and SSAC)
KLC aerobics room per hour (KLC only) Y Hour 34.90 KLC crèche room per hour (KLC only) Y Hour 34.90
Short courses (KLC and SSAC)
Member Y Course 115.00 Non-Member Y Course 139.00
Swim School (KLC and SSAC)
School & preschool age per lesson (full payment upon enrolment) Y Lesson 14.80 Semi- Private Lessons Y Lesson 22.90 Private Lessons Y Lesson 31.30 Express Swim Program – 1 week Y Program 47.20 Express Swim Program – 2 weeks Y Program 88.50 Instructor Hire Y Occasion 42.00 School & preschool age per month (full payment upon enrolment) Y Month 47.40 Semi-Private Lessons per month Y Month 83.40 Private Lessons per month Y Month 112.40

97
Service Description
GST (Y/N)
Unit Of
Measure
2015/16 (GST Incl
if applicable)
Swimming (KLC and SSAC)
School Entry - Pool Y Entry 3.80 Child Swim Y Occasion 4.20 Concession Swim Y Occasion 4.20 Swim Casual Y Occasion 5.60 Family Swim (2 adults & 3 children. Additional family members – concession rate Y Family 17.40 Pool hire per lane (1 hour) Y Hour 38.30 Full pool hire (hourly rate) Recreation Play (for every 100 patrons over the fi Y Hour 42.00 Full pool hire (hourly rate) School Carnivals (1DM & 2LG) Y Hour 127.50 Full pool hire (hourly rate) Recreation Play (up to 100 patrons) Y Hour 127.50 Full pool hire (hourly rate) Not for Profit Community Groups Y Hour 127.50 Full pool hire (hourly rate) Commercial Organisations Y Hour 173.50
Broadford Leisure Centre
Aerobic Casual Y Occasion 13.80 Basketball Y Player 8.00
Wallan Leisure Centre
Aerobic Casual Y Occasion 10.00 Teen/Seniors Class Y Occasion 6.00 Teen/Seniors 10 Session Pass Teen & Seniors Classes Only Y Pass 59.00 4 Month Class Membership (Unlimited Classes) Y Memberships 150.00 Direct Debit Membership Joining Fee Discounts apply: 3people 50%, 4people 75% ea Y Memberships 88.00 Premium (all Centres) Term 12 month Y Memberships 957.00 Premium (all Centres) Term 12 month Corporate Y Memberships 861.00 Premium (all Centres) Term 12 month Concession/Off Peak Y Memberships 726.00 Premium Direct Debit per month (minimum 6 months) Y Memberships 69.00 Premium Direct Debit Corporate per month (minimum 6 months) Y Memberships 62.10 Premium Direct Debit Conc/Off Peak per month (minimum 6 months) Y Memberships 59.00
Outdoor Pools
Broadford/Seymour/Tallarook Swim Pool
Child Swim Y Occasion 4.10 Concession Y Occasion 4.10 Swim Casual Y Occasion 5.10 Family pass {2 adults & 3 children (under 18). Additional family members – concession rate applies}
Y
Pass
16.40
Full pool hire BOP and TOP pools (hourly rate) Recreation Play (for every 100 patrons over the first 100 patrons, additional staff member cost of $37 per hour per 100 patrons)
Y
Hour
42.00
Additional kiosk staff per hour (LG rate) Y Hour 42.00 Child season. Valid at all 3 outdoor pools. Y Season 48.70 Concession season. Valid at all 3 outdoor pools. Y Season 48.70 Adult season. Valid at all 3 outdoor pools. Y Season 70.50 Family season {2 adults and 3 children (under 18). Additional family members – concession rate applies}. Valid at all 3 outdoor pools.
Y
Season
127.00
Full pool hire BOP and TOP pools (hourly rate) School Carnivals (1DM & 2LG) Y Hour 127.00 Full pool hire BOP and TOP pools (hourly rate) Recreation Play (up to 100 patrons) Y Hour 127.00 Full pool hire SWMOP (hourly rate) School Carnivals (1DM & 3LG) Y Hour 169.00

98
Service Description
GST (Y/N)
Unit Of
Measure
2015/16 (GST Incl
if applicable)
Stadiums
Seymour Sports and Aquatic Centre
Training (1 court) Y Court 20.00 Juniors (1 court) Y Court 33.80 Training (2 courts) Y Occasion 40.00 Seniors (1 court) Y Court 46.60 Juniors (2 courts) Y Occasion 67.50 Seniors (2 courts) Y Occasion 94.00
Libraries
Broadford/ Kilmore/ Seymour/ Wallan Library
A4 Black and White Y Copy 0.30 A4 Black and White print or copy Y Page 0.30 A3 Black and White Y Copy 0.50 A3 Black and White print or copy Y Page 0.50 Incoming Fax Y Page 0.65 Faxes - Subsequent pages Y Page 1.25 Faxes - International Subsequent pages Y Page 1.25 A4 Colour Y Copy 1.65 A4 Colour print or copy Y Page 1.65 A3 Colour Y Copy 2.15 A3 Colour print or copy Y Page 2.15 Replacement Card N Card 2.50 Faxes - First page Y Page 2.45 Faxes International - per page Y Page 3.60 Item to be reserved from Academic Library Y Reservation 17.40 Fines (Max per item $5.50) N Day 0.25 Lost/Damaged Book
N
Book
Replacement cost + $7.50
Community Services
Aged & Disabled Services
Senior Citizens Concert N Ticket 8.00 Wallan Units N Week 107.50
Childrens Services
Term 3 & 4-2013/2014 ( Per term per child - 4 year old) N Term 312.00 Term 1 & 2 2014/2015 (Per term per child - 4 year old) N Term 325.00 Term 3 & 4-2013/2014 ( Per term per child - 3 year old) N Term 208.00 Term 1 & 2 2014/2015 (Per term per child - 3 year old) N Term 220.00
Environmental Health
Environment Protection Act 1970
Septic Tank Plan Search N Registration 54.50 Septic Tank Permit (Tank & Lines) N Registration 420.00 Septic Tank (Advanced Wastewater Treatment) N Registration 420.00

99
Service Description
GST (Y/N)
Unit Of
Measure
2015/16 (GST Incl
if applicable)
Food Act 1984 – Food Act Registration
Class C2 Community N Registration 44.00 Class C3 Low-Packaged Goods N Registration 163.00 Class C2 Medium N Registration 292.00 Class C1 N Registration 390.00 Class C2 High N Registration 390.00 Streetrader - C2 N Permit 116.00 Streetrader C3 N Permit 68.50
Public Health & Wellbeing Act 2008
Renewal of registration - Hairdressers, skin penetration establishment N Registration 130.00 Renewal of Registration - Prescribed Accomodation N Registration 259.00
Residential Tenancies Act 1997
Transfer Inspection fee Y Registration 76.00 Renewal of Registration - Caravan Parks - as set by State Govt N Registration -
Community Compliance
1.7 Derelict/Abandoned Vehicle Removal
Storage fee - Daily Y Day 12.00 Release fee Y Release 135.00 Towing fee (varies from job to job 100% recovery of contractor's fee) Y Job -
Dog & Cat Registration
Dogs/Cats - Pensioner Discount 50% N Registration - Dogs/Cats - Desexed, KCC/ VCA reg, working dog, obedience trained, >10yo N Registration 43.00 Dogs/Cats - Standard fee N Registration 129.00 Dogs/Cats - Declared dogs N Registration 255.00
Domestic Animal Business
Domestic Animal Business Registration N Registration 115.00
Fire Prevention Works
Administration Fee Y Job 92.00 Contractors charge (100% cost recovery of contractor's fee + administration charge) Y Job 154.00
Local Laws Fees
Firewood Collection on roadsides N Permit 10.30 Livestock Grazing N Permit 52.00 Roadside Trading - daily fee N Permit 52.00 Temporary Vehicle Crossing N Permit 59.00 Bulk Rubbish Container on Road N Permit 59.00 Advertising Signs on Roads N Permit 70.00 Displaying Goods for Sale N Permit 70.00 Outdoor Eating Facility N Permit 70.00

100
Service Description
GST (Y/N)
Unit Of
Measure
2015/16 (GST Incl
if applicable)
Local Laws Fees (continued.)
Alcohol N Permit 112.00 Animal shelters N Permit 112.00 Asset Protection Permit N Permit 205.00 Roadside Trading - monthly fee N Permit 310.00 Resident Parking Permit N Permit 26.00 Temporary Resident Parking Permit N Permit 26.00 Keeping of animals N Permit 38.00 Open air burning N Permit 54.50 Use of recreation vehicle N Permit 59.00 Keeping of beehives N Permit 59.00 Street Party N Permit 70.00 Collection on Roads for House to House N Permit 70.00 Actions affecting Council land N Permit 112.00 Shipping containers N Permit 112.00 Electric fencing N Permit 112.00 Fireworks N Permit 112.00 Municipal Transfer Stations N Permit 112.00 Camping N Permit 112.00 All other Local Laws Permits N Permit 112.00 Circuses N Permit 450.00 Other Impounded items - Release fee Y Per item 80.00
Pet Expo
Stall Holder Fees (various) Y stall 25.00
Pound Fees
Welfare dogs - Daily Y Daily 5.00 Welfare cats - Daily Y Daily 5.00 Small Livestock - eg rabbits, guinea pigs, poultry - Daily Y Daily 5.00 Posting formal notice - Release Y Release 5.00 Medium Livestock - eg sheep/goats - Daily Y Daily 10.00 Small Livestock - eg rabbits, guinea pigs, poultry - Release Y Release 10.00 Seized dogs - Daily Y Daily 15.00 Dogs - Daily Y Daily 18.00 Cats - Daily Y Daily 18.00 Large Livestock - eg horses/cattle - Daily Y Daily 21.00 Advertisement in newspaper - Release Y Release 25.00 Medium Livestock - eg sheep/goats - Release Y Release 51.00 Surrendered animals - Release Y Daily 58.00 Dogs - Release Y Release 90.00 Cats - Release Y Release 90.00 Large Livestock - eg horses/cattle - Release Y Release 105.00
Uncontained Animals/Livestock
Cost Recovery (Ordinary per hour) - On release Y Hour 39.00 Cost Recovery (Saturday per hour) - On release Y Hour 58.00 Cost Recovery (Sunday per hour) - On release Y Hour 78.00

101
Service Description
GST (Y/N)
Unit Of
Measure
2015/16 (GST Incl
if applicable)
Waste Management
Waste Operations
Single axle trailer Waste (1m³ or less) Y Unit 31.00 Single axle trailer Waste heaped Y Unit 46.50 Single axle Boxed trailer Waste Y Unit 62.00 Single axle trailer Green Waste (1m³ or less) Y Unit 15.50 Single axle trailer Green Waste heaped Y Unit 15.50 Single axle Boxed trailer Green Waste Y Unit 31.00 Double axle trailer Green Waste Y Unit 31.00 Double axle trailer Green Waste heaped Y Unit 46.00 Double axle Boxed trailer Green Waste Y Unit 46.50 Double axle trailer Waste Y Unit 62.00 Double axle trailer Waste heaped Y Unit 77.00 Double axle Boxed trailer Waste Y Unit 123.00 Mattress - Single/King single Y Unit 15.50 Mattress - Doubles/Queen/King Y Unit 31.00 Other loads of bulk rubbish Y Unit 154.00 Car or motor cycle tyres Y Unit 8.00 Greenwaste Purchase at Waste Site Y Unit 5.00 Car Boot Load Waste Y Unit 15.50 Larger tyres (small truck) Y Unit 31.00 Municipal Waste (Landfill weighbridge) Y tonne 158.00 Industrial Waste (Landfill weighbridge) Y tonne 158.00 Bricks & Concrete (Landfill weighbridge) Y tonne 67.00 Disposal of a Gas bottle Y Unit 5.00

102
Appendix E
Schedule of Changes from the Draft Budget 2015/16 1.1 Corrections to operating results
Service Area Effect on Surplus
Budget Comments
Emergency Services (13,500) Include grant for SES of $13,500 as a final contribution.
Finance 13,500 Reduction in anticipated insurance cost.
Capital Income (150,000)
Adjustment to funding arrangement for Broadford Sports Pavilion project. Offset by reallocation of $200,000 LGIP grant funding already received by Council, reallocated from Smiths Bridge project. Further details listed under adjustments to capital expenditure below.
Effect on Net Surplus (150,000) Decrease in operating surplus from draft 2015/16 budget
1.2 Corrections to capital expenditure
Broadford Sports Pavilion 150,000
Increase to estimated cost of providing new Broadford sports pavilion which accommodate male and female facilities and incorporate the whole project in one year instead of two. Council will seek further external funding for this project, which if successful will reduce Council’s contribution to the pavilion. Refer to Capital income above.
Smiths Bridge Project (200,000)
The carry forward forecast estimate for Smiths Bridge has been reduced to reflect the decreased total cost estimate for the project. This project is being managed by Bendigo City Council as part of a border agreement. Council has reallocated $200,000 LGIP grant funding received for this project as described above.
Effect on total capital works expenditure
50,000 Increase in capital works expenditure from draft 2015/16 budget
1.2 Administrative corrections to wording, tables and graphs Reference Description
Throughout Amendments to tables, graphs, commentary and appendices to reflect the abovementioned changes from the 2015/16 draft budget.
Appendix D The fees and charges schedule has been amended in relation to: playing field hire, court hire at Council’s stadiums, room hire at stadium, libraries and Seymour sports and aquatic centre, community place building at Chittick Park, event bookings and new fees for exclusive use bookings of the new Goulbourn Park Rotunda to reflect a prior resolution of Council on 16 March 2015. New Creche 10 x2hr session pass added and reduction to max fine per library book.
Section 2 Waste management moved from 2.1 (Sustainable Growth and Development) to 2.4 (Environmental Resilience) in line with Council plan.

103

104
nicole