contents lists available at growingscience management ... · c h r o n i c l e a b s t r a c t ......
TRANSCRIPT
* Corresponding author. E-mail address: [email protected] (P. Rana) © 2018 by the authors; licensee Growing Science, Canada doi: 10.5267/j.msl.2018.4.033
Management Science Letters 8 (2018) 569–580
Contents lists available at GrowingScience
Management Science Letters
homepage: www.GrowingScience.com/msl
Initiatives of six-sigma in an automotive ancillary unit: A case study
Pardeep Ranaa* and Prabhakar Kaushikb
aResearch Scholar, UIET, Maharshi Dayanand University, Rohtak, Haryana, India bAssociate Professor, UIET, Maharshi Dayanand University, Rohtak, Haryana, India C H R O N I C L E A B S T R A C T
Article history: Received: November 26, 2017 Received in revised format: Janu-ary 31, 2018 Accepted: April 26, 2018 Available online: April 27, 2018
It is a commonly visible scenario in todays’ market, especially in small and medium sized enter-prises (SMEs), where the focus is on quantity rather than quality. This paper explains the common high rejection problem of a SME and how the productivity levels were enhanced after the success-ful implementation of Six-Sigma DMAIC methodology. Once the project completion industry was able to acquire many tangible and intangible benefits, this paper offers a systematic step by step illustration of DMAIC methodology to help the other firms start similar productivity improvement initiatives.
© 2018 by the authors; licensee Growing Science, Canada
Keywords: Six-Sigma Productivity Improvement Quality Engineering DMAIC Methodology
1. Introduction Six-Sigma was introduced by Motorola, and in very short time, due to its enormous benefits, it was introduced in many large scale manufacturing organizations across the globe (Kaushik et al., 2012; Kaushik & Mittal, 2015; Kaushik, 2016a,b; Srinivasan et al., 2016; Uluskan, 2016). But the problem still exists on how to apply it in SMEs. The evidences of Six-Sigma application in small and medium scaled industries are very little. In large industries, Six-Sigma is an emerging and one of the most effective business strategies all over the world. As for big manufacturing industries Six-Sigma achieved positive results over different productivity problems, so it can also provide useful results for small scale industries as well (Sreedharan & Raju, 2016). For SME sector to become successful in the present competitive scenario, the strategy needs to be innovative (Biswas & Chowdhury 2016). SME sector needs immediate attention due to its participation in global progress in form of breakthrough strategy other than Statistical Process Control (SPC) (Kaushik et al., 2017a). In order to achieve customer satisfaction, researchers and industrialists around the world have worked over various tools (Kaushik et al., 2017b,c) and techniques like Total Quality Management (TQM), Quality circles (Mittal & Prajapati 2014), APQP (Mittal, Kaushik, & Khanduja 2012; Mittal et al., 2011, 2012), Shainin system (Mittal et al., 2017b), Quality Function Deployment (QFD) (Mittal & Kaushik 2011; Tewari et al., 2017), Decision Tree Analysis
570
(Mittal et al., 2017; Mittal et al., 2017a), Fuzzy logic (Mittal et al. 2016a), Total Preventive Maintenance (TPM), Business Process Reengineering (Mittal et al., 2016b), Lean and Six Sigma (Kaushik et al., 2012; Kaushik et al., 2016a). The most popular of the techniques named above is Six-Sigma. It aims to find out the basic causes in process and eliminates them to achieve business excellence (Kaushik et al., 2016b). Various aspects of DMAIC strategy have been analyzed by researchers in great details in their own terms and literature suggests that so far, Six Sigma has been mostly thought of quality management tool for large manufacturing industries alone. With this in mind, an attempt has been made to visualize the appli-cation of Six-Sigma in a SME explained in form of a case study.
The organization under consideration is a SME manufacturing automobiles components such as valves, locks, carburetor repair parts, float needle, main jet, slow jet, throttle needle, chock piston, jet holder, gasket kit, slide screw, air screw, etc. The company was established in the year 1987 with a vision to deliver quality automobile components to fulfill the requirements of the Overall Equipment manufactur-ers (OEMs). It owns a sophisticated manufacturing unit and is equipped with the latest technology and tools to fabricate quality products which render long term service. The name of the company is withheld at its behest, to maintain confidentiality of the company records.
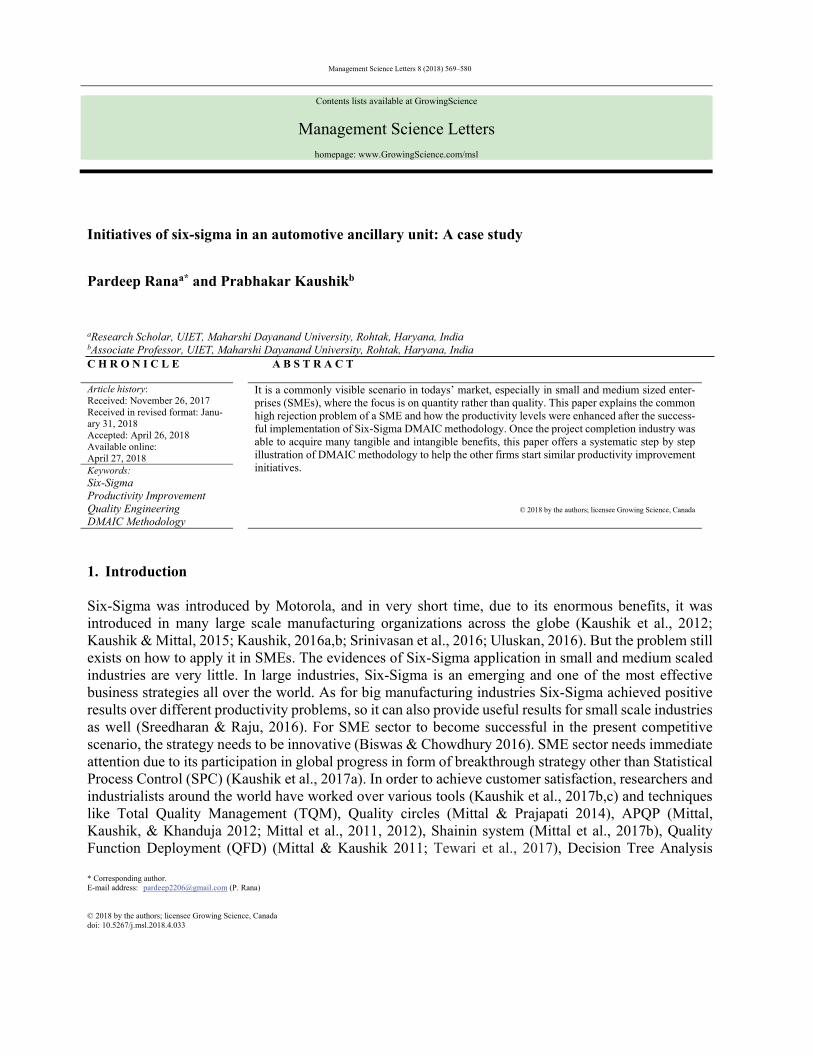
The main product of company is locks and one variety of lock is hood latch lock as shown in Fig 1. The company was facing high rejection rates due to tight movement of lock’s hood which ultimately results in “Hook not return” complaint in long stay. Hence, it became essential to validate the design of the product without changing the riveting specification due to high rejection rate and willingness of staff and management to improve quality.
Fig. 1. Hood Latch Lock
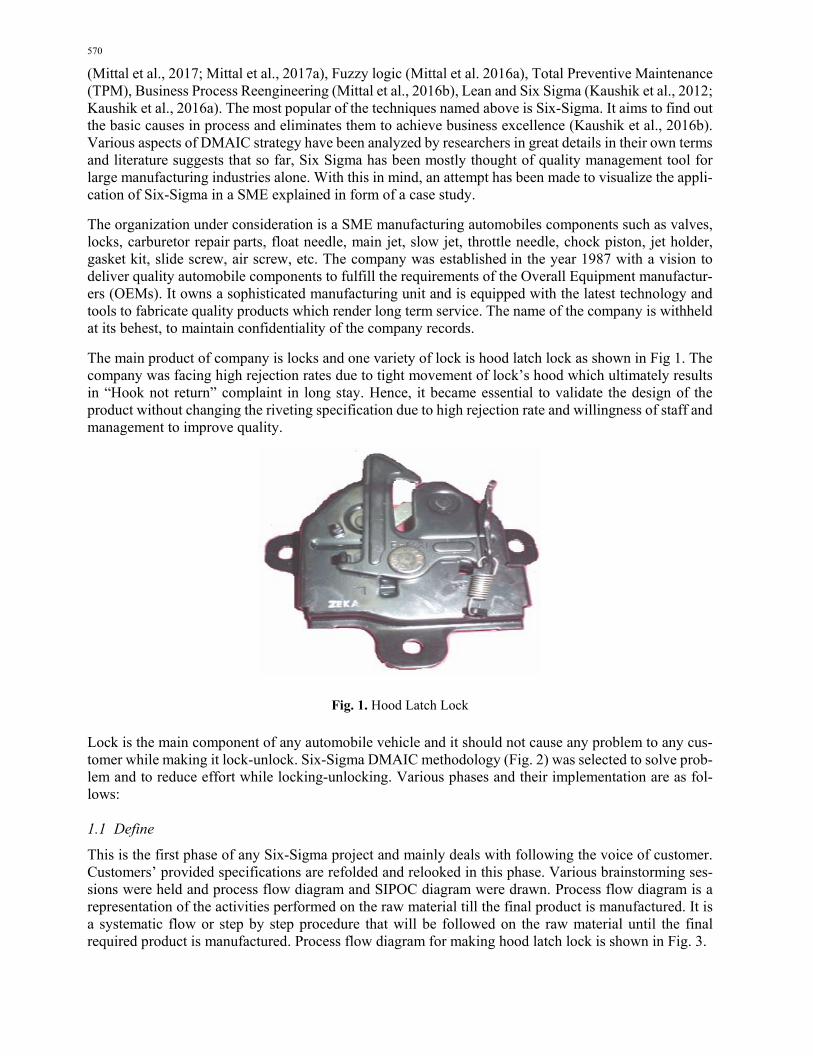
Lock is the main component of any automobile vehicle and it should not cause any problem to any cus-tomer while making it lock-unlock. Six-Sigma DMAIC methodology (Fig. 2) was selected to solve prob-lem and to reduce effort while locking-unlocking. Various phases and their implementation are as fol-lows: 1.1 Define
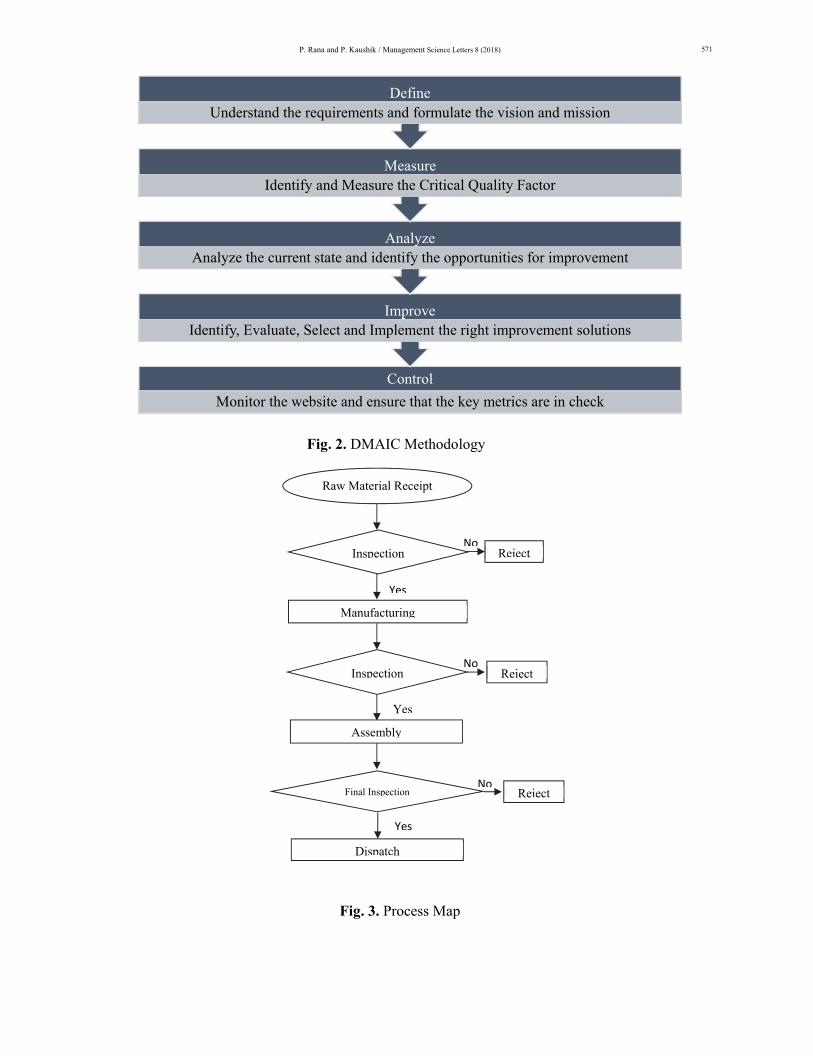
This is the first phase of any Six-Sigma project and mainly deals with following the voice of customer. Customers’ provided specifications are refolded and relooked in this phase. Various brainstorming ses-sions were held and process flow diagram and SIPOC diagram were drawn. Process flow diagram is a representation of the activities performed on the raw material till the final product is manufactured. It is a systematic flow or step by step procedure that will be followed on the raw material until the final required product is manufactured. Process flow diagram for making hood latch lock is shown in Fig. 3.
P. Rana and P. Kaushik / Management Science Letters 8 (2018)
571
Fig. 2. DMAIC Methodology
Fig. 3. Process Map
Control
Monitor the website and ensure that the key metrics are in check
ImproveIdentify, Evaluate, Select and Implement the right improvement solutions
AnalyzeAnalyze the current state and identify the opportunities for improvement
MeasureIdentify and Measure the Critical Quality Factor
DefineUnderstand the requirements and formulate the vision and mission
No
No
No
Yes
Yes
Yes
Raw Material Receipt
Inspection
Manufacturing
Inspection
Assembly
Final Inspection
Dispatch
Reject
Reject
Reject
572
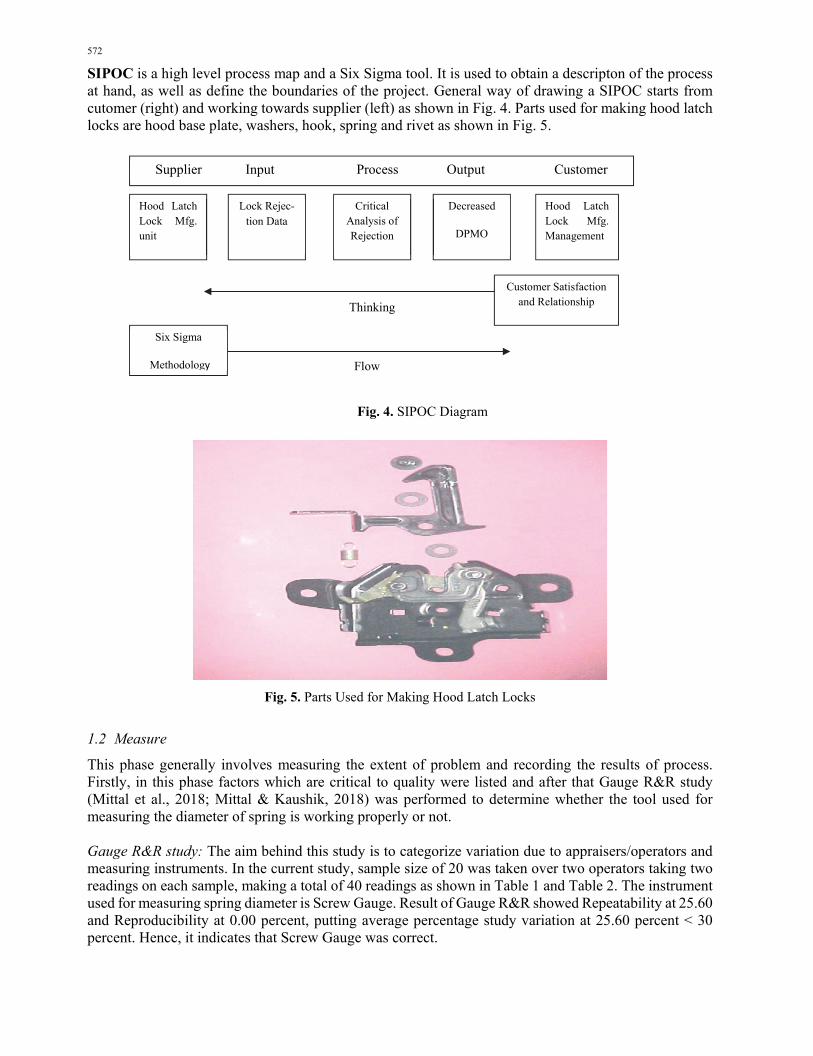
SIPOC is a high level process map and a Six Sigma tool. It is used to obtain a descripton of the process at hand, as well as define the boundaries of the project. General way of drawing a SIPOC starts from cutomer (right) and working towards supplier (left) as shown in Fig. 4. Parts used for making hood latch locks are hood base plate, washers, hook, spring and rivet as shown in Fig. 5.
Fig. 4. SIPOC Diagram
Fig. 5. Parts Used for Making Hood Latch Locks
1.2 Measure
This phase generally involves measuring the extent of problem and recording the results of process. Firstly, in this phase factors which are critical to quality were listed and after that Gauge R&R study (Mittal et al., 2018; Mittal & Kaushik, 2018) was performed to determine whether the tool used for measuring the diameter of spring is working properly or not. Gauge R&R study: The aim behind this study is to categorize variation due to appraisers/operators and measuring instruments. In the current study, sample size of 20 was taken over two operators taking two readings on each sample, making a total of 40 readings as shown in Table 1 and Table 2. The instrument used for measuring spring diameter is Screw Gauge. Result of Gauge R&R showed Repeatability at 25.60 and Reproducibility at 0.00 percent, putting average percentage study variation at 25.60 percent < 30 percent. Hence, it indicates that Screw Gauge was correct.
Flow
Supplier Input Process Output Customer
Hood Latch Lock Mfg. unit
Lock Rejec-tion Data
Critical Analysis of Rejection
Decreased
DPMO
Hood Latch Lock Mfg. Management
Customer Satisfaction and Relationship
Six Sigma
Methodology
Thinking

P. Rana and P. Kaushik / Management Science Letters 8 (2018)
573
1.3 Analysis
In this phase, the real root-cause analysis is performed using various statistical tools. After knowing the extent of the problem in measure phase, various brainstorming sessions are held and a list of suspected source and causes of rejection is prepared. In this case, one by one, components were analyzed to see the main cause of problem in the lock movement. Table 1 Minitab Data Sheet of Spring Diameter for Gauge R&R Study
Sequence No.
Operation Sequence no.
Operator
Trial Part No. Readings (Diameter, mm)
1 1 1 1 3 0.94 2 2 1 1 6 0.97 3 3 1 1 9 0.96 4 4 1 1 1 0.99 5 5 1 1 4 0.93 6 6 1 1 7 1.00 7 7 1 1 8 0.94 8 8 1 1 10 0.96 9 9 1 1 2 1.01 10 10 1 1 5 0.95 11 1 1 2 6 0.96 12 2 1 2 1 0.93 13 3 1 2 3 0.97 14 4 1 2 9 0.94 15 5 1 2 2 1.01 16 6 1 2 8 0.99 17 7 1 2 10 0.94 18 8 1 2 4 0.97 19 9 1 2 7 0.95 20 10 1 2 5 1.00 21 1 2 1 8 1.02 22 2 2 1 6 0.94 23 3 2 1 2 0.97 24 4 2 1 1 0.99 25 5 2 1 5 0.98 26 6 2 1 3 0.93 27 7 2 1 10 0.94 28 8 2 1 7 0.96 29 9 2 1 4 1.01 30 10 2 1 9 0.97 31 1 2 2 4 0.98 32 2 2 2 9 0.94 33 3 2 2 7 1.01 34 4 2 2 1 0.99 35 5 2 2 10 1.02 36 6 2 2 5 0.96 37 7 2 2 3 0.95 38 8 2 2 8 0.94 39 9 2 2 2 0.97 40 10 2 2 6 0.98
Suspected source of variations are categorized in two parts for further analysis. These are: -
Process Variation
Assembly Riveting Process
Input Product Variation
a) Hook Thickness

574
b) Washer Thickness
c) Hood Base Thickness
d) Rivet Height
e) Spring Diameter
Table 2 Result of Gauge R&R (Spring Diameter)
Source Std. Dev Study Var. % Study Var.
(6* SD) (%SD) Total gauge 0.0271712 0.163027 25.60
Repeatability 0.0271712 0.163027 25.60 Reproducibility 0.0000000 0.0000000 0.00
Part to Part 0.0024468 0.014681 98.97 Total Variation 0.0272812 0.16368 100.00
First suspected source of variation was Rivet height. Modified component search tool was selected for its analysis. This tool is used when the problem is on an assembled product and parts will get damaged during disassembling and rivet pin will get damaged during disassembly during analysis. Also, the com-ponent was replaced with new pin for the First trial and Second trial run. A Best of Best (BOB) and Worst of Worst (WOW) sample was collected based on Attribute Index. Both BOB & WOW assemblies were disassembled two times and response is shown in Table 3.
Table 3 Response of Modified Component Search
Good (BOB) Bad (WOW) Initial Value 1 5
First Disassembly and Reassembly 1 4 Second Disassembly and Reassembly 2 4
Based on the results obtained from Table 3, D/d ratio was calculated which tells whether rivet pin is causing problem or not. Here, ‘D’ refers to difference of Medians of BOB and WOW, whereas ‘d’ indi-cates the average sum of range of BOB and WOW. If D/d is equal to or more than 3 then it is concluded that the component is not causing problem. Table 4 shows the results of the modified component search. Since, in this search D/d ratio comes out to be equal to 3. Hence it can be stated that Assembly Process or Replaced component is not causing any problem, the other parts are causing problem. Secondly, the spring diameter was checked, whether it is causing problem or not. The dimension of spring diameter is 0.98mm +/- .5mm. A histogram (Fig. 6) for the 40 spring diameter readings was drawn. Histogram dis-plays the large data that is difficult to interpret and also indicates process capability. Table 4 Calculation of D/d Ratio
BOB(+) WOW(-) Initial sample 1 5
First trial 1 4 Second trial 2 4
Median 1 4 Range 1 1
D/d ratio 3/1=3 The Histogram clearly shows that the data for spring diameter is centric. Hence, it is not the reason for the tightness of the hook of Hood Latch Lock. After the conclusion on spring diameter, three components (Hook, Washer and Hook base plate) were left that might be causing problem. One by one component

P. Rana and P. Kaushik / Management Science Letters 8 (2018)
575
was disassembled from Good and assembled in the bad and the response is taken as shown in Table 5, Table 6 and Table 7.
List of suspected components are 1) Hook – A (A-R+, A+R-) 2) Washer – B (B-R+, B+R-) 3) Hook Base Plate – C (C-R+, C+R-)
1 .021 .000 .980 .960 .940 .92
7
6
5
4
3
2
1
0
r e a d in g s
Freq
uenc
y
M ean 0.973S tD ev 0.02544N 40
H is to gr a m o f r e a d ingsNo rm a l
Fig. 6. Histogram for Spring Diameter
A conclusion table for the above analysis was drawn as Table 8.
Table 5 Response for Hook (A-R+, A+R-)
Good Assembly (+) Response Bad Assembly (-) ResponseA-R+ 1 A+R- 4
Table 6 Response for Washer (B-R+, B+R-)
Good Assembly (+) Response Bad Assembly (-) Response
B-R+ 5 B+R- 1
Table 7: Response for Hook Base Plate (C-R+, C+R-)
Good Assembly (+) Response Bad Assembly (-) Response
C-R+ 1 C+R- 5
Table 8 Conclusion of Hook, Washer and Base Plate Response
A-R+, A+R- Replacing of Hook from Good to Bad & Bad to
Good No Reversal in Response
B-R+, B+R- Replacing of Hook from Good to Bad & Bad to
Good (Both Washers were replaced) Complete Reversal of Response
C-R+,C+R- Replacing of Hook from Good to Bad & Bad to
Good No Reversal in Response
576
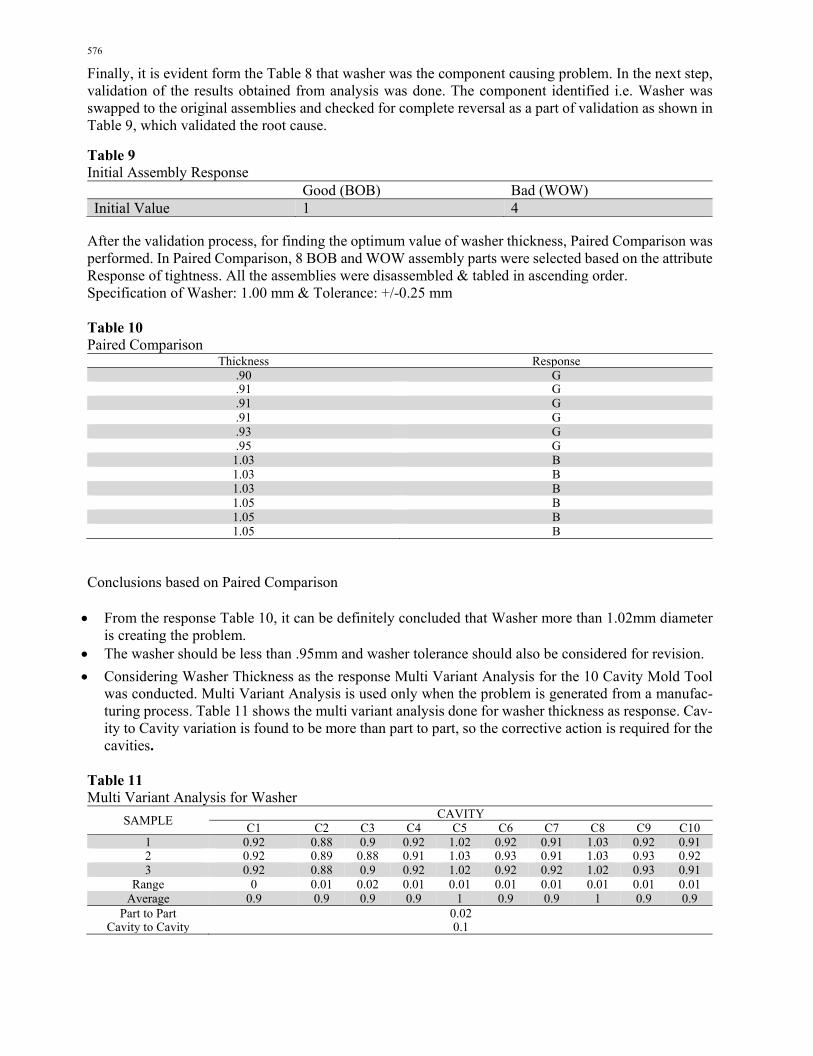
Finally, it is evident form the Table 8 that washer was the component causing problem. In the next step, validation of the results obtained from analysis was done. The component identified i.e. Washer was swapped to the original assemblies and checked for complete reversal as a part of validation as shown in Table 9, which validated the root cause.
Table 9 Initial Assembly Response
Good (BOB) Bad (WOW) Initial Value 1 4
After the validation process, for finding the optimum value of washer thickness, Paired Comparison was performed. In Paired Comparison, 8 BOB and WOW assembly parts were selected based on the attribute Response of tightness. All the assemblies were disassembled & tabled in ascending order. Specification of Washer: 1.00 mm & Tolerance: +/-0.25 mm Table 10 Paired Comparison
Thickness Response .90 G.91 G.91 G.91 G.93 G.95 G
1.03 B1.03 B1.03 B1.05 B1.05 B1.05 B
Conclusions based on Paired Comparison From the response Table 10, it can be definitely concluded that Washer more than 1.02mm diameter
is creating the problem. The washer should be less than .95mm and washer tolerance should also be considered for revision.
Considering Washer Thickness as the response Multi Variant Analysis for the 10 Cavity Mold Tool was conducted. Multi Variant Analysis is used only when the problem is generated from a manufac-turing process. Table 11 shows the multi variant analysis done for washer thickness as response. Cav-ity to Cavity variation is found to be more than part to part, so the corrective action is required for the cavities.
Table 11 Multi Variant Analysis for Washer
SAMPLE CAVITYC1 C2 C3 C4 C5 C6 C7 C8 C9 C10
1 0.92 0.88 0.9 0.92 1.02 0.92 0.91 1.03 0.92 0.912 0.92 0.89 0.88 0.91 1.03 0.93 0.91 1.03 0.93 0.923 0.92 0.88 0.9 0.92 1.02 0.92 0.92 1.02 0.93 0.91
Range 0 0.01 0.02 0.01 0.01 0.01 0.01 0.01 0.01 0.01Average 0.9 0.9 0.9 0.9 1 0.9 0.9 1 0.9 0.9
Part to Part 0.02Cavity to Cavity 0.1

P. Rana and P. Kaushik / Management Science Letters 8 (2018)
577
1.4 Improvement phase This is the fourth phase of Six Sigma DMAIC methodology and in this phase, improvement is made in the cause of problem by implementing the corrective measures recommended by the team in analysis phase. As in current case study, washer thickness is found to be the source of problem so the improvement action for the same is taken into account. The washer is manufactured by molding process, so as a first corrective step, mold tool was improved at the manufacturing end by revising tolerance. Improvement required in size for various parts is shown in Table 12. Table 12 Corrective Actions for Revising Tolerance in Mold Design
COMPONENT RESPONSE Hook Thickness 2.6 mm, Tolerance Not Specified In The Drawing ( UT Working Tolerance=+/-0.05 (2.55 ~2.65mm)
No Change in Specification
Rivet Pin :4.7,+0.15/+0.05, 4.75~4.85mm (Drawing Tolerance) No Change in Specification Washer : 1.0mm Tolerance As Per (Engineering Specification) =+/- 0.25(0.75 ~1.25mm)
Tolerance Revised ( 0.90 -0.0/ +0.05)
Fig. 7 and Fig. 8 show the picture of molded component and 10 Cavity mold for washer. Various tests including flexure strength testing (Kaushik et al., 2017; Kaushik et al., 2017) were also performed for changes made in the thickness of washer.
Fig. 7. Molded Component Fig. 8. 10 Cavity Mold Tool 1.5 Control Phase
This is the final phase of Six Sigma DMAIC Methodology. In this phase results of the improvement phase are checked. The true aim of this phase is to cross check the implementation and raise a feedback system if deviation is visualized. In present case study, as the mold tool is the only component which required improvement. After the implementation of recommended actions, defects in hood latch locks were reduced to a great extent. Results shows the decrease in PPM in four months after the improvement done in the mold tool used for making washer. Initially, PPM was about 1550 which has been reduced to nearly 100 PPM in a short period of four months. Additionally, a control plan for the mold tool has been prepared to keep a check on the variation in washer thickness.
578
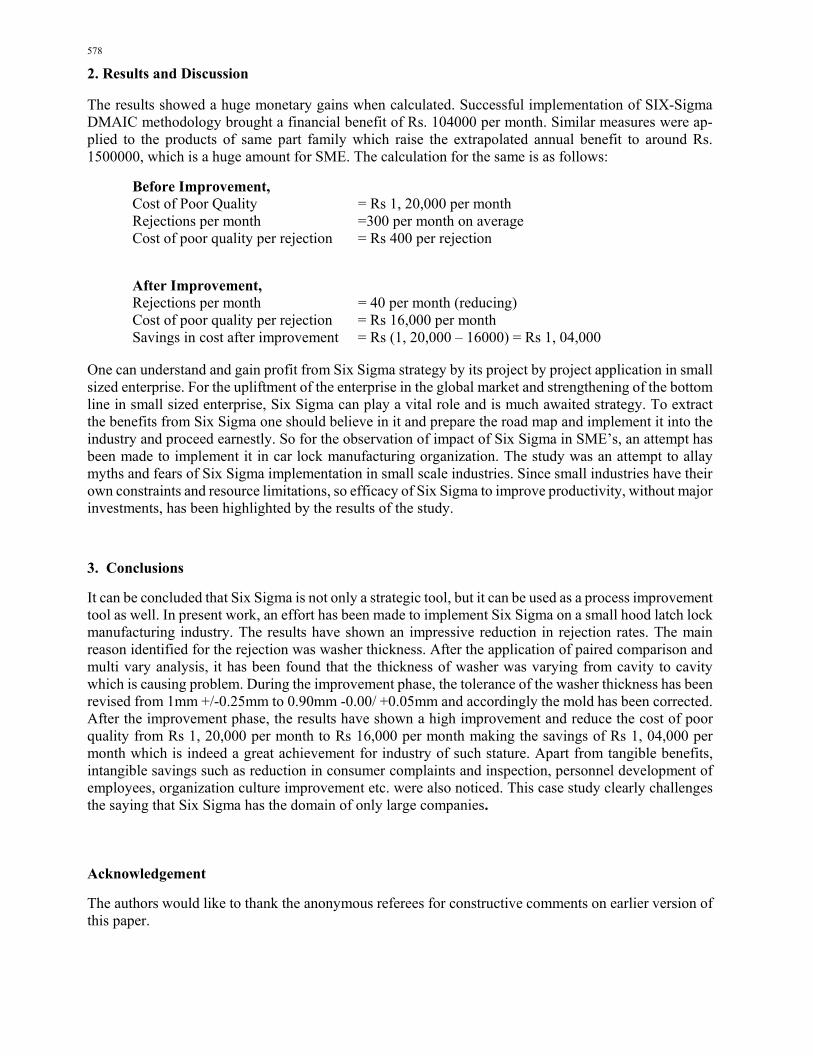
2. Results and Discussion
The results showed a huge monetary gains when calculated. Successful implementation of SIX-Sigma DMAIC methodology brought a financial benefit of Rs. 104000 per month. Similar measures were ap-plied to the products of same part family which raise the extrapolated annual benefit to around Rs. 1500000, which is a huge amount for SME. The calculation for the same is as follows:
Before Improvement, Cost of Poor Quality = Rs 1, 20,000 per month Rejections per month =300 per month on average Cost of poor quality per rejection = Rs 400 per rejection
After Improvement, Rejections per month = 40 per month (reducing) Cost of poor quality per rejection = Rs 16,000 per month Savings in cost after improvement = Rs (1, 20,000 – 16000) = Rs 1, 04,000
One can understand and gain profit from Six Sigma strategy by its project by project application in small sized enterprise. For the upliftment of the enterprise in the global market and strengthening of the bottom line in small sized enterprise, Six Sigma can play a vital role and is much awaited strategy. To extract the benefits from Six Sigma one should believe in it and prepare the road map and implement it into the industry and proceed earnestly. So for the observation of impact of Six Sigma in SME’s, an attempt has been made to implement it in car lock manufacturing organization. The study was an attempt to allay myths and fears of Six Sigma implementation in small scale industries. Since small industries have their own constraints and resource limitations, so efficacy of Six Sigma to improve productivity, without major investments, has been highlighted by the results of the study.
3. Conclusions
It can be concluded that Six Sigma is not only a strategic tool, but it can be used as a process improvement tool as well. In present work, an effort has been made to implement Six Sigma on a small hood latch lock manufacturing industry. The results have shown an impressive reduction in rejection rates. The main reason identified for the rejection was washer thickness. After the application of paired comparison and multi vary analysis, it has been found that the thickness of washer was varying from cavity to cavity which is causing problem. During the improvement phase, the tolerance of the washer thickness has been revised from 1mm +/-0.25mm to 0.90mm -0.00/ +0.05mm and accordingly the mold has been corrected. After the improvement phase, the results have shown a high improvement and reduce the cost of poor quality from Rs 1, 20,000 per month to Rs 16,000 per month making the savings of Rs 1, 04,000 per month which is indeed a great achievement for industry of such stature. Apart from tangible benefits, intangible savings such as reduction in consumer complaints and inspection, personnel development of employees, organization culture improvement etc. were also noticed. This case study clearly challenges the saying that Six Sigma has the domain of only large companies.
Acknowledgement
The authors would like to thank the anonymous referees for constructive comments on earlier version of this paper.
P. Rana and P. Kaushik / Management Science Letters 8 (2018)
579
References
Biswas, S., & Chowdhury, B. (2016). Industrial Applications and Practices of Six Sigma–A Literature Review. Sigma, 3(3), 176-79.
Kaushik, P., Khanduja, D., Mittal, K., & Jaglan, P. (2012). A case study: Application of Six Sigma meth-odology in a small and medium-sized manufacturing enterprise. The TQM Journal, 24(1), 4-16.
Kaushik, P., & Mittal, K. (2015). Significance of six sigma basics in a manufacturing unit: A case study. Progress in Management Sciences, 3(1).
Kaushik, P., Mittal, K., & Rana, P. (2016a). Energy paybacks of six-sigma: A case study of manufactur-ing industry in India. Management Science Letters, 6(11), 691-700.
Kaushik, P., Prikshit, & Mittal, K., (2016b). Gratitude of six-sigma: A case study of manufacturing environment Prabhakar. Journal of Mechanical Engineering, 126, 223–31.
Kaushik, P., Dahiya, V., & Mittal, K. (2017a). Statistics for industries: A sophisticated approach. Man-agement Science Letters, 7(8), 397-406.
Kaushik, P., Jaivir, J., & Mittal, K. (2017b). Analysis of mechanical properties of jute fiber strengthened epoxy/polyester composites. Engineering Solid Mechanics, 5(2), 103-112.
Kaushik, P., Kumar, S., Siwach, R., & Mittal, K., (2017c). Mechanical behavior of short & long bamboo fiber based polyester : A case study. International Journal of Research in Engineering & Management 1(2), 23–31.
Mittal, K., & Kaushik, P. (2011). Quality function deployment: A way to total quality. Yamuna Journal of Business Management & Technology, 1(1), 11–18.
Mittal, K., Khanduja, D & Kaushik, P. (2011). Leveraging APQP methodology to drive improvement in SME : A case study. International Journal of Contemporary Practices, 1(1), 38–51.
Mittal, K., Khanduja, D. & Kaushik, P. (2012). Evidence of APQP in quality improvement : An SME case study. International Journal of Management Science and Engineering Management, 7(1), 20–28.
Mittal, K., & Prajapati, R. K. (2014). Quality councils: an overview. International Journal of Manage-ment, IT and Engineering, 4(12), 200.
Mittal, K., Tewari, P. C., & Khanduja, D. (2016a). Refurbishing business processes: An insight. Journal of Industrial Engineering and Advances, 1(1).
Mittal, K., Chandra Tewari, P., Khanduja, D., & Kaushik, P. (2016b). Application of Fuzzy TOPSIS MADM approach in ranking & underlining the problems of plywood industry in India. Cogent Engi-neering, 3(1), 1155839.
Mittal, K., Tewari, P. C., & Khanduja, D. (2017a). An insight into ‘Decision Tree Analysis’”. World Wide Journal of Multidisciplinary Research and Development, 3(12), 111–115.
Mittal, K., Tewari, P. C., & Khanduja, D. (2017b). Productivity improvement under manufacturing en-vironment using Shainin system and fuzzy analytical hierarchy process: a case study. The Interna-tional Journal of Advanced Manufacturing Technology, 92(1-4), 407-421.
Mittal, K., Tewari, P., & Khanduja, D. (2018). On the fuzzy evaluation of measurement system analysis in a manufacturing and process industry environment: A comparative study. Management Science Letters, 8(4), 201-216.
Mittal, K., & Kaushik, P. (2018). A general model for problem solving in manufacturing or service or-ganizations.
Sreedharan, V. R., & Raju, R. (2016). A systematic literature review of Lean Six Sigma in different industries. International Journal of Lean Six Sigma, 7(4), 430-466.
Srinivasan, K., Muthu, S., Devadasan, S. R., & Sugumaran, C. (2016). Six Sigma through DMAIC phases: a literature review. International Journal of Productivity and Quality Management, 17(2), 236-257.
Tewari, P. C., Mittal, K., & Khanduja, D. (2017). On the right approach to selecting a quality improve-ment project in manufacturing industries. Operations Research and Decisions, 27(1), 105-124.

580
Uluskan, M. (2016). A comprehensive insight into the Six Sigma DMAIC toolbox. International Journal of Lean Six Sigma, 7(4), 406-429.
© 2018 by the authors; licensee Growing Science, Canada. This is an open access article distributed under the terms and conditions of the Creative Commons Attribution (CC-BY) license (http://creativecommons.org/licenses/by/4.0/).