content-area graphic...
TRANSCRIPT

Content-AreaGraphic Organizers
WALCH PUBLISHING
SOCIAL STUDIES
Margaret Cleveland

The classroom teacher may reproduce materials in this book for classroom use only.
The reproduction of any part for an entire school or school system is strictly prohibited.
No part of this publication may be transmitted, stored, or recorded in any form
without written permission from the publisher.
1 2 3 4 5 6 7 8 9 10ISBN 0-8251-5007-8
Copyright © 2005
J. Weston Walch, Publisher
P. O. Box 658 • Portland, Maine 04104-0658
walch.com
Printed in the United States of America
WALCH PUBLISHING

Table of Contents
To the Teacher . . . . . . . . . . . . . . . . . . . . . . . . . . . . . . . . . . . . . . . . . . . . . . . . . . . . . . v
Part 1: Graphic Organizer Overview . . . . . . . . . . . . . . . . . . . . . . . . . . . . . . . . . . . 1
Lesson 1: Introduction to Graphic Organizers . . . . . . . . . . . . . . . . . . . . . . . . . . . 3
Part 2: Graphic Organizers in Social Studies . . . . . . . . . . . . . . . . . . . . . . . . . . . . 5
Lesson 2: Organizing and Classifying . . . . . . . . . . . . . . . . . . . . . . . . . . . . . . . . . . 7• Concept/Event Maps • Main Idea and Details Charts • Hierarchy Diagrams • Spider Maps
Lesson 3: Sequencing . . . . . . . . . . . . . . . . . . . . . . . . . . . . . . . . . . . . . . . . . . . . . . . 23• Time Lines • Sequence Chains • Escalator Graphs
Lesson 4: Comparing and Contrasting . . . . . . . . . . . . . . . . . . . . . . . . . . . . . . . . . 34• Then and Now Charts • Venn Diagrams • Comparison Matrixes
Lesson 5: Showing Cause and-Effect . . . . . . . . . . . . . . . . . . . . . . . . . . . . . . . . . . 44• Cause and Effect Maps •Problem/Solution Charts • Event Maps
Lesson 6: Writing . . . . . . . . . . . . . . . . . . . . . . . . . . . . . . . . . . . . . . . . . . . . . . . . . . . 54• KWL Charts • Note-Taking Organizers • Formal Outlines• Informal Outlines • Expository Writing Organizers
Part 3: Reproducible Graphic Organizers . . . . . . . . . . . . . . . . . . . . . . . . . . . . . . 73
Answer Key . . . . . . . . . . . . . . . . . . . . . . . . . . . . . . . . . . . . . . . . . . . . . . . . . . . . . . . 93

Graphic organizers can be a versatile tool in yourclassroom. Organizers offer an easy, straightforwardway to visually present a wide range of material.Research suggests that graphic organizers supportlearning in the classroom for all levels of learners.Gifted students, students on grade level, andstudents with learning difficulties all benefit fromtheir use. Graphic organizers reduce the cognitivedemand on students by helping them accessinformation quickly and clearly. Using graphicorganizers, learners can understand content moreclearly and can take clear, concise notes. Ultimately,learners find it easier to retain and apply whatthey’ve learned.
Graphic organizers help foster higher-level thinkingskills. They help students identify main ideas anddetails in their reading. They make it easier forstudents to see patterns, such as cause and effect,comparing and contrasting, and chronological order.Organizers also help learners master critical-thinkingskills by asking them to recall, evaluate, synthesize,analyze, and apply what they’ve learned. Researchsuggests that graphic organizers contribute to bettertest scores because they help students understandrelationships between key ideas and enable them tobe more focused as they study.
This book shows students how they can use somecommon graphic organizers as they read and writein social studies classes. As they become familiarwith graphic organizers, they will be able to adaptthem to suit their needs.
In the social studies classroom, graphic organizershelp students to
• preview new material• make connections between new material and
prior learning• recognize patterns and main ideas in reading• understand the relationships between key ideas• organize information and take notes• review material
This book offers graphic organizers suitable forsocial studies tasks, grouped according to big-pictureskills, such as organizing and classifyinginformation; sequencing; comparing and contrasting;showing cause and effect; and writing. Eachorganizer is introduced with an explanation of itsprimary uses and structure. Next comes a step-by-step description of how to create the organizer, witha completed example that uses text relevant to thecontent area. Finally, an application section asksstudents to use the techniques they have just learnedto complete a blank organizer with information froma sample text. Throughout, learners are encouragedto customize the organizers to suit their needs. Toemphasize the variety of graphic organizersavailable, an additional organizer suitable for eachbig-picture skill is introduced briefly at the end ofeach lesson.
Content-Area Graphic Organizers: Social Studies is easyto use. Simply photocopy and distribute the sectionon each graphic organizer. Blank copies of thegraphic organizers are included at the back of thisbook so that you can copy them as often as needed.The blank organizers are also available for downloadat our web site, walch.com.
As learners become familiar with using graphicorganizers, they will develop their own approachesand create their own organizers. Encourage them toadapt them, change them, and create their own formore complex strategies and connections.
Remember, there is no one right way to use graphicorganizers; the best way is the way that works foreach student.
To the Teacher
v


Part 1: Graphic OrganizerOverview


© 2005 Walch Publishing Content-Area Graphic Organizers: Social Studies3
You’ve probably heard the old saying, “A picture is worth a thousand words.”Like most old sayings, it isn’t always true. But in many things we do, wordsalone are not the best way to communicate. That’s why we use pictures and, inparticular, graphic organizers.
A graphic organizer is simply a special drawing that contains words ornumbers. If you’ve ever made a web or filled in a chart, then you already knowhow to use a graphic organizer. In this book, you’ll find that you can usegraphic organizers in ways you may not have expected. And you’ll find thatthey can make your learning a lot easier!
The power of a graphic organizer is that instead of just telling you aboutrelationships among things, it can show them to you. A graphic organizer canhelp you understand information much more easily than the same informationwritten out as a paragraph of text. For example, look at this listing of names,addresses, and telephone numbers. Use it to find the telephone number forAmanda Jones.
Alden E. Jones, 18 Milford St., Boston, MA 02118, (617) 555-8040. Alun HuwJones, 91 Westland Ave., Boston, MA 02115, (617) 555-9654. Alvin Jones, 715Tremont St., Boston, MA 02118, (617) 555-2856. Alvin D. Jones, 77 Salem St.,Boston, MA 02113, (617) 555-2890. Amanda Jones, 111 W. 8th St., Boston, MA02127, (617) 555-0738. Amos K. Jones, 11 Helen St., Boston, MA 02124, (617) 555-3560. Andre N. Jones, 523 Mass. Ave., Boston, MA 02118, (617) 555-0829. AndrewJones, 168 Northampton St., Boston, MA 02118, (617) 555-0069.
In order to find Amanda’s number, you had to read, or at least scan, the wholetext. Here is the same information presented in a graphic organizer—a table.
Introduction to Graphic Organizers
Name Address City, State, Zip Phone
Alden E. Jones 18 Milford St. Boston, MA 02118 (617) 555-8040
Alun Huw Jones 91 Westland Ave. Boston, MA 02115 (617) 555-9654
Alvin Jones 715 Tremont St. Boston, MA 02118 (617) 555-2856
Alvin D. Jones 77 Salem St. Boston, MA 02113 (617) 555-2890
Amanda Jones 111 W. 8th St. Boston, MA 02127 (617) 555-0738
Amos K. Jones 11 Helen St. Boston, MA 02124 (617) 555-3560
Andre N. Jones 523 Mass Ave. Boston, MA 02118 (617) 555-0829
Andrew Jones 168 Northampton St. Boston, MA 02118 (617) 555-0069

Which arrangement was easier to use? Most people find it easier to see theinformation in the table. This is because the table gives all the names in onecolumn, all the telephone numbers in another column, and all the informationabout each person in one row. As soon as you know how the table is set up—thelabels at the top of each column tell you—you can quickly find what you’relooking for.
Graphic organizers use lines, circles, grids, charts, tree diagrams, symbols, andother visual elements to show relationships—classifications, comparisons,contrasts, time sequence, parts of a whole, and so on—much more directly thantext alone.
You can use graphic organizers in many ways. You can use them before youbegin a lesson to lay the foundation for new ideas. They can help you recallwhat you already know about a subject and see how new material is connectedto what you already know.
You can use them when you are reading to take notes or to keep track of whatyou read. It doesn’t matter what you are reading—a textbook, a biography, or aninformational article. Organizers can help you understand and analyze whatyou read. You can use them to recognize patterns in the reading. They can helpyou identify the main idea and its supporting details. They can help youcompare and contrast all kinds of things, from people to ideas, animals, places,eras, and events.
Graphic organizers can help you after you read. You can use them to organizeyour notes and figure out the most important points in what you read. They area great tool as you review to make sure you understood everything or as youprepare for a test.
You can use graphic organizers when you write, too. They are particularlyuseful for prewriting and planning. Organizers can help you brainstorm newideas. They can help you sort out the key points you want to make. Graphicorganizers can help you write clearly and precisely.
Think of graphic organizers as a new language. Using this new language may bea bit awkward at first, but once you gain some fluency, you’ll enjoycommunicating in a new way.
Content-Area Graphic Organizers: Social Studies © 2005 Walch Publishing4

Part 2: Graphic Organizersin Social Studies


© 2005 Walch Publishing Content-Area Graphic Organizers: Social Studies7
Imagine that you are going to the library to select a book. When you arrive, youfind that books on the shelves are all mixed up. There are novels alongsideencyclopedias. Books on the geography and history of the states are next tobooks about mountain lions. There is no order to the books at all. How will youfind what you need?
Now think about how you categorize your assignments. What if your list ofhomework for one week looked like this:
How would you remember what books to read? How would you know whichclass worksheet to do? When you create a list, do you organize your homeworkassignments into categories with assigned headings? Look at the revised list ofassignments below. Does it make more sense?
The most important part of making a list is not that you are writing thingsdown, but that you are organizing and classifying the information in your list.We organize and classify every day. In the library, we find books shelved bycategory. In our own notebooks, we find our assignments arranged by subject. Ifnot, we would spend a lot of time looking for things or trying to figure out whatthings mean. Organizing and classifying is a skill you use when you read socialstudies material. When you read, you can look for patterns or ways to organizeor classify, just as you would when you write down your assignments. In thislesson, we will look at three different ways to classify or organize information.
Organizing and Classifying
_______________________________________________________________
_______________________________________________________________
_______________________________________________________________
_______________________________________________________________
_______________________________________________________________
read pages 51–78
write essay as assigned in class
learn vocabulary words on page 44
do problems from class worksheet
memorize definitions from class notebook
_______________________________________________________________
_______________________________________________________________
_______________________________________________________________
_______________________________________________________________
_______________________________________________________________
Social Studies: read pages 51–78
English: write essay as assigned in class
Spanish: learn vocabulary words on page 44
Math: do problems from class worksheet
Science: memorize definitions from class notebook

Every article you read for social studies—whether it is part of a textbook or aprimary source—involves a main concept or event. Usually you can figure outthe main concept by looking at the title or reading the introductory paragraph.Where a lot of people run into trouble is sorting out the key points that describethe main concept or event. A concept/event map can help you sort out the keypoints.
A concept/event map uses the questions who, what, where, when, how, andwhy to identify the key points. Once you can answer these questions about thearticle you are reading, you will know the key points.
In a concept/event map, you write the main idea (an event or a concept) in themiddle of the page. Then you write the key questions around the main idea. Onlines drawn out from the center, write the key facts that explain who, what,where, when, how, and why.
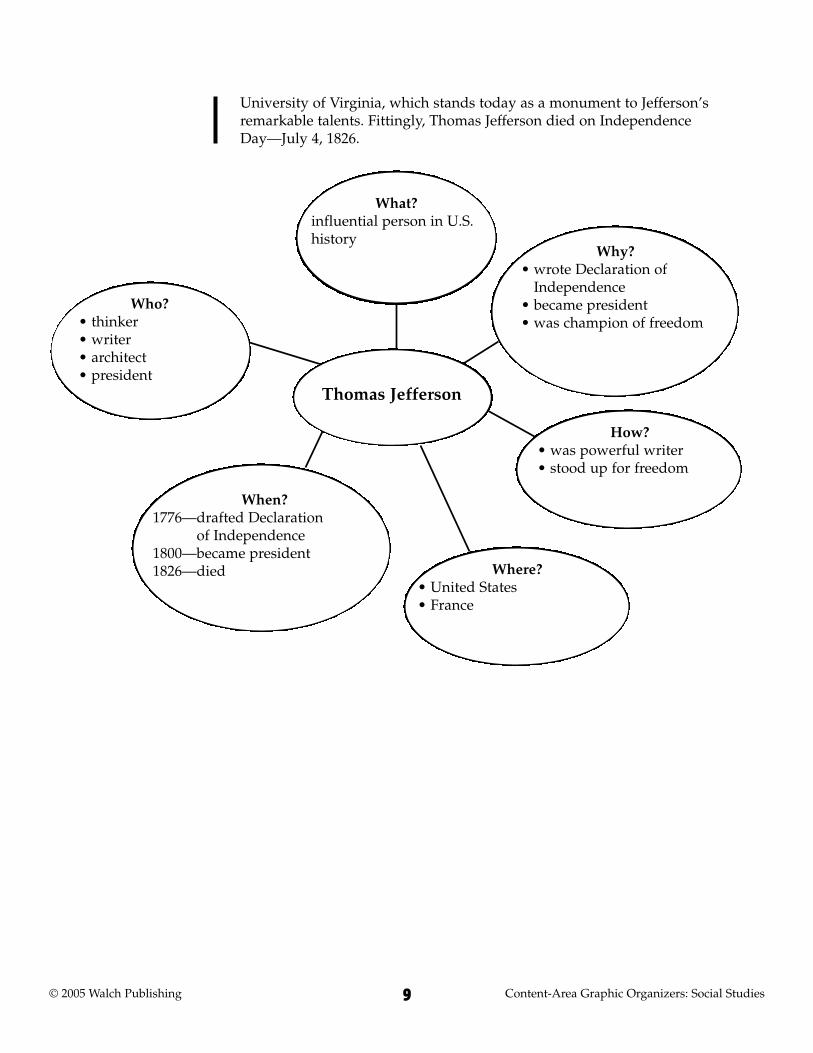
Look at the article below about the life of Thomas Jefferson. Then see how asample concept/event map is filled out on page 9.
Content-Area Graphic Organizers: Social Studies © 2005 Walch Publishing8
Concept/EventMaps in Action
Many historians consider Thomas Jefferson one of the most influentialpeople in our nation’s history. He was a brilliant thinker, writer, andarchitect. He became the third president of the United States. His actionsbefore and after his presidency continue to influence America today.
In 1776, when he was just thirty-three years old, Jefferson revised avery sketchy document for the Continental Congress. That documentbecame the Declaration of Independence. Jefferson believed in freedomabove all else. He drafted a bill that outlined religious freedom for thosein his native state of Virginia. This bill became a foundation documentfor the later Bill of Rights.
After the American Revolution, Jefferson became minister to France.This was an important time in French history, as it was the eve of theirviolent revolution. The fight between nobles and peasants captured theinterest of many Americans. Some sympathized with the nobles. Others,like Jefferson, sympathized with the peasants who wanted morefreedom. Leaders in America were split on their sympathies. This splitled to the formation of two rival political parties. The Federalists becamethe more conservative party in America, and the DemocraticRepublicans were more liberal—they sympathized with French peasants.Jefferson was the leader of the Republicans.
In 1800, Jefferson became president—reluctantly. His presidency wasmarked by some controversy, including his purchase of the land areaknown as the Louisiana Territory. However, the Louisiana Purchaseturned out to be one of the most critical decisions of his presidency. Thispurchase doubled the size of the United States.
When his term of presidency was over, Jefferson retired to his home,known as Monticello. There he sketched the architectural plans for the
Architect, Thinker, President
UsingConcept/Event
Maps
Concept/EventMaps
© 2005 Walch Publishing Content-Area Graphic Organizers: Social Studies9
University of Virginia, which stands today as a monument to Jefferson’sremarkable talents. Fittingly, Thomas Jefferson died on IndependenceDay—July 4, 1826.
Thomas Jefferson
Who?• thinker • writer• architect• president
What?influential person in U.S.history
Why?• wrote Declaration of
Independence• became president• was champion of freedom
When?1776—drafted Declaration
of Independence1800—became president1826—died
How?• was powerful writer• stood up for freedom
Where?• United States• France
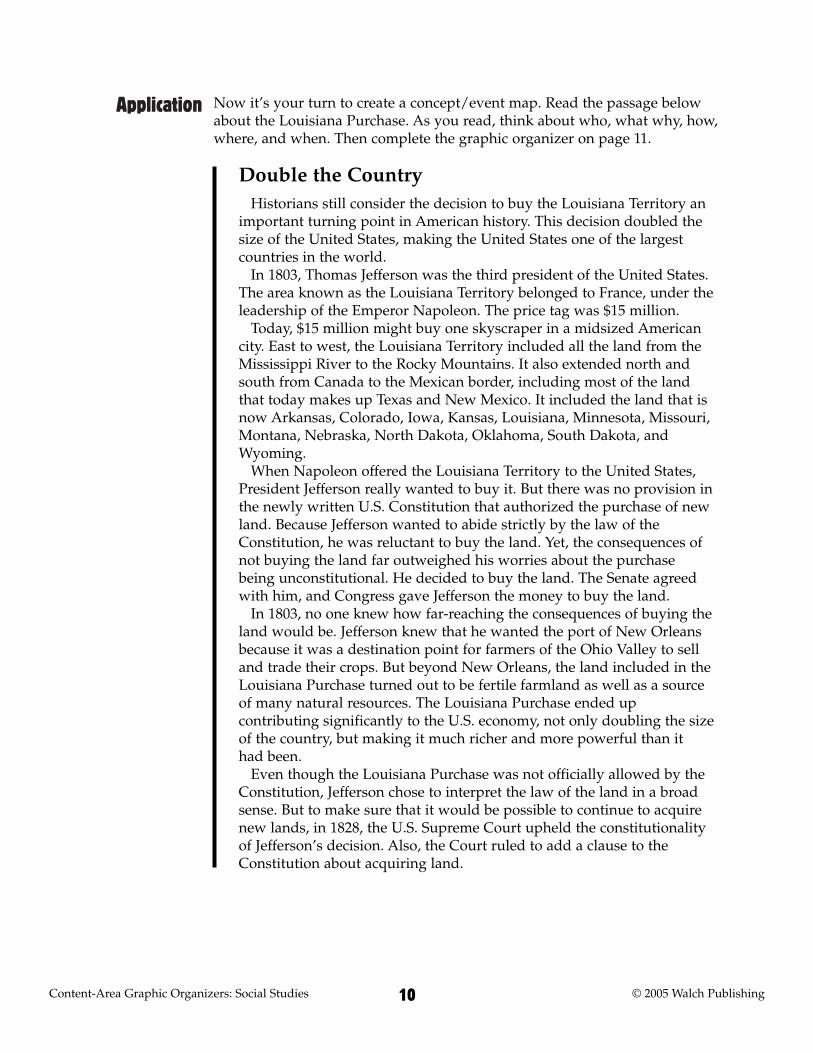
Application Now it’s your turn to create a concept/event map. Read the passage belowabout the Louisiana Purchase. As you read, think about who, what why, how,where, and when. Then complete the graphic organizer on page 11.
Content-Area Graphic Organizers: Social Studies © 2005 Walch Publishing10
Historians still consider the decision to buy the Louisiana Territory animportant turning point in American history. This decision doubled thesize of the United States, making the United States one of the largestcountries in the world.
In 1803, Thomas Jefferson was the third president of the United States.The area known as the Louisiana Territory belonged to France, under theleadership of the Emperor Napoleon. The price tag was $15 million.
Today, $15 million might buy one skyscraper in a midsized Americancity. East to west, the Louisiana Territory included all the land from theMississippi River to the Rocky Mountains. It also extended north andsouth from Canada to the Mexican border, including most of the landthat today makes up Texas and New Mexico. It included the land that isnow Arkansas, Colorado, Iowa, Kansas, Louisiana, Minnesota, Missouri,Montana, Nebraska, North Dakota, Oklahoma, South Dakota, andWyoming.
When Napoleon offered the Louisiana Territory to the United States,President Jefferson really wanted to buy it. But there was no provision inthe newly written U.S. Constitution that authorized the purchase of newland. Because Jefferson wanted to abide strictly by the law of theConstitution, he was reluctant to buy the land. Yet, the consequences ofnot buying the land far outweighed his worries about the purchasebeing unconstitutional. He decided to buy the land. The Senate agreedwith him, and Congress gave Jefferson the money to buy the land.
In 1803, no one knew how far-reaching the consequences of buying theland would be. Jefferson knew that he wanted the port of New Orleansbecause it was a destination point for farmers of the Ohio Valley to selland trade their crops. But beyond New Orleans, the land included in theLouisiana Purchase turned out to be fertile farmland as well as a sourceof many natural resources. The Louisiana Purchase ended upcontributing significantly to the U.S. economy, not only doubling the sizeof the country, but making it much richer and more powerful than it had been.
Even though the Louisiana Purchase was not officially allowed by theConstitution, Jefferson chose to interpret the law of the land in a broadsense. But to make sure that it would be possible to continue to acquirenew lands, in 1828, the U.S. Supreme Court upheld the constitutionalityof Jefferson’s decision. Also, the Court ruled to add a clause to theConstitution about acquiring land.
Double the Country
Answer the who, what, why, how, where, and when questions about the passageyou have just read on the Louisiana Purchase. Then complete the map below tohelp you remember the key points of the article. When you go back to studyabout this topic, or any topic for which you use a concept/event map, the mainideas will be well organized and easy to study and remember.
© 2005 Walch Publishing Content-Area Graphic Organizers: Social Studies11
Concept/Event Map
Who?
What?
Why?
When?
Where?
How?
Have you ever read something and found that the writing rambled on withoutever stating the main idea of the article? It’s hard to remember the facts whenyou don’t see how they are connected to a main idea or central thought.
Every well-written article is organized around a main idea supported by detailsthat illustrate that idea. Most of the time the main idea is stated in the title or inthe opening paragraph. That makes it fairly easy to spot. However, sometimesthe main idea is not clear. For example, when you read a document or a primarysource, you may not be able to identify the main idea very easily. Then you haveto ask yourself these two questions:
• How would I summarize this article in one sentence?
• What title would I give this article?
Next you want to identify the supporting details. Sometimes there are severaldetails in an article or in a primary source. Your job is to figure out which arethe most important details that support the main idea. To do this, you can askyourself these two questions:
• Does this detail broaden my understanding of the main idea? (yes or no)
• In what way does this detail broaden my understanding of the main idea?
A great way to cull information from an article is to create a main idea anddetails chart as you read. You can use it to take notes so that you are notoverwhelmed with less important details. You can also use it to review the textwhen you write a paper or take a test. A main idea and details chart will helpyou remember the key points of your reading.
There are several versions of a main idea and details chart. For social studies, itis helpful to use a graphic organizer that shows how the details add up to themain idea.
Content-Area Graphic Organizers: Social Studies © 2005 Walch Publishing12
Main Idea andDetails Charts
Using Main Ideaand Details Charts
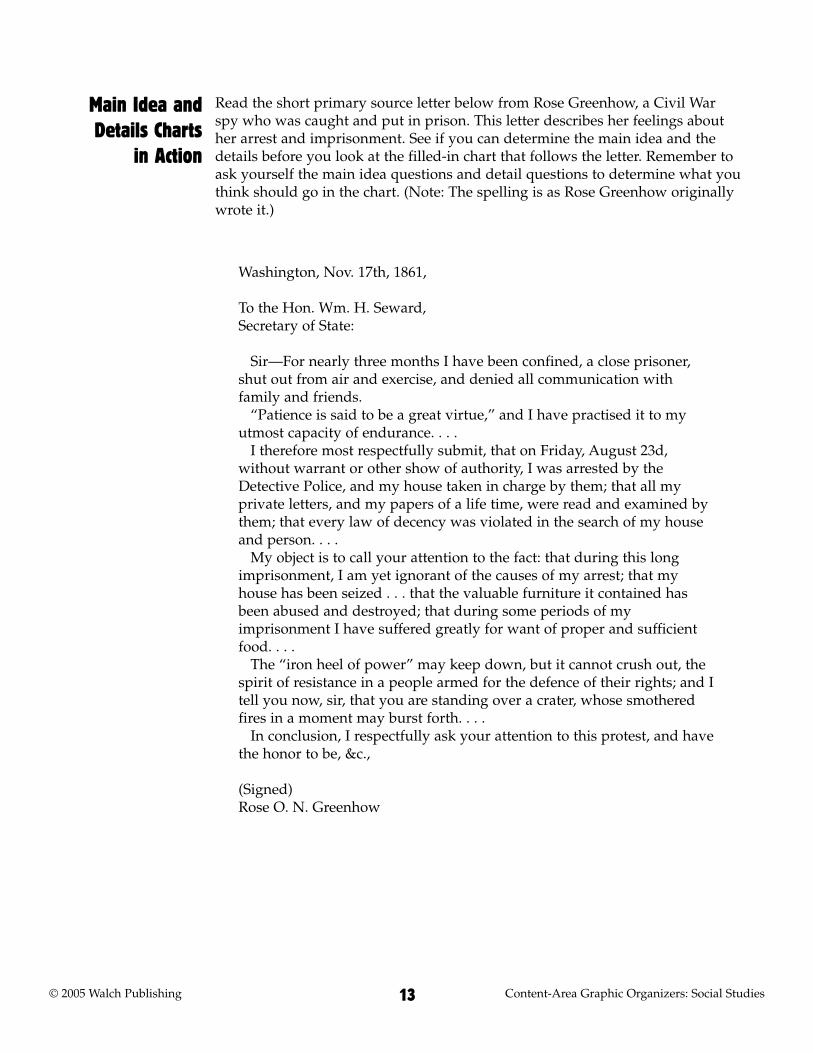
Read the short primary source letter below from Rose Greenhow, a Civil Warspy who was caught and put in prison. This letter describes her feelings abouther arrest and imprisonment. See if you can determine the main idea and thedetails before you look at the filled-in chart that follows the letter. Remember toask yourself the main idea questions and detail questions to determine what youthink should go in the chart. (Note: The spelling is as Rose Greenhow originallywrote it.)
© 2005 Walch Publishing Content-Area Graphic Organizers: Social Studies13
Main Idea andDetails Charts
in Action
Washington, Nov. 17th, 1861,
To the Hon. Wm. H. Seward,Secretary of State:
Sir—For nearly three months I have been confined, a close prisoner,shut out from air and exercise, and denied all communication withfamily and friends.
“Patience is said to be a great virtue,” and I have practised it to myutmost capacity of endurance. . . .
I therefore most respectfully submit, that on Friday, August 23d,without warrant or other show of authority, I was arrested by theDetective Police, and my house taken in charge by them; that all myprivate letters, and my papers of a life time, were read and examined bythem; that every law of decency was violated in the search of my houseand person. . . .
My object is to call your attention to the fact: that during this longimprisonment, I am yet ignorant of the causes of my arrest; that myhouse has been seized . . . that the valuable furniture it contained hasbeen abused and destroyed; that during some periods of myimprisonment I have suffered greatly for want of proper and sufficientfood. . . .
The “iron heel of power” may keep down, but it cannot crush out, thespirit of resistance in a people armed for the defence of their rights; and Itell you now, sir, that you are standing over a crater, whose smotheredfires in a moment may burst forth. . . .
In conclusion, I respectfully ask your attention to this protest, and havethe honor to be, &c.,
(Signed)Rose O. N. Greenhow
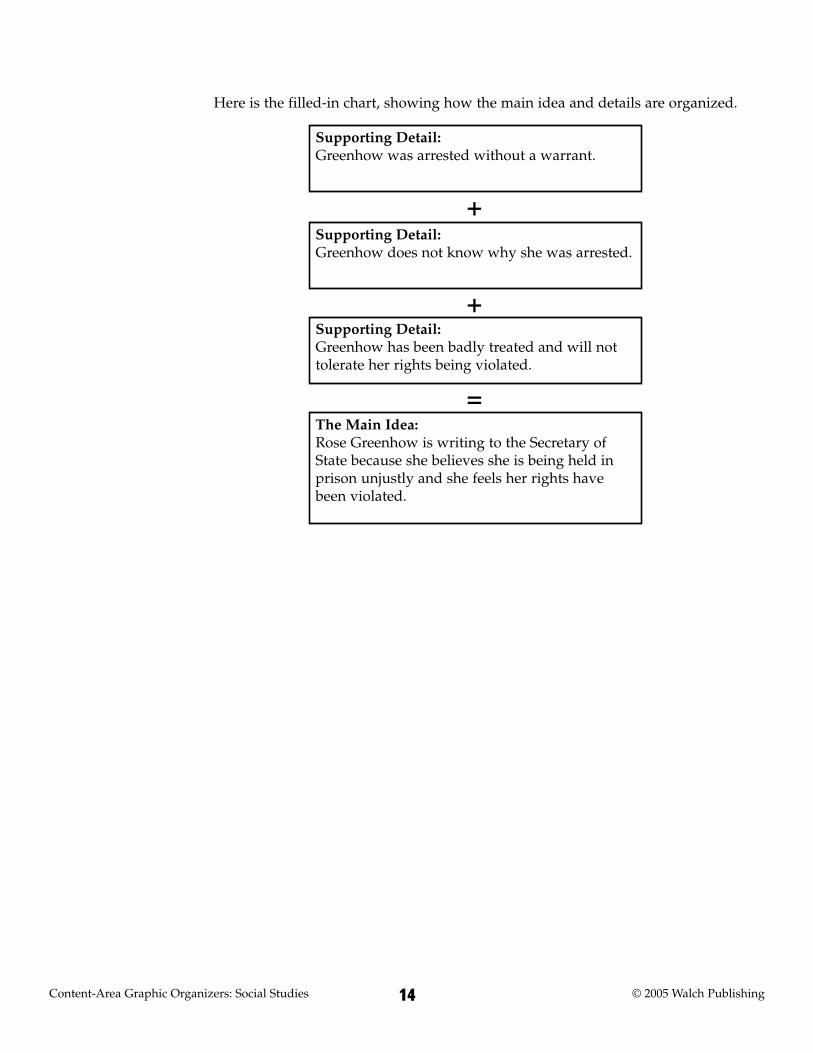
Here is the filled-in chart, showing how the main idea and details are organized.
Content-Area Graphic Organizers: Social Studies © 2005 Walch Publishing14
Supporting Detail:Greenhow was arrested without a warrant.
Supporting Detail:Greenhow does not know why she was arrested.
Supporting Detail:Greenhow has been badly treated and will nottolerate her rights being violated.
The Main Idea:Rose Greenhow is writing to the Secretary ofState because she believes she is being held inprison unjustly and she feels her rights havebeen violated.
+
+
=

Now it’s your turn. Create a main idea and details chart based on the diaryentry that follows. It was written in 1889 by Lucy Larcom. At the age of eleven,Lucy went to work in the textile mills in Lowell, Massachusetts. Read the article.Ask yourself the questions about the main idea:
• How would I summarize this article in one sentence?
• What title would I give this article?
Then examine the supporting details and ask yourself:
• Does this detail broaden my understanding of the main idea?
• In what way does this detail broaden my understanding of the main idea?
© 2005 Walch Publishing Content-Area Graphic Organizers: Social Studies15
Application
So I went to my first day’s work in the mill with a light heart. Thenovelty of it made it seem easy, and it really was not hard, just to changethe bobbins on the spinning-frames every three quarters of an hour orso, with half a dozen other little girls who were doing the same thing.When I came back at night, the family began to pity me for my long,tiresome day’s work, but I laughed and said,—
“Why, it is nothing but fun. It is just like play.”And for a little while it was only a new amusement; I liked it better
than going to school and “making believe” I was learning when I wasnot. . . .
There were compensations for being shut in to daily toil so early. Themill itself had its lessons for us. But it was not, and could not be, theright sort of life for a child, and we were happy in the knowledge that, atthe longest, our employment was only to be temporary. . . .
In the older times it was seldom said to little girls, as it always hasbeen said to boys, that they ought to have some definite plan, while theywere children, what to be and do when they were grown up. There wasusually but one path open before them, to become good wives andhousekeepers. . . . When I was growing up, they had already begun to beencouraged to do so. We were often told that it was our duty to developany talent we might possess, or at least to learn how to do some onething which the world needed, or which would make it a pleasanterworld. . . .
One great advantage which came to these many stranger girls throughbeing brought together, away from their own homes, was that it taughtthem to go out of themselves, and enter into the lives of others. Home-life, when one always stays at home, is necessarily narrowing. . . . Wehave hardly begun to live until we can take in the idea of the wholehuman family as the one to which we truly belong. To me, it was anincalculable help to find myself among so many working girls, all of usthrown upon our own resources, but thrown much more upon eachothers’ sympathies.
From Lucy Larcom’s Diary

Fill in the main idea and details chart below. You may want to begin with themain idea first, then see what supporting details add up to it. Or, you may wantto try putting the details on paper first, then seeing what they all add up to.
Content-Area Graphic Organizers: Social Studies © 2005 Walch Publishing16
Supporting Detail:
Supporting Detail:
Supporting Detail:
The Main Idea:
+
+
=
Main Idea andDetails Chart
Have you ever tried to describe your family to another person? Did you includeyour aunts and uncles, brothers and sisters, cousins, nieces and nephews? It canbe complicated to explain who is who, especially in a big family. Luckily, there isa tool called a family tree. This tool can help you visualize the people in a familyand how they are related to one another.
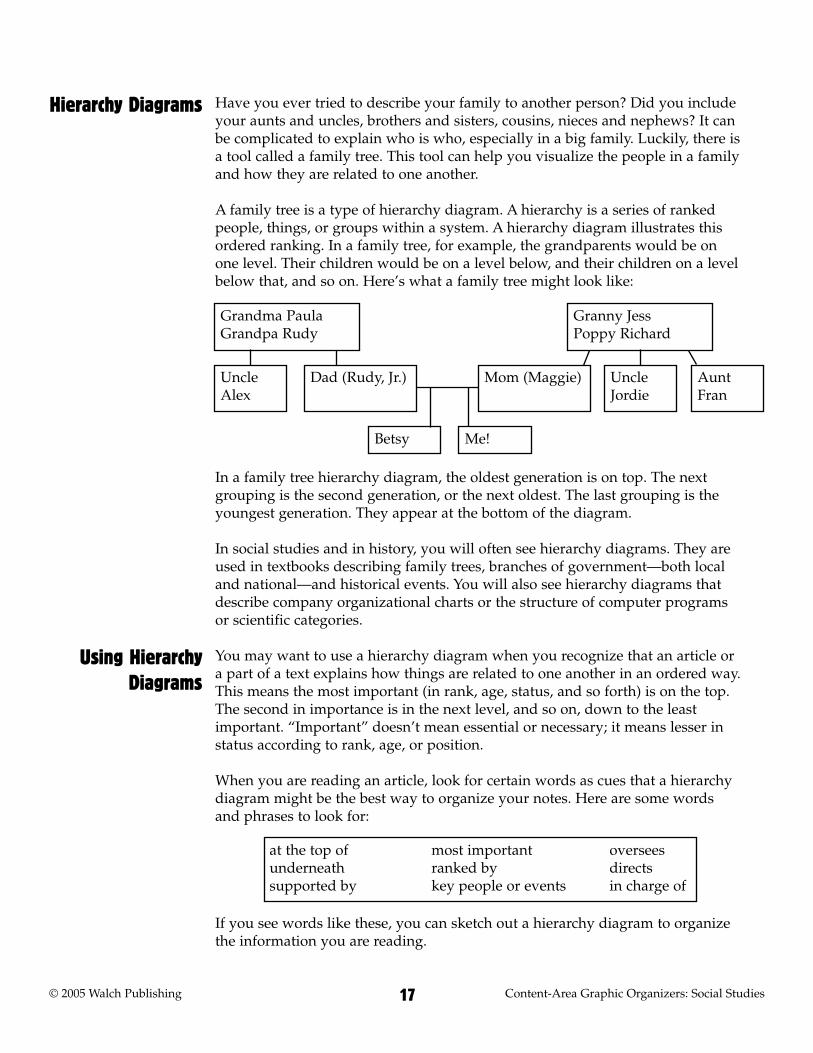
A family tree is a type of hierarchy diagram. A hierarchy is a series of rankedpeople, things, or groups within a system. A hierarchy diagram illustrates thisordered ranking. In a family tree, for example, the grandparents would be onone level. Their children would be on a level below, and their children on a levelbelow that, and so on. Here’s what a family tree might look like:
In a family tree hierarchy diagram, the oldest generation is on top. The nextgrouping is the second generation, or the next oldest. The last grouping is theyoungest generation. They appear at the bottom of the diagram.
In social studies and in history, you will often see hierarchy diagrams. They areused in textbooks describing family trees, branches of government—both localand national—and historical events. You will also see hierarchy diagrams thatdescribe company organizational charts or the structure of computer programsor scientific categories.
You may want to use a hierarchy diagram when you recognize that an article ora part of a text explains how things are related to one another in an ordered way.This means the most important (in rank, age, status, and so forth) is on the top.The second in importance is in the next level, and so on, down to the leastimportant. “Important” doesn’t mean essential or necessary; it means lesser instatus according to rank, age, or position.
When you are reading an article, look for certain words as cues that a hierarchydiagram might be the best way to organize your notes. Here are some wordsand phrases to look for:
If you see words like these, you can sketch out a hierarchy diagram to organizethe information you are reading.
© 2005 Walch Publishing Content-Area Graphic Organizers: Social Studies17
Hierarchy Diagrams
Grandma PaulaGrandpa Rudy
Granny JessPoppy Richard
Mom (Maggie)Dad (Rudy, Jr.) UncleJordie
Betsy Me!
UncleAlex
AuntFran
at the top of underneathsupported by
most importantranked bykey people or events
overseesdirectsin charge of
Using HierarchyDiagrams

Below is an article about how three types of local city governments work. Afterthe article are three different hierarchy diagrams that show the three types oflocal government. Note that in each case the strongest or most important in rankis at the top of the diagram. The least important in rank is at the bottom. Lookfor some of the key phrases to see how they translate into the hierarchy diagram.
Content-Area Graphic Organizers: Social Studies © 2005 Walch Publishing18
Hierarchy Diagramsin Action
Do you have a weak mayor? Or do you have a strong mayor? Maybeyou don’t have a mayor at all. Whatever your local government, themost important people who run the city are the voters who elect theirrepresentatives.
A weak mayor doesn’t really mean that the mayor isn’t a good mayor.The weak mayoral system is a name given to a form of local governmentin which voters elect a mayor and a city council to run the town. Oftenthe mayor is just a ceremonial role because the council does most of thedecision-making for the town or city. Underneath the city council andthe mayor are the department heads. Departments include public safety,public works, parks and recreation, and finance.
A strong mayoral system doesn’t mean that the mayor is really strong,either. A strong mayoral system means that the city council advises themayor, who makes many of the decisions for the town. The mayor is incharge of the department heads. They all report to the mayor and not tothe city council, as in a weak mayoral system. In this system, voters electthe city council as well as the mayor.
A council-manager system has no mayor at all. This is a system oftenfound in smaller towns. In this system, the city council oversees a citymanager, and the city manager directs the department heads. In someways the city manager is like a mayor, only he or she doesn’t have thesame authority as a mayor.
Discovering what lies beneath the politics of your town can help youmake better decisions about how you want your town to run. As a voter,you will be glad you have all the correct information!
Weak or Strong or None at All

Here are the three completed hierarchy diagrams.
Weak Mayoral System
Strong Mayoral System
Council-Manager Government
© 2005 Walch Publishing Content-Area Graphic Organizers: Social Studies19
City Council Mayor
Department Heads
Mayor City Council
Department Heads
City Manager
Department Heads
City Council

Now it’s your turn to make a hierarchy diagram. Read through the followingarticle about the branches of the federal government. Look for key words to helpyou determine what should go at the top of the diagram and what should go inthe next tier. Then use this information to complete the blank chart on page 21.
Content-Area Graphic Organizers: Social Studies © 2005 Walch Publishing20
Application
The young men who wrote the Constitution of the United States had atough job to do. Their job was to create a framework that would outlinehow the U.S. government would work. One of the most important issuesthey faced was how to make sure that no one person could ever havetotal control over the people. They had experienced government by asingle ruler when they were ruled by the king of England.
So the men who wrote the Constitution created a system in which allthe power in the government would be shared by three separate butequal branches. The system they devised is called the system of checksand balances. This means that each branch can reject the decisions of theother two. In this way, the branches can keep one another in check.
The framers first established the executive branch. This branchincludes the President, the Vice President, and all the chief staff membersadvising these two people. These advisers are known as the cabinet.There are roughly fourteen cabinet positions; sometimes the Presidenteliminates or adds a cabinet office, according to the needs of the country.For example, President George W. Bush created a new cabinet post in2002, the Secretary of Homeland Security. That position had never beforeexisted in the executive branch.
The legislative branch of government has the same authority as theexecutive branch. This branch includes all the members of the Senate(100) and all the members of the House of Representatives (435).Together these two groups are called the Congress. Their job is to writeand review bills that may become laws. They then vote for or againstthese bills. Congress members don’t always agree on what bills shouldbecome laws, so there is often a lot of discussion, debate, and revision of bills.
The judicial branch is made up of the courts. In the courts, judgesdecide how to apply and interpret the laws that are made by Congress.Sometimes the intent of the law is unclear, so the courts need to clarifythe meaning.
The highest court in the judicial branch is called the Supreme Court.The judges who sit on this court make some of the most importantdecisions in the country. Each year, about 4,500 cases are sent to theSupreme Court. But each year, the judges only hear about 200 of them.The rest of the cases are settled at the next court level, the court ofappeals. The lowest court level is called the district court.
These three branches of government are the backbone of the U.S.government. Ultimately, however, the voters choose the people torepresent us in the government, so we must listen closely to elect thosewho will uphold the best interests for all U.S. citizens.
A Balancing Act
After you have read the article about the three branches of the federalgovernment, complete a hierarchy diagram that shows how the three branchesare related to one another. Write the most important element at the top. Writeless important elements lower down. Use lines to show relationships betweenelements. Add or delete boxes and lines as needed.
© 2005 Walch Publishing Content-Area Graphic Organizers: Social Studies21
Hierarchy Diagram

A spider map is another graphic organizer you can use to organize your readingnotes. You can use a spider map any time you want to illustrate the main ideaand details of a text.
Write the topic or theme of the reading in the oval. Write one main idea on eachdiagonal line. Write one supporting detail on each horizontal line. Add or deletelines as needed.
Content-Area Graphic Organizers: Social Studies © 2005 Walch Publishing22
Spider Maps
Topic/Theme:
_____________________________
Main Idea
Detail
Detail Detail
Detail
Detail
Detail Detail
Detail
Main IdeaM
ain Id
ea
Mai
n Idea

© 2005 Walch Publishing Content-Area Graphic Organizers: Social Studies23
Have you ever had someone give you directions, but they gave them out oforder? What happened? Did you get lost or have a hard time figuring out howto follow the directions?
Or imagine that you opened a cookbook and found that the recipe for chocolatechip cookies looked like this:
If you followed the sequence of this recipe, you probably wouldn’t make verygood cookies!
Order of events, or sequencing, is a key pattern in social studies. When youstudy history, it is important to understand what happened first, next, then last.Understanding how things happened and in what order helps you understandwhy those things happened. For example, when Rosa Parks decided not tomove to the back of the bus, she caused a ripple effect that eventually led to theboycott and integration of buses in Montgomery, Alabama. If you learned aboutthese historic events out of order, they would not be as meaningful.
In this lesson, we will look closely at two graphic organizers that can help yourecognize and understand sequencing. The first is a time line, which you haveprobably worked with before. The second is a sequence chain, which will showyou the flow of events from one to another.
Sequencing
Recipe for Chocolate Chip Cookies
Cook for 25–30 minutes until the cookies are lightly browned.
Mix chocolate chips with flour, salt, and baking powder.
Pour in chocolate chips.
Add vanilla.
Cream together eggs and sugar.
Preheat oven to 350˚.
The study of history is often presented in chronological order. This means that itis presented in the order that the events occurred. When you read about history,you’ll see that dates are often sprinkled throughout the text. But the dates don’tmean much unless they are set in some kind of time frame. Time lines are agreat way to organize information so that it follows chronological order.
Time lines come in many shapes and sizes. All time lines include a date andsome type of slot to write in brief information about what happened on thatdate. Sometimes, instead of written information, time lines have pictures thatrepresent the event or activity.
Some time lines are very detailed. Some are more general. For example, youcould create a time line of the events in your classroom. Each day could bechronicled according to birthdays, holidays, sporting events, or other specialactivities. You might need the whole wall to cover the year. You could also createa time line of the highlights of the past twenty centuries. This time line mightinclude four or five events per century, covering more than 2,000 years.
Almost any event or span of time can be shown with a time line. For example,you could create a detailed time line of your activities in the past week. Whatdid you do each day? You could also create a time line of your whole life. Whatevents would you want to highlight? Any time you are reading something thatincludes a time frame, a time line can help you keep the events or the ideasstraight.
Time lines usually have the dates on one side and the events depicted on theother. Time lines can be horizontal, or they can be vertical. If they are vertical—going from top to bottom—usually the earliest events are placed on the bottom.Later events appear higher on the line, with the most recent events at the top. Ifthe time line is horizontal, the earliest events usually are placed at the left sideof the time line. Then the events progress to the most recent date, on the right.
Content-Area Graphic Organizers: Social Studies © 2005 Walch Publishing24
Time Lines
Using Time Lines

The passage below describes the most important inventions created throughouthistory. Below the text, you’ll see a time line that illustrates the key inventions.Note that this time line is very simple, and it covers a huge time frame.
© 2005 Walch Publishing Content-Area Graphic Organizers: Social Studies25
Time Lines in Action
Can you imagine life without a wheel? What if there were no signs orwords printed on a page? Almost everything you do, every tool you use,was once the invention and innovation of a creative mind. Many of thearticles we use today were created more than 2,000 years ago.
Do you know anyone who has false teeth? Do you know when falseteeth were invented? It might surprise you to find out that false teethhave been around a lot longer than the telescope, the trumpet, or evenpaper. False teeth were the brainchild of the ancient Etruscans and werefirst used around 700 B.C.E.
Other B.C.E. inventions include the tent (40,000 B.C.E.), maps (3800 B.C.E.), soap (3000 B.C.E.), and the first flush toilet—invented wayback in 2000 B.C.E. You probably think that ice cream is a twentieth-century invention. Would it surprise you to know it was invented in 400 B.C.E.? And kites have been around for more than 3,000 years. Theywere first invented in China, around 1000 B.C.E. The Chinese were alsofamous for inventing the umbrella—not to keep out the rain, but to keepout the bright sun. This invention happened around the same time as thekite. The Chinese also invented gunpowder, around 700 B.C.E., to propelrockets.
So the next time you go for a lick of ice cream, thank the ancients for itand for many other inventions that help us through the twenty-firstcentury.
Tools from Long Ago
40,000 B.C.E. 3800 B.C.E. 3000 B.C.E. 2000 B.C.E. 1000 B.C.E. 700 B.C.E. 400 B.C.E.
tents maps soapflush toilet
false teeth andgunpowder
icecream
kites andumbrellas
Inventions
Now it’s your turn to try your hand at a time line. Research one of the topicsbelow. Then create a time line based on the facts you learn about the topic andits history. Feel free to use the time line provided on page 27, or create yourown, using drawings or art from your sources.
1. The years of the American Revolution were filled with events that beganthe history of the young American republic. Research the events that ledup to the American Revolution, and create a time line that reflects the keyevents.
2. Fashion in the twentieth century has changed as the times have changed.Research fashions for either men or women, and create a time line thatshows the changing fashions.
3. Popular music in each decade of the twentieth century has changed toreflect the psyche of the American people. Find out what types of musicwere introduced at what times, and create a time line that reflects popularmusic changes.
4. Choose an artist of the nineteenth or twentieth century, and create a timeline that shows the key events in his or her life.
5. Choose one decade in the settling of the West, and create a time line thatshows key events during that decade.
6. The late nineteenth and twentieth centuries were times of majortechnological advances. Many inventions changed the way Americanswork, play, and live. Create a time line that shows when key technologieswere introduced to society.
7. Find out what happened on one day of the year at different periods ofhistory, and plot the events on a time line. You might want to look at thenewspaper, which often lists historical events for the day and the yearsthat the events took place.
8. Create a time line that depicts the events in the life of your favorite author.Why is it interesting or important to know about these events?
9. Find out when the musical instruments of the orchestra were invented.Create a time line that shows the years of their invention.
10. Choose your favorite car maker, and create a time line that shows whenvarious models were designed and put on the market.
Content-Area Graphic Organizers: Social Studies © 2005 Walch Publishing26
Application

Use the time line below to show the events from one of the projects on page 26.There’s space here if you want to include a drawing or a picture to illustrateyour time line. Put the earliest event at the bottom, with more recent eventsabove, in the order in which they took place. The most recent event should be atthe top.
© 2005 Walch Publishing Content-Area Graphic Organizers: Social Studies27
Time Line

Like time lines, sequence chains are a way to organize events in the order inwhich they occurred. Just as history is often written in time order, other socialstudies topics are written in sequential order. This means that events are linkedto one another by the order in which they happened. Sequential order tells whathappened first, next, and last.
The sequence chain can be used to describe a chain of events, stages ofdevelopment, phases of an era, or actions taken by an individual or a group, aswell as the outcomes of all of the steps in the sequence. When you are learningabout a sequence, you want to ask yourself four key questions:
• What person, event, phase, project, or action is being discussed?
• What are the steps, actions, or events that describe this person or time period?
• How do these steps, actions, or events relate to one another?
• What is the final outcome of these events?
The last key question is very important. The answer indicates the importance ofthe subject.
Content-Area Graphic Organizers: Social Studies © 2005 Walch Publishing28
Sequence Chains
Using SequenceChains
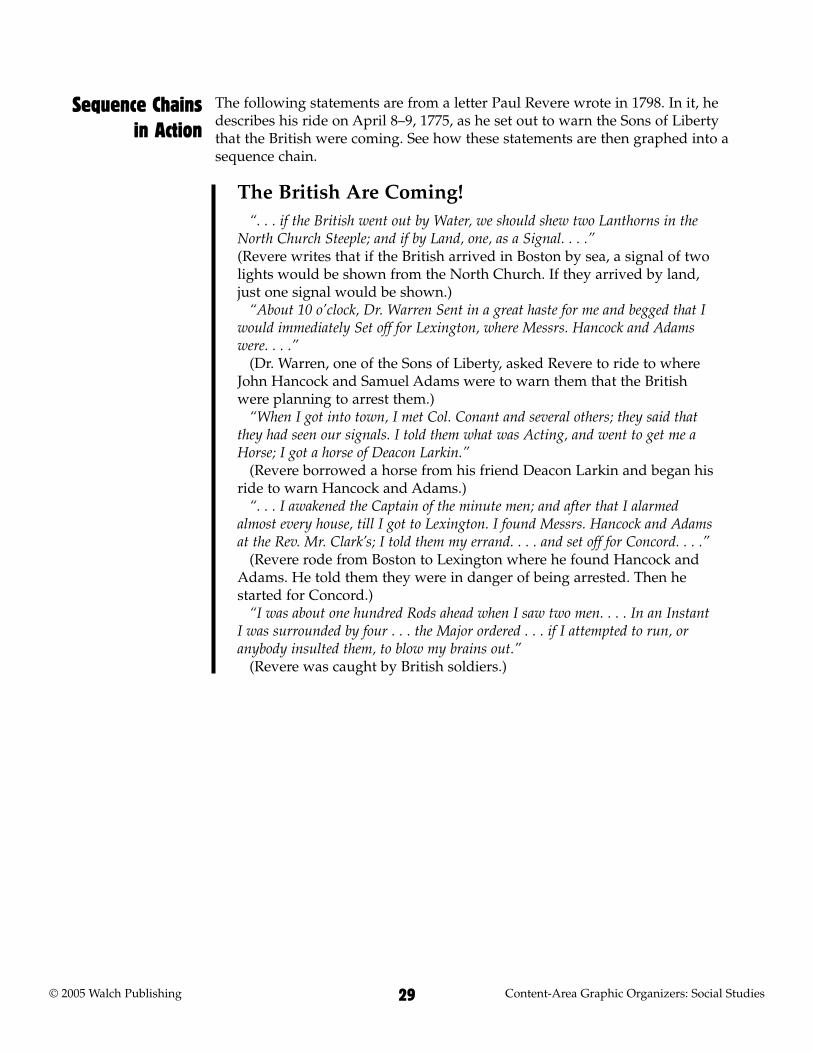
The following statements are from a letter Paul Revere wrote in 1798. In it, hedescribes his ride on April 8–9, 1775, as he set out to warn the Sons of Libertythat the British were coming. See how these statements are then graphed into asequence chain.
© 2005 Walch Publishing Content-Area Graphic Organizers: Social Studies29
Sequence Chains in Action
“. . . if the British went out by Water, we should shew two Lanthorns in theNorth Church Steeple; and if by Land, one, as a Signal. . . .”(Revere writes that if the British arrived in Boston by sea, a signal of twolights would be shown from the North Church. If they arrived by land,just one signal would be shown.)
“About 10 o’clock, Dr. Warren Sent in a great haste for me and begged that Iwould immediately Set off for Lexington, where Messrs. Hancock and Adamswere. . . .”
(Dr. Warren, one of the Sons of Liberty, asked Revere to ride to whereJohn Hancock and Samuel Adams were to warn them that the Britishwere planning to arrest them.)
“When I got into town, I met Col. Conant and several others; they said thatthey had seen our signals. I told them what was Acting, and went to get me aHorse; I got a horse of Deacon Larkin.”
(Revere borrowed a horse from his friend Deacon Larkin and began hisride to warn Hancock and Adams.)
“. . . I awakened the Captain of the minute men; and after that I alarmedalmost every house, till I got to Lexington. I found Messrs. Hancock and Adamsat the Rev. Mr. Clark’s; I told them my errand. . . . and set off for Concord. . . .”
(Revere rode from Boston to Lexington where he found Hancock andAdams. He told them they were in danger of being arrested. Then hestarted for Concord.)
“I was about one hundred Rods ahead when I saw two men. . . . In an InstantI was surrounded by four . . . the Major ordered . . . if I attempted to run, oranybody insulted them, to blow my brains out.”
(Revere was caught by British soldiers.)
The British Are Coming!

The article below is adapted from Ben’s Guide to U.S. Government(http://bensguide.gpo.gov), a service of the U.S. Government Printing Office. Itdescribes how a law is made. As you read it, keep in mind the key questionslisted on page 28. These questions will help you focus on the most importantparts of the article. Then create a sequence chain based on the key points in thearticle. Hint: Look for the topic sentence in each of the paragraphs. These willoften tell you which are the most important points.
Content-Area Graphic Organizers: Social Studies © 2005 Walch Publishing30
Step 1Revere arranged that a signalfrom the North Church wouldshow if the British were comingby land or by sea.
Step 2Dr. Warren sent for Revere towarn Samuel Adams and JohnHancock that the British wereplanning to arrest them.
Step 3Revere began his ride.
Step 4Revere rode to Lexington,awakening everyone on hisway. He found Hancock andAdams.
Step 5As he started for Concord,Revere was stopped by Britishsoldiers.
Application
Laws are started in the legislative branch of the government. There aretwo parts to the legislative branch. A bill can be started in eitherchamber of Congress—the House of Representatives or the Senate.
When a representative has an idea for a new law, she or he becomes asponsor of that bill. She or he introduces it by giving it to the clerk of theHouse or by placing it in a box, called the hopper. The clerk assigns alegislative number to the bill, with H.R. for bills introduced in the Houseof Representatives and S. for bills introduced in the Senate. TheGovernment Printing Office (GPO) then prints the bill and distributescopies to each representative.
Next the speaker of the House assigns the bill to a committee for study.The House has twenty-two standing committees. . . . The standingcommittee (or often a subcommittee) studies the bill and hears testimony
How a Law Is Made

© 2005 Walch Publishing Content-Area Graphic Organizers: Social Studies31
from experts and people interested in the bill. The committee then mayrelease the bill with a recommendation to pass it. Or, they might revisethe bill and release it, or lay it aside so that the House cannot vote on it.Releasing the bill is called reporting it out. Laying it aside is calledtabling.
If the bill is released, it then goes on a calendar, which is a list of billsawaiting actions. Here the House Rules Committee may call for the billto be voted on quickly, or may limit debate about the bill. Bills may bepassed by unanimous consent, or by a two-thirds vote if members agreeto suspend the rules.
The bill now goes to the floor of the House for consideration andbegins with a complete reading of the bill. . . . If the bill passes by simplemajority (218 of 435), the bill moves to the Senate.
Just as in the House, the bill then is assigned to a committee. It isassigned to one of the Senate’s sixteen standing committees. . . . TheSenate committee studies and either releases or tables the bill just likethe House standing committee.
Once released, the bill goes to the Senate floor for consideration. Billsare voted on in the Senate based on the order they come from thecommittee. However, an urgent bill may be pushed ahead by leaders ofthe majority party. When the Senate considers the bill, they can debateabout it for a very long time. When there is no more debate, the bill isvoted on. A simple majority (51 of 100) passes the bill.
The bill now moves onto a conference committee, which is made up ofmembers from each house. The committee works out any differencesbetween the House and Senate versions of the bill. The revised bill issent back to both houses for their final approval. Once approved, the billis printed by the U.S. Government Printing Office in a process calledenrolling. The clerk from the introducing house certifies the finalversion.
The enrolled bill is now signed by the speaker of the House and thenby the Vice President. Finally, it is sent for presidential consideration.The President has ten days to sign or veto the enrolled bill. If thePresident vetoes the bill, it can still become a law if two-thirds of theSenate and two-thirds of the House then vote in favor of the bill.
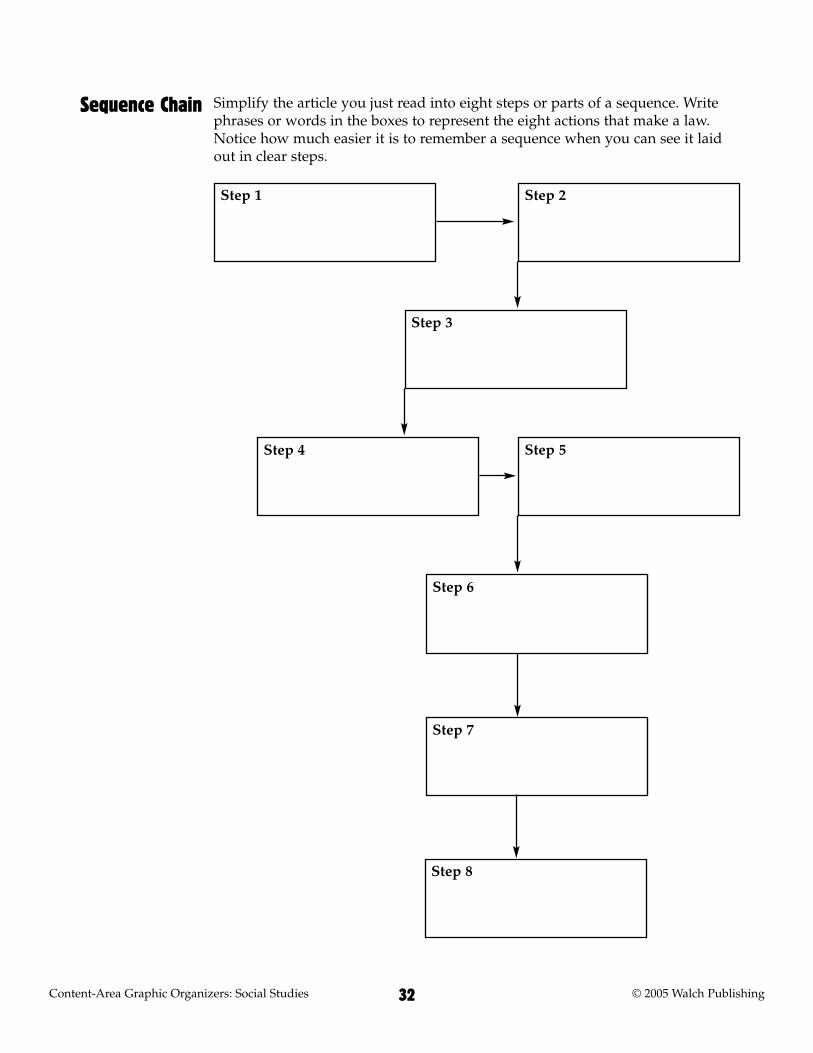
Simplify the article you just read into eight steps or parts of a sequence. Writephrases or words in the boxes to represent the eight actions that make a law.Notice how much easier it is to remember a sequence when you can see it laidout in clear steps.
Content-Area Graphic Organizers: Social Studies © 2005 Walch Publishing32
Step 1 Step 2
Step 3
Step 4 Step 5
Step 6
Step 7
Step 8
Sequence Chain
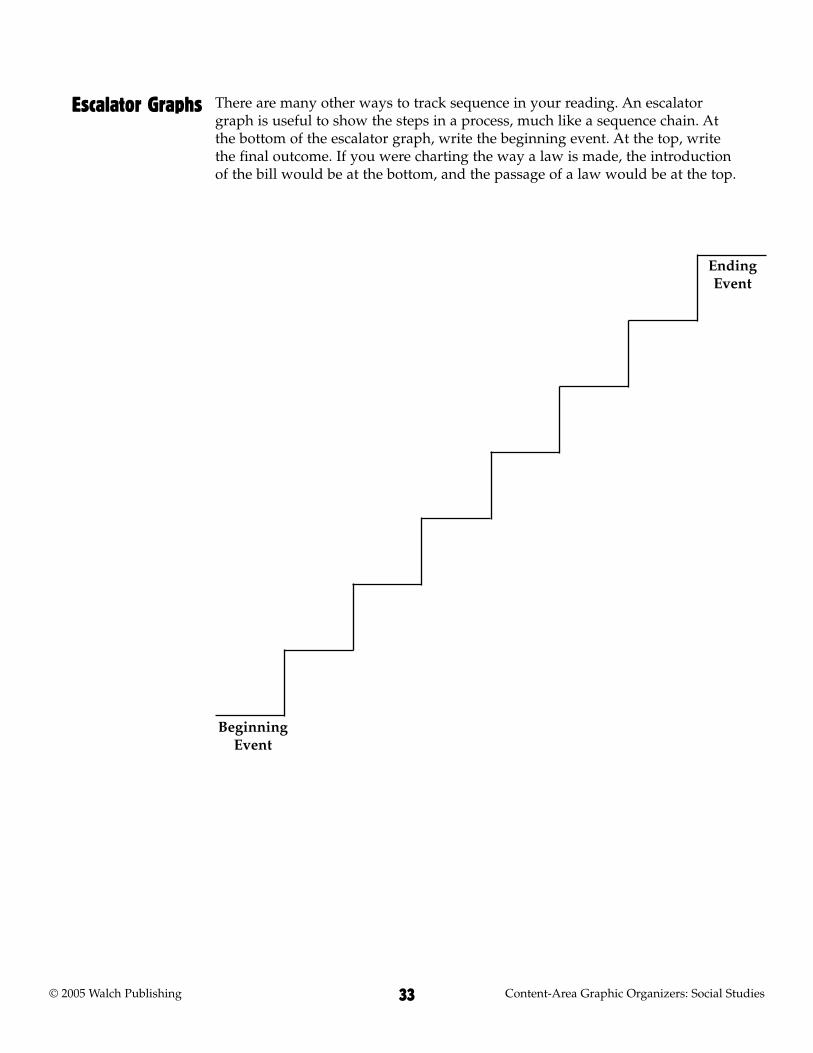
There are many other ways to track sequence in your reading. An escalatorgraph is useful to show the steps in a process, much like a sequence chain. Atthe bottom of the escalator graph, write the beginning event. At the top, writethe final outcome. If you were charting the way a law is made, the introductionof the bill would be at the bottom, and the passage of a law would be at the top.
© 2005 Walch Publishing Content-Area Graphic Organizers: Social Studies33
Escalator Graphs
EndingEvent
BeginningEvent

Content-Area Graphic Organizers: Social Studies © 2005 Walch Publishing34
What are your favorite types of music? Are you a hip-hop fan? Perhaps you likejazz or heavy metal or blues or even classical music. If someone asked you todescribe your two favorite types of music, what would you choose? If someoneasked you what these types of music have in common, what would you say?How would you say they are different?
You compare and contrast items every day. Comparing music types is just oneexample. Each day you compare one food to another. You compare one article ofclothing to another. You even compare teaching styles, books, and schoolactivities. When you make these comparisons, you make a choice. You decidewhich things you prefer. This process of comparing and contrasting is animportant skill in your life. It helps you decide what is important and why. Ithelps you understand the relationship between one thing and another.
Comparing and contrasting is often used in social studies. When you comparetwo or more things, you analyze the ways that they are alike. When you contrasttwo or more things, you analyze the ways that they are different. Ultimately,you use the skill of comparing and contrasting to help you learn more deeplythe attributes of a particular idea, object, situation, or person.
In this lesson, you will learn about two types of graphic organizers that are usedto show how things are alike and how they are different. The first chart is calleda then and now chart. It shows a historical object or idea as it compares to thesame type of modern-day item. The second type of organizer is called a Venndiagram. This simple diagram shows clearly what two objects or ideas have incommon and how they are different. When you learn how to use these graphicorganizers in your reading, you’ll discover that text arranged in a compare andcontrast organizer is very clear and easy to understand.
Comparing and Contrasting
Then and now charts compare and contrast events, ideas, situations, or things asthey were at a time in the past and as they are today. This type of T-chart helpsillustrate what life was like in another time. It points out the changes that havetaken place between a time past and today. This can help you see how your lifemight have been different had you been born at another time. It can also helpyou realize what types of choices and decisions people faced in the past.Knowing this will help you understand the process of adapting to change—acritical life skill.
When you compare and contrast time periods—or any two or more ideas,objects, or situations—it is important to ask yourself some key questions. Thesequestions will help you focus on what the key points are in your reading andwhat information you want to gather from the text. The questions are these:
• What do I want to compare and contrast?
• What do I want to learn about the things being compared and contrasted?
• What information do I need to have about both things in order to compareand contrast them?
• What did I learn? What did I discover by comparing and contrasting these things?
To create a then and now chart, start with a T-chart. Draw a vertical line in themiddle of the page. Next, draw a horizontal line that crosses the vertical line.The chart should look a little like a large letter “t.” Write the things you arecomparing above the horizontal line, with one on each side of the vertical line.Now write the information about each thing on the appropriate side of thechart. If you have the same type of information about both things—for example,size, color, duration, and so forth—line the information up on both sides of thevertical line. This makes it much easier to see how the things really compare.
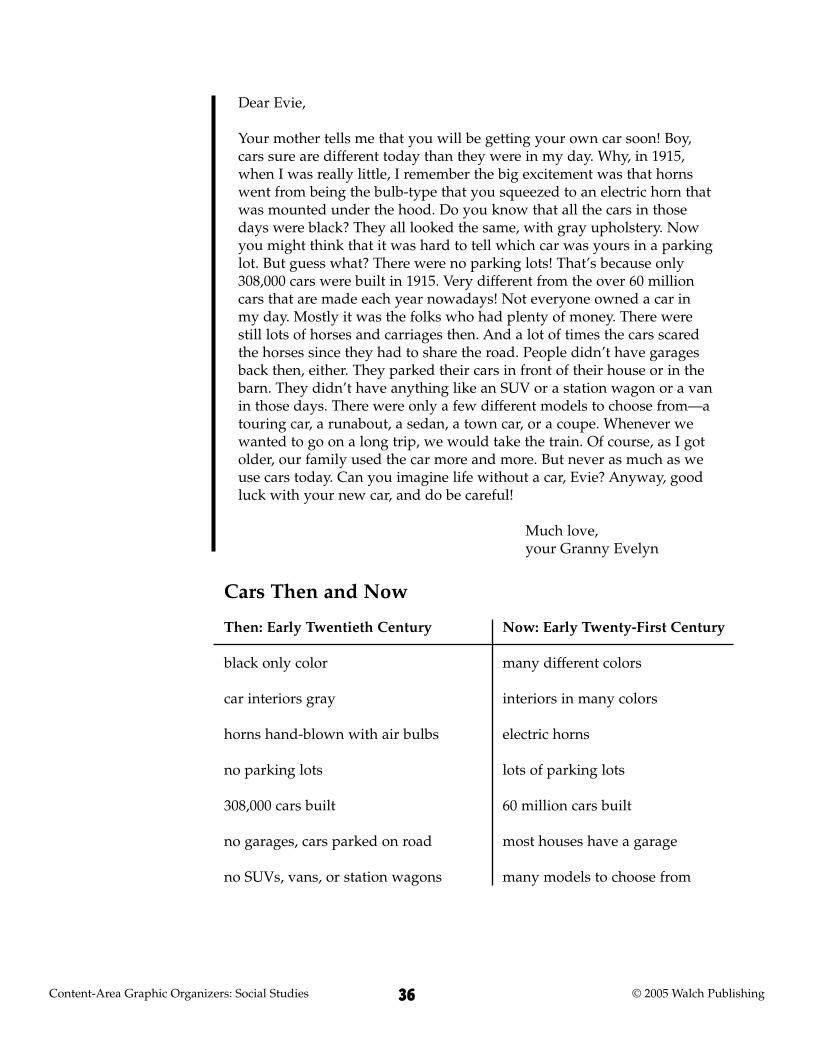
On the following page is a letter written by Evelyn, a 95-year-old woman, to hergreat-great-granddaughter, her namesake, Evie. In it, the older woman describesa few details of what life was like when she was young. After you have read theletter, ask yourself the key questions. Then see how the information has beencharted in the then and now chart on page 36. You’ll note that there are someentries in the “now” column that don’t specifically appear in the letter. That isbecause the example assumes the reader has some experience or workingknowledge of contemporary cars. When you do a then and now chart, you’lloften have to fill in information using prior knowledge.
© 2005 Walch Publishing Content-Area Graphic Organizers: Social Studies35
Then and Now Charts
Then and Now Charts
in Action
Using Then and Now Charts
Content-Area Graphic Organizers: Social Studies © 2005 Walch Publishing36
Cars Then and Now
Then: Early Twentieth Century
black only color
car interiors gray
horns hand-blown with air bulbs
no parking lots
308,000 cars built
no garages, cars parked on road
no SUVs, vans, or station wagons
Now: Early Twenty-First Century
many different colors
interiors in many colors
electric horns
lots of parking lots
60 million cars built
most houses have a garage
many models to choose from
Dear Evie,
Your mother tells me that you will be getting your own car soon! Boy,cars sure are different today than they were in my day. Why, in 1915,when I was really little, I remember the big excitement was that hornswent from being the bulb-type that you squeezed to an electric horn thatwas mounted under the hood. Do you know that all the cars in thosedays were black? They all looked the same, with gray upholstery. Nowyou might think that it was hard to tell which car was yours in a parkinglot. But guess what? There were no parking lots! That’s because only308,000 cars were built in 1915. Very different from the over 60 millioncars that are made each year nowadays! Not everyone owned a car inmy day. Mostly it was the folks who had plenty of money. There werestill lots of horses and carriages then. And a lot of times the cars scaredthe horses since they had to share the road. People didn’t have garagesback then, either. They parked their cars in front of their house or in thebarn. They didn’t have anything like an SUV or a station wagon or a vanin those days. There were only a few different models to choose from—atouring car, a runabout, a sedan, a town car, or a coupe. Whenever wewanted to go on a long trip, we would take the train. Of course, as I gotolder, our family used the car more and more. But never as much as weuse cars today. Can you imagine life without a car, Evie? Anyway, goodluck with your new car, and do be careful!
Much love, your Granny Evelyn

Now it’s your turn to create a then and now chart. Read the article below aboutthe contrast between women in sports in the Victorian Age and today. Then fillin the then and now chart on page 38.
© 2005 Walch Publishing Content-Area Graphic Organizers: Social Studies37
Application
If you had been a woman in the Victorian Age, between 1837 and 1901,you probably would not have chosen sports as your number-oneinterest. In those days, sports were considered masculine and notsuitable for delicate females. Women did not participate in sportsbecause of the highly restrictive clothing they wore. To be physicallyactive would mean doing away with corsets, high-topped shoes, longsleeves, and high collars. But women slowly began to ask to join men insome mild athletic interests and pursuits. Slowly, sports were introducedto women—particularly those that included the company of men.
If you were among those first women in sports, you would look verydifferent from the hard-bodied women athletes of today. If you went tocollege, or if you grew up in a wealthy family, you might be among thefirst to try some of the newfangled sports, like croquet or archery. Theseyou could play without risking your femininity, and without taking offany of your tight clothes! You might also play golf—again, if you were arich girl or woman—but you might only play at a country club that hada designated Ladies Day.
If you were like most women interested in sports in Victorian days,tennis might be your game. But don’t think you would ever break asweat. You would play your game on well-manicured lawns, and youwould never stretch too hard or exert yourself too much. You wouldprobably play with men as doubles. You would never play against aman, though—what if you were to beat him?
Today, you probably don’t think anything of zipping out somewhereon your bike. But if you were a woman in the Victorian Age, riding abike would be quite revolutionary. For one thing, it would mean thatyou could go places where you might not be seen, where you might notbe safe. And you would have to get rid of your heavy skirts and tightcorsets so you could move more freely. You might even wear a crazy pairof bloomers. Bicycling and other sports were responsible for thebeginning of the loosening of women’s dress codes. Thank goodness!
Today, women can participate in whatever sport they like. They areleaders in running, bodybuilding, even baseball and football. Hard,athletic bodies are considered beautiful and powerful. Women show offtheir bodies in shorts and sports tops. But women’s and men’s sports arestill not equal. Professional male athletes still make vast sums of moneymore than their female counterparts if there is even a women’sequivalent to compare. Women’s sports have yet to be televised in thesame way as men’s sports. There is still a long way to go. How willsports for women change in your lifetime?
The Evolution of Women’s Sports

Answer the questions about comparing and contrasting to determine exactlywhat you are comparing in your then and now chart. What conclusions can youdraw based on the information you learned? Complete the then and now chartbelow. You may need to read between the lines to compare women’s sports inthe Victorian Age and now.
Content-Area Graphic Organizers: Social Studies © 2005 Walch Publishing38
Then: (Victorian Age: 1837–1901) Now
Then and NowChart
Women in Sports in the Victorian Age and Today

One of the most useful graphic tools for comparing and contrasting ideas,people, eras, situations, or events in social studies is the Venn diagram. Thediagram was named for a man named John Venn who lived in the mid-1800s.Venn was a historian and an inventor. He invented a machine that could bowlballs automatically. It is said that his machine was so good that it beat achampionship bowling team from Australia! He is best remembered for thefamous diagram that bears his name. He developed the Venn diagram as a wayto illustrate math and logic problems. Today, people use Venn diagrams tocompare and contrast many different ideas. It is particularly useful in socialstudies to compare eras, people, ideas, events, or time periods.
The Venn diagram is made by drawing two or more intersecting circles. Theparts of the circles that intersect show how the things you are comparing arealike. The parts of the circle that do not intersect show how the things are different.
© 2005 Walch Publishing Content-Area Graphic Organizers: Social Studies39
Venn Diagrams
Using VennDiagrams
Alike
Different Different
Alike(A + B)
Alike(B + C)
Alike(A + C)
Alike(A + B + C)
Different
Different
Different
A B
C
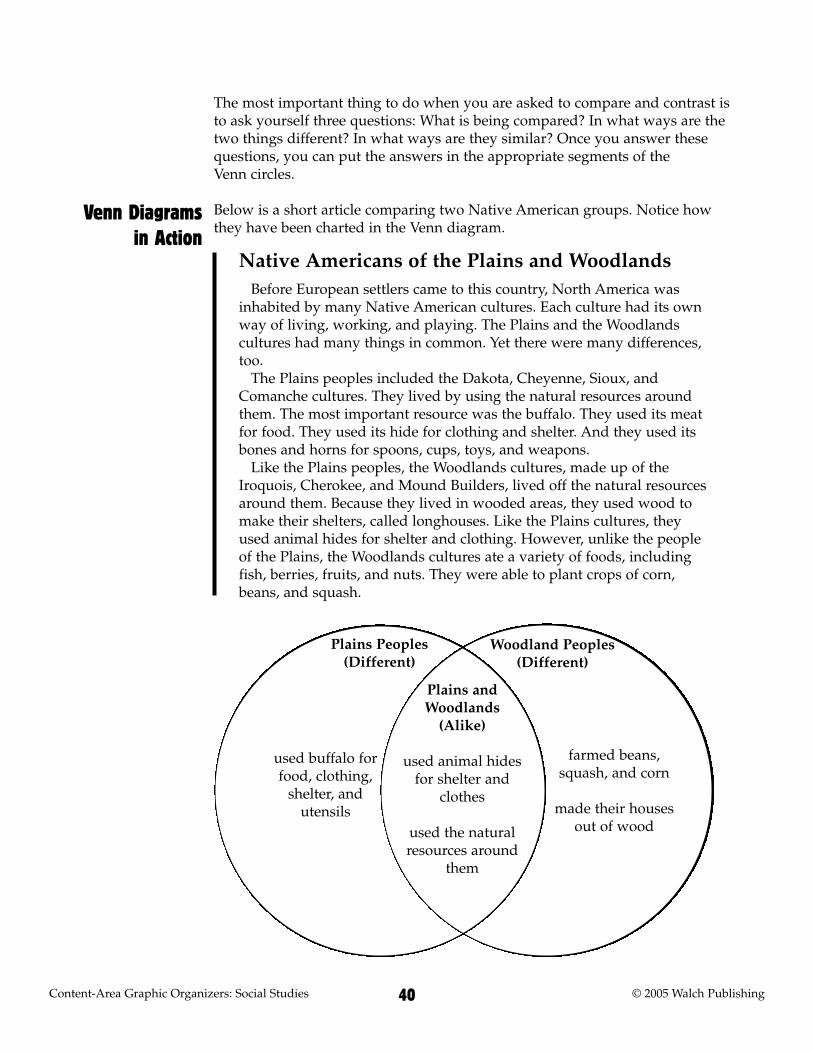
The most important thing to do when you are asked to compare and contrast isto ask yourself three questions: What is being compared? In what ways are thetwo things different? In what ways are they similar? Once you answer thesequestions, you can put the answers in the appropriate segments of the Venn circles.
Below is a short article comparing two Native American groups. Notice howthey have been charted in the Venn diagram.
Content-Area Graphic Organizers: Social Studies © 2005 Walch Publishing40
Venn Diagramsin Action
Before European settlers came to this country, North America wasinhabited by many Native American cultures. Each culture had its ownway of living, working, and playing. The Plains and the Woodlandscultures had many things in common. Yet there were many differences,too.
The Plains peoples included the Dakota, Cheyenne, Sioux, andComanche cultures. They lived by using the natural resources aroundthem. The most important resource was the buffalo. They used its meatfor food. They used its hide for clothing and shelter. And they used itsbones and horns for spoons, cups, toys, and weapons.
Like the Plains peoples, the Woodlands cultures, made up of theIroquois, Cherokee, and Mound Builders, lived off the natural resourcesaround them. Because they lived in wooded areas, they used wood tomake their shelters, called longhouses. Like the Plains cultures, theyused animal hides for shelter and clothing. However, unlike the peopleof the Plains, the Woodlands cultures ate a variety of foods, includingfish, berries, fruits, and nuts. They were able to plant crops of corn,beans, and squash.
Native Americans of the Plains and Woodlands
Plains andWoodlands
(Alike)
used animal hidesfor shelter and
clothes
used the naturalresources around
them
used buffalo forfood, clothing,
shelter, andutensils
farmed beans,squash, and corn
made their housesout of wood
Plains Peoples(Different)
Woodland Peoples(Different)

The article below discusses the two smallest states in the United States. Theyhave much in common, yet in many ways they are quite different. Read thearticle. Then fill in the Venn diagram on page 42.
© 2005 Walch Publishing Content-Area Graphic Organizers: Social Studies41
Application
If you’ve ever traveled around the United States, you know that thestates vary in size, shape, climate, landscape, and landform. While ittakes more than two days to ride all the way across the state of Texas, itwould take less than one hour to ride across Delaware. It would takeeven less time to ride across Rhode Island.
Delaware and Rhode Island are the nation’s smallest states. Delawareis the second smallest, and its little cousin, Rhode Island, ranks first.Delaware is 1,982 square miles, and Rhode Island is just 1,545. Andwhile these little states have much in common, there are many featuresthat differentiate them as well.
Both states were settled originally by Native American cultures. Bothwere the destinations of early Dutch explorers. Both states arecharacterized by beautiful coastlines. And both states rely on tourists toboost their state’s economy, particularly at their beaches.
Rhode Island and Delaware were both part of the thirteen originalstates. Delaware proudly boasts being the first state to ratify the U.S.Constitution. Rhode Island was the thirteenth state to ratify theConstitution. Rhode Island was presumably named for the Greek islandRhodes, based on its shape. Delaware was named for the first governorof Virginia, Lord de la Warr.
Rhode Island is part of New England and shares some of the ruggedhistory of shipbuilding and metalworking of New England’s heritage.Today, jewelry-making and tourism join this tiny state’s thrivingindustries. Delaware has a dual identity—one town, called Delmar, isdivided between Delaware and its neighbor to the south, Maryland (itsname is the first three letters of each state name). The Mason-Dixon lineis drawn through Delmar, dividing the United States into its officialNorth and South, so important during the Civil War. As a MiddleAtlantic state, Delaware has chemical products, food processing, andpaper products as its primary industrial manufacturing.
Delaware and Rhode Island are great states to visit. They both haveengaging places to see, such as the Winterthur Museum outsideWilmington, Delaware, which features one of the world’s best-knownnaturalistic gardens. Newport, Rhode Island, is also a popular visitingspot. It is historically a shipbuilding town and is known for the elegantmansions built by early twentieth-century millionaires who calledNewport their summer home.
If you haven’t had a chance to explore the country’s smallest states, tryit sometime. You’ll find that they are both inviting—Delaware will lureyou to its sandy Rehoboth Beach on a hot summer afternoon, whileRhode Island will tempt you with its history and its rocky shores.
The Smallest States

Complete the Venn diagram below with information about the ways that RhodeIsland and Delaware are different—and alike—as the two smallest states in thenation. Write similarities in the area where the circles intersect. Write differencesin the areas where the circles don’t intersect. Don’t forget to label both circles.
Content-Area Graphic Organizers: Social Studies © 2005 Walch Publishing42
Venn Diagram

There are other types of graphic organizers you can use to compare and contrastsubjects in social studies. When you are comparing two things that have somesimilarities, you can use a comparison matrix. This type of graphic organizer isgreat for comparing things with common elements but different content. Forexample, if you wanted to use a comparison matrix to compare Delaware andRhode Island, you might put Delaware in the spot that says “Name 1” andRhode Island in the spot that says “Name 2.” Then you could write attributesboth states share at the start of each row. For example, you could include landarea, attractions, rank as a state, and chief industries.
© 2005 Walch Publishing Content-Area Graphic Organizers: Social Studies43
ComparisonMatrixes
Attribute 1
Attribute 2
Attribute 3
Attribute 4
Attribute 5
Name 1 Name 2

Content-Area Graphic Organizers: Social Studies © 2005 Walch Publishing44
Have you ever forgotten to take a book back to the public library? Whathappened? Did you have to pay a fine? Have you ever left the milk out of thefridge? Chances are it went bad, and you couldn’t drink it.
The examples above describe events and the reasons they happened. If youforget to bring your book back to the library, then you pay a fine. If you leave themilk out of the fridge, then you can’t use it because it has spoiled. This if . . . then link represents a relationship known as cause and effect. The effect isthe thing that happens. The cause is the thing that makes it happen. Here’s howit works with the above examples:
Cause Effect
forget to take books back to library must pay fineleave milk out of fridge milk spoils
In social studies, cause and effect relationships are a way to understand whythings happened and what made them happen. So often a turn of eventstriggers other really important events, such as the assassination of ArchdukeFerdinand of Austria, which signaled the start of World War I.
Causes and effects aren’t always easy to spot when you’re reading a text. Thatrequires some critical-thinking skills. But it is important to recognize causes andeffects, because they can help you make better decisions, understandconsequences and outcomes, and solve problems. They can also help youanalyze information and events so that you can determine the accuracy of whatyou’re reading or what you’re listening to. Luckily, there are some techniquesyou can use to recognize a cause and effect pattern. One of the most importanttechniques is to ask yourself these questions:
• What caused this event or situation to happen? (What is the cause?)
• What are the consequences of this event or situation? (What is the effect?)
It is also important to remember that some events have a number of causes orconsequences. You’ll also discover that cause and effect are not necessarily laidout clearly in a historic document or text. Sometimes the effect will be statedfirst. Sometimes you will need to infer the cause based on the events or factspresented. Sometimes you will have to use prior knowledge to draw aconclusion about the effect of an event.
Showing Cause and Effect

A cause-and-effect map is a graphic organizer that can help you analyze why anevent took place and what the consequences of that event were. One way torecognize that a cause and effect pattern is being used is to look for key wordsand phrases in the text. These words signal that a cause and effect pattern isbeing used.
To make a cause and effect map, you must first determine if your text involvesone cause leading to one effect, or more complex cause and effect relationships.For example, you might find one cause leading to several effects, or one effectwith several causes. The basic approach to organizing causes and effects is thesame for each situation—you write the cause on the left and the effect on theright, with an arrow going from the cause to the effect—but the specificarrangement varies.
If you have one cause for each effect, the organizer can be very simple. For eachcause, draw an oval on the left side of the page. Write the cause in the oval. Onthe right side of the page, draw a rectangle for each effect. Write the effect in therectangle. Draw an arrow from each oval to each rectangle.
Of course, in social studies, many events have more than one cause, or morethan one effect. If you have one cause leading to several effects, draw a largerectangle on the left side of the page. Write the cause in that box. On the rightside of the page, draw a smaller rectangle for each effect. Write one effect in eachbox. Draw arrows from the cause box to each effect box.
If you have many causes leading to one effect, draw a rectangle on the left sideof the page for each cause. Write the causes in the boxes. Draw a rectangle onthe right side of the page for the effect. Write the effect in the box. Draw arrowsfrom the cause boxes to the effect box.
© 2005 Walch Publishing Content-Area Graphic Organizers: Social Studies45
Cause and EffectMaps
Cause
because
due to
since
as a result of
if
began
Effect
as a result
therefore
resulted in
thus
as a consequence
caused
led to
so
then
Using Cause andEffect Maps

Read the story that follows about Raimi Rowan, who forgot to gas up his car thenight before an important exam. See how many causes and effects you can find.Then check out the charts below and on page 47 to see if you found them all.
Content-Area Graphic Organizers: Social Studies © 2005 Walch Publishing46
Cause and EffectMaps in Action
It was the big day. The last exam ever in college. The last test beforemedical school. The last day in college before Raimi began his journey todiscover the cure for the common cold. The most important day ever. Ifhe didn’t do well on this exam, he would lose everything.
He woke with a start—he had overslept. No matter—he would skipbreakfast. All that mattered was that he get to the exam on time.
He dressed quickly, got to his car, and began his short drive to thecollege. He looked at the gas gauge. Darn! He had meant to put somegas in last night. Oh well, he’d get there. It wasn’t too far. Just as heturned the first corner, the car began to stall. He wasn’t going to make it.He pulled the car to the side of the road. Please let someone come by,please, please! Five minutes went by, then ten. He was too impatient tojust wait there. So he started for the gas station four blocks away. Bynow it was 8:10. The exam had begun. He knew he wasn’t going to makeit. His dream was shattered. There were no make-up exams. This hadbeen his only chance. Now the world would have to wait for someoneelse to discover the cure for the common cold.
Raimi’s Regret
Cause:Raimi forgot to fill his gas tank.
Effect:He ran out of gas.
Effect:He missed his exam.
Effect:He wouldn’t get to go to medicalschool to discover the cure for thecommon cold.
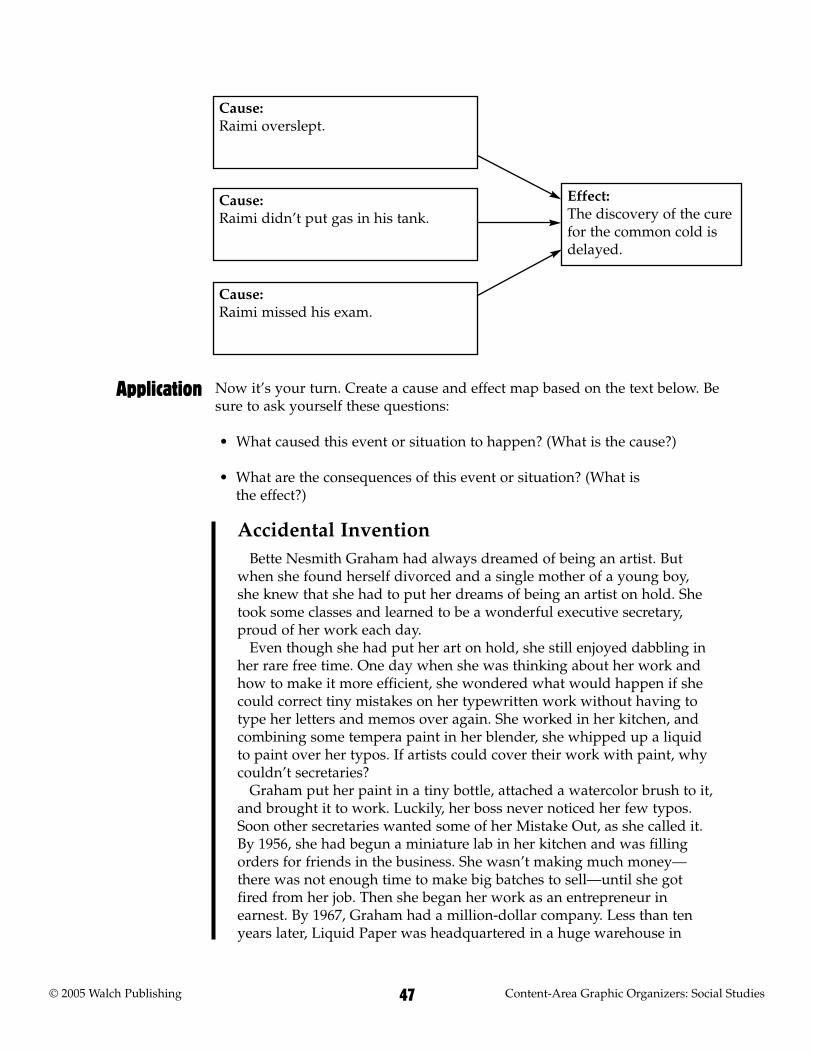
Now it’s your turn. Create a cause and effect map based on the text below. Besure to ask yourself these questions:
• What caused this event or situation to happen? (What is the cause?)
• What are the consequences of this event or situation? (What is the effect?)
© 2005 Walch Publishing Content-Area Graphic Organizers: Social Studies47
Effect:The discovery of the curefor the common cold isdelayed.
Cause:Raimi overslept.
Cause:Raimi didn’t put gas in his tank.
Cause:Raimi missed his exam.
Application
Bette Nesmith Graham had always dreamed of being an artist. Butwhen she found herself divorced and a single mother of a young boy,she knew that she had to put her dreams of being an artist on hold. Shetook some classes and learned to be a wonderful executive secretary,proud of her work each day.
Even though she had put her art on hold, she still enjoyed dabbling inher rare free time. One day when she was thinking about her work andhow to make it more efficient, she wondered what would happen if shecould correct tiny mistakes on her typewritten work without having totype her letters and memos over again. She worked in her kitchen, andcombining some tempera paint in her blender, she whipped up a liquidto paint over her typos. If artists could cover their work with paint, whycouldn’t secretaries?
Graham put her paint in a tiny bottle, attached a watercolor brush to it,and brought it to work. Luckily, her boss never noticed her few typos.Soon other secretaries wanted some of her Mistake Out, as she called it.By 1956, she had begun a miniature lab in her kitchen and was fillingorders for friends in the business. She wasn’t making much money—there was not enough time to make big batches to sell—until she gotfired from her job. Then she began her work as an entrepreneur inearnest. By 1967, Graham had a million-dollar company. Less than tenyears later, Liquid Paper was headquartered in a huge warehouse in
Accidental Invention
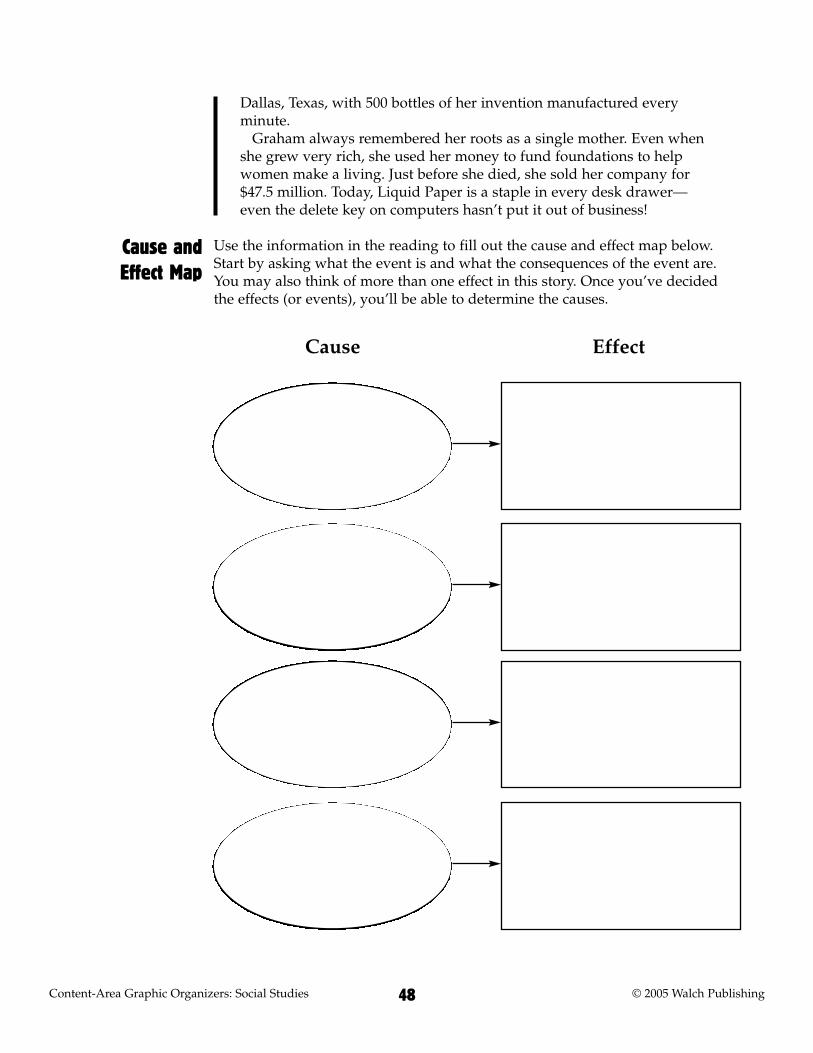
Use the information in the reading to fill out the cause and effect map below.Start by asking what the event is and what the consequences of the event are.You may also think of more than one effect in this story. Once you’ve decidedthe effects (or events), you’ll be able to determine the causes.
Content-Area Graphic Organizers: Social Studies © 2005 Walch Publishing48
Dallas, Texas, with 500 bottles of her invention manufactured everyminute.
Graham always remembered her roots as a single mother. Even whenshe grew very rich, she used her money to fund foundations to helpwomen make a living. Just before she died, she sold her company for$47.5 million. Today, Liquid Paper is a staple in every desk drawer—even the delete key on computers hasn’t put it out of business!
Cause and Effect Map
Cause Effect

Are you a good problem solver? It takes special skills to be good at solving aproblem. One of the most important skills is learning how to see what theproblem is in the first place. It’s easy to get overwhelmed by the details and notsee the real problem.
One of life’s goals is to meet challenges, figure out how to solve them, and growstronger. In history, problems and challenges are what we study. One interestingaspect of history is seeing how people choose to solve the challenges they face.Once we understand how people solve problems, we can become better at itourselves. That’s one of the greatest advantages of studying history and social studies!
When reading social studies or history texts, it is often helpful to identify whatproblem or challenge is being addressed. Then it is important to analyze theaction people take to solve the problem. Finally, you can then see the result, orwhat happens as a result of the action. This process of identifying the problemcan be done by asking these questions:
• What is the problem or challenge that people want to address?
• What action do people take to try to address the challenging or problematicsituation?
• What happens as a result of the action?
You can organize this information graphically by using a problem/solutionchart. This type of organizer is a cousin to the cause and effect organizer, sincesolving a problem requires knowing what the cause and effect of an issue or anevent really are.
© 2005 Walch Publishing Content-Area Graphic Organizers: Social Studies49
Problem/SolutionCharts
UsingProblem/Solution
Charts

Read the following article about the Apollo 13 mission to the Moon in 1970. Asyou read, stop and think about what the problem is. Then take a moment topredict what you think the action to solve the problem should be. Read to findout what people did to solve the problem and what happened as a result. Thensee how this information is shown on the problem/solution chart below.
Content-Area Graphic Organizers: Social Studies © 2005 Walch Publishing50
Problem/SolutionCharts in Action
For eight long days in April of 1970, three astronauts—Jim Lovell, FredHaise, and Jack Swigert—were kept alive by the extraordinary teamworkof a group of people who couldn’t even see them from the ground.
Apollo 13 was thought of as a fairly routine Moon flight. Thecrewmembers were to collect rocks from the Fra Mauro region of theMoon. But fifty-five hours into the flight, a failure occurred in the servicemodule oxygen system. This meant that there was not enough oxygen,water, or power to continue the mission to the Moon. Instead, theastronauts were lucky to live through their mission at all.
What saved them was the ingenuity of the people who worked inHouston, Texas, the home base for the lunar project. The members of thelarge land crew were forced to think as if they were the astronautsthemselves. What would they do to save power? The crew stayed upovernight, never leaving the Houston Control area, in order to thinkcreatively about how to help the Apollo 13 crew stay alive. Luckily theirefforts paid off. They figured out a makeshift solution to keep the energyand oxygen from draining out of the astronauts’ small module.However, there have been no trips to the Moon since the Apollo 13near disaster.
The Successful Failure
Problem: Due to an accident, the crew of Apollo 13 were in danger oflosing oxygen, water, and power.
Action: The Houston-based crewstayed up through the night tocome up with a solution abouthow to save power.
Results: The crew returnedsafely. However, there hasnot been another mission tothe moon since 1970.

Now it’s your turn to identify a problem and the ways the problem is solved.Read the article below about the difficult election night in 2000, when there wasno clear winner of the presidential election. As you read, think about what theproblem really is, and what the solution should be. Then fill out theproblem/solution chart on page 52.
© 2005 Walch Publishing Content-Area Graphic Organizers: Social Studies51
Application
Most election nights are long, but none was longer than the one thattook place on November 6, 2000. That night, there was no official winnerof the election.
On November 6, most voting areas had reported their votes. The racebetween then Vice President Al Gore and Texas Governor George W.Bush was tighter than any election in the recent past. Late Election night,news organizations predicted Gore would win. Later still, they withdrewtheir predictions for Gore and said that Bush would win. By 5:00 A.M.,they withdrew that prediction as well. There was no clear winner.
Why was it so hard to tell who was the winner? One of the key issuesin the election was the confusing ballots and defective voting machinesthat were used in Florida. People there voted by punching a voting cardand creating a hole next to the name of the person they wanted to elect.The little piece of paper that is punched out of the voting card is called achad. If the punch isn’t complete, then it is hard to tell whom the voterreally wanted for president.
People still disagree about who really won the election. The decisionwent to the Florida Supreme Court and then to the U.S. Supreme Court.But not everyone agreed with the courts’ decisions. Bush was declaredthe winner by just 537 votes. Those who favored Gore were bitterlydisappointed. Those who favored Bush were thrilled. Today, the electionprocess in Florida has been improved with new electronic voting andbetter vote counting. No one wants to see a repeat of election night 2000.
The Long Night

Use the reading on page 51 to fill in the problem/solution chart below. Write theproblem in the top box. Write the action taken to address the problem in the“Action” box. Write the results of the action taken in the “Results” box.
Content-Area Graphic Organizers: Social Studies © 2005 Walch Publishing52
Action: Results:
Problem/SolutionChart
Problem:
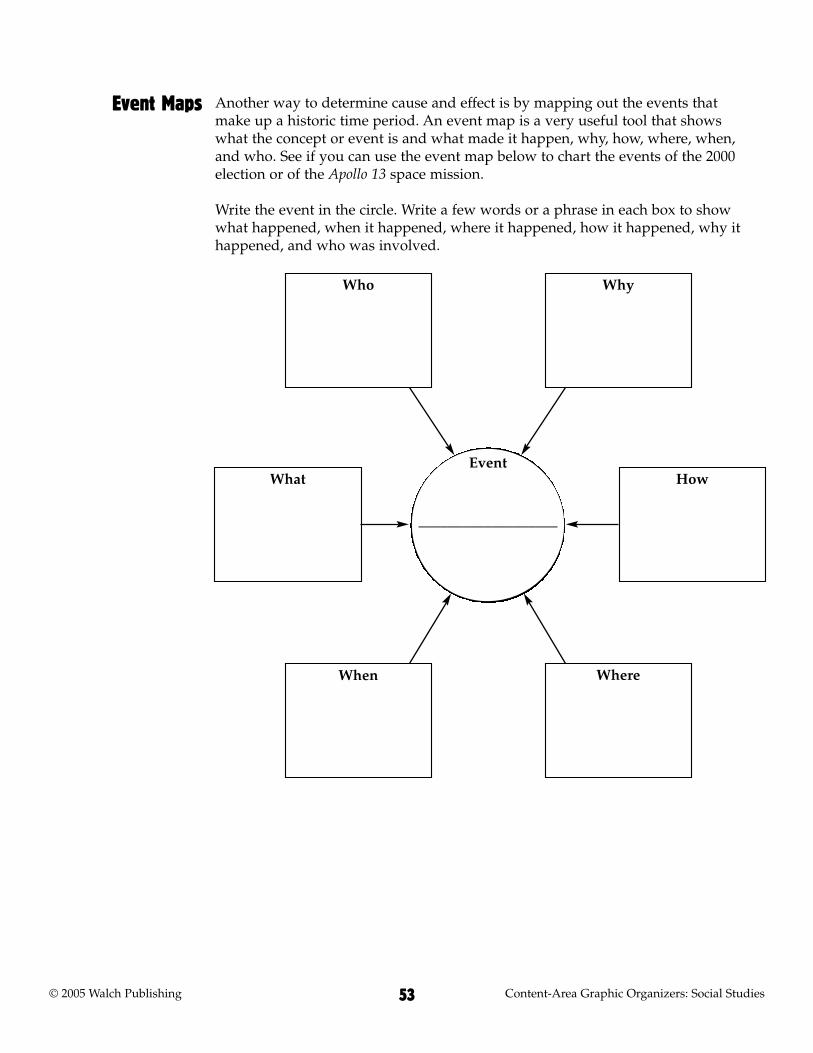
Another way to determine cause and effect is by mapping out the events thatmake up a historic time period. An event map is a very useful tool that showswhat the concept or event is and what made it happen, why, how, where, when,and who. See if you can use the event map below to chart the events of the 2000election or of the Apollo 13 space mission.
Write the event in the circle. Write a few words or a phrase in each box to showwhat happened, when it happened, where it happened, how it happened, why ithappened, and who was involved.
© 2005 Walch Publishing Content-Area Graphic Organizers: Social Studies53
Event Maps
Who Why
What
When
How
Where
Event
___________________

Content-Area Graphic Organizers: Social Studies © 2005 Walch Publishing54
As you have learned, graphic organizers are very helpful when you are reading.They are also helpful when you are writing. In this lesson, you’ll learn aboutusing graphic organizers as you write history or social studies assignments.More often than not, writing for social studies classes involves both research andanalysis. Graphic organizers can help you get your thoughts together, gatheryour notes, and present your information clearly in writing. Once you knowhow to use these writing tools, you’ll find that you can use them over and overagain in your social studies classes.
Graphic organizers are a great tool to use as you plan your writing. Most ofyour writing is probably done using the writing process. The writing processhelps writers organize their thoughts. It also helps writers avoid frustration anduse their time efficiently. There are four basic steps in the writing process:prewriting, writing, revising, and publication. In this lesson, we will look atgraphic organizers that you can use for the first two steps, prewriting andwriting.
We will use a model question to show how you can use graphic organizers towrite about social studies. Here is the model question:
• Choose an explorer from the twentieth century. Write about his or herexploration and how the exploration made an impact on society.
Now choose a topic that interests you from the list on page 55 and practiceusing each graphic organizer with the topic you chose.
Writing

1. The Civil War changed the lives of African Americans in the United States.In what ways were their lives affected?
2. Geography plays an important role in the character of a region. Choosetwo world regions. Compare and contrast the geography of both regions.Discuss the ways that geography affects the type of work and culturefound in each area.
3. During the nineteenth century, wars were fought in many parts of theworld. They included revolutions, wars of conquest, and civil wars.Choose one war from this period. Discuss the causes, combatants, andconsequences of this war.
4. Research the difference between a democracy and a republic. Find out whythe framers of the U.S. Constitution chose to make the United States arepublic rather than a democracy.
5. What do you think might have happened if the U.S. Constitution had beenwritten this year instead of over 200 years ago? In what ways would thedocument be different? How would it reflect the needs of our currentsociety?
6. What were the events that led up to the 1955 bus boycott in Montgomery,Alabama? What happened as a result of the boycott?
7. Trace the evolution of women’s clothing in the twentieth century. In whatways do changes in women’s fashion reflect the changing roles of womenduring that period?
8. Trace the history of your state or territory. What people and events had themost influence in shaping this history?
9. Interview an older family member or friend. Find out what inventionswere new when he or she was the age you are today. In what ways didthese inventions affect society?
10. Think about some important events that have taken place since you wereborn. In terms of world history, what single event do you consider themost important? Describe the event. Then give reasons for your choice.
© 2005 Walch Publishing Content-Area Graphic Organizers: Social Studies55
Social Studies Research Topics

The first part of the writing process is prewriting. This is the work you do beforeyou actually begin to write. It is the most important part of your writing. Oncethe prewriting stage is done, you’ll have done most of the planning for yourwork. The only thing left will be to put the sentences to paper. That part will beeasy because you will already have organized everything you want to say!
The prewriting stage includes several different tasks. You need to choose a topic,narrow it, establish a purpose for writing, research the topic, and plan yourwriting by creating an outline. For the purposes of this lesson, either you havealready chosen a topic from the list on page 55, or you are using the modelquestion. So we will start with narrowing the topic.
Writing topics are often very broad. The first step in prewriting is narrowing thetopic. Start by identifying several subtopics that fit the requirements of thequestion. Then decide which of them you find most interesting. Using the modelquestion, you might use your prior knowledge to identify areas of exploration inthe twentieth century. Your experience tells you that there were several areas,including:
• space
• Antarctica
• the oceans
• the North Pole
• rain forests
• the Himalayan region
Let’s say that you choose Antarctica. Now that you have an area of exploration,you need to choose an explorer. If you already know a bit about Antarctica, youmay be able to do this right away. If not, you may need to do a little readingfirst. Let’s say that you decide to write about Sir Ernest Shackleton’s 1914–1916Antarctic expedition. You have successfully taken a broad topic—twentieth-century explorers—and narrowed it to a manageable topic.
Content-Area Graphic Organizers: Social Studies © 2005 Walch Publishing56
Prewriting
Narrowing theTopic
Once you’ve chosen a writing topic, the next step is to define your purpose forwriting. The purpose is what you are trying to achieve by writing. Are youtrying to explain how something happened, or trying to present informationabout a topic? Do you want to describe something? Perhaps you want toanalyze an event, with the causes that led up to it and the consequences of theevent. You might want to persuade someone to do something, or convince themthat an idea or a theory is correct. You might just want to express an idea or anopinion. Each of these purposes will affect the way you write your essay. It’spossible that you will include elements of more than one purpose. But it isimportant to decide your main approach. In social studies, most essays have oneof the following purposes:
• to inform or explain
• to describe
• to analyze
• to persuade
• to express thoughts or opinions
Look back at your narrowed topic. Why are you writing about this topic? Forthe Shackleton paper, imagine that you have decided to describe the expedition.This means that you will describe the people, places, and events of the trip. Youwill also use analysis to decide how the trip made an impact on society.
© 2005 Walch Publishing Content-Area Graphic Organizers: Social Studies57
Defining a Purpose for Writing
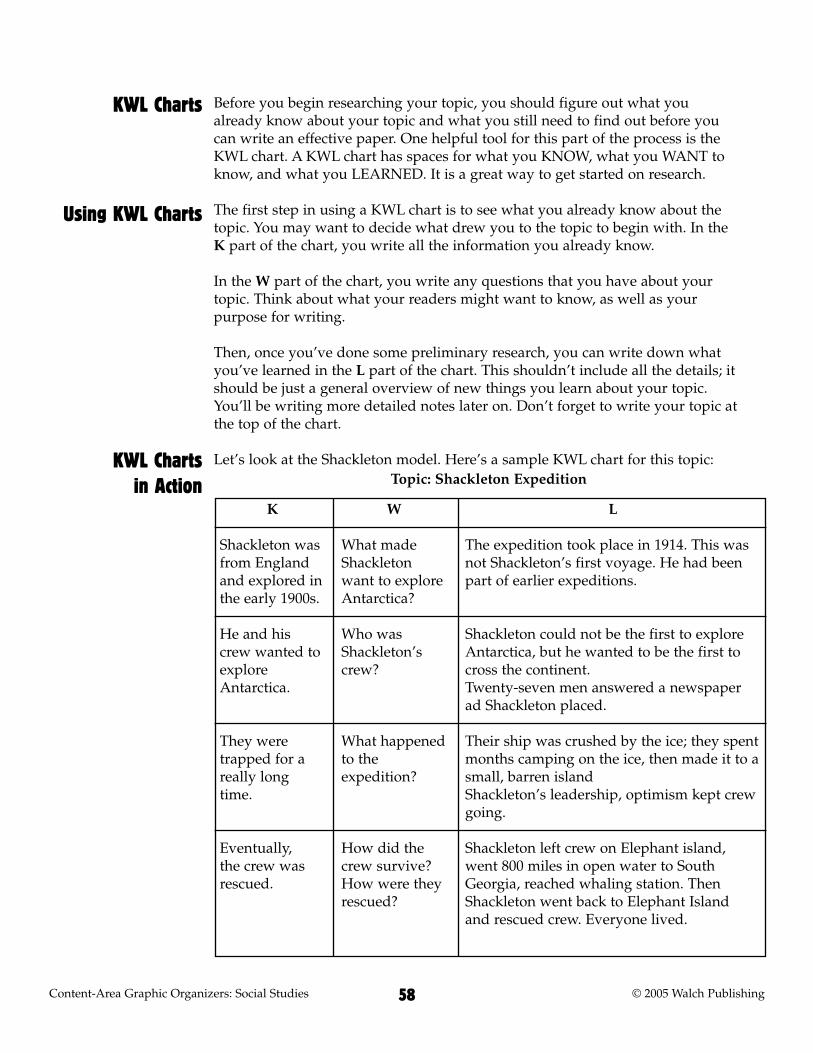
Before you begin researching your topic, you should figure out what youalready know about your topic and what you still need to find out before youcan write an effective paper. One helpful tool for this part of the process is theKWL chart. A KWL chart has spaces for what you KNOW, what you WANT toknow, and what you LEARNED. It is a great way to get started on research.
The first step in using a KWL chart is to see what you already know about thetopic. You may want to decide what drew you to the topic to begin with. In theK part of the chart, you write all the information you already know.
In the W part of the chart, you write any questions that you have about yourtopic. Think about what your readers might want to know, as well as yourpurpose for writing.
Then, once you’ve done some preliminary research, you can write down whatyou’ve learned in the L part of the chart. This shouldn’t include all the details; itshould be just a general overview of new things you learn about your topic.You’ll be writing more detailed notes later on. Don’t forget to write your topic atthe top of the chart.
Let’s look at the Shackleton model. Here’s a sample KWL chart for this topic:
Content-Area Graphic Organizers: Social Studies © 2005 Walch Publishing58
KWL Charts
KWL Charts in Action
Using KWL Charts
K
Shackleton wasfrom Englandand explored inthe early 1900s.
He and hiscrew wanted toexploreAntarctica.
They weretrapped for areally longtime.
Eventually, the crew wasrescued.
W
What madeShackletonwant to exploreAntarctica?
Who wasShackleton’screw?
What happenedto theexpedition?
How did thecrew survive?How were theyrescued?
L
The expedition took place in 1914. This wasnot Shackleton’s first voyage. He had beenpart of earlier expeditions.
Shackleton could not be the first to exploreAntarctica, but he wanted to be the first tocross the continent.Twenty-seven men answered a newspaperad Shackleton placed.
Their ship was crushed by the ice; they spentmonths camping on the ice, then made it to asmall, barren islandShackleton’s leadership, optimism kept crewgoing.
Shackleton left crew on Elephant island,went 800 miles in open water to SouthGeorgia, reached whaling station. ThenShackleton went back to Elephant Island and rescued crew. Everyone lived.
Topic: Shackleton Expedition

Use the blank KWL chart below to chart the information you know, would liketo know, and have learned about the topic you have chosen.
© 2005 Walch Publishing Content-Area Graphic Organizers: Social Studies59
Application
KWhat I KNOW
WWhat I WANT to Know
LWhat I LEARNED
Topic: _______________________________________
The next prewriting step is collecting information about the topic. This usuallycalls for some research. Most people choose to do research by using reliableInternet sites and library books on the topic, taking accurate notes as they findnew information.
Remember, taking notes does not mean copying information word for word. Thekey to good note-taking is to write down only key facts, with a clear reference tothe source of the information. Copying whole sentences can make it hard toremember which material comes from another source and which is your own.Using someone else’s words is plagiarism. Whether it is done intentionally or bymistake, plagiarism in a paper will result in a failing grade. You can easily avoidproblems with research by keeping careful track of your sources and by jottingdown key phrases and words rather than whole sentences.
There are several good ways to keep track of notes. One approach is to use 3 � 5cards and keep one fact on each card. Another way is to use a graphic organizerlike the one on the next page. This organizer has a space for everything youneed to keep track of.
This organizer has a section for each information source you use. Start bywriting down information about the source. If it is a book, write down the titleof the book, the name of the author, and any other details your teacher requiresfor a bibliography, such as the year of publication and the name of the publisher.If the source is a web page, write down the name of the page, the page’s author,if available, and the URL for the page. For each source, use the other boxes inthat section to note important information. For each note, write down thenumber of the page where you found the information. Then write a few briefphrases to capture the information. Don’t copy word for word!
Content-Area Graphic Organizers: Social Studies © 2005 Walch Publishing60
Note-TakingOrganizers
Using Note-TakingOrganizers

This is what a note-taking organizer for the paper on Shackleton might look like:
© 2005 Walch Publishing Content-Area Graphic Organizers: Social Studies61
Note-TakingOrganizers
in ActionResearch Source 1Author: Lansing,AlfredTitle: Endurance
Note: p. 12S. bought shipcalled Polaris,renamed itEndurance afterfamily motto: “Byendurance weconquer.”
Note: p. 125,000 peoplevolunteered to bepart of theexpedition.
Note: p. 12-13S. picked 27 menin all. Some werepeople he hadsailed with before.Others he pickedby intuition. Forexample, askedDr. AlexanderMacklin if hecould sing.
Research Source 2Author: Rubin,JeffTitle: EncyclopediaEncarta Internethttp://encarta.msn.com/text_761558323/Shackleton_Sir_Ernest_Henry.html
Note: intro: S. was born1874, died 1922
Note: First expeditions: S. had tried a fewexpeditionsearlier, includingone with RobertFalcon Scott. S.got sick, thenwent again in1907.
Note: First expeditions:S. was knighted in1909 for settingthe record for thefarthest southernlatitude reached.
Research Source 3Author: Khan,AdamTitle: All in YourHeadwww.youmeworks.com
Note: p. 2Endurance trappedin ice. Crew spent10 months waitingfor ice to breakup. Took lifeboatsfrom Endurance,dragged them 9miles over ice,sailed to lifelessElephant Island.
Note: p. 3S. took 5 crewmenfrom ElephantIsland over longpassage to St.George’s.
Note: p. 4S., 2 crewmenclimbed oversteep mountainson St. George’s.No one hadcrossed thembefore. Survived;arrived at whalingstation in tatteredclothes. Thenwent back toElephant Island torescue rest ofcrew.
Research Topic: Ernest Shackleton and the Endurance expedition
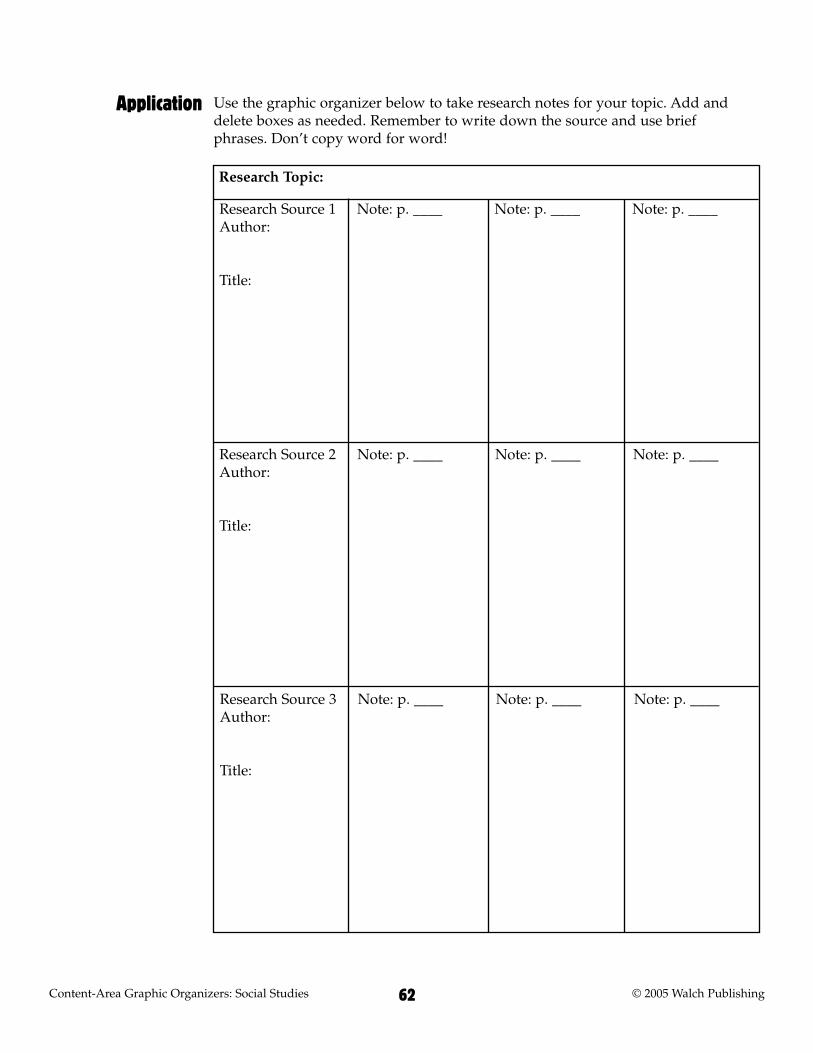
Use the graphic organizer below to take research notes for your topic. Add anddelete boxes as needed. Remember to write down the source and use briefphrases. Don’t copy word for word!
Content-Area Graphic Organizers: Social Studies © 2005 Walch Publishing62
Application
Research Source 1Author:
Title:
Note: p. ____ Note: p. ____ Note: p. ____
Research Source 2Author:
Title:
Note: p. ____ Note: p. ____ Note: p. ____
Research Source 3Author:
Title:
Note: p. ____ Note: p. ____ Note: p. ____
Research Topic:

The next step in the prewriting process is planning. This is where you decidewhat you want to include in your writing and what you can leave out. This isalso where you decide what supporting details to include. You can use anoutline to help your planning.
An outline is an organized overview of an essay, written in short phrases. It is atype of map or scheme that shows the way your writing will progress logically.The purpose of an outline is to organize your information. Outlines help youdetermine the beginning, middle, and end of your work. They can show howyour ideas are related to one another.
Outlines can be either informal or formal. We’ll look at a formal outline first.
A formal outline is often used in informational or expository writing. Formaloutlines don’t include complete sentences or punctuation. Each line includes justa few important words or a key phrase. Later on, you will turn these into topicsentences and supporting details for the paragraphs of your essay.
A formal outline follows a very specific pattern. The most important informationis written along the left of the page. Less important information is indented—setin—from the left. The farther from the left of the page a piece of information is,the less important it is.
The most important pieces of information are the main points you want to makeor topics you want to cover. They are labeled with Roman numerals. Subtopicsunder each topic are indented and labeled with capital letters. Details thatsupport the subtopics are indented even more and labeled with regular (Arabic)numerals. If you need to add another level of detail, you can indent again, usinglowercase letters to identify these details. Once the outline is complete, you cantell at a glance which information is most important.
Begin your outline by writing the title of your paper at the top of the page. Next,identify the main topics you want to address or points you want to make inyour paper. Write the Roman numeral I on the left side of the page. Write yourmost important topic or point next to the I. This is usually something that willintroduce the essay and explain what you are trying to say, such as your thesisstatement.
Now, identify any subtopics in this main topic, or ideas that clarify the mainpoint. Under the first main point, indented a little from the left, write a capitalletter A. Write a subtopic or a piece of information that supports your point nextto the letter A. Do the same thing for any other facts that support this point,using a different capital letter for each.
© 2005 Walch Publishing Content-Area Graphic Organizers: Social Studies63
Outlines
Formal Outlines
Using FormalOutlines

Next, identify any details or examples that develop your supporting ideas.Under the first subtopic, indented a little more from the left, write an Arabicnumeral 1. Write a detail or an example next to the numeral. Do the same thingfor any other details or examples that develop this point, using a differentnumeral for each.
Continue with the same pattern for your other main topics, using Romannumerals for the main topics, capital letters for subtopics, and Arabic numeralsfor details and examples. The last main point should offer a conclusion to therest of the points. It often includes a restatement of the main idea. When youfinish, you will have the basic structure for your essay.
A formal outline pattern looks like this:
TitleI. Introduction
A. Opening statement
B. Main idea or thesis
II. First major idea or topic
A. Subtopic or clarifying idea
1. Detail or example
2. Detail or example
B. Subtopic or clarifying idea
1. Detail or example
2. Detail or example
III. Second major idea or topic
A. Subtopic or clarifying idea
1. Detail or example
2. Detail or example
B. Subtopic or clarifying idea
1. Detail or example
2. Detail or example
IV. Conclusion
A. Restatement of main idea
B. Final statement
The number of Roman numerals, letters, and Arabic numerals depends on howmany topics and subtopics you include in your paper.
Content-Area Graphic Organizers: Social Studies © 2005 Walch Publishing64
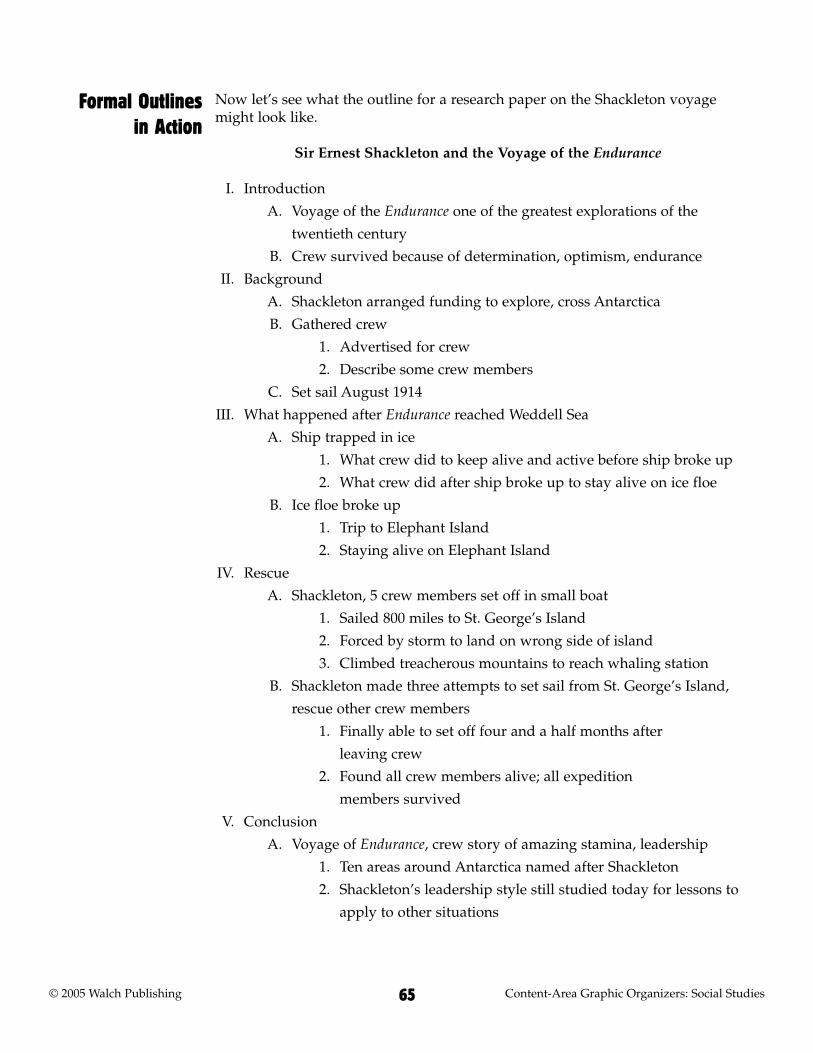
Now let’s see what the outline for a research paper on the Shackleton voyagemight look like.
Sir Ernest Shackleton and the Voyage of the Endurance
I. Introduction
A. Voyage of the Endurance one of the greatest explorations of the
twentieth century
B. Crew survived because of determination, optimism, endurance
II. Background
A. Shackleton arranged funding to explore, cross Antarctica
B. Gathered crew
1. Advertised for crew
2. Describe some crew members
C. Set sail August 1914
III. What happened after Endurance reached Weddell Sea
A. Ship trapped in ice
1. What crew did to keep alive and active before ship broke up
2. What crew did after ship broke up to stay alive on ice floe
B. Ice floe broke up
1. Trip to Elephant Island
2. Staying alive on Elephant Island
IV. Rescue
A. Shackleton, 5 crew members set off in small boat
1. Sailed 800 miles to St. George’s Island
2. Forced by storm to land on wrong side of island
3. Climbed treacherous mountains to reach whaling station
B. Shackleton made three attempts to set sail from St. George’s Island,
rescue other crew members
1. Finally able to set off four and a half months after
leaving crew
2. Found all crew members alive; all expedition
members survived
V. Conclusion
A. Voyage of Endurance, crew story of amazing stamina, leadership
1. Ten areas around Antarctica named after Shackleton
2. Shackleton’s leadership style still studied today for lessons to
apply to other situations
© 2005 Walch Publishing Content-Area Graphic Organizers: Social Studies65
Formal Outlines in Action
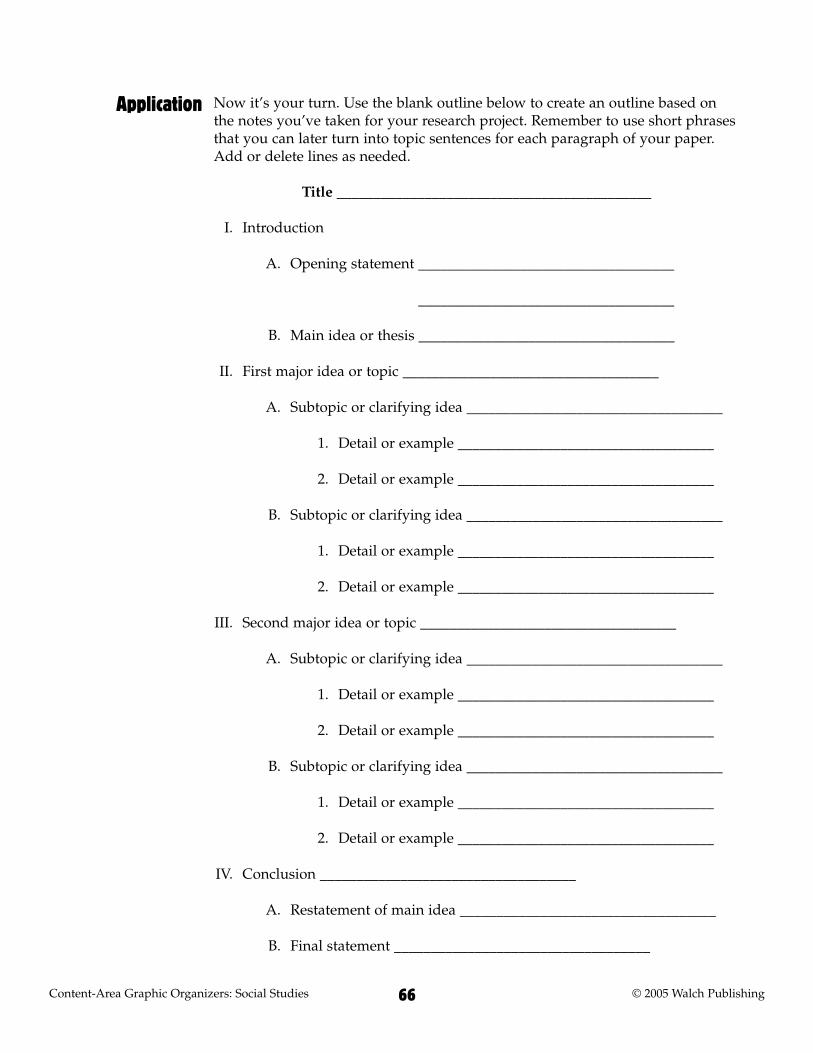
Now it’s your turn. Use the blank outline below to create an outline based onthe notes you’ve taken for your research project. Remember to use short phrasesthat you can later turn into topic sentences for each paragraph of your paper.Add or delete lines as needed.
Title ___________________________________________
I. Introduction
A. Opening statement ___________________________________
___________________________________
B. Main idea or thesis ___________________________________
II. First major idea or topic ___________________________________
A. Subtopic or clarifying idea ___________________________________
1. Detail or example ___________________________________
2. Detail or example ___________________________________
B. Subtopic or clarifying idea ___________________________________
1. Detail or example ___________________________________
2. Detail or example ___________________________________
III. Second major idea or topic ___________________________________
A. Subtopic or clarifying idea ___________________________________
1. Detail or example ___________________________________
2. Detail or example ___________________________________
B. Subtopic or clarifying idea ___________________________________
1. Detail or example ___________________________________
2. Detail or example ___________________________________
IV. Conclusion ___________________________________
A. Restatement of main idea ___________________________________
B. Final statement ___________________________________
Content-Area Graphic Organizers: Social Studies © 2005 Walch Publishing66
Application

An informal outline is very similar to a formal outline. Like a formal outline, itgives an overview of the way the paper will be developed. Unlike a formaloutline, it does not use a system of Roman numerals, capital letters, and Arabicnumerals. An informal outline may use short phrases, or it may use completesentences for the main topics and supporting points. It includes an indication ofhow each supporting point will be developed, such as by using examples,descriptions, comparisons, and so forth. An informal outline often begins with athesis statement—a statement of what the essay is designed to show.
Informal outlines are a good way of organizing information when a formaloutline is not really required. Because informal outlines often include completesentences, it is easy to move from the outline to a first draft of the essay. Theseoutlines can be especially useful in an exam setting, where you don’t have thetime or resources for a formal outline.
Here is an example of an informal outline for an essay about the voyage of theEndurance.
Topic: Sir Ernest Shackleton and the Voyage of the Endurance
© 2005 Walch Publishing Content-Area Graphic Organizers: Social Studies67
Informal Outlines
Using InformalOutlines
Informal Outlinesin Action
Thesis statement: The voyage of the Endurance was one of the greatestexplorations of the twentieth century. The crew survived because of a mixtureof determination, optimism, and endurance—and the leadership skills of SirErnest Shackleton.
Support Statement 1: Sir Ernest Shackleton was already an experiencedexplorer when he put the expedition together. Developed by: description of Shackleton’s experience, how he set up theexpedition, hired crew, etc. Quote: “help wanted” ad.
Support Statement 2: All went well until after the expedition left SouthGeorgia Island, heading for the Weddell Sea. By January 19, the Endurance wassolidly frozen in pack ice, and the struggle to survive began. Developed by: description of what crew did to survive in blizzards, below-zero temperatures of Antarctic winter, preparations they made for possibilityof ship being crushed by ice
Support Statement 3: On October 23, after 281 days locked in the ice, theEndurance was crushed by the pressure, and the next phase of the ordeal beganas the crewmen used open boats to try to reach land.Developed by: description of setting up camp on the ice, dragging boats milesto reach open water, optimism despite desperate situation; quote from S.:“After long months of ceaseless anxiety and strain . . . we have been compelledto abandon the ship, which is crushed beyond all hope of ever being righted,we are alive and well, and we have stores and equipment for the task that liesbefore us. The task is to reach land with all the members of the Expedition”;description of trip to barren Elephant Island; detail: first time they touchedland in 16 months
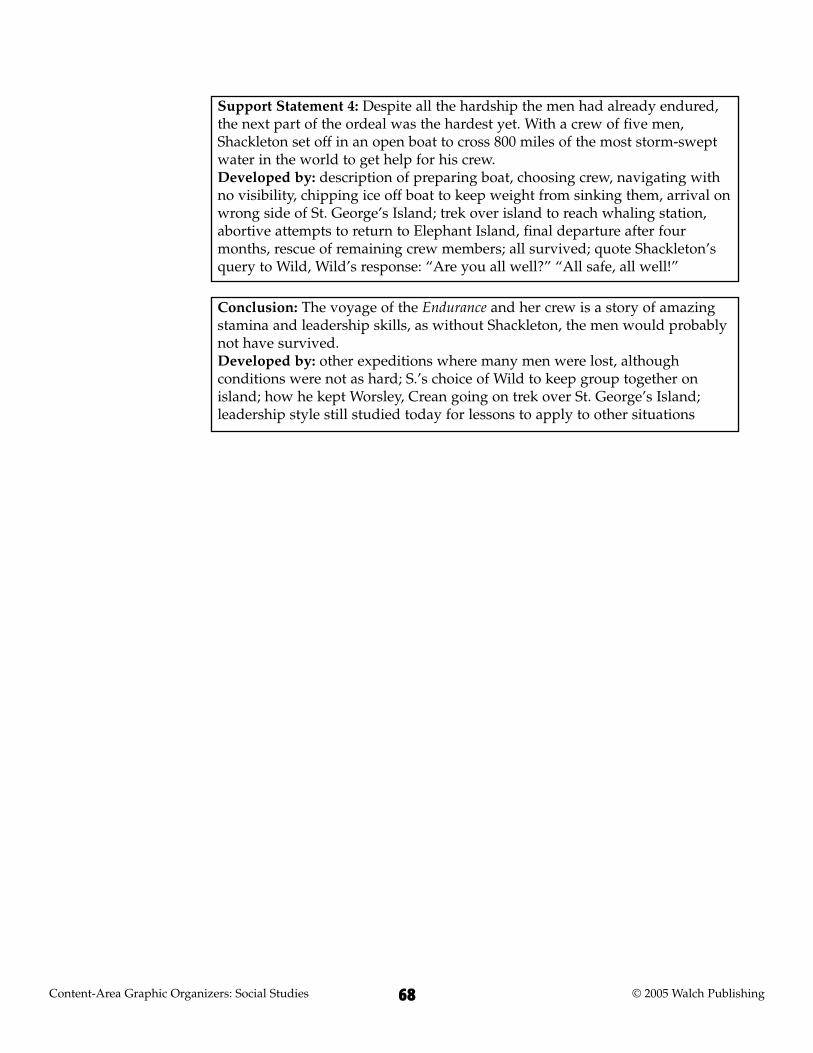
Content-Area Graphic Organizers: Social Studies © 2005 Walch Publishing68
Support Statement 4: Despite all the hardship the men had already endured,the next part of the ordeal was the hardest yet. With a crew of five men,Shackleton set off in an open boat to cross 800 miles of the most storm-sweptwater in the world to get help for his crew.Developed by: description of preparing boat, choosing crew, navigating withno visibility, chipping ice off boat to keep weight from sinking them, arrival onwrong side of St. George’s Island; trek over island to reach whaling station,abortive attempts to return to Elephant Island, final departure after fourmonths, rescue of remaining crew members; all survived; quote Shackleton’squery to Wild, Wild’s response: “Are you all well?” “All safe, all well!”
Conclusion: The voyage of the Endurance and her crew is a story of amazingstamina and leadership skills, as without Shackleton, the men would probablynot have survived.Developed by: other expeditions where many men were lost, althoughconditions were not as hard; S.’s choice of Wild to keep group together onisland; how he kept Worsley, Crean going on trek over St. George’s Island;leadership style still studied today for lessons to apply to other situations

Try organizing your notes into the informal outline below. Say how you willdevelop each supporting point. Possible approaches include example,comparison, contrast, definition, description, narrative, quotations, andparaphrases of research material. Add or delete boxes as needed.
Topic:
© 2005 Walch Publishing Content-Area Graphic Organizers: Social Studies69
Application
Thesis statement:
Support Statement 1:
Developed by:
Support Statement 2:
Developed by:
Support Statement 3:
Developed by:
Support Statement 4:
Developed by:
Conclusion:
Developed by:

Content-Area Graphic Organizers: Social Studies © 2005 Walch Publishing70
Once you’ve done all the prewriting, it’s time to actually start writing. Graphicorganizers can help you here, too. For the writing stage, you can use a writingorganizer. This will create the skeleton of the sentences you want to include.This is a place where you can begin to do some preliminary editing and cullingout of unnecessary information.
An expository writing organizer is a great way to lay out most of your workbefore you begin writing. Like an outline, an expository writing organizer canbe formal or informal. The formal organizer breaks your paragraphs intoheadings, much like the outline. However, the expository writing organizerincludes full sentences that you can transfer directly into your writing, as well astransition words or phrases to connect paragraphs and ideas. Once you havecompleted this part of the process, you should have a first draft of your paper.
To complete the expository writing organizer, start by writing the title of youressay at the top. In the first box, write the opening sentences of your paper. Thisshould include your thesis statement—a sentence that tells your readers whatthe essay will be about and what point you will be making.
In the next box, write a transition word, phrase, or sentence to link yourintroduction with the first paragraph of the body of the essay. In the next box,write the topic sentence for the first body paragraph. Then add sentences for thesupporting details. Complete the rest of the organizer, following the samepattern: topic sentence, details, transition.
Here is an expository writing organizer for the essay on the Endurance:
Topic: Sir Ernest Shackleton and the Voyage of the Endurance
Expository WritingOrganizers
Using ExpositoryWriting Organizers
Expository WritingOrganizers
in ActionOpening Sentences: Sir Ernest Shackleton and his crew led one of the greatestexplorations of the twentieth century. Their success was based ondetermination, optimism, and endurance.
Paragraph 1 Topic sentence: Preparing for the expedition was challenging. Supporting details: With the outbreak of the First World War, many peoplewere unwilling to give money for exploration. Shackleton finally was able to gather the funds he needed. Then he went about choosing his crew. Over 5,000 men volunteered for the voyage. Most of them were people wholoved the sense of adventure and exploration. Shackleton chose mostly veteranseamen for the core of his crew. For the remaining crew, Shackleton made quick decisions based on how themen looked and if they had a sense of humor as well as discipline.It might have seemed that Shackleton didn’t put much thought into choosingthe crew, but he had a great ability to build a team he could trust and whowould trust him.
Transition: Were it not for Shackleton’s great leadership, thevoyage of the Endurance could have ended tragically.
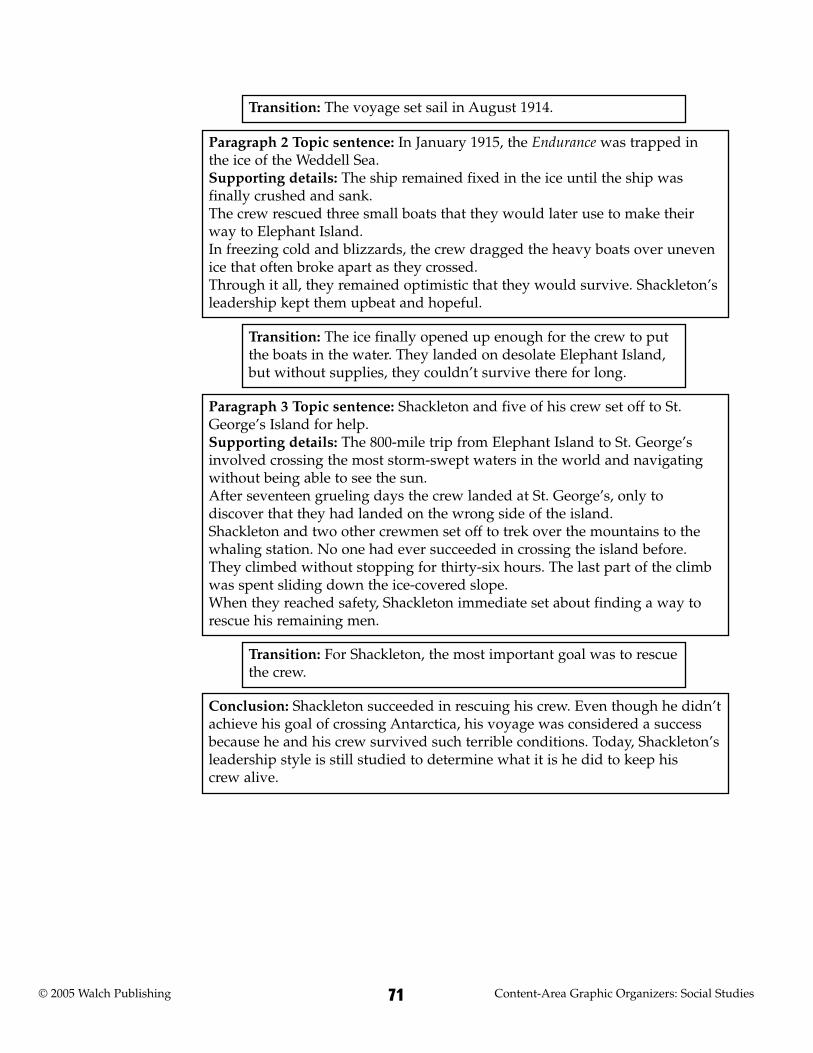
© 2005 Walch Publishing Content-Area Graphic Organizers: Social Studies71
Paragraph 2 Topic sentence: In January 1915, the Endurance was trapped inthe ice of the Weddell Sea. Supporting details: The ship remained fixed in the ice until the ship wasfinally crushed and sank.The crew rescued three small boats that they would later use to make theirway to Elephant Island.In freezing cold and blizzards, the crew dragged the heavy boats over unevenice that often broke apart as they crossed. Through it all, they remained optimistic that they would survive. Shackleton’sleadership kept them upbeat and hopeful.
Conclusion: Shackleton succeeded in rescuing his crew. Even though he didn’tachieve his goal of crossing Antarctica, his voyage was considered a successbecause he and his crew survived such terrible conditions. Today, Shackleton’sleadership style is still studied to determine what it is he did to keep his crew alive.
Paragraph 3 Topic sentence: Shackleton and five of his crew set off to St.George’s Island for help. Supporting details: The 800-mile trip from Elephant Island to St. George’sinvolved crossing the most storm-swept waters in the world and navigatingwithout being able to see the sun.After seventeen grueling days the crew landed at St. George’s, only todiscover that they had landed on the wrong side of the island.Shackleton and two other crewmen set off to trek over the mountains to thewhaling station. No one had ever succeeded in crossing the island before.They climbed without stopping for thirty-six hours. The last part of the climbwas spent sliding down the ice-covered slope.When they reached safety, Shackleton immediate set about finding a way torescue his remaining men.
Transition: The voyage set sail in August 1914.
Transition: The ice finally opened up enough for the crew to putthe boats in the water. They landed on desolate Elephant Island,but without supplies, they couldn’t survive there for long.
Transition: For Shackleton, the most important goal was to rescuethe crew.

Now it’s your turn. Use your outline to fill in the expository writing organizerbelow. Add or delete sections as needed.
Content-Area Graphic Organizers: Social Studies © 2005 Walch Publishing72
Application
Opening Sentences:
Conclusion:
Transition: .
Paragraph 1 Topic sentence:
Supporting details:
Transition:
Paragraph 2 Topic sentence:
Supporting details:
Transition:
Transition:
Paragraph 3 Topic sentence:
Supporting details:

Part 3: ReproducibleGraphic Organizers

Content-Area Graphic Organizers: Social Studies © 2005 Walch Publishing74
Con
cep
t/E
ven
t M
ap
Write your topic in the center circle. Then write details in the smaller circles. Add and delete linesand circles as needed.
Who?
What?
Why?
When?
Where?
How?
Concept/Event Map
Main Idea and Details Chart
© 2005 Walch Publishing Content-Area Graphic Organizers: Social Studies75
Mai
n I
dea
an
d D
etai
ls C
har
t
Write a supporting detail in each of the first three boxes. Write the main idea in the last box.
Supporting Detail:
Supporting Detail:
Supporting Detail:
The Main Idea:
+
+
=

Hierarchy Diagram
Content-Area Graphic Organizers: Social Studies © 2005 Walch Publishing76
Write the most important element at the top of the chart. Write less important elements lowerdown. Use lines to show relationships between elements. Add or delete boxes and lines as neededto fit the material.
Hie
rarc
hy
Dia
gram

Spider Map
© 2005 Walch Publishing Content-Area Graphic Organizers: Social Studies77
Sp
ider
Map
Write the topic or theme of the reading in the oval. Write one main idea on each diagonal line.Write one supporting detail on each horizontal line. Add or delete lines as needed.
Topic/Theme:
_____________________________
Main Idea
Detail
Detail Detail
Detail
Detail
Detail Detail
Detail
Main IdeaM
ain Id
ea
Mai
n Idea
Time Line
Content-Area Graphic Organizers: Social Studies © 2005 Walch Publishing78
Write events on the lines, with the earliest event at the bottom and later events, in order, on theupper lines. The most recent event should be at the top. T
ime
Lin
e

Sequence Chain
© 2005 Walch Publishing Content-Area Graphic Organizers: Social Studies79
Write the first step or event in the first box. Write the other steps or events in order in the otherboxes. Add or delete lines and boxes as needed.
Seq
uen
ce C
hai
n
Step 1 Step 2
Step 3
Step 4 Step 5
Step 6
Step 7
Escalator Graph
Content-Area Graphic Organizers: Social Studies © 2005 Walch Publishing80
An escalator graph is useful to show the steps in a process, much like a sequence chain. At thebottom of the escalator graph, write the beginning event. At the top, write the final outcome.
Esc
alat
or G
rap
h
EndingEvent
BeginningEvent

Then and Now Chart
© 2005 Walch Publishing Content-Area Graphic Organizers: Social Studies81
Write the topic you are charting at the top. Write the time periods you are comparing beside thewords “Then” and “Now.” Write information about the topic at each period on the appropriateside of the chart. Try to line up information in the same category—such as size, color, amount—oneither side of the line to make comparing the two periods easier.
Topic: ___________________________________________________
Th
en a
nd
Now
Ch
art
Then: Now:
Venn Diagram 1
Content-Area Graphic Organizers: Social Studies © 2005 Walch Publishing82
Label both circles. Write similarities in the area where the circles intersect. Write differences in theareas where the circles don’t intersect.
Ven
n D
iagr
am 1

Venn Diagram 2
© 2005 Walch Publishing Content-Area Graphic Organizers: Social Studies83
Label all three circles. Write similarities in the areas where the circles intersect. Write differences inthe areas where the circles don’t intersect.
Ven
n D
iagr
am 2

Comparison Matrix
Content-Area Graphic Organizers: Social Studies © 2005 Walch Publishing84
Write the items you are comparing at the top of each column. Write one attribute at the start ofeach row. Add or delete rows and columns as needed.
Com
par
ison
Mat
rix
Attribute 1
Attribute 2
Attribute 3
Attribute 4
Attribute 5 Name 1 Name 2

© 2005 Walch Publishing Content-Area Graphic Organizers: Social Studies85
Write one cause in each oval. Write its effects in the rectangle that is connected to the oval.
Cause and Effect Map
Cau
se a
nd
Eff
ect
Map
Cause Effect

Problem/Solution Chart
Content-Area Graphic Organizers: Social Studies © 2005 Walch Publishing86
Write the problem in the top box. Write the action taken to address the problem in the “Action”box. Write the results of the action in the “Results” box.
Pro
ble
m/S
olu
tion
Ch
art
Problem:
Action: Results:
Event Map
© 2005 Walch Publishing Content-Area Graphic Organizers: Social Studies87
Eve
nt
Map
Write the event in the circle. Write a few words or a phrase in each box to show what happened,when it happened, where it happened, how it happened, why it happened, and who was involved.
Who Why
What
When
How
Where
Event
______________________

KWL Chart
Content-Area Graphic Organizers: Social Studies © 2005 Walch Publishing88
KW
LC
har
t
Write your topic at the top of the chart. In the K part of the chart, write what you already knowabout the topic. In the W part of the chart, write any questions you have about the topic. Once youhave done your research, write an overview of what you have learned in the L part of the chart.
KWhat I KNOW
WWhat I WANT to Know
LWhat I LEARNED
Topic: ________________________________________________

Note-Taking Organizer
© 2005 Walch Publishing Content-Area Graphic Organizers: Social Studies89
Write your research topic at the top. For each source you use, write the title, author, and otherbibliographical details in the “Source” box. Write each note in a separate box. Include the page youfound the information on at the top of the box. Don’t copy word for word—just jot down keywords and phrases. Add or delete boxes for sources and notes as needed.
Not
e-Ta
kin
g O
rgan
izer
Research Source 1Author:
Title:
Note: p. ____ Note: p. ____ Note: p. ____
Research Source 2Author:
Title:
Note: p. ____ Note: p. ____ Note: p. ____
Research Source 3Author:
Title:
Note: p. ____ Note: p. ____ Note: p. ____
Research Topic:

Form
al O
utl
ine Formal Outline
Content-Area Graphic Organizers: Social Studies © 2005 Walch Publishing90
Write the title on the line at the top. Then fill in the rest of the outline with topics, subtopics, andsupporting details. Add or delete lines as needed.
Title ___________________________________________
I. Introduction
A. Opening statement ___________________________________
___________________________________
B. Main idea or thesis ___________________________________
II. First major idea or topic ___________________________________
A. Subtopic or clarifying idea ___________________________________
1. Detail or example ___________________________________
2. Detail or example ___________________________________
B. Subtopic or clarifying idea ___________________________________
1. Detail or example ___________________________________
2. Detail or example ___________________________________
III. Second major idea or topic ___________________________________
A. Subtopic or clarifying idea ___________________________________
1. Detail or example ___________________________________
2. Detail or example ___________________________________
B. Subtopic or clarifying idea ___________________________________
1. Detail or example ___________________________________
2. Detail or example ___________________________________
IV. Conclusion ___________________________________
A. Restatement of main idea ___________________________________
B. Final statement ___________________________________
© 2005 Walch Publishing Content-Area Graphic Organizers: Social Studies91
Informal Outline
Write your topic and thesis statement at the top. Write the statements that support the thesisstatement in the boxes.
Topic: ________________________________________________________
Info
rmal
Ou
tlin
e
Thesis statement:
Support Statement 1:
Developed by:
Support Statement 2:
Developed by:
Support Statement 3:
Developed by:
Support Statement 4:
Developed by:
Conclusion:
Developed by:
Expository Writing Organizer
Content-Area Graphic Organizers: Social Studies © 2005 Walch Publishing92
Use your outline to fill in the expository writing organizer. Add or delete sections as needed.
Exp
osit
ory
Wri
tin
g O
rgan
izer
Opening Sentences:
Conclusion:
Transition:
Paragraph 1 Topic sentence:
Supporting details:
Transition:
Paragraph 2 Topic sentence:
Supporting details:
Transition:
Transition:
Paragraph 3 Topic sentence:
Supporting details:

Answer Key


© 2005 Walch Publishing Content-Area Graphic Organizers: Social Studies95
Answer Key: Lesson 2
Concept/Event Map, page 11Answers will vary. Sample answer:
Louisiana Purchase
Who?Thomas Jefferson
What?Bought huge area ofland from EmperorNapoleon When?
Land was bought in 1803.
Why?• The purchase doubled
the size of the U.S.• The territory had many
natural resources andfertile areas.
Where?All of the land from theMississippi to theRockies and Canada toMexico, including 15current U.S. states
How?• Jefferson loosely
interpreted theConstitution.
• Senate andCongress backedhim up.

Content-Area Graphic Organizers: Social Studies © 2005 Walch Publishing96
Main Idea and Details Chart, page 16Answers will vary. Sample answer:
Answer Key: Lesson 2
Supporting Detail:Lucy doesn’t feel that working in the mill is hard work, especiallysince she will be there only a short time.
The Main Idea:Lucy describes her time working in the mill and says that it was agood experience.
+Supporting Detail:Lucy thinks that if girls and women spend too much time at home,their view of the world becomes narrow.
+Supporting Detail:Being in the mill makes Lucy feel as if she is a part of a biggerhuman family.
=
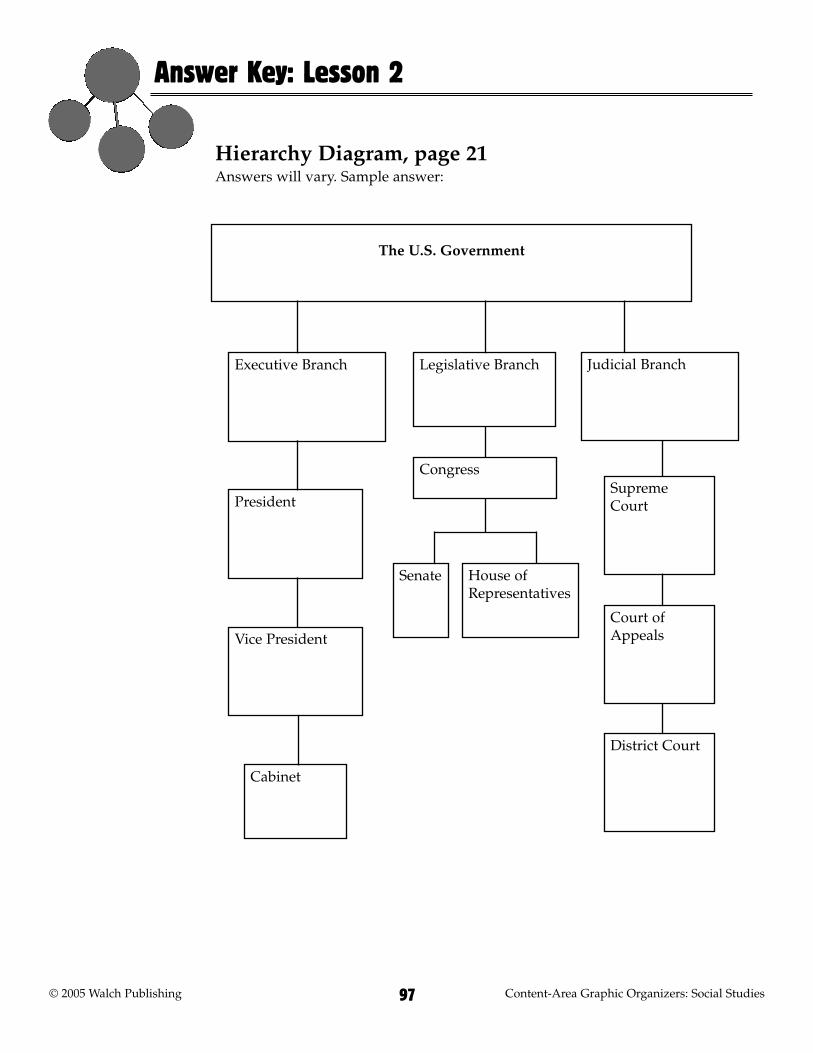
© 2005 Walch Publishing Content-Area Graphic Organizers: Social Studies97
Hierarchy Diagram, page 21Answers will vary. Sample answer:
Answer Key: Lesson 2
Senate House ofRepresentatives
Legislative Branch
Congress
Cabinet
The U.S. Government
Executive Branch
President
Vice President
Judicial Branch
SupremeCourt
Court ofAppeals
District Court

Content-Area Graphic Organizers: Social Studies © 2005 Walch Publishing98
Sequence Chain, page 32Answers will vary. Sample answer:
Answer Key: Lesson 3
Step 1The sponsor of a bill introducesit by giving it to the clerk orputting it in the hopper.
Step 2The speaker of the Houseassigns the bill to a committee.
Step 3The bill goes on a calendarawaiting action.
Step 4The bill goes to the floor of theHouse for consideration. If itpasses, it moves to the Senate.
Step 5The bill is assigned to a Senatecommittee.
Step 6The bill goes to the Senate floorfor consideration.
Step 7The House and the Senate worktogether to revise the bill, ifnecessary.
Step 8The bill goes to the speaker,then the Vice President, then the President for final approvalor veto.

© 2005 Walch Publishing Content-Area Graphic Organizers: Social Studies99
Then and Now Chart, page 38Answers will vary. Sample answer:
• What do I want to compare and contrast?Women’s sports in Victorian times compared to today
• What do I want to learn about the things being compared or contrasted?How things are different today from Victorian times for women in sports
• What information do I need to have about both things in order to compareand contrast them? What details to include—should I also talk about women’s dress?
• What did I learn? What did I discover by comparing and contrasting these things?That women were seen as delicate and that their femininity was veryimportant. Also, that clothing determined the types of sports in whichwomen participated.
Answer Key: Lesson 4
Then (Victorian Age: 1837–1901)
types of sports: croquet, archery,tennis, and golf
Only wealthy women played sports.Women weren’t seen as powerful.
Bicycles began to change the waywomen moved and traveled.
Clothing for bikes became lessrestrictive.
Now
no restrictions
Sports are open to everyone. Power and muscles are seen as beautiful.
Women ride bikes, play football, playbaseball, and participate in othertraditionally masculine sports.
Women wear whatever they want toparticipate in sports.
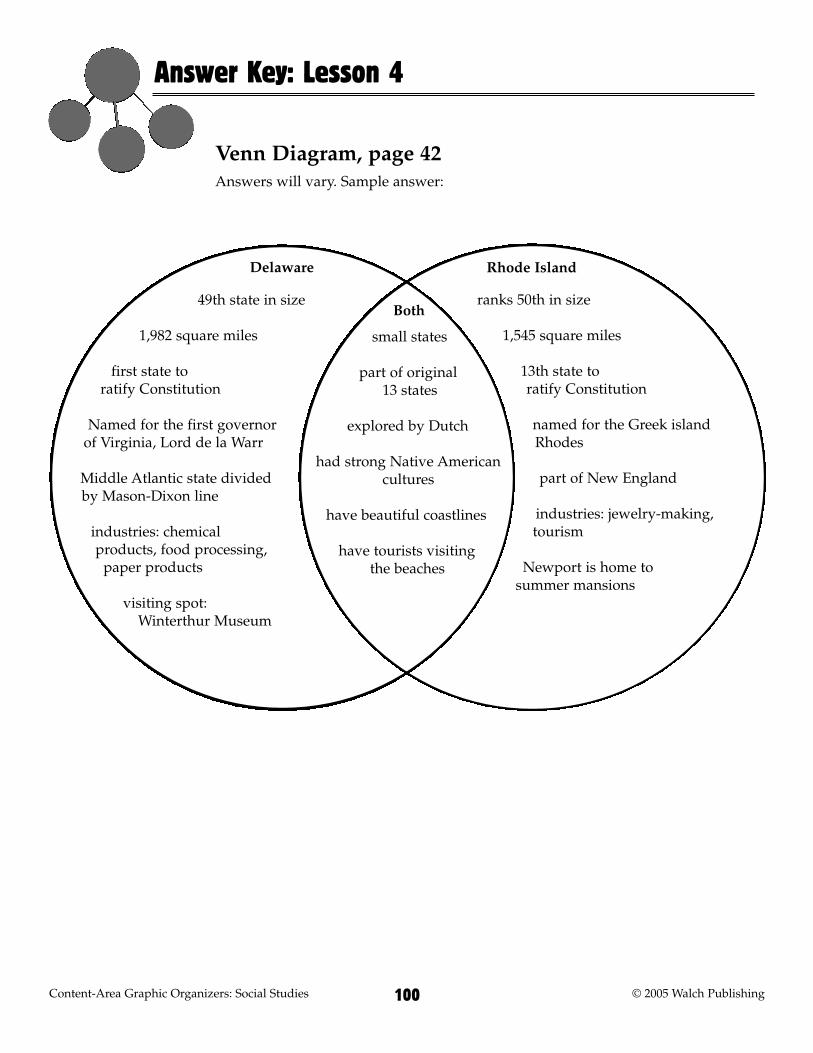
Content-Area Graphic Organizers: Social Studies © 2005 Walch Publishing100
Venn Diagram, page 42Answers will vary. Sample answer:
Answer Key: Lesson 4
Both
Delaware Rhode Island
49th state in size
1,982 square miles
first state to ratify Constitution
Named for the first governorof Virginia, Lord de la Warr
Middle Atlantic state dividedby Mason-Dixon line
industries: chemicalproducts, food processing,
paper products
visiting spot: Winterthur Museum
ranks 50th in size
1,545 square miles
13th state to ratify Constitution
named for the Greek islandRhodes
part of New England
industries: jewelry-making,tourism
Newport is home to summer mansions
small states
part of original 13 states
explored by Dutch
had strong Native Americancultures
have beautiful coastlines
have tourists visitingthe beaches

© 2005 Walch Publishing Content-Area Graphic Organizers: Social Studies101
Cause and Effect Map, page 48Answers will vary. Sample answer:
Answer Key: Lesson 5
Cause Effect
Bette gets a divorce and has tosupport herself and her son.
Bette wants to be very efficientat her job.
Bette is fired from her job andcan devote full-time energy toher new invention.
Bette believes in helping otherswho might be starting out asshe did.
Bette gets a job as an executive secretary.
Bette invents Mistake Out soshe doesn’t have to retype her papers.
Bette begins manufacturingher product in earnest. Shemakes a million-dollarcompany.
Bette funds foundations tohelp women make a living.

Content-Area Graphic Organizers: Social Studies © 2005 Walch Publishing102
Problem/Solution Chart, page 52Answers will vary. Sample answer:
Answer Key: Lesson 5
Problem: There was no clear winner of the 2000 presidential election because thevoting tickets in Florida were difficult to read.
Action: The Supreme Court had to step into decide who the winner was
Results: Voting processes in Floridahave improved so that in thefuture, votes will be clearly marked.

WALCH PUBLISHING
Content-Area Graphic Organizers: Social Studies © 2005 Walch Publishing103
