contaminant assessment of common terns in the gulf of maine reports/5n38_final... · u.s. fish and...
TRANSCRIPT
U.S. FISH AND WILDLIFE SERVICE MAINE FIELD OFFICE
SPECIAL PROJECT REPORT: FY07-MEFO-2-EC
Contaminant Assessment of Common Terns in the Gulf of Maine
July 2008

Mission Statement U.S. Fish and Wildlife Service
“Our mission is working with others to conserve, protect, and enhance the nation’s fish and wildlife and their habitats for the continuing
benefit of the American people.”
Suggested citation: Mierzykowski S.E., L.J. Welch, C.S. Hall, S.W. Kress and R.B. Allen. 2008. Contaminant assessment of common terns in the Gulf of Maine. USFWS. Spec. Proj. Rep. FY07-MEFO-2-EC. Maine Field Office. Old Town, ME. 91 pp.

U.S. FISH AND WILDLIFE SERVICE
MAINE FIELD OFFICE SPECIAL PROJECT REPORT: FY07-MEFO-2-EC
Contaminant Assessment of Common Terns
in the Gulf of Maine
FINAL REPORT
Region 5 ID: 1261-5N38 DEQ ID: 200450001
(filename: COTE Report 5N38 Revised.pdf)
Prepared by:
Steven E. Mierzykowski
U.S. Fish and Wildlife Service, Ecological Services - Maine Field Office
Linda J. Welch U.S. Fish and Wildlife Service, Maine Coastal Islands National Wildlife Refuge
C. Scott Hall and Stephen W. Kress
National Audubon Society, Seabird Restoration Program
and
R. Bradford Allen Maine Department of Inland Fisheries and Wildlife, Bird Group
July 2008
2
Executive Summary In 2001, developmental abnormalities and low productivity were reported in common tern (Sterna hirundo) chicks from three islands on the Maine coast - Stratton Island, Jenny Island, and Pond Island. Newborn terns were too weak to hatch or unable to completely emerge from their eggshell. Others birds that were able to hatch quickly developed combinations of the following symptoms: swollen or encrusted eyes, bloody nares, patchy feather development, and necrotic skin at the base of the bill and legs. Chicks shook involuntarily or were extremely lethargic. At one island, there was an unconfirmed report of malformed bills in a few chicks. Most affected tern chicks died within five to seven days of hatching. Diagnostic examinations for diseases and parasites were conducted by the National Wildlife Health Center (NWHC), but were inconclusive. Acting on a recommendation by the NWHC, a screening-level contaminant survey was initiated by the U.S. Fish and Wildlife Service and its seabird restoration partners in 2004. Some contaminants such as dioxins, polychlorinated biphenyls, DDT, and mercury have been linked in previous tern studies to developmental abnormalities or reduced productivity. During the 2004 and 2005 breeding seasons, non-viable eggs and moribund or dead common tern chicks from five islands along the Maine coast were collected and analyzed for residues of organochlorine compounds and trace elements. Besides the three islands with reported abnormalities, two islands - Eastern Egg Rock and Petit Manan Island - were selected to serve as reference locations in the study. Concentrations of 26 organochlorine compounds and nineteen trace elements were determined in 50 eggs and 42 chicks. Three 3-egg composite samples were also analyzed for dioxins, furans, and PCB congeners. Organochlorine Compounds Compared to suggested biological effect levels and to regional and other tern investigations, highly elevated levels of organochlorine contaminants were not found in egg or chick samples from the Maine coast. Total PCB concentrations in eggs (average 0.36 parts-per-million, ppm fresh wet weight) were below the biological effect threshold (7 ppm). Similarly, Total PCB levels in chicks (ave. 0.62 ppm) were not elevated compared to levels found in other regional studies. Composite egg samples from three islands (two target, one reference) were also analyzed for dioxin, furan, and polychlorinated biphenyl (PCB) congeners including non-ortho and mono-ortho dioxin-like congeners. Dioxin toxic equivalents (TCDD-TEQ) in egg composite samples were not elevated (max. 62 parts-per-trillion, ppt) and below suggested tern embryotoxicity levels (600 ppt). TCDD-TEQ levels in egg composites were 3-fold higher, however, at the two target islands than the reference island. PCB# 77 was the dominant dioxin-like congener to the TCDD-TEQ in all three egg composite samples. PCB congener patterns were similar among the three islands with PCB #153, PCB #138, and PCB #180 being the greatest contributors to the Total PCB load. If a discrete PCB source was affecting one of the islands, a different PCB congener pattern would have been evident in one of

3
the samples. A slight contaminant gradient from southern Maine to Downeast was indicated by PCB congener egg concentrations (Stratton > Pond > Petit Manan) and in Total PCB egg data for all five islands (Stratton > Jenny > Pond > Eastern Egg > Petit Manan), but the same pattern was not evident in Total PCB chick concentrations. DDE, a metabolite of the pesticide DDT, was found in all egg and chicks samples, but at low concentrations (< 0.10 ppm). Compared to a tern study where hatching failure occurred at levels greater than 1.9 ppm, the DDE levels along the Maine coast were not elevated. Other organochlorine compounds (e.g., chlordane compounds, cyclodiene pesticides, hexachlorcyclohexanes) were also detected at low concentrations (i.e., low parts-per-billion). Effect levels for these other organochlorine compounds typically occur at the parts-per-million range, or put another way, at concentrations orders of magnitude higher than what were found in this study. Contaminant uptake (expressed as the difference in contaminant mass in eggs and chicks) among the five islands was consistent for several organochlorine compounds. For example, PCB mass was nearly 10 micrograms higher in chick samples than in eggs. Trace Elements Compared to concentrations found in other Maine seabirds and to biological effects thresholds, mercury concentrations in common tern eggs (0.11 ppm) and chicks (0.16 ppm) were low. Recent egg injection studies with methylmercury categorize common terns as moderately sensitive with lethal concentrations (LC50s) ranging from 0.25 to 1.00 ppm. Common tern embryos from the Maine coast were well below this suggested toxicity threshold. Except for a few anomalous elevated detections, concentrations of eighteen other trace elements including cadmium, lead, and selenium were either within previously reported ranges, low, sporadically detected, or below detection. Trace element uptake (expressed as the difference in contaminant mass in eggs and chicks) among the five islands was similar to what was found in organochlorine compounds for some elements (e.g., higher mass of copper, strontium, zinc in chicks than eggs), but not for others (e.g., lower mass of mercury and selenium in chicks than eggs). Also, the variance in chick trace element mass was generally larger than the variance in eggs. Summary Overall, contaminant concentrations did not exceed suggested biological effect levels or were not elevated compared to other regional common tern studies. Some significant differences (p < 0.05) in contaminant concentrations were found between target and reference islands, among all five islands, and by sample type (i.e., egg and chick); but contaminant concentrations of individual organochlorine compounds and trace elements were not found at levels reported to have caused developmental abnormalities or reduced productivity in other studies.

4
In 2006, the incidence of chick abnormalities had greatly diminished at the three target islands. Only isolated instances of abnormalities were reported in 2007. For a variety of reasons (weather, predator harassment, other disturbances), common tern productivity annually fluctuates along the Maine coast. Based on the contaminant levels detected in tern eggs and chicks, and variation in productivity among years and islands (target and reference), a relationship between contaminants levels and productivity was not evident. Although elevated contaminant concentrations were not detected in this study, it is not known what role combinations of low, sub-lethal body burdens of these contaminants and others not measured in this study may have on developing birds. To our knowledge, this project was the first broad study of contaminant exposure in common terns along the Maine coast. In other parts of the region (e.g., Cape Cod, Buzzards Bay, Long Island Sound, Barnegat Bay), tern contaminant studies have been conducted since the 1970s. Now that a Maine baseline has been established, periodic monitoring (e.g., every ten years) of contaminants in common terns and other Maine seabirds is recommended. To track trends in exposure, future monitoring should include the organochlorine compounds and trace elements analyzed in this study, and also include newly emerging contaminant compounds such as polybrominated diphenyl ethers and perfluorinated compounds. These newly emerging contaminants were not included in the original study design, because biological effect thresholds have not yet been established and the analytical costs were prohibitive. KEYWORDS: common tern, organochlorines, trace elements, Maine

5
TABLE OF CONTENTS Page Title Page 1 Executive Summary 2 Keywords 4 Table of Contents 5 List of Figures 6 List of Tables 7 List of Acronyms and Abbreviations 8 Preface and Acknowledgements 10 1. Background 11 2. Study Objectives 12 3. Study Areas 12 3.1 Stratton Island 3.2 Jenny Island 3.3 Pond Island 3.4 Eastern Egg Rock 3.5 Petit Manan Island 4. Methods 13 4.1 Field methods 4.2 Contaminant analyses 4.3 Data presentations and statistical analyses 5. Results 15 5.1 Biological metrics 5.2 Organochlorine compounds 5.3 Trace elements 5.4 Lipids 6. Discussion 21
6.1 Organochlorine compounds 6.2 Trace elements 7. Summary and Management Action 37 8. Literature Cited 40
6
List of Figures Figure 1. Location of study islands in the Gulf of Maine Figure 2. Percent lipids in eggs among island (years combined) Figure 3. Percent lipids in eggs by island and year Figure 4. Percent lipids in chicks among islands (years combined) Figure 5. Percent lipids in chicks by island and year Figure 6. Dioxin toxic equivalents in COTE egg composites Figure 7. TCDD-TEQ in tern eggs – ME vs. MA and WI Figure 8. PCB congener patterns in COTE egg composites Figure 9. PCB congener concentrations in COTE egg composites Figure 10. Percent lipid in COTE eggs – target vs. reference islands Figure 11. Total PCBs in COTE eggs on a lipid weight basis – target vs. reference islands Figure 12. Percent lipid in COTE chicks – target vs. reference islands Figure 13. Total PCBs in COTE chicks on a lipid weight basis – target vs. reference islands Figure 14. Total PCBs in COTE eggs and chicks – target vs. reference islands Figure 15. Total PCBs in COTE eggs and chicks by island Figure 16. Fledging success relative to Total PCBs in COTE eggs Figure 17. Fledging success relative to Total PCBs in COTE chicks Figure 18. DDE in COTE eggs and chicks – target vs. reference islands Figure 19. DDE in COTE eggs and chicks by island Figure 20. Oxychlordane in COTE eggs and chicks – target vs. reference islands Figure 21. Oxychlordane in COTE eggs and chicks by island Figure 22. Heptachlor epoxide in COTE eggs and chicks – target vs. reference islands Figure 23. Heptachlor epoxide in COTE eggs and chicks by island Figure 24. Dieldrin in COTE eggs and chicks – target vs. reference islands Figure 25. Dieldrin in COTE eggs and chicks by island Figure 26. HCB in COTE eggs and chicks – target vs. reference islands Figure 27. HCB in COTE eggs and chicks by island Figure 28. Mirex in COTE eggs and chicks – target vs. reference islands Figure 29. Mirex in COTE eggs and chicks by island Figure 30. Arsenic in COTE eggs and chicks – target vs. reference islands Figure 31. Arsenic in COTE eggs and chicks by island Figure 32. Copper in COTE eggs and chicks – target vs. reference islands Figure 33. Copper in COTE eggs and chicks by island Figure 34. Mercury in COTE eggs and chicks – target vs. reference islands Figure 35. Mercury in COTE eggs and chicks by island Figure 36. Manganese in COTE eggs and chicks – target vs. reference islands Figure 37. Manganese in COTE eggs and chicks by island Figure 38. Selenium in COTE eggs and chicks – target vs. reference islands Figure 39. Selenium in COTE eggs and chicks by island Figure 40. Strontium in COTE eggs and chicks – target vs. reference islands Figure 41. Strontium in COTE eggs and chicks by island

7
Figure 42. Zinc in COTE eggs and chicks – target vs. reference islands Figure 43. Zinc in COTE eggs and chicks by island Figure 44. COTE productivity at the five study islands, 2000 - 2007 List of Tables Table 1. Egg metrics and percent lipids Table 2. Chick weights and percent lipids Table 3. Summary of organochlorines in eggs Table 4. Summary of organochlorines in chicks Table 5. TCDD-TEQs in composite egg samples Table 6. Summary of trace elements in eggs Table 7. Summary of trace elements in chicks List of Appendix Figures Figure A-1. Organochlorine mass (µg) by island and sample type Figure A-2. Trace element mass (µg) by island and sample type

8
Acronyms and Abbreviations Al aluminum As arsenic ave. average B boron Ba barium Be beryllium BHC benzenehexachloride Cd cadmium CDD chlorinated dioxin CDF chlorinated furan CGC capillary gas chromatography COTE common tern Cr chromium Cu copper DDD dichlorodiphenyldichloroethane DDE dichlorodiphenyldichloroethylene DDT dichlorodiphenyltrichloroethane DEQ Division of Environmental Quality, USFWS EER Eastern Egg Rock Fe iron GERG Geochemical and Environmental Research Group GOMSWG Gulf of Maine Seabird Working Group HCB hexachlorobenzene Hg mercury JEN Jenny Island LET Laboratory and Environmental Testing, Incorporated LOAEL Lowest Observable Adverse Effect Level LOD limit of detection MDIFW Maine Department of Inland Fisheries and Wildlife MEFO Maine Field Office µg/g microgram per gram (parts-per-million) Mg magnesium Mn manganese ng/g nangrams per gram (parts-per-billion) NAS National Audubon Society Ni nickel NWHC National Wildlife Health Center, USGS NWR National Wildlife Refuge Pb lead PCB polychlorinated biphenyl PCDD polychlorinated dibenzo-p-dioxins PCDF polychlorinated dibenzofurans pg/g picogram per gram (parts-per-trillion)

9
PMI Petit Manan Island PND Pond Island QA/QC quality assurance / quality control ROST roseate terns SD standard deviation Se selenium Sr strontium STR Stratton Island TCDD-TEQ dioxin toxic equivalent TEF toxic equivalency factor USFWS U.S. Fish and Wildlife Service USGS U.S. Geological Survey Zn zinc

10
PREFACE This report provides information on environmental contaminants in common tern eggs and chicks from five islands in the Gulf of Maine. Analytical work for this project was completed under U.S. Fish and Wildlife Service (USFWS) Analytical Control Facility Catalogs 5100008 and 5100012, and Purchase Order Numbers 94420-04-Y477, 94420-04-Y478, 94420-06-Y583, and 94420-06-Y584. Questions, comments, and suggestions related to this report are encouraged. Written inquiries should refer to Report Number FY07-MEFO-2-EC and be directed to:
Steve Mierzykowski U.S. Fish and Wildlife Service
1168 Main Street Old Town, Maine 04468
The U.S. Fish and Wildlife Service requests that no part of this report be taken out of context, and if reproduced, the document should appear in its entirety. Copies of this report may be downloaded from the Maine Field Office Environmental Contaminants web site at http://www.fws.gov/northeast/mainecontaminants. This report complies with peer review and certification provisions of the Information Quality Act (Pubic Law 106-554, Section 515). ACKNOWLEDGEMENTS Funding for this project was provided by the U.S. Fish and Wildlife Service's Division of Environmental Quality. In-kind support was provided by the National Audubon Society (NAS) and Maine Department of Inland Fisheries and Wildlife. We thank all the USFWS and NAS island supervisors and interns that participated in this project. We especially thank Matthew Martinkovic, former Pond Island NWR Supervisor, for his extra efforts to provide samples for this project. Michael Langlois prepared the map for Figure 1. Dr. Timothy Fannin, USFWS Region 5 Contaminants Coordinator, was particularly helpful in coordinating sample catalogs and data quality objectives with the Analytical Control Facility. Peer review was provided by Daniel Sparks, USFWS Bloomington (Indiana) Field Office, and F. Timothy Prior, Massachusetts Department of Environmental Protection and USFWS retired. Final editorial review was provided by Wende Mahaney of the USFWS Maine Field Office.
11
1. Background Beginning in 2001, developmental problems were observed in 25% to 30% of the common tern (Sterna hirundo; alpha code COTE) and roseate tern (Sterna dougallii; alpha code ROST) eggs and chicks on three coastal Maine islands: Stratton Island, Jenny Island and Pond Island. Newborn terns were too weak to hatch or unable to completely emerge from their eggshell. Others birds that were able to hatch quickly developed combinations of the following symptoms: swollen or encrusted eyes, bloody nares, patchy feather development, and necrotic skin at the base of the bill and legs. Chicks shook involuntarily or were extremely lethargic. At one island, there was an unconfirmed report of malformed bills in a few chicks. Most affected tern chicks died within five to seven days of hatching. Tern colonies on nearly 30 coastal Maine islands are annually surveyed by wildlife biologists and island interns from the U.S. Fish and Wildlife Service (USFWS), National Audubon Society (NAS), and Maine Department of Inland Fisheries and Wildlife (MEDIFW). These biologists and interns use standard survey protocols of the Gulf of Maine Seabird Working Group (GOMSWG) to monitor tern colonies. It is common to encounter dead chicks during annual GOMSWG surveys. Common causes for most tern chick deaths are predation, starvation, exposure during inclement weather, late hatching, and abandonment (Burger and Gochfeld 1991, Nisbet 2002). The high mortality rate attributed to the developmental conditions described above, however, was unusual and significant, and had not been reported on 26 other Maine islands within the GOMSWG survey. In 2002, tern chick specimens from Pond Island National Wildlife Refuge and Stratton Island were sent to the U.S. Geological Survey National Wildlife Health Center (NWHC) in Madison, Wisconsin, for necropsy and pathological examinations. The most consistent findings among the Stratton Island samples were the paleness of the kidney, likely due to the presence of fine, precipitated urates (which may have been slightly enlarged), and abundant urates in the cloaca and ureters. These conditions are often found in dehydrated birds, but none of the samples appeared to be so. Some birds had excess fluid in the lungs. In Pond Island tern chicks, the samples exhibited swollen, pale kidneys, and had fluid in the lungs and tracheas. Microbial, viral, and bacterial test cultures were inconclusive. In light of these results, contaminant testing was recommended by the NWHC. The three target islands are not particularly unique among Maine’s coastal islands. All are near-shore islands that have prey bases similar to unaffected, adjacent islands. It was not known why developmental abnormalities were occurring in early life stage terns on Pond, Jenny, or Stratton Island. Shallow waters near river mouths and in the near-shore environment of Maine are typically highly productive fishing grounds. Coastal tern colonies, particularly colonies inhabiting the near-shore islands, forage extensively in these productive fishing areas. Organochlorine contaminants have been detected at elevated levels in bald eagles (Haliaeetus leucocephalus) in Maine’s coastal environments (Welch 1994, Matz 1998, USFWS unpublished data), while high levels of mercury have been found in saltmarsh birds along Maine’s southern coast (Shriver et al. 2002).

12
Organochlorine contaminants have been associated with behavioral (e.g., lethargy, tremors), reproductive (e.g., embryo mortality, decreased egg hatchability), and pathological (e.g., emaciation) effects in birds (Friend and Franson 1999). Bill abnormalities and other malformations in terns and other wildlife have been linked to organochlorine contamination (Gilbertson et al. 1976, Hays and Risebrough 1972, Hoffman et al. 1993, Yamashita et al. 1993). Metals such as mercury, selenium, and cadmium have also been linked to reproductive and developmental effects in birds, especially in younger life stages (Fimreite 1974, Furness 1996, Thompson 1996, Heinz and Hoffman 1998, Weiner et al. 2003). Elevated mercury levels have been found in several species of Maine birds including bald eagles (Welch 1994), common loons (Gavia immer, Evers et al. 1998), and sharp-tailed sparrows (Shriver et al. 2002). Non-viable eggs and dead or moribund prefledging common terns from Pond Island, Jenny Island, Stratton Island, and two reference islands (Figure 1) were collected in this study to determine if contaminants were associated with developmental problems previously described. The three islands of interest occur along a 30-mile linear reach of the southern Maine coast from Saco to Phippsburg, and support some of the largest tern colonies in the state (Lord and Allen 2002). For comparative purposes, two islands - Eastern Egg Rock and Petit Manan Island - were selected as reference areas. The developmental problems found in terns from the three islands of interest had not been reported on these two reference islands. 2. Study Objective The objectives of the study were: ● To measure organochlorine compounds and trace element residues in nonviable common tern eggs and dead or moribund chicks from three islands where developmental abnormalities and reduced productivity had been reported, ● To compare results from these three target islands against egg and chick samples collected from two reference islands, and ● To compare contaminant residue results from all five islands to suggested biological effect levels reported in the scientific literature. 3. Study Areas 3.1 Stratton Island is a 36-acre coastal island located one mile south of Prout’s Neck in Saco Bay and three miles south of the mouth of the Scarborough River and its extensive marsh. The island is owned by the NAS and managed as the Phineas W. Sprague Wildlife Sanctuary. With nearly 100 nesting pairs, Stratton Island supports Maine’s second largest colony of federally-listed endangered roseate terns. Between 150 and 1300 pairs of common tern may nest on Stratton Island. 3.2 Jenny Island is a 2-acre coastal island in Casco Bay that is less than one mile south of the mainland area of West Cundy Point. The island supports approximately 200 to 700 common tern

13
nesting pairs, and, in some years, as many as 15 pairs of roseate terns. The island is owned by the MEDIFW. The tern colonies are cooperatively managed by the NAS and MEDIFW. 3.3 Pond Island National Wildlife Refuge is a 10-acre coastal island in the terminus of the Kennebec River located less than one mile from Popham Beach. The island is owned by the USFWS and co-managed by USFWS staff of the Maine Coastal Islands National Wildlife Refuge and biologists with the NAS. Pond Island supports a common tern colony of approximately 100 to 450 nesting pairs. Roseate terns have occasionally nested on Pond Island with as many as 12 nesting pairs using the island in 2004. 3.4 Eastern Egg Rock is a 7-acre island located five miles east of Pemaquid Point in Muscongus Bay. The island is owned by the Maine Department of Inland Fisheries and Wildlife and co-managed with the National Audubon Society. The island supports approximately 700 to 1500 pairs of common tern and 100 to 160 pairs of roseate terns. 3.5 Petit Manan Island is a 9-acre island located 2.5 miles southeast of Petit Manan Point near Pigeon Hill Bay. The island is a refuge parcel owned by the U.S. Fish and Wildlife Service and managed by staff of the Maine Coastal Islands National Wildlife Refuge. Between 1000 and 1600 common tern pairs may nest on the island along with 10 to 30 pairs of roseate terns. 4. Methods 4.1 Field Methods 4.1.1 Egg Collections. During productivity surveys at the target islands and reference islands, tern nests were monitored by USFWS and NAS personnel on a regular basis. In 2004 and 2005, five partially-pipped or unhatched eggs were collected from each island for organochlorine compound and trace element analyses. A few viable eggs were collected from the reference islands to meet the five egg sampling objective. In 2004, three 3-egg composite samples were also collected from Stratton Island, Pond Island, and Petit Manan Island for congener-specific analyses of dioxins, furans, and PCBs. Eggs were temporarily stored on ice in the field or refrigerated until processed. During processing, total egg weight, length, breadth, and egg content weight (i.e., minus egg shell) were measured. Egg length and breadth measurements were taken with a dial caliper. Eggs were scored at the equator with a stainless steel scalpel and the contents were deposited into chemical-clean jars. Samples were frozen at -20oC until shipped to analytical laboratories. 4.1.2 Prefledged Chick Collections. Easily observed nests or nests used for productivity surveys on the study islands were regularly monitored by USFWS and NAS island interns. All dead or moribund tern chicks with developmental malformations were collected. Dead and moribund chicks were also collected from reference islands. On the islands, chick samples were placed in chemical-clean jars, and kept on ice or frozen immediately after collection. The samples did not appear dessicated or decomposed. During processing back on the mainland, all chick samples were removed from sample jars, lightly brushed to remove dirt and debris, weighed, placed into new chemical-clean jars, and frozen at less than 20o C. Chick carcasses

14
were analyzed whole-body. Bills, feet, internal organs, or stomach contents were not removed prior to analyses. Initially, several chicks were thawed and stomach contents were examined. Little, if any, extractable material was found within stomachs and the dissections were discontinued. Five chick samples of similar age and size were sought from each island each year. Fewer chicks, however, were collected at two of the target islands – Stratton (n = 7) and Jenny (n = 5). 4.2 Contaminant Analyses 4.2.1 Organochlorine Compounds. Fifty individual egg and forty-two individual chick samples were analyzed for organochlorine compounds and percent lipids by the Geochemical and Environmental Research Group (GERG) in College Station, Texas. The organochlorine compounds (n = 26) included in the scan were total polychlorinated biphenyls (PCB), DDT metabolites (o,p'-DDD, o,p'-DDE, o,p'-DDT, p,p'-DDD, p,p'-DDE, p,p'-DDT), hexachlorocyclohexanes (alpha benzenehexachloride (BHC), beta BHC, gamma BHC, delta BHC), chlordanes (heptachlor expoxide, oxychlordane, alpha chlordane, gamma chlordane, cis-nonachlor, trans-nonachlor), heptachlor, aldrin, endrin, dieldrin, hexachlorobenzene (HCB), endosulfan II, mirex, pentachloro-anisole, and toxaphene. Residues were quantified by capillary gas chromatography (CGC) with an electron capture detector for pesticides and PCBs. In cases where analytes co-elute with other analytes (e.g., endosulfan II, PCB congeners), CGC with a mass spectrometer detector was used. In addition, three 3-egg composite samples from Stratton Island, Pond Island, and Petit Manan Island were analyzed for polychlorinated dibenzo-p-dioxins (PCDDs), polychlorinated dibenzofurans (PCDFs), and PCB congeners. The seven dioxin congeners included in the scan were: 2,3,7,8-TetraCDD, 1,2,3,7,8-PentaCDD, 1,2,3,4,7,8-HexaCDD, 1,2,3,6,7,8-HexaCDD, 1,2,3,7,8,9-HexaCDD, 1,2,3,4,6,7,8-HeptaCDD, and OctaCDD. The ten furan congeners were: 2,3,7,8-TetraCDF, 1,2,3,7,8-PentaCDF, 2,3,4,7,8-PentaCDF, 1,2,3,4,7,8-HexaCDF, 1,2,3,6,7,8-HexaCDF, 1,2,3,7,8,9-HexaCDF, 2,2,4,6,7,8-HexaCDF, 1,2,3,4,6,7,8-HeptaCDF, 1,2,3,4,7,8,9-HeptaCDF, and OctaCDF. The PCB congener scan included 122 congeners - 96 with 26 co-elutes. The lower limit of detection (LOD) on a wet weight basis was 0.002 µg/g for most organochlorines, 0.01 µg/g for Total PCBs, 0.05 µg/g for toxaphene, and > 1 pg/g for PCDD/Fs and PCB congeners. 4.2.2 Trace Elements. Fifty individual egg and forty-two individual chick samples were analyzed for trace elements by Laboratory and Environmental Testing, Inc., located in Columbia, Missouri. The 19 elements included in the scan were aluminum (Al), arsenic (As), boron (B), barium (Ba), beryllium (Be), cadmium (Cd), chromium (Cr), copper (Cu), iron (Fe), mercury (Hg), magnesium (Mg), manganese (Mn), molybdenum (Mo), nickel (Ni), lead (Pb), selenium (Se), strontium (Sr), vanadium (V), and zinc (Zn). Most elements were quantified using inductively coupled plasma mass spectrometry, graphite furnace atomic absorption, or cold vapor atomic absorption.
15
For trace elements, the lower limits of detection (LOD) on a wet weight basis were 0.02 µg/g for beryllium, cadmium, and mercury; 0.05 µg/g for arsenic, barium, lead, selenium, and strontium; 0.07 µg/g for copper; 0.10 µg/g for chromium, manganese, nickel, vanadium, and zinc; 0.50 µg/g for aluminum, boron, iron, and molybdenum; and 0.70 µg/g for magnesium. 4.2.3 Quality Assurance and Quality Control (QA/QC). QA/QC procedures were performed by the organic and inorganic laboratories and included procedural blanks, duplicates, spike recoveries, and standard reference materials. Laboratory analytical packages and QA/QC results were reviewed and approved by the USFWS Analytical Control Facility in Shepherdstown, West Virginia. 4.3. Data Presentations and Statistical Analyses 4.3.1 Data Presentations. Tern eggs, particularly eggs that are beyond hatch date, in abandoned nests, or eggs that have rolled out of the nest, may be exposed for extended periods to sunlight and experience desiccation. Consequently, wet weight contaminant concentrations were adjusted to fresh wet weight (Stickel et al. 1973). Trace element and most organochlorine compound egg data are presented in µg/g (micrograms per gram, parts-per-million) on a fresh wet weight basis. Tern chick contaminant concentrations are presented in µg/g wet weight. Dioxins, furans, and dioxin-like PCB concentrations in egg composites are presented in pg/g (picograms per gram, parts-per-trillion) on a fresh wet weight basis. Additionally, dioxin toxic equivalency factors (Van den Berg et al. 1998) were applied to PCDD, PCDF, and dioxin-like PCB congener data and summed to derive a dioxin toxicity quotient, TCDD-TEQ. Other PCB congener data are presented in ng/g. Total PCB concentrations in eggs are also presented on a lipid weight basis (µg PCB/g lipid) to facilitate comparisons with other regional studies. Concentrations for each compound or element are presented within the body of this report and summarized in Tables 3 through 7. Descriptive statistics in the report include arithmetic mean ± standard deviation and range. For statistical comparisons, the following convention was used. In instances where one-half or more of the samples had concentrations above the detection limit, one-half the sample detection limit was used for non-detects. 4.3.2 Statistical Analyses. Statistical analyses were performed with Systat 9 (SPSS, Inc. 1998). Significance was deemed acceptable if p < 0.05. Since samples sizes were small among islands and not all compounds or elements were normally distributed, non-parametric statistical analyses were used for all data sets and all tests. To determine differences in sample metrics and contaminant concentrations between years and between target and reference islands, the Mann-Whitney U Test was used. The Kruskal-Wallis Test was used to discern differences in contaminant concentrations among all five islands. 5. Results 5.1 Biological Metrics. Tables 1 and 2 summarize biological metrics for egg and chick samples,
16
respectively. 5.1.1 Eggs. Egg measurements from the study islands were unremarkable and similar to previously reported values (Baicich and Harrison 1997, Nisbet 2002). There were no significant differences (p > 0.05) in total egg weight, length, breadth, egg content weight, or volume between years on each island. Consequently, egg metric data from both years were combined into a single dataset. Egg length, breadth, and volume were similar among islands, but egg weight (total and egg content) was significantly higher at Pond Island (p < 0.02). 5.1.2 Chick Weight. Mean chick weight was 15.8 grams with a wide variation among samples (SD ± 8.25, range: 7.6 - 39.7 grams). Based on weight and age relationships reported by Langham (1972), most chicks appeared to have died one or two days from hatch, with a few less than one week old. Among the five islands, there was no significant difference in chick weight between years (p = 0.684). Both years of data were combined and there was no significant difference in chick weights between target and reference islands (p = 0.545) or among the five study islands (p = 0.417). 5.2 Organochlorine Compounds. Tables 3 and 4 summarize organochlorine compound concentrations in common tern eggs and chicks, respectively. Table 5 lists dioxin, furan, PCB congener results and dioxin toxic equivalent concentrations. Units are presented in pg/g for dioxins, furans, and dioxin-like PCB congeners, in ng/g for PCB congener patterns, and in µg/g for Total PCBs and other organochlorine compounds.
5.2.1 Polychlorinated dibenzo-p-dioxins and dibenzofurans (PCDD/Fs). Seven dioxin and ten furan congeners were below detection in single 3-egg composite samples from Stratton Island, Pond Island, and Petit Manan Island (Table 5). Sample detection limits were less than 7 pg/g for 2,3,7,8-TCDD and 2,3,7,8-TCDF, less than 70 pg/g for OctaCDD and OctaCDF, and less than 35 pg/g for other PCDD/F congeners. Since all PCDD/F congeners were below detection, sample concentrations were not adjusted to fresh wet weight, not adjusted with TEFs, and not included in the TCDD-TEQ calculation. 5.2.2 Dioxin-like PCB Congeners. Concentrations of dioxin-like PCB congeners (four non-ortho and eight mono-ortho) in composite egg samples were adjusted using toxic equivalency factors (TEFs) proposed by Van den Berg et al. (1998). PCB #77 was the only dioxin-like, non-ortho congener detected in composite egg samples and the greatest contributor to the TCDD-TEQ (Table 5). Non-ortho dioxin-like PCB congeners #81, #126, and #169 were below detection in the three composite egg samples. Of eight mono-ortho congeners with dioxin toxic equivalency factors, only seven were found above detection limits in composite egg samples. PCB #114 was below detection in all samples. PCB #118 was found at 0.59 pg/g at Stratton Island, 0.35 pg/g at Pond Island, and 0.11 pg/g at Petit Manan Island. PCB #149, a co-elute with PCB #123, was 0.10 pg/g at Stratton, 0.03 pg/g at Pond, and 0.02 pg/g at Petit Manan. PCB #156 was 1.33 pg/g at Stratton, 1.12 pg/g at Pond, and 0.19 pg/g at Petit Manan. PCB #157 co-eluted with #173 and #201. PCB #157 was 0.36 pg/g at Stratton, 0.22 pg/g at Pond, and 0.03 pg/g at Petit Manan. PCB #167 was 0.08 pg/g at Stratton,

17
0.06 pg/g at Pond, and 0.01 pg/g at Petit Manan. PCB #189 was not detected at Petit Manan Island. At Stratton Island and Pond Island, the PCB #189 TEF-adjusted concentrations were 0.008 pg/g and 0.0007 pg/g, respectively. 5.2.3 Dioxin toxic equivalents (TCDD-TEQ). TEF-adjusted concentrations of PCDDs, PCDFs, and non-ortho and mono-ortho PCB congeners were summed to derive a TCDD-TEQ concentration for each composite egg sample (Table 5). TCDD-TEQs were 65 pg/g at Stratton Island, 59 pg/g at Pond Island, and 17 pg/g at Petit Manan Island. PCB #77 was the dominant dioxin-like PCB congener in all composite samples accounting for over 94% of the TCDD-TEQ.
5.2.4 Other PCB Congeners. The PCB congener scan included 122 congeners with
several co-eluting congeners. The congeners with the highest contribution relative to Total PCB were PCB #153 (co-eluting with PCB #132) followed by PCB #138 (co-eluting with PCB #160), PCB #180, and PCB #118. The patterns of PCB congener distributions among the egg composites from Stratton Island, Pond Island, and Petit Manan Island were similar (Figure 8). Of the three islands, these dominant PCB congeners exhibited the highest concentrations at Stratton Island (Figure 9).
5.2.5 Total Polychlorinated biphenyl (PCB). Total PCB was detected in all egg and chick samples. Mean Total PCB was 0.364 ± 0.192 µg/g in eggs (Table 3) and 0.620 ± 0.463 µg/g in chicks (Table 4). The highest Total PCB concentration in an egg was 0.907 µg/g from Jenny Island. The highest Total PCB level in a chick was 1.960 µg/g from Eastern Egg Rock.
5.2.6 DDT metabolites. Three ortho, para (o,o’) and three para, para (p,p’) isomers of
the insecticide DDT (dichlorodiphenyltrichloroethane) and its two breakdown metabolites, DDD - dichlorodiphenyldichloroethane and DDE – dichlorodiphenyldichloroethylene, were included in the organochlorine analytical scan. DDD: o,p'-DDD was found in 40 of 50 egg samples (mean 0.0031 ± 0.00188 µg/g, range: 0.0006 - 0.0106 µg/g) and in all chick samples (mean 0.0040 ± 0.00378 µg/g, range: 0.0004 - 0.0191 µg/g). The highest o,p'-DDD concentrations in an egg and chick were found at Stratton Island and Pond Island, respectively. p,p'-DDD was found in 12 of 50 egg samples (mean 0.0023 ± 0.00144 µg/g, range: 0.0007 - 0.0048 µg/g) and in 36 of 42 chick samples (mean 0.0016 ± 0.00126 µg/g, range: 0.0002 - 0.0057 µg/g). DDE: o,p'-DDE was detected in 11 of 50 egg samples (mean 0.0012 ± 0.00048 µg/g, range: 0.0009 - 0.0024 µg/g). In 14 of 42 chick samples, mean o,p'-DDE was 0.0013 ± 0.00057 µg/g and the range was 0.0002 - 0.0021 µg/g. p,p'-DDE, the most commonly detected DDT metabolite in biotic tissue, was found in all egg (Table 3) and chick samples (Table 4). Mean p,p'-DDE was 0.0427 ± 0.02249 µg/g (range: 0.0128 - 0.1379 µg/g) in eggs and 0.0847 ± 0.05467 µg/g (range: 0.0157 - 0.2780 µg/g) in chicks. The highest concentrations were detected in an egg and chick sample from Eastern Egg Rock.
DDT: o,p'-DDT was detected in only four of 50 egg samples (mean 0.0012 ± 0.00034 µg/g, range: 0.0009 - 0.0016 µg/g ). Mean o,p'-DDT in 24 of 42 chick samples was 0.0019 ±
18
0.00206 µg/g (range: 0.0002 - 0.0091 µg/g). p,p'-DDT was detected in 17 of 50 egg samples (mean 0.0033 ± 0.00507 µg/g, range: 0.0008 - 0.0224 µg/g) and in 20 of 42 chick samples (mean 0.0035 ± 0.00663 µg/g , range: 0.0003 - 0.0306 µg/g). 5.2.7 Hexachlorocyclohexanes. Four hexachorocyclohexane isomers were included in the analytical scan of eggs (Table 3) and chicks (Table 4): alpha benzene hexachloride (BHC), beta BHC, gamma BHC, and delta BHC. Alpha BHC was detected in 20 of 50 egg samples (0.0036 ± 0.00377 µg/g; range: 0.0007 - 0.0122 µg/g) with the highest concentration found in an egg from Petit Manan Island. In 32 of 42 chick samples, the mean alpha BHC level was 0.0022 ± 0.00298 µg/g. Beta BHC was found in ten of 50 eggs (mean 0.0011 ± 0.00057 µg/g, range: 0.0005 - 0.0026 µg/g). In chicks, 37 of 42 samples contained beta BHC (mean 0.0010 ± 0.00058 µg/g, range: 0.0002 - 0.0025 µg/g. Gamma BHC, also known as lindane, was detected in only one egg sample (0.0014 µg/g at Pond Island). In chicks, gamma BHC was detected in four of 42 samples (mean 0.0007 ± 0.00011 µg/g, range: 0.0005 - 0.0008 µg/g). Delta BHC was detected in ten of 50 egg samples (mean 0.0015 ± 0.00030 µg/g, range: 0.0010 - 0.0020 µg/g) and in 15 of 42 chick samples (mean 0.0009 ± 0.00047 µg/g, range: 0.0004 - 0.0022 µg/g). 5.2.8 Chlordane Compounds. Six chlordane compounds were included in the organochlorine analytical scan: heptachlor epoxide, oxychlordane, alpha-chlordane, gamma-chlordane, cis-nonachlor, and trans-nonachlor. Heptachlor expoxide was detected in 30 of 50 egg samples (mean 0.0015 ± 0.00066 µg/g, range: 0.0008 - 0.0031 µg/g). All chick samples contained heptachlor epoxide (mean 0.0031± 0.00171 µg/g, range: 0.0007 - 0.0075 µg/g). Oxychlordane was detected in 40 of 50 eggs (mean 0.0025 ± 0.00113 µg/g, range: 0.0008 - 0.0056 µg/g) and 41 of 42 chick (mean 0.0035 ± 0.00219 µg/g, range: 0.0008 - 0.0096 µg/g) samples. Alpha-chlordane was detected in six of 50 egg samples (mean 0.0017 ± 0.00092 µg/g, range: 0.0006 - 0.0027 µg/g) from four of the five study islands. The compound was not detected in eggs from Petit Manan Island. Twenty-eight of 42 chick samples contained detectable levels of alpha-chlordane (mean 0.0009 ± 0.00067 µg/g, range: 0.0002 - 0.0025 µg/g). Gamma-chlordane was below detection in all eggs samples. In 11 of 42 chick samples, mean gamma-chlordane was 0.0005 ± 0.00032 µg/g and the range was 0.0002 - 0.0013 µg/g. Cis-nonachlor was detected in five of 50 eggs (mean 0.0021 ± 0.00041 µg/g, range: 0.0016 - 0.0027 µg/g). In 23 of 42 chick samples, mean cis-nonachlor was 0.0017 ± 0.00181 µg/g (range: 0.0003 - 0.0089 µg/g). Trans-nonachlor was found in 20 of 50 egg samples (mean 0.0033 ± 0.00237 µg/g, range: 0.0008 - 0.0077 µg/g). In 26 of 42 chick samples, mean trans-nonachlor was 0.0043 ± 0.00654 µg/g and the range was 0.0002 - 0.0316 µg/g. 5.2.9 Other organochlorine compounds. In addition to the compounds above, eight other organochlorine compounds were included in the analytical scan. Aldrin was below detection in all egg samples and detected in one chick sample (0.0005 µg/g). Dieldrin was detected in all chick samples and in all but three egg samples. Mean dieldrin in eggs with detectable concentrations was 0.0024 ± 0.00125 µg/g (range: 0.0008 - 0.0073 µg/g). In chicks, the mean dieldrin concentration was 0.0047 ± 0.00385 µg/g (range: 0.0005 - 0.0146 µg/g). Endrin was found in 10 of 50 egg samples (mean 0.0024 ± 0.00125 µg/g, range: 0.009 - 0.0049 µg/g) and in 21 of 42 chick samples (mean 0.0046 ± 0.00432 µg/g, range: 0.0002 - 0.0162 µg/g). Heptachlor was not found in any egg samples and in only one chick sample (0.0017 µg/g from Eastern Egg

19
Rock). Hexachlorobenzene (HCB) was detected in all egg (mean 0.0051 ± 0.00237 µg/g, range: 0.0014 - 0.0109 µg/g) and chick (mean 0.0067 ± 0.00434 µg/g, range: 0.0010 - 0.0230 µg/g) samples. Endosulfan II was found in only two egg samples (0.0017 µg/g and 0.0023 µg/g) and in ten of 42 chick samples (mean 0.0008 ± 0.00053 µg/g, range: 0.0004 - 0.0022 µg/g). Mirex was detected in 34 of 50 egg samples (mean 0.0050 ± 0.00375 µg/g, range: 0.0005 - 0.00179 µg/g) and in 38 of 42 chick samples (mean 0.0057 ± 0.00627 µg/g, range: 0.0009 - 0.0243 µg/g). Pentachloro-anisole was detected in two egg samples, both from Pond Island (0.0010 µg/g and 0.0016 µg/g). Fifteen of 42 chick samples contained pentachloro-anisole (mean 0.0008 ± 0.00037 µg/g, range: 0.0003 - 0.0015 µg/g). Toxaphene was below detection in all egg and chick samples. 5.3 Trace Elements. Tables 6 and 7 summarize trace element concentrations in common tern eggs and chicks, respectively. Units are presented in µg/g fresh wet weight for eggs (i.e., corrected for moisture loss) and in µg/g wet weight for chicks. 5.3.1 Aluminum (Al). Aluminum was detected in five of 50 egg samples (0.58 ± 0.137 µg/g, range: 0.42 - 0.72 µg/g) and in 35 of 42 chick samples (mean 5.42 ± 13.094 µg/g, range: 0.50 - 65.40 µg/g). The outlier chick sample with 65.40 µg Al/g was from Pond Island. If this sample is excluded the mean Al level in chicks was 3.66 ± 8.027 µg/g. 5.3.2 Arsenic (As). Arsenic was detected in 47 of 50 egg samples (mean 0.07 ± 0.015 µg/g, range: 0.04 - 0.11 µg/g) and 40 of 42 chick samples (mean 0.17 ± 0.093 µg/g, range: 0.06 - 0.58 µg/g). 5.3.3 Boron (B). Boron was below the detection limit in all egg samples. In chick samples, boron was detected in five of 42 samples (mean 0.58 ± 0.084 µg/g, range: 0.50 - 0.70 µg/g). 5.3.4 Barium (Ba). In 11 of 50 eggs, the mean Ba level was 0.08 ± 0.061 µg/g (range: 0.05 - 0.26 µg/g). Barium was detected in 29 of 42 chicks (mean 0.09 ± 0.025 µg/g, range: 0.05 - 0.19 µg/g). At Pond Island, Ba was significantly higher in chicks collected in 2005 than in 2004. 5.3.5 Beryllium (Be). Beryllium was below detection limits in all egg and chick samples. 5.3.6 Cadmium (Cd). Cadmium was only detected in one egg at 0.03 µg/g. In chicks, Cd was detected in 11 of 42 samples (mean 0.05 ± 0.031 µg/g, range: 0.02 - 0.13 µg/g). At Pond Island and Petit Manan Island, Cd was significantly higher in chicks collected in 2004 than in 2005. 5.3.7 Chromium (Cr). Similar to cadmium, chromium was only detected in one egg (0.09 µg/g). Eight of 42 chick samples had detectable levels of chromium (mean 0.31 ± 0.360 µg/g, range: 0.10 - 1.20 µg/g). The highest chick Cr level was found at Pond Island. 5.3.8 Copper (Cu). Copper was detected in all samples. In eggs, the Cu mean was 0.61 ±

20
0.091 µg/g (range: 0.44 - 1.01 µg/g). In chicks, the Cu mean was 1.69 ± 2.955 µg/g (range: 0.78 - 20.30 µg/g). The highest concentration was in a chick sample from Petit Manan Island. If this sample is excluded, the mean Cu in chicks was 1.23 ± 0.272 µg/g. 5.3.9 Iron (Fe). Iron was detected in all samples. For eggs, the mean Fe concentration was 26 ± 4.1 µg/g (range: 17 - 35 µg/g). Higher concentrations were detected in chicks (mean 52 ± 40.5 µg/g, range: 26 - 264 µg/g). At Pond Island, Fe was significantly higher in chicks collected in 2005 than in 2004. 5.3.10 Mercury (Hg). All egg samples (mean 0.11 ± 0.033 µg/g, range: 0.06 - 0.20 µg/g) and chick samples (0.16 ± 0.066 µg/g, range: 0.06 - 0.38 µg/g) contained Hg. 5.3.11 Magnesium (Mg). Magnesium was detected in all samples. In eggs, mean Mg was 92.6 ± 9.24 µg/g (range: 66.8 - 109.1 µg/g). In chicks, mean Mg was 249 ± 46.3 µg/g (range: 165 - 354 µg/g). 5.3.12 Manganese (Mn). All samples contained manganese. Mean Mn was 0.50 ± 0.162 µg/g (range: 0.23 - 1.04 µg/g) in eggs and 1.11 ± 0.479 µg/g (range: 0.40 - 3.30 µg/g) in chicks. 5.3.13 Molybdenum (Mo). Molybdenum was below detection limits in all samples. 5.3.14 Nickel (Ni). Nickel was below detection in all egg samples and detected in one chick sample (0.20 µg/g at Eastern Egg Rock). 5.3.15 Lead (Pb). Lead was detected in two egg samples, both at 0.07 µg/g and both from Jenny Island. Eight chick samples contained detectable levels of Pb (mean 0.12 ± 0.141 µg/g, range: 0.05 - 0.46 µg/g). 5.3.16 Selenium (Se). Selenium was detected in all samples. In eggs, mean Se was 0.60 ± 0.090 µg/g (range: 0.37 - 0.83 µg/g). In chicks, mean Se was 0.63 ± 0.125 µg/g (range: 0.42 - 0.99 µg/g). 5.3.17 Strontium (Sr). All samples contained strontium. The mean Sr in eggs was 1.20 ± 0.511 µg/g (range: 0.36 - 3.06 µg/g). The mean Sr in chicks was 5.64 ± 2.288 µg/g (range: 1.90 - 13.70 µg/g). The highest Sr concentration was found in a chick sample from Petit Manan Island. 5.3.18 Vanadium (V). Vanadium was below detection in all egg samples and found at the detection limit (0.10 µg/g) in one chick sample collected from Pond Island. 5.3.19 Zinc (Zn). Zinc was detected in all samples. In eggs, mean Zn was 13.4 ± 2.14 µg/g (range: 9.1 - 18.3 µg/g). In chicks, mean Zn was 23.8 ± 5.55 µg/g (range: 16.0 - 37.4 µg/g). 5.4 Lipids - The average lipid content in eggs and chicks was 6.43% and 2.65%, respectively.

21
Lipid content was not significantly different in eggs (Figures 2 and 3) or in chicks (Figures 4 and 5) among islands and between years. In eggs and chicks, lipid content between target and reference islands was not significantly different (Figure 10 and 12). 6. Discussion A compound or element is discussed below if it was found in one-half or more of the samples (i.e., in 25 of 50 eggs or 21 of 42 chicks). Contaminant concentrations in common tern eggs and chicks from target islands were compared to reference islands, to regional and other tern studies, and to biological effect levels reported in the scientific literature. Most concentrations in this report are presented in µg/g wet weight on a fresh wet weight basis (i.e., corrected for moisture loss) for eggs and in µg/g wet weight for chicks. PCDD/Fs, dioxin-like PCB congeners, and TCDD-TEQ are presented in pg/g. Other PCB congeners are presented in ng/g. To facilitate comparisons with other studies that reported concentrations on a dry weight basis or in ng/g (i.e., parts-per-billion), values in those studies were converted to wet weight using dry weight divided by three (Burger and Gochfeld 2004) and, if necessary converted to from ng/g to µg/g (1 µg/g = 1,000 ng/g). It should be noted, however, that the dry weight to wet weight conversion would not account for differences between wet weight and fresh wet weight concentrations. Generally, fresh wet weight concentrations would be slightly lower that wet weight levels. Tern eggs and chicks have been used in several contaminant studies in response to reports of abnormalities (Hays and Riseborough 1972, Gilbertson et al. 1976), declines in reproductive success (Custer et al. 1983, Kubiak et al. 1989, Castillo et al. 1994), or as bioindicators of temporal trends in contaminants (Burger and Gochfeld 2004). Egg concentrations generally reflect contaminant uptake of female terns foraging near the nesting colony prior to egg laying (Burger 2002, Burger et al. 1992, Becker and Cifuentes 2004). 6.1 Organochlorine Compounds The organochlorine compound scan included chlorinated aromatic hydrocarbons, cyclodiene insecticides, and other compounds that are known to accumulate in animal tissue and have lethal or sub-lethal effects in wildlife. Several of these compounds have been associated with embryotoxicity, developmental abnormalities, early life-stage mortality, or reduced productivity in birds and are discussed below. Some of these compounds, however, were below detection limits or were only sporadically detected in tern egg and chick samples from the Maine coast. Consequently, the following organochlorine compounds were not assessed: aldrin, endrin, heptachlor, endosulfan II, toxaphene, and pentachloro-anisole. Except for a few instances, organochlorine compound levels between years were not significantly different. Both years of data were combined into single datasets by sample type (i.e., eggs or chicks) and tested for differences between target islands (Stratton, Jenny, Pond) and reference islands (Eastern Egg Rock, Petit Manan). Only the organochlorine compounds that were frequently detected were tested for statistical significance: Total PCB, DDE, heptachlor epoxide, oxychlordane, dieldrin, HCB, and mirex.
22
For the compounds that were detected in the majority of samples, a brief description of the compound is provided, along with its potential impacts on birds, comparative data from regional or other tern studies to place our concentrations in context, and a summary assessment of the particular compound. It should be noted that earlier organochlorine contaminant investigations often used less precise analytical methods with higher detection limits than the methods and analytical capabilities available today. Hence, comparisons of our organochlorine compound concentrations and detection limits with earlier studies should take these analytical differences into consideration. 6.1.1 Dioxins and Furans. Polychlorinated dibenzo-p-dioxins (PCDD) occur naturally (e.g., originating from forest fires and volcanic activity) and are also introduced to the environment from human sources (e.g., incinerator and combustion emissions, kraft paper bleaching processes, herbicides, wastewater treatment systems) (ATSDR 1998). Polychlorinated dibenzofurans (PCDF), which commonly co-occur with PCDDs, are a contaminant family similar in structure and toxicological properties as dioxins (Colburn et al. 1997). PCDD/Fs have been linked to reproductive impairment and sub-lethal effects such as developmental abnormalities in birds, but there are large differences in sensitivity among wild species (Elliott et al. 1996). Common terns appear to be less sensitive to the effects of dioxin and other halogenated aromatic hydrocarbons than highly sensitive species like the domestic chicken (Gallus gallus, Karchner et al. 2006). Among the five study islands, Pond Island is located closest to potential PCDD/F sources from the mainland. Pond Island sits in the mouth of the Kennebec River which has several municipal wastewater treatment plants and four kraft pulp and paper mills located upstream on the Kennebec and Androscoggin Rivers (Note: The Androscoggin River meets with the Kennebec at Merrymeeting Bay). Eggs: Although known potential sources occur in the flowages above Pond Island, PCDD/Fs were not detected in composite egg samples above sample detection limits (Table 5). Similarly, PCDD/Fs were below sample detection limits in egg composite samples from Stratton Island and the reference island, Petit Manan Island (Table 5). PCDD/F Assessment: In highly sensitive species such as chickens and wood ducks, TCDD levels in eggs of 20 to 50 pg/g were lethal, teratogenic, or decreased productivity (Hoffman et al. 1996). In the three composite tern egg samples, TCDD was below detection at 7 pg/g. Since TCDD levels in tern eggs did not approach biological thresholds suggested for more sensitive avian species, 2,3,7,8-TCDD was likely not related to tern embryo mortality or chick abnormalities along the Maine coast. Only three 3-egg composites from three islands were analyzed, however, and the potential impact of this contaminant cannot be completely assessed.
6.1.2 Dioxin Toxic Equivalents (TCDD-TEQ). A common tern TCDD-TEQ toxicity threshold has not been established. Various effect thresholds have been proposed using different analytical methods. For example, in Forster’s tern embryotoxicity occurred at 90 to 339 pg/g of TCDD equivalents (determined with the H4IIE bioassay) and at 618 to 7,336 pg/g TCDD-TEQ (determined with congener chemistry; Hoffman et al. 1996). In a retrospective analysis of

23
TCDD-TEQs in Great Lakes colonial waterbirds reinterpreted with World Health Organization TEFs, Kubiak (2007) suggested a 600 pg/g threshold for reduced egg hatchability. Hoffman et al. (1998) determined developmental effects of PCB congeners #77 and #126 on chicken, American kestrel, and common tern embryos. Chickens were more sensitive than kestrels, which were more sensitive than terns. Converting Hoffman’s results to a TCDD-TEQ assuming a TCDD toxic equivalency factor of 0.1 for PCB #126 results in a 4.4 ng/g or 4,400 pg/g LOAEL (Lowest Observable Adverse Effect Level) for the common tern. Hart (1998) suggested a threshold of 30 ng/g lipid TCDD-TEQ, above which the formation of ovotestes in common tern embryos is more likely to occur.
Eggs: Figure 6 depicts TCDD-TEQ levels in tern composite egg samples from Stratton Island (65 pg/g), Pond Island (59 pg/g) and Petit Manan Island (17 pg/g). These levels were lower than Forster’s tern and laboratory-derived threshold levels affecting hatching success or embryo development (Hoffman et al. 1996 and 1998, Kubiak 2007) and lower than common tern concentrations reported for Bird Island in Buzzards Bay, MA (Hart 1998, Figure 7). On a lipid weight basis, TCDD-TEQs in egg composite samples from the three islands (range: 0.24 – 0.66 ng TCDD-TEQ / g lipid) were also below the feminization threshold of 30 ng TCDD-TEQ / g lipid suggested by Hart (1998). PCB #77 was the only non-ortho PCB congener detected in composite egg samples from the three islands and the greatest dioxin-like PCB contributor to the TCDD-TEQ (> 95%). Several dioxin-like mono-ortho PCB congeners were detected in composite egg samples, but contributed little to the TCDD-TEQ (< 5%, Table 5). TCDD-TEQ Assessment: TCDD-TEQs in common tern egg composites from the Maine coast were well below the 600 pg/g egg hatchability effect threshold suggested by Kubiak (2007) and feminization threshold suggested by Hart (1998). A consensus-based TCDD-TEQ biological effect level for terns has not been established, and the effect levels suggested by Hoffman et al. (1998), Hart (1998), and Kubiak (2007) are only provided for comparative purposes. Nonetheless, our TCDD-TEQ levels are well below all of their suggested biological effect levels. It should also be noted that the sample size in our assessment is very small (n = 3) due to analytical costs associated with PCDD/Fs and congener-specific PCBs. Additional samples would be needed to properly characterize the TCDD-TEQ for common terns off the coast of Maine.
6.1.3 Other PCB Congeners. Polychlorinated biphenyl is a group of 209 congeners with
varying degrees of toxicity and ability to cause biological effects (Eisler and Belisle 1996). The congener-specific analytical scan for this study was able to distinguish 96 congeners with several co-elutes increasing the total number to 146 congeners. Congener patterns can be used to discern dietary differences among birds (Mora 1996) and to identify contaminant sources (Litten et al. 2002).
Eggs: Patterns of PCB congeners in tern egg composites appeared similar among islands (Figure 8). Common tern egg composites from three islands along the Maine coast were dominated by congener PCB #153. Of the Total PCB, PCB #153 accounted for approximately 20% in the three egg composites.
24
PCB Congener Assessment: PCB #153 is the most widespread PCB congener in the environment because it is stored and retained in adipose tissue (Eisler and Belisle 1996). In a common tern yolk sac study from the Netherlands and Belgium, PCB #153 was also the major PCB congener present (Bosveld et al. 1995). The range of PCB #153 concentrations in the three composite egg samples from the Maine islands (44 – 164 ng/g) was considerably lower than the range reported in the Netherlands and Belgium study (100 – 69,052 ng/g, Bosveld et al. 1995). Other dominant PCB congeners in egg composite samples were PCB #138, PCB #180, and PCB #118. These PCB congeners have been found to be dominant in several avian egg studies (Eisler and Belisle 1996) and in a recent tern study in Massachusetts (Jayaraman et al. 2006). A unique PCB contaminant source does not appear evident based on the PCB congener patterns from three of the study islands. There is a strong similarity among the three PCB congener patterns. It is unlikely one PCB source on the coast would affect all three islands. There are considerable distances among the three islands, the shorelines are highly dissimilar at each island, and there are strong tidal currents (up to 4 knots) influenced by tidal fluctuations and rivers (e.g., the Kennebec River emptying at Pond Island). A contaminant gradient along the Maine coast, from the southern coast to Downeast, is indicated by the higher PCB congener level at Stratton Island compared to Petit Manan Island (Figure 9), and also by the Total PCB concentrations in eggs among the five islands (Figure 15).
6.1.4 Total Polychlorinated biphenyls (PCBs). PCBs were used for decades as a coolant and insulating agent in electrical transformers and capacitors (Eisler 1986). Although PCBs were banned from the United States in 1979, the compound persists in the environmental as a legacy contaminant from historic discharges and improper disposal practices. Incineration of PCB-contaminated material has also spread the compound worldwide through atmospheric deposition. PCBs, particularly PCBs with dioxin-like activity, adversely affect survival, growth, reproduction, metabolism, and readily accumulate in wildlife (Eisler and Belisle 1996). Reproductive effects caused by PCB exposure in birds include reduced hatchability, embryo mortality, and chick deformities (Hoffman et al. 1996). Common tern egg Total PCB levels above 7.5 µg/g were associated with decreased hatching success (Hoffman et al. 1996). Eggs: Mean Total PCB concentration in common tern eggs from the five Gulf of Maine islands was 0.36 µg/g (range: 0.089 – 0.907 µg/g, Table 6). Total PCB concentrations in eggs were significantly higher at the three target islands than the two reference islands on a fresh wet weight basis (p < 0.001, Figure 14). On a lipid weight basis, the mean for eggs was 5.99 µg Total PCB per g lipid. Lipid levels in eggs were similar between target and reference islands (Figure 10), but Total PCB on a lipid weight basis in eggs was significantly higher at the three target islands (p = 0.003, Figure 11) than the reference islands. To place the Maine PCB results in context, several regional tern contaminant studies were found in the literature. Total PCBs have declined over the decades in the northeastern United States, so our results compared to older studies should be viewed in this light. In nine common tern

25
colonies sampled in 1973 and 1974 in Massachusetts, Total PCB ranged from 3.69 – 29.4 µg/g (Nisbet and Reynolds 1984). In 1986, seven common tern eggs from the Great Bay Estuary, NH, had a mean Total PCB level of 0.89 ± 0.26 µg/g and a range of 0.45 to 1.16 µg/g (Carr and von Oettingen 1989). Total PCB concentrations in common tern eggs from Wickford, RI, were 4.67 µg/g (range: 2.4 – 12.0 µg/g) in 1980 and 2.17 µg/g (range: 1.35 – 3.21 µg/g) in 1981 (Custer et al. 1985). At Seal Island NWR, ME, and Monomoy Island, MA, single 3-egg composite samples contained Total PCB concentrations of 0.343 µg/g and 0.671 µg/g (Mierzykowski 2008). For a regional comparison on a lipid weight basis, Total PCB concentration in common tern eggs collected at Buzzards Bay, MA, in 2005 was 34.60 µg Total PCB per g lipid (Jayaraman et al. 2007). In our study, 50 eggs from the Maine coast had 5.99 µg Total PCB per g lipid. Chicks: There was no significant difference in chick Total PCB concentrations between target and reference islands (p = 0.144, Figure 14). Mean Total PCB concentration in whole-body chicks from the five Gulf of Maine islands was 0.62 µg/g. Compared to other studies, these chick PCB levels appear low. At three Rhode Island sites, Custer et al. (1985) reported Total PCBs levels in prefledging common terns without skin, gastrointestinal tracts, livers or kidneys of 0.85 µg/g, 1.17 µg/g, and 2.82 µg/g. Since these tissues were removed prior to contaminant analyses, Custer et al. (1985) suggested organochlorine concentrations were probably underestimated by 50%. In a study of common terns from the River Rhine (Castillo et al. 1994), mean total PCB concentration in chicks post-hatch was 14.65 µg/g (range: 4.41 - 49.33 µg/g). In the Fox River, WI, Total PCB concentrations in two 5-day old chicks were 5.60 and 8.29 µg/g (Ankley et al. 1993). In a study of abnormalities in young common tern chicks, Hays and Riseborough (1972) reported median PCB concentrations of 25 µg/g in breast muscle. Total PCB Assessment: Total PCB concentrations in eggs and chicks from the five Gulf of Maine islands were lower than levels reported in studies with chick abnormalities (Hays and Risebrough 1972, Gilbertson et al. 1976, Becker et al. 1993). Compared to suggested effect levels and other studies, Total PCB concentrations in common tern eggs and chicks from the five Maine islands do not appear elevated. The Gulf of Maine tern egg mean was lower than Total PCB concentrations reported in an earlier study conducted near the southern Maine border and in more recent collections in Buzzards Bay. During the two years of sampling, no patterns were evident in fledging success relative to Total PCB concentrations in eggs (Figure 16) or chicks (Figure 17). As noted above, a contaminant gradient along the Maine coast, from the southern coast to Downeast, is indicated by the higher PCB congener level at Stratton Island compared to Petit Manan Island (Figure 9), and also by the Total PCB concentrations in eggs among the five islands (Figure 15). However, the same pattern or gradient is not evident in chick Total PCB concentrations (Figure 15).
6.1.5 DDT Metabolites. All egg (Table 3) and chick (Table 4) samples were analyzed for six DDT metabolites in this study: o,p’-DDD, o,p’-DDE, o,p’-DDT, p,p’-DDD, p,p’-DDE, and p,p’-DDT. Although the use of DDT in the United States was essentially discontinued in 1972
26
(EPA 1990), the compound and its metabolites continue to be detected in wildlife tissues. DDT metabolites are lipophilic and accumulate in lipid deposits and other fatty tissues (Blus 2003). DDE, dichlorodiphenyldichloroethylene, is a metabolite of the pesticide DDT and the most persistent DDT remnant in fish and wildlife tissue. In raptors and piscivorous birds, DDT metabolites cause eggshell thinning (Hickey and Anderson 1968). Eggs of piscivorous birds with DDE residues of 1 µg/g have a 5% to 10% reduction in eggshell thickness, and eggshells with 18% thinning are associated with declining populations (Blus 1996). In general, DDE residues in wildlife tissues have declined substantially since the DDT ban. Eggs: Nisbet (2002, citing three studies) suggested severe reproductive effects in a tern colony with DDE in eggs above 4.0 µg/g and hatching failure at levels as low as 1.9 µg/g. DDE residues in common tern eggs (mean 0.04 µg/g) from the five Gulf of Maine islands were orders of magnitude lower than concentrations associated with these adverse effects. There was no significant difference in DDE levels between the target and reference islands (p = 0.067, Figure 18). Chicks: DDE in prefledging whole-body tern chicks (mean 0.08 µg/g) from the Maine coast was approximately twice the level found in tern eggs (Figure 19). DDE levels in chicks were not significantly different between target and reference islands (p = 0.571, Figure 18). Chick DDE levels did not appear elevated compared to other studies. In a Rhode Island study with three sampling locations, the maximum DDE residues in prefledging terns was 0.24 µg/g and the lowest was below the detection limit (Custer et al. 1985). In a common tern study in France, mean DDE concentration in ten common tern chicks was 0.08 µg/g (range: 0.02 - 0.22 µg/g, Castillo et al. 1994). In a study of abnormalities in young common tern chicks at the eastern end of Long Island, NY, Hays and Riseborough (1972) reported median DDE concentrations of 2.1 µg/g in breast muscle. DDE Assessment: DDE concentrations in tern eggs from the Maine coast were well below the 1.9 µg/g level associated with hatching failure. Chick carcass DDE concentrations were also lower than levels reported in studies with chick abnormalities (Hays and Risebrough 1972). It should be noted that elevated PCB levels (median 25 µg/g) in tern chick breast muscle were also reported in the Hays and Risborough (1972) investigation.
6.1.6 Hexachlorocyclohexanes – Hexachlorocyclohexane (HCH), also referred to as
benzene hexachloride (BHC), is a pesticide comprised of several isomers. The more appropriate term is hexachlorocyclohexane (Blus 2003), but the USFWS contract laboratories and USFWS Analytical Control Facility continue to use benzene hexachloride. In our citations of other studies below, we insert BHC where the authors use HCH for consistency purposes. The organochlorine analytical scan for this study included the BHC isomers alpha, beta, gamma, and delta. Gamma BHC, or lindane, is a restricted-use pesticide used in treating wood-inhabiting beetles and seed, as a dip for fleas and lice on pets and livestock, for soil treatment, foliage applications, and wood protection (EPA 2006). In domestic chickens, lindane reduced hatchability and egg production, increased embryonic mortality, and induced eggshell thinning (Blus 2003).

27
Eggs: The four BHC isomers were below detection limits in all 2004 egg samples. In 2005 the highest alpha BHC level (0.0122 µg/g) and mean (0.0078 µg/g) in eggs among the five islands was detected on one of the reference islands, Petit Manan Island. Few regional tern studies were found that reported BHC concentrations in eggs. In 1986, total BHC was below detection in seven common tern eggs from the Great Bay Estuary, NH (Carr and von Oettingen 1989). For Europe and Russia, three papers were found that reported egg residue levels of BHC. In the River Rhine area of France, the maximum gamma BHC levels in common tern eggs was 0.0045 µg/g (Castillo et al. 1994). Gamma BHC in 17 common tern eggs from Southern Karelia, Russia, had a mean of 0.022 µg/g and range of 0.010 – 0.040 µg/g (Medvedev and Markova 1995). In the Elbe estuary of Germany, total BHC in common tern eggs ranged from 0.50 to 2.90 µg/g (Becker et al. 1993). Chicks: Similar to eggs, BHC concentrations in chicks were lower and detected less often in samples collected in 2004 than chicks collected in 2005. In 2004, alpha BHC was detected in several chick samples, usually just above the detection limit of 0.0002 µg/g. Beta BHC was detected in all but one 2004 chick sample with the two highest detections occurring at the two reference islands (0.0024 µg/g at Petit Manan Island and 0.0025 µg/g at Eastern Egg Rock. In 2005, alpha and beta BHC were detected consistently among the five islands with significantly higher levels (p < 0.05) of alpha BHC occurring at Petit Manan Island (mean 0.0083 µg/g), one of the reference islands, and beta BHC occurring at Pond Island (mean 0.0015 µg/g), one of the target islands. No other regional tern chick studies were found to compare BHC concentrations. In 1988 in the Rhine River area of France, young chicks hatching had gamma BHC concentrations ranging from 0.0010 to 0.0022 µg/g, mean 0.0014 µg/g (Castillo et al. 1994). BHC (or HCH) Assessment: A tern egg hatchability threshold for BHC was not found in the scientific literature. In other species, hatchability was unaffected in eggs of ring-necked pheasants with 10 µg/g of beta BHC or American kestrels with 5.5 µg/g of gamma BHC (Wiemeyer 1996). Compared to limited egg hatchability data for these species and to levels reported in other tern studies, BHC levels in common tern eggs (max. 0.0012 µg/g) from the Maine coast do not appear elevated. Tern chick BHC concentrations (max. 0.0025 µg/g) were higher than egg levels, and similar to levels reported in other tern studies.
6.1.7 Chlordane compounds - Chlordane is a cyclodiene insecticide that was once widely used in the United States to control termites, ants, and agricultural pests (Eisler 1990). The use of chlordane was banned in the United States in 1988, but components of the contaminant persist in the environment and in wildlife tissue. Chlordane has a medium to high immediate toxicity to birds (Briggs 1992) and has been implicated in mass bird mortalities (Stansley and Roscoe 1999). Chlordane components in the analytical scan include alpha-chlordane, gamma-chlordane, cis-nonachlor, trans-nonachlor, heptachlor-epoxide, and oxychlordane. Eggs: On the coast of Maine, oxychlordane (max. 0.0056 µg/g) was the most often detected chlordane compound in common tern egg samples, followed by heptachlor epoxide (max. 0.0031 µg/g), and trans-nonachlor (max. 0.0074 µg/g). Oxychordane in eggs was significantly higher (p = 0.003, Figure 20) between target and reference islands, but heptachlor epoxide was not (p =

28
0.742, Figure 22). For comparative purposes, several studies were found reporting chlordane levels in common tern eggs. Ten clutches of common tern eggs from Yarmouth, MA, had heptachlor epoxide levels ranging from 0.003 – 0.017 µg/g (Nisbet 1982). At Bird Island, MA, Nisbet and Reynolds (1984) reported alpha-chlordane concentrations of 0.054 – 0.170 µg/g and oxychlordane levels of 0.009 – 0.034 µg/g in common tern eggs collected between 1976 and 1981. In a study of eggs from nine Atlantic coast common tern colonies, cis-chlordane was detected in 5 of 178 samples (max. 0.19 µg/g) and trans-nonachlor was detected in 25 of 178 samples (max. 0.31 µg/g, Custer et al. 1983). Carr and von Oettingen (1989) reported total chlordane levels below detection (< 0.01 µg/g) in seven common tern eggs from the Great Bay estuary in NH. Similarly, chlordane compounds were below detection (< 0.01 µg/g) in 11 Arctic tern eggs collected from Petit Manan Island in 1993 (Mierzykowski et al. 2001). Weseloh et al. (1989) found scattered detections of oxychlorane (max. 0.13 µg/g), cis-chlordane (max. 0.12 µg/g), cis-nonachlor (max. 0.08 µg/g), and trans-nonchlor (max. 0.30 µg/g) in ten common tern eggs from the Canadian Great Lakes in Ontario. Chicks: Heptachlor expoxide (max. 0.0075 µg/g) was detected in all chick samples and oxychlordane (max. 0.0096 µg/g) was detected in all but one of the chick samples. Alpha chlordane (max. 0.0025 µg/g), gamma chlordane (max. 0.0013 µg/g), cis-nonachlor (max. 0.0089 µg/g), and trans-nonachlor (max. 0.0316 µg/g) were detected sporadically in chick samples among the islands. As in eggs, oxychlordane was significantly higher at the target islands than the reference islands (p = 0.006, Figure 20), but heptachlor epoxide was not (p = 0.545, Figure 22). Only one study was located reporting chlordane concentrations in chick samples. Castillo et al. (1994) reported heptachlor epoxide in chick samples from the River Rhine area of France (max. 0.0011 µg/g). Chlordane Assessment: An adverse effect threshold or screening benchmark (RAIS 2008) for chlordane in eggs or chicks were not located in the scientific literature. Reproduction was unaffected in northern bobwhites and mallards fed 3 µg/g and 8 µg/g of technical chlordane (Wiemeyer 1996). Chlordane compounds in excess of 2 µg/g in brain tissue were lethal in birds (Blus 2003). Levels of chlordane compounds in tern samples from the Maine coast do not appear elevated compared to other studies reporting residue levels.
6.1.8 Dieldrin – Dieldrin is a cyclodiene instecticide that was formerly used for the control of Japanese beetles and fire ants (Blus 2003) and as a seed dressing (Peakall 1996). Dieldrin was implicated in several large mortality events involving several bird species (Peakall 1996). The compound was banned for use in the United States in 1987. Eggs: Dieldrin was detected in all but three of the 50 common tern eggs from the Maine coast (mean 0.0024 µg/g, range: 0.0008 - 0.0073 µg/g, Table 3). There was no significant difference in dieldrin concentrations between target islands and reference islands (p = 0.148, Figure 24). Dieldrin levels in Maine common tern eggs do not appear elevated compared to earlier tern investigations. In the Canadian Prairie provinces, composite egg samples from six colonies in the late 1960s had dieldrin levels ranging from 0.017 to 0.396 µg/g (Vermeer and Reynolds 1970). Thirteen common tern eggs from Hamilton Harbour, Ontario, had a mean dieldrin concentration of 1.64 µg/g (Gilbertson and Reynolds 1972; converted to wet weight using dry
29
weight/3). Nisbet (1982) reported dieldrin levels in common tern eggs from Yarmouth, MA, ranging from 0.029 – 0.083 µg/g. In a 1980 study of common terns along the Atlantic coast of the United States in 1980, Custer et al. (1983) found dieldrin in 17 of 178 eggs with a maximum concentration of 0.24 µg/g. Chicks: Dieldrin was found in all chick samples (mean 0.0047 µg/g, range: 0.0005 - 0.0146 µg/g, Table 4). In prefledging common terns from a colony in Providence, RI, Custer et al. (1985) found dieldrin in only three of 15 samples with a maximum concentration of 0.14 µg/g. Dieldrin concentrations in chicks were similar between target and reference islands (p = 0.860, Figure 24). Dieldrin Assessment: Dieldrin levels in common tern eggs were low compared to earlier investigations and well below the level associated with population declines in raptors (0.70 µg/g, Peakall 1996). Attributing avian population declines to dieldrin, however, is confounded by the presence of other organochlorine contaminants in eggs (Blus 2003).
6.1.9 Hexachlorobenzene (HCB) – HCB is a fungicide and starting material for the wood preservative, pentachlorophenol (Gilbertson and Reynolds 1972). It is a contaminant in the herbicide Dacthal and is persistent in the environment (Wiemeyer 1996). Based on its ability to bind to the aryl hydrocarbon (Ah) receptor, its dioxin-like effects, and ability to bioaccumulate, it has been suggested that HCB be classified as a dioxin-like compound (van Birgelen 1998). HCB is often released to the atmosphere from the same sources that are releasing PCDD/Fs (e.g., chloralkali and wood-preserving plants, municipal and hazardous waste incinerators; ATSDR 2002, Environment Canada 1999). Eggs: HCB was detected in all common tern eggs from the Maine coast (mean 0.0051 µg/g, range: 0.0014 - 0.0109 µg/g, Table 3) and levels were similar between target and reference islands (p = 0.154, Figure 26). HCB levels in Maine tern eggs do not appear elevated compared to earlier North American and European investigations. In these other common tern studies, HCB levels in eggs were 0.006 – 0.028 µg/g (Yarmouth, MA; Nisbet 1982), 0.009 – 0.028 µg/g (nine colonies, MA; Nisbet and Reynolds 1984), 0.02 – 0.37 µg/g (Western Lake Superior, Niemi et al. 1986), non-detect to 0.13 µg/g (Canadian Great Lakes, Weseloh et al. 1989), 0.45 – 4.90 µg/g (Hamilton Harbour, ON; Gilbertson and Reynolds 1972; converted to wet weight using dry weight/3), and 4.5 – 30.1 µg/g (Elbe estuary, Germany; Becker et al. 1993). A study at Petit Manan Island with Arctic terns eggs from the 1993 breeding season found HCB levels ranging from non-detect to 0.021 µg/g (mean 0.015 µg/g, Mierzykowski et al. 2001). Chicks: The mean HCB in chick samples was 0.0067 µg/g (range: 0.0010 - 0.0230 µg/g, Table 4). There was no significant difference between chicks from target islands and reference islands (p = 0.078, Figure 26). Few studies were found to compare HCB levels in chicks. In pre-fledge common tern muscle tissue, Niemi et al. (1986) detected HCB at 0.0100 µg/g in five samples. In two to 14 day old common tern chicks from the German Wadden Sea, HCB on a lipid weight basis was 2.82 µg/g (Scharenberg 1991). In comparison, HCB on a lipid weight basis in tern chicks from the Maine coast was 0.368 µg/g.

30
HCB Assessment: An egg adverse effect level for HCB in terns was not found in the literature, but Wiemeyer (1996) cited two studies where reproduction appeared normal in Canada geese and American kestrel when maximum HCB levels were 2.97 µg/g and 2.40 µg/g, respectively. HCB levels in common terns from the Maine coast were well below these reproductive effect thresholds.
6.1.10 Mirex. Mirex was a pesticide used to control fire ants in the southeastern United States as a replacement for dieldrin and heptachlor, and as a fire retardant (Eisler 1985a, Blus 2003). Although banned in the U.S. in 1978, the compound persists in the environment and in wildlife tissue (Wiemeyer 1996). Eggs: Although not all egg samples had detectable levels, mirex was detected at all five islands in both years of egg sampling. Mirex was significantly higher in common tern eggs from the target islands than the reference islands (p = 0.011, Figure 28). The maximum mirex concentration in a common tern egg was detected at Stratton Island (0.0179 µg/g). In 1986, mirex was below detection (< 0.01 µg/g) in seven common tern eggs from the Great Bay Estuary, NH (Carr and von Oettingen 1989). Similarly, mirex was below detection (< 0.01 µg/g) in 11 Arctic terns egg from Petit Manan Island in 1993 (Mierzykowski et al. 2001). Chicks: Mirex was detected in all chick samples except for four samples from Jenny Island in 2005. The maximum mirex concentration in chick samples was 0.0226 µg/g from Eastern Egg Rock, one of the study reference islands. In contrast to egg concentrations, mirex levels in chicks were not significantly different between target and reference islands (p = 0.950, Figure 28) No studies in the scientific literature were located that reported mirex levels in tern chick carcasses. Mirex Assessment: In dietary studies and subsequent analysis of eggs of domestic chickens, hatchability was not affected until mirex levels reached 450 µg/g. Reproduction in other test species (e.g., mallard) was not affected when mirex residues in eggs averaged 20 µg/g (Wiemeyer 1996). Mirex levels in common tern eggs from the Maine coast were well below these levels. No comparative information was found regarding chick carcass concentrations, but the maximum mirex levels in chicks were similar to eggs (0.02 µg/g). 6.2 Trace Elements. Several trace elements were detected in common tern eggs (Table 6) and/or chicks (Table 7). Sporadically detected elements (i.e., boron, cadmium, chromium, nickel, lead, vanadium) or elements below detection in all samples (i.e., beryllium, molybdenum) or elements with few known impacts on birds (e.g., aluminum, barium, iron, magnesium) are not discussed below. Except for a few instances, trace element levels between years were not significantly different. Both years of data were combined into single datasets by sample type (i.e., eggs or chicks) and tested for differences between target islands (Stratton, Jenny, Pond) and reference islands (Eastern Egg Rock, Petit Manan).
31
The following section provides a brief description of a particular trace element, notes on its potential impacts on birds, comparative data from regional or other tern studies to place our concentrations in context, and a summary assessment of the particular compound. In contrast to organochlorines, trace element analytical methods and detection limits for residue analyses have not changed dramatically over the years. 6.2.1 Arsenic (As). Arsenic is a metalloid used in the production of pesticides and wood preservatives. Coal-fired power utilities and metal smelters annually release tons of arsenic into the atmosphere (Environment Canada 1993). Pressure-treated lumber is used extensively along the coast, and wood remnants with earlier pressure-treated formulations containing chromated copper arsenate likely exist within the wrack line of all the study islands. The bioavailability of arsenic from this wood debris is not known. Arsenic is a teratogen and carcinogen, which bioconcentrates in organisms, but does not biomagnify in food chains (Eisler 1994). In mallard dietary studies, arsenic exposure did not affect hatching success and was not teratogenic, but did delay egg laying, reduce egg weight, and cause eggshell thinning (Stanley et al. 1994). Eggs: Common tern eggs from the Maine coast had a mean arsenic level of 0.07 µg/g (Table 6) and concentrations were not significantly different between target islands and reference islands (p = 0.629, Figure 30). The mean arsenic level in Maine tern eggs is similar to other regional tern studies. In 35 common tern eggs from Barnegat Bay, NJ (Burger 2002) the mean arsenic level was 0.06 µg/g (converted to wet weight using dry weight/3) and the maximum concentration was 0.14 µg/g. In seven common tern eggs from the Great Bay Estuary, NH, mean arsenic was 0.04 ± 0.07 µg/g and the range was 0.01 to 0.20 µg/g (Carr and von Oettingen 1989). Five Arctic terns from Petit Manan Island in 1993 had a mean arsenic level of 0.18 µg/g (Mierzykowski et al. 2001). Chicks: Arsenic levels in chick carcasses averaged 0.17 µg/g (Table 7). There was no significant difference in tern chick arsenic concentrations between target and reference islands (p = 0.959, Figure 30). Arsenic Assessment: Arsenic concentrations in biota are usually less than 1 µg/g, with higher concentrations found in marine organisms particularly crustaceans (Eisler 1994). Libby et al. (1953) reported that domestic chicken (Gallus gallus) egg residues greater than 0.40 µg As/g had no effect on hatchability or fertility. All egg samples from the five Gulf of Maine islands had arsenic levels lower than the avian embryotoxic threshold suggested by Libby et al. (1953) and lower than the nominal level suggested by Eisler (1994).
6.2.2 Copper (Cu). Copper is used in the preservation and coloring of foods, in brass and copper water pipes and domestic utensils, and in fungicides and insecticides (Gross et al. 2003). Copper is an essential trace nutrient that is required in relatively high concentrations (Gochfeld and Burger 1987). Copper is not carcinogenic, mutagenic, or teratogenic at environmentally realistic concentration (Eisler 1997). Eggs: Along the Maine coast, the mean copper concentration in 50 common tern eggs was 0.61
32
µg/g with a range of 0.44 to 1.01 µg/g (Table 6). There was no significant difference in tern egg copper concentrations between the target and reference islands (p = 0.506, Figure 32). A few regional studies were located that reported copper concentrations in common tern eggs. Seven common tern eggs from the Great Bay Estuary, NH, had a mean copper concentration of 0.68 ± 0.06 µg/g (range: 0.59 – 0.78 µg/g, Carr and von Oettingen 1989). At Great Gull Island in Long Island Sound, NY, Connors et al. (1975) reported a mean copper concentration of 1.63 µg/g (converted to wet weight using dry weight/3) and range of 1.14 to 1.82 µg/g in nine common tern eggs. Single 3-egg common tern composites from Seal Island NWR, ME, and Mononoy NWR, MA, during the 2005 breeding season contained 0.79 µg/g and 0.74 µg/g of copper, respectively (Mierzykowski 2008). At Petit Manan Island in 1993, five Arctic tern eggs contained a mean copper concentration of 0.76 µg/g and a range of 0.70 – 0.86 µg/g (Mierzykowski et al. 2001). Morera et al. (1997, citing 3 studies) noted that copper concentrations in eggs of seabirds are usually low, between 0.15 and 1.8 µg/g. Copper levels in common tern eggs from the five islands fall within the concentration range presented by Morera et al. (1997). Chicks: The mean copper concentration in common tern chick carcasses was 1.69 µg/g (Table 7). Copper concentrations in chick carcasses were significantly higher at the target islands than the reference islands (p = 0.002, Figure 32). Copper concentrations in tern chicks were consistently higher than levels in eggs (Figure 33). Copper Assessment: No data are available regarding copper toxicity to avian wildlife (Eisler 1997), but at elevated dietary concentrations Cu accumulated in poultry liver, inhibited growth, and caused gizzard erosion (Eisler 1997, Hui et al. 1998). Compared to other tern studies, copper concentrations in common tern eggs from the Maine coast do not appear elevated. No studies were located in the literature that reported copper concentrations in tern chicks. 6.2.3 Mercury. Mercury is a global pollutant with biological mercury hotspots existing in the northeastern United States (Evers et al. 2007). Sources of mercury contamination include emissions from coal-fired energy facilities, incinerators, mining activities, operation of chloralkali plants, and disposal of mercury-contaminated products such as batteries and fluorescent lamps (Eisler 1987). Mercury is a mutagen, teratogen, and carcinogen which bioconcentrates in organisms and biomagnifies through food chains (Eisler 1987). The most toxic form or mercury is the organic form, methylmercury. Methylmercury may account for nearly all of the total mercury in bird eggs (Schwarzbach et al. 2006).
Eggs: Mean mercury in 50 common tern eggs from the Maine coast was 0.11 µg/g with a range of 0.06 to 0.20 µg/g (Table 6). There was no significant difference in egg mercury levels between target islands and reference islands (p = 0.417, Figure 34). Mercury levels in tern eggs have been reported in several studies. In 35 common tern eggs from Barnegat Bay, NJ, mean mercury was 0.41 ± 0.05 µg/g with a range of 0.10 to 1.21 µg/g (converted to wet weight using dry weight/3; Burger 2002). Mean mercury in seven common tern eggs from the Great Bay Estuary, NH, was 0.19 ± 0.09 µg/g (range: 0.10 – 0.37 µg/g, Carr and von Oettingen 1989). In nine common tern eggs from Great Gull Island in Long Island Sound, NY, Connors et al. (1975) reported a mean mercury level of 0.09 µg/g and a range of 0.02 to 0.27 µg/g.

33
Chicks: Mercury was detected in all chick carcasses (mean 0.16 µg/g, range: 0.06 – 0.38 µg/g, Table 7) and there was no significant difference between target islands and reference islands (p = 0.442, Figure 34). Mercury Assessment: Several mercury concentrations or ranges for effects in avian eggs have been suggested. An often used reproductive effect endpoint for mercury in bird eggs has been 0.80 µg/g based on waterfowl studies (Heinz 1979, Henny et al. 2002), while other investigators and ecological risk assessors suggest 0.50 µg/g as an ecological effect screening benchmark value (Eisler 1986, RAIS 2008). Scheuhammer et al. (2007) suggested an egg-Hg concentration > 1 µg/g as associated with impaired hatchability and embryonic mortality in a number of bird species. Thompson (1996) summarized that mercury concentrations in eggs of 0.5 to 2.0 µg/g are sufficient to reduce egg viability, hatchability and embryo survival in birds. Recent egg injection studies with methylmercury categorize common terns as moderately sensitive with lethal concentrations (LC50s) ranging from 0.25 µg/g to 1.00 µg/g (Heinz et al. 2008). Elevated mercury exposure in fish-eating birds has been documented in Maine (bald eagle, Mierzykowski et al. 2006; common loon, Evers et al. 2003). However, among seabird species in the Gulf of Maine, common terns do not appear to have highly elevated mercury levels (Mierzykowski et al. 2005). Mercury concentrations in common tern eggs from the Maine coast were below all the suggested reproductive effect threshold values and within ranges reported in other studies.
6.2.4 Manganese (Mn) – Manganese is a component of the earth’s crust, an essential
trace element for animals, and is used in iron alloys, nonferrous alloys, and dry cells (Moore 1991). Airborne emissions from vehicle exhausts are a potential source of manganese. Manganese, as methylcyclopentadienyl manganese tricarbonyl, has been used as an additive in gasoline and is currently under review by EPA (2008). In herring gull chicks (Larus argentatus), manganese exposure reduced growth, disrupted behavior, and thermoregulation (Burger and Gochfeld 1995). Eggs: In 50 common tern eggs from the Maine coast, the mean manganese level was 0.50 µg/g with a range of 0.23 to 1.04 µg/g (Table 6). Manganese levels in eggs appeared slightly higher at the reference islands than the target islands, but the difference was did not reach the 0.05 significance threshold (p = 0.062, Figure 36). A few tern studies were found that reported manganese levels. Burger (2002) examined manganese in 35 common tern eggs collected in 2000 from Barnegat Bay, NJ, and reported a mean level of 0.76 µg/g (converted to wet weight using dry weight/3) and a maximum of 1.38 µg/g. In an earlier study, 24 common tern eggs collected in 1982 from Barnegat Bay, NJ had a manganese level of 0.57 ± 0.108 µg/g (Burger and Gochfeld 1988). Five Arctic tern eggs from Petit Manan Island in 1993 contained 0.34 – 0.58 µg/g of manganese (mean 0.49 µg/g, Mierzykowski et al. 2001). Chicks: In contrast to egg levels, manganese concentrations in chick carcasses (mean 1.11 µg/g) were significantly higher at target islands than reference islands (p = 0.008. Figure 36). Manganese levels in tern chick carcasses were not found in the literature. In the livers of 13 – 16
34
day old common tern chicks (older than chicks in this study) from Rhode Island, manganese concentrations ranged from 4.16 µg/g to 9.66 µg/g (Custer et al. 1986, converted to wet weight using dry weight/3). Manganese Assessment: An adverse effect level for manganese in avian eggs could not be located in the literature. Manganese levels in tern eggs from the Gulf of Maine appeared lower than the mean reported by Burger (2002). Manganese concentrations are provided in this report, since little baseline information in biota is available (Burger and Gochfeld 2004).
6.2.5 Selenium (Se). Selenium is a beneficial or essential element for some biota at trace amounts to parts-per-billion concentrations, but toxic at elevated concentrations (Eisler 1985b). Selenium is present in rocks and soils. However, coal and oil combustion, nonferrous metal production, iron manufacturing, municipal and sewage refuse incineration, and production of phosphate fertilizers introduce greater amounts of selenium into the environment than natural sources (Ohlendorf 2003). Background selenium levels in eggs of freshwater and terrestrial bird species are < 1 µg/g (typically 0.5 to 0.8 µg/g), and maximum levels are < 1.67 µg/g, but levels may be more variable and higher in marine species (Ohlendorf 2003; converted to wet weight using dry weight/3). Eggs: The mean selenium level in eggs from the Maine coast was 0.60 µg/g with a range of 0.37 to 0.83 µg/g (Table 6). Selenium concentrations in eggs were not significantly different between target islands and reference islands (p = 0.774, Figure 38). Selenium levels have been reported in several tern studies. In Barnegat Bay, NJ, common tern eggs, Burger (2002) reported a mean selenium concentration of 0.68 µg/g (converted to wet weight using dry weight/3) and a maximum of 1.10 µg/g. Carr and von Oettingen (1989) reported a mean selenium concentration of 0.50 ± 0.07 µg/g and a range of 0.38 to 0.58 µg/g in seven common tern eggs from the Great Bay Estuary, NH. Five Arctic tern eggs from Petit Manan Island in 1993 contained 1.89 µg/g of selenium (range: 1.04 – 2.93 µg/g, Mierzykowski et al. 2001). At Seal Island NWR, ME, and Monomoy NWR, MA, single 3-egg common tern composite samples contained 0.67 µg/g and 0.61 µg.g of selenium, respectively (Mierzykowski 2008). Chicks: As in the case of eggs, selenium levels in chick carcasses were not significantly different between target islands and reference islands (p = 0.140, Figure 38). Selenium levels in chick carcasses (mean 0.63 µg/g) appeared similar to egg levels (mean 0.60 µg/g)(Figures 38 and 39). Expressed as contaminant mass, however, chick selenium levels appeared lower than eggs (Appendix Figure A-2). Selenium Assessment: Heinz (1996) suggested a 3 µg Se/g threshold for reproductive impairment in bird eggs. All common tern eggs from the five Gulf of Maine islands had selenium levels well below this reproductive impairment threshold. Selenium levels in common tern eggs from the Gulf of Maine were similar to other tern studies and background levels (Ohlendorf 2003).
6.2.6 Strontium (Sr). Strontium is an element of seawater (Bowen 1956) and essential in
35
marine gastropod shell development (Bidwell et al. 1986). Strontium is used in fireworks, red signal flares, and on tracer bullets (Merck 1983). Eggs: At the five Maine islands, the mean strontium concentration in 50 common tern eggs was 1.20 µg/g with a wide range between 0.36 and 3.06 µg/g. Eggs from the reference islands had significantly higher selenium levels than the target islands (p = 0.003, Figure 40). In comparison, two least tern egg composites from southern Maine in 2003 contained 0.98 µg/g and 1.50 µg/g of strontium (Mierzykowski and Carr 2004). Common tern egg composites from Seal Island NWR, ME, and Monomoy NWR, MA, had strontium levels of 2.09 µg/g and 1.50 µg/g, respectively (Mierzykowski 2008). Chicks: On the Maine coast, chick strontium concentrations (mean 5.64 µg/g, max. 13.7 µg/g) were higher than eggs, but there was no significant difference between chicks from the target islands and reference islands (p = 0.597, Figure 40). Strontium Assessment: A toxic effect threshold level for stable strontium in bird eggs was not found in the literature. In black-crowned night heron embryos, a strontium concentration of 3.76 µg/g (converted to wet weight using dry weight/3) was associated with increased oxidative stress using hepatic oxidized glutathione (Rattner et al. 2000). Mora (2003) considered egg strontium levels of 75 µg/g (converted to wet weight using dry weight/3) and 63 µg/g as elevated in yellow warbler and song sparrow, respectively. Compared to several other bird species examined by Mora (2003), strontium levels in eggs of yellow warblers and song sparrows were highest. Strontium levels in tern eggs from Maine were lower than the effect level reported by Rattner et al. (2000) for night-herons. 6.2.7 Zinc (Zn). Zinc is used in galvanized metal alloys, paints, wood preservatives, fertilizers, and rodenticides (Opresko 1992, Eisler 1993). Zinc, like copper and iron, is an essential trace nutrient that is required in relatively high concentrations (> 10 µg/g, Gochfeld and Burger 1987, Burger and Gochfeld 1988). Zinc is a cofactor of > 200 enzymes and has an important function in the antioxidant defense system that ameliorates the effects of environmental stress (Sahin and Kucuk 2003). Eggs: Mean Zn level in common tern eggs from the five Gulf of Maine islands was 13.4 µg/g and there was no significant difference in concentrations between target and reference islands (p = 0.063, Figure 42). In other tern studies, reported Zn levels in eggs were 21 µg/g (Connors et al. 1975), 22 µg/g (Burger and Gochfeld 1988), 10.32 g/g (common tern, Carr and von Oettingen 1989), 17.5 µg/g (Arctic tern, Mierzykowski et al. 2001), 12.3 µg/g (least tern, Mierzykowski and Carr 2004). Chicks: Zinc was significantly higher in tern chick carcasses from the target islands than the reference islands (p = 0.002, Figure 42). Zinc concentrations in chicks from the five islands 23.8 µg/g were similar to the lower levels reported by Custer et al. (1986).

36
Zinc Assessment: Zinc levels in the common terns in the Gulf of Maine do not appear elevated compared to other investigations. A toxic effect threshold for zinc in eggs or chick carcasses was not found in the scientific literature.
37
7. Summary and Management Action In 2001, developmental abnormalities and low productivity were reported in common tern (Sterna hirundo) chicks from three islands on the Maine coast - Stratton Island, Jenny Island, and Pond Island. Newborn terns were too weak to hatch, or unable to completely emerge from their eggshell. Others birds that were able to hatch quickly developed combinations of the following symptoms: swollen or encrusted eyes, bloody nares, patchy feather development, and necrotic skin at the base of the bill and legs. Chicks shook involuntarily or were extremely lethargic. At one island, there was an unconfirmed report of malformed bills in a few chicks. Most affected tern chicks died within five to seven days of hatching. Diagnostic examinations for diseases and parasites were conducted by the National Wildlife Health Center (NWHC), but were inconclusive. Acting on a recommendation by the NWHC, a screening-level contaminant survey was initiated by the U.S. Fish and Wildlife Service and its seabird restoration partners in 2004. Some contaminants such as dioxins, polychlorinated biphenyls, DDT, and mercury have been linked in previous tern studies to developmental abnormalities or reduced productivity. During the 2004 and 2005 breeding seasons, non-viable eggs and moribund or dead common tern chicks from five islands along the Maine coast were collected and analyzed for residues of organochlorine compounds and trace elements. Besides the three islands with reported abnormalities, two islands - Eastern Egg Rock and Petit Manan Island - were selected to serve as reference locations in the study. Concentrations of 26 organochlorine compounds and nineteen trace elements were determined in 50 eggs and 42 chicks. Three 3-egg composite samples were also analyzed for dioxins, furans, and PCB congeners. Organochlorine Compounds Compared to suggested biological effect levels and to regional and other tern investigations, highly elevated levels of organochlorine contaminants were not found in egg or chick samples from the Maine coast. Total PCB concentrations in eggs (mean 0.36 µg/g) were below the biological effect threshold (7.5 µg/g, Hoffman et al. 1996). Similarly, Total PCB levels in chicks (mean 0.62 µg/g) were not elevated compared to levels found in regional and other studies. Composite egg samples from three islands (two target, one reference) were also analyzed for dioxin, furan, and polychlorinated biphenyl congeners including non-ortho and mono-ortho dioxin-like congeners. Dioxin toxic equivalents (TCDD-TEQ) in egg composite samples were not elevated (max. 62 pg/g) and below suggested tern embryotoxicity levels (600 pg/g, Kubiak 2007). TCDD-TEQ levels in egg composites were 3-fold higher, however, at two target islands than a reference island. PCB# 77 was the dominant dioxin-like congener to the TCDD-TEQ in all three egg composite samples. PCB congener patterns were similar among the three islands with PCB #153, PCB #138, and PCB #180 being the greatest contributors to the Total PCB load. If a discrete PCB source was affecting one of the islands, a different PCB congener pattern would have been evident in one of

38
the samples. A slight contaminant gradient from southern Maine to Downeast was indicated by PCB congener egg concentrations (Stratton > Pond > Petit Manan) and in Total PCB egg data for all five islands (Stratton > Jenny > Pond > Eastern Egg > Petit Manan), but the same pattern was not evident in Total PCB chick concentrations. DDE, a metabolite of the pesticide DDT, was found in all egg and chicks samples, but at low concentrations (< 0.10 µg/g). Compared to a tern study where hatching failure occurred at levels greater than 1.9 µg/g (Nisbet and Reynolds 1984), the DDE levels along the Maine coast were not elevated. Other organochlorine compounds (e.g., HCB, mirex, chlordane compounds, cyclodiene pesticides, hexachlorcyclohexanes) were also detected at low concentrations (i.e., low ng/g). Effect levels for these other organochlorine compounds typically occur at the µg/g range (i.e., concentrations orders of magnitude higher than what were found in this study. Contaminant uptake (expressed as the difference in contaminant mass in eggs and chicks) among the five islands was consistent for several organochlorine compounds. For example, PCB mass was nearly 10 µg higher in chick samples than in eggs (Appendix Figure A-1). Similar parallel uptake patterns were evident for p,p-DDE, dieldrin, HCB, mirex, and oxychlordane (Appendix Figure A-1. Note: Only organochlorine compounds detected in nearly all samples were plotted). Trace Elements Compared to concentrations found in other Maine seabirds and to biological effects thresholds, mercury concentrations in common tern eggs (0.11 µg/g) and chicks (0.16 µg/g) were low. Recent egg injection studies with methylmercury categorize common terns as moderately sensitive with lethal concentrations (LC50s) ranging from 0.25 to 1.00 µg/g (Heinz et al. 2008). Common tern embryos from the Maine coast were well below this suggested toxicity threshold. Except for a few anomalous elevated detections, concentrations of eighteen other trace elements including cadmium, lead, and selenium were either within previously reported ranges, low, sporadically detected, or below detection. Trace element uptake (expressed as the difference in contaminant mass in eggs and chicks) among the five islands was similar to what was found in organochlorine compounds for some elements (e.g., higher mass of copper, strontium and zinc in chicks than eggs), but not for others (e.g., lower mass of mercury and selenium in chicks than eggs; Appendix Figure A-2). Also, the variance in chick trace element mass was generally larger than the variance in eggs (Appendix Figure A-2). Overall Contaminant Assessment Overall, contaminant concentrations did not exceed suggested biological effect levels or were not elevated compared to other regional common tern studies. Some significant differences (p < 0.05) in contaminant concentrations were found between target and reference islands, among all
39
five islands, and by sample type (i.e., egg and chick), but contaminant concentrations of individual organochlorine compounds and trace elements were not found at levels reported to have caused developmental abnormalities or reduced productivity in other studies. In 2006, the incidence of chick abnormalities had greatly diminished at the three target islands. Only isolated instances of abnormalities were reported in 2007. For a variety of reasons (weather, predator harassment, other disturbances), common tern productivity annually fluctuates along the Maine coast. Based on the contaminant levels detected in tern eggs and chicks, and variation in productivity among years and islands (target and reference), a relationship between contaminants levels and productivity was not evident (Figure 44). Although elevated contaminant concentrations were not detected in this study, it is not known what role combinations of low, sub-lethal body burdens of these contaminants and others not measured in this study may have on developing birds. Management Action To our knowledge, this project was the first broad study of contaminant exposure in common terns along the Maine coast. In other parts of the region (e.g., Cape Cod, Buzzards Bay, Long Island Sound, Barnegat Bay), tern contaminant studies have been conducted since the 1970s. Now that a Maine baseline has been established, periodic monitoring (e.g., every ten years) of contaminants in common terns and other Maine seabirds is recommended. To track trends in exposure, future monitoring should include the organochlorine compounds and trace elements analyzed in this study, and also include newly emerging contaminant compounds such as polybrominated diphenyl ethers and perfluorinated compounds. These newly emerging contaminants were not included in the original study design because biological thresholds have not yet been established and the analytical costs were prohibitive.
40
8. Literature Cited Ankley G.T., G.N. Niemi, K.B. Lodge, H.J. Hallis, D.L. Beaver, D.E. Tillitt, T.R. Schwartz, J.P.
Giesy, P.D. Jones and C. Hagley. 1993. Uptake of planar polychlorinated biphenyls and 2,3,7,8-substituted polychlorinated dibenzofurans and dibenzo-p-dioxins by birds nesting in the lower Fox River, Green Bay, Wisconsin, USA. Arch. Environ. Contam. Toxicol. 24:332-344.
ATSDR (Agency for Toxic Substances and Disease Registry). 1998. Toxicological profile for
chlorinated dibenzo-p-dioxins (update). US Dept Health and Human Services. 678 pp + appendices.
ATSDR (Agency for Toxic Substances and Disease Registry). 2002. ToxFAQs for
Hexachlorbenzene. http://www.atsdr.cdc.gov/tfacts90.html Baicich P.J. and C.J.O. Harrison. 1997. A guide to the nests, eggs, and nestlings of North
American birds, 2nd edition. AP Natural World, Academic Press. San Diego, CA. 347 pp.
Becker P.H. 1992. Egg mercury levels decline with the laying sequence in charadriiformes.
Bull. Environ. Contam. Toxicol. 48:762-767. Becker P.H., S. Schuhmann and C. Koepff. 1993. Hatching failure in common terns (Sterna
hirundo) in relation to environmental chemicals. Environ. Pollut. 79:207-213. Becker P.H. and J.M. Cifuentes. 2004. Contaminants in bird eggs – recent spatial and temporal
trends. Pages 5 – 25 in Wadden Sea Ecosystem No. 18. Common Wadden Sea Secretariat, Trilateral Monitoring and Assessment Group. Wilhelmshaven, Germany. 51 pp.
Bidwell J.P., J.A. Paige and A.M. Kuzirian. 1986. Effects of strontium on the embryonic
development of Aplysia californica. Bio. Bull. 170:75-90. Blus L.J. 1996. DDT, DDD, and DDE in birds. Pages 49 - 71 in Beyer W.N, G.H. Heinz and
A.W. Redmon-Norwood (eds.). Environmental contaminants in wildlife - interpreting tissue concentrations. CRC Press. Lewis Publishers. Boca Raton, FL. 494 pp.
Blus L.J. 2003. Organochlorine pesticides. Pages 313 - 339 in Hoffman D.J., B.A. Rattner, G.A.
Allen Jr. and J. Cairns Jr. (eds.). Handbook of Ecotoxicology, 2nd Edition. Lewis Publishers. Boca Raton, FL. 1290 pp.
Bosveld A.T.C., J. Gradener, A.J. Murk, A. Brouwer, M. van Kampen, E.H.G. Evers and M. van
den Berg. 1995. Effects of PCDDs, PCDFs, and PCBs in common tern (Sterna hirundo) breeding in estuarine and coastal colonies in the Netherlands and Belgium. Environ. Toxicol. Chem. 14(1):99-115.

41
Bowen H.J.M. 1956. Strontium and barium in sea water and marine organisms. J. Mar. Biol.
Assoc. U.K. 35:451-460. Briggs S.A. 1992. Basic guide to pesticides – their characteristics and hazards. Taylor and
Francis. Bristol, PA. 282 pp. Burger J. 2002. Food chain differences affect heavy metals in bird eggs in Barnegat Bay, New
Jersey. Environ. Res. Sect. A. 90:33-39. Burger J. and M. Gochfeld. 1988. Metal in tern eggs in a New Jersey estuary: a decade of
change. Environ. Monit. Assessment 11:127-135. Burger J. and M. Gochfeld. 1991. The common tern - its breeding biology and social behavior.
Columbia Univ. Press. New York, NY. 413 pp. Burger J. and M. Gochfeld. 1995. Growth and behavioral effects of early postnatal chromium
and manganese exposure in herring gull (Larus argentatus) chicks. Pharmacol. Biochem. Behav. 50:607-612.
Burger J. and M. Gochfeld. 2004. Metal levels in eggs of common terns (Sterna hirundo) in
New Jersey: temporal trends from 1971 to 2002. Environ. Res. 94:336-343. Burger J., I.C.T. Nisbet and M. Gochfeld. 1992. Metal levels in regrown feathers: assessment of
contamination on the wintering and breeding grounds in the same individuals. Toxicol. Environ. Health 36:327-338.
Carr K.C. and S. von Oettingen. 1989. An assessment of potential contamination in common
terns from the Great Bay Estuary, New Hampshire. USFWS. New England Field Office. Concord, NH. 12 pp.
Castillo L., E. Thybaud, T. Caquet and F. Ramade. 1994. Organochlorine contaminants in
common tern (Sterna hirundo) eggs and young from the River Rhine area (France). Bull. Environ. Contam. Toxicol. 53:759-764.
Colburn T., D. Dumanoski and J.P. Myers. 1997. Our stolen future. Plume/Penguin Books.
New York, NY. 316 pp. Connors P.G., V.C. Anderlini, R.W. Riseborough, M.Gilbertson and H. Hays. 1975.
Investigations of heavy metals in common tern populations. Can. Field-Naturalist 89:157-162.
Custer T.W., R.M. Erwin and C.J. Stafford. 1983. Organochlorine residues in common tern eggs
from nine Atlantic coast colonies, 1980. Colonial Waterbirds 6:197-204.

42
Custer T.W., C.M. Bunck and C.J. Stafford. 1985. Organochlorine concentrations in prefledging common terns at three Rhode Island colonies. Colonial Waterbirds 8(2):150-154.
Custer T.W., J.C. Franson, J.F. Moore and J.E. Meyers. 1986. Reproductive success and heavy
metal contamination in Rhode Island common terns. Environ. Pollut. (Ser. A) 41:33-52. Eisler R. 1985a. Mirex hazards to fish, wildlife, and invertebrates: a synoptic review. USFWS.
Biol. Rep. 85(1.1). 42 pp. Eisler R. 1985b. Selenium hazards to fish, wildlife, and invertebrates: a synoptic review.
USFWS. Biol. Rep. 85(1.5). 57 pp. Eisler R. 1986. Polychlorinated biphenyl hazards to fish, wildlife, and invertebrates: a synoptic
review. USFWS. Biol. Rep. 85(1.7). 72 pp. Eisler R. 1987. Mercury hazards to fish, wildlife, and invertebrates: a synoptic review. USFWS.
Biol. Rep. 85(1.10). 90 pp. Eisler R. 1990. Chlordane hazards to fish, wildlife, and invertebrates: a synoptic review.
USFWS. Biol. Rep. 85(1.21). 49 pp. Eisler R. 1993. Zinc hazards to fish, wildlife, and invertebrates: a synoptic review. USFWS.
Biol. Rep. 10. 106 pp. Eisler R. 1994. A review of arsenic hazards to plants and animals with emphasis on fishery and
wildlife resources. Pages 185 – 259 in Nriagu J.O. (ed.). Arsenic in the environment. Part II: human and ecosystem effects. J. Wiley & Sons, Inc. New York, NY.
Eisler R. 1997. Copper hazards to fish, wildlife, and invertebrates: a synoptic review. U.S.
Geological Survey, Biological Resources Division. Bio. Sci. Rep. USGS/BRD/BSR-1997-0002. 98 pp.
Eisler R. and A.A. Belisle. 1996. Planar PCB hazards to fish, wildlife, and invertebrates: a
synoptic review. Natl. Biol. Serv. Biol. Rep. 31. 75 pp. Elliott J.E., P.E. Whitehead, P.A. Martin, G.D. Bellward and R.J. Norstrom. 1996. Persistent
pulp mill pollutants in wildlife. Pages 297 – 314 in Servos M.R., K.R. Munkittrick, J.H. Carey and G.J. van der Kraak (eds.). Environmental fate and effects of pulp and paper mill effluents. St. Lucie Press. Delray Beach, FL. 703 pp.
Environment Canada. 1993. Arsenic and its compounds – priority substances list assessment
report. Cat. No. En40-215/14E. Ottawa, Ontario. Canada. Environment Canada (and the Federal/Provincial Task Force on Dioxins and Furans). 1999.
Dioxins and furans and hexachlorobenzene – inventory of releases. Ottawa, Ontario.
43
EPA (Environmental Protection Agency). 1990. Suspended, canceled, and restricted pesticides.
Pesticides and Toxic Substances (EN-243). 20T-1002. Washington, DC. EPA (Environmental Protection Agency). 2006. Consumer Fact Sheet: Lindane
http://www.epa.gov/safewater/contaminants/dw_contamfs/lindane.html EPA (Environmental Protection Agency). 2008. Comment on the gasoline additive MMT
(methylcyclopentadienyl manganese tribaronyl). http://www.epa.gov/otaq/regs/fuels/additive/mmt_cmts.htm Evers D.C., J.D. Kaplan, M.W. Meyers, P.S. Reaman, W.E. Braselton, A. Major, N. Burgess,
and A.M. Scheuhammer. 1998. Geographic trend in mercury measured in common loon feathers and blood. Environ. Toxicol. Chem. 17(2):173-183.
Evers D.C., K.M. Taylor, A. Major, R.J. Taylor, R.H. Poppenga and A.M. Scheuhammer. 2003.
Common loon eggs as indicators of methylmercury availability in North America. Ecotoxicology 12:69-81.
Evers D.C., Y-J Han, C.T. Driscoll, N.C. Kamman, M.W. Goodale, K. Fallon Lambert, T.M.
Holsen, C.Y. Chen, T.A. Clair and T. Butler. 2007. Biological mercury hotspots in the northeastern United States and southeastern Canada. BioScience 57(1):29-43.
Fimreite N. 1974. Mercury contamination of aquatic birds in northwestern Ontario. J. Wildl.
Manage. 38:120-131. Friend M. and J.C. Franson (eds.). 1999. Field manual of wildlife diseases - general field
procedures and disease of birds. U.S. Geological Survey. Info Tech Rpt 1999-001. Madison, WI. 426 pp.
Furness R.W. 1996. Cadmium in birds. Pages 389 - 404 in Beyer W.N, G.H. Heinz and A.W.
Redmon-Norwood (eds.). Environmental contaminants in wildlife - interpreting tissue concentrations. Lewis Publishers. Boca Raton, FL. 494 pp.
Gilbertson M. and L.M. Reynolds. 1972. Hexachlorobenzene (HCB) in the eggs of common
terns in Hamilton Harbour, Ontario. Bull. Environ. Contam. Toxicol. 7(6):371-373. Gilbertson M., R.D. Morris and R.A. Hunter. 1976. Abnormal chicks and PCB residue levels in
eggs of colonial waterbirds on the lower Great Lakes (1971-1973). Auk 93:434-442. Gochfeld M. and J. Burger. 1987. Factors affecting tissue distribution of heavy metals – age
effects and the metal concentration patterns in common terns, Sterna hirundo. Biol. Trace Elem. Res. 12:389-399.
Gross T.S., B.A. Arnold, M.S. Sepulveda and K. MacDonald. 2003. Endocrine disrupting
44
chemicals and endocrine active agents. Pages 1033 - 1098 in Hoffman D.J., B.A. Rattner, G.A. Burton Jr. and J. Cairns Jr. (eds.). Handbook of ecotoxicology, 2nd edition. Lewis Publ. Boca Raton, FL. 1290 pp.
Hart C.A. 1998. Feminization in common terns (Sterna hirundo): relationship to persistent
organic contaminants. Ph.D. dissertation. Massachusetts Institute of Technology and Woods Hole Oceanographic Institution. MIT/WHOI 96-06. Cambridge, MA and Woods Hole, MA. 254 pp.
Hays H. and R.W. Risebrough. 1972. Pollutant concentrations in abnormal young terns from
Long Island Sound. Auk 89:19-35. Heinz G.H. 1979. Methylmercury: reproductive and behavioral effects on three generations of
mallard ducks. J. Wildl. Manage. 43(2):394-401. Heinz G.H. 1996. Selenium in birds. Pages 447 - 458 in Beyer W.N, G.H. Heinz and A.W.
Redmon-Norwood (eds.). Environmental contaminants in wildlife - interpreting tissue concentrations. Lewis Publishers. Boca Raton, FL. 494 pp.
Heinz G.H. and D.J. Hoffman. 1998. Methylmercury chloride and selenomethione interactions
on health and reproduction in mallards. Environ. Toxicol. Chem. 17(2):139-145. Heinz G.H., D.J. Hoffman, J.D. Klimstra, K.R. Stebbins, S.L. Kondrad and C.A. Erwin. 2008.
Species differences in the sensitivity of avian embryos to methylmercury. Arch. Environ. Contam. Toxicol. In press.
Henny C.J., E.F. Hill, D.J. Hoffman, M.G. Spalding and R.A. Grove. 2002. Nineteenth century
mercury: hazards to wading birds and cormorants of the Carson River, Nevada. Ecotoxicology 11(4):213-231.
Hickey J.J. and D.W. Anderson. 1968. Chlorinated hydrocarbons and eggshell changes in
raptorial and fish-eating birds. Science 162:271-273. Hoffman D.J., G.J. Smith and B.A. Rattner. 1993. Biomarkers of contaminant exposure in
common terns and black-crowned night herons in the Great Lakes. Environ. Toxicol. Chem. 12:1095-1103.
Hoffman D.J., C.P. Rice and T.J. Kubiak. 1996. PCBs and dioxins in birds. Pages 165 - 208 in
Beyer W.N, G.H. Heinz and A.W. Redmon-Norwood (eds.). Environmental contaminants in wildlife - interpreting tissue concentrations. Lewis Publishers. Boca Raton, FL. 494 pp.
Hoffman D.J., M.J. Melancon, P.N. Klein, J.D. Eisemann and J.W. Spann. 1998. Comparative
developmental toxicity of planar polychlorinated biphenyl congeners in chickens, American kestrels, and common terns. Environ. Toxicol. Chem. 17(4):747-757.
45
Hui A., J.Y. Tekekawa, V.V. Baranyuk and K.V. Litvin. 1998. Trace element concentrations in
two subpopulations of lesser snow geese from Wrangel Island, Russia. Arch. Environ. Contam. Toxicol. 34:197-203.
Jayaraman S., C.S. Mostello, I.C. Nisbet, D.E. Nacci, C. Gilcrist, R.J. Pruell and J.L. Lake. 2006.
Organic contaminants in common and roseate tern eggs from three breeding colonies in Buzzards Bay, MA, USA. Poster P928. 27th Annual Meeting of the Society of Environmental Toxicology and Chemistry. Montreal, PQ.
Jayaraman S., M.C. Cantwell, D.E. Nacci, C.S. Mostello and I.C.T. Nisbet. 2007.
Polychlorinated biphenyl (PCBs) and polybrominated diphenyl ethers (PBDEs) in current and historical samples of avian eggs from nesting sites in Buzzards Bay, MA, USA. Poster WP99. 28th Annual Meeting of the Society of Environmental Toxicology and Chemistry. Milwaukee, WI.
Karchner S.I., D.G. Franks, S.W. Kennedy and M.E. Hahn. 2006. The molecular basis for
differential dioxin sensitivity in birds: role of the aryl hydrocarbon receptor. Proc. Natl. Acad. Sci. 103(16):6252-6257.
Kubiak T.J., H.J. Harris, L.M. Smith, T.R. Schwartz, D.L. Stalling, J.A. Trick, L. Sileo, D.H.
Docherty and T.C. Erdman. 1989. Microcontaminants and reproductive impairment of the Forster’s tern on Green Bay, Lake Michigan – 1983. Arch. Environ. Contam. Toxicol. 18:706-727.
Kubiak T.J. 2007. Development of TCDD-TEQs using colonial waterbird experiments in the
Great Lakes. Platform Presentation #567. 28th Annual Meeting of the SETAC. Milwaukee, WI.
Langham N.P.E. 1972. Chick survival in terns (Sterna spp.) with particular reference to the
common tern. J. Animal Ecol. 41(2):385-395. Libby D.A., A.C. Groschke, R.J. Evans and S.L. Bandemer. 1953. Feeding of arsanilic acid to
pullets. Mich. Agric. Exp. Stn. Quart. Bull. 35(4):419-427. Litten S., B. Fowler and D. Luszniak. 2002. Identification of a novel PCB source through
analysis of 209 PCB congeners by US EPA modified method 1668. Chemosphere 46:1457-1459.
Lord B. and B. Allen (eds.) 2002. Meeting Minutes of the Gulf of Maine Seabird Working
Group. Hog Island, Bremen. Matz A.C. 1998. Organochlorine contaminants and bald eagles (Haliaeetus leucocephalus) in
Maine: investigations at three ecological scales. Ph.D. dissertation. Univ. Maine. Orono, ME.

46
Medvedev N. and L. Markova. 1995. Residues of chlorinated pesticides in the eggs of Karelian
birds, 1989 – 90. Environ. Pollut. 87:65-70. Merck. 1983. The Merck Index, 10th edition. Merck Co., Inc. Rahway, NJ. Mierzykowski S.E. 2008. Environmental contaminants in tern eggs from Monomoy National
Wildlife Refuge and Seal Island National Wildlife Refuge. USFWS. Spec. Proj. Rep. FY07-MEFO-6-EC. Maine Field Office. Old Town, ME. 27 pp.
Mierzykowski S.E., J.L. Megyesi and K.C. Carr. 2001. Environmental contaminants in arctic
tern eggs from Petit Manan Island. USFWS. Spec. Proj. Rep. FY96-MEFO-6-EC. Maine Field Office. Old Town, ME. 29 pp. + appendices.
Mierzykowski S.E. and K.C. Carr. 2004. Environmental contaminants in piping plover, least
tern, and common tern eggs from coastal Maine – 2003 breeding season. USFWS. Spec. Proj. Rep. FY04-MEFO-1-EC. Maine Field Office. Old Town, ME. 34 pp.
Mierzykowski S.E., L.J. Welch, W. Goodale, D.C. Evers, C.S. Hall, S.W. Kress and R.B. Allen.
2005. Mercury in bird eggs from coastal Maine. USFWS. Spec. Proj. Rep. FY05-MEFO-1-EC. Maine Field Office. Old Town, ME. 14 pp.
Mierzykowski S.E., C.S. Todd, C. DeSorbo and W. Hanson. 2006. Mercury in bald eagle eggs
from Maine, 2000 – 2005. Poster 284. 27th Annual Meeting of the Society of Environmental Toxicology and Chemistry. Montreal, PQ.
Moore J.W. 1991. Inorganic contaminants of surface water – research and monitoring priorities.
Springer-Verlag, Inc. New York, NY. Mora M.A. 1996. Congener-specific polychlorinated biphenyl patterns in eggs of aquatic birds
from the lower Laguna Madre, Texas. Environ. Toxicol. Chem. 15(6):1003-1010. Mora M.A. 2003. Heavy metals and metalloids in egg contents and eggshells of passerine birds
from Arizona. Environ. Pollut. 125:393-400. Morera M., C. Sanpera, S. Crespo, L. Jover and X. Ruiz. 1997. Inter- and intraclutch variability
in heavy metals and selenium levels in Audouin’s Gull eggs from the Ebro Delta, Spain. Arch. Environ. Contam. Toxicol. 33:71-75.
Niemi G.J., T.E. Davis, G.D. Veith and B. Vieux. 1986. Organochlorine chemical residues in
herring gulls, ring-billed gulls, and common terns of western Lake Superior. Arch. Environ. Contam. Toxicol. 15:313-320.
Nisbet I.C.T. 1982. Eggshell characterisitics and organochlorine residues in common terns:
variation with egg sequence. Colonial Waterbirds 5:139-143.
47
Nisbet I.C.T. 2002. Common tern (Sterna hirundo). In Birds of North America. No. 618 (A.
Poole and F. Gill, eds.). The Birds of North America, Inc., Philadelphia, PA. 40 pp. Nisbet I.C.T. and L.M. Reynolds. 1984. Organochlorine residues in common terns and
associated estuarine organisms, Massachusetts, USA, 1971 – 81. Marine Env. Res. Ohlendorf H.M. 2003. Ecotoxicology of selenium. Pages 465 - 500 in Hoffman D.J., B.A.
Rattner, G.A. Burton Jr. and J. Cairns Jr. (eds.). Handbook of ecotoxicology, 2nd edition. Lewis Publ. Boca Raton, FL. 1290 pp.
Opresko D.M. 1992. Toxicity summary for zinc and zinc compounds. Oak Ridge National
Laboratory. Oak Ridge, TN. 20 pp. Peakall D.B. 1996. Dieldrin and other cyclodiene pesticides in wildlife. Pages 73 - 97 in Beyer
W.N, G.H. Heinz and A.W. Redmon-Norwood (eds.). Environmental contaminants in wildlife - interpreting tissue concentrations. Lewis Publishers. Boca Raton, FL. 494 pp.
RAIS (Risk Assessment Information System). 2008. http://rais.ornl.gov/homepage/benchmark.shtml Rattner B.A., D.J. Hoffman, M.J. Melancon, G.H. Olsen, S.R. Schmidt and K. Parsons. 2000.
Organochlorine and metal contaminant exposure and effects in hatching black-crowned night herons (Nycticorax nycticorax) in Delaware Bay. Arch. Environ. Contam. Toxicol. 39(1):38-45.
Sahin K. and O. Kucuk. 2003. Zinc supplementation alleviates heat stress in laying Japanese
quail. Journal of Nutrition 133:808-2811. Scharenberg W. 1991. Prefledging terns (Sterna paradisaea, Sterna hirundo) as bioindicators
for organochlorine residues in the German Wadden Sea. Arch. Environ. Contam. Toxicol. 21:102-105.
Scheuhammer A.M., M.W. Meyer, M.B. Sanheinrich and M.W. Murray. 2007. Effects of
environmental methylmercury on the health of wild birds, mammals, and fish. Ambio 36(1):12-18.
Schwarzbach S.E., J.D. Albertson and C.M. Thomas. 2006. Effects of predation, flooding, and
contamination on reproductive success of California clapper rails (Rallus longirostris obsoletus) in San Francisco Bay. Auk 123(1):45-60.
Shriver W.G., D. Evers and T.P. Hodgman. 2002. Hg exposure profile for sharp-tailed sparrows
breeding in coastal Maine salt marshes. Rep BRI 2002-11. Falmouth, ME. SPSS. 1998. Systat 9. SPSS Inc. Chicago, IL.
48
Stanley T.R. Jr., J.W. Spann, G.J. Smith and R. Rosscoe. 1994. Main and interactive effects of
arsenic and selenium on mallard reproduction and duckling growth and survival. Arch. Environ. Contam. Toxicol. 26:444-451.
Stansley W. and D.E. Roscoe. 1999. Chlordane poisoning of birds in New Jersey, USA.
Environ. Toxicol. Chem. 18(9):2095-2099. Stickel L.F., S.N. Wiemeyer and L.J. Blus. 1973. Pesticide residues in eggs of wild birds:
adjustment for loss of moisture and lipid. Bull. Environ. Contam. Toxicol. 9:193-196. Thompson D.R. 1996. Mercury in birds and terrestrial mammals. Pages 341 - 356 in Beyer
W.N, G.H. Heinz and A.W. Redmon-Norwood (eds.). Environmental contaminants in wildlife - interpreting tissue concentrations. Lewis Publishers. Boca Raton, FL. 494 pp.
Van Birgelen A.P.J.M. 198. Hexachlorobenzene as a possible major contributor to the dioxin
activity of human milk. Environ. Health Persp. 106(11):683-688. Van den Berg M., L. Birnbaum, A.T.C. Bosveld, B. Brunstrom, P. Cook, M. Feeley, J.P. Giesy,
A. Hanberg, R. Hasegawa, S.W. Kennedy, T. Kubiak, J.C. Larsen, F.X. Rolaf van Leewen, A.K.D. Liem, C. Nolt, R.E. Peterson, L. Poellinger, S. Safe, D. Schrenk, D. Tillitt, M. Tysklind, M. Younes, F. Waern and T. Zacharewski. 1998. Toxic equivalency factors (TEFs) for PCBs, PCDDs, PCDFs for humans and wildlife. Environ. Health Persp. 106(12):775-792.
Vermeer K. and L.M. Reynolds. 1970. Organochlorine residues in aquatic birds in the Canadian
prairie provinces. Canadian Field-Naturalist 84:117-130. Weiner J.G., D.P. Krabbenhoft, G.H. Heinz, and A.M. Scheuhammer. 2003. Ecotoxicology of
mercury. Pages 409 - 463 in Hoffman D.J., B.A. Rattner, G.A. Burton, Jr., and J. Cairns, Jr. (eds). Handbook of Ecotoxicology, 2nd Edition. Lewis Publ. Boca Raton, FL.
Welch L.J. 1994. Contaminant burdens and reproductive rates of bald eagles breeding in Maine.
M.S. Thesis. Univ. Maine. Orono, ME. Weseloh D.V., T.W. Custer and B.M. Braune. 1989. Organochlorine contaminants in eggs of
common terns from the Canadian Great Lakes, 1981. Environ. Pollut. 59:141-160. Wiemeyer S.N. 1996. Other organochlorine pesticides in birds. Pages 99 - 115 in Beyer W.N,
G.H. Heinz and A.W. Redmon-Norwood (eds.). Environmental contaminants in wildlife - interpreting tissue concentrations. Lewis Publishers. Boca Raton, FL. 494 pp.
49
Yamashita N., S. Tanabe, J.P. Ludwig, H. Kurita, M.E. Ludwig and R. Tatsukawa. 1993. Embryonic abnormalities and organochlorine contamination in double-crested cormorants (Phalacrocorax auritus) and Caspian terns (Hydroprogne caspia) from the upper Great Lakes in 1988. Environ. Pollut. 79:163-173.

FIGURES Figure 1. Location of study islands in the Gulf of Maine Figure 2. Percent lipids in eggs among island (years combined) Figure 3. Percent lipids in eggs by island and year Figure 4. Percent lipids in chicks among islands (years combined) Figure 5. Percent lipids in chicks by island and year Figure 6. Dioxin toxic equivalents in COTE egg composites Figure 7. TCDD-TEQ – Gulf of Maine vs. Buzzards Bay and the Great Lakes Figure 8. PCB congener profiles in COTE egg composites Figure 9. PCB congener concentrations in COTE egg composites Figure 10. Percent lipid in COTE eggs – target vs. reference islands Figure 11. Total PCBs in COTE eggs on a lipid weight basis – target vs. reference islands Figure 12. Percent lipid in COTE chicks – target vs. reference islands Figure 13. Total PCBs in COTE chicks on a lipid weight basis – target vs. reference islands Figure 14. Total PCBs in COTE eggs and chicks – target vs. reference islands Figure 15. Total PCBs in COTE eggs and chicks by island Figure 16. Fledging success relative to Total PCBs in COTE eggs Figure 17. Fledging success relative to Total PCBs in COTE chicks Figure 18. DDE in COTE eggs and chicks – target vs. reference islands Figure 19. DDE in COTE eggs and chicks by island Figure 20. Oxychlordane in COTE eggs and chicks – target vs. reference islands Figure 21. Oxychlordane in COTE eggs and chicks by island Figure 22. Heptachlor epoxide in COTE eggs and chicks – target vs. reference islands Figure 23. Heptachlor epoxide in COTE eggs and chicks by island Figure 24. Dieldrin in COTE eggs and chicks – target vs. reference islands Figure 25. Dieldrin in COTE eggs and chicks by island Figure 26. HCB in COTE eggs and chicks – target vs. reference islands Figure 27. HCB in COTE eggs and chicks by island Figure 28. Mirex in COTE eggs and chicks – target vs. reference islands Figure 29. Mirex in COTE eggs and chicks by island Figure 30. Arsenic in COTE eggs and chicks – target vs. reference islands Figure 31. Arsenic in COTE eggs and chicks by island Figure 32. Copper in COTE eggs and chicks – target vs. reference islands Figure 33. Copper in COTE eggs and chicks by island Figure 34. Mercury in COTE eggs and chicks – target vs. reference islands Figure 35. Mercury in COTE eggs and chicks by island Figure 36. Manganese in COTE eggs and chicks – target vs. reference islands Figure 37. Manganese in COTE eggs and chicks by island Figure 38. Selenium in COTE eggs and chicks – target vs. reference islands Figure 39. Selenium in COTE eggs and chicks by island Figure 40. Strontium in COTE eggs and chicks – target vs. reference islands Figure 41. Strontium in COTE eggs and chicks by island
Figure 42. Zinc in COTE eggs and chicks – target vs. reference islands Figure 43. Zinc in COTE eggs and chicks by island Figure 44. COTE productivity at the five study islands, 2002 - 2007

Figure 1. Location of study islands in the Gulf of Maine.
Target Islands
Reference Islands
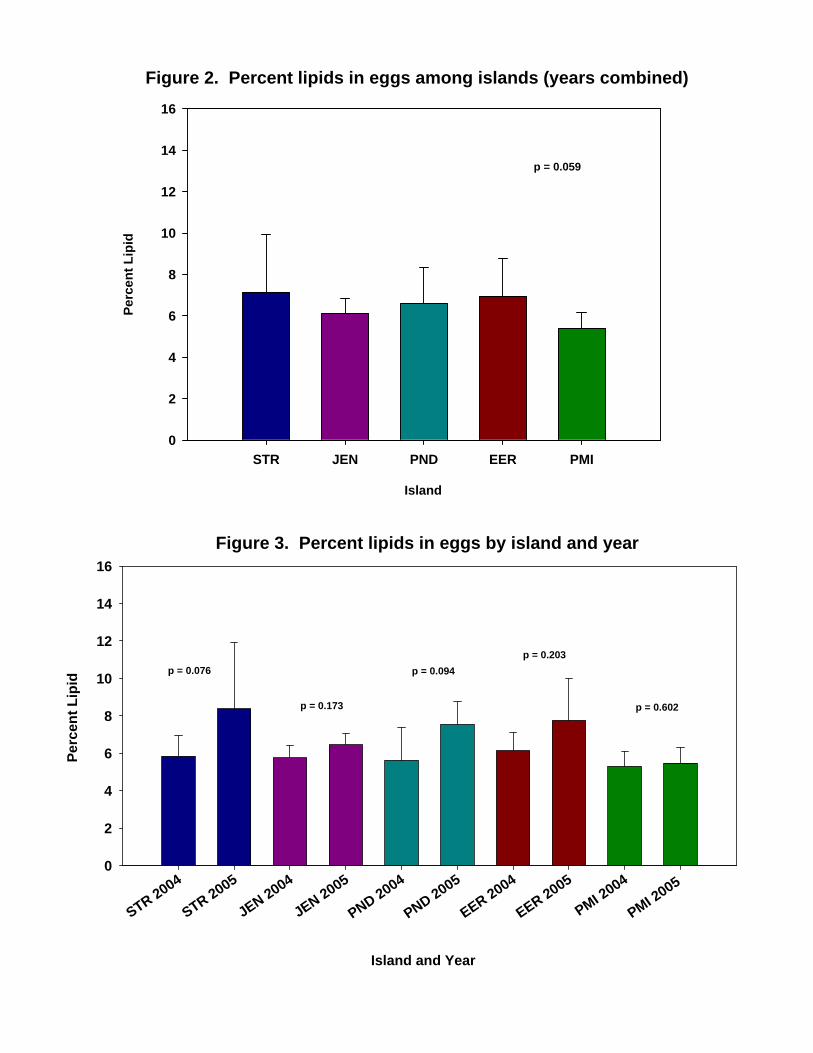
Island
STR JEN PND EER PMI
Perc
ent L
ipid
0
2
4
6
8
10
12
14
16
p = 0.059
Island and Year
STR 2004
STR 2005
JEN 2004
JEN 2005
PND 2004
PND 2005
EER 2004
EER 2005
PMI 2004
PMI 2005
Perc
ent L
ipid
0
2
4
6
8
10
12
14
16
p = 0.076
p = 0.173
p = 0.094p = 0.203
p = 0.602
Figure 2. Percent lipids in eggs among islands (years combined)
Figure 3. Percent lipids in eggs by island and year
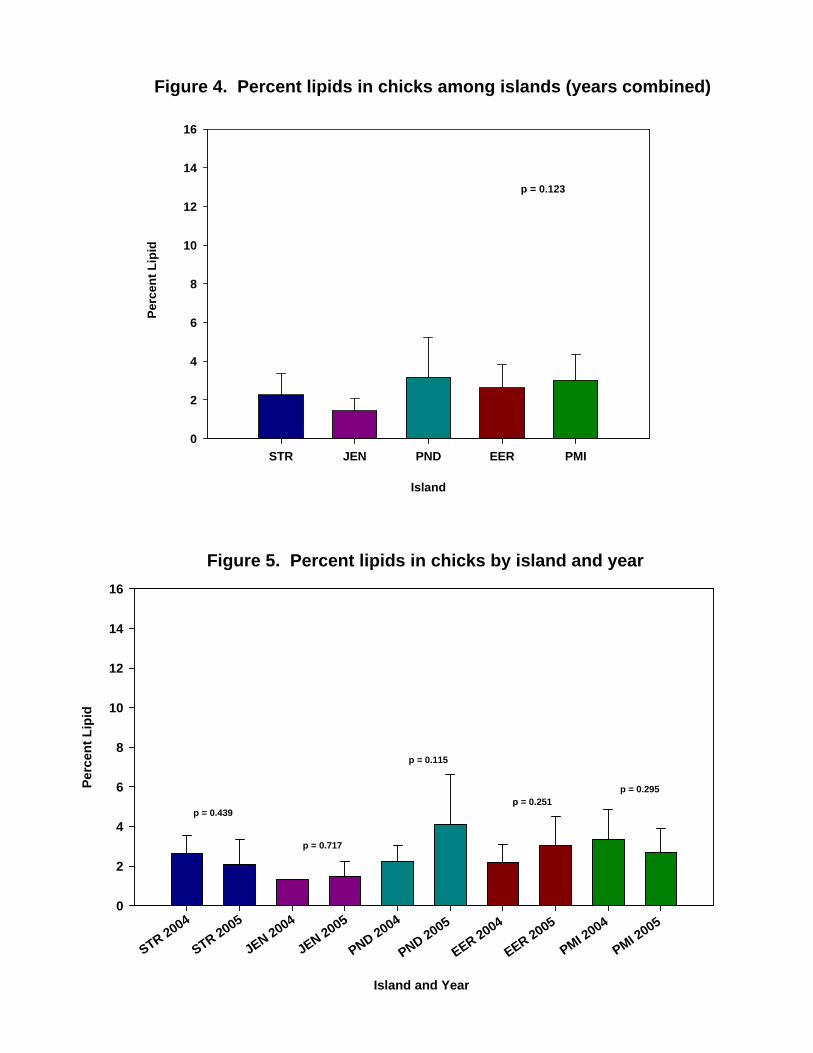
Island
STR JEN PND EER PMI
Perc
ent L
ipid
0
2
4
6
8
10
12
14
16
p = 0.123
Island and Year
STR 2004
STR 2005
JEN 2004
JEN 2005
PND 2004
PND 2005
EER 2004
EER 2005
PMI 2004
PMI 2005
Perc
ent L
ipid
0
2
4
6
8
10
12
14
16
p = 0.439
p = 0.717
p = 0.115
p = 0.251p = 0.295
Figure 4. Percent lipids in chicks among islands (years combined)
Figure 5. Percent lipids in chicks by island and year
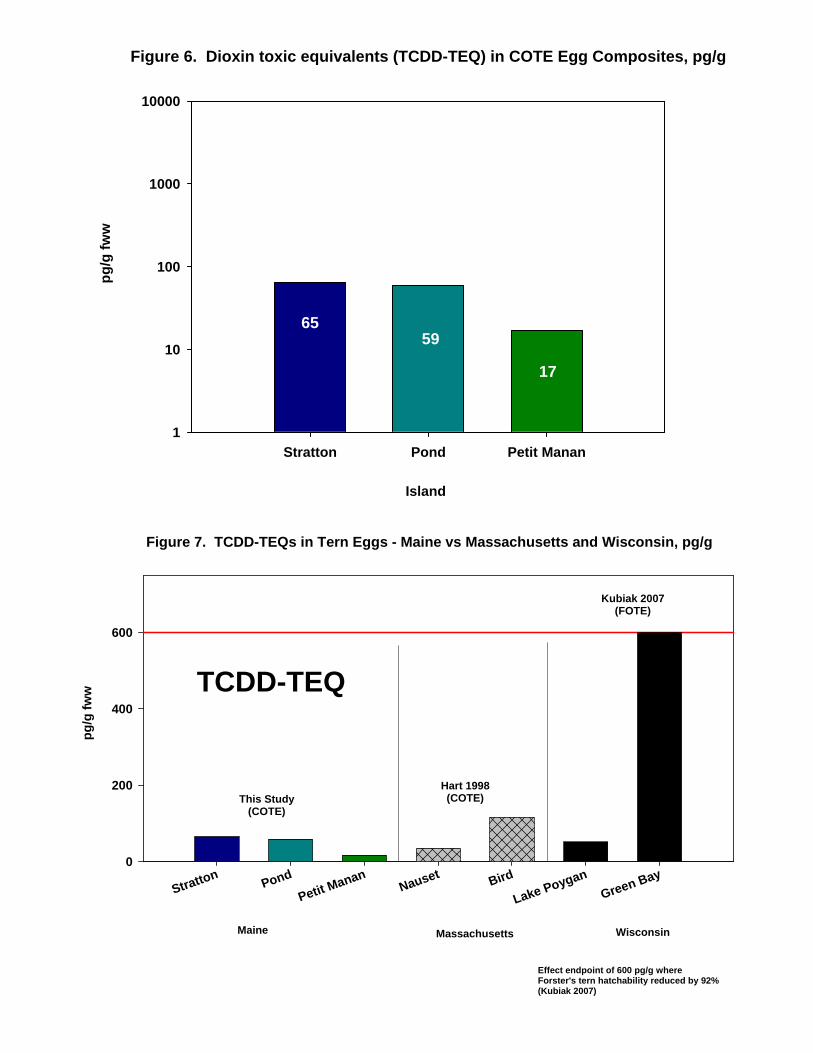
Figure 6. Dioxin toxic equivalents (TCDD-TEQ) in COTE Egg Composites, pg/g
Island
Stratton Pond Petit Manan
pg/g
fww
1
10
100
1000
10000
6559
17
Stratton PondPetit M
ananNauset Bird
Lake PoyganGreen Bay
pg/g
fww
0
200
400
600
This Study(COTE)
Hart 1998(COTE)
Maine Massachusetts
Figure 7. TCDD-TEQs in Tern Eggs - Maine vs Massachusetts and Wisconsin, pg/g
TCDD-TEQ
Kubiak 2007(FOTE)
Effect endpoint of 600 pg/g where Forster's tern hatchability reduced by 92%(Kubiak 2007)
Wisconsin

PCB Congener (with co-elutes)
PCB# 1
PCB# 8/5
PCB# 18/17
PCB# 25
PCB# 28
PCB# 31
PCB# 41/64
PCB# 42/59/37
PCB# 44
PCB# 45
PCB# 47/75
PCB# 48
PCB# 49
PCB# 52
PCB# 60/56
PCB# 66
PCB# 67
PCB# 70
PCB# 72
PCB# 74/61
PCB# 77
PCB# 82
PCB# 85
PCB# 87/115
PCB# 92
PCB# 95/80
PCB# 97
PCB# 99
PCB# 101/90
PCB# 105
PCB# 107
PCB# 110
PCB# 118
PCB# 119
PCB# 128
PCB# 130
PCB# 135
PCB# 136
PCB# 138/160
PCB# 141/179
PCB# 146
PCB# 149/123
PCB# 151
PCB# 153/132
PCB# 156
PCB# 157/173/201
PCB# 158
PCB# 166
PCB# 167
PCB# 170/190
PCB# 171/202
PCB# 172
PCB# 174
PCB# 175
PCB# 176/137
PCB# 177
PCB# 178
PCB# 180
PCB# 183
PCB# 185
PCB# 187
PCB# 189
PCB# 191
PCB# 193
PCB# 194
PCB# 195/208
PCB# 196
PCB# 197
PCB# 199
PCB# 205
PCB# 206
PCB# 207
PCB# 2090
5
10
15
20
25
Stratton Island
Pond Island
Petit Manan Island
Perc
ent C
ontr
ibut
ion
to T
otal
PC
B L
oad
Figure 8. PCB Congener Patterns in COTE Egg Composites

Figure 9. PCB congener concentrations in COTE egg composites, ng/g wet weight
PCB Congener (with co-elutes)
PCB# 1
PCB# 8/5
PCB# 18/17
PCB# 25
PCB# 28
PCB# 31
PCB# 41/64
PCB# 42/59/37
PCB# 44
PCB# 45
PCB# 47/75
PCB# 48
PCB# 49
PCB# 52
PCB# 60/56
PCB# 66
PCB# 67
PCB# 70
PCB# 72
PCB# 74/61
PCB# 77
PCB# 82
PCB# 85
PCB# 87/115
PCB# 92
PCB# 95/80
PCB# 97
PCB# 99
PCB# 101/90
PCB# 105
PCB# 107
PCB# 110
PCB# 118
PCB# 119
PCB# 128
PCB# 130
PCB# 135
PCB# 136
PCB# 138/160
PCB# 141/179
PCB# 146
PCB# 149/123
PCB# 151
PCB# 153/132
PCB# 156
PCB# 157/173/201
PCB# 158
PCB# 166
PCB# 167
PCB# 170/190
PCB# 171/202
PCB# 172
PCB# 174
PCB# 175
PCB# 176/137
PCB# 177
PCB# 178
PCB# 180
PCB# 183
PCB# 185
PCB# 187
PCB# 189
PCB# 191
PCB# 193
PCB# 194
PCB# 195/208
PCB# 196
PCB# 197
PCB# 199
PCB# 205
PCB# 206
PCB# 207
PCB# 209
ng/g
wet
wei
ght
0
50
100
150
200
Stratton Island Pond Island Petit Manan Island

Figure 10. Percent lipid in COTE eggs - target vs. reference islands.
Islands
Target Reference
Perc
ent
0
2
4
6
8
10
12
14
16
StrattonJennyPond
(n = 30 eggs)
Eastern EggPetit Manan
(n = 20 eggs)
p = 0.41
Figure 11. Total PCBs in COTE eggs on a lipid weight basis - target vs. reference islands
Islands
Target Reference
ug T
otal
PC
Bs
/ g L
ipid
0
2
4
6
8
10
12
14
16
18
p = 0.003
StrattonJennyPond
(n = 30)Eastern EggPetit Manan
(n = 20)
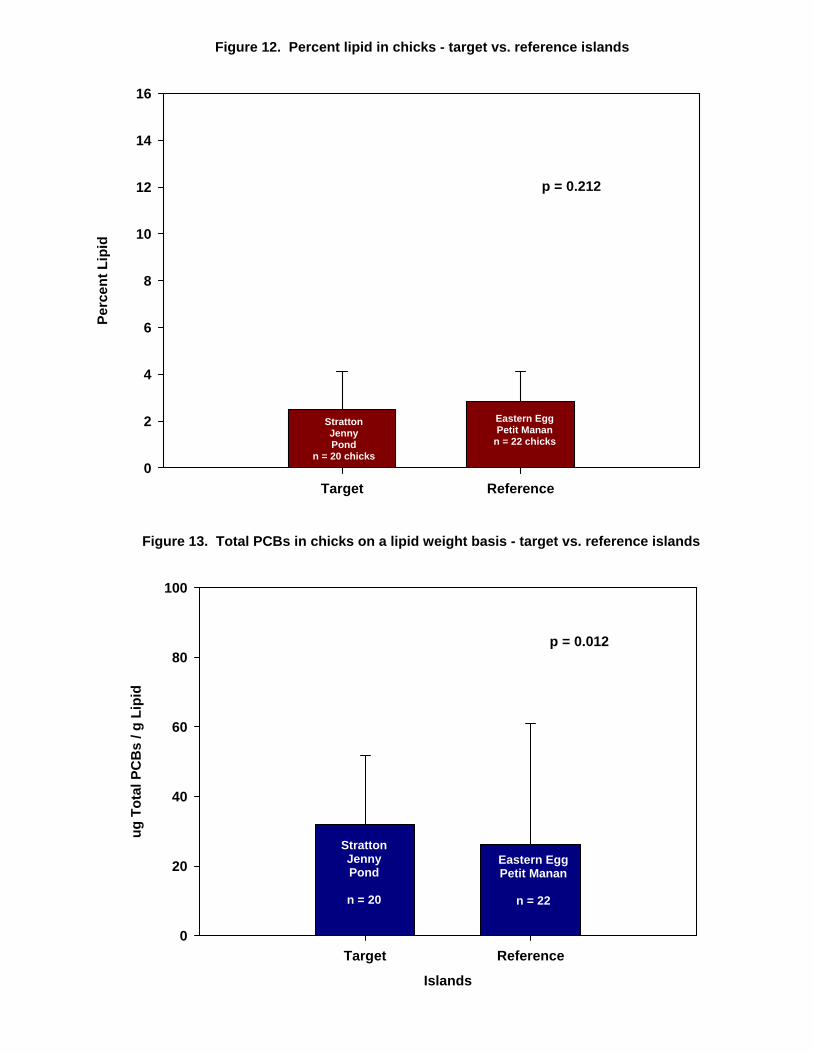
Islands
Target Reference
Perc
ent L
ipid
0
2
4
6
8
10
12
14
16
StrattonJennyPond
n = 20 chicks
Eastern EggPetit Manan
n = 22 chicks
p = 0.212
Figure 12. Percent lipid in chicks - target vs. reference islands
Islands
Target Reference
ug T
otal
PC
Bs
/ g L
ipid
0
20
40
60
80
100
p = 0.012
StrattonJennyPond
n = 20
Eastern EggPetit Manan
n = 22
Figure 13. Total PCBs in chicks on a lipid weight basis - target vs. reference islands
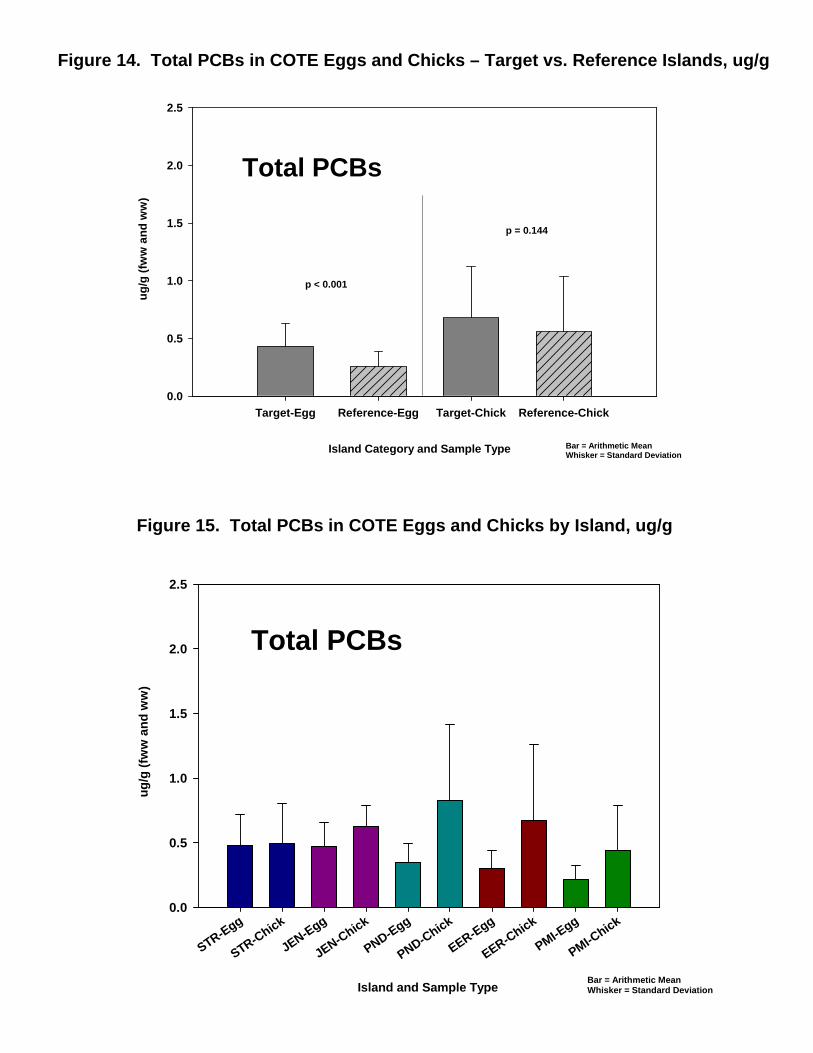
Island and Sample Type
STR-Egg
STR-Chick
JEN-Egg
JEN-Chick
PND-Egg
PND-Chick
EER-Egg
EER-Chick
PMI-Egg
PMI-Chick
ug/g
(fw
w a
nd w
w)
0.0
0.5
1.0
1.5
2.0
2.5
Bar = Arithmetic MeanWhisker = Standard Deviation
Total PCBs
Island Category and Sample Type
Target-Egg Reference-Egg Target-Chick Reference-Chick
ug/g
(fw
w a
nd w
w)
0.0
0.5
1.0
1.5
2.0
2.5
Total PCBs
p < 0.001
p = 0.144
Bar = Arithmetic MeanWhisker = Standard Deviation
Figure 14. Total PCBs in COTE Eggs and Chicks – Target vs. Reference Islands, ug/g
Figure 15. Total PCBs in COTE Eggs and Chicks by Island, ug/g
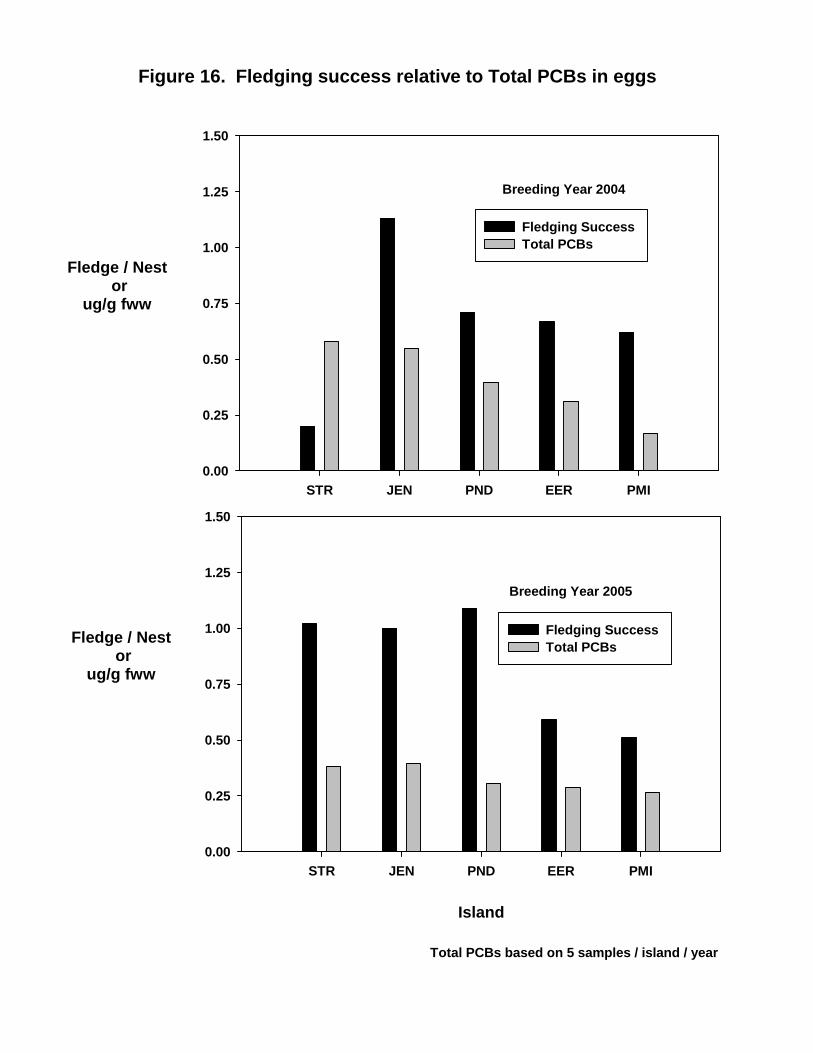
Island
STR JEN PND EER PMI0.00
0.25
0.50
0.75
1.00
1.25
1.50
Figure 16. Fledging success relative to Total PCBs in eggs
STR JEN PND EER PMI
Fledge / Nest or
ug/g fww
0.00
0.25
0.50
0.75
1.00
1.25
1.50
Fledging Success Total PCBs
Breeding Year 2004
Breeding Year 2005
Fledge / Nest or
ug/g fww
Total PCBs based on 5 samples / island / year
Fledging Success Total PCBs

Figure 17. Fledging success relative to Total PCBs in chicks
STR JEN PND EER PMI
Fledge / Nestor
ug/g ww
0.00
0.25
0.50
0.75
1.00
1.25
1.50
Island
STR JEN PND EER PMI0.00
0.25
0.50
0.75
1.00
1.25
1.50
Fledging Success Total PCBs
Fledge / Nestor
ug/g ww
n = 2
n = 1
n = 4
Breeding Year 2004
Breeding Year 2005
Total PCBs based on 5 samples / island / year unless noted
Fledging Success Total PCBs

Island and Sample Type
STR-Egg
STR-Chick
JEN-Egg
JEN-Chick
PND-Egg
PND-Chick
EER-Egg
EER-Chick
PMI-Egg
PMI-Chick
ug/g
(fw
w a
nd w
w)
0.00
0.05
0.10
0.15
0.20
0.25
0.30
DDE
Bar = Arithmetic MeanWhisker = Standard Deviation
Island Category and Sample Type
Target-Egg Reference-Egg Target-Chick Reference-Chick
ug/g
(fw
w a
nd w
w)
0.00
0.05
0.10
0.15
0.20
0.25
0.30
Bar = Arithmetic MeanWhisker = Standard Deviation
DDE
p = 0.067
p = 0.571
Figure 18. DDE in COTE Eggs and Chicks – Target vs. Reference Islands, ug/g
Figure 19. DDE in COTE Eggs and Chicks by Island, ug/g

Figure 20. Oxychlordane in COTE Eggs and Chicks - Target vs. Reference Islands, ug/g
Island Category and Sample Type
Target-Egg Reference-Egg Target-Chick Reference-Chick
ug/g
(fw
w a
nd w
w)
0.000
0.005
0.010
0.015
0.020
0.025
Oxychlordane
p = 0.003
p = 0.006
Bar = Arithmetic MeanWhisker = Standard Deviation
Figure 21. Oxychlordane in COTE Eggs and Chicks by Island, ug/g
Island and Sample Type
STR-Egg
STR-Chick
JEN-Egg
JEN-Chick
PND-Egg
PND-Chick
EER-Egg
EER-Chick
PMI-Egg
PMI-Chick
ug/g
(fw
w a
nd w
w)
0.000
0.005
0.010
0.015
0.020
0.025
Oxychlordane
Bar = Arithmetic MeanWhisker = Standard Deviation

Figure 22. Heptachlor epoxide in COTE Eggs and Chicks - Target vs. Reference Islands, ug/g
Island Category and Sample Type
Target-Egg Reference-Egg Target-Chick Reference-Chick
ug/g
(fw
w a
nd w
w)
0.000
0.005
0.010
0.015
0.020
0.025
p = 0.742
p = 0.545
Bar = Arithmetic MeanWhisker = Standard Deviation
Heptachlor epoxide
Figure 23. Heptachlor epoxide in COTE Eggs and Chicks by Island, ug/g
Island and Sample Type
STR-Egg
STR-Chick
JEN-Egg
JEN-Chick
PND-Egg
PND-Chick
EER-Egg
EER-Chick
PMI-Egg
PMI-Chick
ug/g
(fw
w a
nd w
w)
0.000
0.005
0.010
0.015
0.020
0.025
Bar = Arithmetic MeanWhisker = Standard Deviation
Heptachlor epoxide

Figure 24. Dieldrin in COTE Eggs and Chicks - Target vs. Reference Islands, ug/g
Island Category and Sample Type
Target-Egg Reference-Egg Target-Chick Reference-Chick
ug/g
(fw
w a
nd w
w)
0.000
0.005
0.010
0.015
0.020
0.025
Dieldrin
p = 0.860
p = 0.148
Bar = Arithmetic meanWhisker = Standard Deviation
Figure 25. Dieldrin in COTE Eggs and Chicks by Island, ug/g
Island and Sample Type
STR-Egg
STR-Chick
JEN-Egg
JEN-Chick
PND-Egg
PND-Chick
EER-Egg
EER-Chick
PMI-Egg
PMI-Chick
ug/g
(fw
w a
nd w
w)
0.000
0.005
0.010
0.015
0.020
0.025
Dieldrin
Bar = Arithmetic MeanWhisker = Standard Deviation

Figure 26. Hexachlorobenzene (HCB) in COTE Eggs and Chicks - Target vs. Reference Islands, ug/g
Island Category and Sample Type
Target-Egg Reference-Egg Target-Chick Reference-Chick
ug/g
fww
and
ww
0.000
0.005
0.010
0.015
0.020
0.025
p = 0.154
p = 0.078
HCB
Bar = Arithmetic MeanWhisker = Standard Deviation
Figure 27. Hexachlorobenzene (HCB) in COTE Eggs and Chicks by Island, ug/g
Island and Sample Type
STR-Egg
STR-Chick
JEN-Egg
JEN-Chick
PND-Egg
PND-Chick
EER-Egg
EER-Chick
PMI-Egg
PMI-Chick
ug/g
(fw
w a
nd w
w)
0.000
0.005
0.010
0.015
0.020
0.025
Bar = Arithmetic MeanWhisker = Standard Deviation
HCB

Figure 28. Mirex in COTE Eggs and Chicks - Target vs. Reference Islands, ug/g
Island Category and Sample Type
Target-Egg Reference-Egg Target-Chick Reference-Chick
ug/g
(fw
w a
nd w
w)
0.000
0.005
0.010
0.015
0.020
0.025
p = 0.011
p = 0.950
Mirex
Bar = Arithmetic MeanWhisker = Standard Deviation
Figure 29. Mirex in COTE Eggs and Chicks by Island, ug/g
Island and Sample Type
STR-Egg
STR-Chick
JEN-Egg
JEN-Chick
PND-Egg
PND-Chick
EER-Egg
EER-Chick
PMI-Egg
PMI-Chick
ug/g
(fw
w a
nd w
w)
0.000
0.005
0.010
0.015
0.020
0.025
Bar = Arithmetic MeanWhisker = Standard Deviation
Mirex
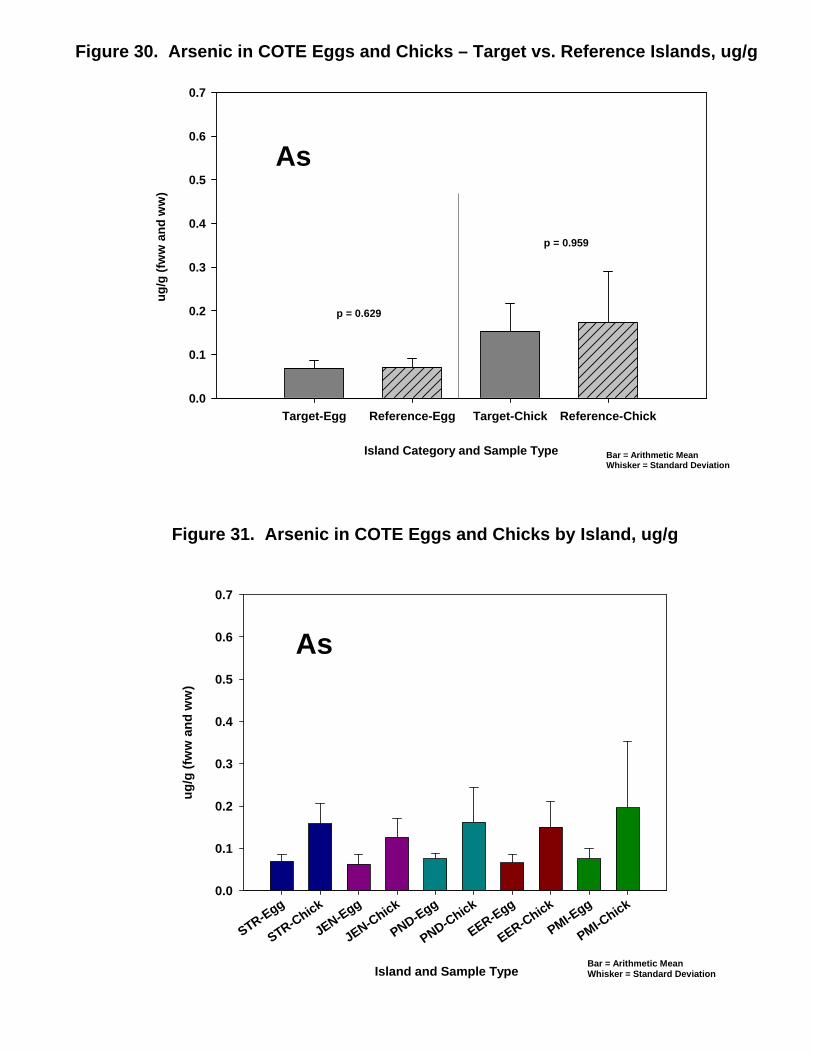
Island Category and Sample Type
Target-Egg Reference-Egg Target-Chick Reference-Chick
ug/g
(fw
w a
nd w
w)
0.0
0.1
0.2
0.3
0.4
0.5
0.6
0.7
As
p = 0.629
p = 0.959
Bar = Arithmetic MeanWhisker = Standard Deviation
Island and Sample Type
STR-Egg
STR-Chick
JEN-Egg
JEN-Chick
PND-Egg
PND-Chick
EER-Egg
EER-Chick
PMI-Egg
PMI-Chick
ug/g
(fw
w a
nd w
w)
0.0
0.1
0.2
0.3
0.4
0.5
0.6
0.7
As
Bar = Arithmetic MeanWhisker = Standard Deviation
Figure 30. Arsenic in COTE Eggs and Chicks – Target vs. Reference Islands, ug/g
Figure 31. Arsenic in COTE Eggs and Chicks by Island, ug/g
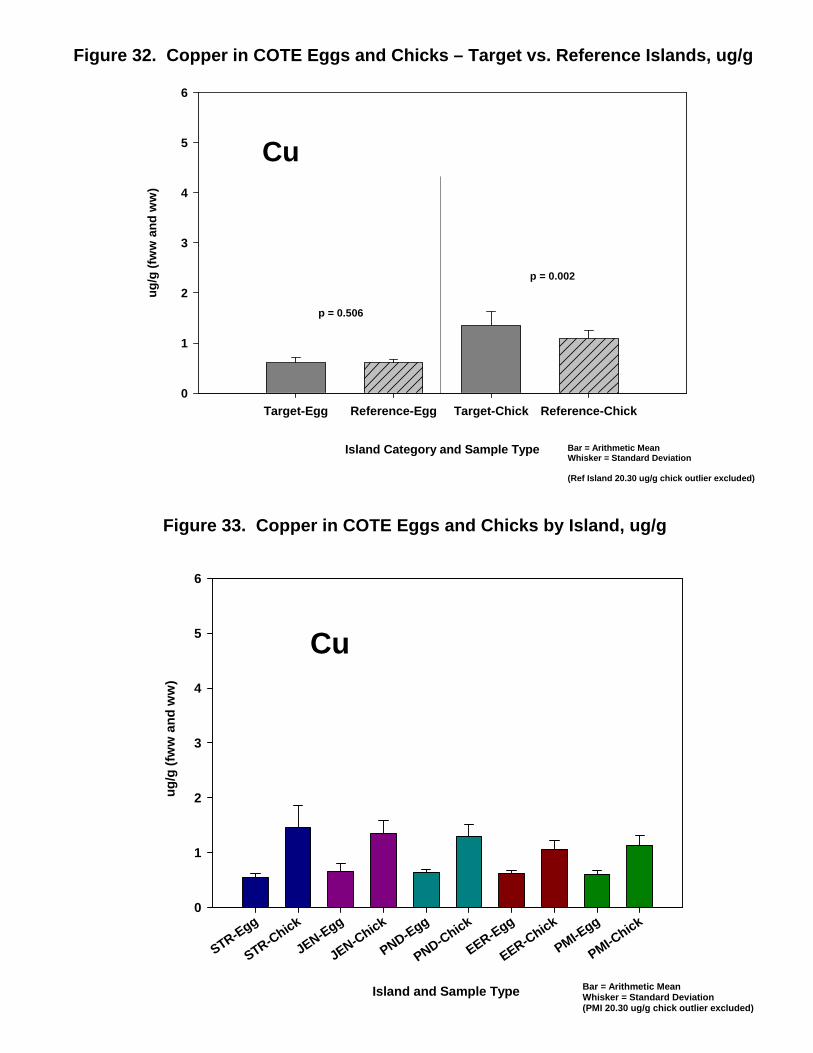
Island Category and Sample Type
Target-Egg Reference-Egg Target-Chick Reference-Chick
ug/g
(fw
w a
nd w
w)
0
1
2
3
4
5
6
Cu
Bar = Arithmetic MeanWhisker = Standard Deviation
(Ref Island 20.30 ug/g chick outlier excluded)
p = 0.506
p = 0.002
Island and Sample Type
STR-Egg
STR-Chick
JEN-Egg
JEN-Chick
PND-Egg
PND-Chick
EER-Egg
EER-Chick
PMI-Egg
PMI-Chick
ug/g
(fw
w a
nd w
w)
0
1
2
3
4
5
6
Bar = Arithmetic MeanWhisker = Standard Deviation(PMI 20.30 ug/g chick outlier excluded)
Cu
Figure 32. Copper in COTE Eggs and Chicks – Target vs. Reference Islands, ug/g
Figure 33. Copper in COTE Eggs and Chicks by Island, ug/g
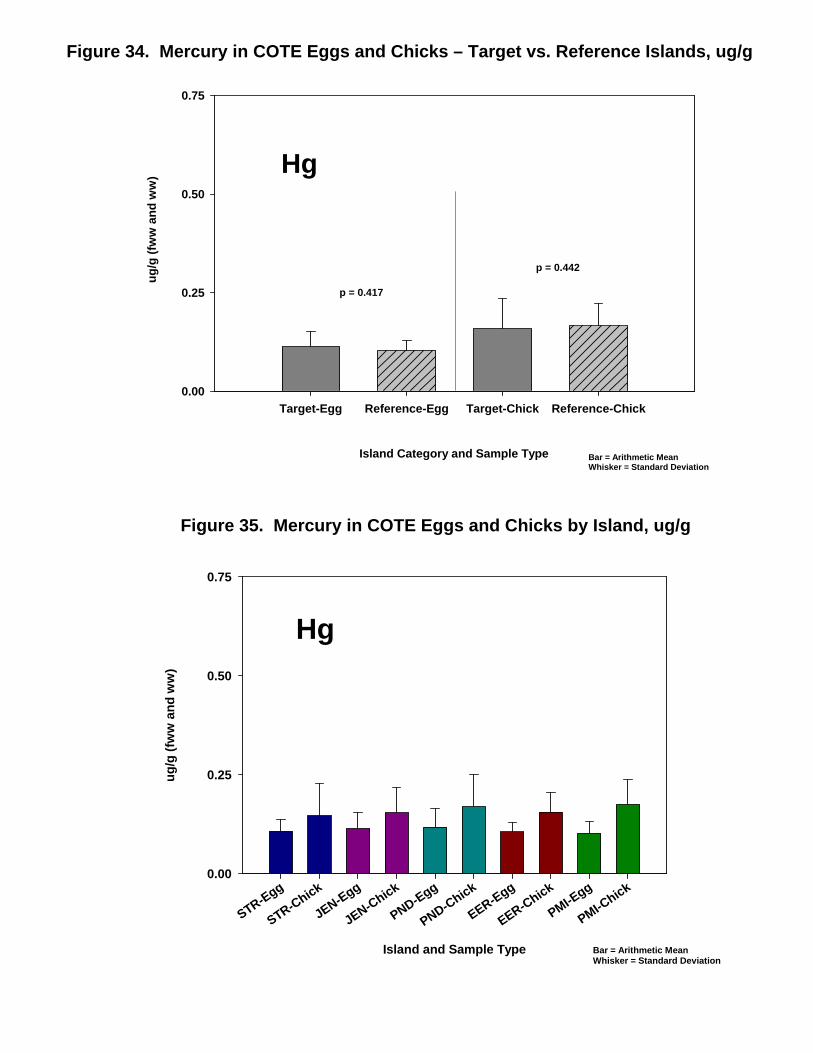
Island Category and Sample Type
Target-Egg Reference-Egg Target-Chick Reference-Chick
ug/g
(fw
w a
nd w
w)
0.00
0.25
0.50
0.75
Hg
Bar = Arithmetic MeanWhisker = Standard Deviation
p = 0.442
p = 0.417
Island and Sample Type
STR-Egg
STR-Chick
JEN-Egg
JEN-Chick
PND-Egg
PND-Chick
EER-Egg
EER-Chick
PMI-Egg
PMI-Chick
ug/g
(fw
w a
nd w
w)
0.00
0.25
0.50
0.75
Hg
Bar = Arithmetic MeanWhisker = Standard Deviation
Figure 34. Mercury in COTE Eggs and Chicks – Target vs. Reference Islands, ug/g
Figure 35. Mercury in COTE Eggs and Chicks by Island, ug/g

Island Category and Sample Type
Target-Egg Reference-Egg Target-Chick Reference-Chick
ug/g
(fw
w a
nd w
w)
0.0
0.5
1.0
1.5
2.0
2.5
3.0
3.5
Mn
Bar = Arithmetic MeanWhisker = Standard Deviation
p = 0.008
p = 0.062
Island and Sample Type
STR-Egg
STR-Chick
JEN-Egg
JEN-Chick
PND-Egg
PND-Chick
EER-Egg
EER-Chick
PMI-Egg
PMI-Chick
ug/g
(fw
w a
nd w
w)
0.0
0.5
1.0
1.5
2.0
2.5
3.0
3.5
Mn
Bar = Arithmetic MeanWhisker = Standard Deviation
Figure 36. Manganese in COTE Eggs and Chicks – Target vs. Reference Islands, ug/g
Figure 37. Manganese in COTE Eggs and Chicks by Island, ug/g

Island and Sample Type
STR-Egg
STR-Chick
JEN-Egg
JEN-Chick
PND-Egg
PND-Chick
EER-Egg
EER-Chick
PMI-Egg
PMI-Chick
ug/g
(fw
w a
nd w
w)
0.0
0.5
1.0
1.5
2.0
2.5
3.0
Se
Bars = Arithmetic MeanWhiskers = Standard Deviation
Island Category and Sample Type
Target-Egg Reference-Egg Target-Chick Reference-Chick
ug/g
(fw
w a
nd w
w)
0.0
0.5
1.0
1.5
2.0
2.5
3.0
Bars = Arithmetic MeanWhiskers = Standard Deviation
p = 0.774 p = 0.140
Se
Figure 38. Selenium in COTE Eggs and Chicks – Target vs. Reference Islands, ug/g
Figure 39. Selenium in COTE Eggs and Chicks by Island, ug/g
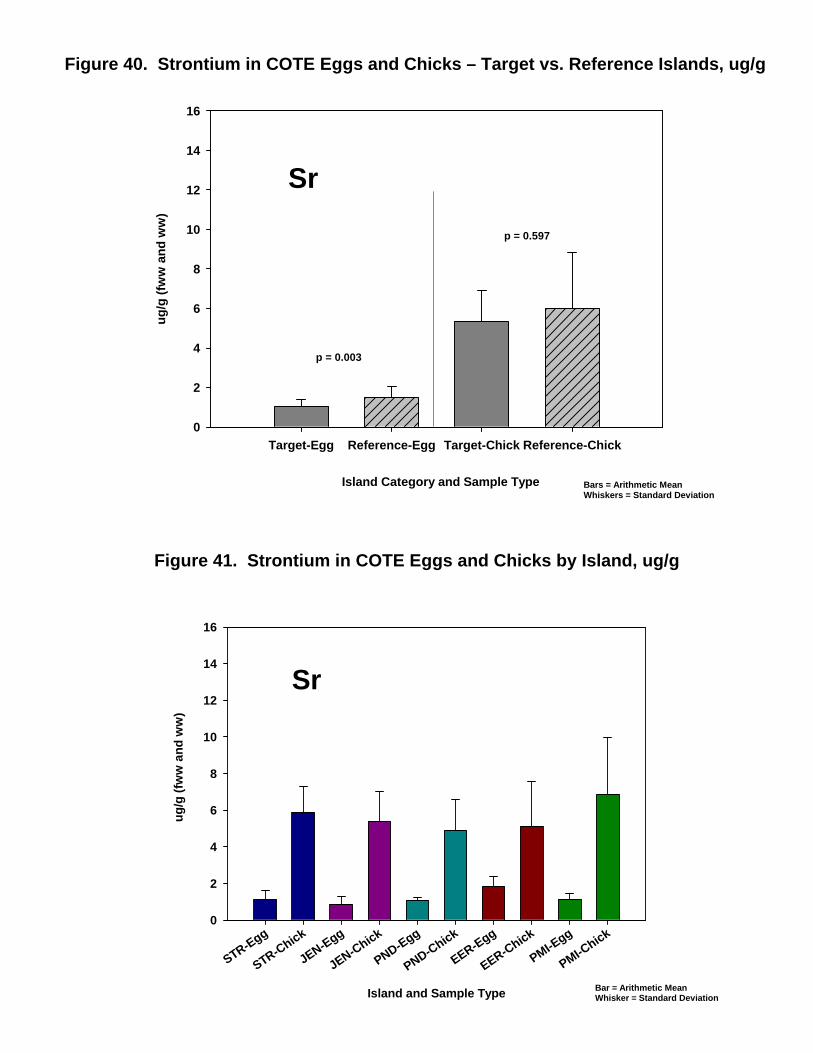
Island and Sample Type
STR-Egg
STR-Chick
JEN-Egg
JEN-Chick
PND-Egg
PND-Chick
EER-Egg
EER-Chick
PMI-Egg
PMI-Chick
ug/g
(fw
w a
nd w
w)
0
2
4
6
8
10
12
14
16
Sr
Bar = Arithmetic MeanWhisker = Standard Deviation
Island Category and Sample Type
Target-Egg Reference-Egg Target-Chick Reference-Chick
ug/g
(fw
w a
nd w
w)
0
2
4
6
8
10
12
14
16
Bars = Arithmetic MeanWhiskers = Standard Deviation
p = 0.003
p = 0.597
Sr
Figure 40. Strontium in COTE Eggs and Chicks – Target vs. Reference Islands, ug/g
Figure 41. Strontium in COTE Eggs and Chicks by Island, ug/g
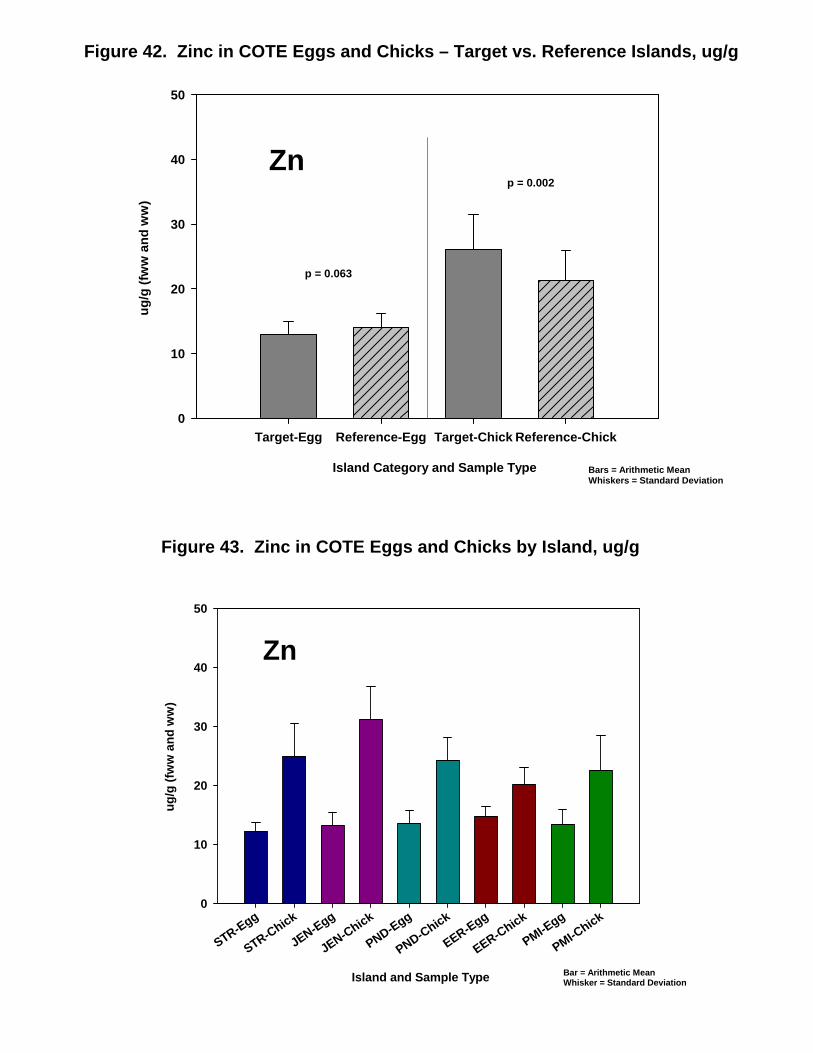
Island and Sample Type
STR-Egg
STR-Chick
JEN-Egg
JEN-Chick
PND-Egg
PND-Chick
EER-Egg
EER-Chick
PMI-Egg
PMI-Chick
ug/g
(fw
w a
nd w
w)
0
10
20
30
40
50
Zn
Bar = Arithmetic MeanWhisker = Standard Deviation
Island Category and Sample Type
Target-Egg Reference-Egg Target-Chick Reference-Chick
ug/g
(fw
w a
nd w
w)
0
10
20
30
40
50
Zn
Bars = Arithmetic MeanWhiskers = Standard Deviation
p = 0.063
p = 0.002
Figure 42. Zinc in COTE Eggs and Chicks – Target vs. Reference Islands, ug/g
Figure 43. Zinc in COTE Eggs and Chicks by Island, ug/g
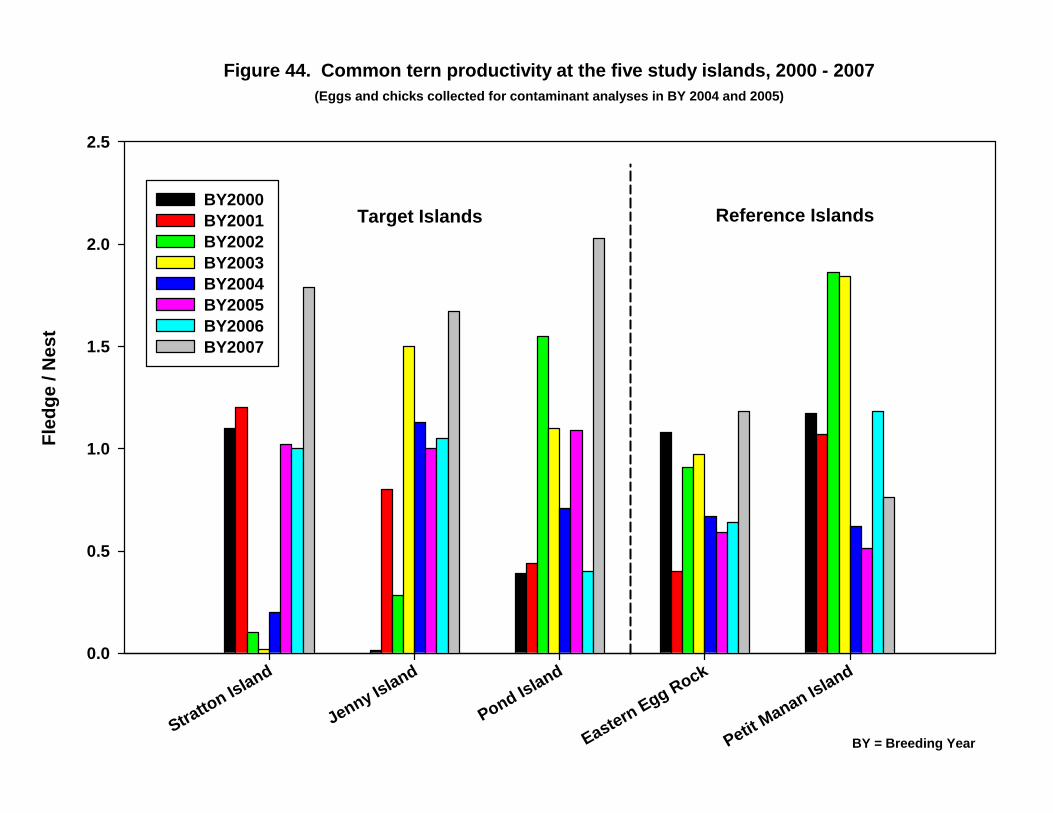
Figure 44. Common tern productivity at the five study islands, 2000 - 2007(Eggs and chicks collected for contaminant analyses in BY 2004 and 2005)
Stratton Island
Jenny Island
Pond Island
Eastern Egg Rock
Petit Manan Island
Fled
ge /
Nes
t
0.0
0.5
1.0
1.5
2.0
2.5
BY2000 BY2001 BY2002 BY2003 BY2004 BY2005 BY2006 BY2007
Target Islands Reference Islands
BY = Breeding Year
TABLES Table 1. Egg metrics and percent lipids Table 2. Chick metrics and percent lipids Table 3. Summary of organochlorines in eggs Table 4. Summary of organochlorines in chicks Table 5. TCDD-TEQs in composite egg samples Table 6. Summary of trace elements in eggs Table 7. Summary of trace elements in chicks
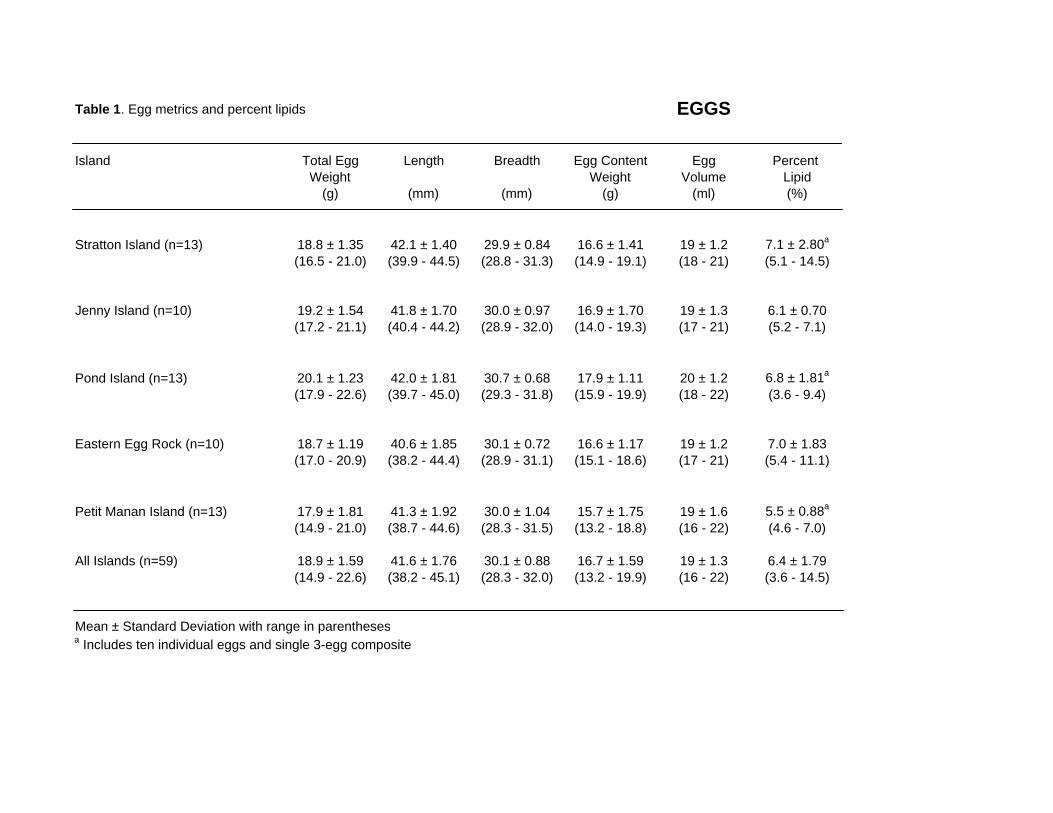
Table 1. Egg metrics and percent lipids EGGS
Island Total Egg Length Breadth Egg Content Egg Percent Weight Weight Volume Lipid
(g) (mm) (mm) (g) (ml) (%)
Stratton Island (n=13) 18.8 ± 1.35 42.1 ± 1.40 29.9 ± 0.84 16.6 ± 1.41 19 ± 1.2 7.1 ± 2.80a
(16.5 - 21.0) (39.9 - 44.5) (28.8 - 31.3) (14.9 - 19.1) (18 - 21) (5.1 - 14.5)
Jenny Island (n=10) 19.2 ± 1.54 41.8 ± 1.70 30.0 ± 0.97 16.9 ± 1.70 19 ± 1.3 6.1 ± 0.70(17.2 - 21.1) (40.4 - 44.2) (28.9 - 32.0) (14.0 - 19.3) (17 - 21) (5.2 - 7.1)
Pond Island (n=13) 20.1 ± 1.23 42.0 ± 1.81 30.7 ± 0.68 17.9 ± 1.11 20 ± 1.2 6.8 ± 1.81a
(17.9 - 22.6) (39.7 - 45.0) (29.3 - 31.8) (15.9 - 19.9) (18 - 22) (3.6 - 9.4)
Eastern Egg Rock (n=10) 18.7 ± 1.19 40.6 ± 1.85 30.1 ± 0.72 16.6 ± 1.17 19 ± 1.2 7.0 ± 1.83(17.0 - 20.9) (38.2 - 44.4) (28.9 - 31.1) (15.1 - 18.6) (17 - 21) (5.4 - 11.1)
Petit Manan Island (n=13) 17.9 ± 1.81 41.3 ± 1.92 30.0 ± 1.04 15.7 ± 1.75 19 ± 1.6 5.5 ± 0.88a
(14.9 - 21.0) (38.7 - 44.6) (28.3 - 31.5) (13.2 - 18.8) (16 - 22) (4.6 - 7.0)
All Islands (n=59) 18.9 ± 1.59 41.6 ± 1.76 30.1 ± 0.88 16.7 ± 1.59 19 ± 1.3 6.4 ± 1.79(14.9 - 22.6) (38.2 - 45.1) (28.3 - 32.0) (13.2 - 19.9) (16 - 22) (3.6 - 14.5)
Mean ± Standard Deviation with range in parenthesesa Includes ten individual eggs and single 3-egg composite
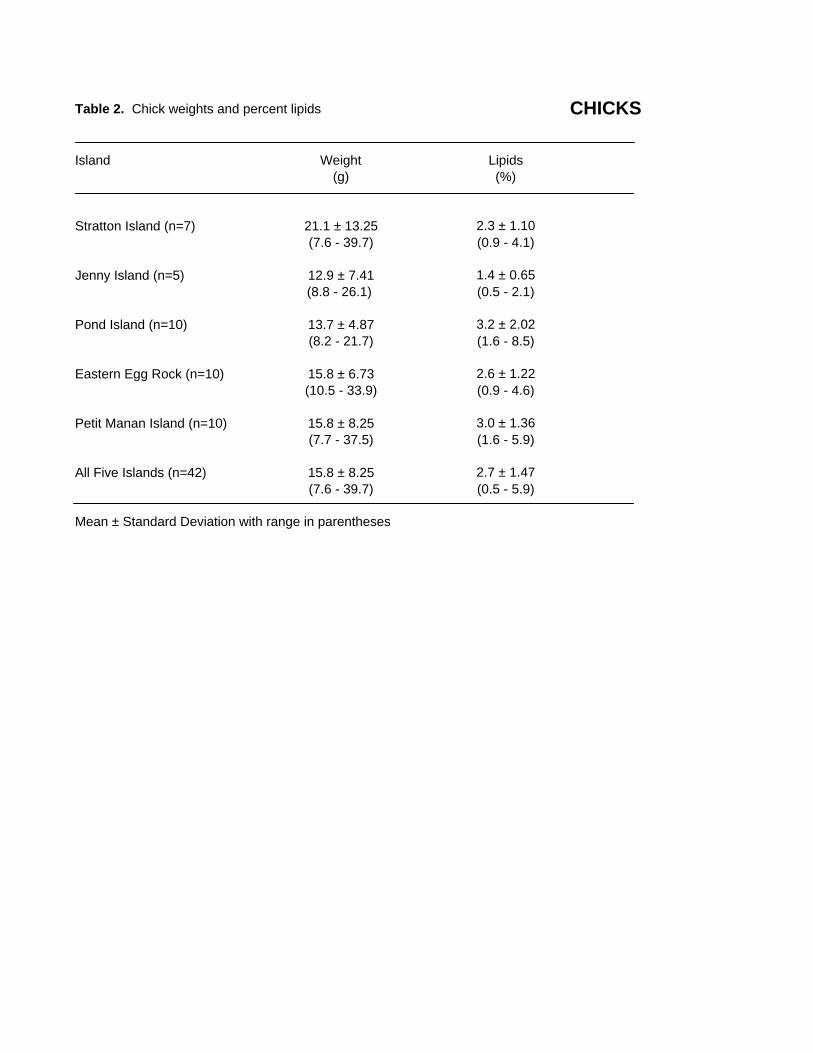
Table 2. Chick weights and percent lipids CHICKS
Island Weight Lipids(g) (%)
Stratton Island (n=7) 21.1 ± 13.25 2.3 ± 1.10(7.6 - 39.7) (0.9 - 4.1)
Jenny Island (n=5) 12.9 ± 7.41 1.4 ± 0.65(8.8 - 26.1) (0.5 - 2.1)
Pond Island (n=10) 13.7 ± 4.87 3.2 ± 2.02(8.2 - 21.7) (1.6 - 8.5)
Eastern Egg Rock (n=10) 15.8 ± 6.73 2.6 ± 1.22(10.5 - 33.9) (0.9 - 4.6)
Petit Manan Island (n=10) 15.8 ± 8.25 3.0 ± 1.36(7.7 - 37.5) (1.6 - 5.9)
All Five Islands (n=42) 15.8 ± 8.25 2.7 ± 1.47(7.6 - 39.7) (0.5 - 5.9)
Mean ± Standard Deviation with range in parentheses
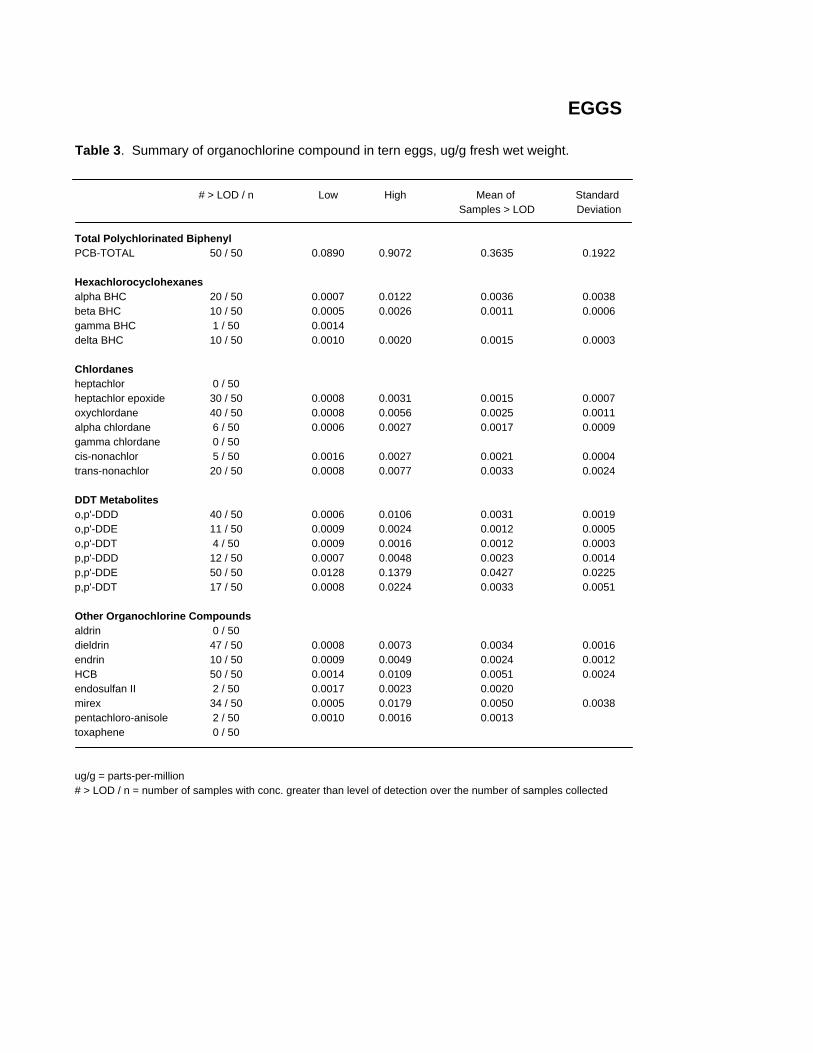
EGGS
Table 3. Summary of organochlorine compound in tern eggs, ug/g fresh wet weight.
# > LOD / n Low High Mean of Standard Samples > LOD Deviation
Total Polychlorinated BiphenylPCB-TOTAL 50 / 50 0.0890 0.9072 0.3635 0.1922
Hexachlorocyclohexanesalpha BHC 20 / 50 0.0007 0.0122 0.0036 0.0038beta BHC 10 / 50 0.0005 0.0026 0.0011 0.0006gamma BHC 1 / 50 0.0014delta BHC 10 / 50 0.0010 0.0020 0.0015 0.0003
Chlordanesheptachlor 0 / 50heptachlor epoxide 30 / 50 0.0008 0.0031 0.0015 0.0007oxychlordane 40 / 50 0.0008 0.0056 0.0025 0.0011alpha chlordane 6 / 50 0.0006 0.0027 0.0017 0.0009gamma chlordane 0 / 50cis-nonachlor 5 / 50 0.0016 0.0027 0.0021 0.0004trans-nonachlor 20 / 50 0.0008 0.0077 0.0033 0.0024
DDT Metaboliteso,p'-DDD 40 / 50 0.0006 0.0106 0.0031 0.0019o,p'-DDE 11 / 50 0.0009 0.0024 0.0012 0.0005o,p'-DDT 4 / 50 0.0009 0.0016 0.0012 0.0003p,p'-DDD 12 / 50 0.0007 0.0048 0.0023 0.0014p,p'-DDE 50 / 50 0.0128 0.1379 0.0427 0.0225p,p'-DDT 17 / 50 0.0008 0.0224 0.0033 0.0051
Other Organochlorine Compoundsaldrin 0 / 50dieldrin 47 / 50 0.0008 0.0073 0.0034 0.0016endrin 10 / 50 0.0009 0.0049 0.0024 0.0012HCB 50 / 50 0.0014 0.0109 0.0051 0.0024endosulfan II 2 / 50 0.0017 0.0023 0.0020mirex 34 / 50 0.0005 0.0179 0.0050 0.0038pentachloro-anisole 2 / 50 0.0010 0.0016 0.0013toxaphene 0 / 50
ug/g = parts-per-million# > LOD / n = number of samples with conc. greater than level of detection over the number of samples collected
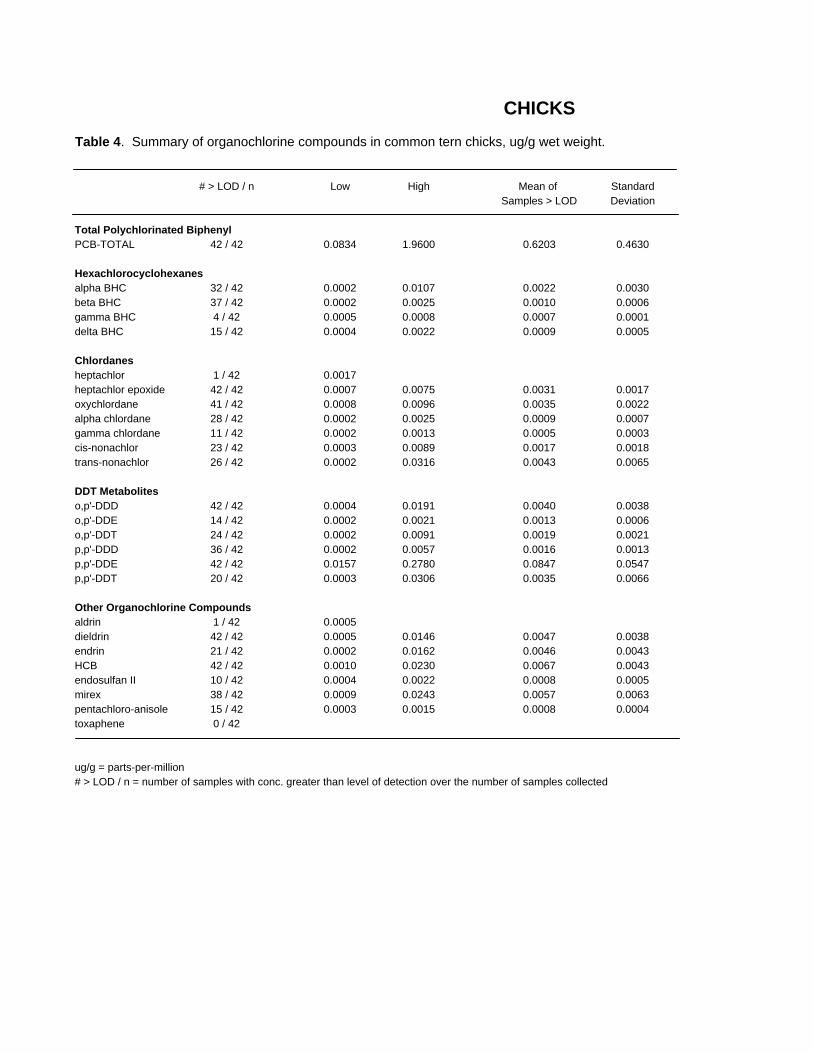
CHICKSTable 4. Summary of organochlorine compounds in common tern chicks, ug/g wet weight.
# > LOD / n Low High Mean of StandardSamples > LOD Deviation
Total Polychlorinated BiphenylPCB-TOTAL 42 / 42 0.0834 1.9600 0.6203 0.4630
Hexachlorocyclohexanesalpha BHC 32 / 42 0.0002 0.0107 0.0022 0.0030beta BHC 37 / 42 0.0002 0.0025 0.0010 0.0006gamma BHC 4 / 42 0.0005 0.0008 0.0007 0.0001delta BHC 15 / 42 0.0004 0.0022 0.0009 0.0005
Chlordanesheptachlor 1 / 42 0.0017heptachlor epoxide 42 / 42 0.0007 0.0075 0.0031 0.0017oxychlordane 41 / 42 0.0008 0.0096 0.0035 0.0022alpha chlordane 28 / 42 0.0002 0.0025 0.0009 0.0007gamma chlordane 11 / 42 0.0002 0.0013 0.0005 0.0003cis-nonachlor 23 / 42 0.0003 0.0089 0.0017 0.0018trans-nonachlor 26 / 42 0.0002 0.0316 0.0043 0.0065
DDT Metaboliteso,p'-DDD 42 / 42 0.0004 0.0191 0.0040 0.0038o,p'-DDE 14 / 42 0.0002 0.0021 0.0013 0.0006o,p'-DDT 24 / 42 0.0002 0.0091 0.0019 0.0021p,p'-DDD 36 / 42 0.0002 0.0057 0.0016 0.0013p,p'-DDE 42 / 42 0.0157 0.2780 0.0847 0.0547p,p'-DDT 20 / 42 0.0003 0.0306 0.0035 0.0066
Other Organochlorine Compoundsaldrin 1 / 42 0.0005dieldrin 42 / 42 0.0005 0.0146 0.0047 0.0038endrin 21 / 42 0.0002 0.0162 0.0046 0.0043HCB 42 / 42 0.0010 0.0230 0.0067 0.0043endosulfan II 10 / 42 0.0004 0.0022 0.0008 0.0005mirex 38 / 42 0.0009 0.0243 0.0057 0.0063pentachloro-anisole 15 / 42 0.0003 0.0015 0.0008 0.0004toxaphene 0 / 42
ug/g = parts-per-million# > LOD / n = number of samples with conc. greater than level of detection over the number of samples collected

EGGSTable 5. Dioxin toxic equivalents (TCDD-TEQ) in composite samples of COTE eggs, pg/g fresh wet weight
TEF Stratton Island Pond Island Petit Manan IslandTEQ TEQ TEQ
Dioxins2,3,7,8-TCDD 1 < 6.94 < 6.58 < 6.851,2,3,7,8-PeCDD 1 < 34.7 < 32.9 < 34.21,2,3,4,7,8-HxCDD 0.05 < 34.7 < 32.9 < 34.21,2,3,6,7,8-HxCDD 0.01 < 34.7 < 32.9 < 34.21,2,3,7,8,9-HxCDD 0.1 < 34.7 < 32.9 < 34.21,2,3,4,6,7,8-HpCDD < 0.001 < 34.7 < 32.9 < 34.2OCDD 0.0001 < 69.4 < 65.8 < 68.5
Furans2,3,7,8-TCDF 1 < 6.94 < 6.58 < 6.851,2,3,7,8-PeCDF 0.1 < 34.7 < 32.9 < 34.22,3,4,7,8-PeCDF 1 < 34.7 < 32.9 < 34.21,2,3,4,7,8-HxCDF 0.1 < 34.7 < 32.9 < 34.21,2,3,6,7,8-HxCDF 0.1 < 34.7 < 32.9 < 34.21,2,3,7,8,9-HxCDF 0.1 < 34.7 < 32.9 < 34.22,3,4,6,7,8-HxCDF 0.1 < 34.7 < 32.9 < 34.21,2,3,4,6,7,8-HpCDF 0.01 < 34.7 < 32.9 < 34.21,2,3,4,7,8,9-HpCDF 0.01 < 34.7 < 32.9 < 34.2OCDF 0.0001 < 69.4 < 65.8 < 68.5TEQ PCDD/F BDL BDL BDL
Non-ortho PCBsPCB# 77 0.05 61.16 56.7 16.318PCB# 81 0.1 < 164 < 167 < 179PCB# 126 0.1 < 164 < 167 < 179PCB# 169 0.001 < 164 < 167 < 179
Mono-ortho PCBsPCB# 105 0.0001 1.3288 0.909 0.37966PCB# 114 0.0001 < 164 < 167 < 179PCB# 118 0.00001 0.594 0.3528 0.10824PCB# 149/123 0.00001 0.1012 0.0261 0.015744PCB# 156 0.0001 1.3288 1.116 0.1886PCB# 157/173/201 0.0001 0.36168 0.2232 0.033538PCB# 167 0.00001 0.080608 0.05967 0.01066PCB# 189 0.00001 0.0082104 0.007317 < 179
TEQ Total (PCDD/Fs + Planar PCBs) 65 59 17
One 3-egg composite sample per islandpg/g = picograms per gram, parts-per-trillionTEFs = toxic equivalency factors from Van den Berg et al . 1998
BDL = below detection limit. Values preceded by < indicate non-detects and sample detection limit. These congenerswere not adjusted to fww or adjusted with TEF or included in the TEQ calculations.
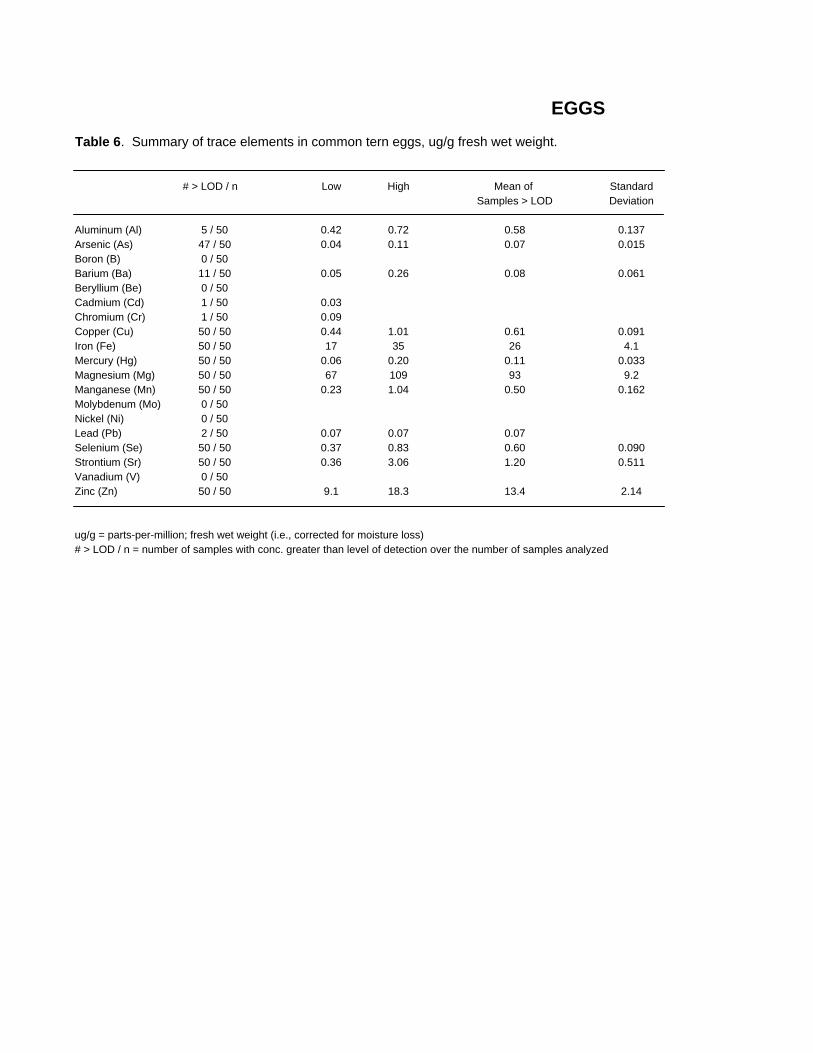
EGGSTable 6. Summary of trace elements in common tern eggs, ug/g fresh wet weight.
# > LOD / n Low High Mean of StandardSamples > LOD Deviation
Aluminum (Al) 5 / 50 0.42 0.72 0.58 0.137Arsenic (As) 47 / 50 0.04 0.11 0.07 0.015Boron (B) 0 / 50Barium (Ba) 11 / 50 0.05 0.26 0.08 0.061Beryllium (Be) 0 / 50Cadmium (Cd) 1 / 50 0.03Chromium (Cr) 1 / 50 0.09Copper (Cu) 50 / 50 0.44 1.01 0.61 0.091Iron (Fe) 50 / 50 17 35 26 4.1Mercury (Hg) 50 / 50 0.06 0.20 0.11 0.033Magnesium (Mg) 50 / 50 67 109 93 9.2Manganese (Mn) 50 / 50 0.23 1.04 0.50 0.162Molybdenum (Mo) 0 / 50Nickel (Ni) 0 / 50Lead (Pb) 2 / 50 0.07 0.07 0.07Selenium (Se) 50 / 50 0.37 0.83 0.60 0.090Strontium (Sr) 50 / 50 0.36 3.06 1.20 0.511Vanadium (V) 0 / 50Zinc (Zn) 50 / 50 9.1 18.3 13.4 2.14
ug/g = parts-per-million; fresh wet weight (i.e., corrected for moisture loss)# > LOD / n = number of samples with conc. greater than level of detection over the number of samples analyzed

CHICKS
Table 7. Summary of trace elements in common tern chicks, ug/g wet weight
# > LOD / n Low High Mean of StandardSamples > LOD Deviation
Aluminum (Al) 35 / 42 0.50 65.40 5.42 13.094Arsenic (As) 40 / 42 0.06 0.58 0.17 0.091Boron (B) 5 / 42 0.50 0.70 0.58 0.084Barium (Ba) 29 / 42 0.05 0.19 0.09 0.025Beryllium (Be) 0 / 42Cadmium (Cd) 11 / 42 0.02 0.13 0.05 0.031Chromium (Cr) 8 / 42 0.10 1.20 0.31 0.360Copper (Cu) 42 / 42 0.78 20.3 1.69 2.955Iron (Fe) 42 / 42 26 264 52 40.5Mercury (Hg) 42 / 42 0.06 0.38 0.16 0.066Magnesium (Mg) 42 / 42 165 354 249 46.3Manganese (Mn) 42 / 42 0.40 3.30 1.11 0.479Molybdenum (Mo) 0 / 42Nickel (Ni) 1 / 42 0.20Lead (Pb) 8 / 42 0.05 0.46 0.12 0.141Selenium (Se) 42 / 42 0.42 0.99 0.63 0.125Strontium (Sr) 42 / 42 1.90 13.70 5.64 2.288Vanadium (V) 1 / 42 0.10Zinc (Zn) 42 / 42 16.0 37.4 23.8 5.55
ug/g = parts-per-million# > LOD / n = number of samples with conc. greater than level of detection over the number of samples collected

APPENDIX FIGURES
Figure A-1. Organochlorine mass (µg) by island and sample type Figure A-2. Trace element mass (µg) by island and sample type

Mass of Total PCBs (ug) in Common Terns by Island and Sample Type
Island and Sample Type
STR-Egg
STR-Chick
JEN-Egg
JEN-Chick
PND-Egg
PND-Chick
EER-Egg
EER-Chick
PMI-Egg
PMI-Chick
ug T
otal
PC
Bs
0.1
1
10
100
Egg Chick
Circles indicate meanWhiskers indicate standard deviation
Mass of p,p'-DDE (ug) in Common Terns by Island and Sample Type
Island and Sample Type
STR-Egg
STR-Chick
JEN-Egg
JEN-Chick
PND-Egg
PND-Chick
EER-Egg
EER-Chick
PMI-Egg
PMI-Chick
ug p
,p'-D
DE
0.01
0.1
1
10
Egg Chick
Circles indicate meanWhiskers indicate standard deviation
Figure A-1. Organochlorine mass (ug) by Island and Sample Type
Contaminant mass (ug) = conc. (ug/g ww) * mass of sample (g).
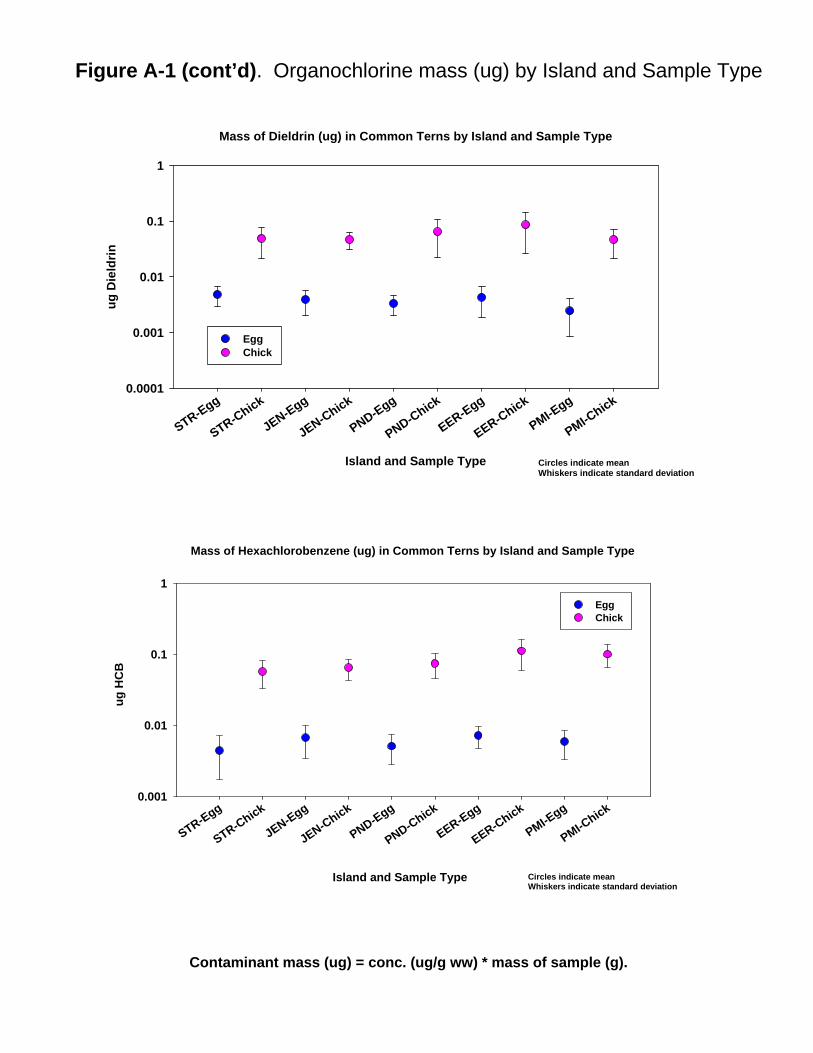
Mass of Dieldrin (ug) in Common Terns by Island and Sample Type
Island and Sample Type
STR-Egg
STR-Chick
JEN-Egg
JEN-Chick
PND-Egg
PND-Chick
EER-Egg
EER-Chick
PMI-Egg
PMI-Chick
ug D
ield
rin
0.0001
0.001
0.01
0.1
1
Egg Chick
Circles indicate meanWhiskers indicate standard deviation
Mass of Hexachlorobenzene (ug) in Common Terns by Island and Sample Type
Island and Sample Type
STR-Egg
STR-Chick
JEN-Egg
JEN-Chick
PND-Egg
PND-Chick
EER-Egg
EER-Chick
PMI-Egg
PMI-Chick
ug H
CB
0.001
0.01
0.1
1
Egg Chick
Circles indicate meanWhiskers indicate standard deviation
Figure A-1 (cont’d). Organochlorine mass (ug) by Island and Sample Type
Contaminant mass (ug) = conc. (ug/g ww) * mass of sample (g).
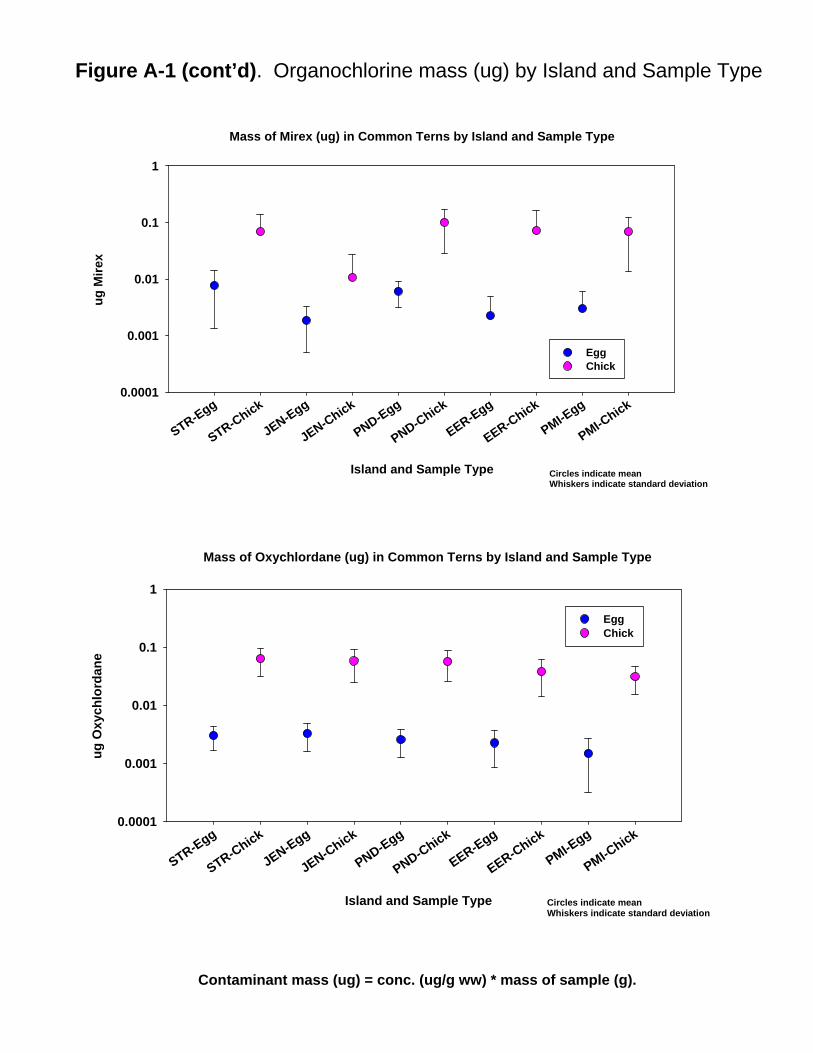
Mass of Mirex (ug) in Common Terns by Island and Sample Type
Island and Sample Type
STR-Egg
STR-Chick
JEN-Egg
JEN-Chick
PND-Egg
PND-Chick
EER-Egg
EER-Chick
PMI-Egg
PMI-Chick
ug M
irex
0.0001
0.001
0.01
0.1
1
Egg Chick
Circles indicate meanWhiskers indicate standard deviation
Mass of Oxychlordane (ug) in Common Terns by Island and Sample Type
Island and Sample Type
STR-Egg
STR-Chick
JEN-Egg
JEN-Chick
PND-Egg
PND-Chick
EER-Egg
EER-Chick
PMI-Egg
PMI-Chick
ug O
xych
lord
ane
0.0001
0.001
0.01
0.1
1
Egg Chick
Circles indicate meanWhiskers indicate standard deviation
Figure A-1 (cont’d). Organochlorine mass (ug) by Island and Sample Type
Contaminant mass (ug) = conc. (ug/g ww) * mass of sample (g).

Figure A-2. Trace element mass (ug) by sample type and island.
Contaminant mass (ug) = conc. (ug/g ww) * mass of sample (g).
Mass of Arsenic (ug) in Common Terns by Island and Sample Type
Island and Sample Type
STR-Egg
STR-Chick
JEN-Egg
JEN-Chick
PND-Egg
PND-Chick
EER-Egg
EER-Chick
PMI-Egg
PMI-Chick
ug A
rsen
ic
0.01
0.1
1
10
100
Egg Chick
Circles indicate meanWhiskers indicate standard deviation
Mass of Copper (ug) in Common Terns by Island and Sample Type
Island and Sample Type
STR-Egg
STR-Chick
JEN-Egg
JEN-Chick
PND-Egg
PND-Chick
EER-Egg
EER-Chick
PMI-Egg
PMI-Chick
ug C
oppe
r
0
10
20
30
40
50
60
70
80
Egg Chick
Circles indicate meanWhiskers indicated standard deviation

Figure A-2 (cont’d). Trace element mass (ug) by sample type and island.
Contaminant mass (ug) = conc. (ug/g ww) * mass of sample (g).
Mass of Mercury (ug) in Common Terns by Island and Sample Type
Island and Sample Type
STR-Egg
STR-Chick
JEN-Egg
JEN-Chick
PND-Egg
PND-Chick
EER-Egg
EER-Chick
PMI-Egg
PMI-Chick
ug M
ercu
ry
0.5
1.0
1.5
2.0
2.5
3.0
3.5
4.0
4.5
Egg Chick
Circles indicate meanWhiskers indicate standard deviation
Mass of Selenium (ug) in Common Terns by Island and Sample Type
Island and Sample Type
STR-Egg
STR-Chick
JEN-Egg
JEN-Chick
PND-Egg
PND-Chick
EER-Egg
EER-Chick
PMI-Egg
PMI-Chick
ug S
elen
ium
2
4
6
8
10
12
14
16
18
20
Egg Chick
Circles indicate meanWhiskers indicate standard deviation
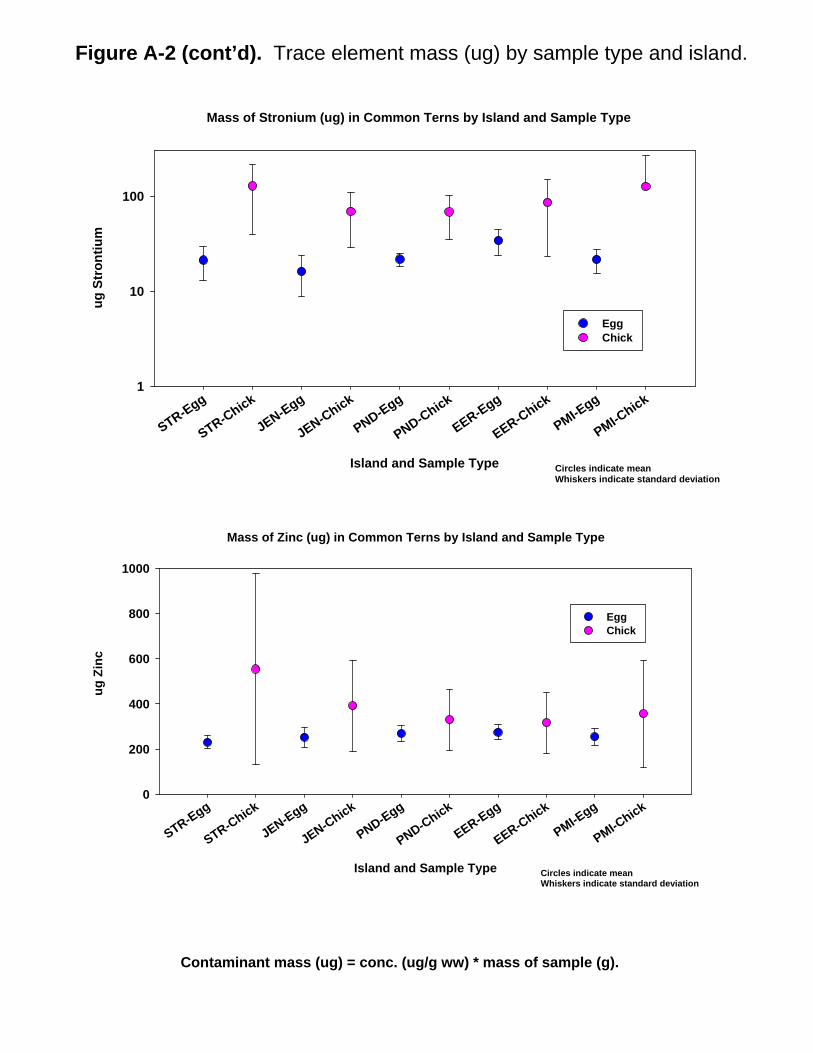
Figure A-2 (cont’d). Trace element mass (ug) by sample type and island.
Contaminant mass (ug) = conc. (ug/g ww) * mass of sample (g).
Mass of Stronium (ug) in Common Terns by Island and Sample Type
Island and Sample Type
STR-Egg
STR-Chick
JEN-Egg
JEN-Chick
PND-Egg
PND-Chick
EER-Egg
EER-Chick
PMI-Egg
PMI-Chick
ug S
tron
tium
1
10
100
Egg Chick
Circles indicate meanWhiskers indicate standard deviation
Mass of Zinc (ug) in Common Terns by Island and Sample Type
Island and Sample Type
STR-Egg
STR-Chick
JEN-Egg
JEN-Chick
PND-Egg
PND-Chick
EER-Egg
EER-Chick
PMI-Egg
PMI-Chick
ug Z
inc
0
200
400
600
800
1000
Egg Chick
Circles indicate meanWhiskers indicate standard deviation