containerised freight specialisation at the port … freight specialisation at the port of bell bay:...
TRANSCRIPT

Containerised Freight Specialisation
at the Port of Bell Bay: A Cost-Benefit Analysis
September 2012
MMC LINK | LEVEL 6 111 MACQUARIE STREET HOBART TAS 7000 | PHONE 03 6108 9038

i | P a g e
About Us
The MMC Link team specialises in providing economic and social research, strategic planning and continuous improvement support. Our service profile includes industry, government, and the not-for-profit sector.
Full Name: MMC Link Pty Ltd
ABN: 58 137 685 020
Mailing Address Level 6 Reserve Bank Building
111 Macquarie Street
Hobart Tasmania 7000
Telephone: (03) 6108 9038 or 0414 845 024
Email: [email protected]
Website: http://link.edu.au

ii | P a g e
Executive Summary In their 2008 submission to the national infrastructure audit, the Tasmanian government outlined the following plan for port specialisation:
• Bell Bay to become the state’s major international container and Bass Strait roll-on/roll-off general container port;
• Burnie to become the major bulk commodity port; • Devonport to become a multi-user port, with a focus on passenger ferry services; and, • Hobart to be the centre for cruise ships, Antarctic and naval vessel visits (Tasmanian
Government, 2008).
Since that time, however, ‘market forces’ and a lack of access to capital have conspired to frustrate the realisation of this vision. Although a degree of port specialisation has been achieved, Bell Bay no longer ships containers at all, and public funds continue to be diverted to Burnie’s container operations to crisis manage the commercial operator’s explosive growth.
It is recognised that competing interests in the community have a number of divergent views on whether the Port of Bell Bay should remain the preferred destination for general containerised freight in the state. We propose that this conundrum should be considered exclusively from the perspective of the welfare of all Tasmanians. Ultimately we find that every day the Port of Bell Bay lies dormant comes at the following economic costs to the community:
• Expansion at some point in the future somewhere in the northern port system is required to avoid constraining overall container movements and statewide economic growth, and the dormant land and infrastructure at Bell Bay is the most efficient, effective and strategically sustainable solution available;
• The majority of producers are presently disadvantaged by higher freight costs consequent to the closure of Bell Bay’s container terminals, which equates to a net reduction in government revenue over time; and
• In the absence of a viable alternative such as Bell Bay, the government is committed to maintaining the congested and decaying container infrastructure at the Ports of Burnie and Devonport, effectively relieving the commercial operators of any incentive in this regard.
Using the best practice principles of cost-benefit analysis, we further demonstrate that:
• The net present value of the Bell Bay proposal is positive (Benefit / Cost Ratio (BCR) greater than 1) at the social discount rate of 3.5 per cent, but not higher discount rates. Therefore a public, rather than private, investment approach is required. This supports a request for Australian Government funding.
• The net present value is only positive where there is a relative low marginal operating cost or relative high operating earnings as a proportion of revenue. This would indicate that TasPorts must seek opportunities for efficiency, including specialisation, to reduce operating costs and pay close attention to forecast operating costs in the final investment analysis.

1 | P a g e
Contents About Us .................................................................................................................................................. i
Executive Summary ................................................................................................................................. ii
Contents .................................................................................................................................................. 1
Introduction ............................................................................................................................................ 2
Scope ................................................................................................................................................... 4
Tasmania’s Ports ..................................................................................................................................... 5
Bell Bay ................................................................................................................................................ 6
Burnie .................................................................................................................................................. 7
Devonport ........................................................................................................................................... 9
Hobart ............................................................................................................................................... 10
Growth forecasts................................................................................................................................... 11
Conclusion ......................................................................................................................................... 13
Implications ........................................................................................................................................... 14
Potential economic loss with no major port investment after 2020 ................................................ 14
Port of Bell Bay – Feasibility .................................................................................................................. 16
Net Present Value and Benefit Cost Ratio Analysis .......................................................................... 17
Investment timing ................................................................................................................................. 21
Conclusion ............................................................................................................................................. 24
Appendix 1 – Cost Benefit Analysis ....................................................................................................... 26
Appendix 2 – About the Authors .......................................................................................................... 30
Dr Bruce Felmingham ....................................................................................................................... 30
Paul Muller ........................................................................................................................................ 30
Ian McMahon .................................................................................................................................... 30
Glossary ................................................................................................................................................. 31
References ............................................................................................................................................ 32

2 | P a g e
Introduction Port cities have historically enjoyed an economic advantage, given their ability to connect remote forelands through maritime transport, as Adam Smith (1776) points out in the cases of London and Calcutta (Lee, Song, & Ducreut, 2008). Tasmania has four major port cities – Burnie, Devonport, Launceston (Bell Bay) and Hobart – that have been central to the development of the island’s economy.
Until 2006, these ports enjoyed separate ownership and engaged in robust competition for market share. As a consequence, each independently developed infrastructure to support the various modes of maritime freight transport; including, passenger, vehicular, bulk and containerised task support. The fragmentation of such a small producer market across four major providers, and the relative cost burden of infrastructure maintenance and renewal, has however proven to be unsustainable in the global shipping environment. Therefore the challenge is now posed – is this inherited legacy of duplicate infrastructure the most effective use of state resources?
Since its promulgation in 2006, the State owned Tasmanian Ports Corporation (TasPorts) has wrestled with this dilemma (TasPorts, 2006). In assuming ownership of all the state’s major ports, it recognises that to maintain industry competitiveness the state’s export infrastructure is required to be reliable, retain capacity for growth, have frequent shipping services, and maintain efficient port and intermodal infrastructure. It is widely accepted that the current infrastructure has constraints, and projected increases in freight over the next 20 years suggest that it will have difficulty in meeting industry requirements (GHD, 2010b).
In their 2008 submission to the national infrastructure audit, the Tasmanian government outlined the following plan for port specialisation:
• Bell Bay to become the state’s major international container and Bass Strait roll-on/roll-off general container port;
• Burnie to become the major bulk commodity port; • Devonport to become a multi-user port, with a focus on passenger ferry services; and, • Hobart to be the centre for cruise ships, Antarctic and naval vessel visits (Tasmanian
Government, 2008).
Since that time, however, ‘market forces’ and a lack of access to capital have conspired to frustrate the realisation of this vision. Although a degree of port specialisation has been achieved, Bell Bay no longer ships containers at all, and public funds continue to be diverted to Burnie’s container operations to crisis manage the commercial operator’s explosive growth.
This has frustrated a significant number of Tasmanian producers who have positioned their businesses geographically and strategically on the assumptions of the 2008 plan. Although the government and Tasports continue to advocate this policy objective (Legislative Council, 2011; Weedon, 2011), there appears to be little action on their part in this regard beyond reliance upon a capital funding submission to the federal body Infrastructure Australia. This capital funding submission has been passed over for three years in succession, and now appears less likely than ever to succeed (Deegan, 2012).

3 | P a g e
In resiling from an immediate commitment to motivate port specialisation, the State Government refers to an as yet unmet capacity “tipping point” as the trigger for change (Legislative Council, 2011). When might this tipping point therefore occur? And at what point are the costs of change at their lowest?
The other governing question of this report is whether container specialisation should proceed at Bell Bay at all, given its present operational abandonment. The imperative of ‘market forces’ has been frequently cited as the motivator for this closure; yet, does the market power of operators (freight and logistic companies) unfairly distort the disaggregated influence of port customers (Tasmanian manufacturers and producers)? In other words, is the market truly unbiased in de-selecting Bell Bay as a container port?
This report has been independently prepared by MMC Link to respond to these important yet hereto inconclusively answered questions in the current ports debate. It is recognised that competing interests in the community have a number of divergent views on these questions. We propose that these questions should be considered exclusively from the perspective of the welfare of all Tasmanians.
There is strong demand for evidenced based decision making, and better data and analytical systems to support decision making about ports and freight logistics infrastructure in Tasmania (Spence, 2011). In this report, we consider all the publically available data and the viewpoints of affected stakeholders, and apply an objective analytic process to what has hereto been highly politicised debate. We are confident that points of subjective difference can be rationally resolved and a commitment made to a clear path to action.

4 | P a g e
Scope This report has been commissioned by the Northern Tasmania Development Board. It undertakes an analysis of the business case for the reactivation and expansion of the Port of Bell Bay using the best-practice principles of cost benefit analysis (see Appendix 1). In doing so, it frames its research from the perspective of the whole Tasmanian economy, and the collective welfare of all Tasmanians. It assumes that for the project to proceed, the discounted benefits of the project should be greater than the costs, and that the net benefits of the project should be greater than those offered by the alternatives (in this case, an equivalent expenditure on other Tasmanian ports).
It specifically references the historical, current and future potential for containerised cargo trade to and from Tasmania. Although we are mindful of the parallel bulk cargo trade, this is not directly assessed. We nevertheless assume that the investment stipulated will relieve systemic capacity constraints and substantially improve the movement of cargo at each identified port alternative.
The method used in the study involved the integration of:
• Academic literature reviews; • Reviews of relevant reports produced by third parties; • Media scanning, interpretation and analysis; • Consultation with over 30 relevant stakeholders to explore/confirm issues, including:
o Port owners o Shipping operators o Importers o Exporters o Academics o Government agencies o Industry groups
• Trade and freight flow data collected by the Tasmanian Ports Corporation Pty Ltd (TasPorts), the Bureau of Transport and Regional Economics (BTRE), and the Australian Bureau of Statistics (ABS); and
• The collective experience and expertise of the MMC Link team of social, business and economic analysts.
Nomenclature
Airports are out of the scope of consideration for this report. Therefore references to ports should be understood to explicitly refer to sea ports, unless otherwise indicated.
Similarly, the term export is literally used here to mean ex- (or out of) the nominated port. It should not be confused with the general use of the term export to refer to international trade. Given our Tasmanian focus, the exports referred to in this report do not distinguish between the inter-state and international movements of goods, unless specified.

5 | P a g e
Tasmania’s Ports Ports, as they are described in this report, are interfaces between the sea and land where goods are transferred to and from ships. As indicated in the figure here (TasPorts, 2012a), there are 12 major ports in Tasmania, four of which (Bell Bay, Burnie, Devonport and Hobart) are commercially significant.
There are a number of ways of examining ports issues. One possibility is to take a legal view, and consider only the port authorities (eg TasPorts). Another approach would be to consider ‘port precincts’, which may include matters which are not in the direct control of the port authority, such as terminal operators, haulage companies and their assets.
Our preferred approach is to take a functional view and consider all matters related to activities conducted at ports, even if those matters occur beyond the port precinct. This mirrors the approach of the National Ports Strategy which is currently being developed by the Council of Australian Governments (COAG) (Infrastructure Australia and the National Transport Commission, 2010).
The functional view recognises the complexity of port operations. On the sea-side, a port needs to have safe marine access channels, sea anchorage areas outside the port, pilots and tugs to safely navigate the ships to and from the quayside, and procedures to minimise any possible damage to the marine environment (Infrastructure Australia and the National Transport Commission, 2010).
Once the ships are moored, formal arrival procedures are carried out by customs, quarantine and ship-safety authorities to ensure that both the crew and goods comply with all protective regulations (Infrastructure Australia and the National Transport Commission, 2010).
Equipment is then used to transfer goods to and from ships. A port therefore needs to have precinct land and a series of physical assets, technologies, people processes and supporting activities that are all ultimately perishable. While in port, ships also have to be serviced with fuel, food, water, waste disposal and possible light maintenance and crew changes. Tasmania’s port precincts are then serviced by truck and train handling facilities which connect at the port gate to the inland rail and (shared) road network (Infrastructure Australia and the National Transport Commission, 2010).
Because the relevant assets are operated by different parties – both commercial and government owned – efficient port performance relies on a high level of cooperation, much of which is based on commercial contracts (Infrastructure Australia and the National Transport Commission, 2010).
Figure 1 – Tasmania’s Major Ports

6 | P a g e
As an island economy, the productivity, living standards and quality of life of all Tasmanians depends on its trade performance, which in turn depends on its maritime capability. Indeed, exports outweigh imports by a factor of about two to one, and all but one per cent of the state’s import / export freight task is moved through its ocean ports (TasPorts, 2012a). The ports and freight infrastructure are therefore of the utmost social and economic importance to the state.
Before considering that, and the questions that might flow from that point, it would be useful to detail the circumstances of the four major ports in Tasmania.
Bell Bay Located at Bell Bay on the eastern bank of the Tamar River, 48 kilometres north of Launceston, the port is adjacent to a major Tasmanian industrial estate. The Port of Bell Bay is a pivotal intermodal hub for domestic and international bulk goods, as well as (until recently) container services (TasPorts, 2012b).
The Bell Bay industrial estate is Tasmania’s most industrialised region, and home to some of the state’s most important industries; including: TEMCO BHP Billiton, RIO Tinto Alcan, Gunns Timber Productions, Artec, ECKA Granules Australia and the Tamar Valley power station. In 2010, the estate directly employed 3,498 full time equivalent staff, and accounted for 58% of the state’s manufacturing industry and 35% of Tasmania’s total exports (Felmingham, 2011).
The Port of Bell Bay is seen by many as the venue best placed to manage growth. It has sufficient nearby industrial land, good road and rail connections, a natural deep water harbour, and no nearby development. Yet it is not without constraint. The rail loading facilities, for example, are located on the main berth hardstand and are congested, with restrictions on rail operations when ships are being unloaded. Rail access to Berth 2 does not pass underneath the on-dock crane and train wagons interfere with road movements. At Berth 5, there is no under-crane access for the rail network and freight trains interfere with other port movements when trains are loaded and unloaded. Currently, the on-dock rail access is limited to trains of 300m in length. The connection to the main Tasmanian rail network is poor, with a steep grade out of the port limiting train capacity (Engineers Australia, 2010).
The port and its associated industrial base have also suffered from the loss of both international and domestic container services in the last couple of years. For a number of years, Bell Bay was a port of call on AAA Shipping’s international service, the only direct container service to international markets that was available to Tasmanian producers. As the smallest volume port on the route, however, it was frequently (and often unpredictably) overlooked by the carrier, until it ultimately stopped calling in April 2011 (ABC News, 2011b). Furthermore, in 2009, domestic container service
Figure 2 – Port of Bell Bay
7 | P a g e
provider ANL entered into a joint venture with road transport and freight logistics company Toll Holdings, switching operations from Bell Bay to Burnie (McKay, 2009b). Following that, Agility Shipping attempted to revive the Melbourne-Bell Bay container route, but after failing to secure a permanent berth at the Port of Melbourne (Sexton, 2011a), and running vessels that frequently broke down or were arrested by maritime authorities for operational and safety issues (Crisp, 2010; Sexton, 2011b), withdrew from the market within 12 months. Short thereafter, the wharf’s stevedoring contractor similarly withdrew their services (Sexton, 2011c).
These factors have significantly added to the cost impost placed on Tasmanian producers. The loss of an international service demands the transhipment all containerised goods through the Port of Melbourne, or break bulking to ports such as Taiwan for off-shore containerisation (ABC News, 2011a). The loss of domestic container services adds the additional distance to the Ports of Devonport or Burnie to the cost of freighting goods – a cost that is especially keenly felt by agricultural and manufacturing firms in the South of the state (M. Smith, 2012).
Prior to the loss of these services, the port was understood to be operating at near to its container capacity of 150,000 TEUs per annum. Since 2009, an application has been before Infrastructure Australia to upgrade this facility. The proposal recommends two stages: the first – a removal of constraints, including the redevelopment of berths and foreshore reclamation – would increase capacity to 200,000 TEUs by 2020; while the second stage – an inland expansion of the facility – would increase container freight capacity to 400,000 TEUs per annum by 2025 (DIER, 2011).
In 2010/11, the Port of Bell Bay handled 47,690 TEUs, approximately 10% of Tasmania’s containerised freight task (TasPorts, 2011); however, that figure is anticipated to drop to zero in the next reporting period.
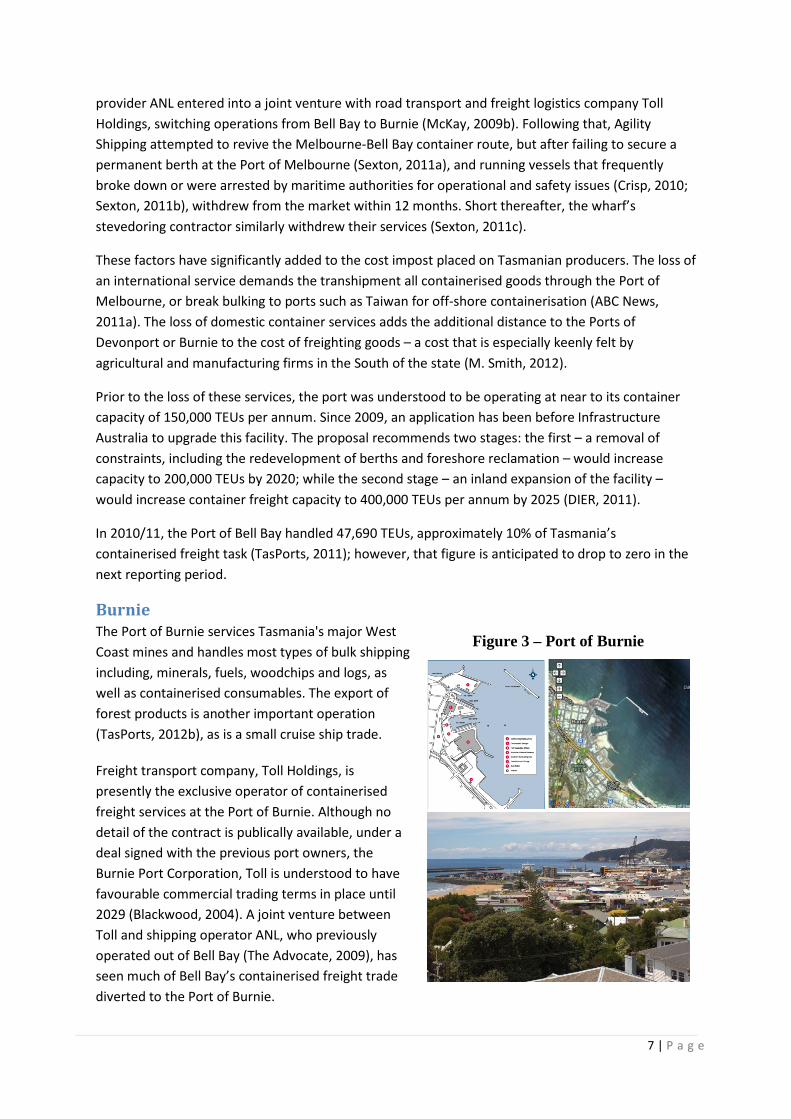
Burnie The Port of Burnie services Tasmania's major West Coast mines and handles most types of bulk shipping including, minerals, fuels, woodchips and logs, as well as containerised consumables. The export of forest products is another important operation (TasPorts, 2012b), as is a small cruise ship trade.
Freight transport company, Toll Holdings, is presently the exclusive operator of containerised freight services at the Port of Burnie. Although no detail of the contract is publically available, under a deal signed with the previous port owners, the Burnie Port Corporation, Toll is understood to have favourable commercial trading terms in place until 2029 (Blackwood, 2004). A joint venture between Toll and shipping operator ANL, who previously operated out of Bell Bay (The Advocate, 2009), has seen much of Bell Bay’s containerised freight trade diverted to the Port of Burnie.
Figure 3 – Port of Burnie

8 | P a g e
This increase in trade volume has placed significant stress on the capacity of the container terminal at the port. As a result, in May 2012 the Port of Burnie received $4 million in federal infrastructure funding to increase its container handling capacity (Sexton, 2012). It is estimated that through this and other proposed expansions, the Port of Burnie will eventually be able to handle up to 350,000 TEUs per annum. Projecting growth at three per cent per annum, however, Burnie is predicted to reach this full capacity again by 2020 (DIER, 2011).
Another outcome of this shift in trade has been an increase in truck movements into and out of the port by as many as 600 containers a week (Shipping Industry News, 2009). Toll has additionally requested Super B-Double trucks (vehicles carrying 8 containers) be allowed on local roads to get containers from the Burnie railyard to their terminal (Legislative Council, 2011).
Improvements are therefore being made to the railyard whereby trains will no longer need to be broken into three sections and queued along the beach in order to disembark containers. What this means for Toll is that they can free space in their own terminal for stacking, while reducing the costly multiple handling of containers. Nevertheless, containers must still be double-handled from the railyard onto trucks and then onto vessels, or triple-handled when stored.
Critically for the current owners of the Port of Burnie, TasPorts, the shift of freight from Bell Bay to Burnie on the terms of the old Burnie Ports Corporation deal has resulted in a significant revenue shortfall that will affect its ability to maintain existing infrastructure (TasPorts, 2009). TasRail, too, was quick to shut down their spur from Launceston to Bell Bay on the grounds that it was no longer financially sustainable, which effectively halted a $9.6 million proposed upgrade; although, they have announced that they will resume the service in September, 2012 (TasRail, 2012).
Growth in capacity beyond that planned for and mentioned above is also significantly constrained by urban encroachment, which significantly limits the port’s capacity to expand its footprint inland. This is especially significant if the production and export of bulk commodities from the state’s resource rich North-West grows according to forecasts (ACIL Tasman, 2009). A significant bottleneck for bulk and containerised freight is foreseeable if alternative capacity for one or both cannot be found.
In 2010/11, the Port of Burnie handled 231,615 TEUs, approximately 50% of Tasmania’s containerised freight task (TasPorts, 2011).

9 | P a g e
Devonport The Port of Devonport straddles the river Mersey in the state’s north-west. The western precinct currently provides dedicated storage and loading facilities for cement export and fuels, and a casual berth for visiting cruise ships. Because it abuts the main CBD, there are limited expansion opportunities (GHD, 2010b).
Rail only runs up the western shore of the port, even though the container berthing facilities are on the opposite, eastern side. Minister for Infrastructure, David O’Byrne has stated that there is insufficient container volume coming in by rail to justify anything more than maintenance expenditure on the existing line (Legislative Council, 2011). Like the western shore, expansion is constrained by urban development and the unavailability of industrial land (GHD, 2010b).
The other main constraint to growth faced by the Port of Devonport is that the narrow diameter of the swing (or turning) basin means that the safe maximum ship length is 205m. Paul Weedon, Chief Executive Officer (CEO) of TasPorts has indicated that it would be prohibitively expensive to widen the channel, and that any such widening would significantly impact on the river ecology. Relocating up-river is also not an option, as the channel shallows from an 8m to a 4m draught in a very short space (Legislative Council, 2011)
SeaRoad (formerly Patricks) and the government owned TT-Line are the dedicated cargo providers at Devonport. SeaRoad currently operates a daily service to the Port of Melbourne via two roll-on-roll-off (RORO) vessels which can handle all types of freight including trailers, mobiles, cars and containers. Containers are handled by a special method using ‘cassettes’ – 40 foot steel pallets that hold four 20 foot containers (SeaRoad Holdings, 2012). Primarily a passenger ferry operator, the two TT-Line vessels also accommodate containers via fixed vehicle transport on a daily Melbourne service.
SeaRoad is presently refreshing its fleet, converting its two 115m ships (the aged Tamar and the Mersey) to two, natural gas powered 185m vessels (Clark, 2012). This will effectively double its container cargo carrying capacity. However, the current dispute over lease, the flagged transition to Bell Bay, and terminal constraints that include limited yard space, outdated technology and constrictive roads behind the berth that discourage land-side expansion, would all appear to reduce the economic incentive for SeaRoad to make the landside investments necessary to fully realise the potential of their fleet upgrade. It should also be noted that RORO is generally regarded to be a less efficient means of container management (Slack, 1999).
Figure 4 – Port of Devonport
10 | P a g e
Bulk commodities handled by the port include wheat grain, cement, fertilizers, and fuels. In 2010/11, the Port of Devonport handled 184,401 TEUs, approximately 40% of Tasmania’s containerised freight task (TasPorts, 2011).
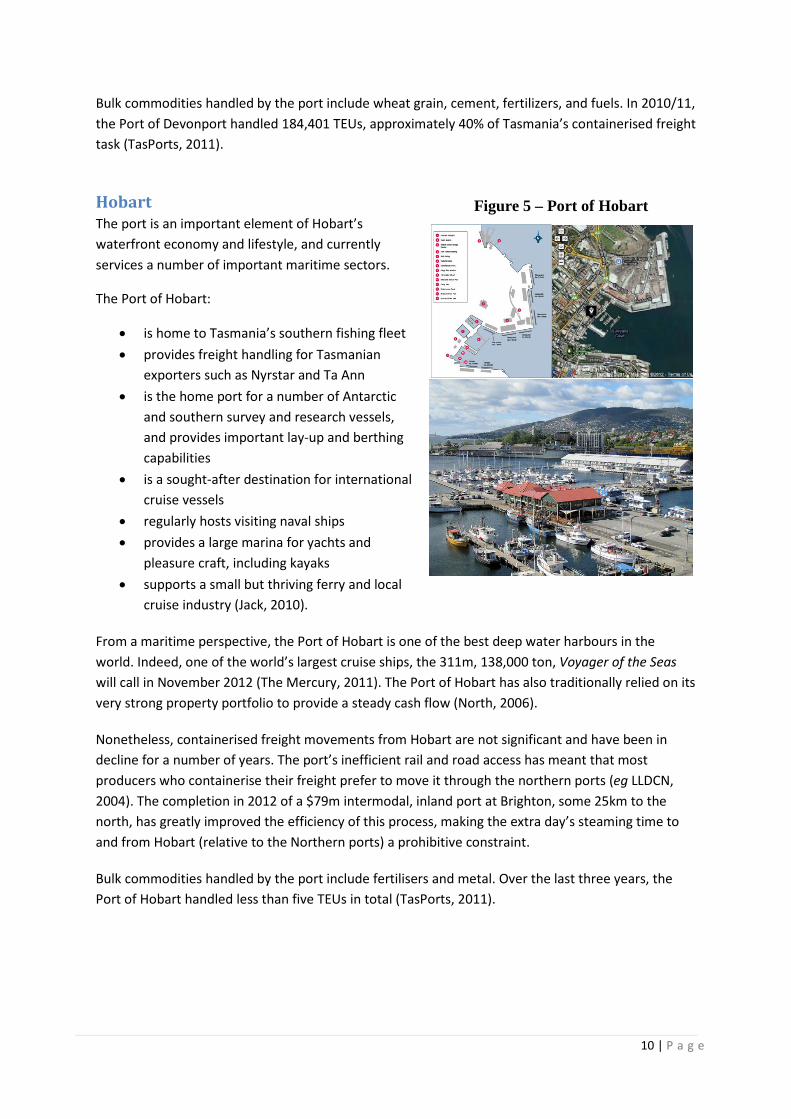
Hobart The port is an important element of Hobart’s waterfront economy and lifestyle, and currently services a number of important maritime sectors.
The Port of Hobart:
• is home to Tasmania’s southern fishing fleet • provides freight handling for Tasmanian
exporters such as Nyrstar and Ta Ann • is the home port for a number of Antarctic
and southern survey and research vessels, and provides important lay-up and berthing capabilities
• is a sought-after destination for international cruise vessels
• regularly hosts visiting naval ships • provides a large marina for yachts and
pleasure craft, including kayaks • supports a small but thriving ferry and local
cruise industry (Jack, 2010).
From a maritime perspective, the Port of Hobart is one of the best deep water harbours in the world. Indeed, one of the world’s largest cruise ships, the 311m, 138,000 ton, Voyager of the Seas will call in November 2012 (The Mercury, 2011). The Port of Hobart has also traditionally relied on its very strong property portfolio to provide a steady cash flow (North, 2006).
Nonetheless, containerised freight movements from Hobart are not significant and have been in decline for a number of years. The port’s inefficient rail and road access has meant that most producers who containerise their freight prefer to move it through the northern ports (eg LLDCN, 2004). The completion in 2012 of a $79m intermodal, inland port at Brighton, some 25km to the north, has greatly improved the efficiency of this process, making the extra day’s steaming time to and from Hobart (relative to the Northern ports) a prohibitive constraint.
Bulk commodities handled by the port include fertilisers and metal. Over the last three years, the Port of Hobart handled less than five TEUs in total (TasPorts, 2011).
Figure 5 – Port of Hobart
11 | P a g e
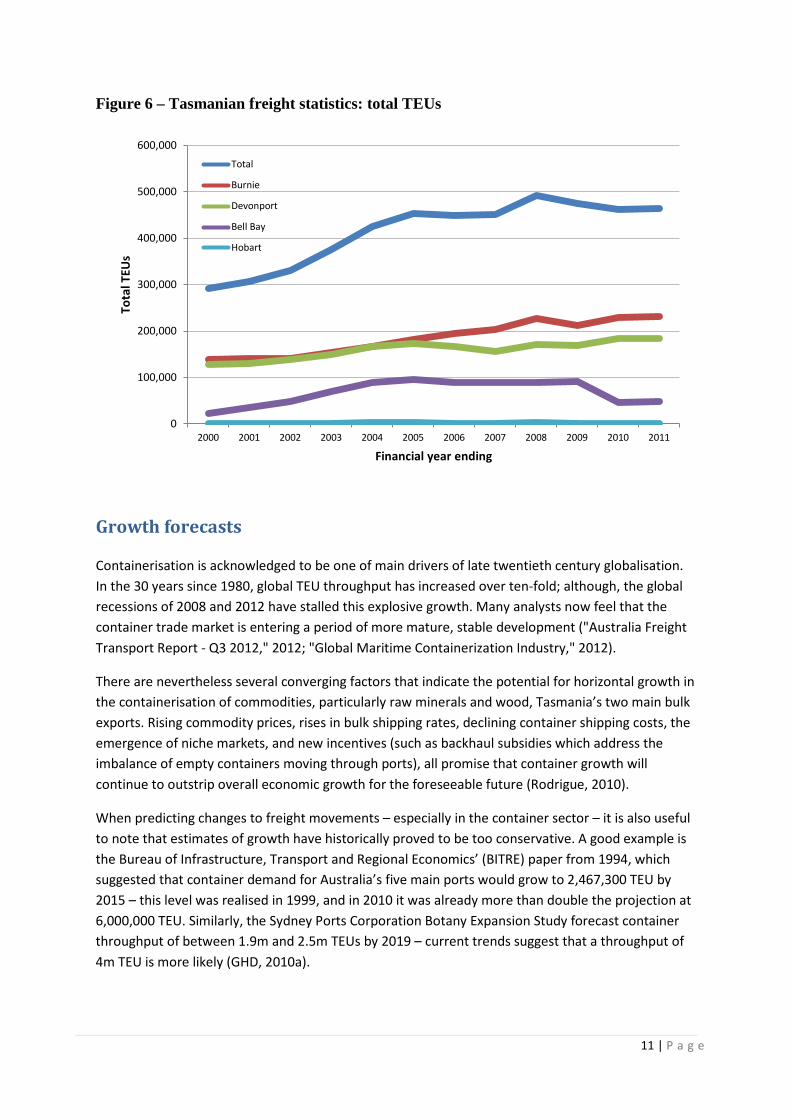
Figure 6 – Tasmanian freight statistics: total TEUs
Growth forecasts
Containerisation is acknowledged to be one of main drivers of late twentieth century globalisation. In the 30 years since 1980, global TEU throughput has increased over ten-fold; although, the global recessions of 2008 and 2012 have stalled this explosive growth. Many analysts now feel that the container trade market is entering a period of more mature, stable development ("Australia Freight Transport Report - Q3 2012," 2012; "Global Maritime Containerization Industry," 2012).
There are nevertheless several converging factors that indicate the potential for horizontal growth in the containerisation of commodities, particularly raw minerals and wood, Tasmania’s two main bulk exports. Rising commodity prices, rises in bulk shipping rates, declining container shipping costs, the emergence of niche markets, and new incentives (such as backhaul subsidies which address the imbalance of empty containers moving through ports), all promise that container growth will continue to outstrip overall economic growth for the foreseeable future (Rodrigue, 2010).
When predicting changes to freight movements – especially in the container sector – it is also useful to note that estimates of growth have historically proved to be too conservative. A good example is the Bureau of Infrastructure, Transport and Regional Economics’ (BITRE) paper from 1994, which suggested that container demand for Australia’s five main ports would grow to 2,467,300 TEU by 2015 – this level was realised in 1999, and in 2010 it was already more than double the projection at 6,000,000 TEU. Similarly, the Sydney Ports Corporation Botany Expansion Study forecast container throughput of between 1.9m and 2.5m TEUs by 2019 – current trends suggest that a throughput of 4m TEU is more likely (GHD, 2010a).
0
100,000
200,000
300,000
400,000
500,000
600,000
2000 2001 2002 2003 2004 2005 2006 2007 2008 2009 2010 2011
Tota
l TEU
s
Financial year ending
Total
Burnie
Devonport
Bell Bay
Hobart

12 | P a g e
Unfortunately, the consequences of errors in forecasting for port planning can be serious, and the consequences of over-estimating and under-estimating are not equal. To over-build may add only a few dollars, at most, per ton of freight cost; however, an under-build may cause congestion leading to additional costs of hundreds of dollars per ton (United Nations, 1985). For that reason, we prefer a realistic as opposed to cautious approach to these estimates.
Under existing conditions Tasmania’s northern ports have a total capacity of 650,000 TEUs (Northern Tasmania Development, 2012). Figure 6 (above) shows that in 2010/11, the state handled just over 460,000 TEUs (TasPorts, 2011), a figure that has plateaued over recent years. Underutilised capacity at Bell Bay and Hobart stands in stark contrast to significantly constrained capacity at Burnie and Devonport. It is also recognised that no single Tasmanian port currently has the capacity to manage the entirety of Tasmania’s containerised freight task.
Population projections performed by the University of Tasmania’s Demographic Analytical Services Unit indicate that significant growth is unlikely over the next 50 years, staying under one per cent per annum (Jackson, 2008). Assuming a similarly unremarkable shift in the domestic consumption profile, this would suggest that our inbound freight demand will remain well under our export task. In other words, given the current imbalance of exports to imports in the state (approximately 2:1 (TasPorts, 2011)), Tasmanian’s are likely to remain net exporters for the foreseeable future.
Tasmania’s State Treasury (2012) most recently predicted that the Tasmanian economy will grow at two percent per annum over the next five years as it slowly rebounds from external pressures such as the high Australian dollar and global financial crisis. In this paper, we adopt that figure of 2.0 per cent as our pessimistic (or low) forecast of container freight growth.
This figure is pessimistic for our purposes, as Treasury also indicates that exports to mainland Australia are likely to be the prime motivator of economic growth in the State for the foreseeable future, off-setting significant reductions in government stimulus and local demand (Tasmanian Government, 2012). A continued long-run business-as-usual approach also recognises that Tasmania’s growth in containerised freight has increased at an average of 5.3 per cent per annum over the last 11 years (TasPorts, 2011). We therefore adopt that figure of 5.3 per cent as our optimistic (or high) forecast of container freight growth in the state.
This figure is likely to be optimistic, however, as container exports have notably stabilised in recent years, thanks to consecutive global financial crises and the market maturity previously cited. Locals have also challenged the assumption that just because Australia’s freight task is doubling every twenty years or less, Tasmania’s will automatically do the same (McGuire, 2009).
Using historical data going back to 1972, the BITRE most recent estimate of the average annual growth rate of inter-coastal shipping freight between Tasmania and Victoria was 3.4 per cent per annum for the period 2008-2030 (BITRE, 2010). This study does not, however, disaggregate containers from bulk freight. Slightly more dated figures have predicted that the container task will increase at around 3.8 percent per year, resulting (from their starting point) in over 800,000 TEU in container movements by 2025 (Tasmanian Government, 2008).

13 | P a g e
A final consideration before settling on a most likely forecast is what the next generation of Tasmanian exports might look like. It is well documented that forestry and, to a lesser extent, manufacturing exports are facing challenging macro-economic circumstances. Significant investments in agriculture through public investment in irrigation infrastructure (Tasmanian Irrigation, 2012), and the notable growth in minerals exploration in the North-West of the state (ACIL Tasman, 2009), are nonetheless likely to supplant and even exceed any losses in these traditional industries.
Conclusion The limitations of this study mean that we have not been able to test the reliability of the forecasts reviewed, or validate their methodology. Even our governing assumption of perpetual growth may be challenged by a rapid destabilising macro-economic environment.
We have also assumed that the state’s logistic infrastructure will keep pace with producer driven growth. Should port and hinterland gateways to export markets prove incapable of handling projected increases in demand, container bottlenecks will inevitably conspire to frustrate these forecasts.
In this report, we forecast that Tasmanian containerised freight is most likely to grow 3.5 per cent per annum over the next 13 years. Under that scenario, Tasmania can expect to throughput 750,000 TEUs of containerised freight in 2025. Comparisons with optimistic and pessimistic growth forecasts are shown in Figure 7.
Figure 7 – Forecast growth in Tasmanian freight: total TEUs
0.46
0.56
0.66
0.76
0.86
0.96
2011 2012 2013 2014 2015 2016 2017 2018 2019 2020 2021 2022 2023 2024 2025
TEU
s (M
illio
ns)
5.3% growth (high)
3.5% growth (likely)
2.0% growth (low)

14 | P a g e
Implications
Potential economic loss with no major port investment after 2020 Figure 8 below shows the forecast capacity utilisation of Tasmanian Ports. The forecast is based on the medium forecast of Tasmania-wide TEU demand growth of 3.5 per cent. It is assumed that recently announced investment in Burnie brings capacity at that port of 350,000 TEUs per annum. Further, it is assumed that due to the current commercial advantage, demand growth at Burnie and Devonport grows at 5 per cent per annum until capacity is constrained. Residual demand is transferred to a re-activated Bell Bay.
It can be seen that in the short-run, due to growth at Burnie and Devonport, growth at Bell Bay is substantially constrained and may continue to decline in the short-run. However, it can also be seen that due to capacity constraints at Devonport and then Burnie, growth may pick-up in the latter part of the decade, and the overall system reach capacity around 2023. Without a substantial investment in new capacity at that time, Tasmanian shipping, and the economic activity it enables, will be substantially constrained.
The potential economic loss to Tasmania associated with this constrained capacity can be estimated using TRIOM, the Tasmanian Regional Input Output Matrix model.
Figure 8 – Tasmanian port capacity forecasts (with capacity constraints)
0
50
100
150
200
250
300
350
400
2011
2012
2013
2014
2015
2016
2017
2018
2019
2020
2021
2022
2023
2024
2025
2026
2027
2028
2029
2030
2031
2032
2033
2034
2035
TEU
'000
Burnie 350000
D'Port 200000
Bell Bay 150000
Economic Loss

15 | P a g e
Figure 9 shows the potential economic impact of the capacity restriction identified in Figure 8. Using TRIOM and estimating the demand impact of exports on the Tasmanian economy, it can be seen that there is a substantial potential impact of a restriction on Tasmania, including by 2034, over 10,000 jobs and $1 billion in lost GSP.
The Economic Loss of TEUs identified in Figure 8 is the difference between demand growth at 3.5 per cent per annum and the identified capacity. Without the increase in capacity, the economic activity enabled by the container trade would be lost.
The value of domestic container trade is difficult to estimate with accuracy, and in any event is a conjecture on the shape of container trade more than a decade into the future. Data collected for the Freight Equalisation Scheme, which is dominated by container trade, provides an indication of the potential value of trade that could be lost.
The estimates in Figure 9 are based on the forecast TEU constraint each year. The input-output approach is based on an equilibrium whereby the economy is demand constrained with excess output capacity. The approach therefore measures the potential value of the increase in the output gap associated with a loss of export capacity. It is in strong contrast with computerised general equilibrium (CGE) approaches whereby output capacity adjusts to equilibrium. In the Tasmanian case a CGE approach would likely indicate that the output gap will lead to a loss of population and effectively disappear.
Figure 9 – Potential economic cost of container capacity constraint
0
100
200
300
400
500
600
0
2,000
4,000
6,000
8,000
10,000
12,000
14,000
16,000
18,000
20,000
TEU
'000
Empl
oym
ent,
$ m
illio
n G
SP, D
eman
d, O
utpu
t
Total Demand
Output Impact
GSP Impact
Employment Impact
Constrained/Lost TEUs

16 | P a g e
Port of Bell Bay – Feasibility In the protracted absence of any container service to and from Bell Bay, many in the industry are questioning how realistic the government’s long-term commitment to the port might be (McKay, 2009a; Sexton, 2011d); including, it should be pointed out, Infrastructure Australia itself (Deegan, 2012) – the very body the State government is petitioning for that funding. A question of relevance, therefore, is whether or not the reactivation of the Port of Bell Bay can be socially justified. In other words, is it in the net best interests of all Tasmanians to maintain what is effectively a third container facility when it may be theoretically reasonable to expand existing operations at the Ports of Burnie and/or Devonport?
Maritime experts generally agree that the Port of Bell Bay is the best natural harbour of the three main Northern ports. It also has significant infrastructure, and – critically – room to grow. At the Port of Burnie in particular, the forementioned growth in mineral production in the North-West risks crowding out future container capacity. Although improvements in port technology may increase the efficiency of land use (container stacking being an obvious example); if Tasmania’s container export volume is to exceed 1,000,000 TEUs within the next two generations, then the urban constraints faced by the Ports of Burnie and Devonport are dire.
This is not to say that these constraints are prohibitive, as the necessary land for expansion could be compulsorily or commercially acquired regardless of the location. Nevertheless, the cost of such acquisitions, the amenity costs of traffic congestion and noise, the public safety and environmental risks, and the opportunities lost by the community in diverting premium waterfront land to these purposes, are far greater at the city Ports of Burnie and Devonport than they are at the rural Port of Bell Bay.
More immediately, though, primary research reveals that major exporters – including firms, such as Hobart-based Cadbury and Launceston-based Veolia; and industries, such as agricultural producers in the North-East and far South – find the additional costs of transhipping their produce to Devonport or Burnie (relative to Bell Bay) prohibitive at a time when margins are constrained by highly cost-sensitive markets. Steel producers at the Bell Bay industrial hub, for example, presently find it more efficient to break-bulk their product to Taiwan for containerisation than it is to containerise their product locally and export it through Burnie. Very few Tasmanian producers, however, enjoy the luxury of such scale.
Given that a significant number of containerised exports are sourced from industries in closer geographic proximity to Bell Bay than Devonport or Burnie, it can be deduced that the net effect of this impost is to reduce the profitability of Tasmanian industry, reduce the tax base available to government, and place a greater strain on public safety and the environment through longer freight taskings on shared infrastructure. It is furthermore reasonable to suppose that consumers of imported products in the state pay a similar penalty.
It should also be noted that significant investment has taken place in the Northern Tasmanian region on the assumption that the State-owned Port of Bell Bay will be a container handling facility. Businesses that have established operations on the basis of this government-endorsed assumption – and who are now being effectively penalised for these investments – have a strong argument for compensation.

17 | P a g e
Net Present Value and Benefit Cost Ratio Analysis If the of reactivation of the Port of Bell Bay is socially justifiable, the question remains whether or not the current expansion proposed for the Port of Bell Bay can be economically justified. After all, if it is not economically viable in its own right, then it would be difficult to see how the long term benefits of containerised freight specialisation at that location might be practically realised.
Net Present Value is a standard approach for making investment decisions in a public and private context. The net present value approach is based on discounting future cash flows, costs and benefits, to a present value.
𝑁𝑃𝑉0 = 𝐶𝐹0 +𝐶𝐹1
1 + 𝑟+
𝐶𝐹2(1 + 𝑟)2 +
𝐶𝐹3(1 + 𝑟)3 +⋯+
𝐶𝐹𝑛(1 + 𝑟)𝑛
In the equation above, the NPV for reference year zero is equal to the sum of the flows in each of the years 1 to n, with each of those years discounted by the interest rate r for each year between the relevant cash flow and the reference date.
Where the Net Present Value is positive, this is an indicator that the investment is wealth improving, while a negative NPV is indicative of a wealth decreasing investment. The NPV approach is appropriate where there are no investment constraints at the discount rate. Where there is an overall limit in the pool of available investment funds, the NPV indicator does not have the capacity to distinguish between investments directly.
The Benefit / Cost Ratio (BCR) builds on the net present value approach but can be used to rank or distinguish between multiple alternative investments. Firstly cash flows are separated into those associated with the operating phase of the project (the benefits) and those associated with the capital investment phase. The net present value of the benefits arising from an investment is compared to the net present value of the investment costs and the ratio determined. The investment with a higher ratio of benefits to costs is generally preferred to an investment with a lower ratio. Selecting investments with higher benefit cost ratios will maximize the net present value of benefits subject to a fixed pool of investment funds.
𝐵𝐶𝑅 =𝑁𝑃𝑉𝐵𝑒𝑛𝑒𝑓𝑖𝑡𝑠𝑁𝑃𝑉𝐼𝑛𝑣𝑒𝑠𝑡𝑚𝑒𝑛𝑡
It should be noted that the internal rate of return or IRR can also be used to rank investments. The IRR is identified as the discount rate at which a given investment will have an NPV of zero. In normal investments, where costs precede benefits, the investment with higher IRR is preferred over that with the lower IRR. However, in investments where the benefits precede the costs, a lower IRR is preferred, as the investment is actually a loan and the IRR akin to the cost of that loan. Where cash flows may alternate between positive and negative values over a project life, there may be multiple discount rates at which the NPV is zero and the interpretation for investment decisions necessarily ambiguous.
The selection of discount rate is a critical and often controversial aspect of project evaluation. There is a substantial difference between the appropriate choice of discount rate for the purposes of public investment and private investment purposes. In general, public investment has strong externalities, or benefits that are captured by participants in the economy more broadly but that which may be

18 | P a g e
difficult to measure or capture. Conversely, private investment is subject to substantial risk and investors require higher returns to justify investing in companies that may default or be subject to uncertain returns.
Public investment may therefore be assessed at a rate based on the long-term bond rate which is a risk free cost of funds to the government or rate of return to the investor. The long-run estimate used by the Tasmanian Treasury for discounting the unfunded superannuation liability is 6 per cent per annum (Tasmanian Government, 2012). This estimate is based on long-term bond rates and is suitable for our purposes as a nominal discount rate. Bond rates are nominal rates that do not take into account the effects of inflation. Where prices are expected to rise over time, cash flow benefits will be higher in nominal, or money of the day, terms, but have the same real value after discounting for inflation.
Similarly, capital costs may increase over time, but have the same real cost after adjusting for inflation. Inflation may be incorporated directly into analysis by adjusting the estimated value for the impacts of inflation. Alternatively, and generally more simply, estimates can be made in real terms relative to a base year and then the discount rate adjusted for the effects of inflation. Where the anticipated inflation rate and required nominal rate of return are close to zero then the required real discount rate is approximated by subtracting the inflation rate (i) from the nominal rate of return.
𝑟𝑟𝑒𝑎𝑙 ≅ 𝑟𝑛𝑜𝑚𝑖𝑛𝑎𝑙 − 𝑖
The Reserve Bank of Australia has a well-publicised target range for inflation of between 2 and 3 per cent per annum. Therefore, an appropriate real discount rate for public investment is 3.5 per cent; that is, 6 per cent average long-term bond rate, less the average of the inflation target band (2.5 per cent).
Analysis of the potential investment return from the Bell Bay project indicated an expected Benefit Cost Ratio of around 1.33 (assuming a marginal operating cost of around 50 per cent of revenue). This ratio was highly dependent on the discount rate and the operating cost assumptions as can be seen in Table 1.
This analysis has two significant conclusions for the policy maker:
• The net present value is only positive (BCR greater than 1) at the social discount rate of 3.5 per cent, but not higher discount rates. Therefore a public, rather than private, investment approach is required. This supports a request for Australian Government funding.
• The net present value is only positive (BCR greater than 1) where there is a relative low marginal operating costs or relative high operating earnings as a proportion of revenue. This would indicate that TasPorts must seek opportunities for efficiency, including specialisation, to reduce operating costs and pay close attention to forecast operating costs in the final investment analysis.

19 | P a g e
Table 1: Net Present Value Calculation (Bell Bay Ports Investment)
Imports Exports
Revenue per TEU $ 109.62 Revenue per TEU $ 141.77 $ 75.06
Proportion of TEUs 51.80% 48.20%
Incremental Opex 0.5 as Percentage of Revenue
Discount Rate 3.50%
2020
Yr-2 Yr-1 Yr-0 1 2 3 4 5 6 7 8 9 10
$'000 $'000 $'000 $'000 $'000 $'000 $'000 $'000 $'000 $'000 $'000 $'000 $'000
Incremental TEUs .... .... .... 46 23 190 207 225 244 250 250 250 250 Incremental Revenue .... .... .... 5,047 2,538 20,827 22,690 24,647 26,702 27,404 27,404 27,404 27,404 Incremental Opex
.... 2,524 1,269 10,413 11,345 12,324 13,351 13,702 13,702 13,702 13,702
Net Benefit .... .... .... 2,524 1,269 10,413 11,345 12,324 13,351 13,702 13,702 13,702 13,702
11 12 13 14 15 16 17 18 19 20 21 22 23 24 25 $'000 $'000 $'000 $'000 $'000 $'000 $'000 $'000 $'000 $'000 $'000 $'000 $'000 $'000 $'000
250 250 250 250 250 250 250 250 250 250 250 250 250 250 250 27,404 27,404 27,404 27,404 27,404 27,404 27,404 27,404 27,404 27,404 27,404 27,404 27,404 27,404 27,404 13,702 13,702 13,702 13,702 13,702 13,702 13,702 13,702 13,702 13,702 13,702 13,702 13,702 13,702 13,702 13,702 13,702 13,702 13,702 13,702 13,702 13,702 13,702 13,702 13,702 13,702 13,702 13,702 13,702 13,702
NPV Benefits 177,644 $'000

20 | P a g e
2020
Yr-2 Yr-1 Yr-0 1 2 3 4 5
$'000 $'000 $'000 $'000 $'000 $'000 $'000 $'000
Capital Expenditure 56,000 .... 25,000 .... 55,000 .... .... 14,000
NPV Investment Cost 133,595 $'000
Benefit / Cost Ratio 1.33
NPV Benefits / NPV Investment Costs
Table 5: Benefit / Cost Ratio Sensitivity Analysis (excludes avoided Opportunity Costs) Benefit Cost Ratio
Marginal Operating Cost (as proportion of revenue)
0.85 0.5 0.25
3.5% 0.40 1.33 1.99 Discount Rate 6.5% 0.29 0.95 1.43
10.0% 0.20 0.67 1.01

21 | P a g e
Investment timing It should be noted that the conundrum of specialisation is not a uniquely Tasmanian challenge. In like economies, South Africa (Nevin, 1998) and New Zealand (New Zealand Prodcutivity Commission, 2012) have and continue to wrestle with the dilemma of how to optimise public expenditure in this regard. In Australia we have seen port relocation to resolve the issue, such as the shift of the Port of Brisbane to Fisherman’s Island (Piyatrapoomi, Bunker, & Ferreira, 2006); port re-commissioning, such as the dedicated functionality assigned to the different ports in Sydney Harbour (Sydney Ports, 2012), and even port duplication / expansion, such as is being seen in the development of the Port of Hastings by the Victorian state government (Lucas, 2011).
What is observable is that in environments where there is a general consensus for port rationalisation, a laissez faire approach – such as that adopted in New Zealand – leads to market uncertainty, which in turn impacts detrimentally on business confidence, new investment and export growth (Glass & Hannan, 2012). Indeed, competitors often seize the initiative in the absence of decision implementation, as is presently evidenced in the emerging assumption that New Zealand will be consigned to little more than a spoke route on an Australian hub (Harris, 2010), and as shall be seen below.
In more decisive economies – see Japan, and more recently, China – critical infrastructure decisions like this are centrally planned for notable productive benefits. In other words, in the absence of fiscal constraints, government action in this regard is inevitably preferable to caution.
Despite this, Minister for Infrastructure, David O’Byrne has stated that the market – in his words, “the customers and (Port of Burnie operators) Toll (Holdings)” – have made a decision that freight will not go through Bell Bay in the short term (Legislative Council, 2011). To suggest that customers have had any say in this decision, however, is highly contestable. Indeed, it is the exclusive actions of the commercial operators that have led to the current situation whereby the Ports of Devonport and Burnie are the state’s last two container ports left standing.
After all, scheduling difficulties faced by the AAA shipping consortium led to the loss of the Bell Bay’s international service. A profit-seeking series of commercial decisions led to the joint-venture between Toll and ANL at the Port Burnie. And poor commercial practices by Agility, including the inability to pre-secure a berth at the Port of Melbourne and the use of vessels of questionable sea-worthiness, led to the failure of the last remaining container service out of Bell Bay.
It is noted, too, that the assignment of the remnant Bell Bay container contracts by producers to the operators at Burnie (Toll / ANL) and Devonport (SeaRoad) more accurately reflects a desire for business continuity than they do any commercial benefit. If, in fact, as the producers argue, that they are commercially worse off by being forced to relocate to the north-western ports, then it is unreasonable to suggest that they have freely elected to not route their freight through the Port of Bell Bay.

22 | P a g e
As pointed out, though, the State government continues to express support for the Port of Bell Bay as the main container hub for Tasmania. Yet the Minister states he is relying on the “market” to indicate when the “tipping point” will be that shifts containerisation from Burnie to Bell Bay. His definition of the tipping point is when freight companies say, “We are a bit constrained here.” He argues that if the Bell Bay investment were started now, it would not be the best investment for Tasmania (Legislative Council, 2011).
There are a number of issues in that statement of policy that are worth challenging. Foremost is the fundamental misunderstanding of who the market is; or, more accurately, which aspect of the market the government is mandated to represent. It could be argued that this approach to policy decision making is placing the mercantile interests of a duopoly of firms over the net commercial welfare of all of Tasmania’s producers. In raw economic terms, the exporters return far more direct and indirect wealth to the State than their agents.
Secondly, the operators are already saying, “We are a bit constrained here.” In the same committee appearance as the Ministerial one cited, the CEO of TasPorts stated that the current development plan for Port of Burnie will extend its life by 5-10 years (from today), and that they are relying on Toll to make investments in terminal efficiencies that will maybe extend this to 10-15 years (Legislative Council, 2011). Unfortunately, though, not only does that suggest that the tipping point is already upon us, but that there is also no incentive for Toll and SeaRoad to make any significant investment in their terminal facilities. This is because for every day that Bell Bay lies dormant, there is an implicit guarantee that their capital needs will continue to be met by top-up funding. And why should they commit when the government continues to send mixed signals about their futures relative to Bell Bay?
It is noted earlier in this report that assuming a growth forecast in Tasmanian containerised freight of 3.5 per cent per annum, Tasmania can expect to throughput 750,000 TEUs of containerised freight per annum by 2025. If the planned portside improvements at Burnie and Bell Bay are realised, their combined capacity will be 700,000 TEUs. Therefore Tasmania’s capacity to meet the export expectations of the state’s producers is soon to be critically constrained (see Figures 8 & 9), and the consequential economic effects will be devastating in terms of production, employment and, ultimately, population losses. This is despite the inarguable benefits of specialisation; despite the intention to upgrade the Port of Bell Bay as the State’s premier container handling facility; and, despite the assurances of government that they will recognise “tipping points” when they occur.
What, then, might be gained if the Port of Bell Bay proposal currently before Infrastructure were to be immediately realised?

23 | P a g e
Figure 10 – Tasmanian port capacity forecast (with Bell Bay expansion)
Figure 10 shows a forecast of capacity utilisation at Tasmania’s ports under the main investment scenario of an investment in capacity to enable 400,000 TEUs through Bell Bay around 2020 (with phased expansion of capacity) and a further investment 2030 when the 400,000 capacity is reached. It can be seen that due to demand growth, both Burnie and Devonport remain major ports for containers.
The assumptions behind this forecast include capacity and utilisation at Bell Bay increasing to 150,000 in 2021 and 2022 (ie the maximum existing capacity) and 340,000 (85 per cent of capacity) in 2023. From 2023, utilisation is estimated to grow at 5 per cent per annum, reflecting the comparative advantage at Bell Bay after the expansion and intermodal investments. Remaining capacity is divided between Burnie and Devonport proportional to capacity, and grows more rapidly after 2027 when the new capacity at Bell Bay is reached. These forecasts can be assumed to be broadly reflective of the potential utilisation of capacity with specialisation of the container freight at Bell Bay, noting that Burnie remains significant.
As an aside, TasPorts should be encouraged to regularly publish economic value added analyses for port operations, including disaggregated data for significant business segments. This would improve reporting and transparency, support benchmark competition between port companies, and help to ensure the efficient use of capital in the freight transport system. An independent assessment of comparative financial performance for port owners and policy makers to consider would also promote a more informed community debate in this regard (New Zealand Prodcutivity Commission, 2012).
0
100
200
300
400
500
60020
1120
1220
1320
1420
1520
1620
1720
1820
1920
2020
2120
2220
2320
2420
2520
2620
2720
2820
2920
3020
3120
3220
3320
3420
35
TEU
'000
Burnie 350000
D'Port 200000
Bell Bay 150000/400000/800000

24 | P a g e
Conclusion A recent transport industry forum rightly identified that more intelligent infrastructure systems for Tasmania depend on increased communication and cooperation between the three tiers of government and the various transport industry bodies (AMC & CILTA, 2011). It should not be forgotten, however, that the needs of the users of these systems – the state’s export producers – should be paramount to the commercial interests of network providers. With reference to these producers and sustainable best-practice, this report highlights a number of relevant issues of importance to Tasmania’s future economic prosperity.
Firstly, there is a need for expansion at some point in the future somewhere in the northern port system to avoid constraining overall container movements. This is not in dispute, and acknowledged by all stakeholders. Before determining where and when that expansion might occur though, it is vital to consider what the state’s ultimate container port infrastructure might look like. This is because port investments require significant capital outlays that are returned over a multi-generational life-cycle. Given that in Australia at the moment, it takes an average of ten years to develop major port infrastructure (GHD, 2010a), failure to take an over-the-horizon view in this regard will inevitably result in sub-optimal social and economic outcomes.
The State government recognises that they have an opportune advantage (relative to other economies), through the direct ownership of roads, rail (above and below the line) and ports, to direct an effective and efficient freight logistics strategy (Legislative Council, 2011); therefore, the time for the reactivation of the Port of Bell Bay is upon us. Re-activation is required to manage the constraints that the state’s container export infrastructure will incur in the next five years (and are in all likelihood being felt now). Capital expansion is therefore required to meet even the most modest medium term growth forecasts. It should be pointed out that realisation of these forecasts is absolutely critical for the welfare of all Tasmanians in an environment where other potential drivers of domestic growth are anticipated to be in decline (Tasmanian Government, 2012).
In order for the Bell Bay plans to proceed, the start-up investment – as outlined in the State Government’s proposal to Infrastructure Australia (DIER, 2011) – needs to be economically justified. Using the best practice principles of cost-benefit analysis, the report demonstrates that: a public, rather than private, investment approach is required; and that TasPorts must seek opportunities for efficiency, including specialisation, to reduce operating costs and pay close attention to forecast operating costs in the final investment analysis.

25 | P a g e
To the extent that there are clearly identifiable benefits to reactivating at the Bell Bay site for the majority of stakeholders, the de facto specialisation now occurring at Burnie represents an inferior outcome. This outcome appears fundamentally driven by the legacy commercial arrangements between the Port of Burnie and Toll Holdings. Achievement of the optimal economic outcome is therefore likely to require some form of Pareto compensation, or commercial flexibility to ensure that any benefits currently received for one location are transferable to another (ie from Burnie to Bell Bay). If necessary, infrastructure levies can be applied at the State-level to fund investment, thus enabling commercial terms available at Burnie to be replicated at Bell Bay.
Reform of the Bass Strait Freight Equalisation Scheme has also been clearly identified as a policy opportunity (Deegan, 2012). At $100 million per annum and growing, and at a social discount rate of 3.5 per cent per annum, the effective net present value of this subsidy is over $2.8 billion, and $2.9 billion has been spent to date in real terms (Deegan, 2012). Therefore major reform or replacement of the scheme, in association with investments in Tasmania’s port, transport and logistics infrastructure that left exporters no worse off, could be both socially and economically beneficial for Tasmania and Australia.
Ultimately, it is shown that every day the Port of Bell Bay lies dormant comes at an economic cost to the community. Firstly, the majority of producers are presently disadvantaged by higher freight costs consequent to the closure of Bell Bay’s container terminals, which equates to a net reduction in government revenue over time. Secondly, in the absence of a viable alternative such as Bell Bay, the government is committed to maintaining the congested and decaying container infrastructure at the Ports of Burnie and Devonport, effectively relieving the commercial operators of any incentive in this regard. And finally, in a return to the initial argument – suggesting a somewhat vicious cycle – expansion at some point in the future somewhere in the northern port system is required to avoid constraining overall container movements and statewide economic growth, and the dormant land and infrastructure at Bell Bay is prima facie the most efficient and effective solution available.

26 | P a g e
Appendix 1 – Cost Benefit Analysis What is cost-benefit analysis? Cost-benefit analysis (CBA) is a tool used to determine the worth of a project, programme or policy. It is used to assist in making judgments and appraising available options. CBA principles and practice are well established – as evidenced by the vast amounts of literature available from academics, CBA practitioners, and government agencies (both domestically and abroad).
CBA is a quantitative analytical tool to aid decision-makers in the efficient allocation of resources. It identifies and attempts to quantify the costs and benefits of a programme or activity and converts available data into manageable information. The strength of the method is that it provides a framework for analysing data in a logical and consistent way. CBA helps managers answer questions such as:
• Does the proposal provide a net benefit to the community as a whole? • Should the proposed project, programme or policy be undertaken? • Should the project or programme be continued? • Which of various alternative projects or programmes should be undertaken?
A CBA adds rigour to a programme evaluation because, among other things, it makes explicit the links between inputs and outcomes, clarifies the underlying assumptions, and points to gaps in information. By endeavouring to express outcomes (benefits) and inputs (costs) in dollar terms, it facilitates comparisons across different types of programmes as well as options within a particular programme.
Why use it? A CBA is normally undertaken as one aspect of a more comprehensive assessment of a programme’s appropriateness, efficiency and effectiveness. A CBA is primarily designed to answer the question ‘does the expenditure of public money on this particular programme provide a net benefit to the Australian economy and the Australian public, bearing in mind that these resources could be applied in an alternative use?’
In principle, CBAs enable agencies to compare the relative merit of different (or alternative) programmes or projects in terms of their returns on the use of public resources. CBA may also be used to evaluate the social returns on the use of privately owned resources as in regulation reviews.
Cost-benefit analysis is employed in various ways. It may assist government to:
• decide whether a proposed project or programme should be undertaken; • decide whether an existing project or programme should be continued; • choose between alternative projects or programmes; • choose the appropriate scale and timing for a project; and • determine regulations affecting the private sector.
All of these applications are ex ante (or ‘before’) uses of the method. The method can also be used when a project or programme has matured as part of an evaluation of programme impact or outcomes. In this context the method may:

27 | P a g e
• provide information on whether the outcomes achieved justify the resources used, relative to alternative uses; or
• clarify the focus on different components of a project or programme, in order to see how the project or programme can be improved, and which areas should be cut back or expanded.
In practice, it is often difficult to provide a clear ranking of alternative demands on public funds. Another important stumbling block faced by economists in all evaluations is that the assessment depends on what would have happened without the project or programme, which has to be forecast. What is foregone when we undertake a project is known as the ‘opportunity cost’.
Key concepts The cost-benefit analyst’s ‘toolkit’ includes the following basic concepts:
• Opportunity cost: resources are priced at their value against their best alternative use, which may be above or below the actual cost of production.
• Willingness to pay: outputs are valued at what consumers are willing to pay for them. • The cost-benefit rule: subject to budget and other constraints and equity considerations, a
project or policy is acceptable where net social benefit (total benefit less total cost), valued according to the opportunity cost and willingness to pay principles, is positive rather than negative.
Distributional issues A key advantage of CBA is that it provides a quantitative measure of the net benefit of an investment, allowing direct comparisons between dissimilar projects. Unless programmed otherwise, equal weight is accorded between winners and losers.
The cost-benefit process implicitly estimates the size of gains and losses for affected individuals and groups. This information is important in public sector decision-making and should be made explicit because it is important to identify those who stand to gain and lose from a programme or project
Value added A CBA provides an estimate of the worth of a proposal relative to an accompanying estimate of what would happen in the absence of the proposal. The difference between these values can be viewed as the ‘value added’ from adopting a proposal. For example, suppose that the benefits of a new overseas marketing campaign to promote Australia as a holiday destination are estimated in terms of new visitors attracted to Australia. It is first necessary to estimate the number of new visitors who would have been attracted in the absence of the advertising. While this may appear an obvious point, it can be easily overlooked, resulting in an inaccurate estimate of the net benefits that can be attributed to the campaign.

28 | P a g e
Computing present values The time dimension is also important in valuing costs and benefits. Costs and benefits should be valued at the specific time that they occur. Because a dollar’s consumption in the future is usually valued less than a dollar’s consumption today, future costs and benefits are discounted to a ‘present value’. This means that the cost-benefit rule needs to be consistent with the net present value rule:
• subject to budget and other constraints, a project should be undertaken if its net present value is positive; or
• subject to budget and other constraints, those projects should be undertaken with the highest positive net present values.
Other decision criteria such as the internal rate of return rule, the benefit-cost ratio and the payback period can be used but, unlike the net present value rule, they are not reliable in all circumstances.
The discount rate used should generally reflect the opportunity cost of capital – that is the return on capital foregone in alternative use of the resources. Depending on the circumstances, this may reflect the return foregone on marginal public or private sector projects or a project-specific discount rate that reflects the rate of return that private lenders would require for financing this specific type of project.
Differentiated discount rates are appropriate where organisations are fully commercialised.
Allowing for risk Projects are also exposed to many sources of uncertainty. Sensitivity analysis is the most helpful general procedure to identify the risk or uncertainty associated with project outcomes. This involves testing the effects on net present value of plausible better-case and worse-case assumptions. Sensitivity analysis should also be applied to the level of the discount rate, to accommodate uncertainty concerning the opportunity cost of capital over the project period.
In cases where the values of more than two or three variables are considered highly uncertain, a full risk analysis, which takes into account the variety of causes of risk, should be undertaken.
Limitations The effective use of cost-benefit analysis requires awareness of the method’s limitations as well as its strengths. Some limitations are:
• Design weakness - cost-benefit analysis compares a project scenario with an alternative scenario based on estimates of what would have happened in the absence of the project. Any margin for error in the specification of the alternative scenario is carried over into the project analysis.
• Treatment of ‘intangibles’ - not all costs and benefits are amenable to dollar quantification and those that are not (the intangibles) may be overlooked.
• Equity concerns - the potential bias against those with a lesser ability to pay that may result from measuring benefits in dollars can be allowed for with the use of judgement, but this is necessarily external to the basic framework.

29 | P a g e
• Obscurity - when the user’s interest is focused on the ‘bottom line’ of the analysis, the analysis itself may be rather obscure. However, the analysis will only be as good as its assumptions and these should always be set out as clearly as possible.
Financial evaluation Closely related to, but distinct from cost-benefit analysis, a financial evaluation or appraisal asks ‘what is the net benefit to the individual organisation?’ rather than ‘what is the net benefit to the community as a whole?’ Only cash flows in and out of the organisation are considered: cash flows involving other players are excluded, as generally are costs and benefits that are unpriced.
Cost-effectiveness analysis Cost-effectiveness analysis differs from cost-benefit analysis in that benefits are expressed, not in money units, but in physical units. In cost-benefit analysis, costs are expressed in money terms.
In relaxing the approach towards benefits measurement, cost-effectiveness analysis is particularly useful in areas (such as health, accident safety and education) where it may be easier to specify benefits than it is to value them.
Assuming that adequate quantitative measures of programme effectiveness can be found, the method is very useful in comparing alternative options or existing projects and programmes. Its limitation is that, because costs and benefits are not directly comparable, it does not provide a criterion for acceptance or rejection of a project or programme.
Sources
Department of Finance & Administration, Financial Management Group, 2006, Introduction to Cost-Benefit Analysis and Alternative Evaluation Methodologies, Commonwealth of Australia.
Department of Finance & Administration, Financial Management Group, 2006, Handbook of Cost-Benefit Analysis, Commonwealth of Australia.

30 | P a g e
Appendix 2 – About the Authors The MMC Link team has a proven track record of undertaking comprehensive cost-benefit analysis, interpretation and modelling of demographic, social and economic patterns, drivers and trends by jurisdiction. Through such analysis and interpretation, they have prepared highly credible, fact based projections, advice, reports and presentations that have assisted government and industry to effectively plan at the strategic level.
Dr Bruce Felmingham Dr Bruce Felmingham was the chief economist for this project and is the principal consultant for MMC Link. Bruce is a highly respected economic consultant, commentator, and academic. Bruce’s research interests principally relate to International Finance, Monetary Economics, Population Economics and related Labour Market issues, such as productivity.
Bruce has authored or co-authored over 70 research journal articles in these literatures. He has held a large number of positions within the tertiary, public and private sectors and has completed many consultancies for business, State, Federal and Local Government.
Paul Muller Prior to joining MMC Link, Paul enjoyed 15 years of senior management experience across Australia, Asia and Europe in a wide range of hospitality, training and sports businesses. Since coming to Tasmania, he has advised organisations as diverse as the Department of Economic Development, Tourism and the Arts, RBF, Aurora and the Tasmanian Cricket Association on management issues relating to strategy, risk, projects, operations, marketing and people.
Ian McMahon Ian McMahon is a Graduate of the Australian Institute of Company Directors, has a degree in Management and Professional Studies from Southern Cross University, Diploma of Entrepreneurial Management, Certificate IV in Workplace Assessment and Training, Diploma in Occupational Health and Safety, and is an accredited External Auditor (Quality ISO 9001:2000).
31 | P a g e
Glossary
ABS Australian Bureau of Statistics
BCR Benefit Cost Ratio
BITRE Bureau of Infrastructure, Transport and Regional Economics (Department of Infrastructure, Transport and Local Government, Canberra, Australia)
CEO Chief Executive Officer
COAG The Council of Australian Governments (COAG) is the peak intergovernmental forum in Australia. COAG comprises the Prime Minister, State Premiers, Territory Chief Ministers and the President of the Australian Local Government Association (ALGA).
DIER Department of Infrastructure, Energy and Resources (Tasmania)
GBE A Government Business Enterprise (GBE) is a legal entity created by a government to undertake commercial activities on behalf of an owner government. While they may also have public policy objectives, GBEs should be differentiated from other forms of government agencies or state entities established to pursue purely non-financial objectives.
LLDCN Lloyd’s List Daily Commercial News
RORO Roll-on/roll-off (RORO or ‘ro-ro’) ships are vessels designed to carry wheeled cargo.
TasPorts Tasmanian Ports Corporation Pty Ltd (GBE)
TasRail Tasmanian Railway Pty Ltd (GBE)
TEU One Twenty-foot Equivalent Unit (TEU) represents the cargo capacity of a standard intermodal container; 20 feet (6.1 m) long by 8 feet (2.44 m) wide
(Department of Finance & Administration (Financial Management Group), 2006a, 2006b; Obsidian, 2004; A. Smith, 1776)

32 | P a g e
References
ABC News. (2011a). Hopes for new Bell Bay operator, from http://www.abc.net.au/news/2011-02-16/hopes-for-new-bell-bay-operator/1944622
ABC News. (2011b). Tasmanian international cargo shipping ends, from http://www.abc.net.au/news/2011-02-16/hopes-for-new-bell-bay-operator/1944622
ACIL Tasman. (2009). Vision 2020 Project: The Australian Minerals Industry's Infrastructure Path to Prosperity.
AMC & CILTA. (2011). Tasmanian Transport Forum: A Vision for 2020. Launceston: Australian Maritime College & the Tasmanian Branch of CILTA (Chartered Institute of Logistics and Transport Australia).
. Australia Freight Transport Report - Q3 2012. (2012) (pp. 1-56). London, United Kingdom, London.
BITRE. (2010). Interstate Freight in Australia: Bureau of Infrastructure, Transport and Regional Economics.
Blackwood, F. (2004, 19 March). Port Debate, Stateline (Tasmania).
Clark, N. (2012, 10 May). Gas ships plan for Strait, The Mercury.
Crisp, D. (2010, 16 August). Unlucky start for Agility, Lloyd's List Daily Commercial News.
Deegan, M. (2012, 24 May). [Correspondence to the Minister for Infrastructure and Transport].
Department of Finance & Administration (Financial Management Group). (2006a). Handbook of Cost-Benefit Analysis: Commonwealth of Australia.
Department of Finance & Administration (Financial Management Group). (2006b). Introduction to Cost-Benefit Analysis and Alternative Evaluation Methodologies: Commonwealth of Australia.
DIER. (2011). Tasmanian Government's 2011 Submission to Infrastructure Australia: Depar tment of Infrastructure , Energy and Resources.
Engineers Australia. (2010). Infrastructure Report Card 2010: Tasmania.
Felmingham, B. (2011). The economic contribution of the Bell Bay industrial estate on the Tasmanian economy: IMC-Link.
GHD. (2010a). The possible future market challenges for relevant ports: Infrastructure Australia and the National Transport Commission.
GHD. (2010b). Report for Tasports Bell Bay Intermodal Expansion: Infrastructure Australia Update.
Glass, W., & Hannan, G. (2012). Optimising our ports to improve supply chains. FTD Supply Chain Management Magazine(April-May).
Global Maritime Containerization Industry. (2012). PR Newswire, p. n/a. Retrieved from http://ezproxy.utas.edu.au/login?url=http://search.proquest.com/docview/1018651534?accountid=14245
http://rk9dr6cc2p.search.serialssolutions.com/?&genre=article&sid=ProQ:&atitle=Global+Maritime+Containerization+Industry&title=PR+Newswire&issn=&date=2012-06-06&volume=1&issue=&spage=&author=
Harris, C. (2010, 16 October). Road lobby enters port debate, The Dominion Post.
Infrastructure Australia and the National Transport Commission. (2010). National Ports Strategy - Background Paper.

33 | P a g e
Jack, E. (2010). Hobart: a world-class, liveable waterfront city: Department of Economic Development, Tourism and the Arts;.
Jackson, N. (2008). Tasmania's Population Retrieved 6 June, 2012
Lee, S.-W., Song, D.-W., & Ducreut, C. (2008). A Tale of Asia's World Ports: The Spatial Evolution in Global Hub Port Cities. Geoforum, 39(1), 372-385.
Legislative Council. (2011). Government Business Scrutiny Committee B. Tasmania: Hansard.
Lucas, C. (2011, 8 January). Ten-year plan for big Hastings port, The Age.
McGuire, R. (2009). Doubling of Freight Task in Tasmania: Tasmanian Freight Logistics Council.
McKay, R. (2009a, 21 August). Bartlett backs Tasmanian policy on Bell Bay, Lloyd's List Daily Commercial News.
McKay, R. (2009b, 19 August). Tasports fears outcome of Toll-ANL port swap, Lloyd's List Daily Commercial News.
Nevin, T. (1998). Hard choices ahead for SA's ports. Finance Week, 76(36), 22-23.
New Zealand Prodcutivity Commission. (2012). International Freight Transport Services Enquiry.
North, M. (2006). TasPorts. Journal of the Australian Maritime Officers Union, 15(1), 4-5,27.
Northern Tasmania Development. (2012). Regional Transport Funding Priorities.
Obsidian. (2004, 8 January). Hobart to lose its zinc trade to a northern port, Lloyd's List Daily Commercial News.
Piyatrapoomi, N., Bunker, J., & Ferreira, L. (2006). Freight Intermodal Terminal Systems for Port of Brisbane, Melbourne and Sydney: Queensland University of Technology.
Rodrigue, J.-P. (2010). Maritime transportation: drivers for the shipping and port industries. International Transport Forum 2010 Retrieved 8 June, from http://people.hofstra.edu/geotrans/eng/ch3en/conc3en/containership_draft_size.html
SeaRoad Holdings. (2012). National Logistics and Tasmanian Shipping, from http://www.searoadholdings.com.au/
Sexton, D. (2011a, 29 August). Agility terminates Bass Strait service as predicted problems with vessels, competition takes toll, Lloyd's List Daily Commercial News.
Sexton, D. (2011b, 4 April). Bass Strait vessel in the wars, Lloyd's List Daily Commercial News.
Sexton, D. (2011c, 4 April). Jobs to go, as AAA drops Tasmania, Lloyd's List Daily Commercial News.
Sexton, D. (2011d, 2 November). TFLC questions viability of Bell Bay, Lloyd's List Daily Commercial News.
Sexton, D. (2012, 24 May). Tassie exporters get a boost, Lloyd's List Daily Commercial News.
Shipping Industry News. (2009, 13 August). New Toll-ANL shipping service met withroad freight backlash.
Slack, B. (1999). Across the pond: container shipping on the North Atlantic in the era of globalisation. GeoJournal, 48(1), 9-9.
Smith, A. (1776). An Inquiry into the Nature and Causes of the Wealth of Nations.
Smith, M. (2012, 2 May). Port loss blow to Cadbury, The Mercury.

34 | P a g e
Spence, D. (2011). Meeting Tasmania's Economic Infrastructure Needs Tasmanian Transport Forum: A Vision for 2020. Launceston: Department of Infrastructure, Energy and Resources.
Sydney Ports. (2012). Sydney Harbour Retrieved 9 July, from http://www.sydneyports.com.au/corporation/port_facilities/sydney_harbour
Tasmanian Government. (2008). Tasmanian Government Submission to the National Infrastructure Audit.
Tasmanian Government. (2012). Budget Paper No 1: The Budget.
Tasmanian Irrigation. (2012). Current Projects Retrieved 26 June, 2012, from http://www.tasmanianirrigation.com.au/Projects.aspx
TasPorts. (2006). Tasports Leads the Way at Landmark Infrastructure Summit. Manifest(3), 3.
TasPorts. (2009, 19 August). Bell Bay vital for Tasmania's long term economic growth, Media Release.
TasPorts. (2011). 2010/11 Annual Report.
TasPorts. (2012a). Port Statistics Retrieved 17 May, 2012, from http://www.tasports.com.au/corporate/port_statistics.php
TasPorts. (2012b). Tasmania's Major Ports Retrieved 17 May, 2012, from http://www.tasports.com.au/about/port_locations.html#
TasRail. (2012). TasRail announces the resumption of Bell Bay services Retrieved 7 June, from http://www.tasrail.com.au/index.php?option=com_content&view=article&id=99:tasrail-announces-the-resumption-of-bell-bay-services&catid=48:latest-news&Itemid=155
The Advocate. (2009, 7 August). Joint venture good tidings for Burnie Port, The Advocate.
The Mercury. (2011, 9 August). Ocean giant to visit Hobart, The Mercury.
United Nations. (1985). Port development: a handbook for planners in developing countries (Second ed.): United Nations Conference on Trade and Development.
Weedon, P. (2011). Tasmania Ports Strategy & Vision Regional Ports Conference 2011.