uk port freight statistics: 2017 · 2018-12-05 · things you need to know the statistics presented...
TRANSCRIPT


Things you need to know
The statistics presented here on port freight in the United Kingdom (UK) provide information on trends and patterns in the handling of freight Users traffic at UK sea ports. Ports are essential to the UK economy, with Users of the data include
around 95% of all imports and exports being transported by sea. central government, the devolved administrations
Port freight statistics are based on a combination of data reported to and local government,
the DfT by port authorities and shipping lines, or their agents. Ports the maritime industry, transport consultants and are split into major ports and minor ports. Major ports are those with academics, and international
cargo volumes of at least 1 million tonnes annually (as well as some organisations. strategically important ports);. More detailed data is collected for major ports, such as breakdown by cargo type.
Uses of this data are explained in the Background Notes. Guidance notes and comparison with data published by other government departments are in the Port Statistics: Notes and Definitions.
Cargo categorisation in port freight statisticsIn the port freight statistics series, cargo is categorised based on the means by which goods are loaded onto or off of the vessel. For some cargo types there is further subdivision into broad commodities. Cargo category is only available for major ports. There were 51 major ports in 2017.
Unitised trafficOnly lift-on lift-off freight (i.e. container traffic) and roll-on roll-off freight services can be expressed in terms of units, that is the exact amount of cars, lorries, containers etc. that were transported.
Roll-on roll-off traffic are vehicles and trailers either driven on under their own power (self propelled) or transported on via a platform vehicle (non-self propelled). Non-unitised cargoLiquid bulk, dry bulk and other general cargo are all expressed only in tonnage.
Other General Cargo consists primarily of break-bulk cargo, that is cargo which is composed of separate pieces that must be loaded individually, and not in intermodal containers or in bulk, such as with oil or grain. These are typically transported in bags, boxes, crates, drums or barrels.
Bulk cargo is that which is transported unpackaged in large quantities, either in liquid or granular, particulate form, as a mass of solids. Examples include crude oil, coal, gravel, cement powder etc.. This is typically dropped or poured into a hold, and is unloaded via suctions, screw or grabber.
Ship types and arrivalsFor the purposes of these statistics, cargo is categorised depending upon how it is transported on the ship. Because of this, no distinction is made on the type of ship that transports goods such as ferries, cruiseferries, RoPAX (Hybrid RoRo and Passenger transport), ConRO (Hybrid RoRo and container) or RoLo vessels (Hybrid RoRo and LoLo services). Information is available on the number of times ships arrived at UK ports, separated by the type of ship. This is available in the PORT06 data series.
More information on how cargo is categorised can be found in the Port Statistic Notes and Definitions.
Annual Port Freight Statistics: 2017 - Page 3

In 2017, major port tonnage steady whilst minor port tonnage fellUK major port tonnage remained level in 2017 at 470.7 million tonnes. Major ports handled 98% of UK port freight tonnage in 2017. Minor port tonnage fell from 11.3 million tonnes in 2016 to 11.1 million tonnes in 2017, a fall of 1%.
UK port tonnage long term trend shows lowest figure since 1999 Between the early 1980s and 2000 the total amount of freight tonnage handled by UK ports increased by 35%. The 2008 recession resulted in the largest year on year decline seen in the last 30 years, when port freight fell by 11% between 2008 and 2009. Total tonnage levels stabilised in recent years at around half a billion tonnes. However, total freight tonnage decreased by 3% in 2016 to 484.0 million tonnes, and marginally further to 481.8 million tonnes in 2017.
Tonnage handled by UK ports since 1980, by port type (port0101)
Unitised traffic increased for the fifth consecutive yearUnitised traffic handled at UK major ports grew very marginally in 2017 Definitionsto 24.1 million unts in 2017, which marks the fifth consecutive year of growth. Unitised traffic has risen 16% since 2012. Unitised traffic: Unitised
traffic can initially be broken
Unitised traffic can also be measured in terms of tonnage handled - down into freight units (those
171.1 million tonnes passed through UK major ports in 2017, a very units which are used for trade)
marginal fall on the previous year where 171.8 million tonnes were and non-freight units (e.g. passenger cars). Freight units
handled by the same ports. can be further broken down into lift-on lift off (lo-lo) a.k.a Main freight units passing through UK major ports have risen to 14.2 containers, and roll-on, roll-off
million units in 2017, a 3% rise on 2016 and the highest number of main (ro-ro) e.g. lorries.freight units on record. In terms of tonnage,164.8 million tonnes of main freight were handled in 2017, a less than 1% fall from 2016. Main freight makes up 35% of all UK major port tonnage handled.
Detailed statistics on freight traffic (tonnage) by port can be found in the statistical data sets, PORT0101 and statistics on unitised traffic in PORT0203, PORT0204 and PORT0205.
Annual Port Freight Statistics: 2017 - Page 4
Port Freight Traffic1.
Major PortsMilliontonnes470.7
Minor PortsMilliontonnes11.1
1980 1990 2000 2010 2017
600
500
400
300
200
100
0
Million tonnes

UK major port freight by type: 2000 to 2017 (port0201)
Million tonnes Definitions120 Main freight units:
Ro-Ro main freight Unitised traffic which transports commercial goods. 100 100.8 This includes:Roll-on / roll-off
80 Lo-Lo main freight
64.0• Road goods vehicles• Unaccompanied road
60 goods trailers• Rail wagons & shipborne
40 trailersLoad-on/load-off
20 • Lo-Lo containers
02000 2005 2010 2017
The top 10 major ports in the UK by tonnage remain unchanged from 2016, however there has been a change in ranking for 5 ports. The top three ports retained their rankings in 2017.
Detailed statistics on freight traffic by port can be found in the statistical data sets, PORT0101, PORT0203, PORT0301, PORT0302 and PORT0303.
Annual Port Freight Statistics: 2017 - Page 5
Decreased Stable Increasedranking ranking ranking
2016 2017Million Million
Rank TonnesTonnes
Grimsby & Immingham 54.4 1 1 54.0
London 50.4 2 2 49.9
Southampton 36.0 3 3 34.5
Milford Haven 34.8 4 4 32.5
Liverpool 31.9 5 5 32.0
Felixstowe 28.2 6 6 29.0
Forth 27.4 7 7 28.4
Dover 27.3 8 8 27.5
Tees & Hartlepool 26.9 9 9 26.2
Belfast 17.6 10 10 18.2
All other UK major ports 137.9 138.3 All other UK major ports
Grimsby & Immingham London
Southampton LiverpoolMilford Haven Felixstowe
Tees & Hartlepool
Forth
DoverBelfast
All UK major ports by tonnes, ranking in 2016 and 2017 (port0303)


UK ports by direction, 2016UK major ports*: tonnage by direction, 2017
54.0 million tonnes(Grimsby & Immingham)
2.1 million tonnes(Shoreham)
Inwards
Outwards
!
Grimsby &Immingham
London
Southampton
Liverpool
Milford Haven
Felixstowe
Tees &Hartlepool
Forth
Dover
Belfast
RiversHull &Humber
Hull
Clyde
Bristol
Medway
Port Talbot
Manchester
Glensanda
Holyhead
Sullom Voe
Orkney
Harwich
Heysham
Aberdeen
Portsmouth
Newport
Warrenpoint
Tyne
LarneCairnryan
LochRyan
Plymouth
Ipswich
Shoreham
Other major ports
Minor ports
!
!
!
!
!
!
!
!
!
!
!!
!
! !
!
!
!
!
!
!
!
!
!
!
!
!!
!
!
!
!
!
!
!
!
!
!
!
!
!
!
!!
!
! !!
!
!
!
!
!
!
!
!
!
!
!
!!
!!
!
!
!
* All ports marked on map handled over 2 million tonnes of freight in 2017.© Crown copyright. All rights reserved. Department for Transport 2018.
Made with Natural Earth.
Annual Port Freight Statistics: 2017 - Page 7


Annual Port Freight Statistics: 2017 - Page 11
Cargo CategoriesMost of the cargo categories described within this release can be described using tonnage. In addition, unitised traffic (Lo-Lo and Ro-Ro) can be described in terms of units.
Cargo is primarily categorised depending upon how it is transported on the ship. There is limited categorisation into broad commodity categories as shown in the graphic below, however it is not possible to describe cargo down to individual commodities in the Port Freight Statistics.
UK major port freight by cargo category, in million tonnes, 2017 (port0201)
Lo-Lo64.0
Other GeneralCargo18.8Million tonnes
Million tonnes
All Major Port Traffic
470.7 Milliontonnes
Liquid Bulk
189.1 Milliontonnes
Dry Bulk91.7Million
tonnes
Other Dry Bulk
Ores
Crude Oil
Oil Products
Other Liquid Bulk
Liquefied Natural Gas
17
11.2
86.3
80.4
11.2
10.5
11.3
52.8
Agricultural Products
Coal
Ro-Ro
107.0Million tonnes
Ro-Ro Freighte.g. road goods vehicles (RGV) unaccompanied RGV trailersrail wagonsshipborne trailers
100.8Passenger Cars 5,394Thousand units
127Thousand units
Passenger Buses
6.2 Million tonnesRo-Ro Non-Freighte.g. import/export motor vehiclespassenger cars/busesunaccompanied caravans
NB: Tonnage is not collected for these two categories
More information on how cargo is categorised can be found in the Port Statistic Notes and Definitions.


Annual Port Freight Statistics: 2017 - Page 13
Crude oil continues to fall
Top 3 crude oil import and export countries, 2017 and change from 2016 (port0205)
2016
Million tonnes0 10 20 30
Norway
USA
Algeria
2017 Exports
Million tonnes0 10 20 30
Netherlands
China
South Korea
Crude oil tonnage has more than halved since 2000 and continues to fall. In 2017 this is the largest contributor to the overall 1% fall in liquid bulk traffic passing through UK major ports.
Forth handled the most crude oil in 2017, with 15 million tonnes passing through the port, which was 17% of the total crude oil handled by UK ports. All of this is in the outwards direction; the largest port for crude oil passing in the inwards direction is Southampton, with 11.9 million tonnes passing through its services in 2017. Counting both directions, 12.2 million tonnes of crude oil were handled by Southampton, an increase of 15% from 2016.
A total of 19.2 million tonnes of crude oil passed through UK major ports from Norway, which was 22% of the total amount handled.
The second largest international route for crude oil is the Netherlands, with 9.5 million tonnes passing through UK major ports, 11% of all crude oil traffic. The story is reverse however to that of Norway: where nearly all crude oil traded with Norway was imported to the UK, in contrast, the majority of crude oil traded with the Netherlands was exports, with 9.3 million tonnes entering their ports from UK major ports in 2017.
Liquefied gas continues to fallLiquefied gas handled by UK major ports continues to fall following a peak in 2011, falling 17% in 2017, driven by a fall in imports from Qatar. Following an initial peak of Qatari supply of 16.7 million tonnes in 2011, values have generally fallen to 4.4 million tonnes in 2017. Total liquefied gas passing through UK major ports is now near to its pre-2008 levels.
This fall in Qatari supply could possibly be linked to the 2017 Qatari diplomatic crisis, which resulted in several Qatari ports being blockaded by Saudi Arabia and the United Arab Emirates.
Inwards and outwards liquefied gas trafficfrom 2000 (port0205)
0
5
10
15
20
25
2000 2005 2010 2015
OutwardsInwards
2017
Million tonnes
More information on the 2017 Qatari diplomatic crisis can be found online, including statements by the Foreign and Commenwealth Office (FCO).
Imports

Annual Port Freight Statistics: 2017 - Page 15
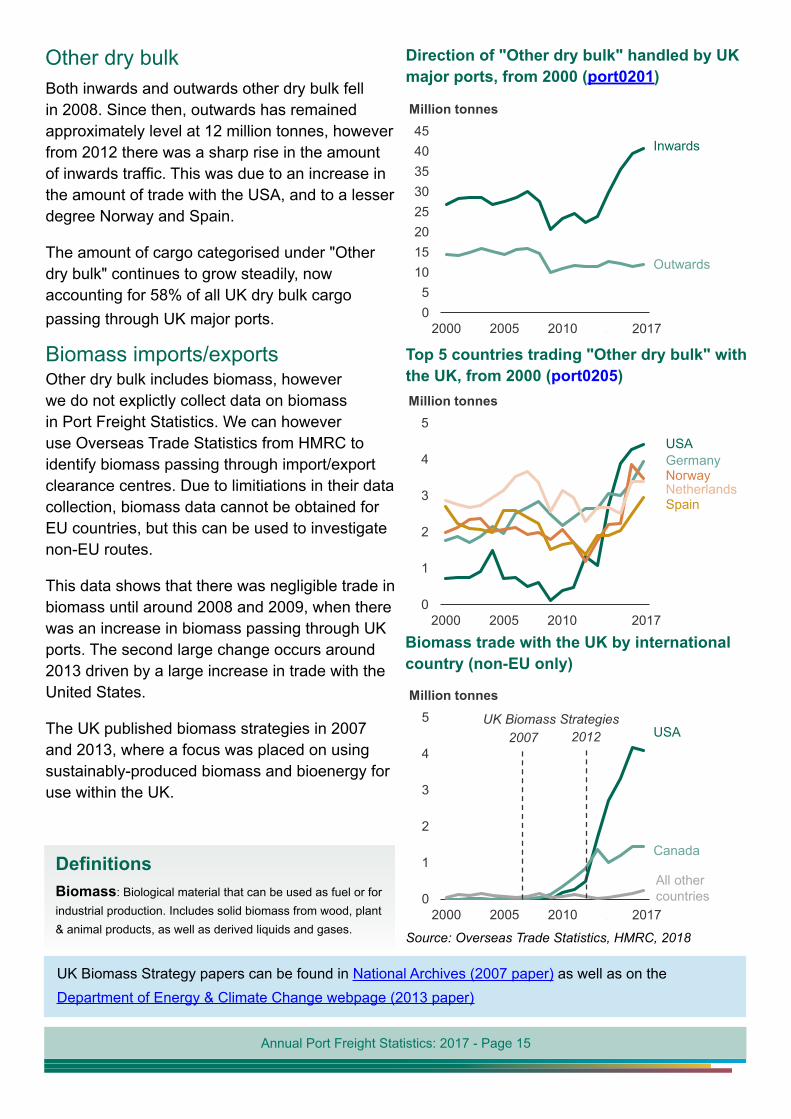
Other dry bulkBoth inwards and outwards other dry bulk fell in 2008. Since then, outwards has remained approximately level at 12 million tonnes, however from 2012 there was a sharp rise in the amount of inwards traffic. This was due to an increase in the amount of trade with the USA, and to a lesser degree Norway and Spain.
The amount of cargo categorised under "Other dry bulk" continues to grow steadily, now accounting for 58% of all UK dry bulk cargo passing through UK major ports.
Direction of "Other dry bulk" handled by UK major ports, from 2000 (port0201)
05
1015202530354045
2000 2005 2010 2015
Outwards
Inwards
2017
Million tonnes
Biomass imports/exportsOther dry bulk includes biomass, however we do not explictly collect data on biomass in Port Freight Statistics. We can however use Overseas Trade Statistics from HMRC to identify biomass passing through import/export clearance centres. Due to limitiations in their data collection, biomass data cannot be obtained for EU countries, but this can be used to investigate non-EU routes.
This data shows that there was negligible trade in biomass until around 2008 and 2009, when there was an increase in biomass passing through UK ports. The second large change occurs around 2013 driven by a large increase in trade with the United States.
The UK published biomass strategies in 2007 and 2013, where a focus was placed on using sustainably-produced biomass and bioenergy for use within the UK.
0
1
2
3
4
5
2000 2005 2010 2015
GermanyUSA
2017
Million tonnes
NorwayNetherlandsSpain
Source: Overseas Trade Statistics, HMRC, 2018
Biomass trade with the UK by international country (non-EU only)
0
1
2
3
4
5
2000 2005 2010 2015
Canada
USA
2017
Million tonnes
All other countries
UK Biomass Strategies2007 2012
DefinitionsBiomass: Biological material that can be used as fuel or for industrial production. Includes solid biomass from wood, plant & animal products, as well as derived liquids and gases.
UK Biomass Strategy papers can be found in National Archives (2007 paper) as well as on the Department of Energy & Climate Change webpage (2013 paper)
Top 5 countries trading "Other dry bulk" with the UK, from 2000 (port0205)


All values
Annual Port Freight Statistics: 2017 - Page 17
Ro-Ro Main FreightRo-Ro main freight tonnage passing through UK major ports has been steadily increasing since 2013. Between 2013 to 2017 this rose 14% to 100.8 million tonnes. Dover also saw a rise in 2017, rising 9% to 2.9 million units in 2017, retaining its position as the largest Ro-Ro port in the UK. This is also the largest increase of any port in this category.
International Ro-Ro Main freight units, 2017
Inwards OutwardsThousand Units
France: 1,498.2
Netherlands: 718.0
Irish Republic: 463.4
Belgium: 355.9Other EU: 169.7
Non-EU Europe: 9.2Other Regions: 0.9
EU: 3,205.2
UK: 3,215.3
UK: 3,260.0
EU: 3,247.2
France: 1,602.7
Netherlands: 670.2
Irish Republic: 470.0
Belgium: 333.3Other EU: 171.1
Non-EU Europe: 9.8Other Regions: 5.0
Top 10 UK major ports handing Ro-Ro main freight, and 2016 to 2017 comparison (port0303)
DoverGrimsby & ImminghamLondon
Belfast
LiverpoolHolyhead
Harwich
HeyshamFelixstowe
Portsmouth
1DoverGrimsby & Immingham
LiverpoolLondon
Belfast
Holyhead
Harwich
HeyshamPortsmouthFelixstowe
2016 2017
Increasedranking
DecreasedrankingStable ranking
2
3
5
4
6
7
8
9
10
1
2
3
5
4
6
7
8
9
10
2,891.5872.5
572.5
539.5
537.0
450.3
334.8
281.2
264.9
232.1
2,641.9853.0
538.7
536.1
530.7
422.6
354.5
249.7
244.2
243.4
All other UK major ports 1,292.9 All other UK major ports1,312.6
Thousand Units
Thousand UnitsRank
Detailed statistics on freight traffic (unitised) can be found in the statistical data sets PORT0201, and PORT0301.


Annual Port Freight Statistics: 2017 - Page 19
UK major ports: tonnage by cargo category, 2017
54.0 million tonnes(Grimsby & Immingham)
2.1 million tonnes(Shoreham)
Dry bulk & Other general cargo
Liquid bulk
Ro-Ro
Lo-Lo
Grimsby &Immingham
London
Southampton
Liverpool
Milford Haven
Felixstowe
Tees &Hartlepool
Forth
Dover
Belfast
RiversHull &Humber
Hull
Clyde
Bristol
Medway
Port Talbot
Manchester
Glensanda
Holyhead
Sullom Voe
Orkney
Harwich
Heysham
Aberdeen
Portsmouth
Newport
Warrenpoint
Tyne
LarneCairnryan
LochRyan
Plymouth
Ipswich
Shoreham
Other major ports
Minor ports
!
!
!
!
!
!
!
!
!
!
!!
!
! !!
!
!
!
!
!
!
!
!
!
!
!
!!
!!
!
!
!
* All ports marked on map handled over 2 million tonnes of freight in 2017.© Crown copyright. All rights reserved. Department for Transport 2018.
Made with Natural Earth.

Annual Port Freight Statistics: 2017 - Page 20
Domestic tonnage (between two UK major ports or one-port traffic) amounted to 90.5 million tonnes in 2017, which was 19% of all tonnage through UK major ports, a fall of 2 percentage points from 2016.
International tonnage handled by UK major ports rose 2% to 380.1 million tonnes in 2017. The majority of this was with the European Union (EU), a total of 207.6 million tonnes. This figure remained unchanged compared to 2016, and accounted for 55% of all international cargo moved.
A total of 65.8 million tonnes was handled between UK major ports and ports in European and Mediterranean countries that are not part of the EU. This is a rise of 9% from 2016, largely due to a 12% increase in the amount of liquid bulk cargo that is imported from those countries in 2017. Amongst these countries, we see an increase in the amount of crude oil being imported from Russia (up 71% to 3.1 million tonnes), Libya (more than doubled to 2.7 million tonnes), and Algeria (up 33% to 3.8 million tonnes).
4. Port Freight by Route
UK major port freight with world regions by direction, 2017 and comparison with 2016
0 50 100 150050100150
EU
Imports ExportsMilliontonnes
116.7Other Non-EU Europe
and MediterraneanAsia
Americas
Africa
Australasia
57.3 10%
28.7 10%
32.0 2%
6.3 22%
2.5 52%
8.6 3%
24.0 8%
10.8 12%
2.1 13%
0.3 45%
90.9 1%
DefinitionsDomestic: Made up of coastwise and one-port traffic (see below).
Coastwise: Traffic travelling within UK waters between ports in the United Kingdom.
One-port: Sand and gravel etc dredged from sea bed and landed at a port for commercial purposes; and traffic to and from UK offshore locations eg oil & gas installations and wind farms.
Detailed statistics on freight traffic by route can be found in tables PORT0204, PORT0205, PORT0206, and PORT0302. A detailed filterable breakdown of port and country can be found in PORT0499.

Annual Port Freight Statistics: 2017 - Page 21
International traffic by cargo type and world region, 2017
Liquid Bulk traffic by world region, 2017
EU
Other Non-EUEurope
Asia
Americas
Africa
Australasia
66.1
42.4
25.1
15.5
6.0
0.2
MillionTonnes155.2
Liquid Bulk
Dry Bulk traffic by world region, 2017
EU
Americas
Other Non-EUEurope
Asia
Australasia
Africa
26.3
19.3
15.1
2.2
1.7
0.9
MillionTonnes65.5
Dry Bulk
Lift-on Lift-off traffic by world region, 2017
Asia
EU
Americas
Other Non-EUEurope
Africa
Australasia
23.8
23.4
6.3
5.1
1.2
0.7
MillionTonnes60.4
Lift-On Lift-Off
Roll-on roll-off traffic by world region, 2017
EU
Other Non-EUEurope
Americas
Asia
Australasia
Africa
80.9
0.7
0.5
0.5
0.1
0.1
MillionTonnes82.8
Roll-On Roll-Off
Other General Cargo by world region, 2017
EU
Other Non-EUEurope
Asia
Americas
Africa
Australasia
11.0
2.5
1.2
1.1
0.2
0.1
MillionTonnes16.2
Other Cargo
International traffic through UK major ports continues to be dominated by liquid bulk traffic, a total of 155.2 million tonnes. 70% of the liquid bulk passing through UK major ports to or from countries in Europe, both EU and non-EU.
Containerised (lift-on/lift-off) traffic is the only cargo group where the EU is not the number one trading partner. 23.8 million tonnes of our containers are to or from Asia, predominantly China. 23.4 tonnes of containers were to or from the EU, however, some of this cargo may have originated in other countries, but then stopped at a European port such as Rotterdam, and was "trans-shipped" to a UK port.


Source: Digest of UK Energy Statistics 2018, table 6.4


deep sea


short sea

Annual Port Freight Statistics: 2017 - Page 29
Liquid Bulk ExportsExports to Asia increased 34% since 2016 to 13.1 million tonnes in 2017. The largest contributor to this change has been an increase in the exports to South Korea, up to 5.2 million tonnes in 2017 from 2.1 million tonnes in 2016. The majority of this increase is in the form of crude oil. This increase is entirely due to crude oil exports.
Exports to the American continent have been steadily decreasing to its current low of 6.7 million tonnes, down 17% from 2016. 67% of this was with the United States of America: 3.8 million tonnes of oil products and 0.6 million tonnes of crude oil were sent to the USA in 2017. 136 thousand tonnes of crude oil were also sent to the US Virgin Islands for the first time since 2011.
In addition to US territories, 0.5 million tonnes of crude oil were set to Canada in 2017, down by 52% from 2016.
Liquid bulk exports to top 3 deep sea regions, from 2000 (port0499)
05
1015202530354045
2000 2005 2010 2015
Americas
Asia
2017
Africa
Million tonnes
Containerised TrafficA total of 5.3 million TEU was transported to/from UK major ports and deep sea ports. 47% of these are to/from China, 2.5 million TEU in total, down 1% from 2016. Of this total, 1.3 million TEU of goods were imported into UK major ports, and 1.2 million TEU were exported.
Container traffic with Singapore rose 26% to 408 thousand TEU in 2017. This is mostly due to a 35% increase in imports from Singapore over that time to 189 thousand TEU.
Containerised traffic with the United States of America fell 1% to 402 thousand TEU. The amount imported from the USA however rose by 3% to 233 thousand TEU.
Deep sea containerised traffic with the UK in TEU - Rank and change from 2016 (port0205)
1China
USA
Singapore
Malaysia
India
Hong Kong
Sri Lanka
U.A.E.
Canada
South Korea Top 10
2016 2017
Increasedranking
Decreasedranking
Stable ranking
2
3
5
4
6
7
8
9
10
China
Singapore
USA
Malaysia
India
Hong Kong
South Korea
Sri Lanka
Canada
U.A.E.
1
2
3
5
4
6
7
8
9
10

Annual Port Freight Statistics: 2017 - Page 30
UK major ports: domestic and international tonnage, 2017
Minor ports
Other major ports
54.0 million tonnes(Grimsby & Immingham)
2.1 million tonnes(Shoreham)
UK Domestic
European Union
Non-EU Europe
Deep Sea
Grimsby &Immingham
London
Southampton
Liverpool
Milford HavenFelixstowe
Tees &Hartlepool
Forth
Dover
Belfast
RiversHull &
Humber
Hull
Clyde
Bristol
Medway
Port Talbot
Manchester
Glensanda
Holyhead
Sullom Voe
Orkney
Harwich
Heysham
Aberdeen
Portsmouth
Newport
Warrenpoint
Tyne
LarneCairnryan
Loch Ryan
Plymouth
Ipswich
Shoreham
!
!
!
!
!
!
!
!
!
!
!!
!
! !!
!
!
!
!
!
!
!
!
!
!
!
!!
!!
!
!
!
* All ports marked on map handled over 2 million tonnes of freight in 2017.© Crown copyright. All rights reserved. Department for Transport 2018.
Made with Natural Earth.

Annual Port Freight Statistics: 2017 - Page 31
A total of 116.0 thousand cargo carrying vessels arrived at UK ports in 2017, 3% lower than the 119.7 thousand vessels in 2016. This was also 11% lower than the recent peak of 130.1 thousand vessels in 2013. These figures exclude 'other' vessels to ensure a comparable time series.
Ro-Ro vessels were the most common vessel to arrive at UK ports, with 63.6 thousand arrivals in 2017, down 1% from 2016. The next numerous arrivals were by closed-cellular container vessels, making 8.7 thousand arrivals, a figure which is unchanged from 2016.
In terms of deadweight tonnage (dwt.) however, closed-cellular container vessels have provided an increasing fraction of UK port freight arrivals, rising from 281.5 million dwt. in 2013 to 388.4 million dwt. in 2017, a rise of 38%. This places closed-cellular containers as the second most numerous vessel type in terms of deadweight tonnage in 2017, only just behind Ro-Ro vessels (390.0 million dwt.)
Tankers saw a fall in provided deadweight tonnage from a peak of 444.7 million dwt. in 2010, and stabilised between 2014 to 2017, to around 340 million dwt.
5. Arrivals Data DefinitionsDeadweight tonnage: is theweight of cargo, stores, fuel, passengers and crew carried by the ship when loaded to its maximum summer loadline.
Deadweight tonnage arriving at UK ports by ship type from 2009 (port0603)
0
50
100
150
200
250
300
350
400
450
500
2009 2012 2014 2017
Million deadweight tonnes
Ro-RoCellular containersTankers
Other dry cargo
Other
Passenger
Cargo vessel arrivals at UK ports since 1994 (port0602)
020406080
100120140160180
1994 2000 2005 2010 2017
Thousand vesselsBreak in time series(2009)
Vessels arriving at UK ports by ship type, 2017 (port0601)
0 20 40 60 80 100Thousand vessels
Ro-Ro
Cellular containers
Tankers
Other dry cargo
Other
Passenger
Detailed statistics on the number of vessel arrivals can be found in the statistical data sets, PORT0601, PORT0602 and PORT0603. These statistics on the number of arrivals are not classified as National Statistics.

Annual Port Freight Statistics: 2017 - Page 32
• The port freight statistics relate to traffic travelling to and from ports in the United Kingdom,unless otherwise stated, and do not cover ports in the Isle of Man or the Channel Islands.
• Final port freight statistics are published 9 months after the year end. At this stage a fullreconciliation of port and shipping agent data will have been carried out, and the grossingprocedures described in the Technical Note are completed and checked. The detailed resultsin this release are based on the grossed data and the full range of analyses, including those byroute and vessel type, are then available.
• Arrivals statistics are not, at present, National Statistics. All of our other port freight statisticshave been certified as meeting the standards of the Office of Statistics Regulation, and are thusNational Statistics.
Section 6: Strengths and Weaknesses of the Data
Section 7: Glossary
• Lo-Lo (lift-on lift-off) containers: standard shipping containers that are lifted on or off ships.Containers can also be carried on Ro-Ro (roll-on roll-off) services, usually on port-to-porttrailers, road goods vehicles or unaccompanied trailers, in which case they will be treated asRo-Ro traffic.
• Major ports: Ports handling over one million tonnes per year, and a small number of other keyports, together accounting for over 98% of UK port traffic. More detailed statistics are collectedfrom these ports.
• Minor ports: All other ports handling freight traffic. Only total weight of goods loaded andunloaded is collected from these ports.
• Tonnage: The weight of goods transported, including crates and other packaging, but excludingthe unloaded weight of any shipping containers, road goods vehicles, trailers and other items oftransport equipment where these are used.
• Units: Includes all roll-on roll-off (Ro-Ro) units whether carrying freight or not (road goodsvehicles, unaccompanied trailers, shipborne port-to-port trailers, passenger vehicles, tradevehicles, and other Ro-Ro units), as well as lift-on lift-off (Lo-Lo) containers. In most portstatistics outputs, freight-carrying roll-on roll-off units are normally reported separately fromothers, but this detail is not available at the time of publication of the quarterly statistics, inwhich combined totals are given.

Annual Port Freight Statistics: 2017 - Page 33
These statistics are collected to provide information on trends and patterns in the handling of freight traffic at UK sea ports. Users of the data include central government, the devolved administrations and local government, the maritime industry, transport consultants and academics, and international organisations.
These statistics are used both inside and outside government to aid decision making, including:
• To provide general background to sector trends, and to inform the development andevaluation of policy, and to inform decision making.
• In the development or testing of transport and environmental models and forecasts.
• In market analysis by transport consultants and businesses.
• To respond to requests for information from Parliament, members of the public andinternational organisations, including Eurostat’s compilation of maritime statistics for theEU.
For example, recently these statistics have been used to inform:
• The Transport Connectivity to Ports Review of the current status and future infrastructurerecommendations1
• Promotional materials and handbooks for London International Shipping Week2
1 www.gov.uk/government/publications/transport-connectivity-to-ports-review-of-the-current-status-and-future-infrastructure-
recommendations2 londoninternationalshippingweek.com/
We welcome any feedback on these statistics by email to [email protected].
Section 8: Users and Uses of the Data
Section 9: Background Notes
• The web tables and charts give further detail of the key results presented in this statisticalrelease. They are available here: Ports statistics.
• Full guidance on the methods used to compile these statistics can be found here: notes
• National Statistics are produced to high professional standards set out in the Code of Practicefor Statistics. They undergo regular quality assurance reviews to ensure they meet customerneeds: Code of Practice
• Details of Ministers and officials who receive pre-release access to these statistics up to 24hours before release can be found here: pre-release access list.
• Provisional summary quarterly statistics on freight handled by UK major ports are also updatedquarterly. The latest tables can be found here: Quarterly summary.