consumer trends - honey and maple syrup in japan trends honey and maple syrup in japan ... most...
TRANSCRIPT

International
Markets
Bureau
MARKET INDICATOR REPORT | MAY 2012
Consumer Trends
Honey and Maple Syrup in Japan
EXECUTIVE SUMMARY
INSIDE THIS ISSUE
DID YOU KNOW?
PAGE 2
Consumer Trends Honey and Maple Syrup in Japan
Executive Summary 2
Consumer Trends 3
Retail Trends 5
Maple Syrup 6
Honey 11
Resources 15
SINCE 2008, CANADA HAS
SEEN A SHARP INCREASE IN
EXPORTS OF NATURAL HONEY
INTO JAPAN , WITH EXPORT
VALUES MORE THAN DOUBLING
BY 2011.
CANADA SUPPLIES JAPAN
WITH 99% OF ITS MAPLE SUGAR
AND MAPLE SYRUP.
Japan was the second-largest importer of Canadian maple syrup in 2011 after the United States (U.S.), importing 2.8 million kilograms of maple syrup, worth C$24.3 million. Canada has been Japan’s top supplier of maple syrup since 2005. Japan has been Canada’s top importer of maple sugar since 2008, importing 141,284 kilograms in 2011. In 2011, Japan was also the second-largest importer of natural Canadian honey (after the U.S.), with an import value of C$7.8 million. Retail sales of honey in Japan reached over US$485.4 million in 2011, and are predicted to reach US$492 million by 2016. Less than ideal economic conditions in Japan, combined with the earthquake and tsunami that struck the country in 2011, adversely affected consumer confidence throughout the year. Consumers cut back on unnecessary expenditures, such as impulse and indulgence products. The Bank of Japan has, however, indicated that consumer spending for 2012 thus far has been “unexpectedly robust.” Japan’s Trade Ministry confirmed that retail sales rose by 2.5% in December 2011, which is the largest increase since August 2010. Furthermore, Japan’s retail figures showed that food and clothing were among the items that led to higher retail sales in December. Health consciousness among Japanese consumers has grown, and healthy living campaigns launched by the Japanese government, coupled with the aging of the Japanese population as a whole, mean that this trend is likely to continue in the short to medium term. As a result, convenient and tasty packaged food under the health and wellness umbrella is increasing in popularity. The naturally occurring, health-boosting compounds found in both maple syrup and honey make these products especially attractive. We can also expect to see more sweet and savoury snacks that address the Japanese consumers’ need for indulgence, while still being healthy. In addition, more offerings under private labels will be available in an effort to compete with branded products. Consumers of spreads may turn to premium spreads, if they are positioned as organic/natural or with no artificial sugar added. Expect to see product innovation turn in this direction to better align with consumer demand.

CONSUMER TRENDS
PAGE 3
Japan has recently begun to experience unprecedented income disparity caused by two main drivers: the aging population and the explosion of temporary and part-time workers in the country. Most older Japanese citizens are living on reduced incomes, while temporary and part-time workers are earning much lower salaries than their full-time colleagues. This is causing a growing divide between the rich and poor, splitting the consumer market into ‘first class’ and ‘economy’ sectors. While high-end specialists are expected to continue offering premium products for those who can afford them, supermarkets are expected to respond to the growing number of cost-conscious consumers by introducing cheaper imported products and increasing their private label offerings. Younger consumers are less brand-conscious than older consumers, which is supporting this shift toward private label. Private label foods are not seen as cheap alternatives, but rather as quality ranges offered at a competitive price, due in part to educational marketing strategies that expound the quality of the products. In 2010, the largest single age category in Japan was middle-aged adults (aged 40 to 65), who accounted for 33.7% of the total population, making them a major consumer group. The consumers at the younger end of the demographic range tend to seek products and services that help them enjoy life more, such as entertainment and luxury items, while those at the older end of the spectrum are looking for goods that make them feel better and look younger. An overarching focus on health is driving the demand for health and wellness products, a trend that is expected to continue. According to the World Organic Food and Beverage report, Japan led Asia in 2010 in the consumption of organic food and drink, with a 54% share of the region’s total organic market. This trend is expected to continue, as health and wellness products grow in popularity and as the price of organic food and drink declines. Impulse and indulgence products saw an overall decrease in value sales in 2011, as consumers cut back on unnecessary spending. In terms of categories, sweet and savoury snacks, the largest category in Japan’s impulse and indulgence market by value, was the only one to record growth from 2010 to 2011, posting gains in both value (1.3%) and volume (0.9%) terms. Biscuits saw the largest value decline in 2011 at -3%, followed by cakes (-2.5%) and confectionery (-2.4%). Ice cream and biscuits saw the largest volume declines from 2010 to 2011, at -4% and -3%, respectively. However, as consumer confidence returns, impulse and indulgence products are forecast to increase by 2% in constant value by 2016. Domestic manufacturers led the production of impulse and indulgence products in Japan in 2011. Japanese consumers tend to prefer branded indulgence products over private label, as they are perceived to be of higher quality. Sweet and savoury snacks were purchased predominantly through the grocery retailer format, followed by supermarkets/hypermarkets. Women in particular tended to buy sweets occasionally as a treat or as a reward on special occasions. Female consumers are gaining in importance in Japan as they become more financially independent and career-focused. In response, domestic marketers are striving to target ad campaigns to this demographic. Japan Today published an article in January, 2012, describing a new food fad in the country: B-grade cuisine. B-grade cuisine is the antithesis to traditional fine dining. It is usually regionally based and tends to feature simple ingredients chosen because they taste good, sometimes in unusual combinations. These dishes are tasty and cheap and have become so popular that there are many restaurants offering samples of the best of B-grade food from across Japan. One very popular dish is Shiro-noir, a warm Danish pastry, topped with whipped ice cream and covered in maple syrup. This treat can be found at Japan’s Nagoya coffeehouse chain. Awareness and usage of functional foods is significant in the Asia-Pacific region. Several functional foods form part of the average diet in this region. For a consumer to adopt or increase their use of a functional food, they need to be able to identify and validate the health benefits of that product. The natural origin and limited processing of both maple syrup and honey could place both products in the functional food category, if promoted as a substitute for traditional sugar and sweeteners.

Packaging and presentation are also very important to the Japanese consumer. Small packages are preferred. Many domestic alcoholic beverage manufacturers, for example, have been capitalizing on this trend. Bottles of wine can be purchased in sizes ranging from 50 ml to 375 ml. Veuve Clicquot experienced skyrocketing sales in Japan by simply adding attractive packaging, such as a colour-coordinated box, wrapping paper, ribbon and a signature shopping bag. Without attractive packaging, these beverages are seen as bland. Many Japanese buy Canadian maple syrup, not only for their own consumption, but also as a gift; the combination of gift-friendly presentation and smaller bottles may be beneficial in an already popular Japanese maple syrup market.
PAGE 4
Region City Urban Population
(millions)
Kanto Tokyo 8.8
Kanto Yokohama 3.7
Kansai Osaka 2.6
Chubu Nagoya 2.2
Hokkaido Sapporo 1.9
Kansai Kobe 1.5
Kansai Kyoto 1.5
Kyushu Fukuoka 1.4
Kanto Kawasaki 1.4
Chugoku Hiroshima 1.2
Japan – Urban Population by City
CONSUMER TRENDS (continued)
Tokyo, Japan. Source: Shutterstock.
Region 2006 2007 2008 2009 2010 2011
Chubu 63,451.1 64,962.8 72,620.8 80,179.7 83,278.3 90,250.1
Chugoku 20,274.0 20,343.9 23,079.0 25,340.8 26,173.2 28,206.5
Hokkaido 14,545.1 15,044.1 16,745.9 18,336.4 18,887.1 20,303.3
Kanto 118,555.5 118,795.7 133,497.9 147,804.9 153,953.5 167,323.1
Kansai 66,127.0 65,844.1 76,253.4 84,025.9 87,096.5 94,227.4
Kyushu 33,482.0 33,079.6 37,439.3 41,083.5 42,418.1 45,718.4
Okinawa 2,637.0 2,628.7 2,948.7 3,269.7 3,412.5 3,718.4
Shikoku 10,421.8 10,792.3 12,585.1 13,792.0 14,217.8 15,292.1
Tohoku 23,097.0 24,390.4 26,710.5 29,233.1 30,094.7 32,327.5
Total 352,590.6 355,881.5 401,880.6 443,065.9 459,531.6 497,366.8
Japan – Consumer Expenditure on Food and Non-Alcoholic Beverages by Region – US$ millions
Source for all: Euromonitor International, 2012.
Japan – Consumer Expenditure on Food and Non-Alcoholic Beverages by Region – US$ per Household
Region 2006 2007 2008 2009 2010 2011 Hokkaido 6,121.3 6,318.1 7,025.4 7,691.4 7,925.9 8,529.6
Kyushu 6,509.3 6,409.1 7,232.8 7,917.8 8,158.9 8,780.3
Okinawa 5,329.1 5,231.4 5,784.1 6,327.4 6,517.2 7,013.5
Shikoku 6,587.8 6,807.3 7,927.8 8,683.2 8,950.8 9,632.6
Tohoku 6,924.3 7,306.2 8,001.4 8,763.4 9,033.2 9,721.3
Kanto 7,340.1 7,273.6 8,085.3 8,857.9 9,132.5 9,828.1
Kansai 7,448.5 7,367.3 8,476.8 9,283.2 9,568.3 10,297.1
Chubu 7,418.8 7,531.0 8,350.2 9,147.8 9,431.2 10,149.5
Average 7,131.8 7,146.1 8,014.5 8,779.1 9,050.6 9,740.8
PAGE 5
RETAIL TRENDS
In 2011, the Japanese population preferred to purchase spreads (including honey) from
grocery retailers, which accounted for 83% of total spread sales, followed by supermarkets/hypermarkets.
Major grocery chains in Japan have responded to consumer demands for better value for money by
cutting prices and expanding private label offerings. To achieve this, both the Ito Yokado and Seiyu chains are utilizing economies of scale and global supply reach to guarantee lower pricing.
In Japan, there is no equivalent to the European discounter format. The typical consumer of low-cost items
in Japan often shops in variety stores and ‘Gyomu’ supermarkets (supermarkets that sell foodservice-oriented products to retail customers). Due to the well-established variety store format, there is very limited
penetration of hypermarkets or forecourt retailers in Japan. The Retail Law introduced in Japan in 2000 also restricted larger retail outlets.
Convenience retail is well established in Japan, enjoying four decades of value sales growth, largely due to their easily accessible locations and ample parking. However, this trend changed in 2010, when value sales declined by 1%. This dip was attributed to a decrease in consumption. To counter this decline, convenience stores have implemented discount pricing and adopted a wider range of private label offerings. The Japan Franchise Association reported that both Aeon Co. and the convenience store chain Lawson Inc. posted record operating profits for the nine months ending November 30, 2011. While international retail chains have a limited presence in Japan, Seiyu Ltd., a Wal-Mart-owned company, has greatly influenced retailing in Japan. The introduction of private label by Seiyu, combined with the offering of non-grocery items, were the key influences driving other domestic players. Small grocery retailers are being squeezed out of the market by larger chains in Japan, as modern consumers continue to move toward one-stop shopping. This struggle with chained retailers is forecast to continue into the future. The country’s older consumers, who often shop in the more traditional outlets, are declining in number, while the large baby boom generation prefers more modern retail formats, a trend that is expected to continue. It is therefore expected that this grocery channel will weaken in the long term.
Store Grocery Banner
Sales (US$)
Non-Grocery
Banner Sales (US$)
Share (%) of Total Grocery
Market
Number of
Outlets
Sales Area
(square feet)
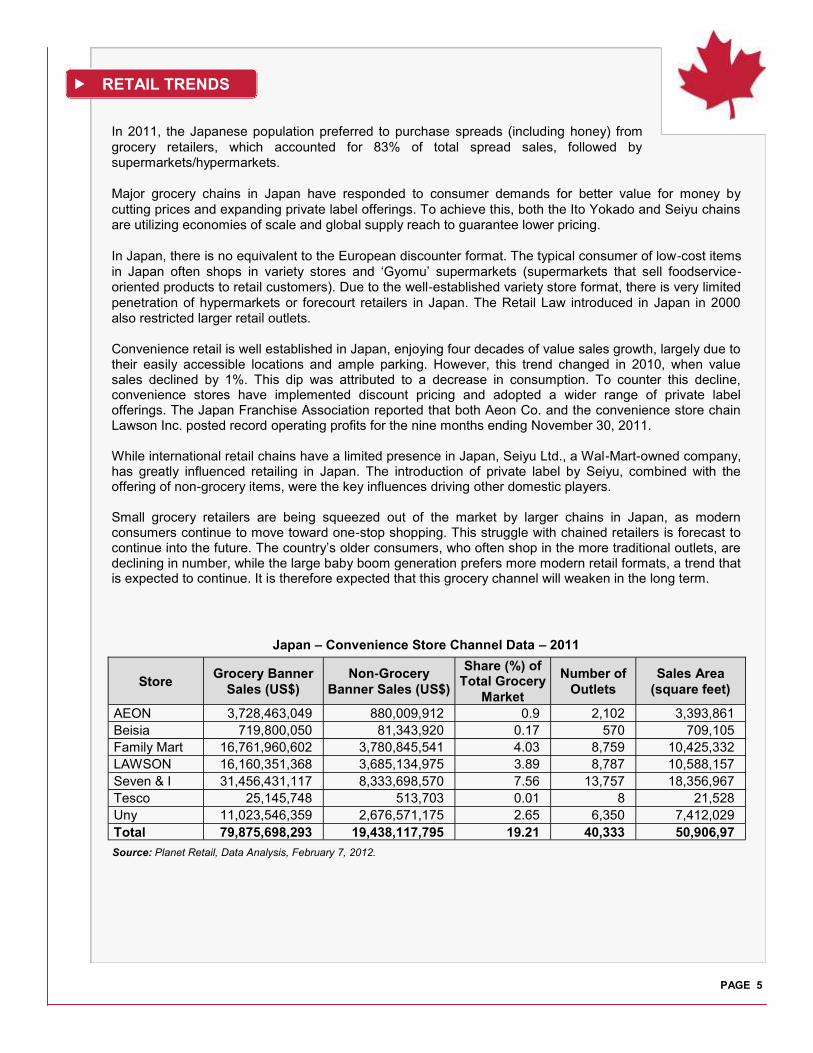
AEON 3,728,463,049 880,009,912 0.9 2,102 3,393,861
Beisia 719,800,050 81,343,920 0.17 570 709,105
Family Mart 16,761,960,602 3,780,845,541 4.03 8,759 10,425,332
LAWSON 16,160,351,368 3,685,134,975 3.89 8,787 10,588,157
Seven & I 31,456,431,117 8,333,698,570 7.56 13,757 18,356,967
Tesco 25,145,748 513,703 0.01 8 21,528
Uny 11,023,546,359 2,676,571,175 2.65 6,350 7,412,029
Total 79,875,698,293 19,438,117,795 19.21 40,333 50,906,97
Japan – Convenience Store Channel Data – 2011
Source: Planet Retail, Data Analysis, February 7, 2012.

PAGE 6
*Note: Indicated companies also include ‘Neighbourhood Store’ format. Source: Planet Retail, Data Analysis, February 7, 2012.
Japan – Supermarkets Channel Data – 2011
Canadian maple syrup is often seen as an “organic,” “additive-free,” or “natural” product. This, combined with consumers’ desire to incorporate more of these food products into their diet, makes maple syrup a popular product in Japan.
Japanese consumers are very loyal to Canadian-branded maple syrup. These discerning consumers appreciate the differentiating characteristics embodied by each type of maple syrup, from lighter grade varieties, to those that are darker in colour. In Japan, honey and maple syrup are preferred by natural-food lovers and by users of Eastern medicine. Both products can be used to sweeten traditional Japanese medicine when it is too bitter. In these cases, both honey and maple syrup are favoured over sugar, because they are more easily digested.
Company Grocery Banner
Sales (US$)
Non-Grocery
Banner Sales (US$)
Share (%) of Total Grocery
Market
Number of
Outlets
AEON 22,614,021,430 501,620,585 5.44 1,307
H2O Retailing 967,332,675 134,973,320 0.23 57
H2O Retailing* 252,877,516 16,826,927 0.06 25
Heiwado 870,020,188 17,773,650 0.21 61
Inagaya 2,082,383,363 42,541,029 0.5 130
Isetan Mitsukoshi 526,854,745 76,682,198 0.13 20
Izumi 166,517,295 24,236,115 0.04 14
Isumiya 773,627,641 31,956,794 0.19 53
J. Front Retailing 1,290,109,706 187,771,770 0.31 85
Life* 5,844,945,245 585,781,957 1.41 225
Okuwa 2,925,527,152 59,765,621 0.7 144
Seven & I 1,913,668,620 39,094,354 0.46 90
Tesco 632,490,619 12,921,157 0.15 58
Uny 137,170,467 2,802,257 0.03 10
Valor 2,854,453,410 415,457,513 0.69 212
Calmart 931,340,356 135,553,920 0.22 79
Zen Nisshoku 3,861,276,725 78,882,058 0.93 1,782
RETAIL TRENDS (continued)
MAPLE SYRUP

PAGE 7
Canadian Trade Performance
MAPLE SYRUP (continued)
Canada’s Top 10 Export Markets for Maple Sugar by Value – C$
Canada’s Top 10 Export Markets for Maple Sugar by Volume – KG
Rank Partner Country 2006 2007 2008 2009 2010 2011
World 187,535,856 213,536,247 227,664,178 247,921,649 226,618,788 238,099,142
1 United States 136,148,326 152,309,660 155,437,126 167,352,950 142,546,482 150,300,017
2 Japan 17,652,601 18,307,223 20,905,665 19,675,220 25,658,705 24,330,184
3 Germany 10,984,524 15,743,403 15,400,713 16,303,810 15,428,669 17,220,459
4 United Kingdom 3,603,441 4,203,003 10,005,861 12,931,979 9,559,161 10,450,534
5 France 4,879,854 5,051,901 6,050,760 7,651,301 7,499,010 8,143,516
6 Australia 3,731,819 4,737,382 5,398,831 8,128,896 6,830,995 6,619,020
7 Korea, South 1,032,198 2,026,880 1,691,645 2,066,720 2,937,698 5,657,799
8 Denmark 2,136,990 2,371,541 2,344,185 2,945,921 3,509,272 4,017,346
9 Netherlands 1,662,410 1,880,788 1,750,634 2,130,572 2,230,490 1,908,449
10 Switzerland 1,809,746 2,111,789 2,234,033 2,107,518 2,605,827 1,871,045
Canada’s Top 10 Export Markets for Maple Syrup by Value – C$
Source for all: Global Trade Atlas, 2012.
Rank Partner Country 2006 2007 2008 2009 2010 2011
World 382,020 491,831 428,478 399,137 347,913 299,990
1 Japan 131,368 131,368 243,113 218,750 115,037 141,284
2 United States 167,317 167,317 109,136 62,631 57,868 43,809
3 Germany 5,563 5,563 26,194 10,207 14,199 51,157
4 United Kingdom 123 123 19,355 11,952 15,405 2,309
5 Australia 4,129 4,129 16,025 99 50 3,487
6 Netherlands Antilles 10,037 10,037 0 0 0 0
7 France 37,052 37,052 28,753 13,318 61,465 4,461
8 Taiwan 1,302 1,302 6,338 2,795 2,980 1,298
9 Spain 0 0 2,963 0 0 0
10 Switzerland 15,130 15,130 20,436 2,053 540 8,882
Rank Partner Country 2006 2007 2008 2009 2010 2011
World 3,087,928 4,094,745 6,074,671 4,806,516 4,679,425 4,021,785
1 Japan 1,376,339 2,445,589 3,706,772 1,993,831 2,434,204 2,201,731
2 United States 1,002,572 791,674 592,004 514,718 446,978 653,125
3 Germany 26,737 131,521 77,394 111,121 796,075 464,554
4 United Kingdom 896 120,695 124,989 137,042 33,989 169,075
5 Australia 49,700 80,554 1,795 756 52,313 153,603
6 France 272,886 268,040 150,351 638,239 81,212 95,730
7 Netherlands Antilles 80,495 0 0 0 0 78,491
8 Taiwan 15,719 64,921 50,727 57,359 24,429 69,669
9 Switzerland 183,916 34,056 24,357 8,186 135,880 60,522
10 Denmark 23,112 118,175 1,265,690 1,311,745 620,808 28,170
PAGE 8
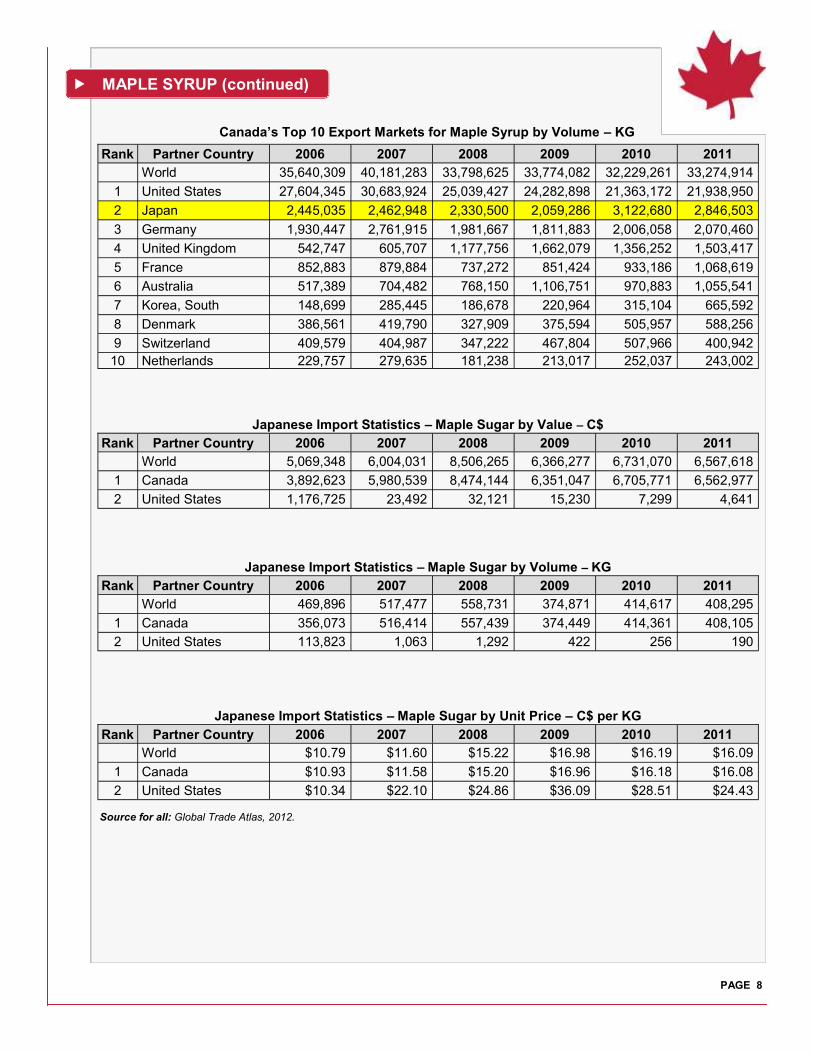
Japanese Import Statistics – Maple Sugar by Value – C$
MAPLE SYRUP (continued)
Canada’s Top 10 Export Markets for Maple Syrup by Volume – KG
Rank Partner Country 2006 2007 2008 2009 2010 2011
World 35,640,309 40,181,283 33,798,625 33,774,082 32,229,261 33,274,914
1 United States 27,604,345 30,683,924 25,039,427 24,282,898 21,363,172 21,938,950
2 Japan 2,445,035 2,462,948 2,330,500 2,059,286 3,122,680 2,846,503
3 Germany 1,930,447 2,761,915 1,981,667 1,811,883 2,006,058 2,070,460
4 United Kingdom 542,747 605,707 1,177,756 1,662,079 1,356,252 1,503,417
5 France 852,883 879,884 737,272 851,424 933,186 1,068,619
6 Australia 517,389 704,482 768,150 1,106,751 970,883 1,055,541
7 Korea, South 148,699 285,445 186,678 220,964 315,104 665,592
8 Denmark 386,561 419,790 327,909 375,594 505,957 588,256
9 Switzerland 409,579 404,987 347,222 467,804 507,966 400,942
10 Netherlands 229,757 279,635 181,238 213,017 252,037 243,002
Rank Partner Country 2006 2007 2008 2009 2010 2011
World 5,069,348 6,004,031 8,506,265 6,366,277 6,731,070 6,567,618
1 Canada 3,892,623 5,980,539 8,474,144 6,351,047 6,705,771 6,562,977
2 United States 1,176,725 23,492 32,121 15,230 7,299 4,641
Japanese Import Statistics – Maple Sugar by Volume – KG
Rank Partner Country 2006 2007 2008 2009 2010 2011
World 469,896 517,477 558,731 374,871 414,617 408,295
1 Canada 356,073 516,414 557,439 374,449 414,361 408,105
2 United States 113,823 1,063 1,292 422 256 190
Japanese Import Statistics – Maple Sugar by Unit Price – C$ per KG
Rank Partner Country 2006 2007 2008 2009 2010 2011
World $10.79 $11.60 $15.22 $16.98 $16.19 $16.09
1 Canada $10.93 $11.58 $15.20 $16.96 $16.18 $16.08
2 United States $10.34 $22.10 $24.86 $36.09 $28.51 $24.43
Source for all: Global Trade Atlas, 2012.
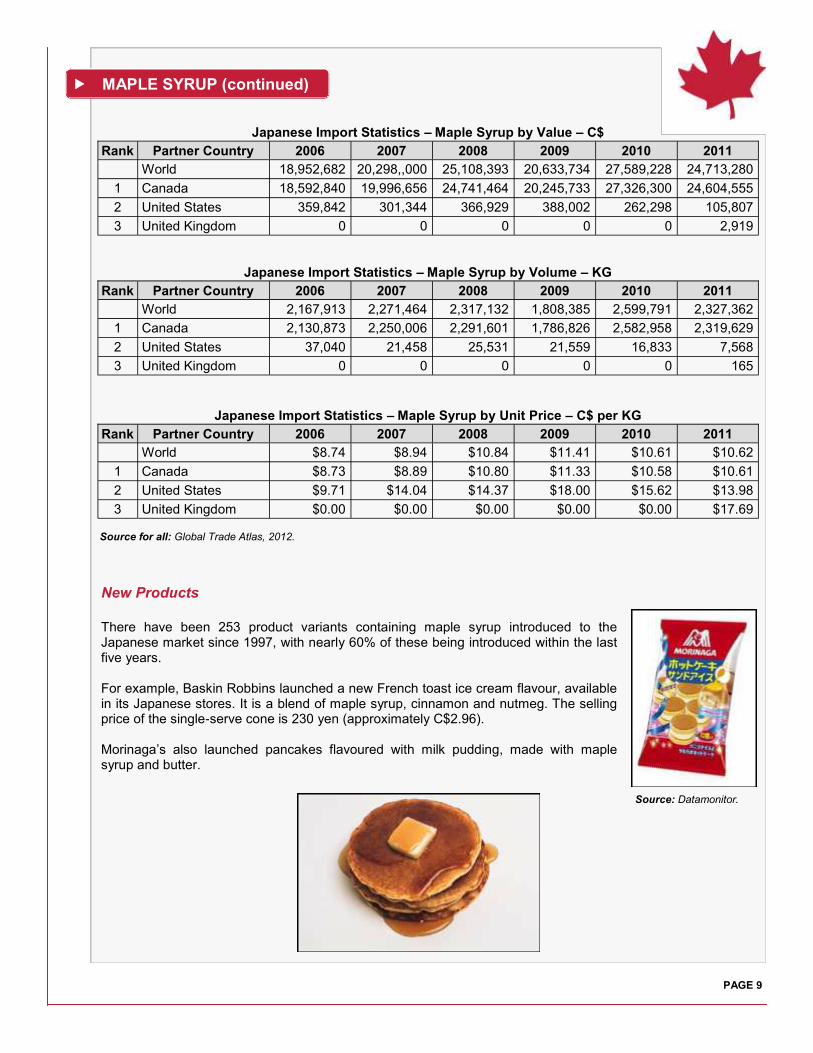
New Products
There have been 253 product variants containing maple syrup introduced to the Japanese market since 1997, with nearly 60% of these being introduced within the last five years. For example, Baskin Robbins launched a new French toast ice cream flavour, available in its Japanese stores. It is a blend of maple syrup, cinnamon and nutmeg. The selling price of the single-serve cone is 230 yen (approximately C$2.96). Morinaga’s also launched pancakes flavoured with milk pudding, made with maple syrup and butter.
Source: Datamonitor.
PAGE 9
Japanese Import Statistics – Maple Syrup by Value – C$
Rank Partner Country 2006 2007 2008 2009 2010 2011
World 18,952,682 20,298,,000 25,108,393 20,633,734 27,589,228 24,713,280
1 Canada 18,592,840 19,996,656 24,741,464 20,245,733 27,326,300 24,604,555
2 United States 359,842 301,344 366,929 388,002 262,298 105,807
3 United Kingdom 0 0 0 0 0 2,919
Japanese Import Statistics – Maple Syrup by Volume – KG
Rank Partner Country 2006 2007 2008 2009 2010 2011
World 2,167,913 2,271,464 2,317,132 1,808,385 2,599,791 2,327,362
1 Canada 2,130,873 2,250,006 2,291,601 1,786,826 2,582,958 2,319,629
2 United States 37,040 21,458 25,531 21,559 16,833 7,568
3 United Kingdom 0 0 0 0 0 165
Japanese Import Statistics – Maple Syrup by Unit Price – C$ per KG
Rank Partner Country 2006 2007 2008 2009 2010 2011
World $8.74 $8.94 $10.84 $11.41 $10.61 $10.62
1 Canada $8.73 $8.89 $10.80 $11.33 $10.58 $10.61
2 United States $9.71 $14.04 $14.37 $18.00 $15.62 $13.98
3 United Kingdom $0.00 $0.00 $0.00 $0.00 $0.00 $17.69
Source for all: Global Trade Atlas, 2012.
MAPLE SYRUP (continued)
PAGE 10
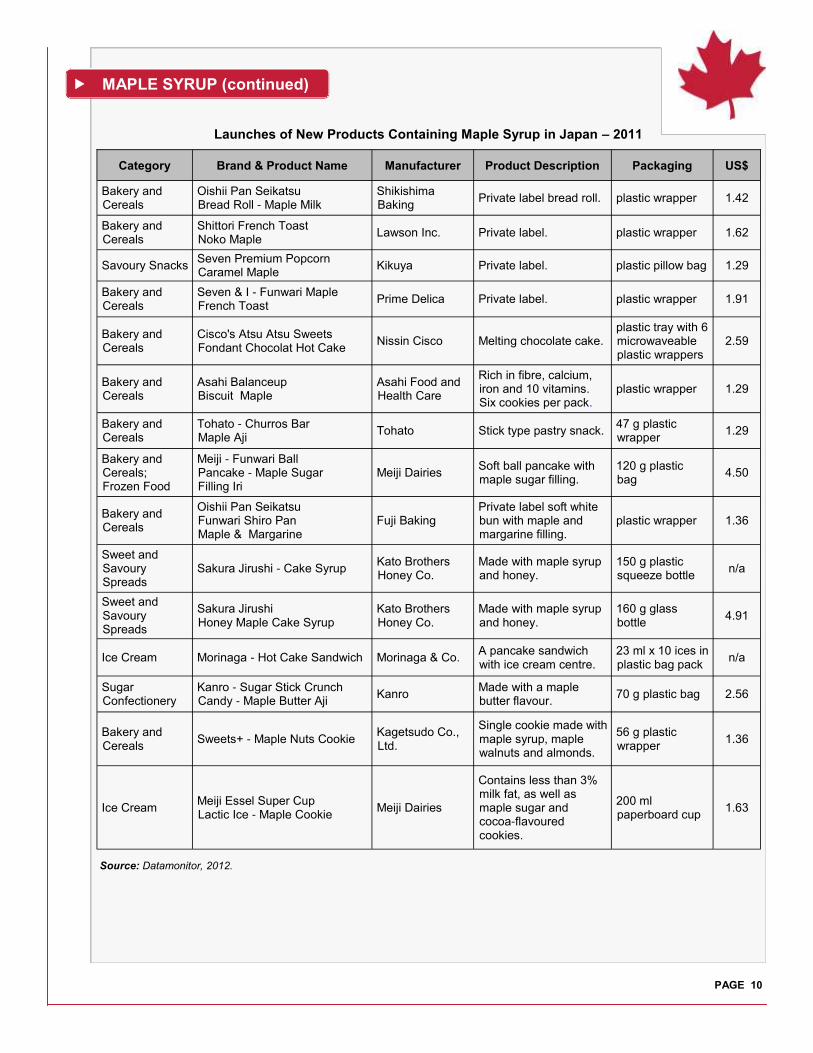
Category Brand & Product Name Manufacturer Product Description Packaging US$
Bakery and Cereals
Oishii Pan Seikatsu Bread Roll - Maple Milk
Shikishima Baking
Private label bread roll. plastic wrapper 1.42
Bakery and Cereals
Shittori French Toast Noko Maple
Lawson Inc. Private label. plastic wrapper 1.62
Savoury Snacks Seven Premium Popcorn Caramel Maple
Kikuya Private label. plastic pillow bag 1.29
Bakery and Cereals
Seven & I - Funwari Maple French Toast
Prime Delica Private label. plastic wrapper 1.91
Bakery and Cereals
Cisco's Atsu Atsu Sweets Fondant Chocolat Hot Cake
Nissin Cisco Melting chocolate cake. plastic tray with 6 microwaveable plastic wrappers
2.59
Bakery and Cereals
Asahi Balanceup Biscuit Maple
Asahi Food and Health Care
Rich in fibre, calcium, iron and 10 vitamins. Six cookies per pack.
plastic wrapper 1.29
Bakery and Cereals
Tohato - Churros Bar Maple Aji
Tohato Stick type pastry snack. 47 g plastic wrapper
1.29
Bakery and Cereals; Frozen Food
Meiji - Funwari Ball Pancake - Maple Sugar Filling Iri
Meiji Dairies Soft ball pancake with maple sugar filling.
120 g plastic bag
4.50
Bakery and Cereals
Oishii Pan Seikatsu Funwari Shiro Pan Maple & Margarine
Fuji Baking Private label soft white bun with maple and margarine filling.
plastic wrapper 1.36
Sweet and Savoury Spreads
Sakura Jirushi - Cake Syrup Kato Brothers Honey Co.
Made with maple syrup and honey.
150 g plastic squeeze bottle
n/a
Sweet and Savoury Spreads
Sakura Jirushi Honey Maple Cake Syrup
Kato Brothers Honey Co.
Made with maple syrup and honey.
160 g glass bottle
4.91
Ice Cream Morinaga - Hot Cake Sandwich Morinaga & Co. A pancake sandwich with ice cream centre.
23 ml x 10 ices in plastic bag pack
n/a
Sugar Confectionery
Kanro - Sugar Stick Crunch Candy - Maple Butter Aji
Kanro Made with a maple butter flavour.
70 g plastic bag 2.56
Bakery and Cereals
Sweets+ - Maple Nuts Cookie Kagetsudo Co., Ltd.
Single cookie made with maple syrup, maple walnuts and almonds.
56 g plastic wrapper
1.36
Ice Cream Meiji Essel Super Cup Lactic Ice - Maple Cookie
Meiji Dairies
Contains less than 3% milk fat, as well as maple sugar and cocoa-flavoured cookies.
200 ml paperboard cup
1.63
Launches of New Products Containing Maple Syrup in Japan – 2011
Source: Datamonitor, 2012.
MAPLE SYRUP (continued)

PAGE 11
According to a Mintel report on sweet and savoury spreads (October 2011), “opportunity exists for developing and positioning honey-based spreads as all natural, HFCS-free [high fructose corn syrup-free] options that cater to consumers’ need for small affordable indulgences.” In the Asia-Pacific region, Japan is second only to China in its honey consumption, and experienced the third-highest market value growth from 2006 to 2011. Datamonitor indicates that honey led all other sub-sectors in the Japanese spreads industry in 2011, with sales of US$485 million. Kato Brothers was the market leader. Japan ranks third in the world for honey imports, behind the United States and Germany, with a value of C$116 million in 2011. An example of honey’s popularity in Japan is seen in Danone’s Bio yogurt product line. The most popular combined flavourings were wild blueberry and strawberry (first), fig (second), and honey apple (third). The combination of the aroma of honey and the crisp texture of apple is thought to be a popular breakfast combination among Japanese consumers. Danone has also been promoting the health benefits of yogurt to achieve product success. The spreads industry in Japan has been adversely affected by lower consumer spending habits, with sales declining by 4% in 2011. In 2012, the trend of trading down to private label food products is expected to affect the spreads industry, spurring a fall in unit prices. The Japanese are becoming increasingly aware of the value of incorporating naturally healthy (NH) foods into their diet. Even though the economic recession had a negative impact on some NH food categories, Japanese consumers have nevertheless continued to purchase naturally healthy products. The value of this category grew by 1% in 2010, reaching US$335 billion. Domestic player, Kato Bros Honey Co. Ltd. led the spreads segment in 2010, with a 17% value share. Kato has been a consistent leader in product innovation; for example, it launched a Café Honey, which promotes the use of honey in place of sugar. The competitive landscape of NH honey is consolidated, with Kato Bros Honey Co. Ltd. and Nippon Hachimitsu Co. Ltd. owning a combined market share of 47% in retail value sales in 2010. International brands remained weak, due to their premium price points, as Japanese consumers were unwilling to spend on products they perceived as unnecessary. Honey is expected to see the smallest decline in value sales of any product in the spread category over the next few years, as Japanese consumer awareness of its health benefits and wide range of uses grows.
HONEY
2006 2011 2016
Retail Value (US$ millions - current prices, fixed 2011 exchange rate)
484.3 485.4 492
Retail Volume (’000 tonnes)
33.8 34.2 33.2
Source: Euromonitor International, 2012.
Japan - Honey Market - Historic/Forecast

Source: Mintel, 2012.
Japan – Sales of Sweet Spreads by Segment Volume in ’000 tonnes – 2009
Canadian Trade Performance
In 2010, the United States was Canada’s biggest importer of honey, followed by Japan. Canada has seen a sharp increase in its exports of natural honey to Japan since 2008, with export value increasing over 500% from 2007 to 2008. In 2011, however, Canada’s export of natural honey to Japan dropped in value by more than 20% compared to 2010 figures. A further analysis shows that the total quantity of honey Canada exported to Japan in 2011 fell by more than 30% from 2010 figures. Gourmet Canadiana Cheena is a major importer and distributor of Canadian products in Japan, such as smoked salmon and maple syrup. Ng Wah International Development Ltd. also imports and distributes a wide variety of Canadian foods.
PAGE 12
HONEY (continued)
Canada’s Top 10 Export Markets for Natural Honey by Value – C$
Rank Partner Country 2006 2007 2008 2009 2010 2011
World 33,381,062 38,787,627 70,934,458 47,829,402 57,834,308 38,997,534
1 United States 28,976,395 33,036,701 55,359,935 33,691,789 41,616,573 28,004,530
2 Japan 784,668 975,265 5,127,445 6,714,312 9,848,183 7,860,065
3 China 31,201 587,811 554,654 1,530,989 1,126,516 972,818
4 United Kingdom 170,410 97,326 758,683 571,813 417,331 491,566
5 Germany 1,948,789 1,712,498 2,430,474 1,914,990 2,669,229 450,661
6 Hong Kong 8,352 20,774 105,665 84,702 215,348 367,799
7 France 434,378 200,187 255,889 341,638 267,623 262,207
8 Australia 0 971,516 4,814,469 2,259,844 230,247 154,119
9 India 53,464 0 40,841 30,141 0 104,447
10 Barbados 159,371 135,184 204,624 87,404 134,755 68,759
Source: Global Trade Atlas, 2012.
10
20
30
40
50
0
Choco
late
Spre
ad
Pea
nut
Butt
er
Honey
Jam

PAGE 13
Japan – Naturally Healthy Honey Retail Unit Prices – January 2011
Source: Euromonitor International, 2011. Note: US$ figures were calculated from the Yen value using a 2010 fixed exchange rate.
HONEY (continued)
Canada’s Top 10 Export Markets for Natural Honey by Volume – KG
Rank Partner Country 2006 2007 2008 2009 2010 2011
World 13,593,991 16,762,766 22,640,023 12,162,019 15,145,337 9,567,936
1 United States 11,765,526 14,154,771 17,401,216 8,466,900 11,178,117 7,233,027
2 Japan 354,929 434,055 1,616,402 1,692,286 2,440,219 1,703,110
3 China 9,475 423,578 133,912 456,944 215,649 191,261
4 Germany 926,526 804,034 972,302 584,853 749,389 120,221
5 United Kingdom 68,356 40,950 265,965 141,888 93,862 79,346
6 France 148,595 58,501 77,481 72,602 59,368 56,869
7 Hong Kong 2,318 8,401 22,937 17,278 23,274 47,066
8 Australia 0 381,909 1,677,296 566,568 57,508 38,594
9 India 21,060 0 15,708 6,427 0 31,287
10 Jordan 100 0 0 600 18,600 17,550
Source: Global Trade Atlas, 2012.
Brand Company Outlet Pack
Size
Unit Price
(Yen)
Unit Price
(US$)
Meidi-Ya Junsui Hachimitsu Meidi-Ya Co. Ltd. Supermarket/hypermarket
300 g 498 6.27
Renge-jirushi Hachimitsu Nippon Hachimitsu Co. Ltd. Direct Selling 150 g 298 3.75
Renge-jirushi Hachimitsu Nippon Hachimitsu Co. Ltd. Supermarket/hypermarket
150 g 298 3.75
Sakura-jirushi Hachimitsu Kato Bros Honey Co. Ltd. Health & Beauty Retailer
250 g 365 4.60
Sakura-jirushi Hachimitsu Kato Bros Honey Co. Ltd. Supermarket/hypermarket
250 g 384 4.84
Seven Premium Junsui Hachimitsu Seven & I Holdings Co. Ltd. Supermarket/hypermarket
150 g 238 3.00
Top Value Junsui Hachimitsu Aeon Co. Ltd. Supermarket/hypermarket
250 g 288 3.63
PAGE 14
Nutritional Value and Claims
In nutritional terms, honey contains many enzymes, anti-bacterial agents (such as hydrogen peroxide) and an impressive array of vitamins (especially B vitamins), as well as minerals and trace elements, albeit in fairly small quantities. Due to its high sugar content (80%), honey has also traditionally been used as a quick-fix energy booster.
Honey is also thought to offer antiseptic, antioxidant and cleansing properties to support the body and health. Rich in antioxidants, honey has been said to protect the heart, improve memory, reduce anxiety, and ease gastro-intestinal disorders (Prevention Magazine, 2003). Both the region of origin and variety of honey affect its healing qualities. There are over 23 common varieties, such as manuka, buckwheat, clover, acacia, alfalfa and wildflower. In addition, honey is reputed to fight infection, aid in tissue healing and reduce inflammation and scarring. Honey can also be used topically to treat wounds, such as burns, ulcers, sores, and scars.
Honey has long been used by individuals suffering from bad breath, athletes foot, hair loss, sleep disorders, sore throats, colds, and even acne who look to this alternative medicine as a natural cure.
New Products
HONEY (continued)
Category Brand Product Description Pack
Size Pack Type
Price
(US$)
Snack Food Calbee Happy Butter Potato Chips
Made with butter, parsley, honey (powder), and cream cheese.
111 g Metallised Film Flexible
2.62
Prepared Soup
Pokka Pumpkin Potage with Crispy Bread Pieces
Enhanced with honey. 3 x
25.8 g Metallised Film Flexible
3.22
Snack Food Beano Yuzu and Pepper Bean Snacks
Flavoured with bonito and kombu seaweed and honey.
63 g Metallised Film Flexible
1.64
Seasonings S&B Motto Spice Shimasho
Honey Ginger Granular seasoning made with domestic ginger and honey (powder).
15 g Plastic PE Flexible Sachet
2.1
Boiled Sweets
Asahi Lemon Candies Candy made with acacia honey and lemon.
81 g Plastic PP Flexible Sachet
2.32
Snack Food Calbee Poterich (Private Label)
Plum and Kimchi Flavoured Potato Chips
Thick potato chips flavoured with plums, kimchi and honey (powder).
74 g Metallised Film Flexible
2.07
Snack Food Oyatsugoro Chocolate Corn Snack (Honey)
Chocolate-soaked corn snack with a honey (powder) flavouring.
53 g Metallised Film Flexible
1.26
Snack Food Hogaraka Time Baked Bread Snack Bite-sized bread snack with a light sweet scent and mild butter flavour, made with honey (powder).
55 g Plastic PP Flexible
1.18
Launches of New Products Containing Honey in Japan – 2011
Source: Mintel, 2012.
Source: Mintel.
PAGE 17
Bloomberg Businessweek (January 29, 2012). “Japan Consumer Spending Revives Even as Exports Slide: Economy.” [http://www.businessweek.com/news/2012-01-29/japan-consumer-spending-revives-even-as-exports-slide-economy.html].
Datamonitor (2012). Product Launch Analytics. Euromonitor International (January 2012). “Packaged Food in Japan.” Industry Overview. Euromonitor International (June 2011). “Grocery Retailers in Japan.” Category Briefing. Euromonitor International (August 2011). “Naturally Healthy Packaged Food in Japan.” Category Briefing. Euromonitor International (September 2011). “Consumer Lifestyles in Japan.” Euromonitor International (January 2012). “Spreads in Japan.” Category Briefing. Euromonitor International (December 2011). “Flavours in Dairy and Ice Cream in Japan.” Category Briefing. Euromonitor International (January 2012). “Japan, Country and Consumer.” Statistics. Euromonitor International (February 2012). “Japan Consumer Expenditure by Region.” Statistics. Global Trade Atlas (2012). Japan Today (January 10, 2012). “B-grade cuisine: Japan’s bizarre foodie fad.” [http://www.japantoday.com/
category/food/view/b-grade-cuisine-japans-bizarre-foodie-fad]. Nutraceuticals World (December 1, 2011). “Functional Foods in Asia Pacific –Technology Benchmarking
and Stakeholder Analysis.” [http://www.nutraceuticalsworld.com/issues/2011-12/view_market-research/functional-foods-in-asia-pacific-technology-benchmarking-and-stakeholder-analysis/].
Prevention Magazine (July, 2003). The Doctor’s Book of Home Remedies. Bantam.
RESOURCES
Consumer Trends: Honey and Maple Syrup in Japan © Her Majesty the Queen in Right of Canada, represented by the Minister of Agriculture and Agri-Food Canada (2012). ISSN 1920-6615 AAFC No. 11752E
Photo Credits All Photographs reproduced in this publication are used by permission of the rights holders. All images, unless otherwise noted, are copyright Her Majesty the Queen in Right of Canada.
For additional copies of this publication or to request an alternate format, please contact: Agriculture and Agri-Food Canada 1341 Baseline Road, Tower 5, 4th floor Ottawa, ON Canada K1A 0C5 E-mail: [email protected]
Aussi disponible en français sous le titre : Tendances de consommation : Miel et sirop d'érable au Japon
The Government of Canada has prepared this report based on primary and secondary sources of information. Although every effort has been made to ensure that the information is accurate, Agriculture and Agri-Food Canada assumes no liability for any actions taken based on the information contained herein.