construction sector outlook, labour costs and productivity · pdf filechart 2.23 :...
TRANSCRIPT

Construction sector – outlook, labour costs and productivity Master Builders Association of Victoria
31 March 2016
Construction sector – outlook, labour costs and productivity
Liability limited by a scheme approved under Professional Standards Legislation. Deloitte refers to one or more of Deloitte Touche Tohmatsu Limited, a UK private company limited by guarantee, and its network of member firms, each of which is a legally separate and independent entity. Please see www.deloitte.com/au/about for a detailed description of the legal structure of Deloitte Touche Tohmatsu Limited and its member firms. © 2016 Deloitte Access Economics Pty Ltd
Contents Glossary ..................................................................................................................................... i
Executive Summary .................................................................................................................... i
1 Introduction .................................................................................................................... 1
2 The Victorian construction sector .................................................................................... 2
2.1 Construction outlook ........................................................................................................ 2
2.2 Labour costs...................................................................................................................... 6
2.3 Construction costs .......................................................................................................... 23
2.4 Productivity .................................................................................................................... 29
2.5 Profitability and insolvency ............................................................................................. 32
Appendix A : Analysis of EBAs and awards ............................................................................... 41
References .............................................................................................................................. 44
Limitation of our work ............................................................................................................... 45
Charts Chart 2.1 : Forecasts of real residential and non-residential construction activity, Victoria, private sector ............................................................................................................................ 5
Chart 2.2 : Trends in Victoria's planned project investment ...................................................... 5
Chart 2.3 : Wage growth in Victoria ......................................................................................... 7
Chart 2.4 : Wage Price Index in Victoria .................................................................................... 8
Chart 2.5 : Average annual wage growth in construction industry EBAs ..................................... 9
Chart 2.6 : Construction industry EBA wage level for Victoria and rest of Australia ................. 10
Chart 2.7 : Construction industry EBA wage growth at the 2 digit ANZSIC level, Victoria .......... 10
Chart 2.8 : Construction industry EBA wage level at the 2 digit ANZSIC level, Victoria ............. 12
Chart 2.9 : Specific EBA wage outcomes for a carpenter – comparison with award wages ...... 13
Chart 2.10 : CFMEU Pattern Industry EBA and Award wage level for a carpenter .................... 14
Chart 2.11 : Specific EBA wage outcomes for an entry-level labourer – comparison with award wages 15
Chart 2.12 : CFMEU Pattern Industry EBA and Award wage level for an entry-level labourer .. 15
Chart 2.13 : Contribution to changes in remuneration under EBAs and Award by type of entitlement ............................................................................................................................. 16

Construction sector – outlook, labour costs and productivity
Chart 2.14 : Average annual earnings of full-time non-managerial employees paid at the adult rate by occupation in Victoria, 2014 ........................................................................................ 17
Chart 2.15 : Average hourly earnings of full-time non-managerial employees paid at the adult rate by occupation in Victoria, 2014 ........................................................................................ 18
Chart 2.16 : EBA wage growth and WPI wage growth in the Victorian construction industry ... 19
Chart 2.17 : The national EBA wage ‘gap’ across industries from 2007 to 2015 ........................ 20
Chart 2.18 : Index of CPI-adjusted wage outcomes for Victorian construction EBAs, Victorian construction WPI, Victorian all industries WPI and Victorian construction awards ................... 21
Chart 2.19 : Wage level for entry-level labourers under 5% and 6% wage increase scenarios . 22
Chart 2.20 : Wage level for carpenters under 5% and 6% wage increase scenarios ................. 22
Chart 2.21 : Price of construction work done, Victoria and Australia ....................................... 24
Chart 2.22 : The relative price of labour compared with the price of construction work done, Victoria and Australia .............................................................................................................. 25
Chart 2.23 : Construction labour productivity, Victoria and Australia ...................................... 30
Chart 2.24 : Labour productivity in the construction and market sectors, Victoria .................. 31
Chart 2.25 : Operating profit margin by industry, Australia, 2013-14 ...................................... 33
Chart 2.26 : Operating profit margins in the broader construction industry (%), Australia ...... 34
Chart 2.27 : Construction industry’s share of all external administration reports lodged ........ 35
Chart 2.28 : Profit margin and return on assets for largest non-residential construction firms, Victoria and Australia .............................................................................................................. 37
Chart 2.29 : Construction companies entering external administration in 2014-15, by State ... 38
Chart 2.30 : Share of all companies entering external administration by industry in 2014-15, Victoria ................................................................................................................................... 39
Chart 2.31 : Initial external administrators’ reports for the Victorian construction industry .... 40
Tables Table 2.1 : Investment by sector and status in Victoria ($ million) ............................................ 6
Table 2.2 : The impact of higher labour costs on building costs in Melbourne ($/m2) ............. 27
Table 2.3 : Labour productivity growth in the construction industry, Victoria ......................... 31
Table 2.4 : Profitability of largest Australian non-residential construction firms, 2010-11 to 2014-15 .................................................................................................................................. 32
Table 2.5 : Profitability of largest non-residential construction firms domiciled in Victoria, 2010-11 to 2014-15 ................................................................................................................ 36

Construction sector – outlook, labour costs and productivity
Deloitte Access Economics
Glossary
AAWI Average Annualised Wage Increase
ABS Australian Bureau of Statistics
CFMEU Construction, Forestry, Mining and Energy Union
CPI Consumer Price Index
EBA Enterprising Bargaining Agreement
EEH ABS Survey of Employee Earnings and Hours
GFC Global Financial Crisis
MBAV Master Builders Association of Victoria
RDO Rostered Day Off
WPI Wage Price Index

Construction sector – outlook, labour costs and productivity
i
Deloitte Access Economics
Executive Summary Deloitte Access Economics has been commissioned by the Master Builders Association of Victoria (MBAV) to undertake independent research across a range of issues relating to the Victorian construction industry. The areas of focus include the construction outlook, wages under enterprise bargaining agreements (EBAs), construction costs, productivity and profitability in the industry. This report updates a similar research report undertaken by Deloitte Access Economics for MBAV in December 2014.
Economic context
The Victorian Government’s economic outlook as set out in the 2015-16 Budget sees a modest improvement in economic growth in the short term. While the Victorian economy received only a small direct benefit from the mining boom due to the minor role that mining plays in the State, the end of the mining boom has brought with it falls in both interest rates and the $A. This has already started to provide assistance to key Victorian export sectors, while lower interest rates have boosted the housing market. Victoria is also leading the nation in population growth, which supports a range of economic indicators, as well as the outlook for the construction sector.
Construction outlook
Housing construction activity continues to be very strong in Victoria. Yet there are some risks wrapped up in that ongoing strength, particularly for inner city apartments. A moderation in housing construction is expected over the next two to three years.
Victoria has relatively good prospects for its engineering construction sector. There are two large projects set to start; the $5.5 billion Western Distributor project (with construction likely to begin in 2016) and the $11 billion Melbourne Metro (in 2018). There are also a number of other projects underway or committed, including the Victorian Government’s Level Crossing Removal Program. These projects will help support activity in the near term.
The outlook for Victoria’s non-residential building construction sector is relatively healthy compared with that in other States, particularly so for office and retail construction.
Wage growth under Victorian construction EBAs
Wage gains in the Victorian construction industry have generally exceeded the wage gains seen in the national construction industry in recent years.
Victorian construction workers under EBAs have achieved wage gains some 6 percentage points greater than the national average for EBAs over the period from June 2007 to June 2015. Further, wage outcomes under Victoria’s construction sector EBAs have outpaced broader wage gains for the Victorian construction sector as measured by the Wage Price Index by 13 percentage points over that period.
The fast pace of construction sector EBA wage growth in Victoria continued in 2015, with a further rise of 5.0% for wages under the CFMEU Pattern Industry EBA over the past year.

Construction sector – outlook, labour costs and productivity
ii
Deloitte Access Economics
That further exacerbates wage levels for Victorian construction workers which are already high relative to other benchmarks. As at 30 June 2015, both carpenters and basic entry-level labourers earned more than double under the EBA for a 51 hour work week than for matching work performed under the award:
On an hourly basis, carpenters and entry-level construction labourers under an EBA earn more than an engineer.
Both entry-level labourers and carpenters earn far more per hour than do nurses, accountants, police or teachers.
Construction costs
Wage rises in the construction industry have outpaced rises in the prices charged for construction work done in both Australia and Victoria in recent years. The discrepancy has been larger in Victoria than nationally. The discrepancy between rising wage costs and only limited growth in the price of construction work done has also been more pronounced for labour under construction EBAs where wage rises have been higher.
Someone always pays: higher labour costs eventually mean higher construction costs for buildings such as offices, hotels, shops, schools and hospitals, and also place upward cost pressure on the Victorian Government’s infrastructure budget.
In turn, these costs to private businesses and to taxpayers fall in part on Victorian families, including via higher prices. Although such subsidies to construction workers from all other workers may not be well understood or well recognised, it is in this way that the broader public funds large wage rises seen in the construction industry.
Productivity
Labour productivity growth in the Victorian construction industry has lagged behind the growth in labour productivity seen in the national construction industry. It has also lagged behind labour productivity growth in other industries in Victoria. The past decade has been particularly poor for productivity growth in construction in Victoria.
Profitability
For the largest non-residential construction firms domiciled in Victoria, profit margins are thin at 0.3% in 2013-14 and 0.4% in 2014-15, while the return on assets is also extremely low – at just 0.7% in 2013-14 and 1.0% in 2014-15.
To put this into perspective, an Australian Government 10 year bond currently yields around 2.5% per annum and a one year term deposit with an Australian bank currently pays around 2.4% per annum. Yet these are essentially risk-free investments, whereas an investment in a construction business entails significant risk.
In effect, the owners of construction businesses in Victoria would currently be better off if they could sell up their businesses for their book value, and simply put that money in the bank. Such a situation is not sustainable without an improvement in firm profitability.
Deloitte Access Economics
Construction sector – outlook, labour costs and productivity
1
Deloitte Access Economics
1 Introduction Deloitte Access Economics has been commissioned by the Master Builders Association of Victoria (MBAV) to undertake independent research across a range of issues relating to the Victorian construction industry. The areas of focus include the construction outlook, wages under enterprise bargaining agreements (EBAs), construction costs, productivity and profitability in the industry.
A similar research report was prepared by Deloitte Access Economics for MBAV in December 2014. MBAV has subsequently requested the key research in that report to be updated for the most recent data. Deloitte Access Economics has utilised a range of publicly available information and our own analysis in compiling this report.
Construction sector – outlook, labour costs and productivity
2
Deloitte Access Economics
2 The Victorian construction sector
2.1 Construction outlook
2.1.1 Economic context
The Victorian Government’s economic outlook set out in the 2015-16 Budget sees a modest improvement in economic growth in the short term. The Victorian economy received only a small direct benefit from the mining boom due to the minor role that mining plays in the State. Rather, the side effects of a high Australian dollar and higher interest rates meant that some of the key sectors of the Victorian economy including manufacturing and international education found it harder to compete – particularly in the period following the global financial crisis (GFC).
The end of the mining boom has brought with it considerable falls in both interest rates and the $A. This has already started to provide assistance to key Victorian export sectors, including agriculture and international education. Lower interest rates have also provided a boost to activity in the housing market leading to large increases in house prices. This has provided a much needed stimulus to the construction and retail sectors (particularly home goods retailing) as developers make the most of the high prices by adding to supply.
Output growth in Victoria is forecast by the Victorian Government to be 2.5% in 2015-16, up from 2.2% in 2014-15. There remain some obstacles to growth in the short term, including the imminent closure of the State’s car assembly industry in 2017. Additionally, the current boost to housing construction from the low level of interest rates may begin to fall over time.
On the other hand Victoria is leading the nation in population growth, with the latest data showing that growth in the State’s population has been the strongest in the nation over the past year – a position that Victoria hasn’t occupied for well over a century. Economic indicators within the State have been supported by strong population growth, in particular the rate of housing construction.
There are expected to be substantial differences in employment growth across the different industry sectors. Employment growth is expected to be fastest in the service sectors of the economy, particularly those which are sheltered from overseas competition, particularly health and social assistance and school education related sectors. On the other hand, growth rates may be lowest in capital intensive and/or trade exposed sectors such as metal ore mining, textile leather, clothing and footwear manufacturing and furniture and other manufacturing.
Of the sectors expected to lead employment growth, health care and social assistance, education and professional services have all enjoyed strong rates of growth in recent years. That hasn’t been the case for financial and insurance services, which have seen some labour shedding as technology has driven process changes, and with more subdued levels of activity in the post-GFC environment.
Construction sector – outlook, labour costs and productivity
3
Deloitte Access Economics
At the other end of the spectrum, agriculture, mining and manufacturing employment are all expected to see a decline in employment over time, with significant global cost pressures on manufacturing and expected productivity gains across these sectors, combined with pressure on commodity prices in the short term.
2.1.2 Construction outlook
Housing construction activity continues to be very strong in Victoria. Housing finance approvals have increased, while growth in Melbourne’s housing prices has been almost as strong as that seen in Sydney. That said, as in Sydney, auction clearance rates and house prices growth have cooled in recent months. The good news is that additional new building has been incentivised by the higher housing prices of recent years. The value of residential building approvals continues to show a rise over the past year. It helps that Victoria’s population growth has been particularly strong, which has helped to underpin housing construction activity.
Yet there are some risks wrapped up in the ongoing strength in housing construction, particularly for inner city apartments – whose supply has been increasing substantially. But current conditions remain strong and latest data are not indicating an oversupplied housing market in Victoria more generally, with rental accommodation vacancy rates remaining steady at around 3% and growth in housing rents still positive and slightly above the national average.
The value of total residential construction work in Victoria grew by 16.2% over the year to September 2015. In addition, residential building approvals remained strong throughout 2015, which will add to the residential construction pipeline over 2016. Even so, following the very strong housing construction activity seen recently in Victoria, a moderation in housing construction is expected over the next two to three years.
Victoria has relatively good prospects for its engineering construction sector as a result of its strong population growth going forward. Victoria’s manufacturing sector was hit hard by the rising dollar associated with high commodity prices and the accompanying boom in mining investment. But as the mining investment boom turns to bust, Victoria is set to outperform the mining States as the falling currency restores some of the lost competitiveness of the non-mining export and import-competing sectors.
The largest projects currently underway in this State – the $4.4 billion Kipper-Tuna-Turrum oilfield being the biggest – are set to wind up in 2016. The cancellation of the former Government’s East-West Link project was also a setback for the immediate engineering construction outlook. However, there are two large projects set to start; the $5.5 billion Western Distributor project (with construction likely to begin in 2016) and the $11 billion Melbourne Metro (in 2018).
There are also a number of other projects under construction or committed. These include the $1.3 billion CityLink Upgrade involving a widening of the Tullamarine Freeway, and the $300 million M80 Ring Road upgrade, while the Government has also committed to remove 50 level crossings over eight years, including at least 20 by 2018 as part of the Level Crossing Removal Program. These projects will help to support activity in the near term. The engineering construction pipeline therefore looks relatively healthy compared with

Construction sector – outlook, labour costs and productivity
4
Deloitte Access Economics
that in some other States, particularly the mining states where mining-related construction is winding down.
The Federal Government is also helping to fund major infrastructure projects in Victoria.
The Federal Government makes large payments to the States and Territories for specific purposes, including in the area of infrastructure. In practice, most major highways or freeways and some significant rail projects in Victoria receive some contribution from the Federal Government. To that end, the Federal Government entered into a National Partnership Agreement with Victoria in October 2014, and the Victorian schedule of projects was updated after the 2015 Budget.1
Key projects to receive funding in the 2015-16 Federal Budget included the upgrade of the Western Highway, Tullamarine Freeway, the M80 and the duplication of parts of the Princess Highway.2 Acting Prime Minister, Warren Truss, delivered the second Annual Ministerial Infrastructure Statement to Parliament on 1 December 2015, in which he stated that these projects are progressing according to plan. Given the cancellation of the East/West project, he also stated that the Federal Government would look to develop a new infrastructure plan with Victoria over coming months.3
In addition to transport infrastructure, the Federal Government is funding the rollout of the National Broadband Network. According to the 2015-16 Federal Budget, 639,500 premises in Victoria are expected to have the NBN in place or under construction by September 2016.
The outlook for Victoria’s non-residential building construction sector is also relatively healthy compared with that in other States, particularly so for office and retail construction. Strong population growth is also helping to support demand for this sector, along with the fall in the exchange rate and low interest rates. For example, according to the Property Council of Australia’s Office Market Report, the office vacancy rate fell to 7.7% in the Melbourne CBD in January 2016, the second lowest in the nation. Meanwhile, growth in the volume of retail sales in Victoria was the strongest of all jurisdictions over the year to December 2015.
While those economic factors are the underlying drivers of a positive outlook for non-residential building construction over the next few years, the latest ABS data reported a fall in the amount of non-residential building work yet to be done in Victoria in the June and September quarters of 2015. That may suggest some downside risk to the near term outlook shown in Chart 2.1, despite the improving economic backdrop. Latest data from the ABS National Accounts show that private sector non-residential building work was robust in the second half of 2015, showing a 13% increase over the same period a year ago.
1 The detailed list of all transport infrastructure projects in Victoria and the Federal Government’s funding contribution can be found at:
http://investment.infrastructure.gov.au/publications/policies/pdf/NPA_Schedule_VIC_September%202015.pdf
2 A full list of key projects that received funding in the 2015-16 Federal Budget can be found at:
http://investment.infrastructure.gov.au/publications/policies/pdf/Infrastructure_Omnibus_May2015.pdf
3 http://investment.infrastructure.gov.au/funding/projects/infrastructurestatement.aspx

Construction sector – outlook, labour costs and productivity
5
Deloitte Access Economics
Major commercial building projects underway which will continue beyond 2016 include the $1.8 billion Collins Square project and the $1.2 billion Merrifield development, along with the $580 million expansion of Chadstone shopping centre. There are also a number of investments being made in hospitals such as the new $200 million Joan Kirner Women’s and Children’s Hospital in St Albans, which is due to be completed in 2020.
Chart 2.1: Forecasts of real residential and non-residential construction activity, Victoria, private sector
Source: ABS, Deloitte Access Economics
Chart 2.2: Trends in Victoria's planned project investment
Source: Deloitte Access Economics’ Investment Monitor
0
10,000
20,000
30,000
40,000
50,000
60,000
70,000
0
2,000
4,000
6,000
8,000
10,000
12,000
14,000
16,000
Non-residential building
Engineering construction
Housing starts (RHS)
Number$ million
Forecast
$0
$10,000
$20,000
$30,000
$40,000
$50,000
$60,000
$70,000
$80,000
$90,000
$100,000
Jun-01 Dec-02 Jun-04 Dec-05 Jun-07 Dec-08 Jun-10 Dec-11 Jun-13 Dec-14
Possible
Under consideration
Definite
Value of projects, $ million
Construction sector – outlook, labour costs and productivity
6
Deloitte Access Economics
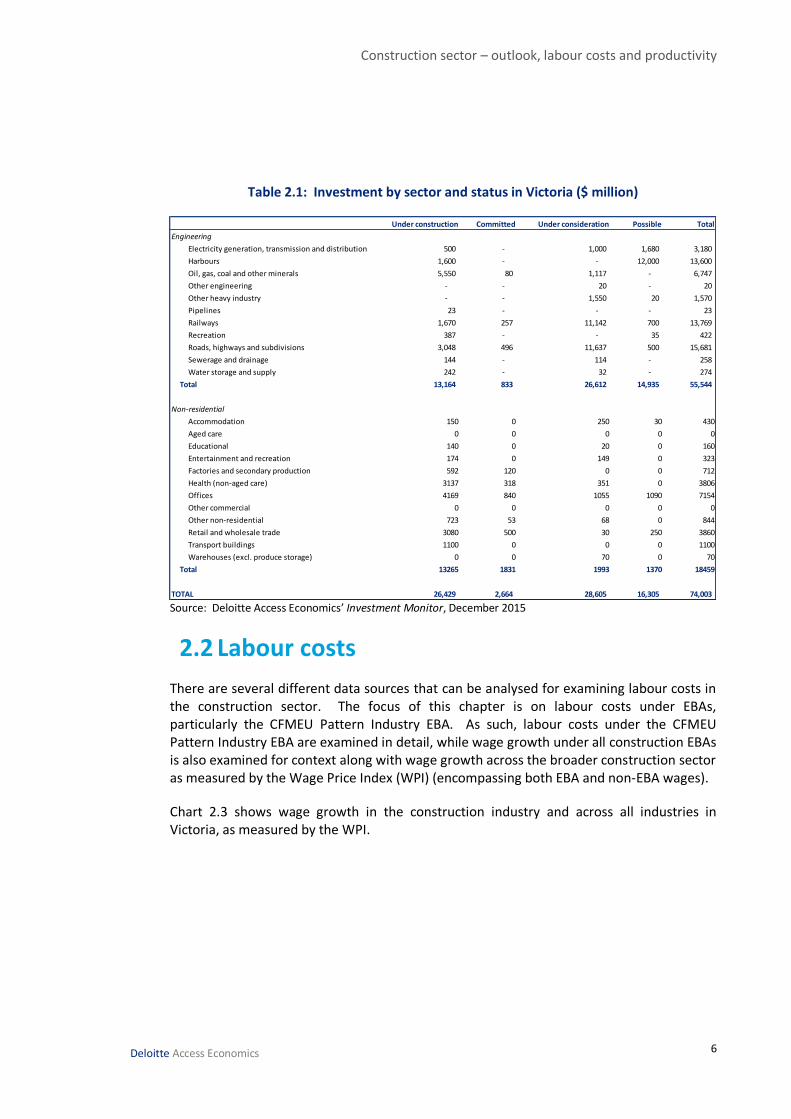
Table 2.1: Investment by sector and status in Victoria ($ million)
Source: Deloitte Access Economics’ Investment Monitor, December 2015
2.2 Labour costs
There are several different data sources that can be analysed for examining labour costs in the construction sector. The focus of this chapter is on labour costs under EBAs, particularly the CFMEU Pattern Industry EBA. As such, labour costs under the CFMEU Pattern Industry EBA are examined in detail, while wage growth under all construction EBAs is also examined for context along with wage growth across the broader construction sector as measured by the Wage Price Index (WPI) (encompassing both EBA and non-EBA wages).
Chart 2.3 shows wage growth in the construction industry and across all industries in Victoria, as measured by the WPI.
Under construction Committed Under consideration Possible Total
Engineering
Electricity generation, transmission and distribution 500 - 1,000 1,680 3,180
Harbours 1,600 - - 12,000 13,600
Oil, gas, coal and other minerals 5,550 80 1,117 - 6,747
Other engineering - - 20 - 20
Other heavy industry - - 1,550 20 1,570
Pipelines 23 - - - 23
Railways 1,670 257 11,142 700 13,769
Recreation 387 - - 35 422
Roads, highways and subdivisions 3,048 496 11,637 500 15,681
Sewerage and drainage 144 - 114 - 258
Water storage and supply 242 - 32 - 274
Total 13,164 833 26,612 14,935 55,544
Non-residential
Accommodation 150 0 250 30 430
Aged care 0 0 0 0 0
Educational 140 0 20 0 160
Entertainment and recreation 174 0 149 0 323
Factories and secondary production 592 120 0 0 712
Health (non-aged care) 3137 318 351 0 3806
Offices 4169 840 1055 1090 7154
Other commercial 0 0 0 0 0
Other non-residential 723 53 68 0 844
Retail and wholesale trade 3080 500 30 250 3860
Transport buildings 1100 0 0 0 1100
Warehouses (excl. produce storage) 0 0 70 0 70
Total 13265 1831 1993 1370 18459
TOTAL 26,429 2,664 28,605 16,305 74,003

Construction sector – outlook, labour costs and productivity
7
Deloitte Access Economics
Chart 2.3: Wage growth in Victoria
Source: ABS 6345.0, Deloitte Access Economics
As Australia’s mining boom has wound down since 2012 and the nation’s economic growth has weakened, wage growth across the economy has eased considerably, including in Victoria. Wage growth across all industries in Victoria dropped to a historic low of 2.5% in the year to December 2013. Latest data show that wage growth across all industries in Victoria has remained near historic lows, and was only 2.6% over the year to the September quarter of 2015.
Wage growth in construction has also eased in recent years in Victoria, but continues to exceed wage growth across all industries in Victoria. That has generally been the case over the period from 2007 to 2015. While that was true when the mining boom was driving demand for workers and wage growth was strong across Australia and Victoria, it has also remained the case in more recent years when the mining boom has been winding down. That said, there has been a more recent lift in housing construction activity in Victoria which may have increased the demand for some workers in the housing construction sector.
The latest data indicate that WPI wage growth for construction in Victoria lifted from 2.7% in the March quarter of 2015 to 3.1% over the year to the September quarter of 2015.
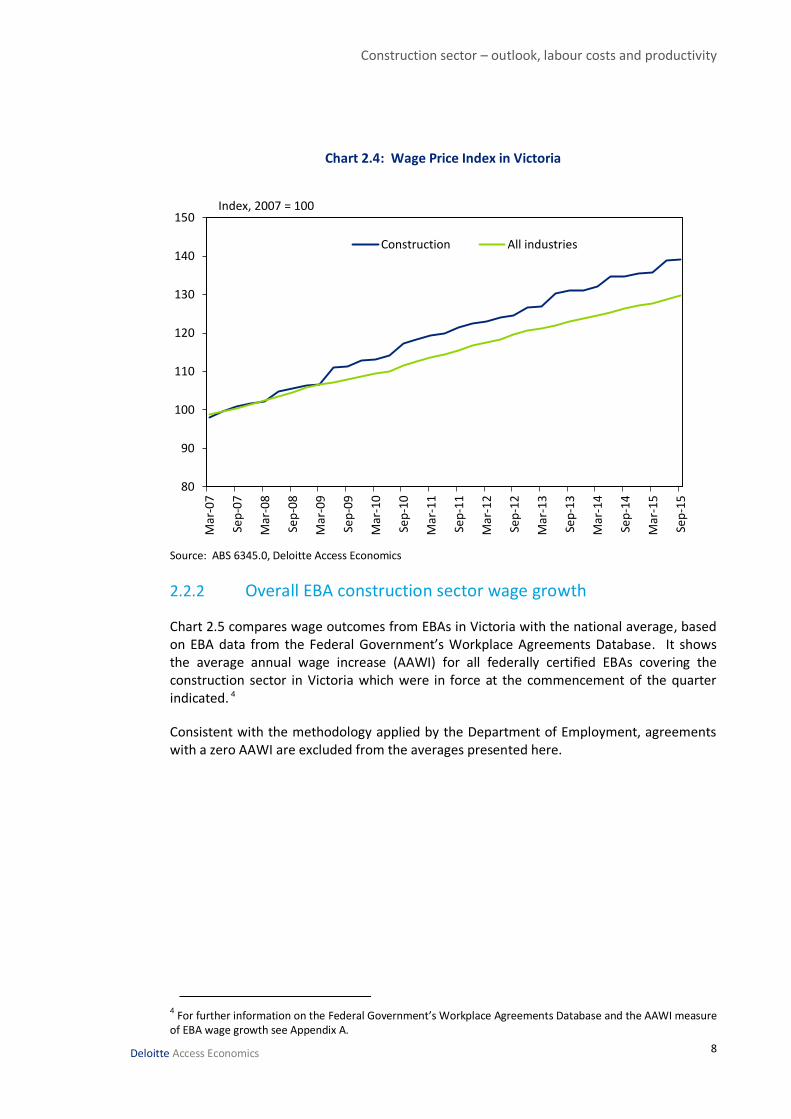
As shown in Chart 2.4, the strong wage growth in construction has compounded over the years into an increasingly higher level of construction wages relative to wages for other industries.
1%
2%
3%
4%
5%
6%
7%M
ar-0
7
Sep
-07
Mar
-08
Sep
-08
Mar
-09
Sep
-09
Mar
-10
Sep
-10
Mar
-11
Sep
-11
Mar
-12
Sep
-12
Mar
-13
Sep
-13
Mar
-14
Sep
-14
Mar
-15
Sep
-15
Construction All industries
Year-to % change
Construction sector – outlook, labour costs and productivity
8
Deloitte Access Economics
Chart 2.4: Wage Price Index in Victoria
Source: ABS 6345.0, Deloitte Access Economics
2.2.2 Overall EBA construction sector wage growth
Chart 2.5 compares wage outcomes from EBAs in Victoria with the national average, based on EBA data from the Federal Government’s Workplace Agreements Database. It shows the average annual wage increase (AAWI) for all federally certified EBAs covering the construction sector in Victoria which were in force at the commencement of the quarter indicated. 4
Consistent with the methodology applied by the Department of Employment, agreements with a zero AAWI are excluded from the averages presented here.
4 For further information on the Federal Government’s Workplace Agreements Database and the AAWI measure
of EBA wage growth see Appendix A.
80
90
100
110
120
130
140
150M
ar-0
7
Sep
-07
Mar
-08
Sep
-08
Mar
-09
Sep
-09
Mar
-10
Sep
-10
Mar
-11
Sep
-11
Mar
-12
Sep
-12
Mar
-13
Sep
-13
Mar
-14
Sep
-14
Mar
-15
Sep
-15
Construction All industries
Index, 2007 = 100

Construction sector – outlook, labour costs and productivity
9
Deloitte Access Economics
Chart 2.5: Average annual wage growth in construction industry EBAs
Source: Department of Employment Workplace Agreement Database, Deloitte Access Economics
Chart 2.5 shows a substantial gap between Victorian wage outcomes and their national counterparts over time, with Victorian construction workers achieving wage gains some 6% higher than the national average over the period from June 2007 to June 2015.
A comparison with EBA wage outcomes in other States further highlights the relatively strong growth in EBA wages in Victoria.
As shown in Chart 2.5 above, the stronger wage outcomes for Victoria have pushed up the national average, with lower wage outcomes seen in agreements for the rest of Australia. Victorian construction workers have achieved wage gains a cumulative 14 percentage points higher than construction workers outside of Victoria over the period from June 2007 to June 2015.
Analysis of the Department of Employment’s Workplace Agreement Database also suggests that Victoria accounts for a relatively high share of all construction workers covered by EBAs nationally. On average over the period since the start of 2007, around 35% of all construction workers covered by EBAs nationally have been in Victoria.
3%
4%
5%
6%
7%
2007 2009 2011 2013 2015
Victoria Rest of Australia Australia
AAWI (%)

Construction sector – outlook, labour costs and productivity
10
Deloitte Access Economics
Chart 2.6: Construction industry EBA wage level for Victoria and rest of Australia
Source: Department of Employment Workplace Agreement Database, Deloitte Access Economics
Chart 2.7: Construction industry EBA wage growth at the 2 digit ANZSIC level, Victoria
Source: Department of Employment Workplace Agreement Database, Deloitte Access Economics
80
90
100
110
120
130
140
150
160
170
2007 2009 2011 2013 2015
Victoria Australia Rest of Australia
Index, 2007 = 100
3%
4%
5%
6%
7%
8%
2007 2009 2011 2013 2015Building construction Construction servicesHeavy and Civil Engineering Construction Total construction
AAWI (%)

Construction sector – outlook, labour costs and productivity
11
Deloitte Access Economics
Wage growth from EBAs can be examined separately for the construction services, heavy and civil engineering and building construction components of the construction industry.5
Chart 2.7 shows that wage growth under EBAs has generally been stronger for building construction and construction services than has been the case in heavy and civil engineering construction over the period from 2007 to 2015. While that has been true on average over this period according to the database, it is not always the case. EBAs in the heavy and civil engineering sector can also sometimes have generous wage increases as well as higher wage levels than in building construction, with the EBA for the construction of the Victorian desalination plant a prominent recent example.
The swings in EBA wage growth for building construction coincide with the periods between expiry of a CFMEU Pattern Industry EBA and adoption of a new CFMEU Pattern Industry EBA in Victoria (which occurred in 2008, 2011 and 2015), with wage growth picking up again when a new CFMEU Pattern Industry EBA is concluded. The database shows that wage growth under new EBAs in Victorian building construction dropped in 2015, but this may reflect the expiry of the previous CFMEU Pattern Industry EBA, with a new CFMEU Pattern Industry EBA outlining wage increases beyond 2015 yet to be concluded.
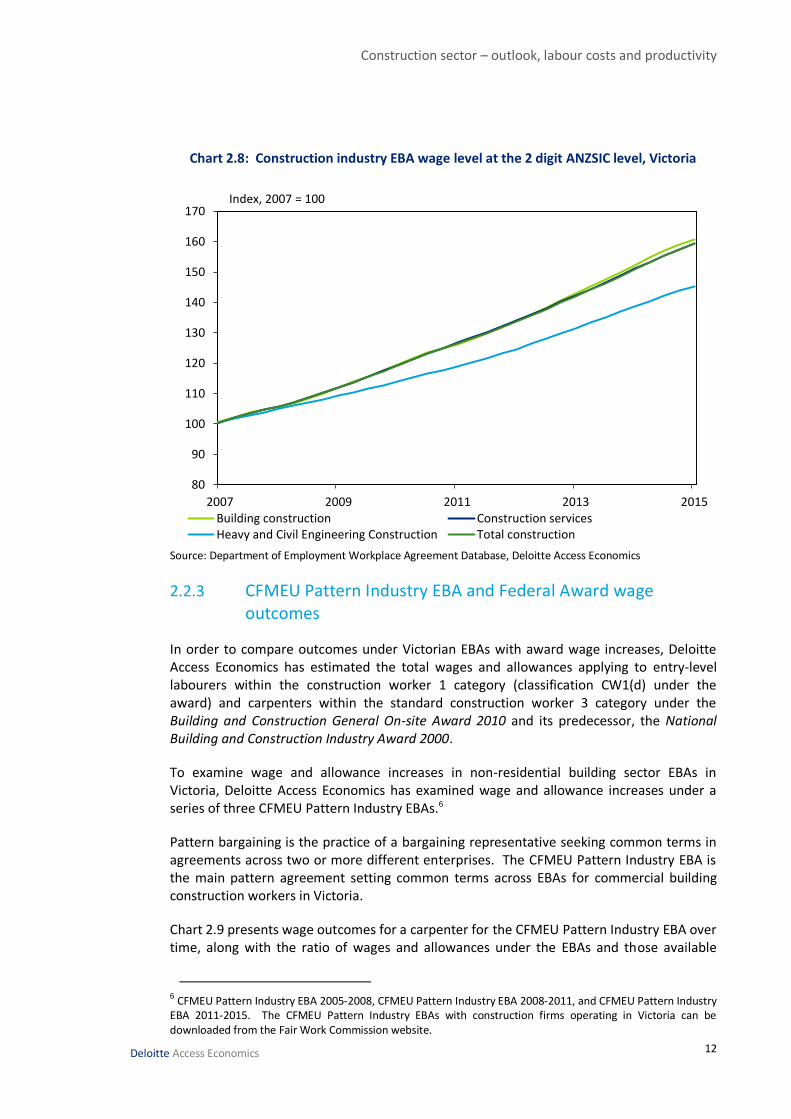
Despite the swings in EBA wage growth from year to year, Chart 2.8 shows that the growth in EBA wages has compounded over time into higher EBA wage levels for all construction sectors.
It should be noted that EBA wage growth for the construction services sector will have implications for labour costs in both the building construction sector and the heavy and civil engineering sector due to the prevalence of subcontracting in the industry.
5 For further information on how these sub-sectors are defined see Appendix A.
Construction sector – outlook, labour costs and productivity
12
Deloitte Access Economics
Chart 2.8: Construction industry EBA wage level at the 2 digit ANZSIC level, Victoria
Source: Department of Employment Workplace Agreement Database, Deloitte Access Economics
2.2.3 CFMEU Pattern Industry EBA and Federal Award wage outcomes
In order to compare outcomes under Victorian EBAs with award wage increases, Deloitte Access Economics has estimated the total wages and allowances applying to entry-level labourers within the construction worker 1 category (classification CW1(d) under the award) and carpenters within the standard construction worker 3 category under the Building and Construction General On-site Award 2010 and its predecessor, the National Building and Construction Industry Award 2000.
To examine wage and allowance increases in non-residential building sector EBAs in Victoria, Deloitte Access Economics has examined wage and allowance increases under a series of three CFMEU Pattern Industry EBAs.6
Pattern bargaining is the practice of a bargaining representative seeking common terms in agreements across two or more different enterprises. The CFMEU Pattern Industry EBA is the main pattern agreement setting common terms across EBAs for commercial building construction workers in Victoria.
Chart 2.9 presents wage outcomes for a carpenter for the CFMEU Pattern Industry EBA over time, along with the ratio of wages and allowances under the EBAs and those available
6 CFMEU Pattern Industry EBA 2005-2008, CFMEU Pattern Industry EBA 2008-2011, and CFMEU Pattern Industry EBA 2011-2015. The CFMEU Pattern Industry EBAs with construction firms operating in Victoria can be downloaded from the Fair Work Commission website.
80
90
100
110
120
130
140
150
160
170
2007 2009 2011 2013 2015Building construction Construction servicesHeavy and Civil Engineering Construction Total construction
Index, 2007 = 100

Construction sector – outlook, labour costs and productivity
13
Deloitte Access Economics
under the federal award. Both cases assume the industry standard 56 hour week, which translates into an average of 51 hours per week once Rostered Days Off (RDOs) are taken into account.7
Chart 2.9: Specific EBA wage outcomes for a carpenter – comparison with award wages
Source: Deloitte Access Economics analysis of CFMEU Pattern Industry EBAs, the Building and Construction General On-site Award 2010 and the National Building and Construction Industry Award 2000
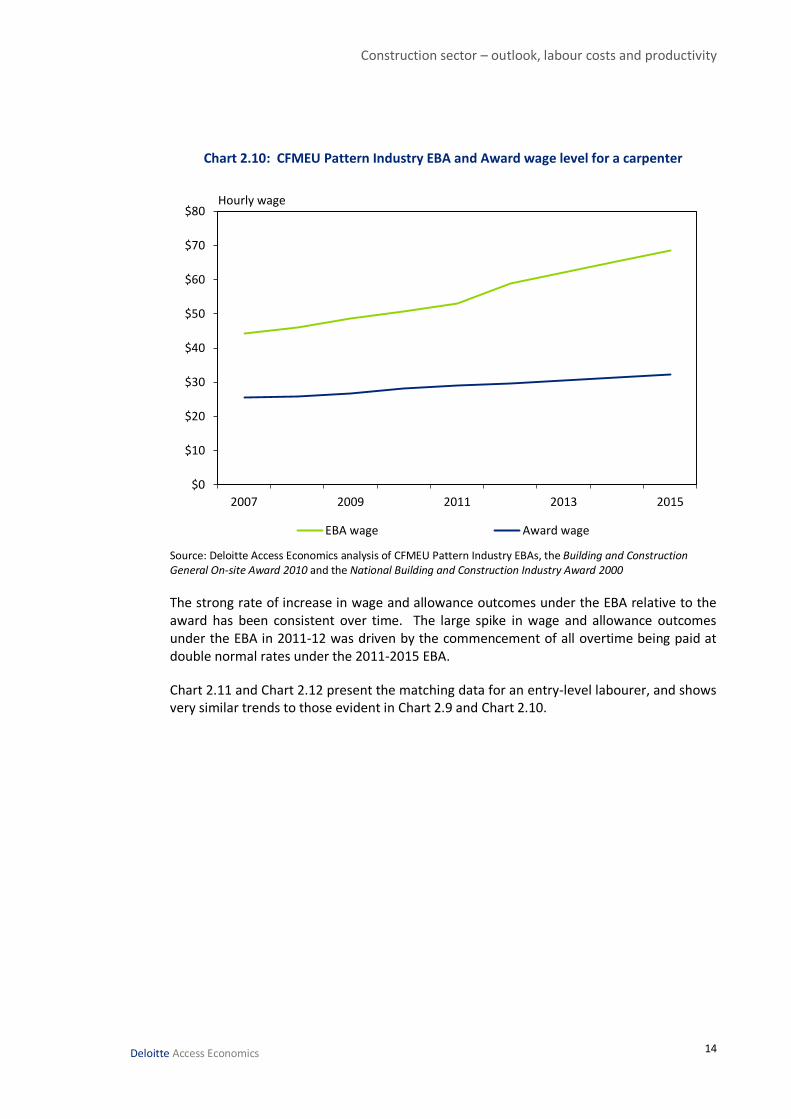
Chart 2.9 highlights the higher growth of wages under the negotiated EBAs, which has compounded over time. Award payments increased by 26.7% between June 2007 and June 2015, while payments under the CFMEU Pattern Industry EBA increased by 55.3%. This is highlighted further in Chart 2.10 which shows the hourly wage level under the CFMEU Pattern Industry EBA and the Award over time.
7 This represents a 102 hour two week cycle, which is comprised of a 56 hour week with 10 hours worked per day Monday to Thursday, and 8 hours per day Friday and Saturday, and a 46 hour week with 10 hours worked per day Tuesday to Thursday, 8 hours on Friday and 8 hours on Saturday, with the Monday a Rostered Day Off.
140%
150%
160%
170%
180%
190%
200%
210%
220%
0%
2%
4%
6%
8%
10%
12%
2007 2009 2011 2013 2015
EBA wage growth Award wage growth EBA wage level (RHS)
Ratio to award wage% ch, 12 months to 30 June
Construction sector – outlook, labour costs and productivity
14
Deloitte Access Economics
Chart 2.10: CFMEU Pattern Industry EBA and Award wage level for a carpenter
Source: Deloitte Access Economics analysis of CFMEU Pattern Industry EBAs, the Building and Construction General On-site Award 2010 and the National Building and Construction Industry Award 2000
The strong rate of increase in wage and allowance outcomes under the EBA relative to the award has been consistent over time. The large spike in wage and allowance outcomes under the EBA in 2011-12 was driven by the commencement of all overtime being paid at double normal rates under the 2011-2015 EBA.
Chart 2.11 and Chart 2.12 present the matching data for an entry-level labourer, and shows very similar trends to those evident in Chart 2.9 and Chart 2.10.
$0
$10
$20
$30
$40
$50
$60
$70
$80
2007 2009 2011 2013 2015
EBA wage Award wage
Hourly wage

Construction sector – outlook, labour costs and productivity
15
Deloitte Access Economics
Chart 2.11: Specific EBA wage outcomes for an entry-level labourer – comparison with award wages
Source: Deloitte Access Economics analysis of CFMEU Pattern Industry EBAs, the Building and Construction General On-site Award 2010 and the National Building and Construction Industry Award 2000
Chart 2.12: CFMEU Pattern Industry EBA and Award wage level for an entry-level labourer
140%
150%
160%
170%
180%
190%
200%
210%
220%
0%
2%
4%
6%
8%
10%
12%
2007 2009 2011 2013 2015
EBA wage growth Award wage growth EBA wage level (RHS)
Ratio to award wage% ch, 12 months to 30 June
$0
$10
$20
$30
$40
$50
$60
$70
$80
2007 2009 2011 2013 2015
EBA wage Award wage
Hourly wage
Construction sector – outlook, labour costs and productivity
16
Deloitte Access Economics
Source: Deloitte Access Economics analysis of CFMEU Pattern Industry EBAs, the Building and Construction General On-site Award 2010 and the National Building and Construction Industry Award 2000
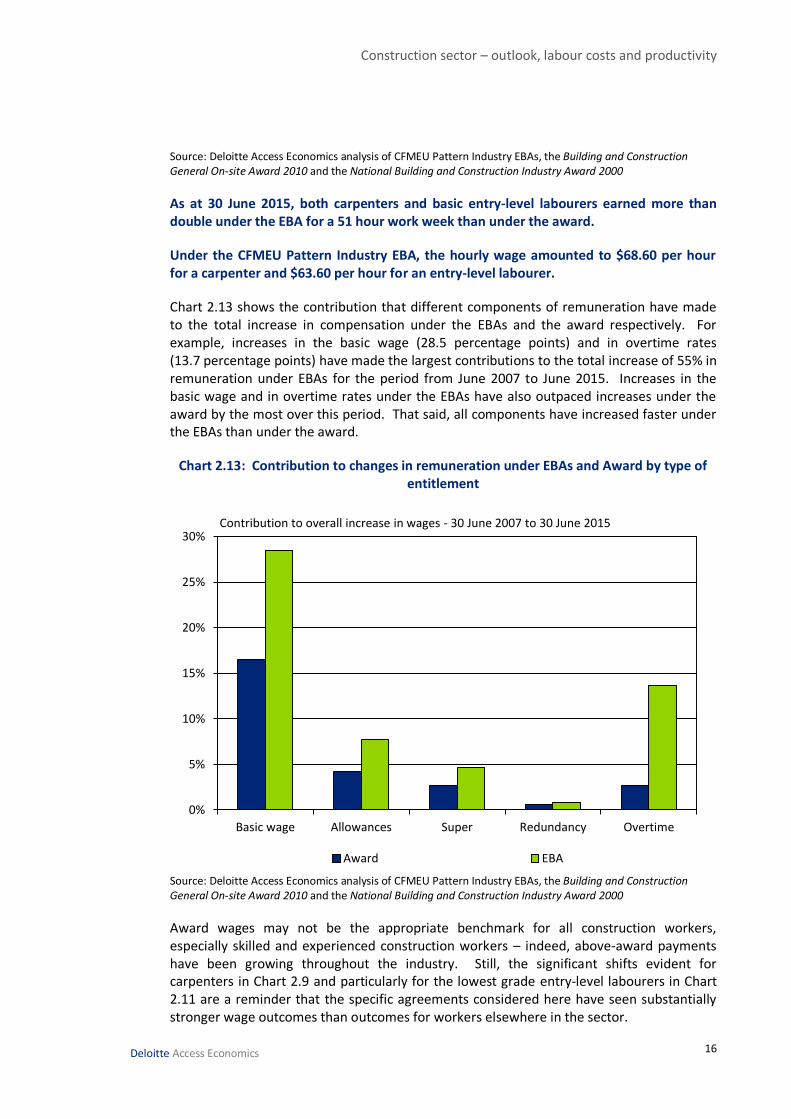
As at 30 June 2015, both carpenters and basic entry-level labourers earned more than double under the EBA for a 51 hour work week than under the award.
Under the CFMEU Pattern Industry EBA, the hourly wage amounted to $68.60 per hour for a carpenter and $63.60 per hour for an entry-level labourer.
Chart 2.13 shows the contribution that different components of remuneration have made to the total increase in compensation under the EBAs and the award respectively. For example, increases in the basic wage (28.5 percentage points) and in overtime rates (13.7 percentage points) have made the largest contributions to the total increase of 55% in remuneration under EBAs for the period from June 2007 to June 2015. Increases in the basic wage and in overtime rates under the EBAs have also outpaced increases under the award by the most over this period. That said, all components have increased faster under the EBAs than under the award.
Chart 2.13: Contribution to changes in remuneration under EBAs and Award by type of entitlement
Source: Deloitte Access Economics analysis of CFMEU Pattern Industry EBAs, the Building and Construction General On-site Award 2010 and the National Building and Construction Industry Award 2000
Award wages may not be the appropriate benchmark for all construction workers, especially skilled and experienced construction workers – indeed, above-award payments have been growing throughout the industry. Still, the significant shifts evident for carpenters in Chart 2.9 and particularly for the lowest grade entry-level labourers in Chart 2.11 are a reminder that the specific agreements considered here have seen substantially stronger wage outcomes than outcomes for workers elsewhere in the sector.
0%
5%
10%
15%
20%
25%
30%
Basic wage Allowances Super Redundancy Overtime
Award EBA
Contribution to overall increase in wages - 30 June 2007 to 30 June 2015

Construction sector – outlook, labour costs and productivity
17
Deloitte Access Economics
Construction workers under the current EBA also receive higher wages than most other occupations in Victoria.
In 2014, the total wages, allowances and entitlements included in this analysis amounted to around $155,961 per year for a carpenter and $144,506 per year for an entry-level labourer for a 51 hour work week. Under the federal award, similar workers are entitled to $74,667 and $69,939 respectively. In 2015, the earnings of carpenters and entry-level labourers under the CFMEU Pattern Industry EBA increased to $163,825 and $151,794 respectively. The latter two amounts can be compared to an entitlement under the federal award of $76,361 and $71,545 in 2015 for carpenters and entry-level labourers respectively.
Chart 2.14 and Chart 2.15 show a comparison of earnings across a selection of major non-managerial occupations in Victoria in 2014 with the earnings of carpenters and entry-level construction labourers under the EBA.
Chart 2.14: Average annual earnings of full-time non-managerial employees paid at the adult rate by occupation in Victoria, 2014
Source: Deloitte Access Economics analysis of ABS Cat. No. 6306.0 and CFMEU Pattern Industry EBA 2011-2015
Notes: Weekly earnings for carpenters and entry-level labourers under the EBA are calculated for a 51 hour work week. Weekly earnings have been annualised by multiplying by 52. Due to unavailability of data the earnings for defence force members, fire fighters and police shown is for male employees only, while earnings for all other occupations is for all employees. Earnings are based on regular wages and salaries in cash (including amounts salary sacrificed where it is the choice of the employee), and so exclude superannuation. The earnings for carpenters and entry-level labourers shown here also exclude a number of other on costs and allowances including redundancy, income protection, portable sick leave, Coinvest, training levy, first aid allowance and away from home allowance.
As shown in the comparison of annualised earnings in Chart 2.13, carpenters under the EBA earned more than double the average earnings across all occupations in Victoria in 2014, while entry-level construction labourers under the EBA earned almost double the average.
Construction sector – outlook, labour costs and productivity
18
Deloitte Access Economics
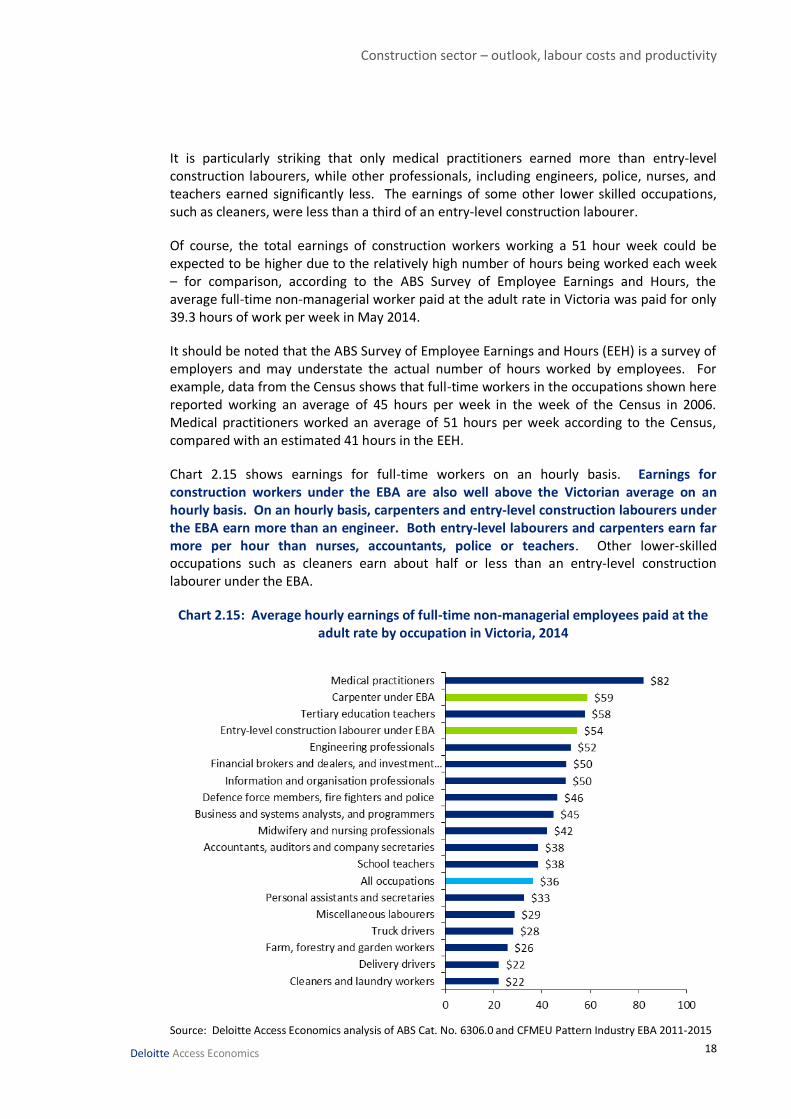
It is particularly striking that only medical practitioners earned more than entry-level construction labourers, while other professionals, including engineers, police, nurses, and teachers earned significantly less. The earnings of some other lower skilled occupations, such as cleaners, were less than a third of an entry-level construction labourer.
Of course, the total earnings of construction workers working a 51 hour week could be expected to be higher due to the relatively high number of hours being worked each week – for comparison, according to the ABS Survey of Employee Earnings and Hours, the average full-time non-managerial worker paid at the adult rate in Victoria was paid for only 39.3 hours of work per week in May 2014.
It should be noted that the ABS Survey of Employee Earnings and Hours (EEH) is a survey of employers and may understate the actual number of hours worked by employees. For example, data from the Census shows that full-time workers in the occupations shown here reported working an average of 45 hours per week in the week of the Census in 2006. Medical practitioners worked an average of 51 hours per week according to the Census, compared with an estimated 41 hours in the EEH.
Chart 2.15 shows earnings for full-time workers on an hourly basis. Earnings for construction workers under the EBA are also well above the Victorian average on an hourly basis. On an hourly basis, carpenters and entry-level construction labourers under the EBA earn more than an engineer. Both entry-level labourers and carpenters earn far more per hour than nurses, accountants, police or teachers. Other lower-skilled occupations such as cleaners earn about half or less than an entry-level construction labourer under the EBA.
Chart 2.15: Average hourly earnings of full-time non-managerial employees paid at the adult rate by occupation in Victoria, 2014
Source: Deloitte Access Economics analysis of ABS Cat. No. 6306.0 and CFMEU Pattern Industry EBA 2011-2015

Construction sector – outlook, labour costs and productivity
19
Deloitte Access Economics
Notes: Hourly earnings for carpenters and entry-level labourers under the EBA are calculated for a 51 hour work week. Due to unavailability of data the earnings for defence force members, fire fighters and police shown is for male employees only, while earnings for all other occupations is for all employees. Earnings are based on regular wages and salaries in cash (including amounts salary sacrificed where it is the choice of the employee), and so exclude superannuation. The earnings for carpenters and entry-level labourers shown here also exclude a number of other on costs and allowances including redundancy, income protection, portable sick leave, Coinvest, training levy, first aid allowance and away from home allowance.
Since workers in professional occupations are typically paid a fixed salary which translates to a fixed level of weekly earnings and the number of hours worked by those workers may be understated in the EEH, average hourly earnings may be overstated for these occupations in the EEH. If this is the case, it would make the discrepancy between average hourly earnings for construction workers under EBAs and other workers in Victoria even more stark.
2.2.4 Comparison with broader wage growth
EBA wage growth in construction can also be compared to broader wage growth for the construction industry as well as for other industries, as measured by the WPI. The WPI is a broad measure of wage growth for workers covered by EBAs as well as those workers in less unionised sectors such as house construction, whose wages are usually not determined by EBAs. The WPI is therefore less likely to be impacted by union influences than the measure of EBA wage growth.
Chart 2.16: EBA wage growth and WPI wage growth in the Victorian construction industry
Source: Department of Employment EBA data, ABS 6302.0, ABS 6345.0, Deloitte Access Economics
In short, EBA wage growth outcomes have been higher on average than the broader WPI measure of wage increases, and they have also tended to be relatively stable at those
0%
1%
2%
3%
4%
5%
6%
7%
8%
2007 2009 2011 2013 2015
EBAs (AAWI) WPI
% change per annum

Construction sector – outlook, labour costs and productivity
20
Deloitte Access Economics
higher rates. In other words, EBA wage growth outcomes have tended to be both higher as well as less responsive to changing market conditions over time.
Both of these differences are evident since 2011, with growth in WPI showing moderation amid a weakening in broader demand as well as an easing of inflationary pressures and broader wage growth across the economy, but with EBA wage growth remaining at historically strong levels over the same period.
Wage outcomes under Victoria’s construction sector EBAs have outpaced the WPI for the Victorian construction sector by 13.4 percentage points from June 2007 to June 2015.
As Chart 2.17 shows, that EBA wage ‘gap’ between EBA wage growth and WPI wage growth has been especially high for the Victorian construction sector when compared with the matching EBA ‘gap’ in other industries.
Chart 2.17: The national EBA wage ‘gap’ across industries from 2007 to 2015
Source: Department of Employment EBA data, ABS 6345.0, Deloitte Access Economics.
Note: The wage gap for Victorian construction is shown as a comparison. The wage gap for all other industries is the national wage gap.
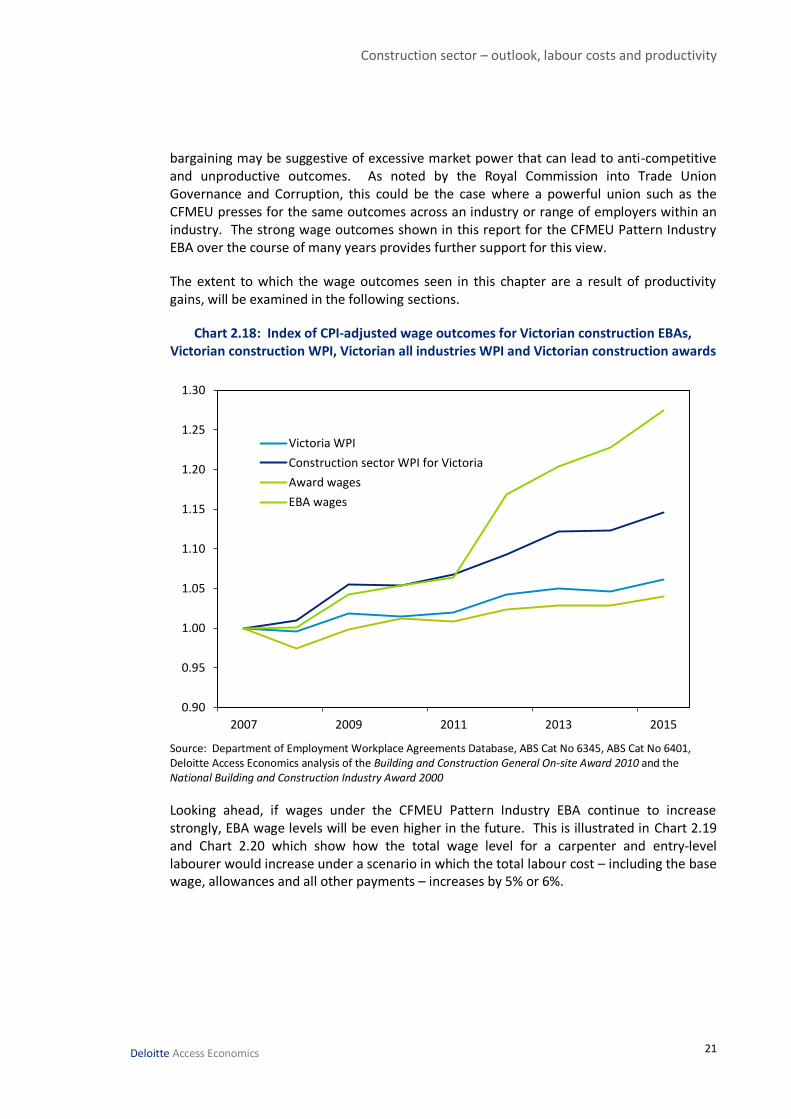
Finally, Chart 2.18 shows an index of Victorian construction EBA wage outcomes along with broader wage outcomes and outcomes under awards after adjusting for CPI. While awards have generally moved in line with the CPI, EBA wage outcomes and broader wage outcomes have outpaced CPI movements. This is generally to be expected as wage gains will also reflect increases in labour productivity over time. Even so, wage growth under the CFMEU Pattern Industry EBA has been particularly strong over time.
As noted recently by both the Productivity Commission Review of the Workplace Relations Framework and Royal Commission into Trade Union Governance and Corruption, pattern
0% 2% 4% 6% 8% 10% 12% 14%
Financial and insurance services
Health care and social assistance
Mining
Arts and recreation services
Retail trade
Public administration and safety
Wholesale trade
Electricity, gas, water and waste services
Transport, postal and warehousing
Information media and telecommunications
All industries
Manufacturing
Professional, scientific and technical services
Other services
Education and training
Accommodation and food services
Administrative and support services
Rental, hiring and real estate services
Construction
Victorian construction
Construction sector – outlook, labour costs and productivity
21
Deloitte Access Economics
bargaining may be suggestive of excessive market power that can lead to anti-competitive and unproductive outcomes. As noted by the Royal Commission into Trade Union Governance and Corruption, this could be the case where a powerful union such as the CFMEU presses for the same outcomes across an industry or range of employers within an industry. The strong wage outcomes shown in this report for the CFMEU Pattern Industry EBA over the course of many years provides further support for this view.
The extent to which the wage outcomes seen in this chapter are a result of productivity gains, will be examined in the following sections.
Chart 2.18: Index of CPI-adjusted wage outcomes for Victorian construction EBAs, Victorian construction WPI, Victorian all industries WPI and Victorian construction awards
Source: Department of Employment Workplace Agreements Database, ABS Cat No 6345, ABS Cat No 6401, Deloitte Access Economics analysis of the Building and Construction General On-site Award 2010 and the National Building and Construction Industry Award 2000
Looking ahead, if wages under the CFMEU Pattern Industry EBA continue to increase strongly, EBA wage levels will be even higher in the future. This is illustrated in Chart 2.19 and Chart 2.20 which show how the total wage level for a carpenter and entry-level labourer would increase under a scenario in which the total labour cost – including the base wage, allowances and all other payments – increases by 5% or 6%.
0.90
0.95
1.00
1.05
1.10
1.15
1.20
1.25
1.30
2007 2009 2011 2013 2015
Victoria WPI
Construction sector WPI for Victoria
Award wages
EBA wages

Construction sector – outlook, labour costs and productivity
22
Deloitte Access Economics
Chart 2.19: Wage level for entry-level labourers under 5% and 6% wage increase scenarios
Source: Deloitte Access Economics
Chart 2.20: Wage level for carpenters under 5% and 6% wage increase scenarios
Source: Deloitte Access Economics
$50
$55
$60
$65
$70
$75
$80
$85
$90
2015 2016 2017 2018 2019
5% wage increase
6% wage increase
Hourly wage
$50
$55
$60
$65
$70
$75
$80
$85
$90
2015 2016 2017 2018 2019
5% wage increase
6% wage increase
Hourly wage
Construction sector – outlook, labour costs and productivity
23
Deloitte Access Economics
2.3 Construction costs
Rising construction sector wages combined with low growth in prices being charged by constructors in Victoria indicates that profits will be squeezed in the absence of gains in labour productivity.
2.3.1 The price of construction work
Chart 2.21 shows that prices for construction work have continued to rise in both Victoria and Australia. Victoria has seen a rise in prices slightly stronger than for Australia over the period from 2007 to 2015.
Latest data indicate that prices of construction work done in Victoria rose by 1.5% over the year to the September quarter 2015, outpacing the rise for Australia as a whole of 1.0%. By sector, prices for housing construction in Victoria rose 2.7% over the year to the June quarter 2015, likely reflecting the recent strength in housing construction, while prices fell 0.4% in non-residential building and rose 1.0% in engineering construction.
These overall price rises remain relatively moderate, but should be seen in the context of a broader easing in inflationary pressures. In particular, a range of commodity prices fell sharply in 2015, which reduces the overall price of materials used in construction.
Indeed, the price of construction services, which abstracts from intermediate inputs such as materials, and reports on the price of the value added by the construction industry, recorded a rise of 6.6% from the previous year in both Victoria and Australia in 2014-15.

Construction sector – outlook, labour costs and productivity
24
Deloitte Access Economics
Chart 2.21: Price of construction work done, Victoria and Australia
Source: ABS Cat No. 6345, ABS Cat No. 8755, Deloitte Access Economics
Chart 2.22 shows that wage rises in the construction industry have outpaced increases in the price of construction work done in both Victoria and Australia over recent years. That remained the case over the past year, with growth in the construction WPI in Victoria of 3.1% over the year to September 2015 comparing with a rise in the price of construction work done of 1.5%. For the CFMEU Pattern Industry EBA, where the rise in wages was 5.0%, the discrepancy has been even larger.
The developments shown in this chart help to illustrate some of the concerns expressed by constructors about unaffordable rises in wage costs.
90
100
110
120
2007 2008 2009 2010 2011 2012 2013 2014 2015
Victoria Australia
June 2007 = 100

Construction sector – outlook, labour costs and productivity
25
Deloitte Access Economics
Chart 2.22: The relative price of labour compared with the price of construction work done, Victoria and Australia
Source: ABS Cat No. 6345, ABS Cat No. 8755, Deloitte Access Economics
Note: This chart shows the ABS Wage Price Index for Construction divided by the price of all construction work done for Victoria and Australia respectively.
As Chart 2.22 shows, the discrepancy between wage rises and price rises has been greater in Victoria than nationally in recent years. The discrepancy has also been more pronounced for labour under construction EBAs where wage rises have been higher. This is seen particularly in non-residential construction, where high, inflexible wage increases have seen the cost of labour rise significantly relative to the price of construction work, putting further pressure on operating profits.
2.3.2 The broader impact of higher construction costs
The Productivity Commission (2014) recently provided a broad outline of the impact higher labour costs could have on construction costs in its examination of public infrastructure:
Labour costs accounted for 23 per cent of total construction costs in 2011-12 (ABS 2013a). Putting aside any substitution by capital or intermediate inputs, an increase in the returns to labour of 10 per cent without a corresponding productivity improvement would increase construction costs by 2.3 per cent (and with a fixed markup, prices by the same proportion). This is not trivial because of the huge investments in public infrastructure.
Using this basic framework, the impact that rising labour costs would have on the construction cost of several different buildings and on the Victorian Government’s total infrastructure expenditure is shown here.
85
95
105
115
125
2007 2009 2011 2013 2015
Victoria Australia
June 2007 = 100

Construction sector – outlook, labour costs and productivity
26
Deloitte Access Economics
Note that since the Productivity Commission’s report was finalised, the ABS has released updated data. The latest data show that labour costs accounted for 22% of total construction costs in 2013-14, which is the figure used for calculations in this report.
The impact of past wage increases
The excess wage growth under the construction EBAs in Victoria compared with broader wage growth in the construction sector as measured by the construction WPI was 13.4 percentage points over the period from June 2007 to June 2015. As an illustration of the impact that such an increase in labour costs can have on building costs, Table 2.2 shows the impact of a 13% difference in labour costs without a corresponding increase in productivity on total building costs in Melbourne on a cost per square metre basis.

Construction sector – outlook, labour costs and productivity
27
Deloitte Access Economics
Table 2.2: The impact of higher labour costs on building costs in Melbourne ($/m2)
Initial building cost1
Increased building cost due to higher
labour cost2
Difference
Building Low High Low High Low High
Office buildings – 25 to 40 storeys – prestige CBD
3200 3600 3295 3706 95 106
Hotels – multi-storey – 4 star
3250 4200 3346 4324 96 124
Aged care – single storey facility
1750 2375 1802 2445 52 70
Private hospitals – low rise – 45-60m2 GFA/Bed
2600 3050 2677 3140 77 90
Private hospitals – low rise – 55-80m2 GFA/Bed with Major Operating Theatre
2900 3500 2986 3603 86 103
Department store 1925 2325 1982 2394 57 69
Supermarket 1215 1800 1251 1853 36 53
Multi-storey units – 20 to 40 storeys – units 60-70 m2
3000 3500 3089 3603 89 103
Source: Riders Digest 2016, Deloitte Access Economics
1 Total building cost per gross floor area ($/m2) as at the fourth quarter of 2015 shown in the Melbourne edition
of the Riders Digest. Data sourced from: http://www.rlbintelligence.com/
2 Increase in labour costs of 13.4%, equivalent to the excess wage growth under construction EBAs in Victoria compared with WPI wage indexation from June 2007 to June 2015
The table illustrates the importance of productivity growth in paying for the growth in construction wages over time. Otherwise, a rise in labour costs (ahead of productivity gains) will mean that the cost of construction will rise for a range of buildings, including offices, hotels, shops, schools, apartments and hospitals. In turn, the cost of doing business and the cost of living in Victoria also increase. The cost of living in Victoria will also increase due to higher construction costs for high-rise apartments, thereby placing additional pressure on dwelling prices in Melbourne.
The adverse impacts of rising labour costs not matched by productivity gains will also be felt by the Victorian Government. The Victorian Government has stated that its infrastructure investment is expected to be $5.0 billion in 2015-16. Infrastructure investment of $6.3 billion is expected in 2016-17 (covering government and PPP infrastructure investment), and a total expenditure of $21.0 billion is expected over the period from 2015-16 to 2018-19 inclusive.8
A difference in labour costs of 13% without corresponding productivity growth would mean that the cost of the Victorian Government’s infrastructure purchases of $5.0 billion
8 State of Victoria (Department of Treasury and Finance), 2015-16 Budget Update.

Construction sector – outlook, labour costs and productivity
28
Deloitte Access Economics
in 2015-16 would rise to $5.15 billion, an increase of $148 million.9 In other words, to purchase the same amount of infrastructure, an additional $148 million would be needed. Over the period from 2015-16 to 2018-19, the additional cost would amount to $621 million in total over those four years.
To put this in context, the Victorian Government recently announced a $291 million project to deliver 15 new schools – around $19.4 million per school – while it has budgeted $200 million to deliver the new Western Women’s and Children’s Hospital.10 Higher construction costs driven by unsustainably strong rises in construction labour costs raise the likelihood of projects such as these not going ahead, given the budget constraints that the Victorian Government faces.
The additional cost of $621 million to the Victorian Government’s total infrastructure spend over the four years from, and including, FY 2015-16 to 2018-19 (the impact of the extent to which Victorian construction EBAs have outpaced wages in the broader Victorian construction sector from 2007 to 2015) is equivalent to the cost of building eleven schools and two hospitals.11 Hence, agreements for higher wages levels involve real trade-offs for taxpayer funds.
And, if the projects do proceed, then taxes would need to be higher (or other public spending reduced), meaning that the broader public was partly funding the higher wages in the construction sector.
In summary, while all taxpayers will ultimately wear the additional costs so that Government projects go ahead, it should be noted that private projects involving a wide range of buildings essential for Victorians may also be shelved as uneconomic in the face of unsustainably strong rises in labour costs.
As shown earlier in Chart 2.1, private sector commercial construction work is expected to amount to around $18.7 billion annually in Victoria or a total of around $75 billion over the period from 2015-16 to 2018-19. A difference in labour costs of 13% without corresponding productivity growth would represent an increase in construction costs for private sector construction work of around $2.2 billion in total over that period.
Someone always pays: higher labour costs eventually mean higher construction costs for buildings such as offices, hotels, shops, schools and hospitals, and also place upward cost pressure on the Victorian Government’s infrastructure budget.
In turn, these costs to private businesses and to taxpayers fall in part on Victorian families, including via higher prices. Although such subsidies to construction workers from all other workers may not be well understood or well recognised, it is in this way that the broader public funds large wage rises seen in the construction industry.
9 This takes into account that labour costs as a share of total costs for the construction industry are around 22% as reported in ABS Cat. No. 5260.0.55.002.
10 http://www.premier.vic.gov.au/building-underway-on-291m-project-for-15-new-schools/.
http://www.premier.vic.gov.au/new-western-womens-childrens-hospital-under-way/
11 Assuming the cost for a school is $19.4 million and the cost of a hospital is $200 million, reflecting the costs of
delivering 15 new schools and the Western Women’s and Children’s Hospital respectively.

Construction sector – outlook, labour costs and productivity
29
Deloitte Access Economics
The impact of future wage increases
An illustration of the impact of higher labour costs on construction costs for two possible scenarios of future wage increases is also considered. In each case, the impact of higher EBA wage growth (at 5% per annum and 6% per annum) on construction costs is shown relative to Deloitte Access Economics’ expectation of construction WPI growth in Victoria. It is assumed that EBA wage increases in excess of wage increases for the construction WPI in Victoria are not underpinned by any productivity gains. In each case, the analysis relates to EBA wage increases occurring every twelve months over the period from 2015-16 to 2018-19, with the first wage increase occurring in mid-2016.
Impact of combined past and future wage increases
Past wage increases not underpinned by higher productivity are likely to have increased the cost of construction, while future wage increases will further raise that cost. For example:
In total, the combined impact of past wage increases and future wage increases at 5% per annum is an increase in the cost of delivering government infrastructure of $806 million over the four years from, and including, FY 2015-16 to 2018-19. That $806 million is equivalent to the cost of 10 schools and three hospitals.
If future wage increases continue at 6% per annum instead of 5% per annum, then the increase in the cost of delivering government infrastructure is $875 million over the four years from, and including, FY 2015-16 to 2018-19.
The combined impact of past wage increases and future wage increases of 5% per annum wage is an increase in the cost of building department stores of around $88 per square metre. That wage increase would have added around $4.2m to the cost of the Emporium retail centre and upwards of $44.8 million to the cost of the Crown Casino Complex and Entertainment Centre.12
2.4 Productivity
Chart 2.23 shows labour productivity for the Victorian and national construction industry respectively. Productivity growth in the Victorian construction industry has generally lagged behind the nation as a whole since around 2004-05.
12 An increase in cost of $88 per square metre applied to 48,000 square metres of space in the case of the Emporium retail centre and 510,000 square metres of space in the case of Crown Casino Complex and Entertainment Centre.

Construction sector – outlook, labour costs and productivity
30
Deloitte Access Economics
Chart 2.23: Construction labour productivity, Victoria and Australia
Source: ABS Cat No. 5220.0, ABS Cat No. 6291.0.55.003 (Data cube EQ03), Deloitte Access Economics
While part of this may reflect a shift towards higher productivity engineering construction work at the national level, productivity growth in the Victorian construction industry has been subdued over the past decade.
As Chart 2.23 shows, the level of productivity in the construction industry can be volatile from year to year. While there was a rebound in the Victorian construction industry’s measured productivity in 2014-15, that followed several years of decline. As a result, the level of productivity in the Victorian construction industry in 2014-15 was lower than the same level a decade ago.
Chart 2.24 shows productivity growth in the Victorian construction industry compared with productivity growth for the broader market sector in Victoria. Again, productivity growth in the Victorian construction industry has been lower than productivity growth in the broader market sector over time.
80
90
100
110
120
130
140
150
160
1990-91 1993-94 1996-97 1999-00 2002-03 2005-06 2008-09 2011-12 2014-15
Victoria Australia
Gross value added per hour worked - Index, 1991-92 = 100
$49/hr
$65/hr

Construction sector – outlook, labour costs and productivity
31
Deloitte Access Economics
Chart 2.24: Labour productivity in the construction and market sectors, Victoria
Source: ABS Cat No. 5220.0, ABS Cat No. 6291.0.55.003 (Data cube EQ03), Deloitte Access Economics
As Chart 2.24 shows, productivity in the construction industry can be highly variable over time, with measured productivity growth rates highly dependent on the starting and ending points. In part, this reflects the influence of the business cycle on productivity, with productivity levels picking up when business conditions are strong, and easing again when conditions weaken. The building construction industry can be particularly susceptible to this pattern, given its highly cyclical in nature.
Nevertheless, it can be seen that productivity growth in the construction industry has generally lagged behind productivity growth elsewhere in the economy in Victoria. Table 2.3 shows productivity growth rates calculated over three different time periods, with productivity growth in construction lagging behind the market sector across all three time periods. The past decade has been particularly poor for productivity growth in construction in Victoria.
Table 2.3: Labour productivity growth in the construction industry, Victoria
Industry Last 20 years Last 10 years Last 5 years
Construction 1.3% -0.8% 0.8%
Market sector 1.7% 0.8% 1.1%
Source: ABS Cat No. 5220.0, ABS Cat No. 6291.0.55.003 (Data cube EQ03), Deloitte Access Economics
The implication of a poor performance on labour productivity in the construction industry in the presence of very strong growth in real wages is that the real labour costs faced by employers in the Victorian construction industry have been rising.
80
90
100
110
120
130
140
150
1990-91 1993-94 1996-97 1999-00 2002-03 2005-06 2008-09 2011-12 2014-15
Construction Market sector
Gross value added per hour worked - Index, 1991-92 = 100
$49/hr
$64/hr

Construction sector – outlook, labour costs and productivity
32
Deloitte Access Economics
2.5 Profitability and insolvency
The profitability of construction firms in Australia and Victoria is investigated using a number of data sources:
The profitability of large commercial construction firms.
Additional data on the broader construction industry.
Insolvencies in the construction industry.
2.5.1 Construction profitability in Australia
Large constructors domiciled nationally
Table 2.4 shows financial data for the largest commercial constructors in Australia, as drawn from IBISWorld’s database of the top 2,000 companies in Australia by revenue. The IBISWorld database allows for a focus on non-residential construction only, excluding residential building.
The IBISWorld data in Table 2.4 shows that profit margins are low for large commercial constructors in Australia. Profit margins have remained squeezed over the past five years. Similarly, the return on assets for large non-residential construction firms in Australia is low, at just 3.3% in 2014-15.
Table 2.4: Profitability of largest Australian non-residential construction firms, 2010-11 to 2014-15
Number of firms
Revenue ($M)
NPAT ($M) Profit Margin (%)
Return on Assets (%)
2010-11 78 70479 946 1.3% 1.6% 2011-12 92 76090 1665 2.2% 2.6% 2012-13 92 86555 1802 2.1% 2.6% 2013-14 91 83908 2931 3.5% 4.2% 2014-15 66 65120 1872 2.9% 3.3%
Source: IBISWorld 2016, Deloitte Access Economics
Note: Firms needed to have data available for revenue, Net Profit After Tax and Total Assets to be included in the sample. Firms classified by IBISWorld as predominantly involved in housing construction or residential building were excluded. Historically a small number of firms have reported results using a financial year basis other than financial years ending 30 June. For these firms, financial results across two years have been averaged to provide an indication of results for financial years ending 30 June.
Additional data on the broader construction industry for Australia
To provide a broader context, Chart 2.25 shows operating profit margins for different industries in Australia in 2013-14. The measure of profit margin shown in this chart is a broader one to that used in the table above. The construction industry in Australia showed a lower profit margin than most other industries operating in Australia in 2013-14. While factors unique to each industry help to determine the level of profit margins across industries, the fact that construction industry profitability has been low relative to most other industries, despite Australia’s mining investment boom strongly lifting the demand for construction services, is notable.

Construction sector – outlook, labour costs and productivity
33
Deloitte Access Economics
In particular, the profit margins of constructors have not benefited as the mining industry’s profit margins did from the favourable swings in commodity prices which helped to keep the mining industry’s profitability elevated in 2013-14.
Chart 2.25: Operating profit margin by industry, Australia, 2013-14
Source: ABS Cat No. 8155.0
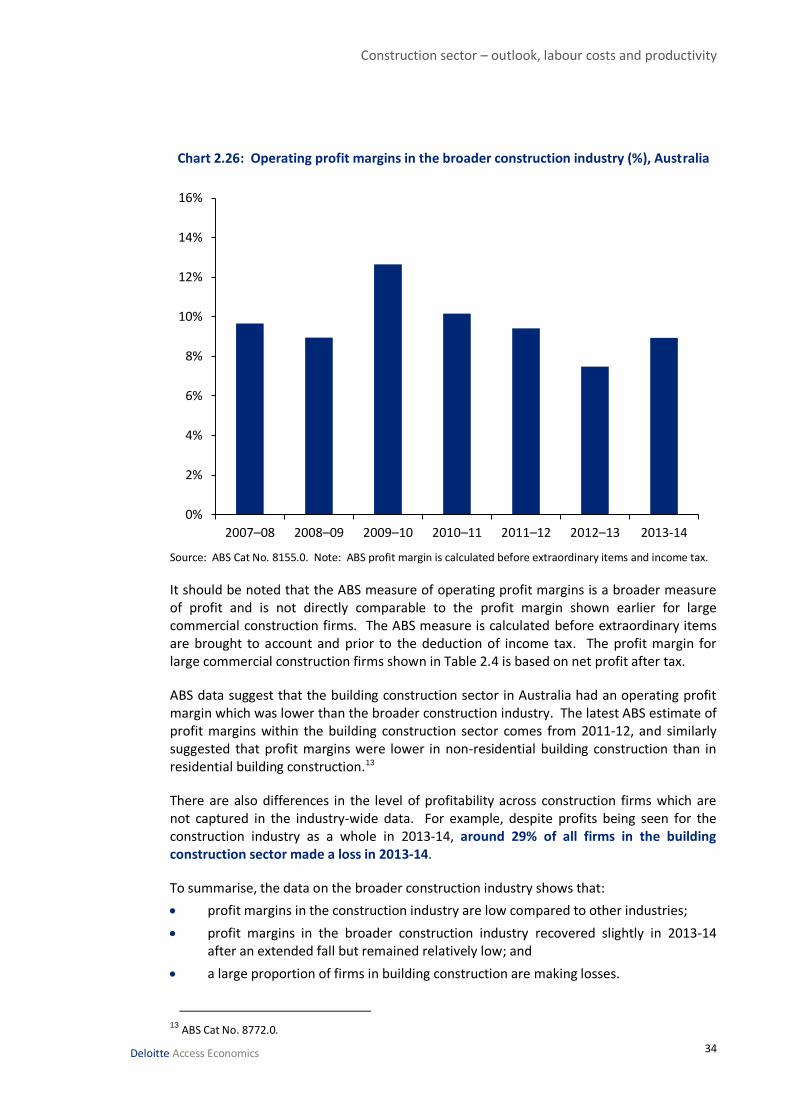
Chart 2.26 shows that profit margins fell in the Australian construction industry from 2009-10 to 2012-13 despite the large rise in construction work done over this period. While remaining relatively low, profit margins recovered slightly in 2013-14, which has likely been assisted by the recent recovery in housing construction activity in Australia.
0%
5%
10%
15%
20%
25%
30%
Construction sector – outlook, labour costs and productivity
34
Deloitte Access Economics
Chart 2.26: Operating profit margins in the broader construction industry (%), Australia
Source: ABS Cat No. 8155.0. Note: ABS profit margin is calculated before extraordinary items and income tax.
It should be noted that the ABS measure of operating profit margins is a broader measure of profit and is not directly comparable to the profit margin shown earlier for large commercial construction firms. The ABS measure is calculated before extraordinary items are brought to account and prior to the deduction of income tax. The profit margin for large commercial construction firms shown in Table 2.4 is based on net profit after tax.
ABS data suggest that the building construction sector in Australia had an operating profit margin which was lower than the broader construction industry. The latest ABS estimate of profit margins within the building construction sector comes from 2011-12, and similarly suggested that profit margins were lower in non-residential building construction than in residential building construction.13
There are also differences in the level of profitability across construction firms which are not captured in the industry-wide data. For example, despite profits being seen for the construction industry as a whole in 2013-14, around 29% of all firms in the building construction sector made a loss in 2013-14.
To summarise, the data on the broader construction industry shows that:
profit margins in the construction industry are low compared to other industries;
profit margins in the broader construction industry recovered slightly in 2013-14 after an extended fall but remained relatively low; and
a large proportion of firms in building construction are making losses.
13 ABS Cat No. 8772.0.
0%
2%
4%
6%
8%
10%
12%
14%
16%
2007–08 2008–09 2009–10 2010–11 2011–12 2012–13 2013-14

Construction sector – outlook, labour costs and productivity
35
Deloitte Access Economics
Construction insolvencies in Australia
A natural consequence of a low level of profitability and a large number of firms making losses is that companies cannot sustain their operations. Chart 2.27 shows that the construction industry has consistently been over-represented among firms entering external administration in Australia over the past six years.
Chart 2.27: Construction industry’s share of all external administration reports lodged
Source: ASIC insolvency statistics (Series 3: External administrators' reports)
Almost a fifth of all firms entering external administration have been firms in the construction industry. The construction industry has been in the top three industries accounting for the most external administrations across all of these years.
2.5.2 Construction profitability in Victoria
As for Australia, the profitability of construction firms in Victoria is investigated using a number of data sources:
The profitability of large commercial construction firms.
Additional data on the broader construction industry.
Insolvencies in the construction industry.
Largest constructors domiciled in Victoria
Table 2.5 shows the profitability of the largest non-residential construction firms domiciled in Victoria using the IBISWorld database.
10%
15%
20%
25%
30%
2008-09 2009-10 2010-11 2011-12 2012-13 2013-14 2014-15

Construction sector – outlook, labour costs and productivity
36
Deloitte Access Economics
The IBISWorld data suggests that profit margins for large Victorian commercial construction firms have fallen in recent years. This is consistent with the IBISWorld data for large constructors nationally which shows profit margins still under pressure, with the data for Victoria additionally suggesting that performance deteriorated further for the largest Victorian based firms in 2013-14 and 2014-15.
It should be noted that the revenue and profit data for Victorian based firms shown in Table 2.5 relates to their total revenue and profit, not just the portion derived from their Victorian operations. Nevertheless, it provides an indication of the financial pressures currently being faced by these firms.
As Table 2.5 shows, not only are profit margins thin, but the return on assets is also extremely low – just 0.7% in 2013-14 and 1.0% in 2014-15. To put this into perspective, an Australian Government 10 year bond currently yields around 2.5% per annum and a one year term deposit with an Australian bank currently pays around 2.4% per annum.14
Yet these are essentially risk-free investments, whereas an investment in a construction business entails significant risk. The situation does not appear to be sustainable without an improvement in the profitability of firms.
Table 2.5: Profitability of largest non-residential construction firms domiciled in Victoria, 2010-11 to 2014-15
Number of firms
Revenue ($M)
NPAT ($M) Profit Margin (%)
Return on Assets (%)
2010-11 11 6755 115 1.7% 3.6% 2011-12 12 7635 91 1.2% 2.5% 2012-13 13 10045 132 1.3% 3.1% 2013-14 13 10022 28 0.3% 0.7% 2014-15 12 8852 39 0.4% 1.0%
Source: IBISWorld 2016, Deloitte Access Economics.
Note: Firms needed to have data available for revenue, Net Profit After Tax and Total Assets to be included in the sample. Firms classified by IBISWorld as predominantly involved in housing construction or residential building were excluded. Only firms classified by IBISWorld as registered in Victoria were included.
The financial performance of the largest Victorian based firms can be contrasted with the financial performance of the largest firms across Australia which as described in the previous section. As shown in Chart 2.28, the profit margin and return on assets of the largest non-residential construction firms based in Victoria were both well below that of all such firms based in Australia in both 2013-14 and 2014-15.
14 Reserve Bank of Australia, Table F2 and F4.
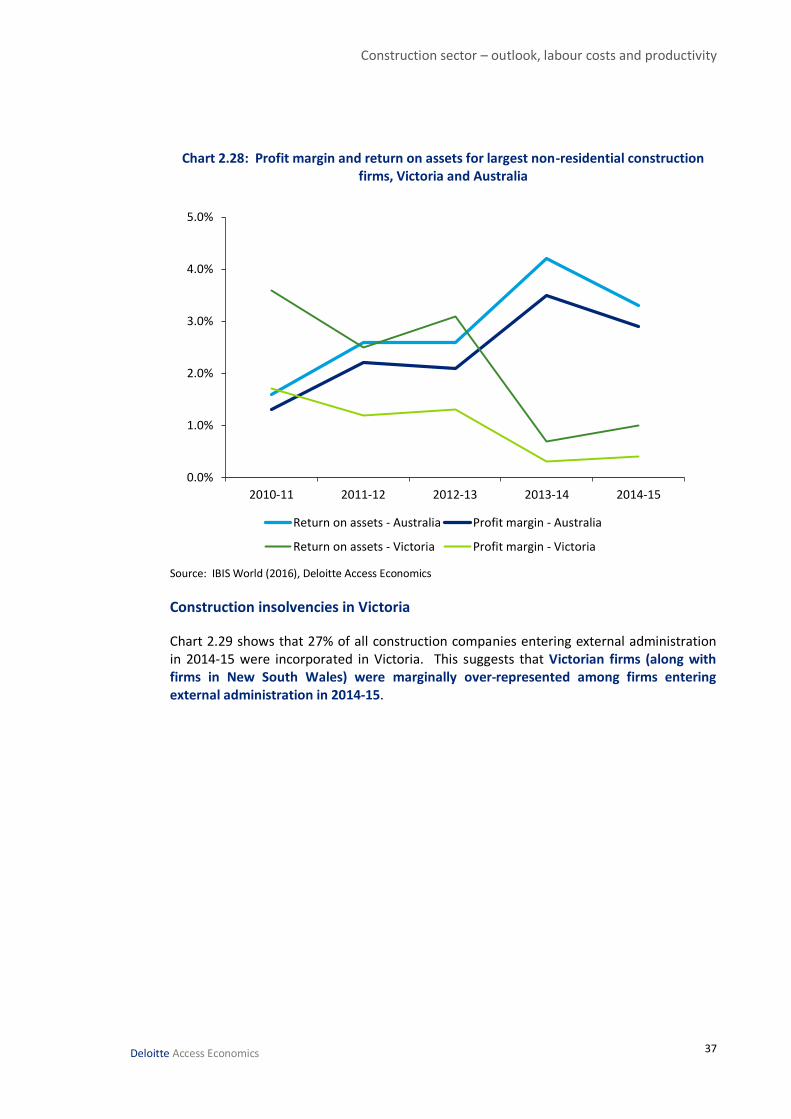
Construction sector – outlook, labour costs and productivity
37
Deloitte Access Economics
Chart 2.28: Profit margin and return on assets for largest non-residential construction firms, Victoria and Australia
Source: IBIS World (2016), Deloitte Access Economics
Construction insolvencies in Victoria
Chart 2.29 shows that 27% of all construction companies entering external administration in 2014-15 were incorporated in Victoria. This suggests that Victorian firms (along with firms in New South Wales) were marginally over-represented among firms entering external administration in 2014-15.
0.0%
1.0%
2.0%
3.0%
4.0%
5.0%
2010-11 2011-12 2012-13 2013-14 2014-15
Return on assets - Australia Profit margin - Australia
Return on assets - Victoria Profit margin - Victoria
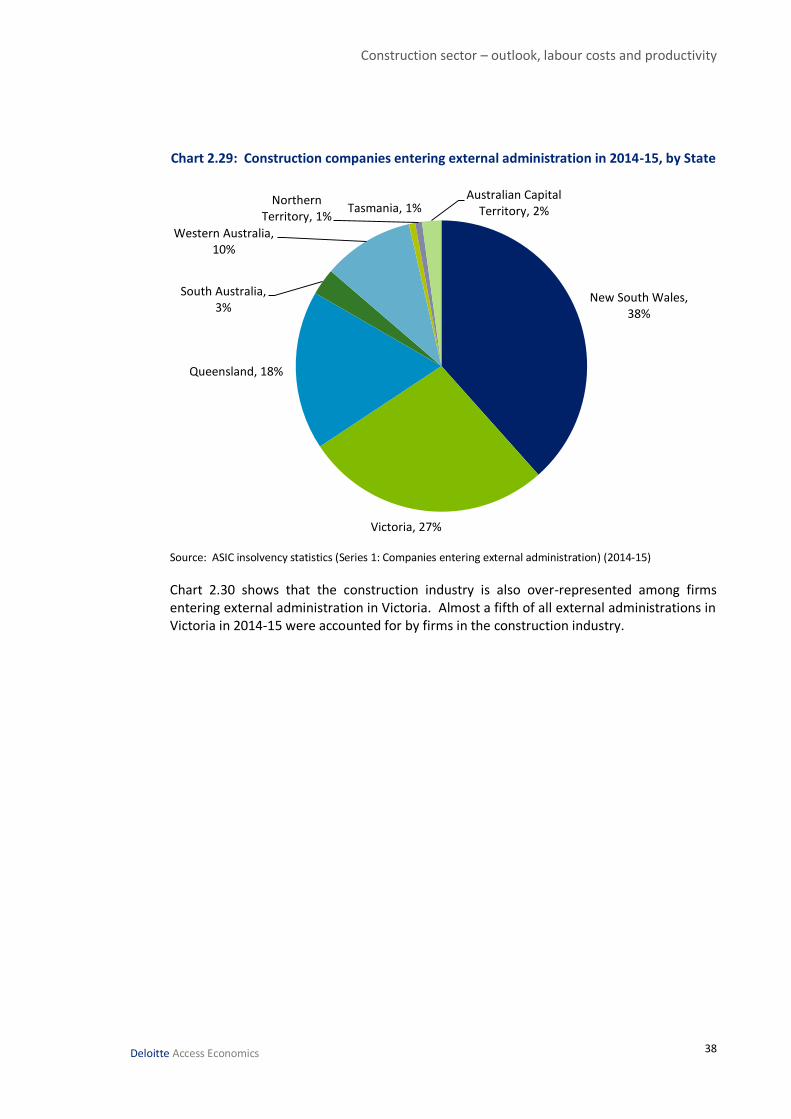
Construction sector – outlook, labour costs and productivity
38
Deloitte Access Economics
Chart 2.29: Construction companies entering external administration in 2014-15, by State
Source: ASIC insolvency statistics (Series 1: Companies entering external administration) (2014-15)
Chart 2.30 shows that the construction industry is also over-represented among firms entering external administration in Victoria. Almost a fifth of all external administrations in Victoria in 2014-15 were accounted for by firms in the construction industry.
New South Wales, 38%
Victoria, 27%
Queensland, 18%
South Australia, 3%
Western Australia, 10%
Tasmania, 1%Northern
Territory, 1%
Australian Capital Territory, 2%

Construction sector – outlook, labour costs and productivity
39
Deloitte Access Economics
Chart 2.30: Share of all companies entering external administration by industry in 2014-15, Victoria
Source: ASIC insolvency statistics (Series 1: Companies entering external administration) (2014-15)
Chart 2.31 indicates that the number of companies in distress in the Victorian construction industry – as measured by the number of initial external administrators’ reports filed with ASIC – had been trending upwards in recent years; however while it remains high it saw a slight decline in 2014-15. This may be a reflection of the recent strength in housing construction sector in Victoria.
0% 5% 10% 15% 20% 25% 30% 35%
Other (business & personal) servicesConstruction
Retail tradeAccommodation
ManufacturingTransport, postal & warehousing
Rental, hiring, real estateInformation media & telecom
Wholesale tradeElectricity, gas, water & waste services
FinanceAgriculture, forestry & fishing
UnknownMining
Professional servicesArts & recreation services
Health care & social assistanceAdministrative…
EducationPublic administration
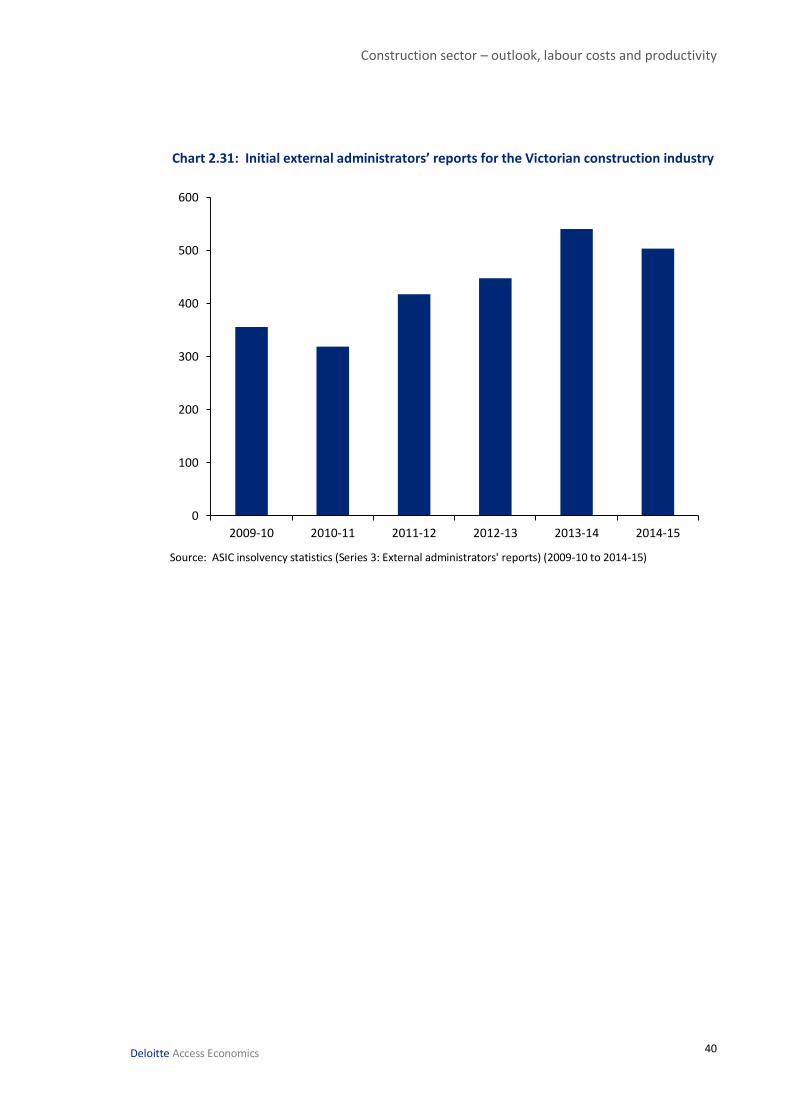
Construction sector – outlook, labour costs and productivity
40
Deloitte Access Economics
Chart 2.31: Initial external administrators’ reports for the Victorian construction industry
Source: ASIC insolvency statistics (Series 3: External administrators' reports) (2009-10 to 2014-15)
0
100
200
300
400
500
600
2009-10 2010-11 2011-12 2012-13 2013-14 2014-15

Construction sector – outlook, labour costs and productivity
41
Deloitte Access Economics
Appendix A: Analysis of EBAs and awards As part of the analysis presented in this report, Deloitte Access Economics has examined a number of award and EBA provisions to estimate the total hourly cost of wages and allowances, as well as data from the Department of Employment’s Workplace Agreements Database.
Workplace Agreements Database
As part of its role in administering industrial relations arrangements, the Federal Department of Employment collects information on all federal collective agreements.
From this database, Deloitte Access Economics has obtained a detailed listing of all federally certified construction sector EBAs since 2000. This data allows the calculation of annual wage inflation as measured by the Average Annualised Wage Increase (AAWI) per employee for the construction industry’s EBAs since 2000, including in Victoria.
The AAWI measure is calculated for agreements that provide quantifiable wage increases over the life of the agreement. It allows for examination of wage increases across all EBAs certified in the construction sector but examines only increases to the base rate of pay, and does not take into account allowances and other payments such as bonuses that are paid separate to the base wage.
The data for the construction industry can be broken down into three sub-sectors – building construction, heavy and civil engineering and construction services.
These sub-sectors are briefly defined below:
Building construction: mainly engaged in the construction of non-residential buildings such as hotels, motels, hostels, schools, hospitals, prisons or other buildings, in carrying out alterations, additions or renovation to such buildings, or in organising or managing these activities. Building construction also includes construction of residential buildings such as housing construction and apartment construction. It should be noted that industry practice is such that EBAs are rarely used for housing construction. The EBA developments for building construction will therefore provide an indication of developments in non-residential building and apartment construction.
Heavy and Civil Engineering: mainly engaged in the construction or general repair of roads, bridges, aerodrome runways or parking lots, or in organising or managing these activities. Also includes those mainly engaged in the construction of railway, dams, irrigation systems, harbour or river works, water or gas supply systems, oil refineries (except buildings), pipelines or construction projects not elsewhere classified, in the on-site assembly of furnaces or heavy electrical machinery from prefabricated components, or in the general repair of such structures, machinery or equipment, or in organising or managing these activities.

Construction sector – outlook, labour costs and productivity
42
Deloitte Access Economics
Construction Services: mainly engaged in providing services to support building construction or heavy and civil engineering activities. Includes Land Development and Site Preparation Services, Building Structure Services, Building Installation Services, Building Completion Services, Other Construction Services.
Construction industry awards
Wage and allowance provisions in construction awards are complex, reflecting the broad range of skills required, and conditions faced in the sector.
In order to create a single benchmark series for wages and allowances in the industry, Deloitte Access Economics has adopted the Construction Worker 1 (CW1) and Construction Worker 3 (CW3) – carpenter classifications, which are standard wage classifications in the awards considered.
Wages and allowances are those applying on 30 June of each year. Specific amounts included in the wages and allowances total include:
Minimum hourly wages.
Industry allowance.
Special allowance
Tool allowance.
Follow the job loading.
Fares and travel allowance
Multi-storey allowance. This is assumed to apply in full at the lowest applicable rate, as our estimates of wages and allowances are designed to reflect outcomes in the commercial construction sector.
Superannuation entitlements based on the minimum standards set by the Superannuation Guarantee (Administration) Act 1992, with the superannuation guarantee rates therein being applied to the wages and allowances noted above.
Redundancy provisions equal to 1.75 hours at the minimum hourly rate per week.
In all cases, a five day 38 hour working week has been used to estimate hourly equivalents of daily and weekly payments as necessary.
Construction sector – outlook, labour costs and productivity
43
Deloitte Access Economics
Enterprise bargaining agreements
Deloitte Access Economics has analysed a number of Victorian CFMEU EBAs. These include a series of agreements for one MBAV member covering the period between 2007 and 2015.
We have assumed that past agreements for the single member are representative of the provisions agreed to by all MBAV members over the period being examined.
As with the analysis of awards outlined above, wages and allowances are those applying on 30 June of each year. Specific amounts included in the wages and allowances total include:
Minimum hourly wages.
Site allowance at the lowest applicable metropolitan Melbourne rate.
Fares and travel allowance
Multi-storey allowance. This is assumed to apply in full at the lowest applicable rate, as our estimates of wages and allowances are designed to reflect outcomes in the commercial construction sector.
Superannuation entitlements based on the specified weekly contribution amounts outlined in the agreements.
Redundancy costs are based on weekly Incolink contributions per employee provided separately by MBAV, including apprentice levy but excluding Accident and Illness Benefits and training costs.
While every effort has been made to compare EBA and award wage outcomes on a like for like basis, there are a number of important caveats on the resulting estimates of wages and allowances.
First, the application of a single benchmark across both EBA and award provisions ignores differences in wages and conditions for other workers in the industry, and the wage comparisons presented in this report will not be appropriate for all employees, particularly apprentices and those with specialised skills.
While estimates of EBA wages include site allowance, some of the award allowances that site allowance is intended to replace are excluded from the award wage estimates. These include the likes of hot work, wet work and underground allowances, among others. That said, this exclusion is unlikely to have a substantial impact on the rate of growth in these measures.

Construction sector – outlook, labour costs and productivity
44
Deloitte Access Economics
References Building and Construction General On-site Award 2010
Commonwealth of Australia 2015, 2015 Budget Overview
Commonwealth of Australia 2015, National Partnership Agreement on Land Transport Infrastructure Projects: Victoria – 2015-16 Programme of Works. Accessed at: http://investment.infrastructure.gov.au/publications/policies/pdf/NPA_Schedule_VIC_September%202015.pdf (accessed on: 18 February 2016)
Commonwealth of Australia 2015, Investment Road and Rail Programme: Key projects to receive funding in 2015-16. Accessed at: http://investment.infrastructure.gov.au/publications/policies/pdf/Infrastructure_Omnibus_May2015.pdf (accessed on: 18 February 2016)
Deloitte Access Economics 2015, Investment Monitor
Department of Employment 2016, Workplace Agreements Database special data request.
National Building and Construction Industry Award 2000.
Productivity Commission 2014, Public Infrastructure, Inquiry Report No. 71, Canberra.
Property Council of Australia 2016, Melbourne vacancy rate falls to 7.7%, Media Release, 4 February.
Rider Levett Bucknall 2016, Riders Digest: Melbourne Australia Edition. Accessed at: http://www.rlbintelligence.com/ (accessed on: 3 February 2016)
State of Victoria (Department of Treasury and Finance), 2015-16 Victorian Budget
State of Victoria (Department of Treasury and Finance), 2015-16 Victorian Budget Update
Truss, W. 2015, Annual Ministerial Infrastructure Statement, 1 December. Accessed at: http://minister.infrastructure.gov.au/wt/speeches/2015/wts030_2015.aspx (accessed on: 18 February 2016)

Limitation of our work
General use restriction
This report is prepared solely for the use of Master Builders Association of Victoria. This
report is not intended to and should not be used or relied upon by anyone else and we
accept no duty of care to any other person or entity. The report has been prepared for the
purpose of EBA and related research. You should not refer to or use our name or the advice for any other purpose.

Contact us
Deloitte Access Economics ACN: 149 633 116 Level 1 9 Sydney Avenue Barton ACT 2600 PO Box 6334 Kingston ACT 2604 Australia Tel: +61 2 6175 2000 Fax: +61 2 6175 2001 www.deloitteaccesseconomics.com.au
Deloitte Access Economics is Australia’s pre-eminent economics advisory practice and a member of Deloitte's global economics group. The Directors and staff of Access Economics joined Deloitte in 2011.
About Deloitte
Deloitte refers to one or more of Deloitte Touche Tohmatsu Limited, a UK private company limited by guarantee, and its network of member firms, each of which is a legally separate and independent entity. Please see www.deloitte.com/au/about for a detailed description of the legal structure of Deloitte Touche Tohmatsu Limited and its member firms.
Deloitte provides audit, tax, consulting, and financial advisory services to public and private clients spanning multiple industries. With a globally connected network of member firms in more than 150 countries, Deloitte brings world-class capabilities and deep local expertise to help clients succeed wherever they operate. Deloitte's approximately 200,000 professionals are committed to becoming the standard of excellence.
About Deloitte Australia
In Australia, the member firm is the Australian partnership of Deloitte Touche Tohmatsu. As one of Australia’s leading professional services firms. Deloitte Touche Tohmatsu and its affiliates provide audit, tax, consulting, and financial advisory services through approximately 6,000 people across the country. Focused on the creation of value and growth, and known as an employer of choice for innovative human resources programs, we are dedicated to helping our clients and our people excel. For more information, please visit our web site at www.deloitte.com.au.
Liability limited by a scheme approved under Professional Standards Legislation.
Member of Deloitte Touche Tohmatsu Limited
© 2016 Deloitte Access Economics Pty Ltd