construction of the descriptive system for the assessment
TRANSCRIPT

Research Paper 2010 (49)
Construction of the descriptive system for the Assessment of Quality of Life
AQoL-6D utility instrument
Dr Stuart Peacock
Co-Director, Canadian Centre for Applied Research in Cancer Control (ARCC)
Senior Scientist, British Columbia Cancer Agency
Associate Professor, University of British Columbia
Professor Jeff Richardson
Centre for Health Economics, Monash University
Neil Atherton Day
Centre for Program Evaluation, The University of Melbourne
Assoc Professor Graeme Hawthorne
Department of Psychiatry, The University of Melbourne
Angelo Iezzi
Centre for Health Economics, Monash University
Dr Gerald Elsworth
Public Health Innovation @ Deakin, Deakin University
June 2010
Centre for Health Economics
ISSN 1833-1173
ISBN 1 921187 48 4

Construction of the descriptive system for the
Assessment of Quality of Life (AQoL)-6D utility instrument
Correspondence:
Jeff Richardson
Centre for Health Economics
Faculty of Business and Economics
Monash University Vic 3800
Australia
Ph: +61 3 9905 0754 Fax: +61 3 9905 8344
Email address: [email protected]

Construction of the descriptive system for the
Assessment of Quality of Life (AQoL)-6D utility instrument
ACKNOWLEDGEMENTS
The authors would like to acknowledge the financial assistance of the Victorian Health Promotion
Foundation and the Population Health Division of the Commonwealth Department of Health and
Ageing.

Construction of the descriptive system for the
Assessment of Quality of Life (AQoL)-6D utility instrument
ABSTRACT
Objectives: To describe the construction of the descriptive system for the Assessment of Quality
of Life (AQoL)-6D, a Multi Attribute Utility (MAU) instrument for use in economic evaluation
studies.
Methods: AQoL-4D and AQoL-6D introduced the use of psychometric methods in the context of
health related Multi Attribute Utility (MAU) modelling for use in economic evaluation studies in
which quality of life (QoL) is an important outcome. Both created a multi-level descriptive system
in which latent dimension variables were constructed from individual items and which, in turn,
created a latent QoL variable.
Results: The AQoL-6D consists of 20 items within 6 dimensions. Structural Equation Modelling
(SEM) results reveal that all but one of the gamma weights between dimensions and the AQoL-
6D latent variable are 0.73 or greater. Lambda weights between the observed item responses
and the dimension latent variables are all above 0.5. The Comparative Fit Index of 0.97 and
RMSEA of 0.054 is an exceptionally good result.
Conclusion: The AQoL-6D has excellent psychometric properties and is a suitable basis for
generating utility values for the economic evaluation of a wide range of health programs.

Construction of the descriptive system for the
Assessment of Quality of Life (AQoL)-6D utility instrument
TABLE OF CONTENTS
1 Introduction .................................................................................................................................... 1
2 Methods ......................................................................................................................................... 3
3 Results ........................................................................................................................................... 5
4 Discussion ..................................................................................................................................... 9
5 Conclusion ................................................................................................................................... 11
Appendix 1 AQoL-6D Questionnaire .............................................................................................. 12
References ..................................................................................................................................... 16
List of Tables
Table 1 Steps in constructing an MAU instrument ........................................................................... 3
Table 2 AQoL-6D Construction Respondent Characteristics .......................................................... 6
Table 3 Comparison of AQoL-6D and AQoL-4D ........................................................................... 11
List of Figures
Figure 1 Structure of AQoL-6D descriptive system ......................................................................... 9
List of Boxes
Box 1 Summary of the AQoL-6D content ......................................................................................... 8

Construction of the descriptive system for the Assessment of Quality of Life
AQoL-6D utility instrument
1 Introduction
Multi-Attribute Utility (MAU) instruments seek to measure the quality of life (QoL) of individuals in
varying health states for use in economic evaluation studies and, in particular, Cost Utility
Analyses (CUA). In principle, MAU instruments have an advantage over holistic health state
valuations – one-off evaluations of single health states – as they describe a large number of
health states and may be used with a relatively small research budget. In practice, because of the
cost and complexity of constructing MAU instruments, only a limited number have been created
to date. These include the AQoL-4D (Hawthorne, Richardson et al. 1997; Hawthorne, Richardson
et al. 1999), EQ-5D (Dolan, Gudex et al. 1995; Kind 1996), SF-6D, 12D (Brazier, Harper et al.
1998; Brazier, Roberts et al. 2002), Health Utilities Index (HUI 1, 2, 3) (Furlong, Feeny et al.
2001; 2002), and the 15D (Sintonen and Pekurinen 1993).
This paper describes the construction of the descriptive system of the Assessment of Quality of
Life (AQoL)-6D which is an extension of the earlier AQoL-4D instrument. It outlines the
conceptualization and innovations of the two AQoL instruments, presents results from the AQoL-
6D construction analysis, and reports the final AQoL-6D descriptive system1.
The AQoL instruments: The objective of the initial AQoL instrument (renamed AQoL-4D) was
the creation of an instrument using the psychometric principles for instrument construction and an
instrument which addressed three challenges, namely, increased sensitivity, a descriptive system
based upon handicap and structural independence between dimensions (Hawthorne, Richardson
et al. 1999). Increased sensitivity was sought to overcome perceived limitations with existing
instruments. It was hypothesized that individual preferences for health states are more closely
related to the level of „handicap‟ than to impairment or disability and, consequently, that more
sensitive measurement will be achieved. With a handicap based than with a „within the skin‟
descriptive system.
The third challenge is one of the most problematical in modelling QoL for economic evaluation.
According to Decision Analytic theory, dimensions in the combination model should be
„orthogonal‟ (eg colour of car does not correlate with horsepower; or with location of factory, etc).
This avoids double counting of elements – „structural dependence‟ or „non-orthogonality‟ (eg cost
1 Utility scaling of the AQoL Mark 2 is described elsewhere (Richardson, Peacock et al. 2007).

Construction of the descriptive system for the
Assessment of Quality of Life (AQoL)-6D utility instrument 2
of product correlates with cost of labour and size of car, etc). However dimensions of health
generally overlap and increasing the number of items in an instrument to achieve content validity
and sensitivity increases the likelihood of structural dependence. The „double counting‟ of
elements can distort estimated utilities and benefits in an economic evaluation (Von Winterfeldt
and Edwards 1986).
To achieve sensitivity without double counting, the AQoL-4D adopted a hierarchical descriptive
system in which items map into dimensions, and dimensions into an overall latent variable, QoL.
Non-orthogonality was permitted within dimensions to increase sensitivity but orthogonality was
sought between dimensions through the use of exploratory factor analysis, with varimax rotation.
In principle, the effects of non-orthogonality would therefore be constrained within dimensions
and minimized. The instrument was scaled – calibrated – using TTO methods and a two part
model in which multiplicative modelling was used firstly to construct 4 dimension values and
secondly, to combine these dimensions to obtain a single AQoL-4D utility score (Hawthorne,
Richardson et al. 1997; Hawthorne, Richardson et al. 1999).
The AQoL-6D project was undertaken to increase the sensitivity of the AQoL-4D. This
exacerbated the problem of structural dependence and a new, more powerful technique was
introduced to overcome the problem. This was to introduce third stage utility modelling to adjust
scores to offset bias from non-orthogonality. An econometric procedure was employed which
used a range of multi attribute (holistic) health state utilities as dependent variables and initial
multiplicative utility and dimension scores as explanatory variables. With this third stage following
and the concern with orthogonality reduced, it was possible to focus more fully upon the
sensitivity of the descriptive system in the AQoL-6D.
MAU Instrument Construction Theory: Psychometric procedures for instrument construction
involve a combination of theory, data collection and analysis which follow the broad steps outlined
in Table 1. Each step has alternative methodologies (and choices have been controversial). The
first step is to establish the relevant concept for HRQoL and instrument content (elements). For
example, an instrument may be based upon a „within the skin‟ concept of health; that is, body
impairment and disability of body functions. Alternatively, the instrument may seek to measure
the effect of a health state upon handicap, the reduction in a person‟s ability to operate in their
social context. This initial concept will determine the type of items that are subsequently included
in the item bank.
Secondly, an item bank is constructed from the literature, from other instruments, from focus
groups and directly from clinicians and the research team itself. The initial items in the item bank
are „filtered‟ to eliminate items which are poorly expressed, which contain ambiguous or multiple
elements („aspects‟ or „concepts‟) or which are obviously repetitive. Final item selection is based
upon an analysis of a construction survey – step 3. This is a stratified and representative group of
respondents who complete all of the items. Item and statistical analysis in step 4 identify items
with desirable properties and which cluster together. The analysis indicates the correspondence
between these clusters and the hypothesized dimension structure. The final choice of items is
based upon the interplay of empirical results, the selected theory and the coherence of the overall
instrument.
The construction of utility weights, described in Part B of Table 1 is discussed in Richardson et al.
(Richardson, Peacock et al. 2007). Step 5 involves a „scaling survey‟ in which the scaling
instrument (Standard Gamble, Time Trade-off, etc) is used to assign value weights to item
responses, items and, in the case of AQoL-4D and 6D to the dimensions. These are combined

Construction of the descriptive system for the
Assessment of Quality of Life (AQoL)-6D utility instrument 3
using an algebraic or econometric model – Step 6. Finally, in step 7 the instrument is tested for
reliability, validity and sensitivity in a particular context (Cronbach and Meehl 1955).
Table 1 Steps in constructing an MAU instrument
A. Descriptive System
1. Select Theory of HRQoL
Select Concept (handicap/disability/impairment)
Hypothesise dimensions, elements
2. Construct Item Bank
Literature
Focus groups
Triage/Filter
Linguistic, logical analysis
3. Construction Survey
Population experiencing elements
4. Derivation of final instrument
Psychometric properties of items
Statistical analyses plus judgment
B. Utility weights/algorithm
5. Scaling Survey
Population whose values are required
6. Modelling utilities
Interpolation; derivation of a scoring algorithm
7. Validation/Testing
2 Methods
The methods used to construct AQoL-6D closely followed the steps described above.
Theory: The AQoL-6D is based upon the hypothesis that (dis)utility depends predominantly upon
the effects of a health condition upon a person‟s capacity to achieve a productive and fulfilling life
in their social environment; that is, it conceptualizes health primarily in terms of handicap. This is
described by the WHO as “a disadvantage for a given individual, resulting from an impairment or
disability... (which) limits or prevents the fulfillment of a role that is normal... for that individual”
(1980 p29). Thus, for example, the loss of an eye (impairment) may result in disability (an inability
to drive) which may result in social handicap (the person may become isolated in their
community). Conversely a blind person who has adapted to their circumstances and, for example,
used a taxi for communication and to maintain social contacts, may suffer relatively little loss of
utility.
Item Bank: The scope and content of the descriptive system depends upon the scope and
content of the items in the „item bank‟. For the AQoL-4D this was constructed from a review of
published health related instruments, from focus groups and from expert analyses. The AQoL-6D
built upon the AQoL-4D item bank and repeated the process but with a wider focus which
emphasised items and elements describing positive health states and health states close to full
health. Focus groups were conducted to obtain additional elements and dimensions to those
already included in the item bank and to ensure terminology was appropriate for both patients
and the general public. The groups included participants associated with health promotion
activities sponsored by the Victorian Health Promotion Foundation and potential users of the final

Construction of the descriptive system for the
Assessment of Quality of Life (AQoL)-6D utility instrument 4
instrument – clinicians, researchers, and decision-makers – from the fields of health promotion
ageing, migrant and youth health.
Three broad questions were canvassed: (i) What is the current role of quality of life measurement
in health promotion; (ii) How is quality of life conceptualized by practitioners and researchers
working in health promotion; and, (iii) What broad changes and developments are likely to occur
in Health Promotion that researchers should anticipate in revising a quality of life instrument?
Discussions were transcribed and examined to identify distinct statements which were then
rewritten as items. The resulting item bank was subject to logical and grammatical analysis to
eliminate obvious duplication and inferior items and to standardize and simplify expression.
Construction survey: The aim of the construction survey was to provide a set of completed
items for statistical analysis to determine the final content and structure of the AQoL-6D. There
were three main criteria for selecting items from the item bank for inclusion in the survey. These
were, first, that the items should result in an instrument which was similar to, but an extension of,
the AQoL-4D to allow for comparison and transformation of results; secondly, that the items
should improve sensitivity as compared with AQoL-4D particularly in the domain of good health,
and thirdly, that there should be multiple items describing each of the important elements
hypothesised and supported by the empirical results to this point. Each item was accompanied by
a rating scale to indicate item importance for a person‟s QoL.
The survey was administered to selected members of the Victorian adult population aged 18 and
above and patients at a major Melbourne teaching hospital. Patient groups were included to
increase the likelihood that responses would include the more severe health states described by
the items.
The population sample was selected in two stages. In the first, telephone addresses were
selected from a computerized directory stratified by postcode, population of postcode and the
social economic (SEIFA) status of the postcode. A RSSI (random start sampling interval)
procedure was used in the case of postcodes with populations too small otherwise to warrant
inclusion in the sample.) All in-scope users of the telephone service were included and a single
individual randomly selected. The number of in-scope persons using the service was recorded
and used to weight the sample to offset bias which would otherwise result in over-representation
of telephone services used by a smaller number of in-scope persons. In the second stage an
introductory letter was sent to the listed telephone subscriber followed by a telephone call. The
construction survey was mailed to consenting individuals. Up to two reminder letters or phone
calls were made.
Inpatients were selected from four wards of a major Melbourne hospital. Patients were initially
approached by cooperating clinical staff with a short letter, an explanatory statement and consent
form requesting the patient‟s participation. Those agreeable were interviewed by members of the
research team as were outpatients who were approached in the same way.
The questionnaire was separated into 8 sequences to offset order effects, and randomly allocated
to participants. Data from the completed questionnaires were double entered using SPSS v11.5
(SPSS 2004), and inconsistencies checked and re-entered. Items were subject to logical checks
of consistency.
Derivation of the instrument: Initially, frequency distributions and missing values for all items
were checked to identify those that might lack sufficient variance or have no „head room‟ or „foot
room‟ as such items are less likely to detect change. Items were also more likely to be discarded
Construction of the descriptive system for the
Assessment of Quality of Life (AQoL)-6D utility instrument 5
when they were expected to discriminate between hospital and population respondents but failed
to do so, and when the response level selected constantly conflicted with the importance rating
given on the rating scale.
The search for instrument structure used two structural equation programs: for dimensions with
fewer than 20 items, the EQS (Bentler and Wu 1995) program was used. For other dimensions,
the LISREL (Jöreskog and Sörbom 1996; Jöreskog and Sörbom 1996) program was applied. In
each case, polychoric correlations were used to reflect the ordinal nature of the data from the
items. For purposes of validation, in the case of one dimension both programs were used and,
due to differences in the algorithms, results were found to differ slightly.
The structural equation analysis was conducted in two stages: initially, analysis was conducted
domain by domain: for example, all items associated with „social relations‟ were examined, then
items relating to „Independent Living‟ and so forth. Initially the LISREL program was used to test
whether items in a dimension measured the same underlying concept. Next, the internal structure
of the dimensions was examined: modification indices provided by the LISREL program often
suggested sub dimensions, and these were explored. Finally items were excluded which
significantly cross loaded between dimensions. In a few instances items were found to measure a
different domain from the initial expectation. Examples of the analysis are given in Day et al.
(2010).
This process identified a few items that strongly supported a scale within each dimension. The
next step was to combine each of these dimensions into an overall model and ensure that each
dimension loaded onto an overall latent measure of health related quality of life.
3 Results
Focus groups and item bank: Four focus groups were conducted in addition to those conducted
for AQoL-4D, two with health professionals and two with members of the public, with a total of 22
participants (64 percent female). In all groups, both intrinsic and mediating factors were identified
as being important for HRQoL. Intrinsic factors are those concerning the self, such as
independence, social well-being, emotional well-being, physical well-being, and coping or self-
actualization. Mediating factors, such as planning, organization and strategic development
facilitated the achievement of HRQoL but were not an intrinsic part of a state of well-being. Only
items from the former group were selected for inclusion in the item bank.
The two focus groups which included practitioners sought to identify elements which would be of
increasing importance for future HRQoL. Some anticipated the increased importance of less
material elements in health, for example spirituality, sexual fulfillment, while others believed that
there would be a movement away from individual level objectives towards the achievement of
collective goals. Some additions were made to the item bank to accommodate the former
comments. The latter comments illustrate the boundaries of an individual oriented QoL
instrument.
After „logical analysis‟ and triage 112 items were included in the survey, a ratio of approximately
5:1 with the targeted instrument size of 15-25. They included multiple items for each of the
elements identified as important.

Construction of the descriptive system for the
Assessment of Quality of Life (AQoL)-6D utility instrument 6
Table 2 AQoL-6D Construction Respondent Characteristics
Male Female Total
Community 132 184 316
Hospital 156 148 304
Total 288 332 620
Community Hospital
Male Female Total Male Female Total
Age
18-24 years 3 9 12 4 6 10
25-34 12 33 45 12 14 26
35-44 18 39 57 16 30 46
45-54 30 39 69 12 24 36
55-64 33 34 67 52 34 86
64+ 36 30 66 60 40 100
Total 132 184 316 156 148 304
Education
primary 19 11 30 32 22 54
high school 36 72 108 82 84 166
trade 28 16 44 12 14 26
university 43 73 116 22 24 46
other 6 12 18 8 4 12
Occupation
full time 63 38 101 40 12 52
part time 13 58 72 8 24 32
unemployed 7 2 9 10 6 16
home 2 33 34 2 36 38
retired 43 48 91 72 50 122
student 2 3 5 2 4 6
other 1 3 4 20 18 38
Total 131 185 316 154 150 304
Marital status
married/de facto 99 132 231 108 62 170
single/never
married 19.5 18 37 26 30 56
single/widowed 4.5 16 21 4 16 20
single/divorced 9 18 27 18 40 58
Total 132 184 316 156 148 304
Income
Under $20,000 42 40 82 62 86 148
20,001-30,000 22 22 45 32 16 48
30,001-40,000 15 19 34 14 8 22
40,001-50,000 10 22 33 2 6 8
50,001-60,000 16 24 40 18 0 18
60,001-80,000 15 10 25 2 10 12
above 80,000 11 31 42 6 4 10
Total 131 168 301 136 130 266
missing=7 missing=8 missing=20 missing=18

Construction of the descriptive system for the
Assessment of Quality of Life (AQoL)-6D utility instrument 7
Construction survey: The construction survey was completed and returned by 316 members of
the general public, a response rate of 31 percent of the sample initially targeted, 44 percent of the
in-scope (possible) respondents and 78 percent of those sent a questionnaire. 206 outpatients2
and 96 inpatients were approached. Interviewers reported no refusals to participate from either of
these groups. This provided a total of 618 responses. These are classified in Table 2 by their age,
gender, socio-economic characteristics and marital status. As shown, the survey succeeded in
obtaining a broad spread of respondents across each of these attributes.
Missing information on individual items was well within acceptable boundaries, with the exception
of three questions about intimate relationships. These items were subjected to Expectation
Maximization Estimation using the SPSS Missing Values procedure (SPSS 2004) so that
answers to all the questions in the social dimension were used to estimate values on intimacy
questions for those who had not answered.
The final instrument is summarized in Box 1 and the results of the SEM analysis in Figure 1. The
instrument consists of 6 dimensions and 20 items. Each of these has between 4 and 6 response
levels. Commencing from the left side of Figure 1, the first column of numbers (in boxes) are the
gamma coefficients between the dimensions and AQoL latent variables. These are equivalent to
standardized correlation coefficients. With the exception of sensory perception where the gamma
coefficient is 0.51, all of the coefficients are 0.73 or greater. Lambda weights between the
observed item responses and the dimension latent variables – the middle column of Figure 1 –
may also be interpreted as equivalent to correlation coefficients. None is below 0.58. Error terms
on the individual items in the final, right hand column, are generally low for an analyses of
individual level data.
The six AQoL-6D dimensions all load on the one HRQoL factor, while the results of the SEM
indicate that they are measuring different aspects of HRQoL. Hence, it is likely these items form a
uni-dimensional parsimonious measure but without extensive double-counting within the
descriptive system. Dimensions, items and response categories are also summarised in Box 1
and reproduced fully on the AQoL website (http://www.aqol.com.au). The overall Comparative Fit
Index (CFI) of 0.97 is considerably higher than the commonly accepted criterion of 0.95 for a
satisfactory fit. The RMSEA of 0.054 is well below 0.08, the generally accepted maximum value
for a satisfactory fit.
In sum, the results summarized in Figure 1 indicate an exceptionally good result and represent
strong evidence of the validity of the model as a representation of the data from our construction
sample (Brown and Cudeck 1993; Yu 2002)3.
2 The response rate from the outpatients was indeterminate due to the method of administration.
3 Yu (2002) investigates goodness of fit indices where data deviate substantially from normality and recommends CFI > .95 and
RMSEA around .5 top .6 as providing acceptable Type 1 (5) and Type II errors.

Construction of the descriptive system for the
Assessment of Quality of Life (AQoL)-6D utility instrument 8
Box 1 Summary of the AQoL-6D content
Item Response
category Response
Dimension 1 Independent living
1 help with household tasks 5 no help, efficient … all tasks
2 mobility outside house 6 easy, enjoyable … need help
3 walking 6 running easy … bed ridden
4 self care 5 very easy … need help
Dimension 2 Relationships
5 intimate relationships 5 very happy … very unhappy
6 health and family role 4 no affect … incapacity
7 health and community role 4 no effect … incapacity
Dimension 3 Mental health
8 despair 5 never … all the time
9 worry 5 never … all the time
16 Sadness 5 never … all the time
11 calm, agitation 5 always calm… always agitated
Dimension 4 Coping
12 Energy 5 always energetic … always tired
13 control of life 5 always … never
14 coping with problems 5 completely … not at all
Dimension 5 Pain
15 frequency 4 rarely … most of the time
16 discomfort 4 none … unbearable
17 interference with activities 5 never … always
Dimension 6 Senses
18 vision 6 excellent … blind
19 hearing 6 excellent … deaf
20 communication 4 no trouble … cannot communicate

Construction of the descriptive system for the
Assessment of Quality of Life (AQoL)-6D utility instrument 9
Figure 1 Structure of AQoL-6D descriptive system
4 Discussion
The development of methods for the construction of the earlier AQoL-4D instrument was
motivated by two significant problems with existing MAU instruments; the ad hoc construction of
descriptive systems and their lack of breadth and sensitivity particularly in the good to best health
range of the scale. This does not imply that they are „invalid‟ in all contexts, but that their valid
applicability is limited.
The AQoL projects also sought to contribute to MAU instrument design and construction
methodology. Their use of psychometric methods and a multi level structure for an MAU
instrument are innovative. Items have been commonly selected for instrument construction on the
basis of logical and content analysis alone (Bowling 2001; Bowling 2005). However, in use,
responses often reflect idiosyncrasies of language and secondary connotations of words which
may not be correctly identified in logical analysis. Similarly, the implication of content overlap with
other items or combinations of items may be opaque. Techniques used in psychometric theory
are specifically designed to take account of these factors.
AQoL-6D
Independent Living
Relationships
Mental Health
Coping
Q1 household tasks
Q3 walking
Q5 friendships
Q6 family
Q7 community
Q8 despair
Q9 worry
Q10 sadness
Q12 energy
Q13 control
Q14 coping
Q2 mobility
Pain
Senses
Q15 frequency of pain
Q16 degree of pain
Q17 effect on usual activities
Q18 seeing
Q19 hearing
Q20 communication
Q4 self-care
Q11 agitation
ITEMSDIMENSIONS
0.200.90
0.160.92
0.330.82
0.310.83
0.750.50
0.270.85
0.220.88
0.360.80
0.310.83
0.500.70
0.670.58
0.450.74
0.560.66
0.560.66
0.130.93
0.280.85
0.330.82
0.670.58
0.550.67
0.660.59
0.86
0.96
0.83
0.96
0.73
0.51
1.00
COL 1 COL 2 COL 3
Notes1. Chi square = 460.73, df = 164; P-value = 0.0000; RMSEA = 0.054; CFI = 0.992. Column 1 represents gamma coefficients (between the AQol and dimension latent variables), column 2 represents lambda
coefficients (between dimension and items), column 3 represents error terms on each of the items.

Construction of the descriptive system for the
Assessment of Quality of Life (AQoL)-6D utility instrument 10
Results for the AQoL-6D descriptive system strongly suggest that the structure of preferences for
health states does not lend itself to simple modelling. This arises, fundamentally, from the
complexity of the underlying construct and the unavoidability of structural dependency in large
instruments. The AQoL-4D relied primarily upon principal components and exploratory factor
analysis to ensure that at least the dimensions were orthogonal in the psychometric sense; that
is, that all of the common variance between the dimensions was explained by the latent variable
and that the error variances were uncorrelated. The AQoL-6D relied primarily upon SEM to select
the best fitting items and dimensions with the „backup‟ of an econometric correction in the scaling,
to eliminate residual redundancy.
At all stages of the analysis, the structure of the model was reviewed from a substantive as well
as a statistical view point. In choosing items to include, and deciding upon the desirable structure,
SEM was used to establish a range of variant models. Decisions between the models or about
variations within them were informed by consideration of the substantive coverage of what is
generally regarded as HRQoL. As an example, a review of the model shows loadings between
items and dimensions (lambdas) are generally high, indicating a close relationship between the
variance of each item and the dimension it represents. The exceptions are in the sensory
perception dimension, where the lowest loading (0.58) is for Q18 about vision. This suggests that
vision is less closely related to HRQoL than other items in the model. This is readily interpretable:
people can suffer poor vision without it necessarily being related to other deficiencies in HRQoL.
Similarly the loading from the AQoL-6D to the sensory perception domain (gamma coefficient) is
lowest in this region of the model: 0.51. This suggests that sensory perception is less closely
related to the other constructs represented by the general AQoL HRQoL measure. However, to
exclude vision or sensory perception from a generic instrument would violate the usual
understandings of HRQoL, and, consequently, they were included in the model. Despite the low
loadings they do not compromise the overall fit of the model to the data.
The final AQoL-6D descriptive system defines 6.58 x 10¹³
health states. The majority of these are
irrelevant as they consist of combinations of health states which may not exist. Nevertheless the
number indicates that the instrument achieves an unprecedented level of detail with respect to
the dimensions of health which it encompasses.
Table 3 describes the relationship between the AQoL-4D and the AQoL-6D. The newer
instrument overlaps and extends AQoL-4D both in terms of the range of elements embodied in
the items and in the sensitivity of the responses. In particular, AQoL-6D gives additional items
relating to coping and pain. It does not include items relating to illness as did the initial AQoL-4D
instrument but which were subsequently removed during the validation process. As noted above,
differences between the instruments do not indicate that one is right and one is wrong. The
shorter AQoL-4D may represent a sufficient description in one context but AQoL-6D may be
superior in another. Comparability between final utility scores is outside the scope of this paper,
but other research indicates that each provides an unbiased estimate of the other
(http://www.aqol.com.au).

Construction of the descriptive system for the
Assessment of Quality of Life (AQoL)-6D utility instrument 11
Table 3 Comparison of AQoL-6D and AQoL-4D
Dimension
AQoL-4D1 AQoL-6D
Items
(levels) Combinations
Items
(levels) Combinations
Independent living 3 (444) 64 4 (5665) 900
Social relationships 3 (444) 64 3 (544) 80
Physical senses 3 (444) 64 3 (664) 144
Psychological wellbeing 3 (444) 60 4 (5555) 625
Pain - 3 (445) 80
Coping - 3 (555) 125
Note
1. Following a number of validating studies the illness dimension was removed from the final AQoL-4D
scoring algorithm
5 Conclusion
The AQoL-6D is a more complex instrument than others reported in the literature. This was
justified by the need to increase the sensitivity of available instruments and particularly for
interventions where the benefits are associated with the change in the level of handicap and
where 'within the skin' description is less likely to provide an indication of utility. The greater
complexity of the instrument brought its own problems in the construction methods. In particular,
it is difficult to envisage a descriptive system of this complexity which achieves construct validity
without the use of the appropriate psychometric construction methods. With more elements
potentially subtracting from utility, structural and preference dependence become of greater
concern. Whilst administration of the AQoL-6D instrument is relatively simple – typically taking 2
to 3 minutes – calculation of utilities is more complex (see Richardson et al. (2007). However, the
AQoL-6D utility algorithm is available for general use free of charge (http://www.aqol.com.au).
In sum, the instrument has excellent psychometric properties and is a suitable basis for
generating utility scores for the economic evaluation of a wide range of health programs.
Alternatively, it may be used as an unweighted „psychometric instrument‟ to provide values for
each of the 6 dimensions in addition to a single global score.
Construction of the descriptive system for the
Assessment of Quality of Life (AQoL)-6D utility instrument 12
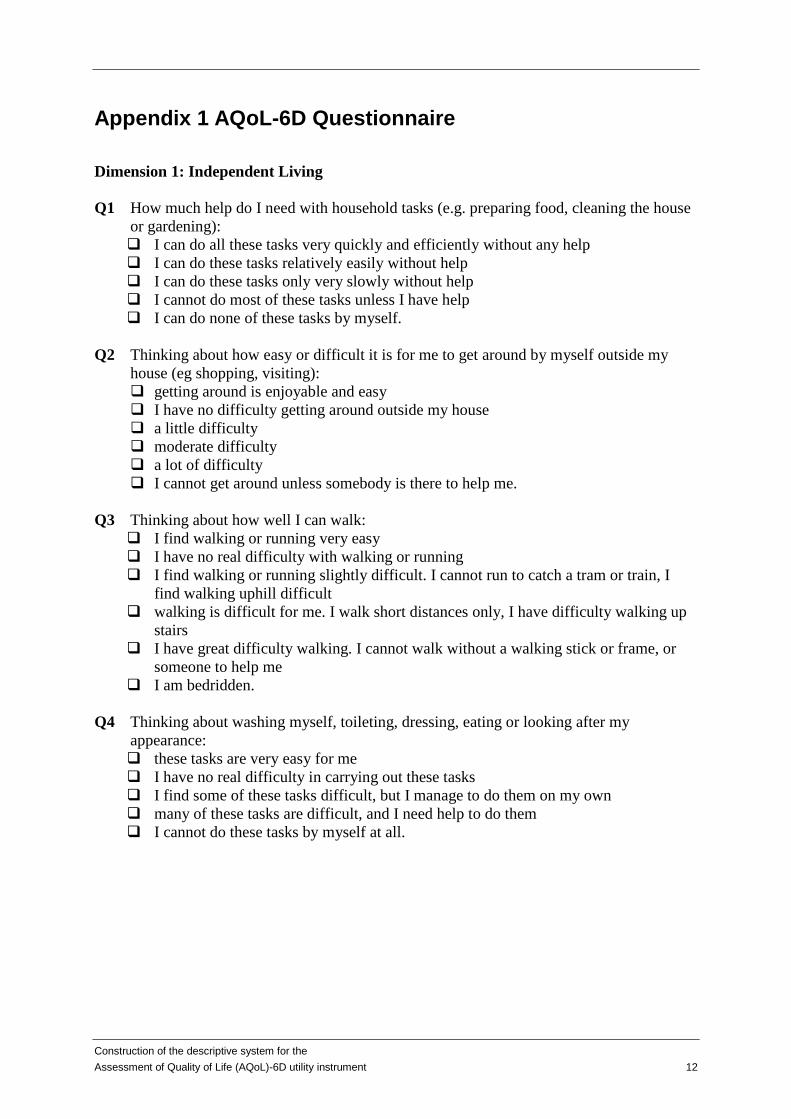
Appendix 1 AQoL-6D Questionnaire
Dimension 1: Independent Living
Q1 How much help do I need with household tasks (e.g. preparing food, cleaning the house
or gardening):
I can do all these tasks very quickly and efficiently without any help
I can do these tasks relatively easily without help
I can do these tasks only very slowly without help
I cannot do most of these tasks unless I have help
I can do none of these tasks by myself.
Q2 Thinking about how easy or difficult it is for me to get around by myself outside my
house (eg shopping, visiting):
getting around is enjoyable and easy
I have no difficulty getting around outside my house
a little difficulty
moderate difficulty
a lot of difficulty
I cannot get around unless somebody is there to help me.
Q3 Thinking about how well I can walk:
I find walking or running very easy
I have no real difficulty with walking or running
I find walking or running slightly difficult. I cannot run to catch a tram or train, I
find walking uphill difficult
walking is difficult for me. I walk short distances only, I have difficulty walking up
stairs
I have great difficulty walking. I cannot walk without a walking stick or frame, or
someone to help me
I am bedridden.
Q4 Thinking about washing myself, toileting, dressing, eating or looking after my
appearance:
these tasks are very easy for me
I have no real difficulty in carrying out these tasks
I find some of these tasks difficult, but I manage to do them on my own
many of these tasks are difficult, and I need help to do them
I cannot do these tasks by myself at all.
Construction of the descriptive system for the
Assessment of Quality of Life (AQoL)-6D utility instrument 13
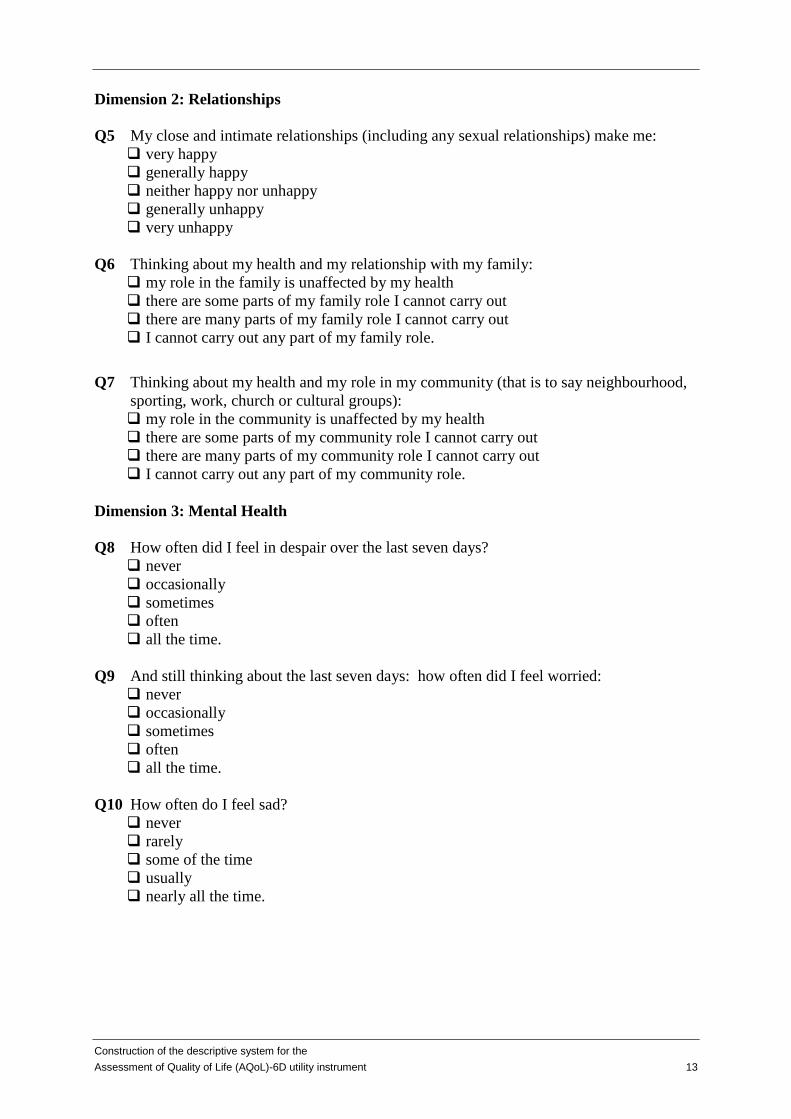
Dimension 2: Relationships
Q5 My close and intimate relationships (including any sexual relationships) make me:
very happy
generally happy
neither happy nor unhappy
generally unhappy
very unhappy
Q6 Thinking about my health and my relationship with my family:
my role in the family is unaffected by my health
there are some parts of my family role I cannot carry out
there are many parts of my family role I cannot carry out
I cannot carry out any part of my family role.
Q7 Thinking about my health and my role in my community (that is to say neighbourhood,
sporting, work, church or cultural groups):
my role in the community is unaffected by my health
there are some parts of my community role I cannot carry out
there are many parts of my community role I cannot carry out
I cannot carry out any part of my community role.
Dimension 3: Mental Health
Q8 How often did I feel in despair over the last seven days?
never
occasionally
sometimes
often
all the time.
Q9 And still thinking about the last seven days: how often did I feel worried:
never
occasionally
sometimes
often
all the time.
Q10 How often do I feel sad?
never
rarely
some of the time
usually
nearly all the time.

Construction of the descriptive system for the
Assessment of Quality of Life (AQoL)-6D utility instrument 14
Q11 When I think about whether I am calm and tranquil or agitated:
always calm and tranquil
usually calm and tranquil
sometimes calm and tranquil, sometimes agitated
usually agitated
always agitated.
Dimension 4: Coping
Q12 Thinking about how much energy I have to do the things I want to do, I am:
always full of energy
usually full of energy
occasionally energetic
usually tired and lacking energy
always tired and lacking energy.
Q13 How often do I feel in control of my life?
always
mostly
sometimes
only occasionally
never.
Q14 How much do I feel I can cope with life’s problems?
completely
mostly
partly
very little
not at all.
Dimension 5: Pain
Q15 Thinking about how often I experience serious pain. I experience it:
very rarely
less than once a week
three to four times a week
most of the time.
Q16 How much pain or discomfort do I experience:
none at all
I have moderate pain
I suffer from severe pain
I suffer unbearable pain.

Construction of the descriptive system for the
Assessment of Quality of Life (AQoL)-6D utility instrument 15
Q17 How often does pain interfere with my usual activities?
never
rarely
sometimes
often
always
Dimension 6: Senses
Q18 Thinking about my vision (using my glasses or contact lenses if needed):
I have excellent sight
I see normally
I have some difficulty focusing on things, or I do not see them sharply. E.g. small
print, a newspaper or seeing objects in the distance.
I have a lot of difficulty seeing things. My vision is blurred. I can see just enough to
get by with.
I only see general shapes. I need a guide to move around
I am completely blind.
Q19 Thinking about my hearing (using my hearing aid if needed):
I have excellent hearing
I hear normally
I have some difficulty hearing or I do not hear clearly. I have trouble hearing softly-
spoken people or when there is background noise.
I have difficulty hearing things clearly. Often I do not understand what is said. I
usually do not take part in conversations because I cannot hear what is said.
I hear very little indeed. I cannot fully understand loud voices speaking directly to me.
I am completely deaf.
Q20 When I communicate with others, e.g. by talking, listening, writing or signing:
I have no trouble speaking to them or understanding what they are saying
I have some difficulty being understood by people who do not know me. I have no
trouble understanding what others are saying to me.
I am understood only by people who know me well. I have great trouble
understanding what others are saying to me.
I cannot adequately communicate with others.

Construction of the descriptive system for the
Assessment of Quality of Life (AQoL)-6D utility instrument 16
References
Bentler, P. M. and E. J. C. Wu (1995). EQS for Windows User's Guide. Encino, Multivariate
Software.
Bowling, A. (2001). Measuring Disease. Buckingham, Philadelphia, Open University Press.
Bowling, A. (2005). Measuring Health: A Review of Quality of Life Measurement Scales.
Maidenhead, Berkshire, Open University Press.
Brazier, J., R. Harper, et al. (1998). "Deriving a preference based single index measure from the
SF36." Journal of Clinical Epidemiology 51(11): 1115-1129.
Brazier, J., J. Roberts, et al. (2002). "The estimation of a preference-based measure of health
from the SF-36." Journal of Health Economics 21: 271-292.
Brown, M. W. and R. Cudeck (1993). Alternate ways of assessing model fit. Testing Structural
Equation Models. K. A. Bollen and J. S. Long. Thousand Oaks, Sage.
Cronbach, J. and P. Meehl (1955). "Construct validity in psychological tests." Psychological
Bulletin 52: 281-302.
Day, N. A., J. Richardson, et al. (2010). Modelling Health Related Quality of Life for the AQoL-6D,
Research Paper 50. Melbourne, Centre for Health Economics, Monash University.
Dolan, P., C. Gudex, et al. (1995). A social tariff for EuroQoL: Results from a UK general
population survey, Discussion Paper No 138. York, Centre for Health Economics, University of
York.
Feeny, D., W. Furlong, et al. (2002). "Multiattribute and single-attribute utility functions for the
Health Utility Index Mark 3 system." Medical Care 40(2): 113-128.
Furlong, W. J., D. H. Feeny, et al. (2001). "The Health Utilities Index (HUI) system for assessing
health-related quality of life in clinical studies." Annals of Medicine 33: 375-384.
Hawthorne, G., J. Richardson, et al. (1999). "The Assessment of Quality of Life (AQoL)
instrument: A psychometric measure of health related quality of life." Quality of Life Research 8:
209-224.
Hawthorne, G., J. Richardson, et al. (1997). The Assessment of Quality of Life (AQoL)
Instrument. Construction, Initial Validation and Utility Scaling, Working Paper 76. Melbourne,
Centre for Health Program Evaluation, Monash University.
Jöreskog, K. G. and D. Sörbom (1996). LISREL 8: User's reference guide. Chicago, Scientific
Software International.
Jöreskog, K. G. and D. Sörbom (1996). PRELIS2: User's reference guide. Chicago, Scientific
Software International.
Kind, P. (1996). The EuroQoL instrument: An index of health related quality of life. Quality of Life
and Pharmacoeconomics in Clinical Trials. B. Spilker. New York, Lippincott-Raven Publishers.

Construction of the descriptive system for the
Assessment of Quality of Life (AQoL)-6D utility instrument 17
Richardson, J., S. Peacock, et al. (2007). Construction and Validation of the Assessment of
Quality of Life (AQoL) Mark 2 Instrument. Research Paper 24. Melbourne, Centre for Health
Economics, Monash University.
Sintonen, H. and M. Pekurinen (1993). A fifteen-dimensional measure of health related quality of
life (15D) and its applications. Quality of Life Assessment. S. Walker and R. Rosser. Dordrecht,
Kluwer Academic Publishers.
SPSS (2004). SPSS for Windows Version 11.5. Chicago, SPSS Inc.
Von Winterfeldt, D. and W. Edwards (1986). Decision Analysis and Behavioral Research.
Cambridge, Cambridge University Press.
World Health Organisation (1980). International Classification of Impairments, Disabilities and
Handicaps. Geneva, WHO.
Yu, C.-Y. (2002). Evaluating Cut-off Criteria of Model Fit Indices for Latent Variable Models with
Binary and Continuous Outcomes, Dissertation for PhD. Los Angeles, University of California.
PhD.