constraints and opportunities of maize production in ... · pdf fileconstraints and...
TRANSCRIPT

www.iita.org
Integrated Management in Africa
Constraints and Opportunities of Maize Production in Western Kenya
A Baseline Assessment of Striga extent, Severity, and Control Technologies
Joseph Ndwiga, Jimmy Pittchar, Peter Musyoka, Dickens Nyagol, George Marechera, Gospel Omanya, and Mel Oluoch
ISMA

i
Integrated Striga Management in Africa Project
Constraints and Opportunities of Maize Production in Western Kenya
A baseline assessment of Striga extent, severity, and control technologies
1J. Ndwiga, 2J. Pittchar, 1P. Musyoka, 2D. Nyagol, 1G. Marechera, 1G.Omanya, and 3M.Oluoch
1The African Agricultural Technology Foundation2International Centre of Insect Physiology and Ecology
3International Institute of Tropical Agriculture

ii
© International Institute of Tropical Agriculture (IITA), 2013
IITA Ibadan, NigeriaTelephone: (234-2) 7517472Fax: +44 208 7113786E-mail: [email protected] Web: www.iita.org
To Headquarters from outside Nigeria:IITA, Carolyn House26 Dingwall Road, Croydon, CR9 3EE, UK
Within Nigeria:PMB 5320, Oyo RoadIbadan, Oyo State
ISBN 978-978-8444-24-4
Correct citation: Ndwiga, J., J. Pittchar, P. Musyoka, D. Nyagol, G. Marechera, G.Omanya, and M. Oluoch. 2013. Integrated Striga Management in Africa Poject. Constraints and opportunities of maize production in Western Kenya: a baseline assessment of striga extent, severity, and control technologies. Integrated Striga Management in Africa (ISMA). 34 pp.
Printed in Nigeria by IITA

iii
Contents
Acknowledgements ...................................................................................................................................... viExecutive summary ......................................................................................................................................viiAcronyms and abbreviations ....................................................................................................................... ix1. Introduction ...........................................................................................................................................1 Background ...........................................................................................................................................1 Aims and objectives of the study ......................................................................................................... 1 Scope of the study ............................................................................................................................... 12. Methodology .........................................................................................................................................2 Study area ............................................................................................................................................2 Sampling procedure .............................................................................................................................2 Data collection and analysis ................................................................................................................. 2
..............................................................................................................................3 Multiple linear regression .................................................................................................................. 3 Outline of the report .............................................................................................................................. 33. Results ..................................................................................................................................................4 Socioeconomic characteristics of households ...................................................................................... 4 Demographic and socioeconomic characteristics of households ..................................................... 4 Social capital .........................................................................................................................................4 Social group membership ................................................................................................................. 4 Household members’ participation in associations/groups and years of involvement ...................... 5 Productive resource endowment and decision-making process in farming .......................................... 6 Main source of funding...................................................................................................................... 6 Land tenure and use ......................................................................................................................... 6 Household workforce .......................................................................................................................7 Productive assets owned .................................................................................................................. 9 Households decision-making process in farming.............................................................................. 9 Crop production and marketing .......................................................................................................... 11 Land allocation and inputs in relation to maize during the long rainy season of 2011 .................... 11 Striga infestation rates ................................................................................................................... 11 Maize intercrop and planting seed type .......................................................................................... 13 Level of input use ...........................................................................................................................13 Households rating 2011 season above average with regard to rainfall ......................................... 13 Total direct production costs ........................................................................................................... 13 Amount of maize harvested (Kg) ................................................................................................... 15 Maize marketing during the long rainy season of 2011 ................................................................... 15 Maize selling price during the long rainy season of 2011 ............................................................... 15 Proportion of maize grain sold and market place most produce sold ............................................ 16 Total maize output and returns during the long rainy season of 2011 ............................................. 16 Production of other crop enterprises ............................................................................................... 17 Access and control over resources ..................................................................................................... 17 Gender access to resources ........................................................................................................... 17 Gender involvement in activities and practices ............................................................................... 17 Striga extent, severity, and control technologies ................................................................................ 17 Main production constraints ............................................................................................................ 17 Extent and severity of the Striga problem ...................................................................................... 18

iv
Striga control measures used by the households ........................................................................... 18 Awareness of Striga control technologies and current use status ...................................................... 18 Use of farm yard manure ................................................................................................................ 18 Use of hand pulling ......................................................................................................................... 20 Use of inorganic manure ................................................................................................................. 20 Reasons for non-adoption of Striga control technologies ............................................................... 20 Vulnerability, capital assets, and livelihoods ....................................................................................... 20
.......................................................................................................................20 .............................................................................................................. 23
Livestock ownership........................................................................................................................ 23 Access to physical infrastructure/capital ......................................................................................... 23 Access to human capital ................................................................................................................. 23 Household income ..........................................................................................................................23 Household non-farm income ........................................................................................................... 25 Opportunities and constraints affecting maize production .................................................................. 25 Result of multiple linear regression analysis ................................................................................... 264. Conclusion and Recommendations .................................................................................................... 32 Conclusion .........................................................................................................................................32
References ........................................................................................................................................34
Tables
Table 1. Areas and population statistics of the study area. ........................................................................... 2Table 2. Socioeconomic characteristics of the sampled households. ........................................................... 4Table 3. Level of involvement in social groups. ............................................................................................. 5Table 4. Level of household members’ participation in associations/groups and years of involvement. ....... 5Table 5. Land tenure and use information. .................................................................................................... 7Table 6. Distribution of household’s workforce. ............................................................................................. 8Table 7. Productive assets owned, status, and value. ................................................................................... 9Table 8. Household decision-making process in farming (% of respondents). ............................................ 10Table 9. Land allocation (ha). ...................................................................................................................... 12Table 10. Extent of Striga infestation. .......................................................................................................... 12Table 11. Distribution of households by maize seed type and cropping pattern (%). .................................. 13Table 12. Quantity of input used during long rainy season of 2011. ............................................................14Table 13. Households rating 2011 season above average with regard to rainfall (%). ............................... 15Table 14. Total direct production costs (Kshs). ............................................................................................ 15Table 15. Amount of maize harvested (Kg) per acre. .................................................................................. 15Table 16. Quantity of maize sold (Kg).......................................................................................................... 15Table 17. Average price per 90-kg bag during peak month (Kshs). ............................................................. 17Table 18. Market place where most grain was sold and proportion............................................................. 17Table 19. Net returns from maize production............................................................................................... 18Table 20. Land allocation for other crop enterprises.................................................................................... 19Table 21. Level of access to resources by men and women. ......................................................................19Table 22. Level of participation by men and women in farm activities and practices. ................................. 21Table 23. Distribution of respondents by main production constraints and level of severity. ....................... 22Table 24. The extent and severity of Striga constraint in maize crop enterprises. ...................................... 23

v
Table 25. Distribution of respondents by Striga control measures. ............................................................. 24Table 26. Distribution of respondent households by reason for non-adoption of technology. ..................... 25
......................................................................................................... 25 ............................................................................. 25
Table 29. Average number of livestock kept by households and their value. .............................................. 26Table 30. Level of access to physical infrastructure. ................................................................................... 28Table 31. Households’ access to human capital. ......................................................................................... 29Table 32. Household farm income. .............................................................................................................. 29Table 33. Household non-farm income details. ........................................................................................... 30Table 34. Linear regression results for the determinants of maize production. ........................................... 31
Figure1. Main source of funding for farm operations (% of respondents). .......................................................... 6

vi
AcknowledgementsThe authors wish to thank all the individuals and institutions who participated in the successful completion of this study particularly:
Peter Shimon Otieno, Research and Development Consultant
Farmers in Nyanza and Western provinces of Kenya to whom this work is dedicated
The ISMA collaborating organizations (local NGOs and CBOs)
The Ministry of Agriculture staff
The International Institute of Tropical Agriculture (IITA)
The African Agricultural Technology Foundation (AATF)

vii
Executive summaryThis report presents results of a baseline study on the constraints and opportunities of maize production in the Western Region of Kenya. The aim of the study was to provide baseline information that would set the basis for measuring progress and impact of the project on the livelihoods of the target population. Its objective was to determine the current status of livelihoods within the project areas by looking at various indicators of livelihoods such as household demographics; access to land, input use, and crop production; decision-making process in farming; Striga and Striga control technologies; vulnerability; capital assets; and livelihood strategies and outcomes, and explore opportunities and constraints affecting maize production in the project areas. One thousand two hundred (1200) households randomly selected from 12 districts were interviewed using a structured questionnaire. Data from the study was analyzed using descriptive statistics and multiple regression.
The study found out that high proportions of households are male-headed households with the proportion of female-headed households in Nyanza being higher than in the Western region. The average age of household head was 49 years with average formal schooling of eight years and household size of six. About 60% of household heads work full-time on the farm. Household land holdings are small and mostly used for the production of annual crops especially maize. Household members over 60 years of age are the ones working mostly full time on the farm. More women than men belong to and participate in the leadership of social groups. In addition most household members belong to women groups, development committees, and credit and savings groups.
The main source of funding for farming aspects among the households is proceeds from sale of farm produce which include maize. All key farming related decisions in the households are made by both the household head and the spouse except the decision on the acreage of land to plant. Input use levels are low and vary inter-province.
Striga is ranked as the number one production constraint in maize production and is severe among 50% of households sampled. In terms of severity, Striga currently claims over 40% of the households’ maize crop. Over 80% of the households use the uprooting method to control Striga in their farms. About 50% of the households use organic and inorganic fertilizers. The use of control technologies like Imazapyr-resistant (IR) maize is less than 5% among farmers. The main reasons for non-adoption of Striga control measures among the households is inadequate information on the technologies and their high costs. The model on determinants of maize
The level of investment in maize production among households is determined by the type of variety being grown and whether intercropped. Most households’ farm produce ends up in the local market in the hands of local consumers and traders where produce prices are low leading to low returns by farmers. Since the main source of funding for farming operations is proceeds from sales of produce, the low returns are not supporting farmers’ efforts to re-invest in maize production and production management including Striga control. The
Striga control is very low. The
Striga control technologies. This included making information on innovations available to maize producing farmers since they are literate enough to read and adopt the innovation to improve their production. This should be done through enhancing partnerships and collaboration with other partners and strengthening farmer-to-farmer extension on Striga management which is gaining ground in the study area. Given the fact that most of farmers are full-time farm workers, they need to be encouraged by providing necessary assistance such as adequate training, appropriate technologies for production, and a good marketing system for their production. to maize farmers to acquire farms inputs like maize seeds, fertilizer, agrochemicals, and other materials for farming activities through

viii
Government should create marketing information centers in order to inform maize farmers on prevailing maize prices in the market. Financial institutions such as agricultural and community banks should be established in the study area with simple procedures for securing loans. The relevant government agencies should mobilize the maize farmers to form themselves into formidable groups so thateconomies of scale both in input purchasing as well as produce marketing. This will also ensure that other actors working or willing to work with the farmers to enhance Strigathrough which to link up with the farmers and other players.

ix
Acronyms and abbreviations AATF African Agricultural Technology FoundationASK Agricultural Society of KenyaFBO farmer-based organizationsFTC Farmer Training CentreGPS Global Positioning SystemHa hectareicipe International Centre of Insect Physiology and EcologyIR Imazapyr-resistant maizeISMA Integrated Striga Management in AfricaNGOs nongovernmental organizationsOPV open-pollinated variety

1
Introduction
BackgroundWestern Kenya (the Lake region) is a major maize-producing region of the country. Maize is a main staple crop and a source of income and employment for millions of farming families in the region. However, maize production is threatened by a series of production constraints that hamper not only the livelihoods of the farming population but also the meeting of the government objectives for agricultural sector transformation.
The problem of Striga hermonthica Basin, western Kenya (Watt 1936; Khan et al. 2006). Striga attaches itself to the maize or sorghum roots from which it draws its moisture and nutrient requirements, inhibiting plant growth, reducing yields, and in extreme cases, causing plant death. The annual Striga damage in sub-Saharan Africa (SSA) is estimated at US$1 billion and affects the livelihoods of more than 100 million people. Fifteen countries of eastern, southern, and western Africa account for 95% of the continent’s Strigatraditional and conventional efforts have tried to control Striga infestation in the region but results have not been promising until recently.
In a bid to contribute to nourishing livelihoods of poor farm families in Africa, the International Wheat and Maize Center (CIMMYT) developed a hybrid maize—Imazapyr-resistant (IR) maize locally referred to as Ua Kayongo—to control Striga. The African Agricultural Technology Foundation (AATF) is facilitating the deployment of IR maize technology. The use of IR maize technology to control Striga is being promoted to increase maize yields by between 38 and 82% more than those currently obtained from traditional maize varieties. In Kenya, it is estimated that when adopted, the proposed technology will lead to an extra 62,000 tons (t) of maize in Western Province alone.
The objective of the Integrated Striga Management in Africa (ISMA) project is to enable smallholder farmers in SSA to have access to appropriate Striga management technologies such as seed of Imazapyr-resistant (IR) maize, Striga-tolerant varieties, suppression and trap cropping management systems, and soil fertility management.
The project covers 12 districts in Kenya: Kisumu, Rachuonyo, Migori, Homa Bay, Bondo, Nyando, and Siaya in Nyanza Province and Butere, Mumias, Teso, Busia, and Vihiga in Western Province where Striga is a major threat to food security for millions of small-scale farmers.
The project has adopted a results-based implementation approach that entails setting baselines for various project objectives in order to enable the assessment of the project impacts at the end of the project implementation period. Hence prior to the large-scale implementation of interventions, a baseline study was commissioned by AATF and icipe.
Aims and objectives of the study The aim of the study was to provide baseline information that would set the basis for measuring progress and impact of the project on the livelihoods of the target population. Its objective was to determine the current status of livelihoods within the project areas by looking at various indicators of livelihoods such as household demographics; access to land, input use, and crop production; decision-making process in farming; Striga and Striga control technologies; vulnerability; capital assets; and livelihood strategies and outcomes, and in addition explore opportunities and constraints affecting maize production in the project areas.
Scope of the study The baseline survey was conducted in twelve districts in Western Kenya which are of interest to the ISMA project to provide baseline information for various project objectives in order to enable the assessment of the project impacts at the end of the project implementation period. The reference period was the 2011 production year.
2
Methodology
Study areaThe baseline study was carried out in 12 larger districts of Nyanza and Western provinces of Kenya. These included Kisumu, Rachuonyo, Migori, Homa Bay, Bondo, Nyando, and Siaya in Nyanza Province and Butere, Mumias, Teso, Busia, and Vihiga in Western Province where maize is an important staple food and Striga is a major threat to food security for millions of small-scale farmers. Nyanza Province occupies a total area of 16,182 km2 and a population of 5,442,711 as per the 2009 census or a population density of 336 persons/km2, against 66 persons/km2 for the country as a whole (Republic of Kenya 2009). Western province has a population of 4,334,282 and a density of 515 persons/km2 on a total area of 8400km2. These two provinces have the second highest population density after Nairobi Province. There were about 968,014 households in Nyanza in 1999 and 701,323 in Western province (VM Manyong et al. 2008) (Table 1).
Sampling procedure The sampling unit was the farm household. A total of 1200 households were randomly sampled in 12 districts. A random sample of 100 farm households was drawn from each district. Random numbers were generated using Research Randomizer software (www.randomizer.org) and used to select a random sample of 50 GPS points from each geographical/administrative district map, excluding unfarmed areas, e.g., water masses, mountains, and forested areas. A table of GPS coordinates was generated for each district. The sampled GPS points were used to interview two households within a 200-m radius from the reference GPS coordinate. This ensured inclusion of at least 50 villages in each district in the survey.
Data collection and analysisData was collected in by means of structured questionnaires administered with the assistance of trained enumerators (four covering each of the 12 project districts in Western Kenya). Themes included in the questionnaire were related to household demographics; access to land, input use and crop production; decision-making process in farming; Striga and Striga control technologies; vulnerability; capital assets; and livelihood strategies and outcomes.
For enumeration purposes, young college graduates from within the localities (districts) were recruited and trained for three days on enumeration skills and use of GPS handsets to record coordinates in each household. Before the actual data collection, the instrument was pre-tested and adjusted to ensure that it yielded the required information during the survey. The pre-test was done in an area outside those sampled for actual data
and icipe staff.
Data was analyzed using SPSS statistical software and descriptive statistics were used for the analysis of
of maize production constraints. Multiple regression was used for the analysis of the effect of production inputs in maize output.
Table 1. Areas and population statistics of the study area.
Province/Country Capital Area (sq.km) Population (24/08/2009 census) Population density
Nyanza Kisumu 16,182 5,442,711 336.3435
Western Kakamega 8400 4,334,282 515.986
Total for Kenya 581,834 38,610,097 66.3593
3
Model
Multiple linear regressionAn econometric model was used to analyze the effect of production input on maize output. Production of maizefollows:
Y = 0+ 1X1+ 2X2+ X3+ 4X4+ 5X5+μ (1) Where Y = maize output in kilograms
0 = constant factorX1 = land under cultivationX2 = total number of labor used in man-hours X3 = quantity of maize planted in kilograms X4 = quantity of fertilizer in kilogramsX5 = quantity of agrochemicals used in litres
i = estimates of the coef cients with (i = 1, 2…5)μ = an error term measuring variation in maize output unaccounted for by independent variable.
maize output. (i = 1, 2…5) was found when a variable is associated with the decrease in maize output.
Outline of the reportThis report presents empirical results from preliminary analyses for both Western and Nyanza provinces. Chapter 1 gives an introduction to the study. Chapter 2 describes the methodology, and Chapter 3 presents
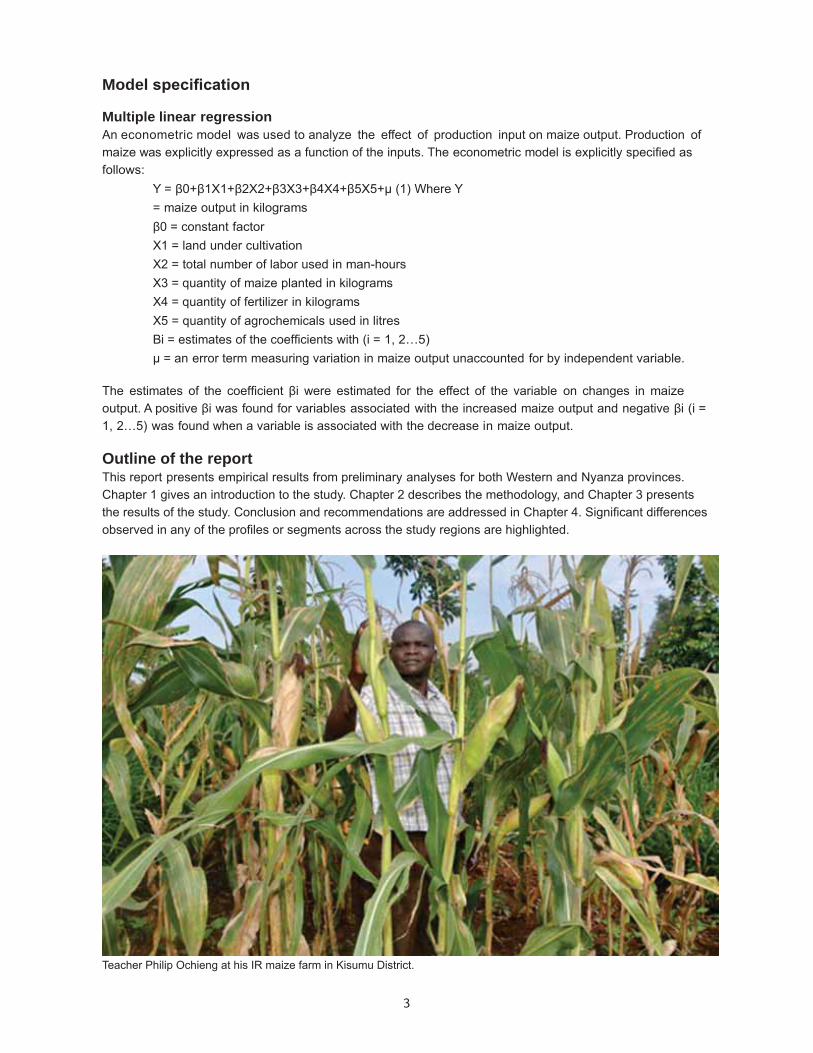
Teacher Philip Ochieng at his IR maize farm in Kisumu District.
4
Results
Socioeconomic characteristics of households
Demographic and socioeconomic characteristics of households
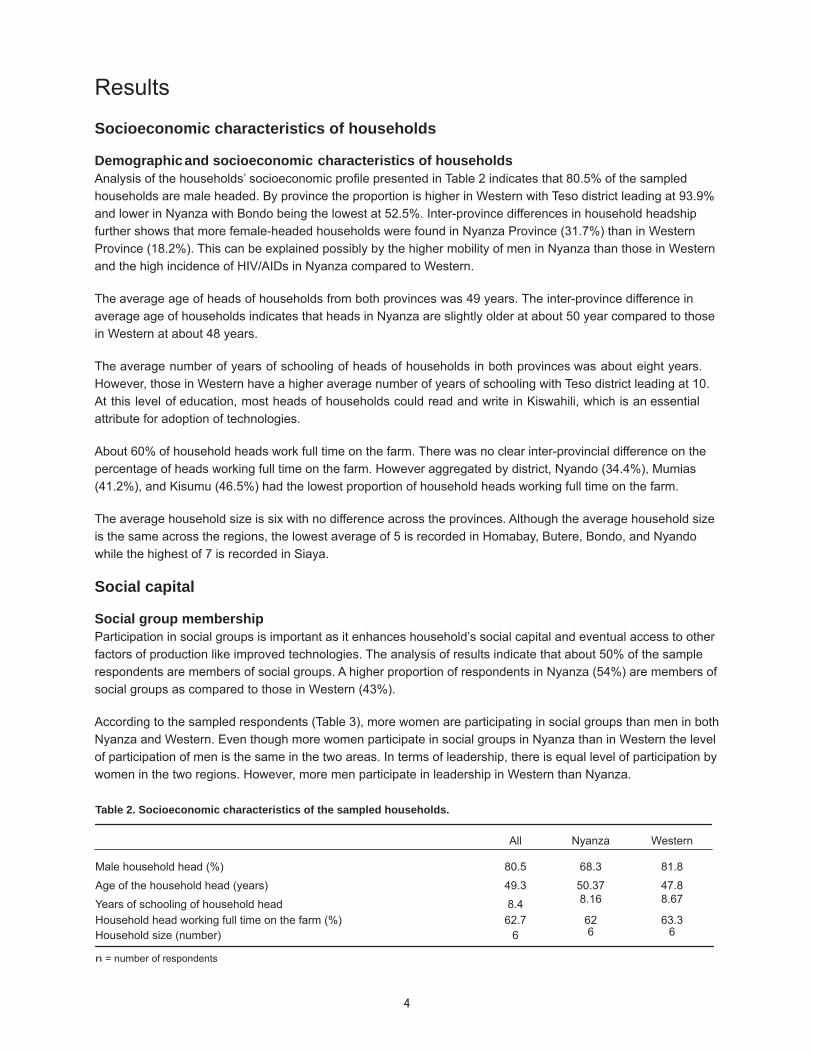
households are male headed. By province the proportion is higher in Western with Teso district leading at 93.9% and lower in Nyanza with Bondo being the lowest at 52.5%. Inter-province differences in household headship further shows that more female-headed households were found in Nyanza Province (31.7%) than in Western Province (18.2%). This can be explained possibly by the higher mobility of men in Nyanza than those in Western and the high incidence of HIV/AIDs in Nyanza compared to Western.
The average age of heads of households from both provinces was 49 years. The inter-province difference in average age of households indicates that heads in Nyanza are slightly older at about 50 year compared to those in Western at about 48 years.
The average number of years of schooling of heads of households in both provinces was about eight years. However, those in Western have a higher average number of years of schooling with Teso district leading at 10. At this level of education, most heads of households could read and write in Kiswahili, which is an essential attribute for adoption of technologies.
About 60% of household heads work full time on the farm. There was no clear inter-provincial difference on the percentage of heads working full time on the farm. However aggregated by district, Nyando (34.4%), Mumias (41.2%), and Kisumu (46.5%) had the lowest proportion of household heads working full time on the farm.
The average household size is six with no difference across the provinces. Although the average household size is the same across the regions, the lowest average of 5 is recorded in Homabay, Butere, Bondo, and Nyando while the highest of 7 is recorded in Siaya.
Social capital
Social group membershipParticipation in social groups is important as it enhances household’s social capital and eventual access to other factors of production like improved technologies. The analysis of results indicate that about 50% of the sample respondents are members of social groups. A higher proportion of respondents in Nyanza (54%) are members of social groups as compared to those in Western (43%).
According to the sampled respondents (Table 3), more women are participating in social groups than men in both Nyanza and Western. Even though more women participate in social groups in Nyanza than in Western the level of participation of men is the same in the two areas. In terms of leadership, there is equal level of participation by women in the two regions. However, more men participate in leadership in Western than Nyanza.
Table 2. Socioeconomic characteristics of the sampled households.
All Nyanza Western
Male household head (%) 80.5 68.3 81.8
Age of the household head (years) 49.3 50.37 47.8
Years of schooling of household head 8.4 8.16 8.67
Household head working full time on the farm (%) 62.7 62 63.3Household size (number) 6 6 6 n = number of respondents
5
Household members’ participation in associations/groups and years of involvementThe results from the analysis of the level of household members’ participation in social associations/groups presented in Table 4 shows that most sample respondents belong to women groups, community development groups, and credit and savings groups in that order. By region, a higher proportion of respondents in Western belong to women groups and community development groups than in Nyanza. However, a higher proportion of sample respondents in Nyanza belonged to credit and savings groups.
Table 3. Level of involvement in social groups.
Number of women compared to men Number of men compared to women
All Nyanza Western All Nyanza Western
Membership 22 24 19 3 3 3
Leadership 3 3 3 2 1 2
Table 4. Level of household members’ participation in associations/groups and years of involvement.
All Nyanza Western
Association/ group type n % Years n % Years n % Years
Community development 185 29.9 5.8 142 28.8 5.6 43 34.1 6.6
Cooperative 27 4.4 7 22 4.5 5.4 5 4 15.7
Religious group 50 8.1 8.6 47 9.5 8.5 3 2.4 10
Credit and savings group 124 20 3.5 108 21.9 3.7 16 12.7 2.5
Men’s group 22 3.6 4 19 3.9 3.8 3 2.4 7
Women’s group 188 30.4 4.6 134 27.2 4.7 54 42.9 4.5
AIDS group 7 1.1 3.9 7 1.4 3.9 0 0 -
Others (specify) 16 2.6 5.5 14 2.8 6 2 1.6 3
n = number of respondents
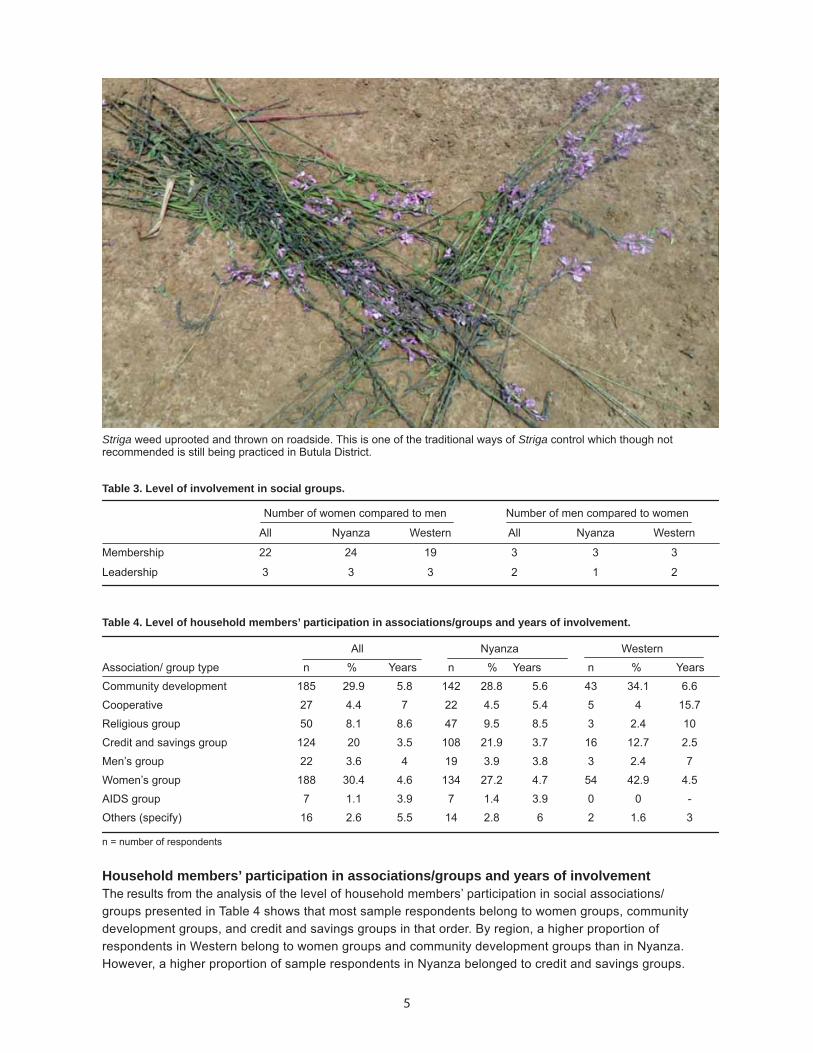
Striga weed uprooted and thrown on roadside. This is one of the traditional ways of Striga control which though not recommended is still being practiced in Butula District.

6
Figure 1. Main source of funding for farm operations (% of respondents).
Productive resource endowment and decision-making process in farming
Main source of fundingFunding is an important aspect in farming that determines the extent to which farm operations can be undertaken. According to the study results (Figure 1), the main sources of funding for farm operations in the entire region were proceeds from sale of farm produce, income from business, income from off-farm employment, and remittances, in that order. Most of the sampled households in Western unlike Nyanza fund their farm operations using proceeds from sale of farm produce with Butere having the highest proportion of households (59%) relying on this source and Kisumu the least (24%). A higher proportion of sampled households in Nyanza fund farm operations with income from business than in Western. However, by district, Teso has a majority of households (40%) funding farming aspects from business while Butere (11%) and Mumias (11%) have the least. Western has the highest proportion of households funding farm operations from off-farm employment. By district Mumias (42%), Siaya (29%), and Busia (29%) have the highest proportion of funding from off-farm employment while Bondo has the lowest (9%). With regards to funding farm activities from remittances, a higher proportion of sampled respondents from Nyanza rather than Western use this source with Rachuonyo (24%) leading and Homabay (3%), Butere (5%), and Mumias (5%) with the least.
Land tenure and use
The analysis of results (Table 5) shows that sample respondents in Nyanza, on average, own larger plots of land (2.5 ha) than those in Western (1.4 ha). In addition, respondents in Western rent more land (0.4 ha) for use than in those in Nyanza (0.2 ha). Borrowing land for use is also shown among respondents of Nyanza where respondents acquire up to 0.1 ha for use in the production of annual crops which is not prevalent in Western.
Respondents from Nyanza put a higher proportion of their owned land under annual crop production (1.6 ha) than those from Western (0.9 ha). However, an equal proportion of land is put under perennial crops in Western (0.3 ha) and Nyanza (0.3 ha). Respondents from Nyanza use more land for grazing (0.2 ha), fallow (0.2 ha),

7
and renting out (0.1 ha) unlike Western respondents who use 0.1 ha for grazing, 0.1 ha on fallow, and 0 ha of land for renting out. About 0.1 ha of rented land is put under annual and perennial crops in both Nyanza and Western.
Household workforce The household workforce is very crucial in ensuring that farm operations are sustainably undertaken. Results presented in Table 6 reveal that out of an average household size of six in Nyanza and Western, an average of four members form the household workforce. In Nyanza and Western two household members (male and female) in the over 60-year age category work full time on the farm. One household member in the 18-40 category works part time on the farm in Western Province. The results therefore indicate that the household workforce in Nyanza is mostly dominated by the elderly whereas in Western an average of one member works part time on the farm. This may be attributed to the fact that there is a high exodus of younger household members to urban areas in search of off-farm employment.
Table 5. Land tenure and use information.
Land tenure Size (ha) Annual crops Perennial crops Grazing Fallow Rented out
All NY WE All NY WE All NY WE All NY WE All NY WE All NY WE
Land owned 2 2.5 1.4 1.3 1.6 0.9 0.3 0.3 0.3 0.1 0.2 0.1 0.1 0.2 0.1 0.1 0.1 0
Rented Land 0.3 0.2 0.4 0.1 0.1 0.1 0.1 0.1 0.1 0 0 0 0 0 0 0 0 0
Borrowed 0.1 0.1 0.0 0.1 0.1 0.0 0.0 0.0 0.0 0.0 0.0 0.0 0.0 0.0 0.0 0.0 0.0 0.0
Total Land 2.4 2.8 1.8 1.5 1.8 1 0.4 0.4 0.4 0.2 0.2 0.1 0.1 0.2 0.1 0.1 0.1 0NY = Nyanza, WE = Western.
Ms. Mebo inspecting one of the IR maize cobs in her farm, Kiboswa, Nandi South District.

8
Tabl
e 6.
Dis
trib
utio
n of
hou
seho
ld’s
wor
kfor
ce.
To
tal i
n ho
useh
old
Num
ber w
orki
ng
fullt
ime
on th
e fa
rm
Num
ber w
orki
ng
part
tim
e on
the
farm
Num
ber w
orki
ng
off f
arm
Num
ber o
f abl
e bo
died
not
doi
ng
anyt
hing
Num
ber o
f di
sabl
ed
mem
bers
A
llN
YW
EA
llN
YW
EA
llN
YW
EA
llN
YW
EA
llN
YW
EA
llN
YW
E
0–6
year
s (m
ale)
01
00
00
00
00
00
00
00
00
0–6
year
s (fe
mal
e)0
00
00
00
00
00
00
00
00
0
7–12
yea
rs (m
ale)
11
10
00
00
00
00
00
00
00
7–12
yea
rs(fe
mal
e)0
00
00
00
00
00
00
00
00
0
13–1
7 ye
ars
(mal
e)0
00
00
00
00
00
00
00
00
0
13–1
7 ye
ars(
fem
ale)
00
00
00
00
00
00
00
00
00
18–4
0 ye
ars
(mal
e)1
11
00
01
01
00
00
00
00
0
18–4
0 ye
ars(
fem
ale)
11
10
00
00
00
00
00
00
00
41–6
0 ye
ars
(mal
e)0
00
00
00
00
00
00
00
00
0
41–6
0 ye
ars(
fem
ale)
00
00
00
00
00
00
00
00
00
Ove
r 60
year
s (m
ale)
0.2
0.2
10.
20.
30.
10
00
00
00
00
00
0
Ove
r 60
year
s (fe
mal
e)0.
10.
20.
10.
30.
40.
10
00
00
00
00
00
0
Tota
l 3
.3 4
.4 4
.10.
50.
60.
2 1
0
1 0
0
0
0
0
0
0 0
0
Age
cat
egor
y

9
Table 7. Productive assets owned, status, and value.Functioning asset Details All Nyanza WesternHand hoe
Number owned 3.5 3.8 3.2Most working properly (%) 80.10 75.3 87.1Total value (Kshs) 1046.3 1135.2 923
Machete (cutlass)
Number owned 1.6 1.6 1.5Most working properly (%) 81.50 78.1 86.4
Total value (Kshs) 397 358.4 327.1
Axe
Number owned 1.1 1.1 1.1Most working properly (%) 83.2 79.9 88.4Total value (Kshs) 408.6 430.6 376.8
Shovel
Number owned 1.2 1.3 1.5Most working properly (%) 80.5 78.1 86.5
Total value (Kshs) 476.9 513.1 392.6
Ox plough
Number owned 1.1 1.1 1Most working properly (%) 83.2 83 85Total value (Kshs) 6079.5 6271.5 4573.7
Ox cart
Number owned 1.1 1.1 1Most working properly (%) 83.3 83.3 0.0Total value (Kshs) 5494.4 6091.7 716.7
Wheelbarrow
Number owned 1.1 1.1 1.1Most working properly (%) 72.7 69.3 79.8
Total value (Kshs) 3289 3442.7 2988.6
Work bull
Number owned 3.1 3.2 2.4Most working properly (%) 87.5 87.5 87.5Total value (Kshs) 54,918.8 56,487.1 42,111.1
Donkey
Number owned 1.8 1.8 -–Most working properly (%) 89.5 89.5 –Total value (Kshs) 12,487 13,031.8 –
Sprayer
Number owned 1.1 1.2 1.1Most working properly (%) 77.4 79.1 75.6Total value (Kshs) 2680.2 3667 1756.4
Irrigation pump
Number owned 1 1.0 1.0Most working properly (%) 66.7 63.6 75Total value (Kshs) 9475 11,909.1 4120
Productive assets ownedAs depicted in Table 7, analysis of the productive assets shows that there is no variation in the quantities of key productive assets owned by the respondent households in Nyanza and Western. Whereas donkeys are a key productive asset in Nyanza, respondent households in Western don’t keep them for production purposes. Most households in both regions perceive most of their productive assets to be working properly (above 65%). The value of the most key productive assets (like irrigation pumps, sprayers work bulls, ox ploughs, and ox carts) kept by respondents in Nyanza is higher than those of Western.
Households decision-making process in farmingThe decisions made by the household members are very crucial with regards to the level of success that can be achieved in farming. Results presented in Table 8 indicate that, in both Nyanza and Western, while most decisions (on crops to plant, variety to grow, planting new crops, purchase of farm inputs/household assets, food security coping mechanisms, farm operations, and new agricultural technologies to use) are made jointly by head of household and spouse, the decision on acreage to plant is made by household head alone. The results also show that in most households in Western, more decisions on farming aspects are made jointly by the head and the spouse than in Nyanza.

10
Tabl
e 8.
Hou
seho
ld d
ecis
ion-
mak
ing
proc
ess
in fa
rmin
g (%
of r
espo
nden
ts).
Cro
ps to
pla
ntA
crea
ge to
pla
ntVa
riety
to g
row
Plan
ting
new
cr
op
Purc
hase
of f
arm
in
puts
/ hou
seho
ld
asse
tsFo
od s
ecur
ity
copi
ng m
echa
nism
s
Fa
rm
oper
atio
ns
N
ew a
gric
ultu
ral
tech
nolo
gy to
use
NY
WE
NY
WE
NY
WE
NY
WE
NY
WE
NY
WE
NY
WE
NY
WE
Hea
d al
one
39.7
25.6
43.0
26.2
38.8
23.8
38.4
23.4
40.7
28.6
38.5
24.6
38.8
24.8
39.3
24.0
Spo
use
alon
e17
.214
.015
.614
.017
.213
.816
.814
.615
.514
.615
.513
.816
.213
.814
.513
.4
Join
tly (h
ead
and
spou
se)
41.8
59.8
40.0
59.2
42.6
61.8
43.4
61.4
42.4
56.0
44.4
61.0
43.6
60.8
44.7
61.6
Chi
ldre
n1.
30.
61.
40.
61.
40.
61.
40.
61.
40.
81.
60.
61.
40.
61.
61.
0 N
Y =
Nya
nza,
WE
= W
este
rn
11
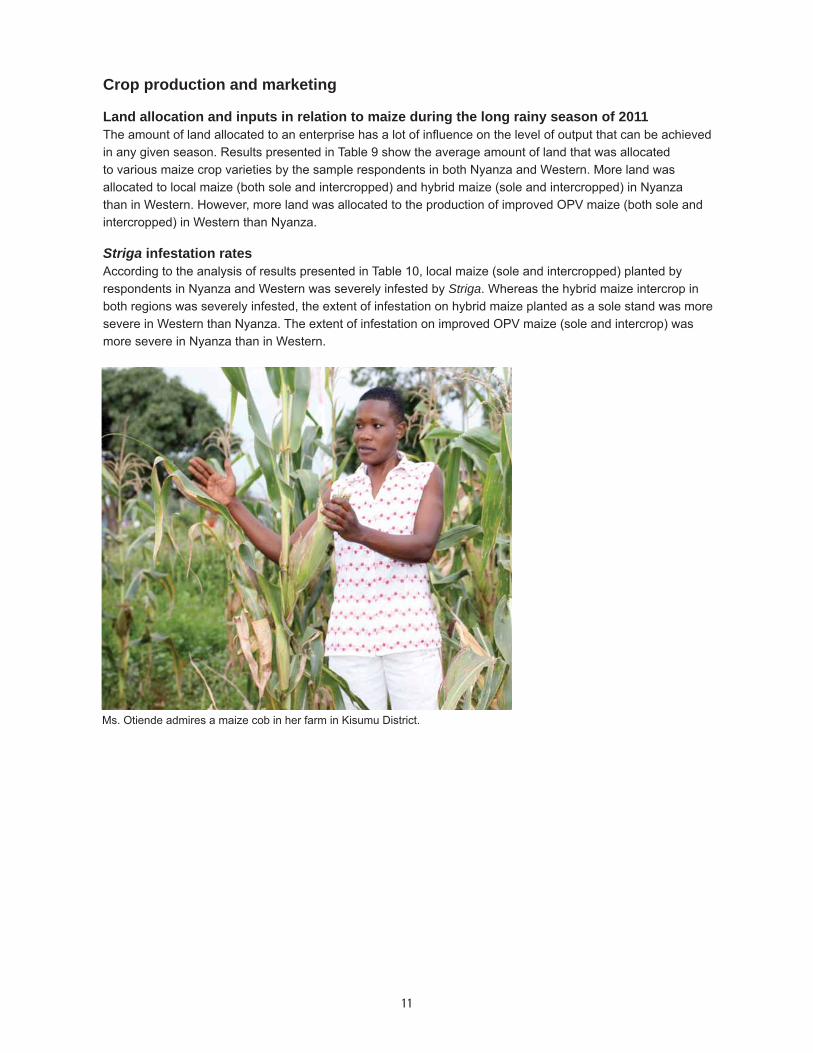
Ms. Otiende admires a maize cob in her farm in Kisumu District.
Crop production and marketing
Land allocation and inputs in relation to maize during the long rainy season of 2011
in any given season. Results presented in Table 9 show the average amount of land that was allocated to various maize crop varieties by the sample respondents in both Nyanza and Western. More land was allocated to local maize (both sole and intercropped) and hybrid maize (sole and intercropped) in Nyanza than in Western. However, more land was allocated to the production of improved OPV maize (both sole and intercropped) in Western than Nyanza.
Striga infestation rates According to the analysis of results presented in Table 10, local maize (sole and intercropped) planted by respondents in Nyanza and Western was severely infested by Striga. Whereas the hybrid maize intercrop in both regions was severely infested, the extent of infestation on hybrid maize planted as a sole stand was more severe in Western than Nyanza. The extent of infestation on improved OPV maize (sole and intercrop) was more severe in Nyanza than in Western.

12
Crop enterprise
All NY WE
Local maize, sole N 222.0 168.0 54.0
Ha 1.6 1.8 1
Hybrid maize, sole N 138 94 4
Ha 1.4 1.6 1
Improved OPV maize, sole N 26.0 7.0 19.0
Ha 1.2 1 1.3
Local maize, intercropped N 444 295 149
Ha 1.6 1.7 1.2
Hybrid maize, intercropped N 376 174 202
Ha 1.2 1.5 1
Improved OPV maize, intercropped N 43 1 42Ha 1.2 1 1.2
N = number of respondents; NY = Nyanza; WE = Western
Land allocation
Table 9. Land allocation (ha).
Crop enterprise
Extent of Striga infestation (% of respondents)
Not infested Mild Severe
All NY WE All NY WE All NY WE
Local maize, sole 10.3 8.8 14.8 37.5 38.2 35.2 52.2 52.9 50.0
Hybrid maize, sole 18.7 16.7 23.3 38.1 33.3 48.8 43.2 50.0 27.9
Improved OPV maize, sole 25.9 0.0 35.0 44.4 42.9 45.0 29.6 57.1 20.0
Local maize, intercropped 8.70 7.30 11.30 46.70 45.70 48.70 44.70 47.00 40.00
Hybrid maize, intercropped 10.2 8.4 11.7 44.3 43.8 44.7 45.6 47.8 43.7Improved OPV maize, intercropped 25.60 0.00 26.20 46.50 100.00 45.20 27.90 0.00 28.60 NY = Nyanza; WE = Western
Table 10. Extent of Striga infestation.

13
Maize intercrop and planting seed typeAs shown in Table 11, most respondents in the two regions intercropped their local maize, hybrid maize, and improved OPV maize with beans. Very few (9.5%) farmers in both regions grew Striga resistant maize varieties. It is also evident from the results that most farmers grew several varieties in their farms. Local varieties which is mainly saved seeds is a common practice in both areas.
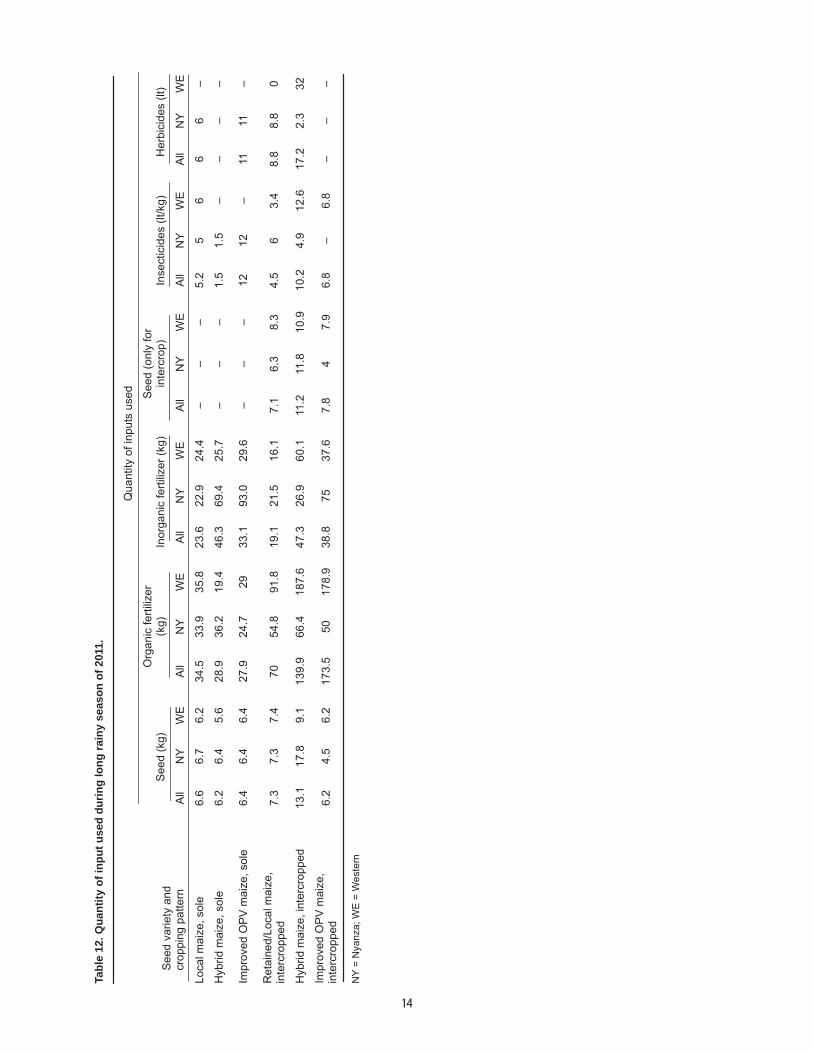
Level of input use As shown in Table 12, overall more hybrid seed maize planted as an intercrop was used by respondents than any other seed variety combination. Organic fertilizer was used more with Improved OPV maize (intercropped) than with any other seed variety combination. Inorganic fertilizer was more popular with hybrid seed maize planted as an intercrop.
Larger volumes of insecticides were more commonly used with hybrid seed maize planted as an intercrop as was the case with herbicides.
Households rating 2011 season above average with regard to rainfall From the analysis of results presented in Table 13, over 25% of respondents perceived the long rain season of 2011 as above average with regards to rainfall/soil moisture in their farms apart from those who planted local maize intercropped with other crops in Western Province.
Total direct production costsThe cost of production is one of the factors that may determine a farmer’s continued involvement in farming activities or not. Table 14 shows that respondents from Western Province who grew hybrid and Improved OPV maize (intercropped) invested more in production compared to their Nyanza counterparts. Respondents growing local maize (sole and intercropped) and hybrid maize (sole) in Nyanza invest more in terms of production cost than respondents from Western.
Table 11. Distribution of households by maize seed type and cropping pattern (%).
Planted seed type/intercropped with Cropping pattern All Nyanza Western
Local variety retained Mono 80.3 83 69.2
Local variety purchased Mono 10.6 8.8 17.9
Purchased hybrid non-Striga resistant Mono 78.6 73.8 88.1
Purchased hybrid Striga resistant Mono 9.5 11.9 4.8
Purchased non-Striga resistant OPV Mono 70.6 50 81.8
Local variety retained Mono 17.6 33.3 9.1
Local maize Intercropping with beans81.9 82.3 81.10
Hybrid maize Intercropping with beans88.6 88.8 84.9
Improved OPV maize Intercropping with beans97.6 100 97.6
14
Tabl
e 12
. Qua
ntity
of i
nput
use
d du
ring
long
rain
y se
ason
of 2
011.
Qua
ntity
of i
nput
s us
ed
See
d (k
g)O
rgan
ic fe
rtiliz
er
(kg)
Inor
gani
c fe
rtiliz
er (k
g)S
eed
(onl
y fo
r in
terc
rop)
In
sect
icid
es (l
t/kg)
H
erbi
cide
s (lt
)
All
NY
WE
All
NY
WE
All
NY
WE
All
NY
WE
All
NY
WE
All
NY
WE
Loca
l mai
ze, s
ole
6.6
6.7
6.2
34.5
33.9
35.8
23.6
22.9
24.4
––
–5.
25
66
6–
Hyb
rid m
aize
, sol
e6.
26.
45.
628
.936
.219
.446
.369
.425
.7–
––
1.5
1.5
––
––
Impr
oved
OP
V m
aize
, sol
e6.
46.
46.
427
.924
.729
33.1
93.0
29.6
––
–12
12–
1111
–
Ret
aine
d/Lo
cal m
aize
, in
terc
ropp
ed7.
37.
37.
470
54.8
91.8
19.1
21.5
16.1
7.1
6.3
8.3
4.5
63.
48.
88.
80
Hyb
rid m
aize
, int
ercr
oppe
d13
.117
.89.
113
9.9
66.4
187.
647
.326
.960
.111
.211
.810
.910
.24.
912
.617
.22.
332
Impr
oved
OP
V m
aize
, in
terc
ropp
ed6.
24.
56.
217
3.5
5017
8.9
38.8
7537
.67.
84
7.9
6.8
–6.
8–
––
NY
= N
yanz
a; W
E =
Wes
tern
See
d va
riety
and
cr
oppi
ng p
atte
rn

15
Amount of maize harvested (Kg) Table 15 shows that maize output for respondents in Western was better than those from Nyanza, except on local maize (sole and intercropped).
Maize marketing during the long rainy season of 2011The results on marketing aspects presented in Table 16 show that respondents from Western have a higher marketed surplus for most maize produce than those in Nyanza except for those growing local maize (intercropped).
Maize selling price during the long rainy season of 2011Across the various maize crop varieties and cropping patterns respondents from Nyanza had a better unit price than those in Western during the peak sales month (Table 17).
A limiting constraint to most maize growing respondents in the two areas is the low produce prices, which limits the farmers’ willingness to adopt productivity enhancing technologies especially in Nyanza. Results also
Table 14. Total direct production costs (Kshs).Seed variety and cropping pattern All Nyanza Western
Local maize, sole 11,903.30 14,311.10 8,403.60
Hybrid maize, sole 11,114.00 12,440.00 8,604.00
Improved OPV maize, sole 14,003.00 10,875.00 14,102.00
Local maize, intercropped 14,013.00 17,724.00 9,626.00
Hybrid maize intercropped 15,755.00 13,792.00 20,168.00
Table 13. Households rating 2011 season above average with regard to rainfall (%). Seed variety and cropping pattern All Nyanza Western
Local maize, sole 38.2 38.8 36.4
Hybrid maize, sole 31.3 29.7 34.9
Improved OPV maize, sole 48.1 28.6 55.0
Local maize, intercropped 34.2 39.2 24.1
Hybrid maize intercropped 37.0 34.7 38.8
Table 15. Amount of maize harvested (Kg) per acre.Seed variety and cropping pattern All Nyanza Western
Local maize, sole 226.70 250.6 157.00
Hybrid maize, sole 1,218.00 541.00 2,604.00
Improved OPV maize, sole 401.00 174.00 469.00
Local maize, intercropped 217.00 225.00 200.00
Hybrid maize intercropped 503.00 311.00 661.00
Average maize production (Kg) 513.14 300.32 818.20
Table 16. Quantity of maize sold (Kg).Seed variety and cropping pattern All Nyanza Western
Local maize, sole 114.00 91.00 221.00
Hybrid maize, sole 2,645.00 195.00 843.80
Improved OPV maize, sole 269.50 – 269.50
Local maize, intercropped 107.00 118.00 95.00
Hybrid maize intercropped 213.40 113.70 291.00

16
A healthy IR maize crop at Vitalis Kweno Farm, in Busia.
showed that technologies not adopted by most respondents due to low produce prices included application of fertilizers and adoption of improved seed varieties.
Proportion of maize grain sold and market place most produce sold Most respondents in the two areas disposed most of their produce at the local market except for the respondents growing improved OPV maize and Hybrid maize (sole) who disposed most of their produce at the farmgate and to the local consumers, respectively (Table 18).
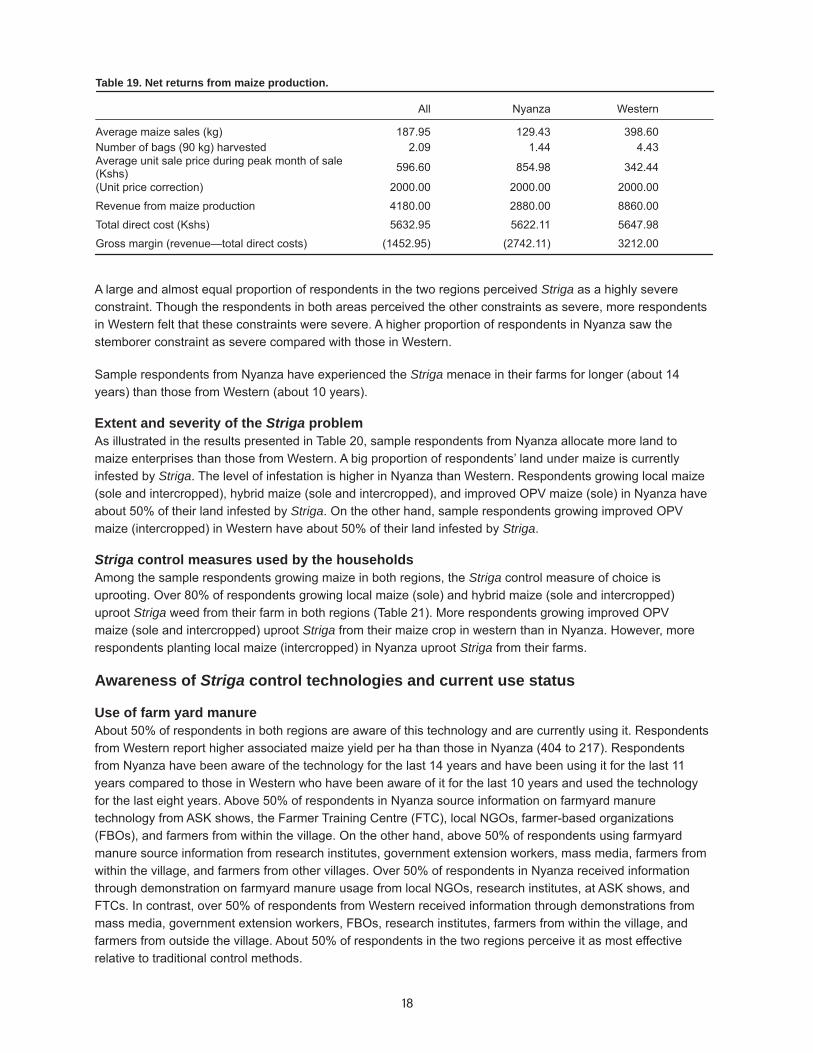
Total maize output and returns during the long rainy season of 2011The results presented in Table 15 indicate that respondent households in Western have a higher marketed surplus than those in Nyanza. However, the unit sale price during the peak month of sale is higher for Nyanza respondents than Western. However, for estimation of gross margins, the average unit prices were found to be too low necessitating the correction of unit price to Kshs 2000. On average, most farmers are not breaking even. The inter-province comparison shows that the gross margin for Nyanza respondents is the lowest. The sampled households in both areas are investing more in terms of direct production costs making the net returns dismal. Even though they attract poor produce unit prices during the peak sales month, the higher gross margin for Western respondents is because of higher output per hectare and higher marketed surplus. The lower net revenue for respondents in Nyanza is due to low output per hectare, low marketed surplus, and numerous high direct cost elements (discussed later) even though they attract fairly better produce prices during the peak sales month.

17
Table 17. Average price per 90-kg bag during peak month (Kshs).Seed variety and cropping pattern All Nyanza Western
Local maize, sole 286.00 385.00 119.00
Hybrid maize, sole 542.80 799.90 323.20
Improved OPV maize, sole 2,526.50 1,627.00 360.00
Local maize, intercropped 604.00 608.00 591.00
Hybrid maize intercropped 499.50 – 499.50
Production of other crop enterprisesThe level of production of other crop enterprises greatly determines the level of resources that can be allocated for the production of maize. The results presented in Table 16 indicate that sample respondents in Nyanza obtain higher productivity per hectare of land planted with other crops than respondents from Western. This may likely determine the amount of land respondents in both regions allocate to the production of maize.
Access and control over resources
Gender access to resourcesAs depicted in the analysis of results shown in Table 17 and according to a high proportion of sampled
Nyanza a high proportion of sampled respondents indicate that women have less access than men compared with the proportion in Western. On the other hand, a high proportion of respondents in Western indicate that women have equal access to resources compared with the proportion in Nyanza.
Gender involvement in activities and practicesA higher proportion of respondents in both regions indicated that there was equal involvement of men and women in all farm activities and practices (Table 18). However, the proportion of respondents in Western was higher compared with those in Nyanza.
Striga extent, severity, and control technologies
Main production constraintsThe results presented in Table 19 show that the key production constraints in order of importance to the sampled respondents were Striga menace, other weeds, termites, storage insects, lack of fertilizers, stemborer, low and erratic rainfall, lack of herbicide, and lack of pesticides. While other weeds and low and erratic rainfall constraints were felt more by the respondents of Nyanza, stemborer, lack of fertilizer, lack of herbicides, and lack of pesticides were felt more by the respondents of Western.
Table 18. Market place where most grain was sold and proportion.
Seed variety and cropping pattern
Market place where most grain was sold and proportion
Local market Local consumers Farmgate
Local maize, sole 65.90%
Hybrid maize, sole 47.10%
Improved OPV maize, sole 50.00%
Local maize, intercropped 70.80%
Hybrid maize intercropped 50.00%
– – –
––
––
––
18
A large and almost equal proportion of respondents in the two regions perceived Striga as a highly severe constraint. Though the respondents in both areas perceived the other constraints as severe, more respondents in Western felt that these constraints were severe. A higher proportion of respondents in Nyanza saw the stemborer constraint as severe compared with those in Western.
Sample respondents from Nyanza have experienced the Striga menace in their farms for longer (about 14 years) than those from Western (about 10 years).
Extent and severity of the Striga problem As illustrated in the results presented in Table 20, sample respondents from Nyanza allocate more land to maize enterprises than those from Western. A big proportion of respondents’ land under maize is currently infested by Striga. The level of infestation is higher in Nyanza than Western. Respondents growing local maize (sole and intercropped), hybrid maize (sole and intercropped), and improved OPV maize (sole) in Nyanza have about 50% of their land infested by Striga. On the other hand, sample respondents growing improved OPV maize (intercropped) in Western have about 50% of their land infested by Striga.
Striga control measures used by the householdsAmong the sample respondents growing maize in both regions, the Striga control measure of choice is uprooting. Over 80% of respondents growing local maize (sole) and hybrid maize (sole and intercropped) uproot Striga weed from their farm in both regions (Table 21). More respondents growing improved OPV maize (sole and intercropped) uproot Striga from their maize crop in western than in Nyanza. However, more respondents planting local maize (intercropped) in Nyanza uproot Striga from their farms.
Awareness of Striga control technologies and current use status
Use of farm yard manureAbout 50% of respondents in both regions are aware of this technology and are currently using it. Respondents from Western report higher associated maize yield per ha than those in Nyanza (404 to 217). Respondents from Nyanza have been aware of the technology for the last 14 years and have been using it for the last 11 years compared to those in Western who have been aware of it for the last 10 years and used the technology for the last eight years. Above 50% of respondents in Nyanza source information on farmyard manure technology from ASK shows, the Farmer Training Centre (FTC), local NGOs, farmer-based organizations (FBOs), and farmers from within the village. On the other hand, above 50% of respondents using farmyard manure source information from research institutes, government extension workers, mass media, farmers from within the village, and farmers from other villages. Over 50% of respondents in Nyanza received information through demonstration on farmyard manure usage from local NGOs, research institutes, at ASK shows, and FTCs. In contrast, over 50% of respondents from Western received information through demonstrations from mass media, government extension workers, FBOs, research institutes, farmers from within the village, and farmers from outside the village. About 50% of respondents in the two regions perceive it as most effective relative to traditional control methods.
Table 19. Net returns from maize production.
All
Nyanza
Western
Average maize sales (kg) 187.95 129.43 398.60 Number of bags (90 kg) harvested 2.09 1.44 4.43 Average unit sale price during peak month of sale (Kshs) 596.60 854.98 342.44
(Unit price correction) 2000.00 2000.00 2000.00
Revenue from maize production 4180.00 2880.00 8860.00
Total direct cost (Kshs) 5632.95 5622.11 5647.98
Gross margin (revenue—total direct costs) (1452.95) (2742.11) 3212.00

19
Table 20. Land allocation for other crop enterprises.
Mean Mean Mean
Sorghum 1.6 1.3 2.7Yield per hectare obtained 103.1 116.7 66.8Millet 0.5 0.7 0.3Yield per hectare obtained 136.8 158.2 109.8Rice 1.4 1.5 0.1Yield per hectare obtained 7304.7 7861.2 70Groundnut 2.1 1.2 3.1Yield per hectare obtained 107 67.2 152.8Sweetpotato 10.5 24.1 1.4Yield per hectare obtained 86.8 108.6 72.9Soybean 0.4 0.4 0.3Yield per hectare obtained 65.5 42.8 73.9Cassava 0.9 1.4 0.6Yield per hectare obtained 168.6 209.4 143.2Kale/sukuma wiki 0.9 1.3 0.7Yield per hectare obtained 128.2 55.9 166.7Cabbage 0.1 0 0.1Yield per hectare obtained 91 150 76.2
Indigenous/local vegetables
Yield per hectare obtained 77.6 39.6 91.6
Onion 2.1 (9.4) 2.5 (10.53) 0.3Yield per hectare obtained 22.1 23.1 18.7Tomato 4 5 0.3Yield per hectare obtained 149.6 152.7 140.5Watermelon 1.1 1.1 –Yield per hectare obtained 155 155 –Eggplant 0 – 0Yield per hectare obtained 1000 – 1000Cotton 1.1 1.3 0.1Yield per hectare obtained 187.6 231.1 13.5Others 2.5 5.1 0.6Yield per hectare obtained 60,348.7 140,000 468Overall average output per hectare (Kg) 2097 2786 208.125
Crop
Table 21. Level of access to resources by men and women.
ResourceAccess to resources by women
Level of access by women as well as men (% of respondents)
More than men Equally with men Less than men
All NY WE All NY WE All NY WE All NY WE
Natural capital (land areas and tenure) 78.2 78.2 78.1 7.9 6.5 9.8 44.5 41 50 47.6 52.7 40.6
Human capital (labor) 11.3 13 9 11 9.1 14 59.2 55 65 29.8 36.3 21.2
Financial capital (cash, credit) 85.5 85.0 86.2 8.1 7.3 9.3 54.9 49.9 61.9 36.9 42.8 28.9
Physical capital (housing quality, consumer durables) 83.2 81.2 85.9 9.7 7.4 13 52.9 45 63 37.4 47.7 23.9
Social capital (social networks and associations) 85.5 84.8 86.5 25.4 24.4 26.7 51.3 46.1 58.4 23.3 29.5 14.9NY = Nyanza; WE = Western.
Yield/ha All Yield/ha Nyanza Yield/ha Western

20
Use of hand pullingAbout 57% of the respondents in Nyanza are aware of and using the technology currently as compared to about 43% of respondents in Western. The associated maize yield per ha is higher for Nyanza respondents compared to respondents in Western (617 to 484). While respondents in Nyanza have been aware of the technology for 16 years and used it for the last 14 years, those in Western have been aware of it for 11 years and used it for the last nine years. Over 50% of respondents in Nyanza received information on the technology from government extension workers, local NGOs, FBOs, mass media, and farmers within the village. On the other hand, over 60% of respondents from Western received information on hand pulling technology from FTCs, research institutes, and farmers from other villages. For about 50% of the respondents in Nyanza, demonstrations on the technology were conducted by farmers from the village, government extension workers, local NGOs, FBOs, and FTCs. For about 50% of the respondents in Western demonstrations were conducted by FTCs, FBOs, research institutes, and farmers from other villages. About 64% of the respondents in Western perceive the technology as the most effective relative to traditional control methods compared to about 48% of respondents in Nyanza who consider it moderately effective.
Use of inorganic manureAbout 57% of the respondents in Nyanza are aware of and currently using the technology compared to about 42% of respondents in Western. The associated maize yield per ha is higher for Western respondents compared to respondents in Nyanza (268 to 490). While respondents in Nyanza have been aware of the
12 years and used it for the last 11 years. Over 50% of respondents in Nyanza received information on the technology from FBOs, mass media, FTCs, farmers from other villages, and farmers within the village. On the other hand, over 60% of respondents from Western received information on inorganic fertilizer technology from research institutes, local NGOs, government extension workers, and farmers from other villages. For over 50% of the respondents in Nyanza, demonstrations on the technology were conducted by farmers from the village, local NGOs, and FBOs. For over 50% of the respondents in Western, demonstrations were conducted by research institutes, government extension workers, farmers from the village, and farmers from other villages. About 88% of the respondents in Nyanza perceive the technology as the most effective relative to traditional control methods compared to about 63% of respondents in Western who consider it moderately effective.
The awareness level on other Striga control technologies like IR maize is less than 5% and the current use level among respondents who are aware of it is about 20% except for crop rotation with a use level of about 74%. About 50% of respondents who are aware of them have never adopted them.
Reasons for non-adoption of Striga control technologiesTable 22 presents the results indicating that the main reason for non-adoption of Striga control technologies is lack of adequate information about the technology even though farmers are aware of them; this is followed by the high cost of the technology, non-availability of improved seed (Striga-resistant varieties), and fear of technology failure.
Vulnerability, capital assets, and livelihoods
months in a year. By region the proportion of respondents is higher for Nyanza compared to Western. By

21
Tabl
e 22
. Lev
el o
f par
ticip
atio
n by
men
and
wom
en in
farm
act
iviti
es a
nd p
ract
ices
.
Onl
y w
omen
in
volv
edW
omen
mor
e th
an
men
Equa
l inv
olve
men
tW
omen
less
invo
lved
Act
ivity
All
NY
WE
All
NY
WE
All
NY
WE
All
NY
WE
All
NY
WE
4.3
4.0
4.7
31.6
31.6
31.5
42.3
40.3
44.9
16.7
20.4
11.6
5.2
3.6
7.3
Plo
ughi
ng fa
rmla
ng1.
91.
42.
421
.118
.125
.441
.342
.439
.825
.930
.719
.19.
87.
313
.4
Pla
ntin
g cr
ops
2.0
1.4
2.8
35.4
37.6
32.3
56.9
55.6
58.8
4.9
5.0
4.7
0.8
0.3
1.4
Wee
ding
cro
ps2.
92.
04.
340
.645
.433
.952
.449
.157
.03.
53.
24.
10.
50.
30.
8
Har
vest
ing
crop
s2.
32.
22.
437
.742
.730
.656
.451
.962
.73.
22.
93.
70.
40.
30.
6
Pos
thar
vest
ing
crop
s4.
96.
13.
241
.748
.332
.547
.640
.657
.45.
24.
85.
90.
60.
31.
0
Sal
e of
farm
pro
duce
3.9
3.2
4.9
35.6
37.3
33.3
50.0
49.3
51.0
9.4
9.1
9.8
1.1
1.2
1.0
Off-
farm
act
iviti
es2.
041.
163.
2617
.32
18.7
815
.27
44.9
942
.07
49.0
831
.15
33.6
227
.70
4.50
4.37
4.68
Lear
ning
impr
oved
agr
icul
tura
l te
chno
logi
es1.
901.
222.
8626
.70
27.8
125
.10
48.7
043
.92
55.1
020
.30
24.3
214
.90
2.40
2.74
2.04
Ada
ptiv
e tri
als
of im
prov
ed a
gric
ultu
ral
tech
nolo
gies
2.11
1.20
3.30
24.8
226
.30
22.9
048
.68
45.3
053
.20
22.1
124
.90
18.4
02.
282.
302.
30
Trai
ning
oth
er fa
rmer
s on
impr
oved
ag
ricul
tura
l tec
hnol
ogie
s2.
000.
603.
9023
.70
26.4
020
.10
45.8
041
.90
51.0
024
.80
26.4
022
.60
3.60
4.60
2.30
Leve
l of i
nvol
vem
ent o
f wom
en a
s w
ell a
s m
en (%
)
NY
= N
yanz
a; W
E =
Wes
tern
.
W
omen
not
invo
lved

22
Tabl
e 23
. Dis
trib
utio
n of
resp
onde
nts
by m
ain
prod
uctio
n co
nstr
aint
s an
d le
vel o
f sev
erity
.
%
of r
espo
nden
ts
expe
rienc
ing
cons
trai
nt
Leve
l of s
ever
ityN
umbe
r of y
ears
as
cons
trai
nt o
n th
e fa
rmH
ighl
y se
vere
Seve
reLe
ss s
ever
e
A
llN
YW
EA
llN
YW
EA
llN
YW
EA
llN
YW
EA
llN
YW
E
Stri
ga a
s a
prod
uctio
n co
nstra
int
93.0
92.9
93.1
46.3
45.3
47.8
36.9
38.4
34.7
16.8
16.3
17.6
12.9
414
.29
10.9
5
Ste
m b
orer
36.6
31.1
44.2
3131
.330
.741
.242
.539
.927
.826
.229
.4
Term
ites
44.2
44.0
44.6
29.3
31.8
25.8
4846
.450
.222
.821
.924
.0
Sto
rage
inse
cts
44.2
44.0
44.6
29.3
31.8
25.8
4846
.450
.222
.821
.924
.0
Low
and
err
atic
rain
fall
3643
.325
.823
.326
.116
.556
.155
.357
.920
.618
.625
.6
21.4
24.8
16.6
38.6
39.6
36.2
43.8
40.8
50.0
17.7
19.5
13.8
Lack
of i
mpr
oved
see
ds34
.934
.835
.028
.130
.125
.457
.556
.359
.214
.313
.515
.4
Lack
of f
ertil
izer
42.5
37.0
50.2
29.6
35.0
24.1
53.4
48.4
58.5
1716
.717
.4
Lack
of h
erbi
cide
28.6
25.8
32.6
23.5
28.7
17.8
51.2
48.0
54.8
25.3
23.4
27.4
Lack
of p
estic
ide
28.7
24.2
35.0
23.9
27.7
20.5
49.1
48.4
49.7
2723
.929
.8
Oth
er w
eeds
as
prod
uctio
n co
nstra
ints
82.0
83.8
79.1
33.3
31.6
36.4
54.4
49.1
63.6
12.2
19.3
0.0
NY
= N
yanz
a; W
E =
Wes
tern
.
Con
stra
int

23
Table 24. The extent and severity of Striga constraint in maize crop enterprises.
Area usually under maize
Proportion of land infested by Striga (%)
Now Past two years
All NY WE All NY WE All NY WE
Local maize, sole 1.6 1.7 1.3 45.6 48.1 39.4 41.8 41.4 42.6
Hybrid maize, sole 1.2 1.5 0.5 48.2 49.8 45.3 44.7 39.9 53.6
Improved OPV maize, sole 1.8 6 1.1 36.6 52.5 33.9 41.1 40.5 41.2
Local maize, intercropped 1.4 1.6 1 50.9 52 48.1 48.2 47.8 49.1
Hybrid maize, intercropped 1.2 1.5 0.5 48.2 49.8 45.3 44.7 39.9 53.6
Improved OPV maize, intercropped 1.1 1.5 0.7 48.6 42.6 54.2 44.4 40.9 47.8 NY = Nyanza; WE = Western.
by remittances, informal credit, and cash savings at the bank. There is no major variation in the sampled
Livestock ownershipThe results presented in Table 25 show that respondents from Nyanza keep a higher number of most livestock types than respondents from Western. However, it is noted that respondents from Western keep a higher number of livestock like pigeons, rabbits, and donkeys. The unit value of livestock kept by sample respondents in Nyanza is higher than those in Western, leading to a higher total value of livestock owned for respondents from Nyanza.
Access to physical infrastructure/capitalThe two regions are variously endowed with physical infrastructure/capital. According to the results presented in Table 26, most respondents in the two areas access water from the lake/stream/river, rainwater, boreholes, wells, and springs. Conspicuously, a higher proportion of respondents in Nyanza rely on borehole water while a higher proportion from Western relies on springs and rainwater.
The majority of respondents (over 80%) in the two regions access pit latrines as a form of toilet. For house lighting
50%) across the regions include health centers, bicycles, mobile phones, own house, corrugated iron roof sheet, and mud and pole wall.
Access to human capitalFrom the results presented in Table 27, the proportion of sampled households accessing information on various introduced agricultural technologies is very low. The proportions of sample respondents who access information in Western obtain it from government extension workers while those in Nyanza mostly from NGOs/projects. A small percent of households in both areas obtain information from private agents.
Household incomeFrom the results presented in Table 28, a higher proportion of respondents from Western are involved in maize production and have higher revenue from maize per year than respondents from Nyanza. However, a higher proportion from Nyanza perceive maize production as a stable source of income than those from Western. While a higher proportion of respondents from Western are involved in the production of other crops and wage employment, a higher proportion of respondents from Nyanza are involved in livestock keeping. Respondents from Western receive higher revenues from other crops, livestock, and wage employment per year than those from Nyanza. However, a smaller proportion of respondents feel that other crops, livestock keeping, and wage employment is a stable source of income than those from Nyanza.
Crop

24
Tabl
e 25
. Dis
trib
utio
n of
resp
onde
nts
by S
trig
a co
ntro
l mea
sure
s.
Strig
a co
ntro
l mea
sure
use
d (%
)
Upr
ootin
gBu
rnin
gM
anur
ing
Cro
p ro
tatio
nIn
terc
ropp
ing
Push
pul
lIR
mai
zeO
ther
s
Al
lN
YW
EAl
lN
YW
EAl
lN
YW
EAl
lN
YW
EAl
lN
YW
EAl
lN
YW
EAl
lN
YW
EAl
lN
YW
E
Loca
l mai
ze, s
ole
86.5
86.8
85.7
1.6
1.7
1.4
8.6
7.5
11.4
0.8
1.1
0.0
0.4
0.0
1.4
0.0
0.0
0.0
0.0
0.0
0.0
2.0
2.9
0.0
Hybr
id m
aize
, sol
e85
8292
1.9
3.1
07.
811
2.6
11.
50
00
00
00
00
03.
93.
15.
3
Impr
oved
OPV
m
aize
, sol
e86
.750
.092
.30.
00.
00.
013
.350
.07.
70.
00.
00.
00.
00.
00.
00.
00.
00.
00.
00.
00.
00.
00.
00.
0
Loca
l mai
ze,
inte
rcro
pped
100
66.7
33.3
100
5050
100
81.4
100
7525
100
100
100
0.0
100
0.0
100
0.0
0.0
0.0
100
90.0
10
Hyb
rid m
aize
, in
terc
ropp
ed85
.481
.592
.11.
93.
10.
07.
810
.82.
61.
01.
50.
00.
00.
00.
00.
00.
00.
00.
00.
00.
03.
93.
15.
3
Impr
oved
O
PV m
aize
, in
terc
ropp
ed77
.065
.886
.71.
83.
20.
614
.019
.49.
40.
91.
90.
02.
44.
50.
60.
91.
30.
60.
61.
30.
02.
42.
62.
2
NY
= N
yanz
a; W
E =
Wes
tern
.
Cro
p

25
Household non-farm incomeThe results presented in Table 29 show that a higher proportion of respondent’s household members are engaged in non-farm income in Nyanza than Western. However, for most non-farm income activities performed, respondent households in Western obtain a higher amount of money per year than those in Nyanza. The proportion of respondent households who perceive these activities as stable source of income is higher in Nyanza than Western. The sample respondents from Western obtain a higher overall non-farm income per year than sampled respondents from Nyanza.
Opportunities and constraints affecting maize productionThe analysis of opportunities and constraints affecting maize production in this study was done in two ways; First through assessment of household livelihood assets and second through studying the factors affecting maize production.
% distribution of households by duration of food
All Nyanza Western
None 3.1 4.9 8.4
1–3 months 34.4 37.5 30.0
4–6 months 28.6 30.1 26.6
7–9 months 18.9 15.2 24.2
10–12 months 11.7 12.3 10.8
Table 26. Distribution of respondent households by reason for non-adoption of technology.
Reason for non-adoption
% of respondentsRank
All NY WE
Lack of adequate information about the technology 43.05 41.1 45.0 1
Fear of technology failure 20.95 16.5 25.4 4
High cost of technology 30.55 23.1 38.0 2
Non-availability of improved seed (Striga-resistant varieties) 24.3 17.0 31.6 3
Others (e.g., cultural factors) 7.05 6.7 7.4 5
NY = Nyanza; WE = Western.
All Nyanza Western
Cash savings at the bank 21.3 21.5 21.0
Cash savings at home/pocket 65.5 62.3 70.0
Claim of good debtors 17.3 20.6 12.6
Jewellery 2.3 2.6 2.0
Formal credit 10.9 10.7 11.2
Informal credit 27.9 27.8 28.0
Cash remittances from relatives/friends 37.4 38.4 36.0
Others 11.4 12.8 9.4
No. of months

26
Table 29. Average number of livestock kept by households and their value.
Whole sample Nyanza Western
Livestock Mean Valid N Mean Valid N Mean Valid N
Dairy cattle 2.2 3.2 1.9
Average price/unit (Ksh) 5106.6 106.0 29,252.2 23.0 23,957.8 83.0
Local cattle 3.8 703.0 4.4 431.0 3 272.0
Average price/unit (Ksh) 14,023 681.0 14,063.8 418.0 13,958.2 263.0
Dairy goats 3.4 33.0 3.6 16.0 3.2 17.0
Average price/unit (Ksh) 11,363.6 33.0 12,275 16.0 10,505.9 17.0
Local goats 3.7 387.0 4 302.0 3 85.0
Average price/unit (Ksh) 3599.9 374.0 3640.6 293.0 3452.8 81.0
Sheep 4.3 269.0 4.7 213.0 2.8 56.0
Average price/unit (Ksh) 3016 260.0 3129.3 205.0 2593.6 55.0
Chicken 10.6 1,002.0 10.8 580.0 10.4 422.0
Average price/unit (Ksh) 395.8 1,002.0 390.9 580.0 402.6 422.0
Rabbits 9.1 17.0 11.9 9.0 5.9 8.0
Average price/unit (Ksh) 658.6 14.0 324.3 7.0 992.9 7.0
Pigeon 7.5 11.0 7.4 9.0 7.5 2.0
Average price/unit (Ksh) 165 10.0 168.8 8.0 150 2.0
Donkeys 1.9 21.0 1.8 20.0 5.0 1.0
Average price/unit (Ksh) 8294.7 19.0 8533.3 18.0 4,000.0 1.0
Horses 8 2.0 6.0 1.0 10.0 1.0
Average price/unit (Ksh) 500.0 1.0 500.0 1.0 – –
Guinea fowl 1.0 2.0 – – 1.0 2.0
Average price/unit (Ksh) 3250 2.0 – – 3250 2.0
Ducks 73.8 57.0 120.7 34.0 4.5 23.0
Average price/unit (Ksh) 671.9 53.0 600 32.0 781.4 21.0
Pigs 2.2 58.0 4.2 8.0 1.8 50.0
Average price/unit (Ksh) 3490.2 57.0 3037.5 8.0 3564.1 49.0
Total value of livestock owned (Ksh) 75,488.5 1122.0 100,000 651.0 40,956.7 471.0
Result of multiple linear regression analysisMaize output was regressed with the quantity of land, labor, maize seeds planted, fertilizer, and agrochemicals. An econometric model was used to analyze the effect of production input on maize output. Production of maizefollows:
Y= (1) Where Y = maize output in kilograms
factorX1 = land under cultivationX2 = total number man-hours of labor X3 = quantity of maize planted in kilograms

27
X4 = quantity of fertilizer in kilogramsX5 = quantity of agrochemicals used in liters
1, 2…5)μ = an error term measuring variation in maize output unaccounted for by independent variable.
maize output. (i = 1, 2…5) was found when a variable is associated with the decrease in maize output.
The implication of this result is that any unit increase in the quantity of inorganic fertilizer will increase maize output by the value of their estimated This
unit increase in the usage of fertilizer increases maize output.
Integrated Striga management demonstration plot in Teso District.

28
Table 30. Level of access to physical infrastructure.
Physical infrastructure/capital
% household access distributed by region
All NY WEWater supply Piped 3.9 4.4 3.4
Public tap 6.45 8.9 4.0
Borehole 31.55 35.7 27.4
Well/spring 24.65 19.9 29.4
Rain water 28.15 25.9 30.4
Vendor/tanker truck 1.85 2.9 0.8
River/lake/stream 51.15 52.3 50.0
Others 1.25 1.7 0.8
Toilet facility Flush toilet 1.85 2.1 1.6
Pit latrine 89.6 83.0 96.2
Bush 8.5 14.6 2.4
Others 1.05 1.7 0.4
Type of lighting for house Electricity 4.2 5.6 2.8
Lantern 96 94.8 97.2
Candles 4.5 3.2 5.8 Torch 5 6.0 4.0 Firewood 3.35 2.7 4.0 Solar 2.15 2.7 1.6 Gas 0.15 0.1 0.2 Others 0.25 0.3 0.2Cooking fuel Firewood 94 93.4 94.6
Charcoal 28.8 30.4 27.2 Electricity 0.8 1.0 0.6 3.4 4.0 2.8 Gas 0.4 0.6 0.2 Others 0.15 0.1 0.2Health center/hospital 84.75 87.7 81.8Own vehicle 4.25 5.3 3.2Own motorcycle 6.75 8.3 5.2Own bicycle 45.5 44.4 46.6Telecommunication (mobile phone, others) 73.25 73.5 73.0Own house 83.55 80.7 86.4Renting a house 6.5 7.2 5.8
House roof Thatched 18.35 12.3 24.4
Corrugated iron sheets/Aluminum sheets 82.8
86.4 79.2
Asbestos 0.2 0.4 0.0 Tiles 0.35 0.7 0.0
Concrete 0.7 1.0 0.4
Others 0.05 0.1 0.0
House wall Thatched 4.2 1.6 6.8
Mud and poles 79.8 79.2 80.4
Raw bricks 1.55 1.1 2.0 Burnt bricks with mud 8.25 8.9 7.6 Cement blocks 6.35 8.3 4.4
Stone 0.55 0.7 0.4
Others 1.15 1.9 0.4

29
Table 32. Household farm income.
Enterprise All Nyanza Western
Maize production
Proportion of households members involved in maize production 44.90% 40.10% 49.50%
Amount from maize production per year (Ksh) 20,225.5 16,060.5 23,553.8
Proportion of households reporting production of maize as stable source of income
17.90% 23.1% 13.4%
Other crops production
Proportion of households members involved in production of other crops 37.00% 33.8% 40.9%
Amount from other crops production per year (Ksh) 27574.2 25749.8 51008.9
Proportion of households reporting production of other crops as stable source of income
19.70% 26.8% 10.6%
Livestock keeping
Proportion of households members involved in livestock keeping 41.20% 43.2% 38.9%
Amount from livestock keeping per year (Ksh) 16471.2 11773 22065.8
Proportion of households reporting livestock keeping as stable source of income
20.30% 27.4% 11.6%
Agricultural wage employment
Proportion of households members involved in agricultural wage employment 24.40% 23.9% 25.0%
Amount from agricultural wage employment per year (Ksh) 16436.1 12352 20265
Proportion of households reporting agricultural wage employment as stable source of income
5.90% 8.9% 2.3%
N 155 75 80
Total farm income (Ksh) 38779.1 30156.5 48600.7
Table 31. Households’ access to human capital.
Technology on which advice received
Source
% household access to information on technologies distributed by source
Distributed by number of times/visits in 2011
All NY WE All NY WE
Improved maize varieties Public (Govt. etc) 11.2 9.6 12.8 3 4 2NGOs/Projects 8.65 9.5 7.8 2 2 2
Private agents 2.5 3.6 1.4 2 2 2
Improved cowpea varieties Public (Govt. etc) 4.2 3.0 5.4 2 2 2NGOs/Projects 3.65 3.3 4.0 2 2 2
Private agents 1.05 2.1 0.0 1 2 -
Control of Striga Public (Govt. etc) 8.1 6.6 9.6 2 2 2NGOs/Projects 5.95 7.3 4.6 2 2 2
Private agents 3.3 4.0 2.6 2.5 3 2
Control of other weeds
Public (Govt. etc) 5.4 4.2 6.6 2 2 2NGOs/Projects 4.1 4.0 4.2 2 2 2
Private agents 2.1 3.0 1.2 2 2 2
Soil fertility management
Public (Govt. etc) 7.6 7.4 7.8 1.5 2 1NGOs/Projects 6.45 7.3 5.6 2 2 2Private agents 1.8 2.4 1.2 1 1 1
Improved food grain storage Public (Govt. etc) 4.25 3.3 5.2 1.5 2 1NGOs/Projects 3.6 3.6 3.6 2 3 1Private agents 1.1 1.4 0.8 0.5 1 -
Collective product marketing Public (Govt. etc) 3.7 3.0 4.4 2 2 2NGOs/Projects 3.5 3.6 3.4 1.5 2 1Private agents 0.95 1.1 0.8 1 2 -
Livestock management Public (Govt. etc) 5.45 5.3 5.6 2 2 2NGOs/Projects 4.45 4.7 4.2 5 7 3Private agents 1.6 2.0 1.2 3 3 3

30
Source All Nyanza Western
Non-agricultural wage Proportion of household members involved 26.2 27.9% 24.2%
Amount obtained per year (Ksh) 45,929.9 44,886.7 47,132.6
Proportion of households reporting it as stable source of income 24.5 33.6% 12.5%
Petty trade Proportion of household members involved 29.4 29.6% 29.1%
Amount obtained per year (Ksh) 32,917.5 32,169.9 33,851.9
Proportion of households reporting it as stable source of income 18.5 21.7% 14.2%
Handicrafts Proportion of household members involved 6 8.5% 2.8%
Amount obtained per year (Ksh) 20,835.4 14,657.5 51725
Proportion of households reporting it as stable source of income 14.5 14.6% 14.3%
Transport service Proportion of household members involved 11.3 12.1% 10.5%
Amount obtained per year (Ksh) 42,879.4 65,377.5 28,364.5
Proportion of households reporting it as stable source of income 17.2 20.0% 14.3%
Grain mills Proportion of household members involved 10.3 3.8% 16.1%
Amount obtained per year (Ksh) 7203.9 20,416.6 3600.4
Proportion of households reporting it as stable source of income 57.9 30.8% 72.0%
Fishing Proportion of household members involved 6.2 10.7% 1.0%
Amount obtained per year (Ksh) 40,493.1 45732 7750
Proportion of households reporting it as stable source of income 17.9 21.2% .0%
Hunting and gathering of wild food Proportion of household members involved 2.4 3.8% 1.0%
Amount obtained per year (Ksh) 45,000 4,5000 .
Proportion of households reporting it as stable source of income 0 0 0
Selling fuelwood and charcoal Proportion of household members involved 15.4 20.1% 9.8%
Amount obtained per year (Ksh) 15,689.3 18,477.5 8718.75
Proportion of households reporting it as stable source of income 9.4 10.9% 5.6%
Selling prepared food/drinks Proportion of household members involved 6.4 6.3% 6.5%
Amount obtained per year (Ksh) 24,146.7 30,105.7 12,228.6
Proportion of households reporting it as stable source of income 10.8 13.0% 7.1%
Professional work Proportion of household members involved 14 14.1% 13.8%
Amount obtained per year (Ksh) 120,000 134,870 91,640
Proportion of households reporting it as stable source of income 48.6 58.1% 33.3%
Traditional medicine Proportion of household members involved 3.3 6.4% .0%
Amount obtained per year (Ksh) 6792.3 6792.3
Proportion of households reporting it as stable source of income 12.5 15.0% .0%
Rent income Proportion of household members involved 6 5.6% 6.3%
Amount obtained per year (Ksh) 52,078.3 40,046.2 67720
Proportion of households reporting it as stable source of income 31.4 34.8% 25.0%
Remittances Proportion of household members involved 29.6 28.7% 30.7%
Amount obtained per year (Ksh) 18,850 18,598.3 19,140.4
Proportion of households reporting it as stable source of income 12.6 16.3% 8.3%
Other non-farm income Proportion of household members involved 30.4 28.9% 33.3%
Amount obtained per year (Ksh) 57,170.2 67,960 38,129.4
Proportion of households reporting it as stable source of income 24.5 35.5% 5.6%
Total non-farm Income (Ksh) 50,469.4 52,967.3 47,353.1
Total income (farm and non-farm income) (Ksh) 64,592.5 59,471.5 71,024.7
Table 33. Household non-farm income details.

31
Table 34. Linear regression results for the determinants of maize production.
Variable Standard error t-ratio P[|T|>t] Mean of X|
Constant 5.07998 0.58019 8.756*** .0000
Amount of maize planted 0.000388 0.0004324 0.897 0.3704 –12.1306
Amount of organic fertilizer used –0.0000221 0.0000858 –0.257 0.7972 –463.853
Amount of inorganic fertilizer used 0.000284 0.0001119 2.532** 0.0118 –447.523
Amount of insecticides used 0.00005905 0.000148 0.397 0.6916 –170.18
Amount of herbicides used –0.000487 0.000515 –0.945 0.3455 –986.514
Household family labor input 0.000000606 0.0000231 0.026 0.9791 1567.673
P < 0.1, ** = P < 0.05, and *** = P < 0.01.
IR seed maize pack.

32
Conclusion and Recommendations
Conclusion The study concludes that most maize farmers are relatively literate and have the ability to receive, decode, and understand any relevant information to make innovative decisions on Striga control technologies. Land acquisition for maize production in the study area is mainly through inheritance hence most households can make major long-term investment decisions touching on the management of Striga on their farms. Most maize farmers are small-scale farmers and are likely to prefer improved Striga management measures that do not attract high investment costs. They obtain low output per hectare from their farms as a result of the heavy infestation of Striga on a large proportion of their land and the low adoption rate of improved management practices. Most maize farmers used local varieties of maize for their production which is one of the contributing factors to susceptibility and loss to Striga. Hence for sustainable management of Striga, improved land management practices and use of improved seed varieties are some of the key measures that may help to reduce the high level of Striga prevalence among the sampled respondents.
The aim of this study was to produce information necessary for the detection of important constraints to IR maize technology adoption and assess the extent of use of IR maize and other Striga control technologies. Structured questionnaires were used for data collection. Data were collected in 12 districts, 32 villages, and 1198 households using a multi-stage random sampling strategy. A random sample of 100 farm households was
The proportion of male-headed households was lower among the respondents in Nyanza than Western. Out-migration and other incidences like HIV/AIDs prevalent in Nyanza may be some of the contributory factors to the presence of more female-headed households. Since the social issues surrounding female and male-headed households may be not be the same, there is need to consider targeting strategies that ensure that both kinds of households embrace appropriate Striga management practices to ensure that its spread is contained within the communities.
Household land holdings were found to be small. Annual crops, especially maize, consumed the largest part of household land allocation. It was also found that there is a practice of land borrowing in Nyanza and more of land renting in Western. However, the big question remains on whether there is any connection between land borrowing and Striga spread!
Household members over 60 years of age are the ones working mostly full time on the farm. There is a need to develop targeted interventions so as to ensure that adoption of Striga control measures is sustainable. Some of the elderly farmers may not be able to undertake all the necessary Striga control operations. Targeting the youth too in the same breath with Striga-related messages will enhance the
Striga management to the households.
More women than men belong to and participate in the leadership of social groups. In addition most household members belong to women groups, development committees, and credit and savings groups.
approach that puts these community institutions at the fore of Striga management and this approach should
farmers good products that even enhance investments in Striga management technologies.
The main source of funding for farming among the households is proceeds from sale of farm produce which include maize. This means that with the reduction of produce occasioned by Striga infestation, the households will not have enough to sell and re-invest in farming operations. The interventions meant to enhance Striga management for enhanced maize output should therefore be linked to marketing interventions to ensure that the farmers get enough revenue from their produce for re-investment to sustain Striga management measures being adopted by the households.

33
The value of most productive assets including irrigation pumps, sprayers, work bulls, ox ploughs, ox carts, and donkeys is high in Nyanza. This could be linked to the demand for these assets in Nyanza. The average household land size is higher in Nyanza and this may increase demand for their use leading to a rise in value. This therefore calls for an intervention that encourages linkage of the service providers and the farmers to ensure that the households are able to obtain the key productive assets at a reasonable cost to enhance use in the management of Striga in their farms.
All key farming-related decisions in the households are made by both the household head and the spouse except the decision on the acreage of land to plant. Since most productive activities on the farm are performed by various members of the households, should the head of the household fail to make the right decision then such operations may suffer. For example, the household-head’s decisions that allocate an uneconomical size of land for the production of maize may lead to the household obtaining negative returns. There is need therefore for interventions to support decision making on the acreage of land to plant in the family.
Input use levels vary among the households. Since input use and management greatly determines the level of output that can be obtained, there is a need to come up with interventions that support collaboration between the public extension systems and other service providers to ensure that the farmers can afford inputs and use them well both for the management of weeds, including Striga, and improved productivity.
Striga is ranked as the number one production constraint among the households. This provides an
to the problem. Since Striga transcends household boundaries, the approach used should target working with households at the group and community level.
The level of investment in maize production is determined by the type of variety being grown by the farmer and whether intercropped. As this is very important, there is need to come up with intervention strategies that support the farmers in their production management practices to ensure that the level of investment is good enough to allow for effective management of the weed and enhanced output.
only get 3 bags before, in Bondo District.

34
Most household farm produce ends up in the local market in the hands of local consumers and traders where the produce prices are low and the returns obtained by farmers not likely to spur re-investment in maize production and production management including Striga control. Interventions that enhance economies of scale and market linkages are suitable and will ensure that the farmers are able to target rewarding markets.
References Khan, Z.R., J.A. Pickett, L.J. Wadhams, A. Hassanali, and C.A.O. Midega. 2006. Combined control of Striga hermonthica
and stemborers by maize-Desmodium spp. intercrops. Crop Protection 25: 989–995. http://dx.doi.org/10.1016/j.cropro.2006.01.008
Godwin, A.A, and F.D. Raoul. 2008. Evaluating the constraints and opportunities of maize production in the west region of cameroon for sustainable development. Journal of Sustainable Development in Africa 13(4).
Government of Kenya. Census report 2009. Government Printer.Manyong, V.M. S.J. Nindi, A.D. Alene, G.D. Odhiambo, G. Omanya, H.D. Mignouna, and M. Bokanga. 2008. Farmer
perceptions of imazapyr-resistant (IR) maize technology on the control of Striga in western Kenya: An agricultural collaborative study on Striga control by the African Agricultural Technology Foundation and the International Institute of Tropical Agriculture. Nairobi, Kenya: African Agricultural Technology Foundation.