constitutive model of thin metal sheet in bulging test
TRANSCRIPT

415
ISSN 1392–1320 MATERIALS SCIENCE (MEDŽIAGOTYRA). Vol. 26, No. 4. 2020
Constitutive Model of Thin Metal Sheet in Bulging Test Considering Strain
Gradient Hardening
Wei LIANG 1 , Tieping WEI 2, Xiaoxiang YANG 1
1 School of Mechanical Engineering and Automation, Fuzhou University, No. 2, North Wulong River Avenue, Minhou
District, Fuzhou 350108, Fujian, China P.R. 2 Department of Mechanical and Automotive Engineering, Fujian University of Technology, No. 3, South Xuefu Road,
Minhou District, Fuzhou 350108, Fujian, China P.R.
http://dx.doi.org/10.5755/j01.ms.26.4.22201
Received 05 December 2018; accepted 01 March 2019
The study of the size effect was one of the most important subjects in the field of micro-forming. To investigate the stress
of the thin sheet in the bulging test with the second order size effect, a constitutive equation considering the strain gradient
hardening was proposed. Based on the equation, the stress of the thin sheet during the bulging test was calculated by the
finite element method. The bulging tests with various thicknesses of brass sheets and radiuses of punching balls were
performed to verify the proposed equation. The results showed that the constitutive equation could capture the stress
variations, while the simulation using the constitutive equation from the conventional theory of plasticity showed the
results with large deviation from those of the experiment. It was found that the stress was sensitive to the thickness of the
sheet and the radius of the punching ball in bulging test of thin brass sheet. The bulging of the thin brass sheet with a
thickness below ten times of its material intrinsic length would cause the generation of the geometrically necessary
dislocations, which induced the strain gradient hardening. Besides that, the decrement of the punching ball radius would
also increase the inhomogeneous deformation and enhance the strain gradient hardening during the thin sheet bulging
process. The strain gradient hardening during the thin sheet bulging test was related to the strain of the sheet. The hardening
effect of the strain gradient was obvious when the strain was small. The strain gradient hardening should be considered in
the thin sheet bulging test with the second order size effect.
Keywords: size effect, constitutive, thin sheet, strain gradient, bulge.
1. INTRODUCTION
Thin metal sheet micro-forming process, well-known
for their process simplicity, high production rate, minimized
material waste, near-net-shapes, excellent mechanical
properties [1, 2], and close tolerances [3], are claimed to be
the most suitable process to fabricate micro-parts in the
fields of electronics [4], medical devices, Micro Electro
Mechanical Systems (MEMS) [5], and Micro System
Technology (MST) [6 – 10]. However, there are challenges
in the thin metal sheet forming process when the sheet
thickness is decreased to the level of micrometres, because
of the unknown deformation mechanics and material
behaviour which called the “second order size effect”
[11 – 15].
Many researchers have been carried out to investigate
the “second order size effect” on the material strength. An
increase in the flow stress was observed as N, which was the
ratio of the sheet thickness to the material grain size,
decreased, especially when N was in the range from 1 to 4.
For instance, a micro hydraulic bulging testing of the thin
CuZn36 sheet by [16] found that flow stress increased as N
value decreased from 5 to 3.3. In the bending testing of
CuZn15 by [17] and aluminium 99.0 % ~ 99. 5 % by [18],
the phenomena of increase of the flow stress were also
observed as N was reduced to near 1 (single crystal
deformation). A series of hydraulic bulging testing of thin
Corresponding author. Tel.: +86-15005966988; fax: +86-0591-
83753562. E-mail address: [email protected] (W. Liang)
metal sheets with thicknesses in the range from 25 μm to
500 μm were carried out by [19]. The results showed that
the flow stress curves were absolutely different from those
obtained from the single direction tensile testing when the
thickness was less than 50 μm.
U. Engle [9] reported that the mechanical behaviour
was characterized by only a few grains located in the
deformed area at micro-scale; thus, the material cannot be
considered as a homogeneous continuum. The deformation
behaviour of each grain plays a significant role in the entire
deformation behaviour of the deformation body. So the
“surface model” [20] and “modify Hall-Petch model” [21]
cannot explain the special phenomenon of the second order
size effect any more.
The theory of Statistically Stored Dislocations (SSD)
and Geometrically Necessary Dislocations (GND) was
introduced by Ashby [22,23] and developed further by Fleck
[24,25] and Hutchinson [26,27,28,29,30,31,32] which
suggested that strengthening is associated with the first
order gradient in plastic strain. The theory was a non-linear
generalisation of Cosserat couple stress theory. Tension and
torsion experiments on thin copper wires confirm the
presence of strain gradient hardening (SGH).
Based on the theory of the Fleck and Hutchinson,
S.H. Chen, and T.C. Wang [33 – 38] proposed a new
hardening law for strain gradient plasticity. The strain
gradient plasticity was represented as an internal variable to

416
increase the tangent modulus. The new hardening law was
demonstrated by two experimental tests i.e. thin wire torsion
and ultra-thin beam bending tests. The present theoretical
results agree well with the experiment results, even when
the diameter of the wire decreased to 12 μm.
So the theory of the strain gradient is a possible tool to
capture the deformation mechanics and material behaviour
influenced by the second order size effect. A constitutive
model, taking into accounts both plastic strain and plastic
strain gradient hardening (SGH), was developed by Li et al
[39] and verified by the experiments of spring back
behaviour of pure aluminium foils with thickness from
25 μm to 500 μm very well.
Lee et al [40] found the strain gradient, which was the
second derivative of displacement, played a very important
role in the thin metal forming when the thickness was only
several micrometres. Based on the non-homogeneity
characteristics of the polycrystalline metallic materials, a
modified model was proposed. And it also could capture the
experiments phenomena much well [41].
In the present paper, a constitute equation, which
considers the plastic strain and plastic SGH, is suggested
and used to predict the stress of the thin sheet in the bulge
processing. Series of the bulge experiments and finite
element analysis were carried out to verify the proposed
equation.
2. CONSTITUTIVE EQUATION MODEL
2.1. Constitutive equation
In the study of Ashby and Fleck [24, 26, 28, 31, 32], it
is supported that dislocation was generated, moved, and
stored when a plastic crystal was deformed. The storage
caused the material to work harden. Dislocations became
stored for two reasons: they accumulated by trapping each
other in a random way or they were required for compatible
deformation of various parts of the crystal. The dislocations
which trap each other randomly were referred to as SSD, s,
which was estimated as a function of stain. The gradient of
plastic shear resulted in the storage of GNS, s. Plastic strain
gradients appeared either because of the geometry of
loading or because the material itself was plastically
inhomogeneous. The GNS was evaluated by the strain
gradient.
In conventional plasticity theory, there is no length
scale considered in the constitutive law and no size effect is
predicted. The index hardening model is expressed as the
following equation,
e e
nK , (1)
where e is the flow stress; K is strength coefficient; e is
effective strain; n is the hardening index.
However, when the length scale associated with the
deformation field is small compared to a material length
scale, for most materials at the level of micrometres, it
becomes necessary to include the strain gradient term in the
constitutive equation [26]. The constitutive model is
proposed as
2 22
e e 2
e
1n lK
, (2)
where l is the material intrinsic length; is a geometrical
parameter, which is relative to the size of specimen; is the
effective strain gradient. It is defined as [26]
1 22
1 1 21
e
CS
ijk ijk
l
l
, (3)
where l1 is the internal material intrinsic length for stretch
gradient, l1 = 1/10l [26]; lcs is the internal material intrinsic
length for rotation gradient, lcs = l [42].
In Ref. [26], Fleck and Hutchinson denotes ijk as the
second gradient of displacement, ui,
, , , 1, , 2,3ijk k ij iu j k ; (4)
and
11 5s s s s
ijk ijk ij kpp kj ipp ik jpp is the first
deviatoric invariant of the second gradient of displacement,
where
1 3s
ijk ijk kij jki ,
1 4ijk ijk ik jpp jk ipp , y is Kronecker delta. The
effective rotation strain gradient, e, is the deformation
curvature.
e 2 3 ij ij , in which ij is the rotation strain gradient.
It can be calculated by
ij its jtse , (5)
where eitc is the permutation tensor.
2.2. Constitutive equation of bulge model
Fig. 1 shows the model of hydraulic bulging testing. In
[43], one element in the specimen is selected. The length
and thickness of the element, before being bulged, are d
and dr , respectively. u is the displacement of the element.
In the coordinate system , , r , the longitudinal strain
and the hoop strain are expressed as follows
dln
d d cosu
; (6)
lnu
, (7)
where d and d r are the length and thickness of the
bulged element, respectively; is the distance between the
axis and the element.
Φ
ρ dρ
rθ
Rρ0 ρ dρ
Fig. 1. Model of hydraulic Bulging test

417
To determine the stress vs. strain curve, two
assumptions are made as: (a) Volume is constant; (b) A
hemisphere is formed during bulging. Under these two
assumptions, a bulged sheet experiences equivalent biaxial
strain at the polar of the dome. The strains could be
calculated by the following equations:
; (8)
2 2r , (9)
where r is the strain in the r direction.
dln ln
d d cosu u
. (10)
Substituting sinr and d cos dr into Eq. (10),
d
cos 1d sin
u ur
. (11)
The displacement u is obtained from Eq. 11:
sin
cos1 cos
u r c
, (12)
where c is a constant.
The boundary condition on the clamped edge is 0u ,
when 0 and r R , so the constant
0cosc R , in
which R is the radius of the specimen on the neutral
surface.
0
sincos cos
1 cosu r R
. (13)
Substituting Eq. 13 into Eq. 7:
0
1 cosln ln
cos
r
u r R
. (14)
The longitudinal strain and the hoop strain could be
simplified as
0
1 cosln
cos
r
r R
. (15)
Substituting Eq. 15 into Eq. 9:
0
1 cos2 2ln
cosr
r
r R
. (16)
Defining the coordinate system , , r as coordinate
system (1, 2, 3), one can obtain
0 0
0 0
0 0 2
ij
A
A
A
, (17)
where 0ln 1 cos cosA r r R .
The effective strain is
e
0
1 cos2ln
cos
r
r R
. (18)
From Eq. 4, the calculation results of the strain gradient
ijk is
0 0 0 0 0 2
0 0 0 0 0 0 0
0 2 0 0 0 0 2
ijk
C C B C
C B
B C B B
, (19)
where 0 0cos cosB R r r R , sin 1 cosC .
The first deviatoric invariant of the strain gradient 1
ijk is:
1
4 4 3 4 70 0 0 0
5 5 5 5 5
3 3 4 40 0 0 0 0
5 5 5 5
4 7 4 7 80 0 0 0
5 5 5 5 5
ijk
C B C B C
C C B B
B C B C B
. (20)
The rotational strain gradient ij is computed by
Eq. 5, and one can get
10 0
2
10
2
10 0
2
ij
B
B C
C
. (21)
The effective rotational strain gradient, e , is
2 2
e
2 5 1
3 6 3ij ij C B . (22)
The effective strain gradient, , is
1 22
1 1 21e
CS
1 22
2 2 2 21
CS
38 32 5 1
5 5 6 3
ijk ijk
l
l
lC B C B
l
. (23)
In the Bulging test, the geometrical parameter
02S t , where 0S is the area of the specimen before
being bulged, 2
0 0S ; t is the thickness of the
specimen before being bulged. Substituting Eq. 23 into
Eq. 2, the constitutive relation used in the analytical model
is obtained as
2 2 2 2 2 2
2 1 CS
0e e 2
e
38 32 5 1
2 5 5 6 31n
l C B l C B
Kt
. (24)
3. BULGING TEST
To verify the constitute equation proposed in the former
section, a series of bulging testing were conducted to
investigate the effects of the sheet thickness and bulging
radius on the material flow stress.
3.1. Experimental setup
Fig. 2 shows the experimental setup of the bulging test.
The circle sample of the thin brass (35 % Zn) sheet was
located on the cavity mould and fixed by a blank holder. The

418
punching ball was assembled under a force transducer, and
then assembled totally to the middle beam of a CMT4104
type high precision material testing machine. The middle
beam was driven by the screw rod of the machine and
controlled by a computer. It pushed the punching ball to
bulge the brass sheet sample until the crack happened on the
surface of the sheet. During the bulging testing process, the
displacement of the middle beam and the force measured by
the force transducer were taken down ten times every
second.
a
Specimen
Punch ball
ψ
t
Blank holder
Cavity mold
b
Fig. 2. Bulging test setup: a – experiment setup; b – bulging model
The accuracy of the force transducer was verified as
0.5 %. And the resolution of the displacement measuring
device was 0.3 m. The specifications of them were high
enough to perform the test.
To investigating the size effect in Bulging test, as shown
in Table 1, thin brass sheets with four different thicknesses
were bulged by the four punching balls of different radiuses.
Table 1. The Bulging test parameters for the thin brass sheet
ψ=15 mm ψ=5 mm ψ=2.5 mm ψ=1.5 mm
t=300 m √ - - -
t=100 m √ √ - -
t=50 m √ √ √ -
t=30 m √ √ √ √
Note: t indicates the thickness of the brass sheet; ψ indicates the
radius of the punching ball.
3.2. Material preparation
Before being cut into the circle specimen, the brass
sheets of the four different thicknesses were annealed at the
same 550 ℃ for 120 minutes in the Nitrogen atmosphere in
order to eliminate the effects of rolling texture and residual
stress. The heat-treated brass sheets were made into two
types of metallographic specimens. One was prepared to
observe the grain distributed on the section (see Fig. 3),
while another one was for that on the plate (see Fig. 4). From
the cross-section of the samples, as shown in Fig. 3, the
average size of them was about were about (20 ~ 25) μm.
There were only 1 to 2 grains on the cross of the 30 μm
sheet, and 2 to 3 grains on that of the 50 μm sheet. The size
of the grain from the view on the plate, as shown in Fig. 4,
was about (25 ~ 30) μm.
a b
Fig. 3. The metallograph of the annealed brass sheet with various
thicknesses, on the cross section: a – 30 m; b – 50m
a b
c d
Fig. 4. Metallograph of the annealed brass sheet with various
thicknesses, on the plate: a – . 30 m; b – 50 m; c – 100
m; d – 300 m
3.3. Data processing
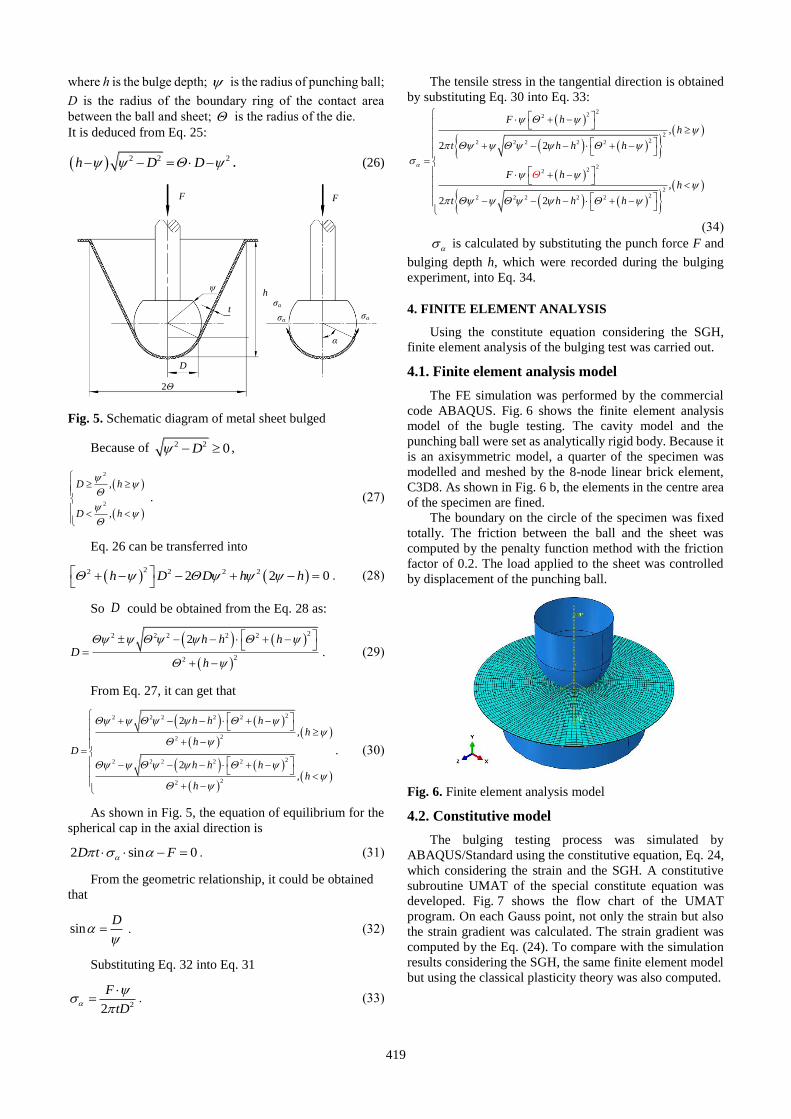
Fig. 5 shows the deformed sample being bulged by the
punching ball. From the figure, the geometric relationship is
obtained,
2 2 2 2h D D D D , (25)
419
where h is the bulge depth; is the radius of punching ball;
D is the radius of the boundary ring of the contact area
between the ball and sheet; is the radius of the die.
It is deduced from Eq. 25:
2 2 2h D D . (26)
F F
σασα
α
hσα
ψ
t
D
2Θ
Fig. 5. Schematic diagram of metal sheet bulged
Because of 2 2 0D ,
2
2
,
,
D h
D h
. (27)
Eq. 26 can be transferred into
22 2 2 22 2 0h D D h h
. (28)
So D could be obtained from the Eq. 28 as:
22 2 2 2 2
22
2 h h hD
h
. (29)
From Eq. 27, it can get that
22 2 2 2 2
22
22 2 2 2 2
22
2,
2,
h h hh
hD
h h hh
h
. (30)
As shown in Fig. 5, the equation of equilibrium for the
spherical cap in the axial direction is
2 sin 0D t F . (31)
From the geometric relationship, it could be obtained
that
sinD
. (32)
Substituting Eq. 32 into Eq. 31
22
F
tD
. (33)
The tensile stress in the tangential direction is obtained
by substituting Eq. 30 into Eq. 33:
222
222 2 2 2 2
222
222 2 2 2 2
,
2 2
,
2 2
F hh
t h h h
F hh
t h h h
(34)
is calculated by substituting the punch force F and
bulging depth h, which were recorded during the bulging
experiment, into Eq. 34.
4. FINITE ELEMENT ANALYSIS
Using the constitute equation considering the SGH,
finite element analysis of the bulging test was carried out.
4.1. Finite element analysis model
The FE simulation was performed by the commercial
code ABAQUS. Fig. 6 shows the finite element analysis
model of the bugle testing. The cavity model and the
punching ball were set as analytically rigid body. Because it
is an axisymmetric model, a quarter of the specimen was
modelled and meshed by the 8-node linear brick element,
C3D8. As shown in Fig. 6 b, the elements in the centre area
of the specimen are fined.
The boundary on the circle of the specimen was fixed
totally. The friction between the ball and the sheet was
computed by the penalty function method with the friction
factor of 0.2. The load applied to the sheet was controlled
by displacement of the punching ball.
Fig. 6. Finite element analysis model
4.2. Constitutive model
The bulging testing process was simulated by
ABAQUS/Standard using the constitutive equation, Eq. 24,
which considering the strain and the SGH. A constitutive
subroutine UMAT of the special constitute equation was
developed. Fig. 7 shows the flow chart of the UMAT
program. On each Gauss point, not only the strain but also
the strain gradient was calculated. The strain gradient was
computed by the Eq. (24). To compare with the simulation
results considering the SGH, the same finite element model
but using the classical plasticity theory was also computed.

420
In the former study [44], uniaxial tension of the same
brass thin sheet had been carried out. K and n were
chosen as 811 MPa and 0.34, respectively.
Fig. 7. Flow chart of the UMAT program
5. RESULTS AND DISCUSSION
The bulged samples were shown in Fig. 8. The punch
force F and bulging depth h recorded during the bulging
testing were substituted into Eq. 34 to calculate the
tangential-direction tensile stress , as shown in Fig. 5.
Fig. 8. Bulged samples of brass sheet with different
thicknesses and bulge radiuses
5.1. Effects of strain on the tangential-direction
tensile stress
Fig. 9 shows the experimental results of the tangential-
direction tensile stress, , of the four specimens with the
same ratio of the sheet thickness to punching ball radius.
The ratio indicated the size characteristic of the bulging
testing. Table 2 lists the detail data in Fig. 9 a. It was
obviously that decreased with the increment of the ratio
of bulging depth to the punching ball radius, h , which
represented the bulging processing and was related to the
deformation of the thin sheet. This argument could be
reinforced by the observed phenomenon in the reported
literature that the flow stress decreased with the increment
of strain [19].
However, according to the classical plasticity theory,
the strain and stress would increase with the thin sheet was
bulged more and more deeply, as the FEA results shown in
Fig. 9.
0.0 0.2 0.4 0.6 0.8 1.0
0
300
600
900
1200
1500
1800
,
MP
a
h/
Exp.
Cla.
SGH
0.0
0.2
0.4
0.6
0.8
1.0
1.2
Stain
a
0.0 0.2 0.4 0.6 0.8
0
300
600
900
1200
1500
1800
,
MP
a
h/Ψ
Exp.
Cla.
SGH
0.0
0.4
0.8
1.2
1.6
Stain
b
0.0 0.2 0.4 0.6 0.8 1.0
0
300
600
900
1200
1500
1800
,
MP
a
h/Ψ
Exp.
Cla.
SGH
0.0
0.2
0.4
0.6
0.8
1.0
1.2
Stain
c
0.0 0.2 0.4 0.6 0.8
0
300
600
900
1200
1500
1800
,
MP
a
h/Ψ
Exp.
Cla.
SGH
0.0
0.2
0.4
0.6
0.8
1.0
1.2
Stain
d
Fig. 9. Comparison of the stresses from the experiment (Exp.) with
the simulation based on the strain gradient hardening
(SGH) and classical plasticity theory (Cla.), for various
thicknesses and punching ball radius: a – t=300 m,
Ψ = 15 mm; b – t = 100 m, Ψ = 5 mm; c – t=50 m,
Ψ = 2.5 mm; d – t=30 m, Ψ=1.5 mm

421
It seems that the classical plasticity was invalid any
more. The SGH played an important role in the Bulging test.
Based on the proposed constitute equation, into which the
SGH factor, 2 2 2 2
e2 D l t , was introduced, the
FEA results of agreed with those from the experiment.
The trend of stress could be captured.
The deviation of the stresses, got from the classical
plasticity theory and the developed SGH law, became
smaller and smaller as the strain increased. It was indicated
that the function of the SGH was dependent on the strain.
However, the relationship would be weaker with the
increment of the strain. It also could be inferred from the
SGH factor that the effect would diminish with the strain the
continuous increment of strain.
Table 2. Comparison of the stresses from the experiment (Exp.)
with the simulation based on the strain gradient
hardening (SGH) and classical plasticity theory (Cla.),
for various thicknesses and punching ball radius
h/Ψ Stain Stress
(Cla.)
Stress
(SGH)
h/Ψ
Stress
(Exp.)
0.1 0.002 156.0 1028.9 0.07 999.0
0.2 0.018 206.0 999.0 0.13 980.0
0.3 0.035 265.0 934.1 0.20 960.0
0.4 0.060 358.0 833.0 0.27 935.8
0.5 0.098 389.0 820.2 0.33 870.7
0.6 0.144 429.0 726.7 0.40 813.1
0.7 0.170 466.0 678.3 0.47 768.4
0.8 0.250 492.0 675.7 0.53 733.3
0.9 0.400 502.0 656.1 0.60 704.4
1.0 0.560 513.0 619.8 0.67 681.5
0.73 664.5
0.80 650.8
0.87 641.0
0.93 632.9
1.00 626.7
5.2. Effects of the sheet thickness on the tangential-
direction tensile stress
The experiment results of the thin sheets of different
thicknesses bulged by the punching balls with radiuses of
15 mm and 5 mm were shown in Fig. 10 and Fig. 11,
respectively.
It can be seen from Fig. 10 a and Fig. 10 b that the
tangential stress decreased as the thickness of the thin plate
reduced from 300 μm to 100 μm. In the study of [45], the
size effect was classified into first order and second order
based on the thickness of the thin plate. The transforming
thickness was about 10 l, in which l is the material intrinsic
length [28, 42]. The transforming thickness of the brass was
about 60 μm because its material intrinsic length was 6 μm
[32, 46]. When the thickness was larger than 60 μm, the
flow stress decreased during the decrement of the thickness.
This phenomenon of stress reduction was called the first
order size effect [47].
0.0 0.2 0.4 0.6 0.8 1.0
0
200
400
600
800
1000
1200
,
MP
a
h/Ψ
Exp.
SGH
a
0.0 0.2 0.4 0.6 0.8 1.0
0
200
400
600
800
1000
1200
,
MP
a h/Ψ
Exp.
SGH
b
0.0 0.2 0.4 0.6 0.8 1.0
0
200
400
600
800
1000
1200
,
MP
a
h/Ψ
Exp.
SGH
c
0.0 0.2 0.4 0.6 0.8 1.0
0
200
400
600
800
1000
1200
,
MP
a
h/Ψ
Exp.
SGH
d
Fig. 10. Comparison of the stresses from the experiment (Exp.)
with the simulation based on the strain gradient hardening
(SGH), for various sheet-thicknesses and Ψ = 15 mm:
a – t = 300 m; b – t= 100 m; c – t = 50 m;
d – t = 30 m
422
0.0 0.2 0.4 0.6 0.8
0
400
800
1200
1600
2000
,
MP
a
h/Ψ
Exp.
SGH
a
0.0 0.2 0.4 0.6 0.8
0
400
800
1200
1600
2000
,
MP
a
h/Ψ
Exp.
SGH
b
0.0 0.2 0.4 0.6 0.8
0
400
800
1200
1600
2000
,
MP
a
h/Ψ
Exp.
SGH
c
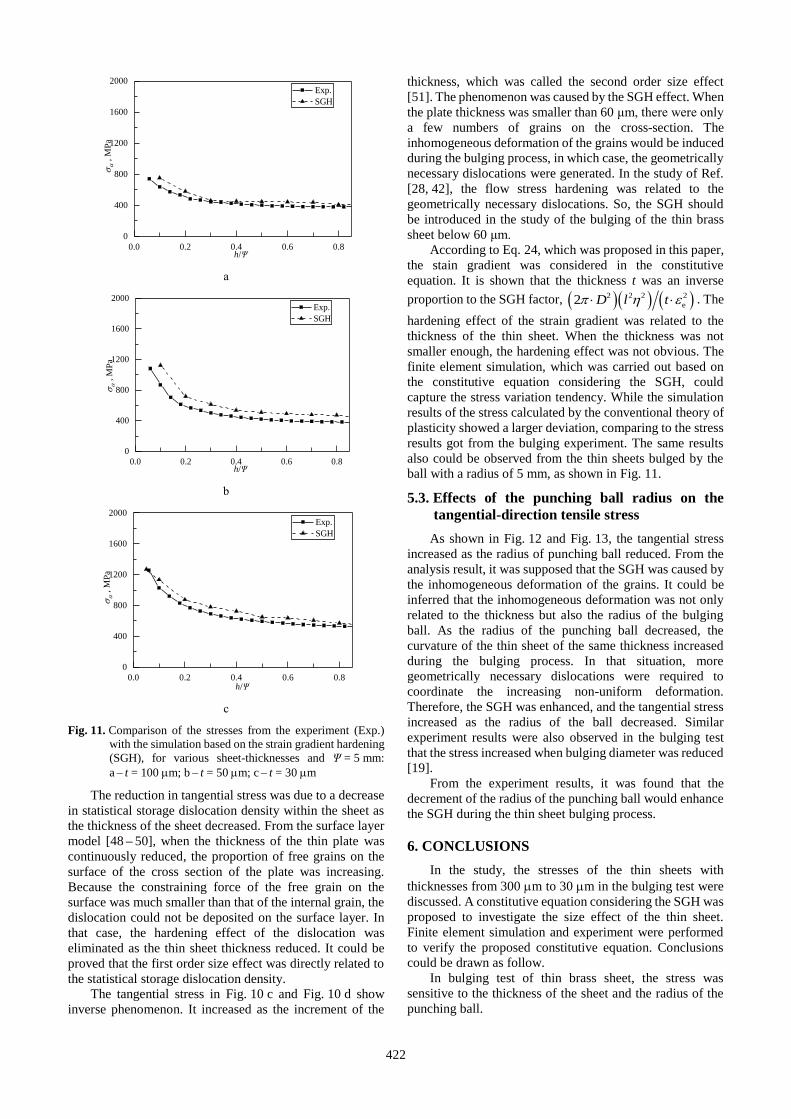
Fig. 11. Comparison of the stresses from the experiment (Exp.)
with the simulation based on the strain gradient hardening
(SGH), for various sheet-thicknesses and Ψ = 5 mm:
a – t = 100 m; b – t = 50 m; c – t = 30 m
The reduction in tangential stress was due to a decrease
in statistical storage dislocation density within the sheet as
the thickness of the sheet decreased. From the surface layer
model [48 – 50], when the thickness of the thin plate was
continuously reduced, the proportion of free grains on the
surface of the cross section of the plate was increasing.
Because the constraining force of the free grain on the
surface was much smaller than that of the internal grain, the
dislocation could not be deposited on the surface layer. In
that case, the hardening effect of the dislocation was
eliminated as the thin sheet thickness reduced. It could be
proved that the first order size effect was directly related to
the statistical storage dislocation density.
The tangential stress in Fig. 10 c and Fig. 10 d show
inverse phenomenon. It increased as the increment of the
thickness, which was called the second order size effect
[51]. The phenomenon was caused by the SGH effect. When
the plate thickness was smaller than 60 μm, there were only
a few numbers of grains on the cross-section. The
inhomogeneous deformation of the grains would be induced
during the bulging process, in which case, the geometrically
necessary dislocations were generated. In the study of Ref.
[28, 42], the flow stress hardening was related to the
geometrically necessary dislocations. So, the SGH should
be introduced in the study of the bulging of the thin brass
sheet below 60 μm.
According to Eq. 24, which was proposed in this paper,
the stain gradient was considered in the constitutive
equation. It is shown that the thickness t was an inverse
proportion to the SGH factor, 2 2 2 2
e2 D l t . The
hardening effect of the strain gradient was related to the
thickness of the thin sheet. When the thickness was not
smaller enough, the hardening effect was not obvious. The
finite element simulation, which was carried out based on
the constitutive equation considering the SGH, could
capture the stress variation tendency. While the simulation
results of the stress calculated by the conventional theory of
plasticity showed a larger deviation, comparing to the stress
results got from the bulging experiment. The same results
also could be observed from the thin sheets bulged by the
ball with a radius of 5 mm, as shown in Fig. 11.
5.3. Effects of the punching ball radius on the
tangential-direction tensile stress
As shown in Fig. 12 and Fig. 13, the tangential stress
increased as the radius of punching ball reduced. From the
analysis result, it was supposed that the SGH was caused by
the inhomogeneous deformation of the grains. It could be
inferred that the inhomogeneous deformation was not only
related to the thickness but also the radius of the bulging
ball. As the radius of the punching ball decreased, the
curvature of the thin sheet of the same thickness increased
during the bulging process. In that situation, more
geometrically necessary dislocations were required to
coordinate the increasing non-uniform deformation.
Therefore, the SGH was enhanced, and the tangential stress
increased as the radius of the ball decreased. Similar
experiment results were also observed in the bulging test
that the stress increased when bulging diameter was reduced
[19].
From the experiment results, it was found that the
decrement of the radius of the punching ball would enhance
the SGH during the thin sheet bulging process.
6. CONCLUSIONS
In the study, the stresses of the thin sheets with
thicknesses from 300 m to 30 m in the bulging test were
discussed. A constitutive equation considering the SGH was
proposed to investigate the size effect of the thin sheet.
Finite element simulation and experiment were performed
to verify the proposed constitutive equation. Conclusions
could be drawn as follow.
In bulging test of thin brass sheet, the stress was
sensitive to the thickness of the sheet and the radius of the
punching ball.

423
0.0 0.2 0.4 0.6 0.8
0
400
800
1200
1600
2000
,
MP
a
h/Ψ
Exp.
SGH
a
0.0 0.2 0.4 0.6 0.8
0
400
800
1200
1600
2000
,
MP
a
h/Ψ
Exp.
SGH
b
0.0 0.2 0.4 0.6 0.8
0
400
800
1200
1600
2000
,
MP
a
h/Ψ
Exp.
SGH
c
0.0 0.2 0.4 0.6 0.8
0
400
800
1200
1600
2000
,
MP
a
h/Ψ
Exp.
SGH
d
Fig. 12. Comparison of the stresses from the experiment (Exp.)
with the simulation based on the strain gradient hardening
(SGH), for various radiuses of punching ball and
t = 30 m: a – Ψ = 15 mm; b – Ψ = 5 mm; c – Ψ = 2.5 mm;
d – Ψ = 1.5 mm
0.0 0.2 0.4 0.6 0.8 1.0
0
400
800
1200
1600
,
MP
a
h/Ψ
Exp.
SGH
(a)
0.0 0.2 0.4 0.6 0.8 1.0
0
400
800
1200
1600
,
MP
a h/Ψ
Exp.
SGH
(b)
0.0 0.2 0.4 0.6 0.8 1.0
0
400
800
1200
1600
,
MP
a
h/Ψ
Exp.
SGH
(c)
Fig. 13. Comparison of the stresses from the experiment (Exp.)
with the simulation based on the strain gradient hardening
(SGH), for various radiuses of punching ball and
t = 50 m: a – Ψ = 15 mm; b – Ψ = 5 mm; c – Ψ = 2.5 mm
When the thickness reduced to the level of 10 times of
the material intrinsic length, the inhomogeneous
deformation of the grains would cause the generation of the
geometrically necessary dislocations, which induced the
SGH during the bulging test. Besides that, the decrement of
the punching ball radius would also increase the
inhomogeneous deformation and enhance the SGH during
the thin sheet bulging process.
The SGH during the thin sheet bulging test was related
to the strain of the sheet. The hardening effect of the strain
gradient was obvious when the strain was small. The
constitutive equation which was used in the calculation of
the stress in the simulation could capture the stress
variations. While the results of the simulation based on the
conventional theory of plasticity showed a large deviation
from the experiment results.

424
The SGH should be considered in the thin sheet bulging
test with the second order size effect.
REFERENCES
1. Ma, Z., Cao, Z., Lu, J., Li, H., Zhang, Y., Liu, W., Yin, Z.
Material Flow Behavior Modeling with Consideration of Size
Effects Rare Metals 37 (11) 2018: pp. 995 – 1002.
http://dx.doi.org/10.1007/s12598-018-1156-1.
2. Yin, P., Zhang, S., Qi, Y., Xin, J. Quantization and Training
of Low Bit-Width Convolutional Neural Networks for Object
Detection Journal of Computational Mathematics 37 (3)
2019: pp. 349 – 360.
http://dx.doi.org/10.4208/jcm.1803-m2017-0301.
3. Sahu, J., Chakrabarty, S., Raghavan, R., Mishra, S.
Investigations of Size Effect on Formability and
Microstructure Evolution in Ss304 Thin Foils Journal of
Strain Analysis for Engineering Design 53 (7)
2018: pp. 517 – 528.
http://dx.doi.org/10.1177/0309324718792443.
4. Wang, H., Rui, H., Zhang, S. An Optimal-Order Error
Estimate for the Mass-Conservative Characteristic Finite
Element Scheme Applied Mathematics and Computation
218 (20) 2012: pp. 10271 – 10278.
http://dx.doi.org/10.1016/j.amc.2012.04.004.
5. Zhang, S., Yin, P., Xin, J. Transformed Schatten-1 Iterative
Thresholding Algorithms for Low Rank Matrix Completion
Communications in Mathematical Sciences 15 (3)
2017: pp. 839 – 862.
http://dx.doi.org/10.4310/CMS.2017.v15.n3.a12.
6. Engel, U., Eckstein, R. Microforming — From Basic
Research to its Realization Journal of Materials Processing
Technology 125 – 126 2002: pp. 35 – 44.
http://dx.doi.org/10.1016/S0924-0136(02)00415-6.
7. Fu, M., Chan, W. A Review On the State-of-the-Art
Microforming Technologies International Journal of
Advanced Manufacturing Technology 2013: pp. 2411 –2437.
http://dx.doi.org/10.1007/s00170-012-4661-7.
8. Vollertsen, F., Niehoff, H., Hu, Z., Theiler, C. State of the
Art in Micro Forming and Investigations Into Micro Deep
Drawing Journal of Materials Processing Technology
2004: pp. 70 – 79.
http://dx.doi.org/10.1016/j.jmatprotec.2004.04.266
9. Engel, U., Egerer, E. Basic Research On Cold and Warm
Forging of Microparts Key Engineering Materials 233 – 236
2003: pp. 449 – 456.
http://dx.doi.org/10.4028/www.scientific.net/KEM.233-
236.449.
10. Chen, W., Kitamura, T., Wang, X., Feng, M. Size Effect on
Cyclic Torsion of Micro-Polycrystalline Copper Considering
Geometrically Necessary Dislocation and Strain Gradient
International Journal of Fatigue 117 2018: pp. 292 – 298.
http://dx.doi.org/10.1016/j.ijfatigue.2018.08.027.
11. Zhang, K.F., Kun, L. Classification of Size Effects and
Similarity Evaluating Method in Micro Forming Journal of
Materials Processing Technology 209 (11)
2009: pp. 4949 – 4953.
http://dx.doi.org/10.1016/j.jmatprotec.2008.11.018
12. Tamai, Y., Inazumi, T., Manabe, K. Fe Forming Analysis
with Nonlinear Friction Coefficient Model Considering
Contact Pressure, Sliding Velocity and Sliding Length
Journal of Materials Processing Technology 227
2016: pp. 161 – 168.
http://dx.doi.org/10.1016/j.jmatprotec.2015.08.023.
13. Tanaka, T., Hirata, T., Shinomiya, N., Shirakawa, N.
Analysis of Material Flow in the Sheet Forming of Friction-
Stir Welds On Alloys of Mild Steel and Aluminum Journal
of Materials Processing Technology 226
2015: pp. 115 – 124.
http://dx.doi.org/10.1016/j.jmatprotec.2015.06.030.
14. Anand, D., Kumar, D.R. Effect of Thickness and Grain Size
On Flow Stress of Very Thin Brass Sheets Procedia
Materials Science 6 2014: pp. 154 – 160.
http://dx.doi.org/10.1016/j.mspro.2014.07.019.
15. Mahabunphachai, S., Ko, M. Investigation of Size Effects
On Material Behavior of Thin Sheet Metals Using Hydraulic
Bulge Testing at Micro/Meso-Scales International Journal
of Machine Tools and Manufacture 48 (9)
2008: pp. 1014 – 1029.
http://dx.doi.org/10.1016/j.ijmachtools.2008.01.006.
16. Michel, J.F., Picart, P. Size Effects On the Constitutive
Behaviour for Brass in Sheet Metal Forming Journal of
Materials Processing Technology 141 (3)
2003: pp. 439 – 446.
https://doi.org/10.1016/S0924-0136(03)00570-3
17. Kals, T.A., Eckstein, R. Miniaturization in Sheet Metal
Working Journal of Materials Processing Technology
103 (1) 2000: pp. 95 – 101.
http://dx.doi.org/10.1016/S0924-0136(00)00391-5
18. Raulea, L.V., Goijaerts, A.M., Govaert, L.E.,
Baaijens, F.P.T. Size Effects in the Processing of Thin Metal
Sheets Journal of Materials Processing Technology 115 (1)
2001: pp. 44 – 48.
http://dx.doi.org/10.1016/S0924-0136(01)00770-1.
19. Diehl, A., Staud, D., Engel, U. Investigation of the
Mechanical Behaviour of Thin Metal Sheets Using the
Hydraulic Bulge Test, in: 4th International Conference on
Multi-Material Micro Manufacture, Cardiff, Wales, UK,
2008: pp. 195 – 198.
20. Geiger, M., Vollertsen, F., Kals, R. Fundamentals On the
Manufacturing of Sheet Metal Microparts Cirp Annals
Manufacturing Technology 45 (1) 1996: pp. 277 – 282.
http://dx.doi.org/10.1016/s0007-8506(07)63063-7
21. Lederer, M., Gröger, V., Khatibi, G., Weiss, B. Size
Dependency of Mechanical Properties of High Purity
Aluminium Foils Materials Science and Engineering: A
527 (3) 2010: pp. 590 – 599. http://dx.doi.org/http://dx.doi.org/10.1016/j.msea.2009.08.016.
22. Ashby, M.F. The Deformation of Plastically Non-
Homogeneous Materials Philosophical Magazine 21
1970: pp. 399 – 424.
http://dx.doi.org/10.1080/14786437008238426.
23. Ashby, M. The Deformation of Plastically Non-
Homogeneous Materials Philosophical Magazine
2006: pp. 399 –424 .
http://dx.doi.org/10.1080/14786437008238426
24. Fleck, N.A., Muller, G.M., Ashby, M.F., Hutchinson, J.W.
Strain Gradient Plasticity: Theory and Experiment Acta
Metallurgica et Materialia 42 (2) 1994: pp. 475 – 487.
http://dx.doi.org/10.1016/0956-7151(94)90502-9
25. Fleck, N.A., Hutchinson, J.W. A Phenomenological Theory
for Strain Gradient Effects in Plasticity Journal of the
Mechanics and Physics of Solids 41 (12)
1993: pp. 1825 – 1857.
http://dx.doi.org/10.1016/0022-5096(93)90072-N
26. Fleck, N.A., Hutchinson, J.W. Strain Gradient Plasticity
Advances Applied Mechanics 33 1997: pp. 295 – 361.

425
27. Hutchinson, J.W. Plasticity at the Micron Scale
International Journal of Solids and Structures 37 (1)
2000: pp. 225 – 238.
http://dx.doi.org/10.1016/S0020-7683(99)00090-6
28. Fleck, N.A., Hutchinson, J.W. A Reformulation of Strain
Gradient Plasticity Journal of the Mechanics and Physics of
Solids 49 (10) 2001: pp. 2245 – 2271.
http://dx.doi.org/10.1016/s0022-5096(01)00049-7
29. Engelen, R.A.B., Fleck, N.A., Peerlings, R.H.J.,
Geers, M.G.D. An Evaluation of Higher-Order Plasticity
Theories for Predicting Size Effects and Localisation
International Journal of Solids and Structures 43 (7 – 8)
2006: pp. 1857 – 1877.
http://dx.doi.org/10.1016/j.ijsolstr.2004.05.072
30. Idiart, M.I., Deshpande, V.S., Fleck, N.A., Willis, J.R. Size
Effects in the Bending of Thin Foils International Journal of
Engineering Science 47 (11 – 12) 2009: pp. 1251 – 1264.
http://dx.doi.org/10.1016/j.ijengsci.2009.06.002
31. Fleck, N.A., Willis, J.R. A Mathematical Basis for Strain-
Gradient Plasticity Theory-Part I: Scalar Plastic Multiplier
Journal of the Mechanics and Physics of Solids 57 (1)
2009: pp. 161 – 177.
http://dx.doi.org/10.1016/j.jmps.2008.09.010
32. Fleck, N.A., Willis, J.R. A Mathematical Basis for Strain-
Gradient Plasticity Theory. Part II: Tensorial Plastic
Multiplier Journal of the Mechanics and Physics of Solids
57 (7) 2009: pp. 1045 – 1057.
http://dx.doi.org/10.1016/j.jmps.2009.03.007
33. Chen, S.H., Wang, T.C. A New Hardening Law for Strain
Gradient Plasticity Acta Materialia 48 (16)
2000: pp. 3997 – 4005.
http://dx.doi.org/10.1016/S1359-6454(00)00216-0.
34. Chen, S.H., Wang, T.C. New Hardening Law for Strain
Gradient Plasticity Acta Materialia 48 (16)
2000: pp. 3997 – 4005.
http://dx.doi.org/10.1016/s1359-6454(00)00216-0
35. Chen, S.H., Wang, T.C. Finite Element Solutions for Plane
Strain Mode I Crack with Strain Gradient Effects
International Journal of Solids and Structures 39 (5)
2002: pp. 1241 – 1257.
http://dx.doi.org/10.1016/S0020-7683(01)00233-5
36. Chen, S.H., Wang, T.C. Interface Crack Problems with
Strain Gradient Effects International Journal of Fracture
117 (1) 2002: pp. 25 – 37.
http://dx.doi.org/10.1023/A:1020904510702
37. Chen, S.H., Tao, C.J., Wang, T.C. A Study of Size-
Dependent Microindentation Acta Mechanica 167 (1 – 2)
2004: pp. 57 – 71.
http://dx.doi.org/10.1007/s00707-003-0064-z
38. Chen, S.H., Liu, L., Wang, T.C. Small Scale, Grain Size and
Substrate Effects in Nano-Indentation Experiment of Film-
Substrate Systems International Journal of Solids and
Structures 44 (13) 2007: pp. 4492 – 4504.
http://dx.doi.org/10.1016/j.ijsolstr.2006.11.033
39. Li, H., Dong, X., Shen, Y., Diehl, A., Hagenah, H.,
Engel, U., Merklein, M. Size Effect On Springback Behavior
Due to Plastic Strain Gradient Hardening in Microbending
Process of Pure Aluminum Foils Materials Science and
Engineering A 527 (16 – 17) 2010: pp. 4497 – 4504.
http://dx.doi.org/10.1016/j.msea.2010.03.105
40. Lee, H., Jung, B., Kim, D., Park, H. On the Size Effect for
Micro-Scale Structures Under the Plane Bulge Test Using the
Modified Strain Gradient Theory International Journal of
Precision Engineering and Manufacturing 12 (5)
2011: pp. 865 – 870.
http://dx.doi.org/10.1007/s12541-011-0115-7.
41. Xiang, Y., Vlassak, J.J. Bauschinger and Size Effects in
Thin-Film Plasticity Acta Materialia 54 (20)
2006: pp. 5449 – 5460.
http://dx.doi.org/10.1016/j.actamat.2006.06.059.
42. Chen, S.H., Wang, T.C. A New Deformation Theory with
Strain Gradient Effects International Journal of Plasticity
18 (8) 2002: pp. 971 – 995.
http://dx.doi.org/10.1016/s0749-6419(01)00020-1
43. Liang, B.H., Hu, S.G. Plasticity of Sheet Metal Forming.
China Machine Press, Beijing, 1987: pp. 123 – 163.
44. Liang, W., Yang, X.X. Second Class Size Effects on Brass
Sheet in Tensile Test Journal of Plasticity Engineering
20 (01) 2013: pp. 100 – 107.
http://dx.doi.org/10.3969/j.issn.1007-2012.2013.01.021
45. Mahabunphachai, S., Koc, M. Investigation of Size Effects
On Material Behavior of Thin Sheet Metals Using Hydraulic
Bulge Testing at Micro/Meso-Scales International Journal
of Machine Tools and Manufacture 48 (9)
2008: pp. 1014 – 1029.
http://dx.doi.org/10.1016/j.ijmachtools.2008.01.006
46. Byon, S., Moon, C., Lee, Y. Strain Gradient Plasticity Based
Finite Element Analysis of Ultra-Fine Wire Drawing Process
Journal of Mechanical Science and Technology 23 (12)
2009: pp. 3374.
http://dx.doi.org/10.1007/s12206-009-0926-y
47. Yun, W., Peilong, D., Zhenying, X., Hua, Y.,
Jiangping, W., Jingjing, W. A Constitutive Model for Thin
Sheet Metal in Micro-Forming Considering First Order Size
Effects Materials and Design 31 (2) 2010: pp. 1010 – 1014.
http://dx.doi.org/10.1016/j.matdes.2009.07.037
48. Kim, G.Y., Ni, J., Koc, M. Modeling of the Size Effects On
the Behavior of Metals in Microscale Deformation Processes
Journal of Manufacturing Science and Engineering,
Transactions of the ASME 129 (3) 2007: pp. 470 – 476.
http://dx.doi.org/10.1115/1.2714582
49. Shen, Y., Yu, H.P., Ruan, X.Y. Discussion and Prediction
On Decreasing Flow Stress Scale Effect Transactions of
Nonferrous Metals Society of China (English Edition) 16 (1)
2006: pp. 132 – 136.
http://dx.doi.org/10.1016/s1003-6326(06)60023-x
50. Shu, J.Y., Fleck, N.A., Van Der Giessen, E.,
Needleman, A. Boundary Layers in Constrained Plastic
Flow: Comparison of Nonlocal and Discrete Dislocation
Plasticity Journal of the Mechanics and Physics of Solids
49 (6) 2001: pp. 1361 – 1395.
http://dx.doi.org/10.1016/S0022-5096(00)00074-0
51. Sciarra, G., Dell'Isola, F., Coussy, O. Second Gradient
Poromechanics International Journal of Solids and
Structures 44 (20) 2007: pp. 6607 – 6629.
http://dx.doi.org/10.1016/j.ijsolstr.2007.03.003
© Liang et al. 2020 Open Access This article is distributed under the terms of the Creative Commons Attribution 4.0 International License (http://creativecommons.org/licenses/by/4.0/), which permits unrestricted use, distribution, and reproduction in any medium, provided you give appropriate credit to the original author(s) and the source, provide a link to the Creative Commons license, and indicate if changes were made.