consolidated financial results for the year ended march 31 ... · © 2013 cybernet systems co.,ltd....
TRANSCRIPT
Consolidated Financial Results for the Year Ended March 31, 2013
© 2013 CYBERNET SYSTEMS CO.,LTD. All Rights Reserved.2
Contents• Overview of Consolidated Financial Results for the Year
Ended March 31, 2013
• Mid-term business plan and Projection for FY2013
• Reference
© 2013 CYBERNET SYSTEMS CO.,LTD. All Rights Reserved.3
FY2012 CYBERNET Group
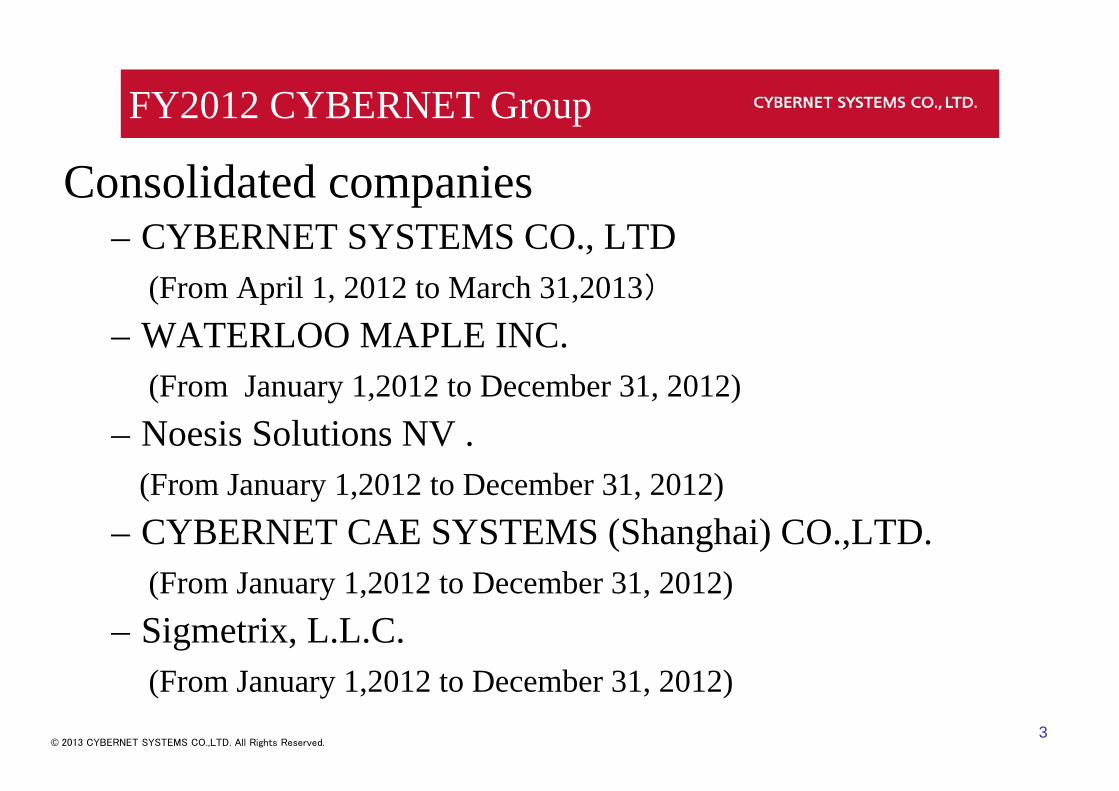
Consolidated companies– CYBERNET SYSTEMS CO., LTD
(From April 1, 2012 to March 31,2013)
– WATERLOO MAPLE INC. (From January 1,2012 to December 31, 2012)
– Noesis Solutions NV .(From January 1,2012 to December 31, 2012)
– CYBERNET CAE SYSTEMS (Shanghai) CO.,LTD. (From January 1,2012 to December 31, 2012)
– Sigmetrix, L.L.C. (From January 1,2012 to December 31, 2012)
© 2013 CYBERNET SYSTEMS CO.,LTD. All Rights Reserved.4
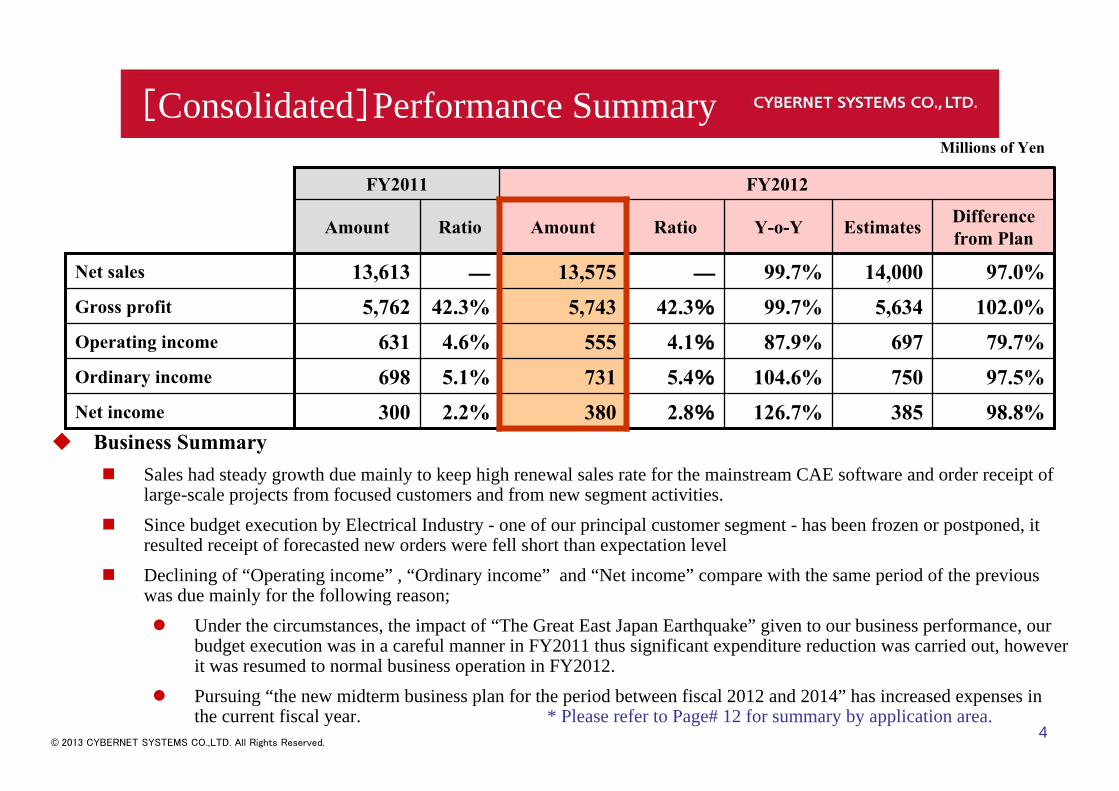
[Consolidated]Performance Summary
98.8%385126.7%2.8%3802.2%300Net income
97.5%750104.6%5.4%7315.1%698Ordinary income
79.7%69787.9%4.1%5554.6%631Operating income
102.0%5,63499.7%42.3%5,74342.3%5,762Gross profit
97.0%14,00099.7%―13,575―13,613Net sales
Difference from PlanEstimatesY-o-YRatioAmountRatioAmount
FY2012FY2011
Millions of Yen
Business SummarySales had steady growth due mainly to keep high renewal sales rate for the mainstream CAE software and order receipt of large-scale projects from focused customers and from new segment activities.Since budget execution by Electrical Industry - one of our principal customer segment - has been frozen or postponed, it resulted receipt of forecasted new orders were fell short than expectation levelDeclining of “Operating income” , “Ordinary income” and “Net income” compare with the same period of the previous was due mainly for the following reason;
Under the circumstances, the impact of “The Great East Japan Earthquake” given to our business performance, our budget execution was in a careful manner in FY2011 thus significant expenditure reduction was carried out, however it was resumed to normal business operation in FY2012.Pursuing “the new midterm business plan for the period between fiscal 2012 and 2014” has increased expenses in the current fiscal year. * Please refer to Page# 12 for summary by application area.

© 2013 CYBERNET SYSTEMS CO.,LTD. All Rights Reserved.5
698
FY2011 Ordinary income
731
+38
(57)
(57)
Millions of Yen
FY2012 Ordinary income
[Consolidated]Increase and Decrease in Ordinary Income Changes
Improvem
ent of Cost rate
Increase of cost of sales for service
Increase of the others of selling and general
administrative
expense
+83
+26N
on-operating income and
expenseForeign exchange gains
© 2013 CYBERNET SYSTEMS CO.,LTD. All Rights Reserved.6
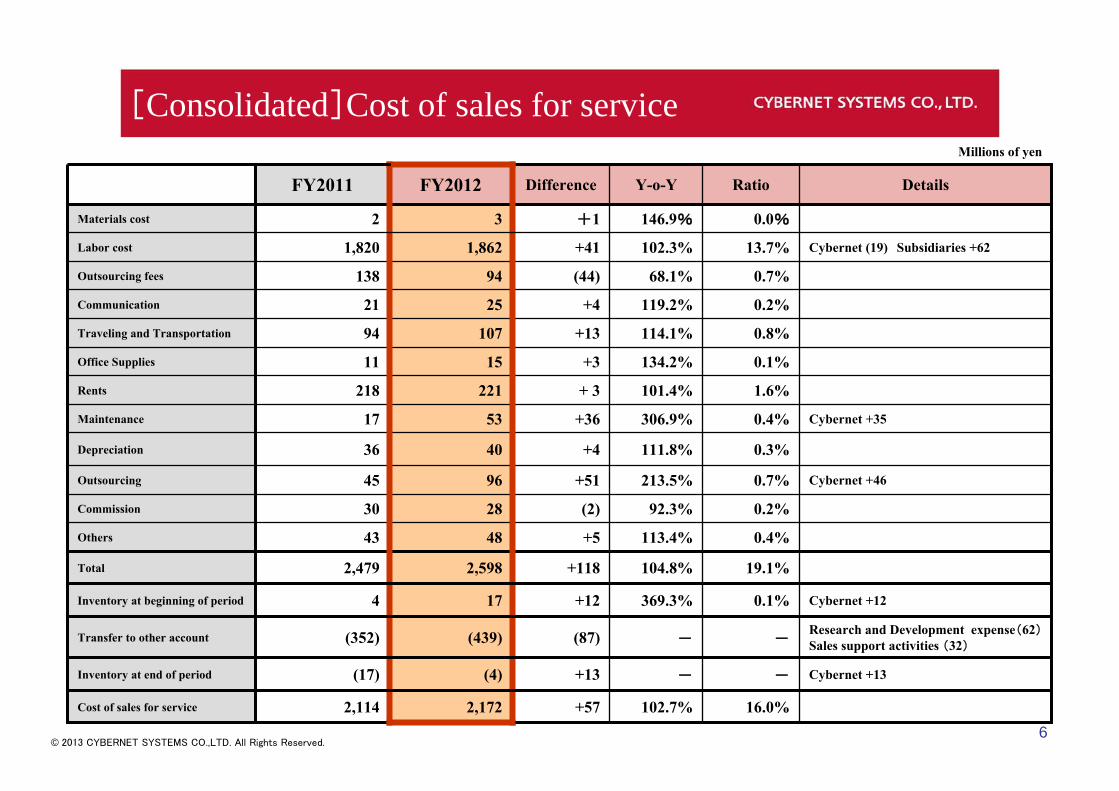
[Consolidated]Cost of sales for service
Cybernet +120.1%369.3%+12174Inventory at beginning of period
Research and Development expense(62)Sales support activities (32)--(87)(439)(352)Transfer to other account
19.1%104.8%+1182,5982,479Total
Cybernet +13--+13(4)(17)Inventory at end of period
0.0%146.9%+132Materials cost
0.7%68.1%(44)94138Outsourcing fees
16.0%102.7%+572,1722,114Cost of sales for service
0.4%113.4%+54843Others
0.2%92.3%(2)2830Commission
Cybernet +460.7%213.5%+519645Outsourcing
0.3%111.8%+44036Depreciation
Cybernet +350.4%306.9%+365317Maintenance
1.6%101.4%+ 3221218Rents
0.1%134.2%+31511Office Supplies
0.8%114.1%+1310794Traveling and Transportation
0.2%119.2%+42521Communication
Cybernet (19) Subsidiaries +6213.7%102.3%+411,8621,820Labor cost
DetailsRatioY-o-YDifferenceFY2012FY2011
Millions of yen

© 2013 CYBERNET SYSTEMS CO.,LTD. All Rights Reserved.7
[Consolidated] Selling and general administrative expenses
38.2%101.1%+575,1885,130Total
Research study expenses + 73Sales support activities + 324.4%123.3%+112594482Others
1.5%94.2%(12)198210Commission
Cybernet+ 391.5%124.9%+39198158Outsourcing
1.8%100.2%+0243242Advertising
Foreign Exchange Fluctuations (11)2.1%95.0%(14)283298Amortization of goodwill
Depreciation of Distribution rights (155)0.7%34.7%(174)92267Depreciation
0.4%95.0%(3)5962Maintenance
2.5%99.3%(2)334336Rents
0.1%87.2%(1)1011Education and Training
0.2%162.5%+92314Recruiting
0.2%58.7%(18)2645Office Supplies
1.6%111.0%+21219197Traveling and Transportation
1.2%104.4%+6163156Communication
Cybernet + 5620.2%103.6%+952,7402,644Personal
DetailsRatioY-o-YDifferenceFY2012FY2011
Millions of yen
© 2013 CYBERNET SYSTEMS CO.,LTD. All Rights Reserved.8
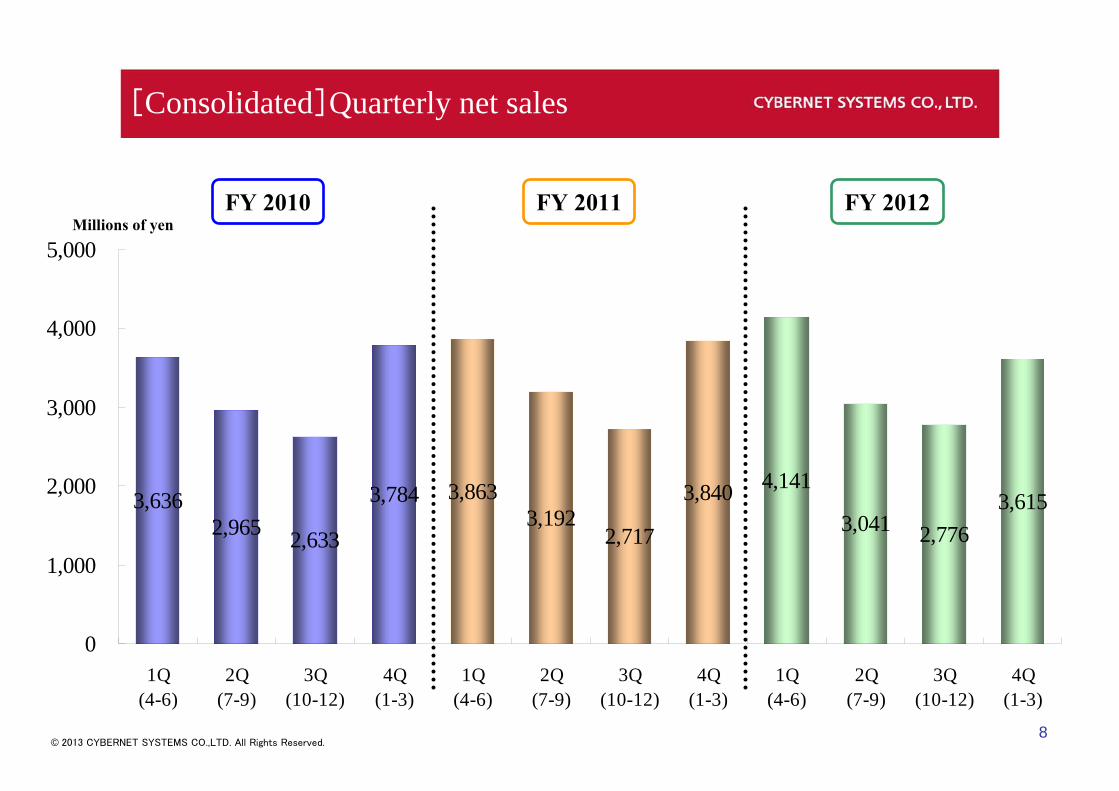
FY 2010 FY 2011 FY 2012Millions of yen
[Consolidated]Quarterly net sales
3,6362,965 2,633
3,784 3,8633,192
2,717
3,840 4,141
3,041 2,7763,615
0
1,000
2,000
3,000
4,000
5,000
1Q(4-6)
2Q(7-9)
3Q(10-12)
4Q(1-3)
1Q(4-6)
2Q(7-9)
3Q(10-12)
4Q(1-3)
1Q(4-6)
2Q(7-9)
3Q(10-12)
4Q(1-3)
© 2013 CYBERNET SYSTEMS CO.,LTD. All Rights Reserved.9
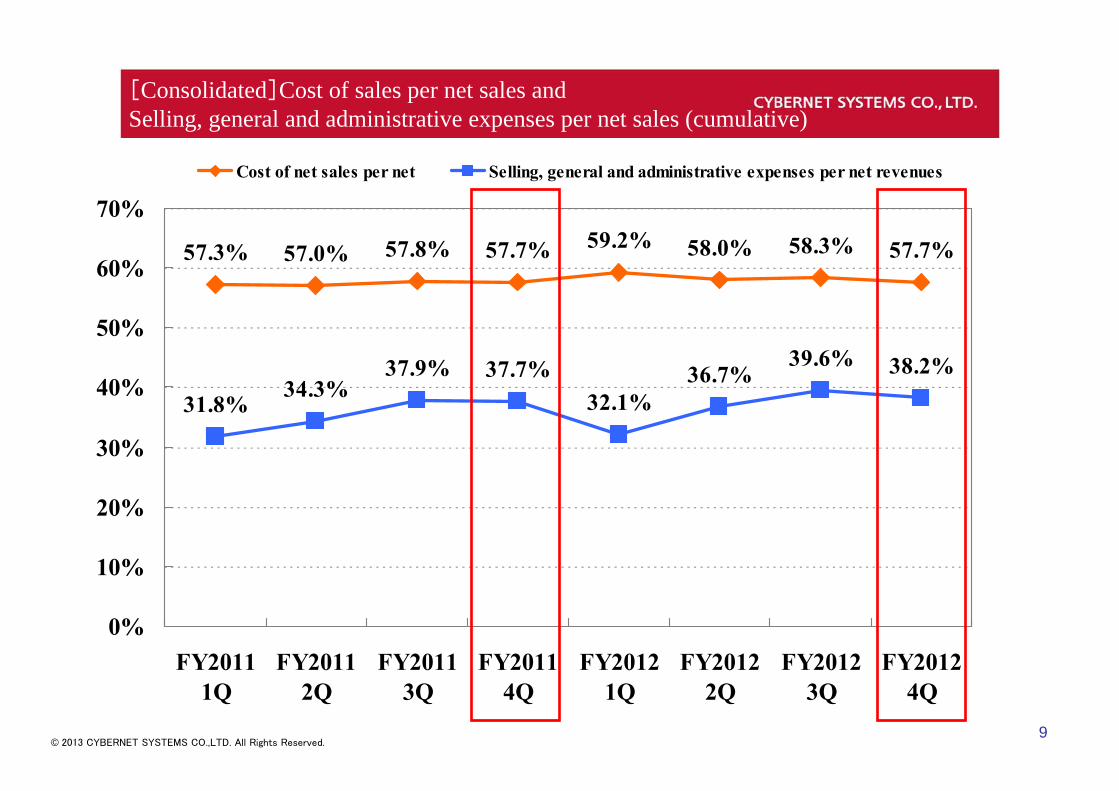
[Consolidated]Cost of sales per net sales and Selling, general and administrative expenses per net sales (cumulative)
57.3% 57.0% 57.8% 57.7% 59.2% 58.0% 58.3% 57.7%
31.8%34.3%
37.9% 37.7%32.1%
36.7%39.6% 38.2%
0%
10%
20%
30%
40%
50%
60%
70%
FY20111Q
FY20112Q
FY20113Q
FY20114Q
FY20121Q
FY20122Q
FY20123Q
FY20124Q
Cost of net sales per net Selling, general and administrative expenses per net revenues

© 2013 CYBERNET SYSTEMS CO.,LTD. All Rights Reserved.10
[Consolidated]Performance Summary
151.6%12978.0%4.7%1966.5%251Net income
156.6%24086.9%9.1%37511.2%432Ordinary income
157.7%22885.7%8.7%35910.9%419Operating income
111.7%1,511102.4%40.8%1,68842.7%1,648Gross profit
105.6%3,924107.2%―4,141―3,863Net sales
Difference from PlanEstimatesY-o-YRatioAmountRatioAmount
FY2012 1Q(4-6)FY2011 1Q(4-6)
Millions of Yen
―22――(2)2.3%72Net income
81.0%4521.8%1.2%365.2%166Ordinary income
68.1%3211.2%0.7%216.1%194Operating income
107.7%1,23295.9%43.6%1,32643.3%1,383Gross profit
95.8%3,17695.3%―3,041―3,192Net sales
Difference from PlanEstimatesY-o-YRatioAmountRatioAmount
FY2012 2Q(7-9)FY2011 2Q(7-9)
Millions of Yen
FY2012(4-6)
FY2012(7-9)
© 2013 CYBERNET SYSTEMS CO.,LTD. All Rights Reserved.11
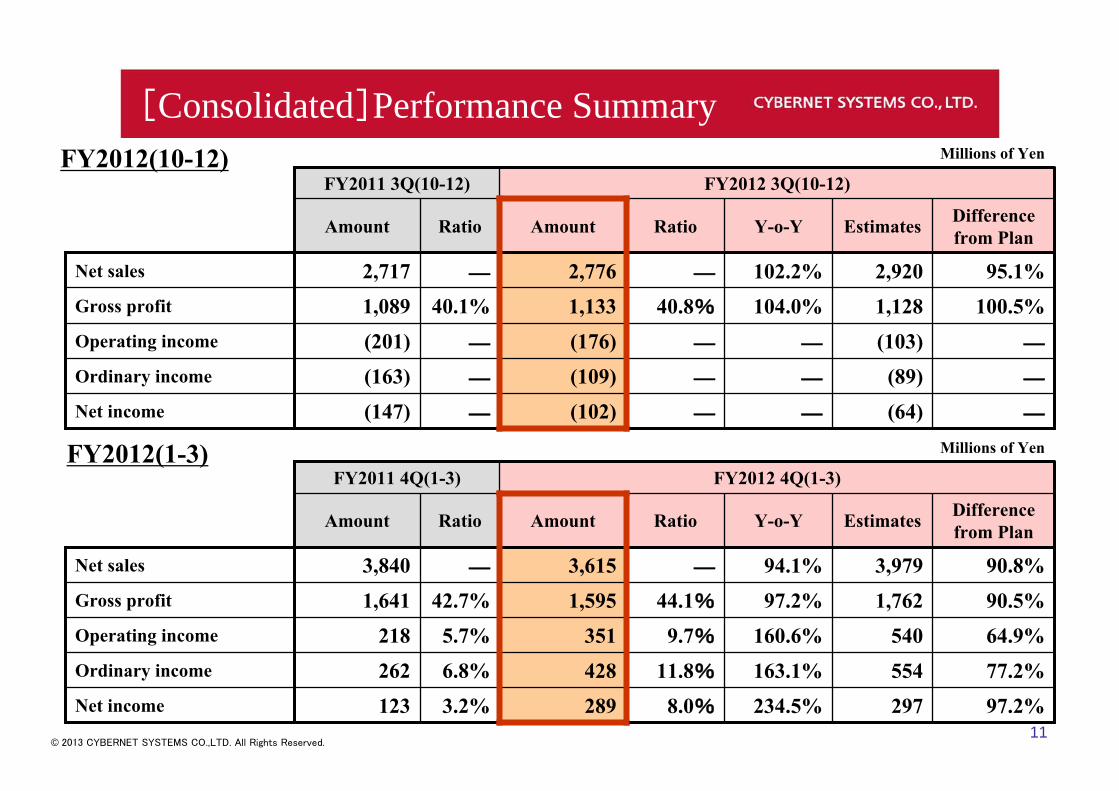
[Consolidated]Performance Summary
―(64)――(102)―(147)Net income
―(89)――(109)―(163)Ordinary income
―(103)――(176)―(201)Operating income
100.5%1,128104.0%40.8%1,13340.1%1,089Gross profit
95.1%2,920102.2%―2,776―2,717Net sales
Difference from PlanEstimatesY-o-YRatioAmountRatioAmount
FY2012 3Q(10-12)FY2011 3Q(10-12)
Millions of YenFY2012(10-12)
97.2%297234.5%8.0%2893.2%123Net income
77.2%554163.1%11.8%4286.8%262Ordinary income
64.9%540160.6%9.7%3515.7%218Operating income
90.5%1,76297.2%44.1%1,59542.7%1,641Gross profit
90.8%3,97994.1%―3,615―3,840Net sales
Difference from PlanEstimatesY-o-YRatioAmountRatioAmount
FY2012 4Q(1-3)FY2011 4Q(1-3)
Millions of YenFY2012(1-3)
© 2013 CYBERNET SYSTEMS CO.,LTD. All Rights Reserved.12
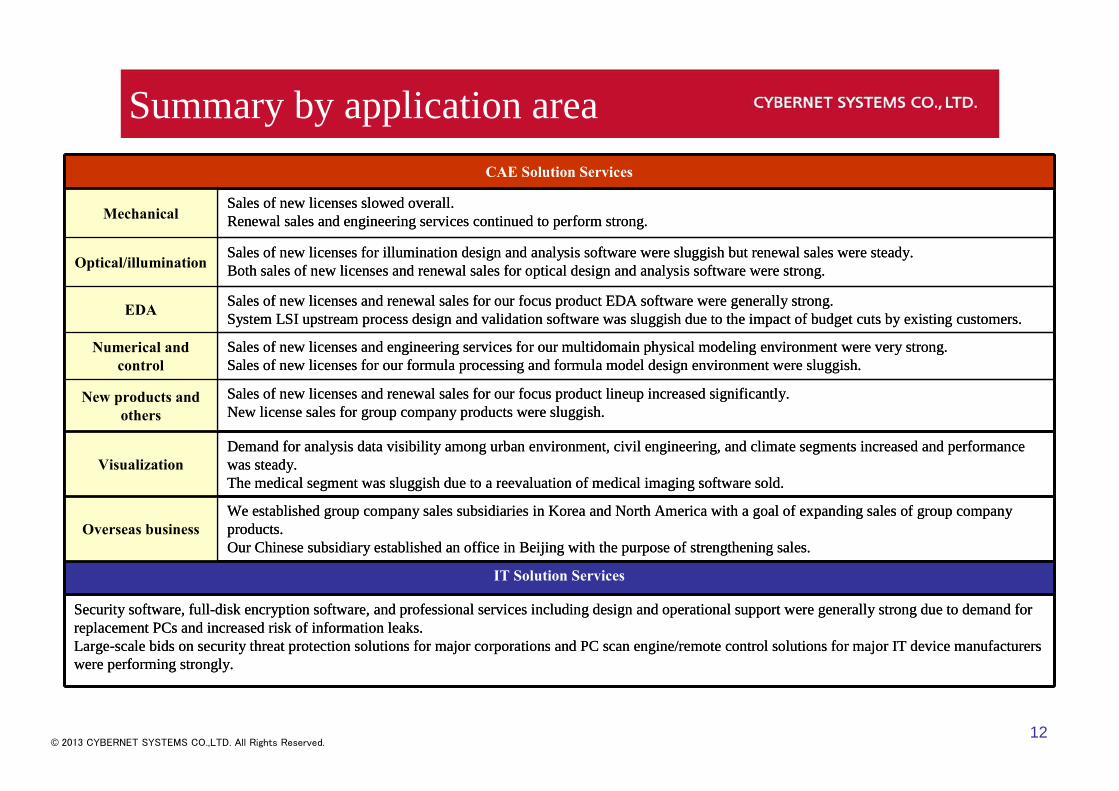
Summary by application areaCAE Solution Services
MechanicalSales of new licenses slowed overall.Renewal sales and engineering services continued to perform strong.
Optical/illuminationSales of new licenses for illumination design and analysis software were sluggish but renewal sales were steady.Both sales of new licenses and renewal sales for optical design and analysis software were strong.
EDA Sales of new licenses and renewal sales for our focus product EDA software were generally strong.System LSI upstream process design and validation software was sluggish due to the impact of budget cuts by existing customers.
Numerical and control
Sales of new licenses and engineering services for our multidomain physical modeling environment were very strong.Sales of new licenses for our formula processing and formula model design environment were sluggish.
New products and others
Sales of new licenses and renewal sales for our focus product lineup increased significantly.New license sales for group company products were sluggish.
VisualizationDemand for analysis data visibility among urban environment, civil engineering, and climate segments increased and performance was steady.The medical segment was sluggish due to a reevaluation of medical imaging software sold.
Overseas businessWe established group company sales subsidiaries in Korea and North America with a goal of expanding sales of group company products.Our Chinese subsidiary established an office in Beijing with the purpose of strengthening sales.
IT Solution Services
Security software, full-disk encryption software, and professional services including design and operational support were generally strong due to demand for replacement PCs and increased risk of information leaks.Large-scale bids on security threat protection solutions for major corporations and PC scan engine/remote control solutions for major IT device manufacturers were performing strongly.
CAE Solution Services
MechanicalSales of new licenses slowed overall.Renewal sales and engineering services continued to perform strong.
Optical/illuminationSales of new licenses for illumination design and analysis software were sluggish but renewal sales were steady.Both sales of new licenses and renewal sales for optical design and analysis software were strong.
EDA Sales of new licenses and renewal sales for our focus product EDA software were generally strong.System LSI upstream process design and validation software was sluggish due to the impact of budget cuts by existing customers.
Numerical and control
Sales of new licenses and engineering services for our multidomain physical modeling environment were very strong.Sales of new licenses for our formula processing and formula model design environment were sluggish.
New products and others
Sales of new licenses and renewal sales for our focus product lineup increased significantly.New license sales for group company products were sluggish.
VisualizationDemand for analysis data visibility among urban environment, civil engineering, and climate segments increased and performance was steady.The medical segment was sluggish due to a reevaluation of medical imaging software sold.
Overseas businessWe established group company sales subsidiaries in Korea and North America with a goal of expanding sales of group company products.Our Chinese subsidiary established an office in Beijing with the purpose of strengthening sales.
IT Solution Services
Security software, full-disk encryption software, and professional services including design and operational support were generally strong due to demand for replacement PCs and increased risk of information leaks.Large-scale bids on security threat protection solutions for major corporations and PC scan engine/remote control solutions for major IT device manufacturers were performing strongly.

© 2013 CYBERNET SYSTEMS CO.,LTD. All Rights Reserved.13
Elimination
AmountComposition
ratioRatio Amount
Compositionratio
Ratio Amount Amount Ratio
Net sales 11,967 87.9% ― 1,645 12.1% ― 0 13,613 ―Operatingexpenses 10,082 ― 84.2% 1,544 ― 93.9% 1,354 12,981 95.4%Operatingincome 1,885 ― 15.8% 101 ― 6.1% (1,354) 631 4.6%
CAE Soluti on Serv ices IT Soluti on Serv ices Consolidated
Elimination
AmountComposition
ratioRatio Amount
Compositionratio
Ratio Amount Amount Ratio
Net sales 11,770 86.7% ― 1,804 13.3% ― ― 13,575 ―Operatingexpenses 10,071 ― 85.6% 1,588 ― 88.0% 1,359 13,019 95.9%Operatingincome 1,699 ― 14.4% 216 ― 12.0% (1,359) 555 4.1%
CAE Solution Services IT Solution Services Consolidated
[Consolidated]Business Segment Information
FY2011 Millions of yen
FY2012 Millions of yen
1.CAE solution services (Y-o-Y Net Sales 1.6% decrease)(Y-o-Y Operating income 9.9% decrease)
2.IT Solution services (Y-o-Y Net Sales 9.6% increase)(Y-o-Y Operating income 113.7% increase)

© 2013 CYBERNET SYSTEMS CO.,LTD. All Rights Reserved.14
45.0% 42.0% 39.3%31.7%
45.2% 40.3% 38.6%31.3%
26.3%18.8%
15.2% 23.8%
25.0%
17.2% 16.9% 28.4%
8.6%
11.9%12.6% 9.0%
8.0%
11.3% 12.0% 8.6%
3.8% 6.3%5.2%
5.6% 5.8% 3.9% 5.5% 4.7%3.7% 8.9% 5.6% 5.5% 5.8%
12.3% 11.1%19.2% 13.9% 13.4% 17.2% 17.2% 14.9%
1.9%
4.3%4.4% 6.9%
2.1%
4.5%
4.3%3.4%2.5% 2.0%7.2%
0%
10%
20%
30%
40%
50%
60%
70%
80%
90%
100%
1Q( 4- 6)
2Q( 7- 9)
3Q(10-12)
4Q( 1- 3)
1Q( 4- 6)
2Q( 7- 9)
3Q(10-12)
4Q( 1- 3)
Mechanical system Optical system EDA Numerical and control New Products and others Visualization IT solution
[Non-consolidated]Net Sales by Business Line
FY2011 FY2012
* Effective from this term, we made “ Visualization” independent from “Mechanical system” category and also moved some of “Mechanical system” to “Others” category and reflected it in this report.
© 2013 CYBERNET SYSTEMS CO.,LTD. All Rights Reserved.15
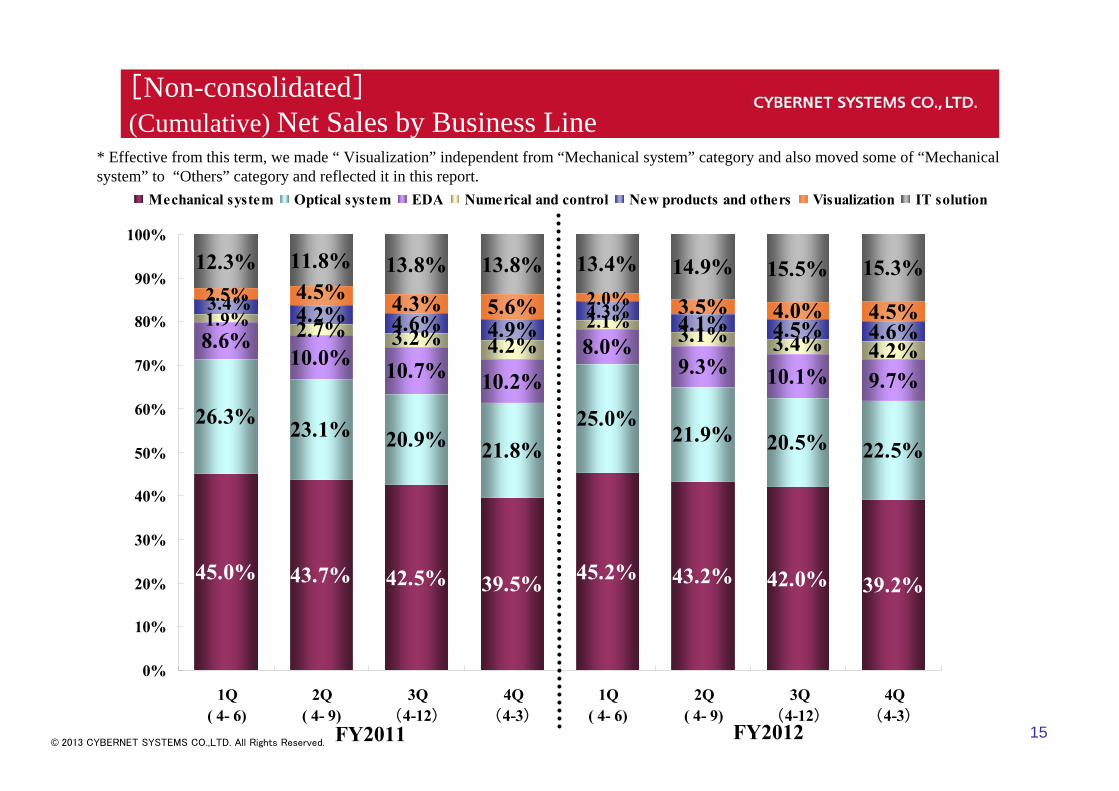
45.0% 43.7% 42.5% 39.5% 45.2% 43.2% 42.0% 39.2%
26.3% 23.1% 20.9% 21.8%25.0%
21.9% 20.5% 22.5%
8.6%10.0% 10.7% 10.2%
8.0%9.3% 10.1% 9.7%
2.7%4.2%
4.2% 4.6% 4.9% 4.1% 4.5% 4.6%4.3% 5.6% 3.5% 4.0% 4.5%
12.3% 11.8% 13.8% 13.8% 13.4% 14.9% 15.5% 15.3%
1.9%3.4%3.2% 4.2%
2.1% 3.1%4.3%3.4%2.5% 2.0%4.5%
0%
10%
20%
30%
40%
50%
60%
70%
80%
90%
100%
1Q( 4- 6)
2Q( 4- 9)
3Q(4-12)
4Q(4-3)
1Q( 4- 6)
2Q( 4- 9)
3Q(4-12)
4Q(4-3)
Mechanical system Optical system EDA Numerical and control New products and others Visualization IT solution
FY2011 FY2012
[Non-consolidated](Cumulative) Net Sales by Business Line
* Effective from this term, we made “ Visualization” independent from “Mechanical system” category and also moved some of “Mechanical system” to “Others” category and reflected it in this report.
© 2013 CYBERNET SYSTEMS CO.,LTD. All Rights Reserved.16
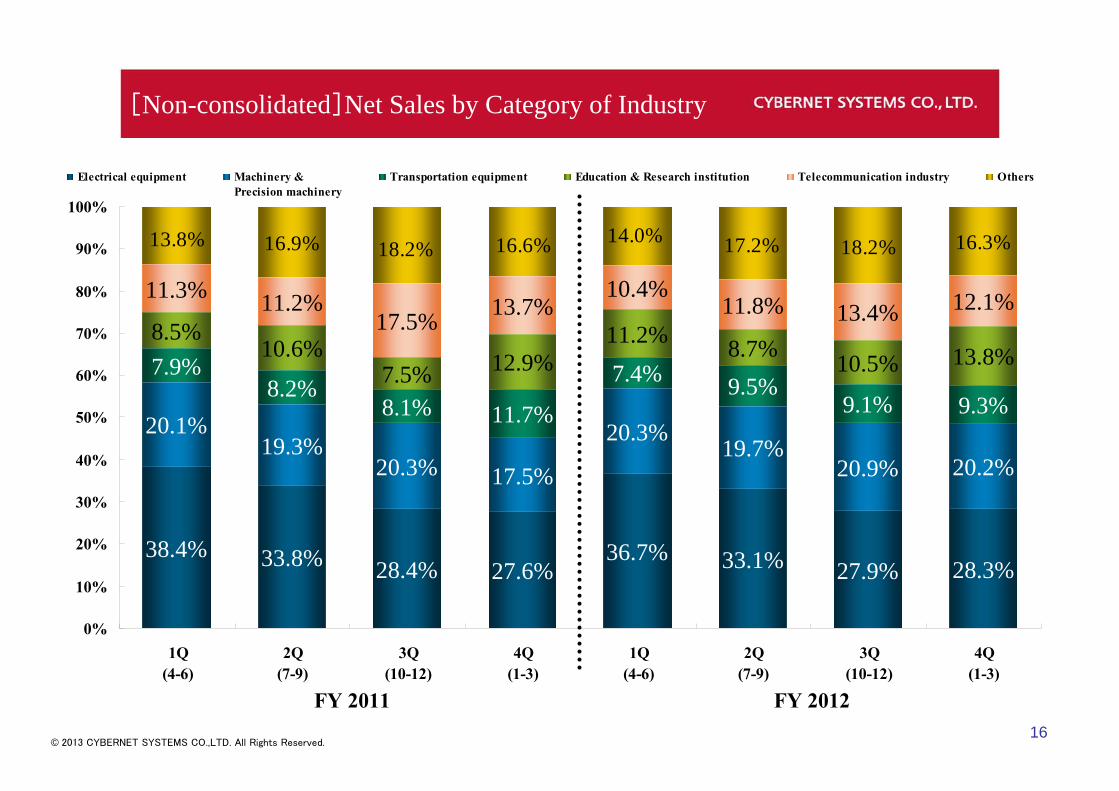
[Non-consolidated]Net Sales by Category of Industry
FY 2011 FY 2012
38.4% 33.8% 28.4% 27.6%36.7% 33.1% 27.9% 28.3%
20.1%19.3%
20.3% 17.5%
20.3%19.7%
20.9% 20.2%
7.9%8.2%
8.1% 11.7%
7.4% 9.5%9.1% 9.3%
8.5%10.6%
7.5% 12.9%11.2% 8.7% 10.5% 13.8%
11.3% 11.2%17.5% 13.7%
10.4%11.8% 13.4% 12.1%
16.3%18.2%17.2%14.0%16.6%18.2%16.9%13.8%
0%
10%
20%
30%
40%
50%
60%
70%
80%
90%
100%
1Q(4-6)
2Q(7-9)
3Q(10-12)
4Q(1-3)
1Q(4-6)
2Q(7-9)
3Q(10-12)
4Q(1-3)
Electrical equipment Machinery & Precision machinery
Transportation equipment Education & Research institution Telecommunication industry Others
© 2013 CYBERNET SYSTEMS CO.,LTD. All Rights Reserved.17
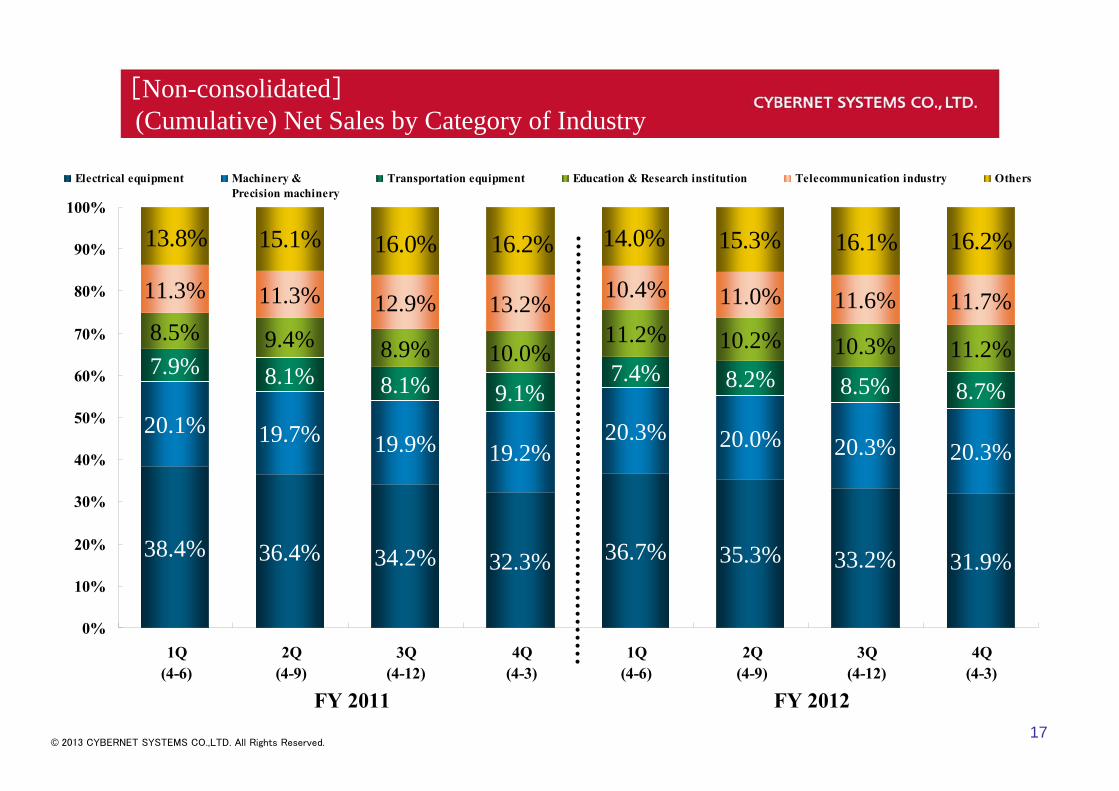
[Non-consolidated](Cumulative) Net Sales by Category of Industry
FY 2011 FY 2012
38.4% 36.4% 34.2% 32.3% 36.7% 35.3% 33.2% 31.9%
20.1% 19.7% 19.9% 19.2%20.3% 20.0% 20.3% 20.3%
7.9% 8.1% 8.1% 9.1%7.4% 8.2% 8.5% 8.7%
8.5% 9.4% 8.9% 10.0%11.2% 10.2% 10.3% 11.2%
11.3% 11.3% 12.9% 13.2% 10.4% 11.0% 11.6% 11.7%
16.2%16.1%15.3%14.0%16.2%16.0%15.1%13.8%
0%
10%
20%
30%
40%
50%
60%
70%
80%
90%
100%
1Q(4-6)
2Q(4-9)
3Q(4-12)
4Q(4-3)
1Q(4-6)
2Q(4-9)
3Q(4-12)
4Q(4-3)
Electrical equipment Machinery & Precision machinery
Transportation equipment Education & Research institution Telecommunication industry Others
© 2013 CYBERNET SYSTEMS CO.,LTD. All Rights Reserved.18
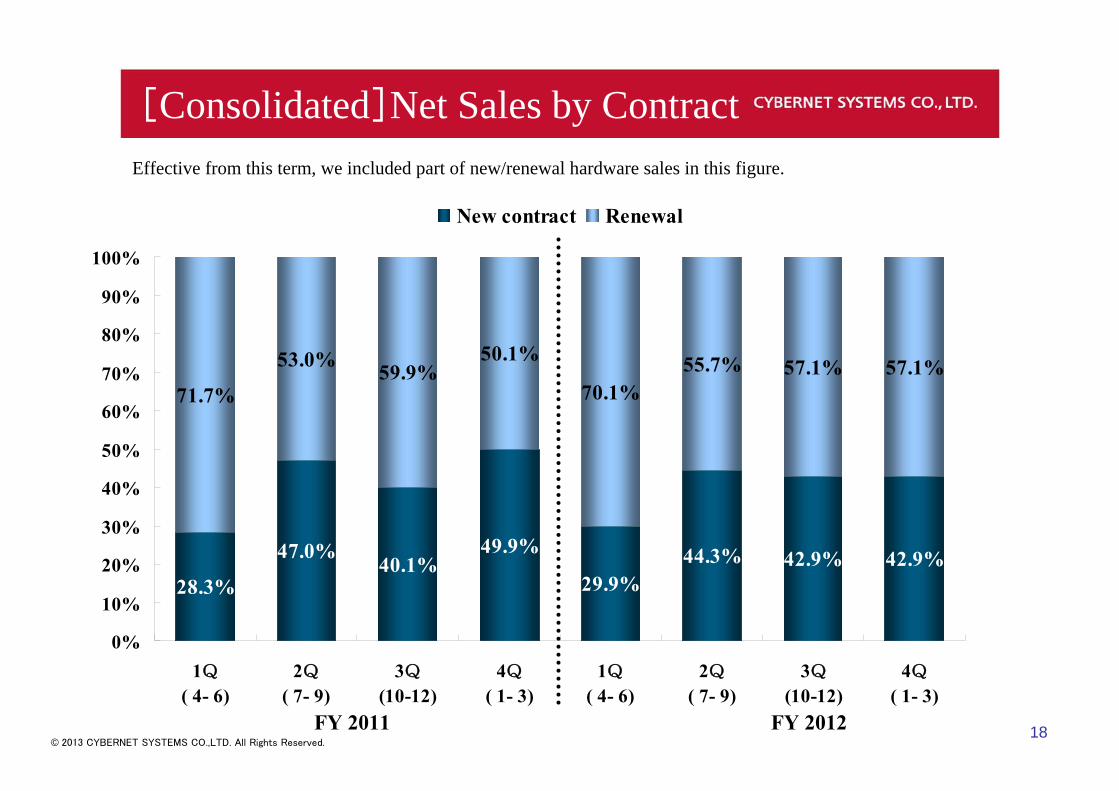
28.3%
47.0%40.1%
49.9%
29.9%44.3% 42.9% 42.9%
71.7%
53.0% 59.9%50.1%
70.1%55.7% 57.1% 57.1%
0%
10%
20%
30%
40%
50%
60%
70%
80%
90%
100%
1Q( 4- 6)
2Q( 7- 9)
3Q(10-12)
4Q( 1- 3)
1Q( 4- 6)
2Q( 7- 9)
3Q(10-12)
4Q( 1- 3)
New contract Renewal
FY 2011 FY 2012
[Consolidated]Net Sales by ContractEffective from this term, we included part of new/renewal hardware sales in this figure.

© 2013 CYBERNET SYSTEMS CO.,LTD. All Rights Reserved.19
28.3%36.1% 37.2% 40.5%
29.9% 35.6% 37.5% 38.8%
71.7%63.9% 62.8% 59.5%
70.1% 64.4% 62.5% 61.2%
0%
10%
20%
30%
40%
50%
60%
70%
80%
90%
100%
1Q( 4- 6)
2Q( 4- 9)
3Q(4-12)
4Q( 4- 3)
1Q( 4- 6)
2Q( 4- 9)
3Q(4-12)
4Q( 4- 3)
New contract Renewal
FY 2011 FY 2012
[Consolidated](Cumulative) Net Sales by Contract
Effective from this term, we included part of new/renewal hardware sales in this figure.

© 2013 CYBERNET SYSTEMS CO.,LTD. All Rights Reserved.20
Millions of yen
[Consolidated]Balance SheetsSources of ChangesFY2012 <Total current assets 17,504 +287 >
<Comparison for the last fiscal year>
Current assetsCash and deposits + 240Short-Term investment +2,902securitiesShort-Term Financing (998)(FSI Group CMS)
Fixed assetsGoodwill +101Investments securities (1,897)
Current liabilitiesAccounts payable-trade (111)Income tax payable (377)Advances received +268
Long-term liabilitiesReserve for retirement benefits + 63
Net assetsRetained earnings + 56Accumulated other comprehensive income +541
Current assets
12,758+2,149
Fixed assets
4,745(1,862)
Net assets
13,292+598
Current liabilities3,486(378)
Long-term liabilities724 +67
© 2013 CYBERNET SYSTEMS CO.,LTD. All Rights Reserved.21
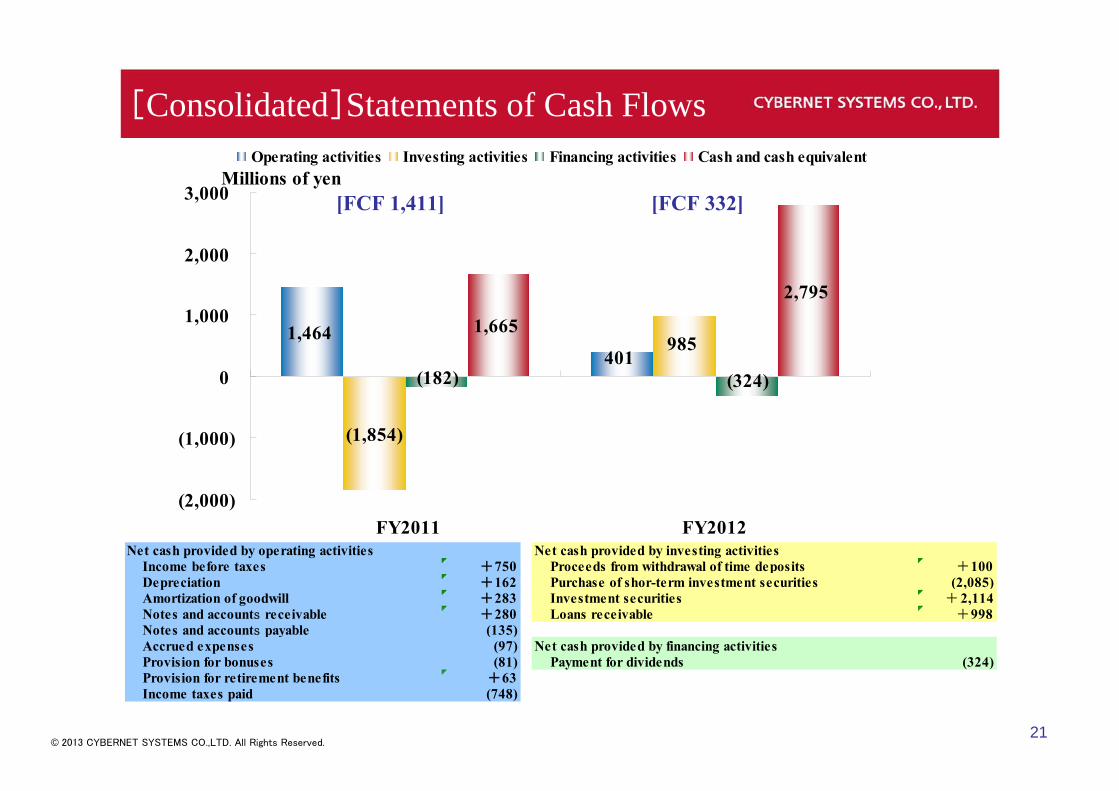
1,464401
(1,854)
1,665
2,795
985
(324)(182)
(2,000)
(1,000)
0
1,000
2,000
3,000
FY2011 FY2012
Millions of yenOperating activities Investing activities Financing activities Cash and cash equivalent
[Consolidated]Statements of Cash Flows
Net cash provided by operating activities Net cash provided by investing activitiesIncome before taxes +750 Proceeds from withdrawal of time deposits +100Depreciation +162 Purchase of shor-term investment securities (2,085)Amortization of goodwill +283 Investment securities +2,114Notes and accounts receivable +280 Loans receivable +998Notes and accounts payable (135)Accrued expenses (97) Net cash provided by financing activitiesProvision for bonuses (81) Payment for dividends (324)Provision for retirement benefits +63Income taxes paid (748)
[FCF 1,411] [FCF 332]
© 2013 CYBERNET SYSTEMS CO.,LTD. All Rights Reserved.22
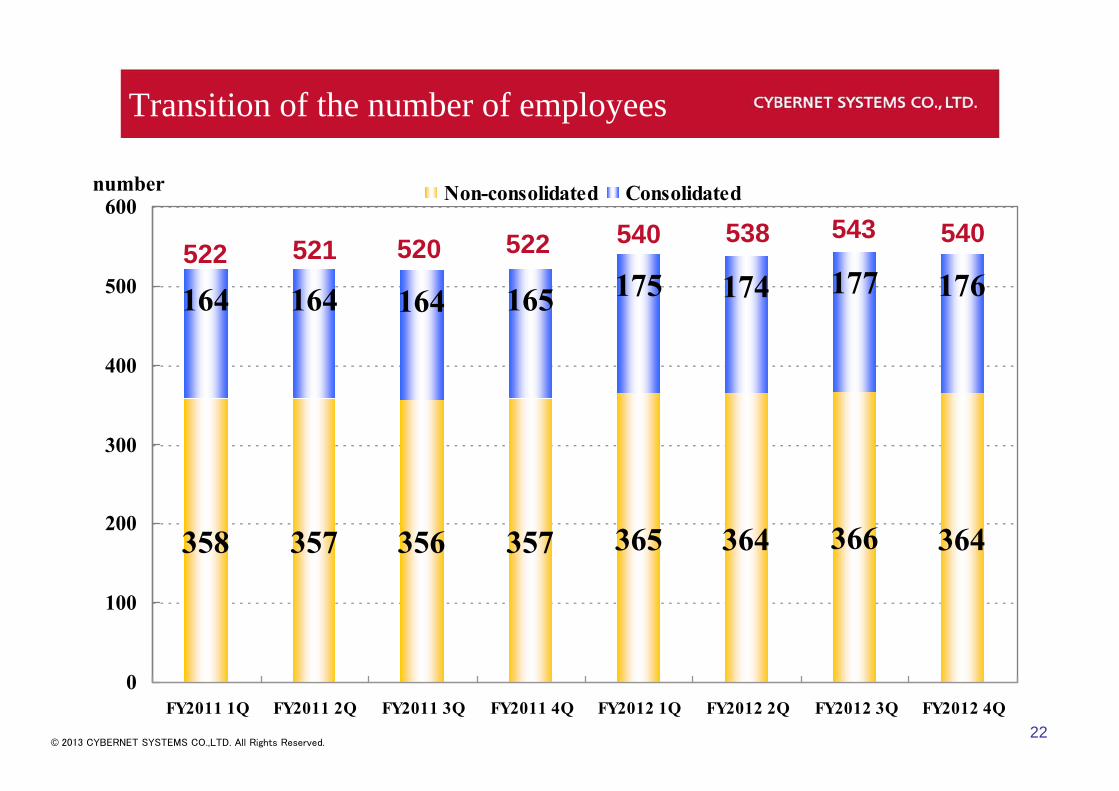
Transition of the number of employees
358 357 356 357 365 364 366 364
164 164 164 165 175 174 177 176
0
100
200
300
400
500
600
FY2011 1Q FY2011 2Q FY2011 3Q FY2011 4Q FY2012 1Q FY2012 2Q FY2012 3Q FY2012 4Q
Non-consolidated Consolidated
522 521 520
number
522 540 538 543 540
© 2013 CYBERNET SYSTEMS CO.,LTD. All Rights Reserved.23
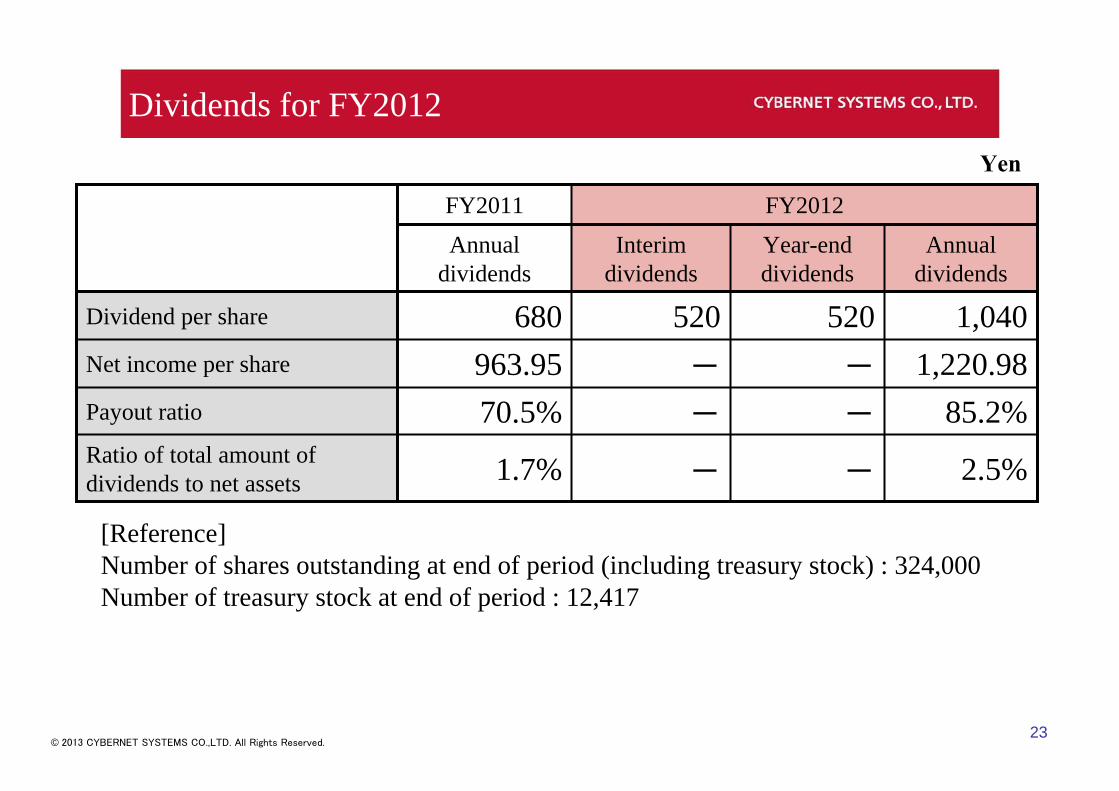
85.2%--70.5%Payout ratio
2.5%--1.7%Ratio of total amount of dividends to net assets
963.95680
Annualdividends
FY2011 FY2012
1,220.98--Net income per share
1,040520520 Dividend per share
Annualdividends
Year-enddividends
Interimdividends
Yen
Dividends for FY2012
[Reference]Number of shares outstanding at end of period (including treasury stock) : 324,000Number of treasury stock at end of period : 12,417
© 2013 CYBERNET SYSTEMS CO.,LTD. All Rights Reserved.24
Mid-term business plan and Projection for FY2013
© 2013 CYBERNET SYSTEMS CO.,LTD. All Rights Reserved.25
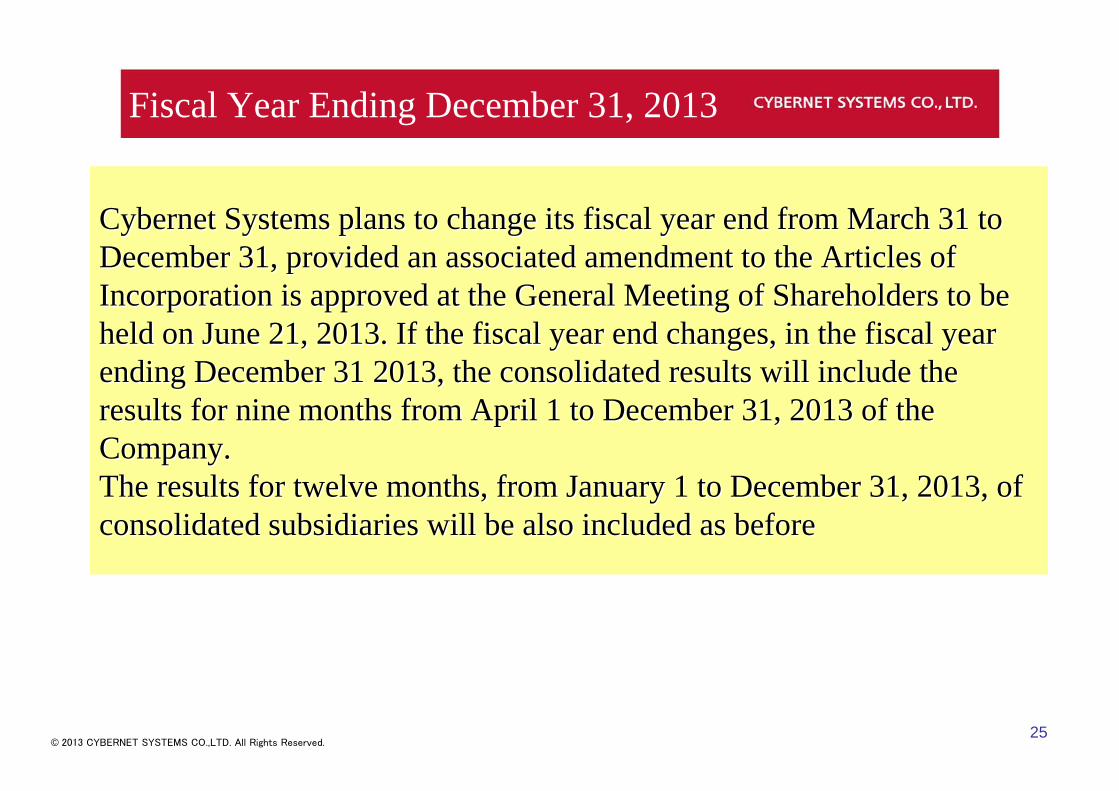
Fiscal Year Ending December 31, 2013
Cybernet Systems plans to change its fiscal year end from March Cybernet Systems plans to change its fiscal year end from March 31 to 31 to December 31, provided an associated amendment to the Articles ofDecember 31, provided an associated amendment to the Articles ofIncorporation is approved at the General Meeting of ShareholdersIncorporation is approved at the General Meeting of Shareholders to be to be held on June 21, 2013. If the fiscal year end changes, in the fiheld on June 21, 2013. If the fiscal year end changes, in the fiscal year scal year ending December 31 2013, the consolidated results will include tending December 31 2013, the consolidated results will include the he results for nine months from April 1 to December 31, 2013 of theresults for nine months from April 1 to December 31, 2013 of theCompany. Company. The results for twelve months, from January 1 to December 31, 20The results for twelve months, from January 1 to December 31, 2013, of 13, of consolidated subsidiaries will be also included as beforeconsolidated subsidiaries will be also included as before
© 2013 CYBERNET SYSTEMS CO.,LTD. All Rights Reserved.26
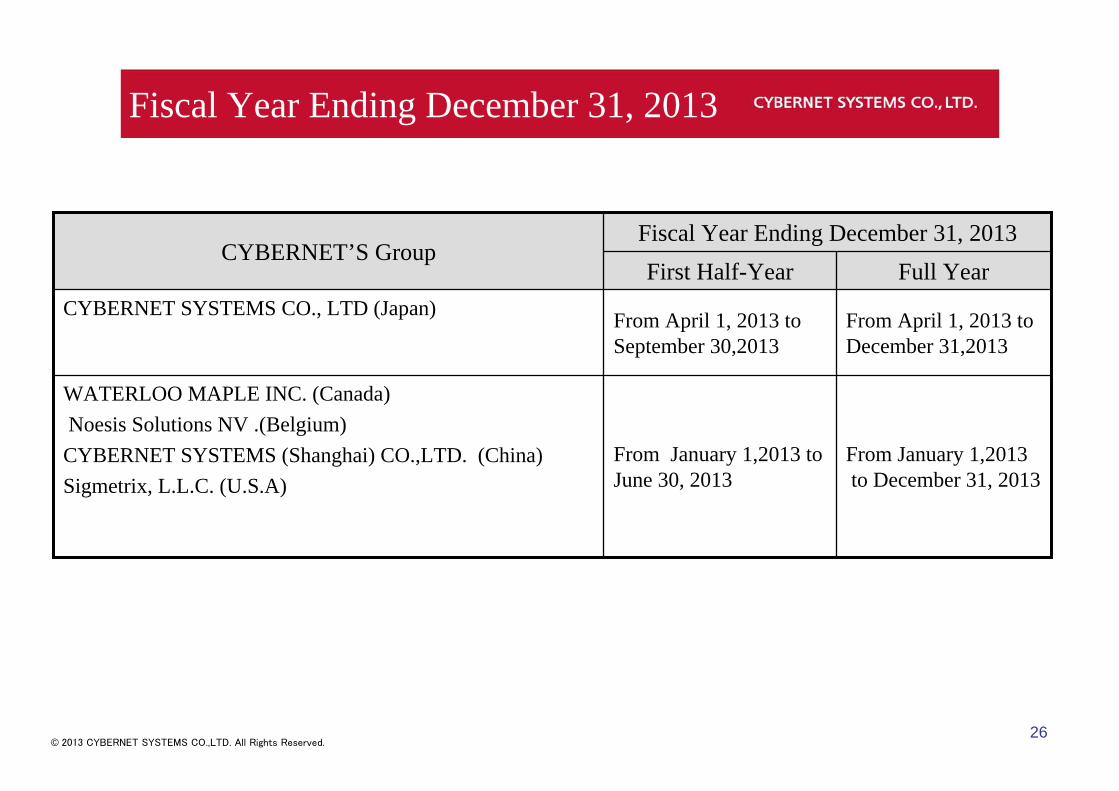
Fiscal Year Ending December 31, 2013
From January 1,2013to December 31, 2013
From January 1,2013 to June 30, 2013
WATERLOO MAPLE INC. (Canada)Noesis Solutions NV .(Belgium)CYBERNET SYSTEMS (Shanghai) CO.,LTD. (China)Sigmetrix, L.L.C. (U.S.A)
From April 1, 2013 to December 31,2013
From April 1, 2013 to September 30,2013
CYBERNET SYSTEMS CO., LTD (Japan)
Full YearFirst Half-YearFiscal Year Ending December 31, 2013
CYBERNET’S Group
© 2013 CYBERNET SYSTEMS CO.,LTD. All Rights Reserved.27
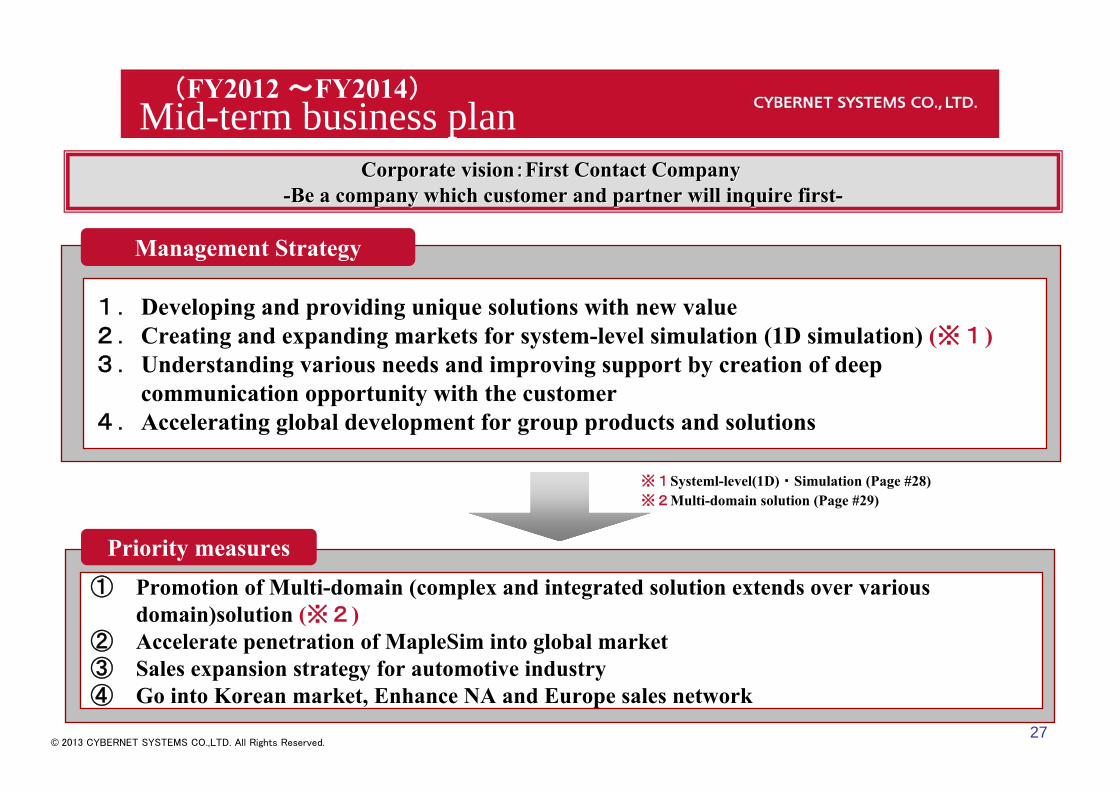
Mid-term business plan
Management Strategy
1.Developing and providing unique solutions with new value2.Creating and expanding markets for system-level simulation (1D simulation) (※1)3.Understanding various needs and improving support by creation of deep
communication opportunity with the customer4.Accelerating global development for group products and solutions
① Promotion of Multi-domain (complex and integrated solution extends over various domain)solution (※2)
② Accelerate penetration of MapleSim into global market③ Sales expansion strategy for automotive industry④ Go into Korean market, Enhance NA and Europe sales network
Priority measures
Corporate visionCorporate vision::First Contact Company First Contact Company --Be a company which customer and partner will inquire firstBe a company which customer and partner will inquire first--
※1Systeml-level(1D)・Simulation (Page #28) ※2Multi-domain solution (Page #29)
(FY2012 ~FY2014)
© 2013 CYBERNET SYSTEMS CO.,LTD. All Rights Reserved.28
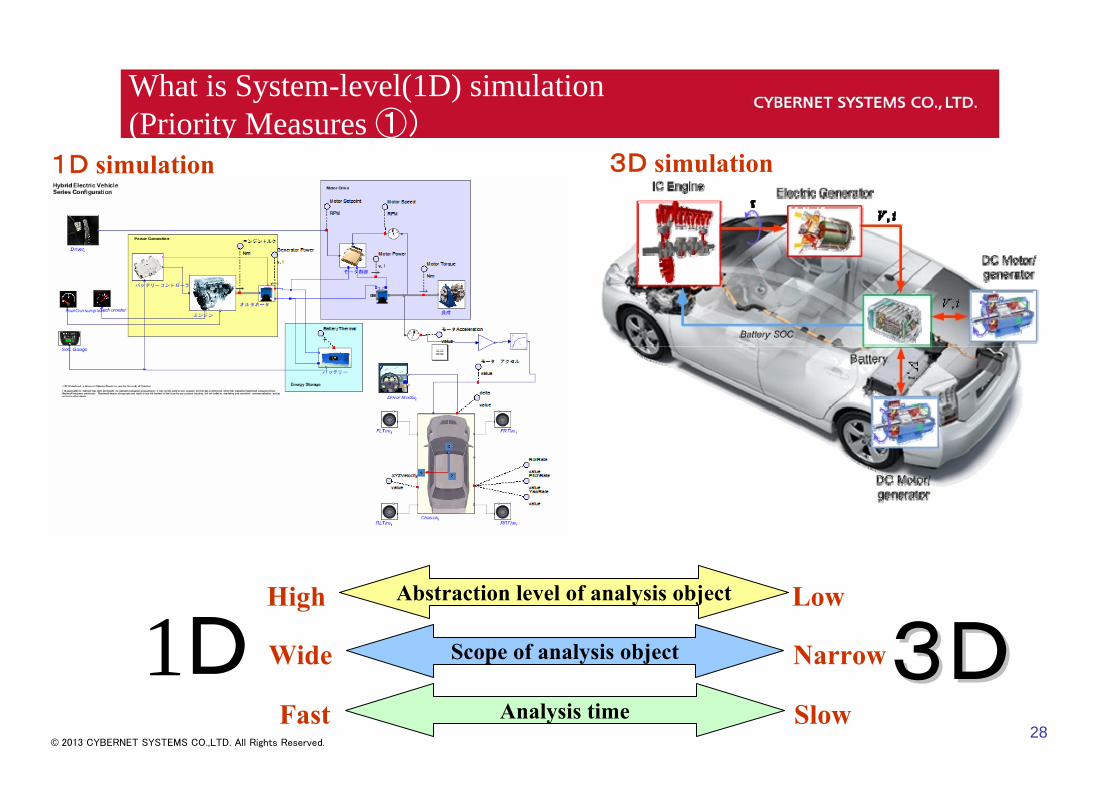
What is System-level(1D) simulation(Priority Measures ①)
3D simulation1D simulation
Scope of analysis object1D 3D3DAnalysis time
LowHigh
SlowFast
Abstraction level of analysis object
NarrowWide

© 2013 CYBERNET SYSTEMS CO.,LTD. All Rights Reserved.29
What is “Multi-Domain Solution”(Priority Measures ②)
Analysis example:Evaluate influences by heat in lens
Primary designLens configuration,
setting data
Secondary designEvaluate efficiency and re-set
variance
Heat Transfer AnalysisCheck influence by heat
OpticalOptical MechanicalMechanical OpticalOptical
Analysis process integration・Total optimization

© 2013 CYBERNET SYSTEMS CO.,LTD. All Rights Reserved.30
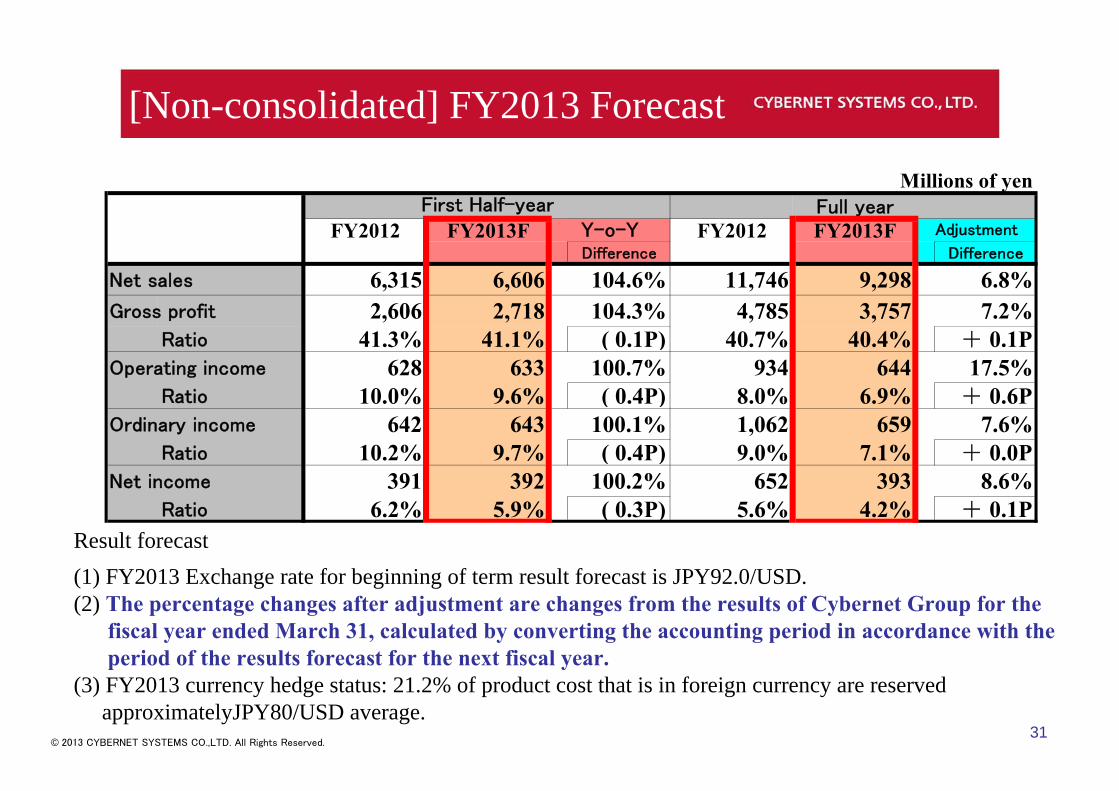
[Consolidated] FY2013 Forecast
(1) FY2013 Exchange rate for beginning of term result forecast is JPY92.0/USD.(2) The percentage changes after adjustment are changes from the results of Cybernet Group for the
fiscal year ended March 31, calculated by converting the accounting period in accordance with the period of the results forecast for the next fiscal year.
(3) FY2013 currency hedge status: 21.2% of product cost that is in foreign currency are reservedapproximately JPY80/USD average.
Result forecast
Millions of yenFull year
FY2012 FY2013F FY2012 FY2013FDifference Difference
Net sales 7,183 7,489 104.3% 13,575 11,330 7.6%Gross profit 3,015 3,185 105.7% 5,743 4,887 9.5%
Ratio 42.0% 42.5% + 0.6P 42.3% 43.1% + 0.7POperating income 381 423 110.9% 555 447 86.2%
Ratio 5.3% 5.6% + 0.3P 4.1% 3.9% + 1.7POrdinary income 412 421 102.1% 731 441 25.3%
Ratio 5.7% 5.6% ( 0.1P) 5.4% 3.9% + 0.5PNet income 194 225 116.3% 380 236 46.8%
Ratio 2.7% 3.0% + 0.3P 2.8% 2.1% + 0.6P
Adjustment
First Half-yearY-o-Y
© 2013 CYBERNET SYSTEMS CO.,LTD. All Rights Reserved.31
[Non-consolidated] FY2013 Forecast
(1) FY2013 Exchange rate for beginning of term result forecast is JPY92.0/USD.(2) The percentage changes after adjustment are changes from the results of Cybernet Group for the
fiscal year ended March 31, calculated by converting the accounting period in accordance with the period of the results forecast for the next fiscal year.
(3) FY2013 currency hedge status: 21.2% of product cost that is in foreign currency are reservedapproximatelyJPY80/USD average.
Result forecast
Millions of yenFull year
FY2012 FY2013F FY2012 FY2013FDifference Difference
Net sales 6,315 6,606 104.6% 11,746 9,298 6.8%Gross profit 2,606 2,718 104.3% 4,785 3,757 7.2%
Ratio 41.3% 41.1% ( 0.1P) 40.7% 40.4% + 0.1POperating income 628 633 100.7% 934 644 17.5%
Ratio 10.0% 9.6% ( 0.4P) 8.0% 6.9% + 0.6POrdinary income 642 643 100.1% 1,062 659 7.6%
Ratio 10.2% 9.7% ( 0.4P) 9.0% 7.1% + 0.0PNet income 391 392 100.2% 652 393 8.6%
Ratio 6.2% 5.9% ( 0.3P) 5.6% 4.2% + 0.1P
Adjustment
First Half-yearY-o-Y

© 2013 CYBERNET SYSTEMS CO.,LTD. All Rights Reserved.32
85.2%1,220.98
1,040
Annualdividends
FY2012 FY2013(Forecast)
137.0%--Equity ratio
759.09--Net income per share
1,040520520 Dividend per share
Annualdividends
Year-enddividends
Interimdividends
Yen
Forecasted Dividends for FY2013
[Reference]Number of shares outstanding at end of period (including treasury stock) : 324,000Number of treasury stock at end of period : 12,417

Reference
© 2013 CYBERNET SYSTEMS CO.,LTD. All Rights Reserved.34
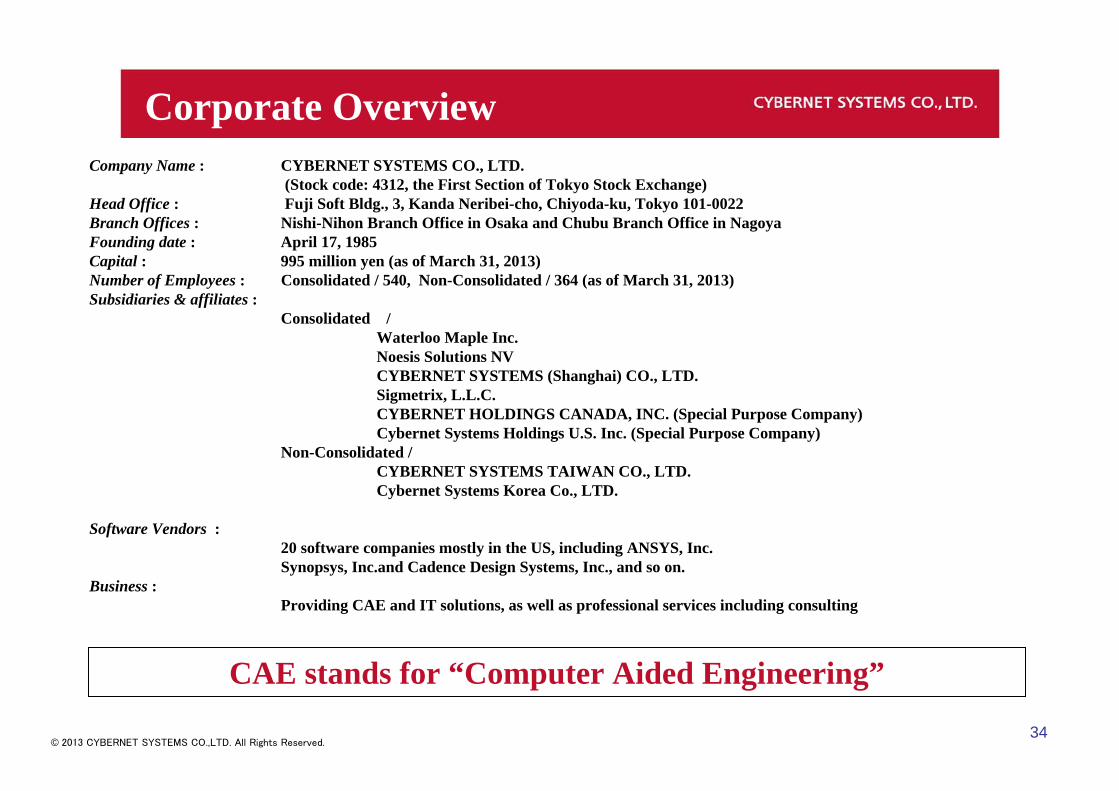
Company Name : CYBERNET SYSTEMS CO., LTD. (Stock code: 4312, the First Section of Tokyo Stock Exchange)
Head Office : Fuji Soft Bldg., 3, Kanda Neribei-cho, Chiyoda-ku, Tokyo 101-0022Branch Offices : Nishi-Nihon Branch Office in Osaka and Chubu Branch Office in Nagoya Founding date : April 17, 1985 Capital : 995 million yen (as of March 31, 2013)Number of Employees : Consolidated / 540, Non-Consolidated / 364 (as of March 31, 2013)Subsidiaries & affiliates :
Consolidated / Waterloo Maple Inc.Noesis Solutions NVCYBERNET SYSTEMS (Shanghai) CO., LTD. Sigmetrix, L.L.C.CYBERNET HOLDINGS CANADA, INC. (Special Purpose Company)Cybernet Systems Holdings U.S. Inc. (Special Purpose Company)
Non-Consolidated / CYBERNET SYSTEMS TAIWAN CO., LTD.Cybernet Systems Korea Co., LTD.
Software Vendors : 20 software companies mostly in the US, including ANSYS, Inc. Synopsys, Inc.and Cadence Design Systems, Inc., and so on.
Business : Providing CAE and IT solutions, as well as professional services including consulting
CAE stands for “Computer Aided Engineering”
Corporate Overview
© 2013 CYBERNET SYSTEMS CO.,LTD. All Rights Reserved.35
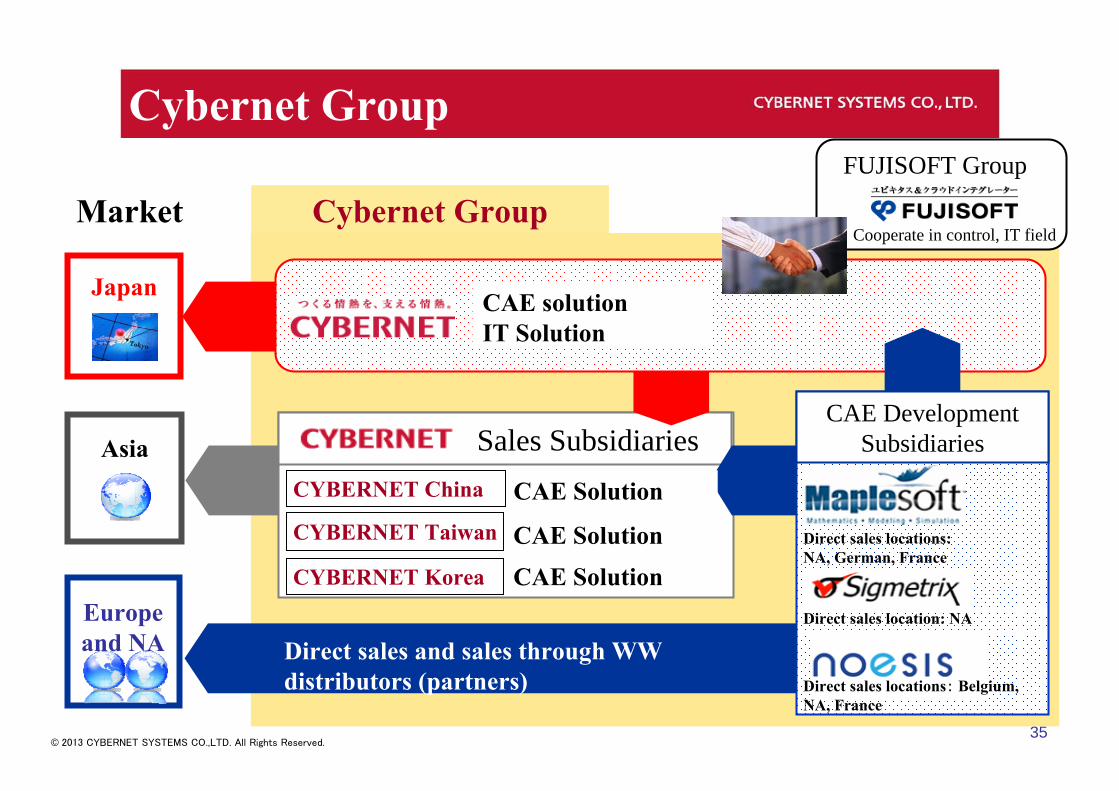
Cybernet Group
Japan
Asia
CAE solutionIT Solution
MarketCooperate in control, IT field
FUJISOFT Group
CAE Solution
CAE Development SubsidiariesSales Subsidiaries
Cybernet Group
Europe and NA
CYBERNET China
CYBERNET Taiwan
Direct sales and sales through WW distributors (partners)
CAE Solution
CYBERNET Korea CAE Solution
Direct sales locations: NA, German, France
Direct sales location: NA
Direct sales locations: Belgium, NA, France
© 2013 CYBERNET SYSTEMS CO.,LTD. All Rights Reserved.36
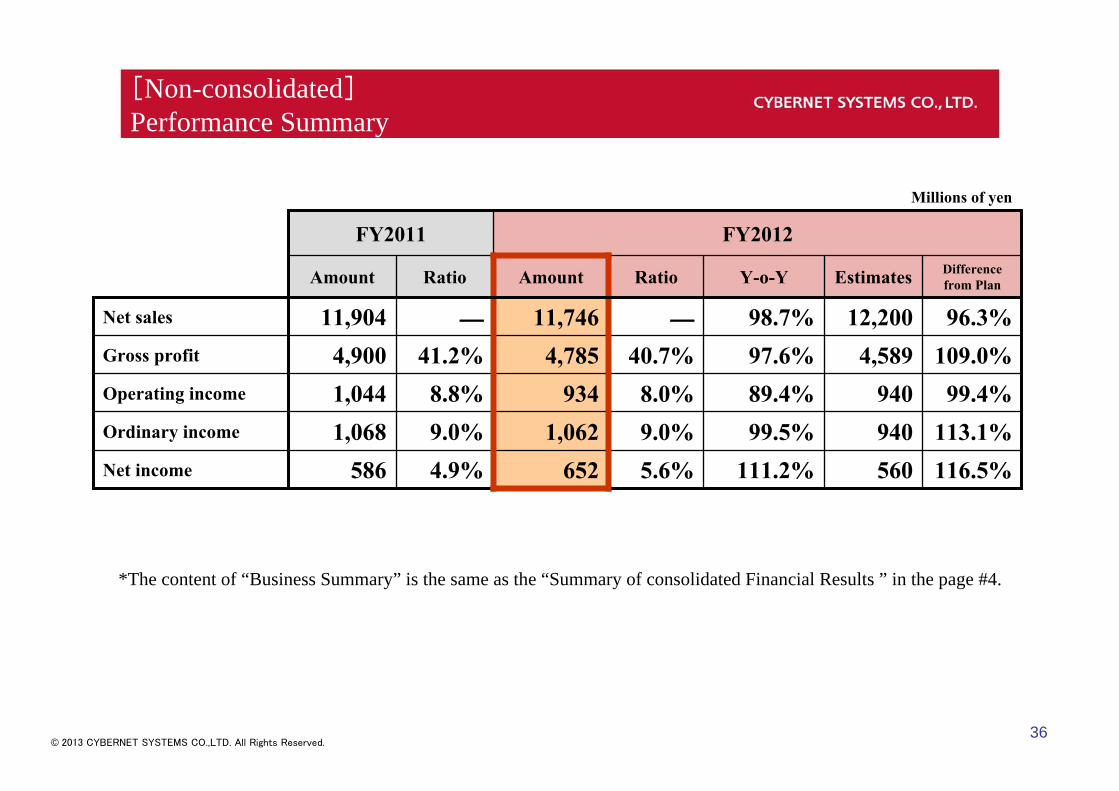
116.5%560111.2%5.6%6524.9%586Net income
113.1%94099.5%9.0%1,0629.0%1,068Ordinary income
99.4%94089.4%8.0%9348.8%1,044Operating income
109.0%4,58997.6%40.7%4,78541.2%4,900Gross profit
96.3%12,20098.7%―11,746―11,904Net sales
Difference from PlanEstimatesY-o-YRatioAmountRatioAmount
FY2012FY2011
Millions of yen
[Non-consolidated]Performance Summary
*The content of “Business Summary” is the same as the “Summary of consolidated Financial Results ” in the page #4.
© 2013 CYBERNET SYSTEMS CO.,LTD. All Rights Reserved.37
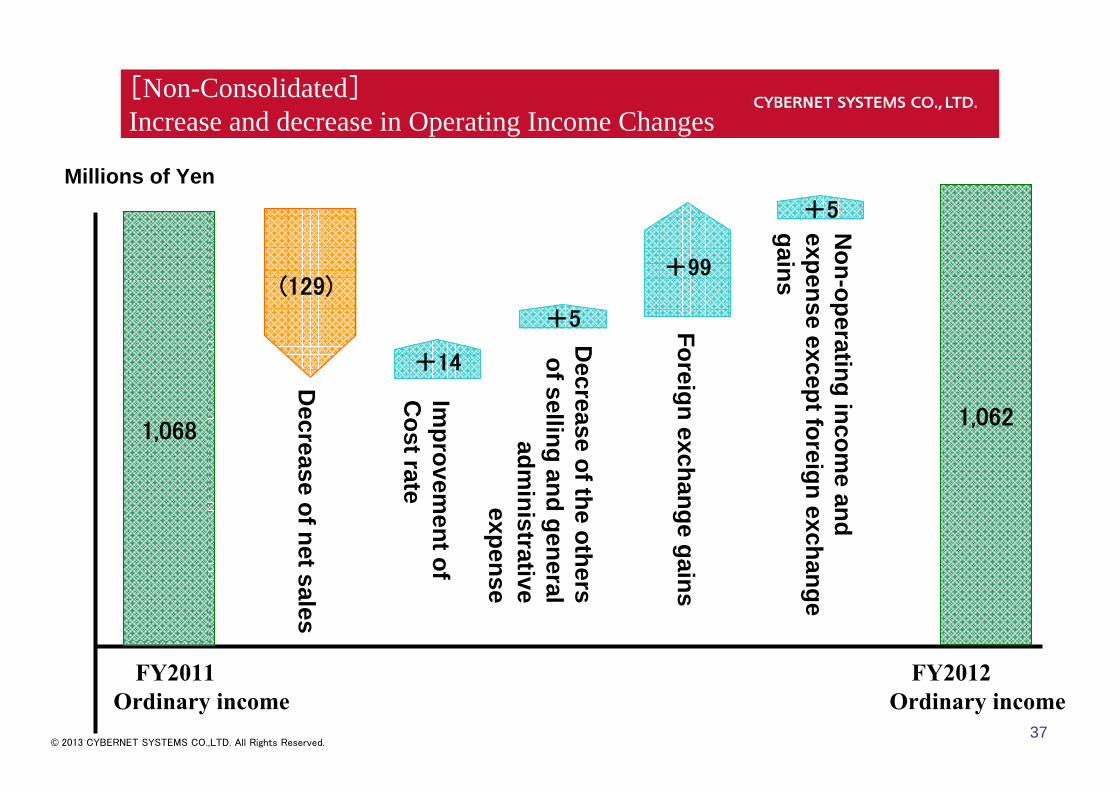
[Non-Consolidated]Increase and decrease in Operating Income Changes
1,0681,062
(129)
Foreign exchange gains
Decrease of net sales
Non-operating incom
e and expense except foreign exchange gains
Decrease of the others of selling and general
administrative
expense
FY2011 Ordinary income
FY2012 Ordinary income
Millions of Yen
+14
Improvem
ent of C
ost rate
+5
+99
+5

© 2013 CYBERNET SYSTEMS CO.,LTD. All Rights Reserved.38
135.1%23787.3%8.5%32110.5%367Net income
138.3%38393.9%14.1%53016.1%564Ordinary income
135.7%38392.0%13.8%52016.1%565Operating income
114.9%1,337103.0%40.8%1,53742.6%1,492Gross profit
106.5%3,539107.4%―3,768―3,507Net sales
Difference from PlanEstimatesY-o-YRatioAmountRatioAmount
FY2012 1Q(4-6)FY2011 1Q(4-6)
Millions of yen
[Non-consolidated]Performance Summary
72.8%9648.1%2.7%695.4%145Net income
70.7%15743.1%4.4%1119.5%259Ordinary income
68.5%15737.0%4.2%10810.8%292Operating income
104.9%1,02092.6%42.0%1,06942.5%1,155Gross profit
92.9%2,74293.7%―2,547―2,718Net sales
Difference from PlanEstimatesY-o-YRatioAmountRatioAmount
FY2012 2Q(7-9)FY2011 2Q(7-9)
Millions of yen
FY2012(4-6)
FY2012(7-9)
© 2013 CYBERNET SYSTEMS CO.,LTD. All Rights Reserved.39
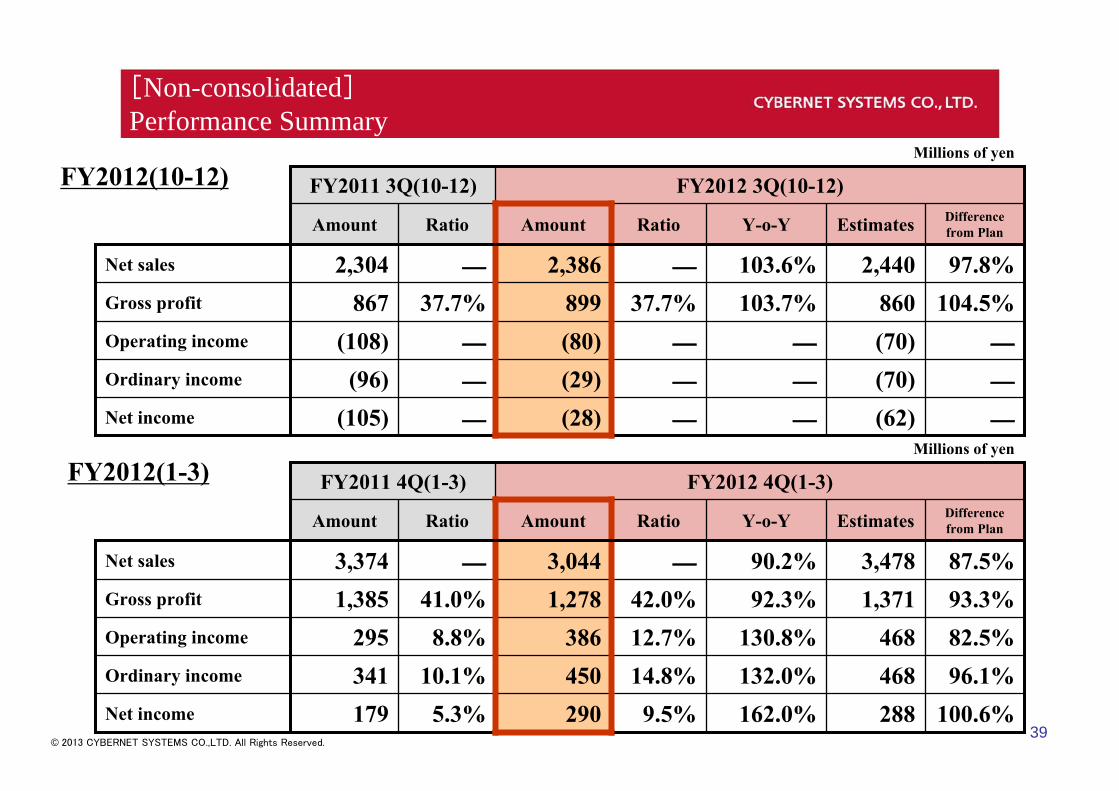
―(62)――(28)―(105)Net income
―(70)――(29)―(96)Ordinary income
―(70)――(80)―(108)Operating income
104.5%860103.7%37.7%89937.7%867Gross profit
97.8%2,440103.6%―2,386―2,304Net sales
Difference from PlanEstimatesY-o-YRatioAmountRatioAmount
FY2012 3Q(10-12)FY2011 3Q(10-12)
Millions of yen
[Non-consolidated]Performance Summary
FY2012(10-12)
100.6%288162.0%9.5%2905.3%179Net income
96.1%468132.0%14.8%45010.1%341Ordinary income
82.5%468130.8%12.7%3868.8%295Operating income
93.3%1,37192.3%42.0%1,27841.0%1,385Gross profit
87.5%3,47890.2%―3,044―3,374Net sales
Difference from PlanEstimatesY-o-YRatioAmountRatioAmount
FY2012 4Q(1-3)FY2011 4Q(1-3)
Millions of yen
FY2012(1-3)
© 2013 CYBERNET SYSTEMS CO.,LTD. All Rights Reserved.40
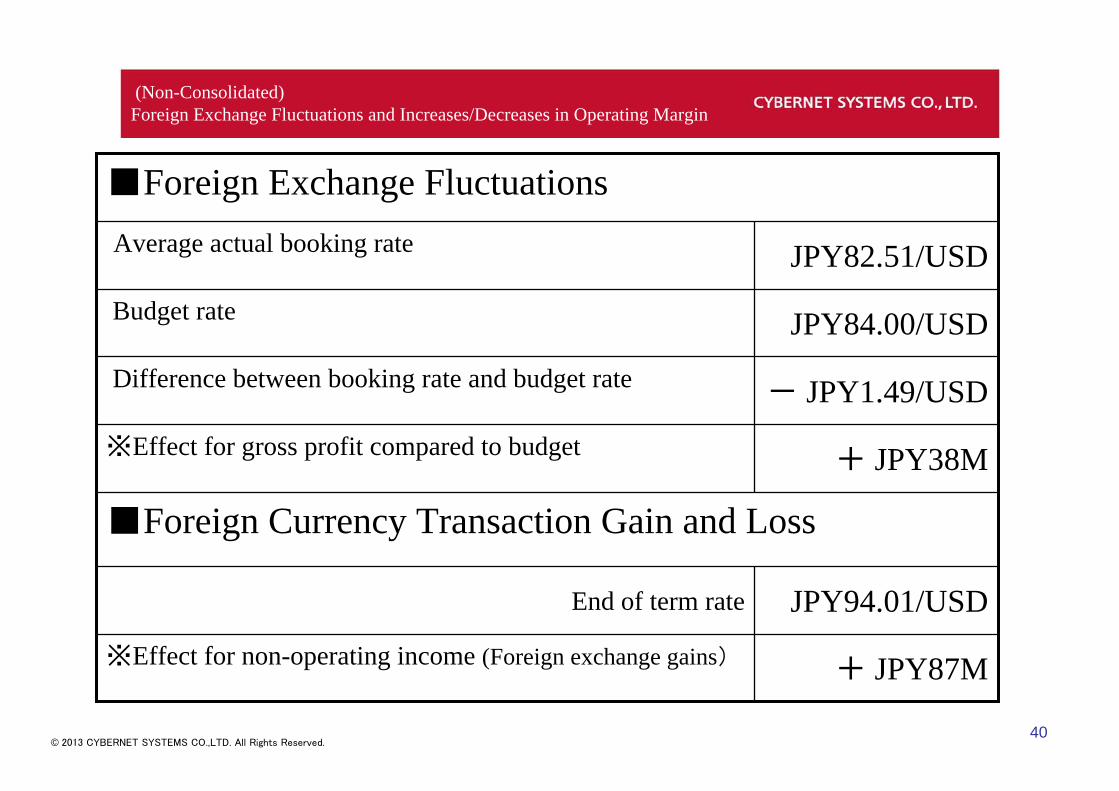
(Non-Consolidated) Foreign Exchange Fluctuations and Increases/Decreases in Operating Margin
+ JPY87M※Effect for non-operating income (Foreign exchange gains)
JPY94.01/USDEnd of term rate
■Foreign Currency Transaction Gain and Loss
+ JPY38M ※Effect for gross profit compared to budget
- JPY1.49/USDDifference between booking rate and budget rate
JPY84.00/USDBudget rate
JPY82.51/USDAverage actual booking rate
■Foreign Exchange Fluctuations
■ Public Relations DepartmentAddress: Fuji Soft Bldg., 3, Kanda Neribei-cho, Chiyoda-ku, Tokyo 101-0022, JapanTEL.: +81-3-5297-3066FAX.: +81-3-5297-3609E-mail: [email protected]: http://www.cybernet.co.jp
These materials are prepared for the sole purpose of providing information as a reference to investors in making investment decisions, and are not intended as a solicitation for investment. These materials were created from data obtained through our operations. We make no guarantees, however, with respect to integrity. In addition, the opinions and predictions provided in these materials relate to the Company’s outlook at the time the materials were prepared. No guarantees whatsoever extend to any outcomes over the use of such opinions or predictions.The contents of these materials are subject to change without notice. Investors are requested to use their own judgment in making any final decisions regarding investments.