consolidated financial report for the second quarter of
TRANSCRIPT

Nihon Unisys, Ltd.Stock Listing: Tokyo Stock Exchange 1st SectionStock Code:URL: https://www.unisys.co.jp/Representative: Akiyoshi Hiraoka, Representative Director, President & CEOScheduled Submission Date for Quarterly Report: November 12 , 2020Scheduled Starting Date for Dividend Payment: December 4 , 2020Earnings Supplementary Explanatory Documents: yesEarnings Results Briefing: yes (for institutional investors, analysts and press)
1. Consolidated Financial Results for FY2021 Q2(from April 1, 2020 to September 30, 2020)
(1) Consolidated Results of Operations (Percentage below represents increase (decrease) from the same period of previous year)
(Note) Comprehensive Income FY2021 Q2: 8,572 Million Yen ( 11.4 % ) FY2020 Q2: 7,692 Million Yen ( 10.2 %)
(2) Consolidated Financial Position
(Reference) Shareholders’ Equity FY2021 Q2: 125,388 Million Yen FY2020: 120,473 Million Yen
2. Dividends
(Note) Revisions to the latest forecast of dividends: No
3. Consolidated Earnings Forecast for FY2021 (from April 1, 2020 to March 31, 2021)(Percentage below represents increase (decrease) from previous year)
(Note) Revisions to the latest forecast of consolidated earnings: No
Operating Income
% YenMillions of Yen Millions of Yen Millions of Yen Millions of Yen% % %
Earnings Per ShareNet Sales
35.00
Profit Attributable toOwners of Parent
70.00
―
Ordinary Income
35.00
―
FY2020FY2021FY2021
(Forecast)
211,307214,975
127,451122,598
Shareholders’ Equity Ratio%
59.3%56.0%
70.00Yen Yen Yen
― 32.50 ― 37.50YenYen
Dividends Per Share
End of Q1 End of Q2 End of Q3 Year-end Total
75.1278.74
FY2020
Yen
Total Assets
FY2021 Q2Millions of Yen Millions of Yen
Net Assets
FY2021 Q2FY2020 Q2
Earnings Per Share Diluted Earnings Per ShareYen
75.3879.01
144,571 (1.1)36.5149,726
%
(3.4)11.9 11,020 35.8
11,53311,656
Millions of Yen %%
28.1
Millions of Yen %Millions of Yen
11,567 (4.6)
Note) This is an English translation of summarized consolidated financial results prepared for readers' convenience.Should there be any inconsistency between the translation and the original Japanese text, the latter shall prevail.
Consolidated Financial Reportfor the Second Quarter of Fiscal Year Ending March 31, 2021 [Japan GAAP]
Net Sales Operating Income Ordinary IncomeProfit Attributable to
Owners of Parent
November 6, 2020
8056
Millions of Yen
7,5667,928
5.0FY2021 Q2FY2020 Q2
FY2021 169.38(6.5)17,000(3.8)25,600(0.5)26,0002.7320,000
(Amounts are rounded down to the nearest million yen.)

* Notes
(1) Change in the scope of consolidation (change of condition of significant consolidated subsidiaries) during this quarterly period: YesNewly consolidated company : CVCF2 Investment Limited Partnership
(2) Adoption of special accounting methods for preparation of quarterly consolidated financial statements: No
(3) Changes in accounting policies, changes in accounting estimates and restatement of corrections
1. Changes in accounting policies in association with revision in accounting standards: No
2. Other changes in accounting policies: No
3. Changes in accounting estimates: No
4. Restatement of corrections: No
(4) Number of shares outstanding (common stock) (shares)
*Comment regarding appropriate usage of earnings forecast, and other special notes
3. Average number of shares outstanding during the period
The forward-looking statements such as earnings forecasts contained in this document are based on the information currentlyavailable to the Company and certain assumptions which are regarded as legitimate. The Company makes no warranty as to theachievability of what is described in the statements. Actual results may differ from these forecasts due to various factors.
100,351,203
*This consolidated financial report is not subject to quarterly review procedures.
FY2020 Q2FY2021 Q2 100,369,371
1. Number of shares outstanding at the end of the period (including treasury stock)
2. Number of shares of treasury stock at the end of the period
109,663,524
9,295,807
FY2020
FY2020
FY2021 Q2 109,663,524
FY2021 Q2 9,290,432
(Appendix) Contents 1.Results of Business Operations and Financial Condition ........................................................... 2
(1) Analysis of Business Operations ......................................................................................... 2
(2) Analysis of Financial Condition .......................................................................................... 5
(3) Comments on the Consolidated Earnings Forecasts and Other Forecasts .......................... 6
2.Consolidated Financial Statements ............................................................................................. 7
(1) Consolidated Balance Sheets .............................................................................................. 7
(2) Consolidated Statements of Income and Statements of Comprehensive Income ............... 9
(Consolidated Statements of Income) ................................................................................ 9
(Consolidated Statements of Comprehensive Income) ...................................................... 10
(3) Consolidated Statements of Cash Flows ............................................................................. 11
(4) Notes concerning the Consolidated Financial Statements .................................................. 12
(Notes on Going Concern Assumption) ............................................................................ 12
(Notes on Significant Changes in Shareholders’ Equity) .................................................. 12
1

1. Results of Business Operations and Financial Conditions
(1) Analysis of Business Operations
During the past six months of the fiscal year ending March 2021, the Japanese economy has been
continuously put in a difficult situation where it suffers the long-term impacts of COVID-19 pandemic. Although
we have seen economic activities resumed in many places, we think that the economic prospects remain uncertain
due to the situations of COVID-19 infectious disease at home and abroad as well as fluctuations in the financial
and capital market.
We have seen that companies are forced to postpone ICT investments under the current circumstances
where it may be long before the pandemic fades away. The landscape of the domestic information services market
is thus impacted. We know that we are operating in a difficult environment.
Against this background, the Nihon Unisys group has made continuous efforts about key issues indicated
in its mid-term management plan ‘Foresight in sight® 2020 ‘(FY2018-FY2020), as a ‘corporate group resolving
social issues through socially beneficial services capable of creating a more affluent society together with customers
and business partners’. The group aims to be at the center of the creation of business ecosystems that connect various
companies across conventional boundaries of industry and business sector. It also aims to provide platforms capable
of digital transformation Note 1.
Net sales in the Focal Area significantly increased by 46.9% from the same period of the previous fiscal
year, although the ICT Core businesses were negatively impacted by product sales situations as well as reduced or
postponed investments in small and medium-sized projects.
We saw customers continuously show a stronger interest in investments related to digital transformation (DX) in
the second quarter than in the first quarter. We have continuously received many inquiries. The net sales have
been increasing towards achieving the full-year target value of the Focal Area faster than the same period of the
previous fiscal year.
The Focal Area business growth is on track. The growth is ascribable to DX businesses such as: our
existing service to strengthen customer interactions at financial institutions; service to transform retail real shop
businesses through an electronic shelf label solution; and solutions to help accelerate workstyle reforms and
digitalization in the field of education in response to the pandemic.
Our electronic shell label solution has been gradually implemented at major mass retailers. An integrated
processing system enables customers to immediately reflect prices and label designs as they intend. The solution
contributes to significantly reducing time at the shops for changing shelf labels in accordance with seasonally
resetting racks and shelves. Our integrated processing service to change price tags in real time also helps the mass
retailers become further competitive.
Our fee-for-services business related to inbound tourism and carsharing has continued to suffer the
pandemic impact. However, our Japanese QR code/bar code settlement service made up for the decrease in the
international settlement service. The entire QR code/bar code settlement service is at the same level as the same
2

period of the previous fiscal year. The transaction volume of our digital code service has also been solid, with a
spreading use of digital money and digital coupons.
The robustness of our dashcam (EDR) service, energy management service, and storage service was conducive to
an increase in the fee-for-service business sales. Furthermore, our value card business has been picking up through
consumption from staying at home, and drove the fee-for-service business sales.
The entire society has been striving to know how to balance attempts to prevent a further spread of the
COVID-19 pandemic and economic activities in the second quarter. The Company significantly improved both
orders and order backlogs compared with the first quarter of the fiscal year under review. Orders were ¥141.7
billion, an increase of 2.5% from the second quarter of the previous fiscal year. Order backlogs were ¥227.8
billion, an increase of 5.9%.
The backlog of orders was larger from the same quarter of the previous fiscal year. It means that the Company
obtained projects to enable a further growth under the pandemic. Also, the order backlogs to be posted as net sales
within the fiscal year under review has recovered to the same level as the second quarter of the previous fiscal
year.
We will continuously aim to obtain further DX businesses in the retail sector of the Focal Area and also in
response to the GIGA School Program Note 2.
We have received orders for several new projects and renewal projects such as those to upgrade
mission-critical systems from the retail sector. The sector is indispensable for consumers living daily lives in the
pandemic-ridden circumstances. Thus, we expect the business field to lead our performance in the second half.
Furthermore, we have seen an increase in orders for DX projects such as an AI-driven automatic ordering service
to help retailers to transform shop operations.
‘AI-Order Foresight TM’, an AI-driven automatic ordering service based on demand forecasts uses various types of
data such as sales records and meteorological information. The solution can automatically calculate optimum
order quantities. The service contributes to reducing losses of opportunities and wastes at shops through
operations without depending on employees’ experiences and skills. We will steadily promote and expand
projects to help the customers implement digital transformation in the future.
We launched ‘BE+CAUS TM’, social action platform where social contributions can be made through
daily shopping, as part of our sustainability Note 3 initiatives. We would like to create big movements to achieve
SDGs in response to a rising awareness of solving social issues, through the platform where we entice various
stakeholders such as retailers to mutually cooperate and work on solving social issues.
Also, our attempts to reduce food loss & waste have been made through the aforementioned ‘AI-Order
Foresight’ service. This contributes to solving an environmental issue of food loss & waste by reducing an
excessive inventory of supply chains.
Furthermore, we have taken measures to reduce CO2 in response to climate changes. We further
enhanced our efforts to spread environmental value trading partly through non-fossil fuel energy certificate. We
established the Group’s ‘Long-term Environmental Vision 2050’, and participated in RE100 Note 4. We aim to
enable a zero-emission society by 2050.
The Group will promote a sustainable management with the aim of solving social issues with various
stakeholders through our businesses, contributing to enabling a sustainable society envisioned for the future, and
3

enabling a sustainable growth of the Group.
(Notes)
1. Digital Transformation:
Companies transform themselves through the use of data and digital technologies in an attempt to enable agile
responses to needs of customers and needs of society. Such a transformation in light of products, services, and
business models, as well as businesses, organizations, processes, and corporate culture helps companies establish
and strengthen competitive edges to cope with drastic changes in a business environment.
2. GIGA School Program:
Initiative of the Ministry of Education, Culture, Sports, Science and Technology to aim to enable education where
creativity is promoted through digitalization optimized for diverse individual children.
The initiative is implemented by promoting cloud-computing on the basis of developing in an integrated fashion
PCs and a high-speed large-capacity communications network for individual students.
3. Sustainability:
Sustainability means to maintain favorable conditions for the natural environment and human societies without
losing functions and systems for a long period of time.
The Nihon Unisys Group aims to become a sustainable company by sincerely working on issues of the
environment and society in order to contribute to enabling a sustainable social development, pursuant to the
corporate principle. The Group thus aims as “a corporate group solving social issues through socially beneficial
services capable of creating a more affluent society together with customers and partners”.
4. RE100:
Global initiative to support companies committed to using 100% renewable power in order to operate their
business
5. Names of companies or products herein described are trademarks or registered trademarks of their respective
organizations.
For the second quarter, net sales were ¥144,571 million (a 3.4% decrease compared with the same period
of the previous fiscal year) mainly due to a decrease in the net sales of system services as well as software &
hardware sales partly impacted by the COVID-19 pandemic, despite an increase in outsourcing services.
Despite an increase in R&D costs for creating new businesses, we posted operating income ¥11,567
million (an increase of 5.0% compared with the same period of the previous fiscal year), owing to an improved
profitability and a decrease in general expenses. Ordinary income was ¥11,533 million (a decrease of 1.1%)
reflecting a decrease in gain on provision for contingent loss and dividend income. Profit attributable to owners of
parent was ¥7,566 million (a decrease of 4.6%).
4

(2) Analysis of Financial Condition
In the first six months, total assets were ¥211,307 million, a decrease of ¥3,668 million compared with
the end of the previous fiscal year. This is partly attributable to a decrease in accounts receivable-trade.
Liabilities were ¥ 83,855 million, a ¥8,521 million decrease from the end of the previous fiscal year,
partly due to a decrease in accounts payable-trade and interest-bearing debt.
Net assets were ¥127,451 million. Shareholders’ equity ratio was 59.3%, up by 3.3 percentage points
from the end of previous fiscal year.
(Cash Flows)
Cash and cash equivalents at the end of the six-month period under review were ¥ 39,869 million, up by
¥ 6,582 million compared with the end of the previous fiscal year. See below the situations of cash flows for the
period under review and the factors concerned.
(Cash flows from operating activities)
Net cash provided by operating activities totaled ¥ 18,091 million (an increase of ¥ 5,487 million in
proceeds from the corresponding period of the previous fiscal year). This reflects proceeds of ¥ 11,064 million in
profit before income taxes (down by ¥ 265 million from the said period of the previous fiscal year), the elements
of increasing the proceeds and the elements of decreasing the proceeds. The elements of increasing the proceeds
include a ¥11,956 million decrease in notes and accounts receivable-trade and non-cash expenses of ¥ 5,325
million in depreciation and amortization. The elements of decreasing the proceeds include a decrease of ¥2,183
million in notes and accounts payable-trade.
(Cash flows from investing activities)
Net cash spent in investing activities was ¥ 5,001 million (a decrease of ¥ 267 million in expenditures
compared with the corresponding period of the previous fiscal year).
This includes expenditures of ¥ 1,223 million due to the acquisition of property, plant and equipment
such as computers for business activities (a decrease of ¥ 243 million in expenditures compared with the same
period of the previous fiscal year), expenditures of ¥ 3,180 million due to the acquisitions of intangible assets such
as investments in software for outsourcing (an increase of ¥ 544 million in expenditures), expenditures of ¥ 746
million as a result of purchasing investment securities* (a decrease of ¥ 14 million in expenditures).
* Investment securities were purchased mainly for fund investments and operating a fund established by a CVC,
our subsidiary company. The investment activities were performed for the purposes of strengthening and
expanding the Focal Areas described in the mid-term management plan.
(Cash flows from financing activities)
Net cash spent in the financing activities was ¥6,498 million (an increase of ¥ 292 million in
expenditures compared with the corresponding period of the previous fiscal year).
This reflects expenditures of ¥ 2,202 million as a result of repayment of long-term borrowings (a
decrease of ¥ 75 million in expenditures from the same period of the previous fiscal year) and the amount of paid
dividends, ¥ 3,764 million (an increase in expenditures of ¥ 756 million).
5
(3) Comments on the Consolidated Earnings Forecasts and Other Forecasts
The performance forecasts on a consolidated basis have not been revised since they were announced on
May 18, 2020.
6

2. Consolidated Financial Statements
(1) Consolidated Balance Sheets
Millions of Yen
FY2020 FY2021 Q2(As of March 31, 2020) (As of September 30, 2020)
Assets
Current assets
Cash and deposits 33,287 39,869
Notes and accounts receivable - trade 70,840 58,876
Merchandise and finished goods 7,443 6,714
Work in process 1,843 3,305
Raw materials and supplies 77 73
Other 19,825 20,129
Allowance for doubtful accounts (21) (54)
Total current assets 133,297 128,914
Non-current assets
Property, plant and equipment
Buildings and structures, net 3,764 3,682
Machinery, equipment and vehicles, net 6,414 5,933
Other, net 3,286 3,386
Total property, plant and equipment 13,465 13,002
Intangible assets
Goodwill 1,509 1,529
Software 18,711 18,642
Other 203 709
Total intangible assets 20,423 20,881
Investments and other assets
Investment securities 23,272 25,139
Deferred tax assets 3,818 2,287
Retirement benefit asset 4,357 5,288
Other 16,637 16,085
Allowance for doubtful accounts (296) (292)
Total investments and other assets 47,789 48,508
Total non-current assets 81,678 82,392
Total assets 214,975 211,307
7

Millions of Yen
FY2020 FY2021 Q2
(As of March 31, 2020) (As of September 30, 2020)
Liabilities
Current liabilities
Notes and accounts payable - trade 22,475 20,287
Current portion of long-term borrowings 5,617 4,555
Income taxes payable 4,654 1,465
Accrued expenses 10,905 9,260
Advances received 18,477 20,595
Provision for loss on contract development 708 545
Other provisions 846 1,038
Other 10,431 8,157
Total current liabilities 74,117 65,906
Non-current liabilities
Long-term borrowings 15,717 14,577
Provisions 94 47
Retirement benefit liability 651 671
Asset retirement obligations 1,128 1,169
Other 668 1,483
Total non-current liabilities 18,260 17,949
Total liabilities 92,377 83,855
Net assets
Shareholders' equity
Capital stock 5,483 5,483
Capital surplus 14,909 14,909
Retained earnings 109,795 113,607
Treasury shares (13,513) (13,505)
Total shareholders' equity 116,675 120,494
Accumulated other comprehensive income
Valuation difference on available-for-sale securities 4,886 6,183
Deferred gains or losses on hedges 0 0
Foreign currency translation adjustment (33) (62)
Remeasurements of defined benefit plans (1,056) (1,227)
Total accumulated other comprehensive income 3,798 4,893
Stock acquisition rights 491 505
Non-controlling interests 1,633 1,557
Total net assets 122,598 127,451
Total liabilities and net assets 214,975 211,307
8

(2) Consolidated Statements of Income and Consolidated Statements of Comprehensive Income
(Consolidated Statements of Income)
Millions of Yen
FY2020 Q2 FY2021 Q2
(Six months ended September 30, 2019)
(Six months ended September 30, 2020)
Net sales 149,726 144,571
Cost of sales 112,337 106,848
Gross profit 37,388 37,723
Selling, general and administrative expenses 26,368 26,155
Operating income 11,020 11,567
Non-operating income
Interest income 4 4
Dividend income 354 258
Other 474 81
Total non-operating income 833 345
Non-operating expenses
Interest expenses 36 51
Share of loss of entities accounted for using equity method 14 138
Loss on investments in partnership 62 131
Other 83 58
Total non-operating expenses 196 379
Ordinary income 11,656 11,533
Extraordinary income
Gain on sales of investment securities 33 8
Other 0 9
Total extraordinary income 34 18
Extraordinary losses
Loss on valuation of investment securities 68 470
Other 292 16
Total extraordinary losses 361 487
Profit before income taxes 11,329 11,064
Income taxes - current 2,704 2,536
Income taxes - deferred 713 1,044
Total income taxes 3,417 3,581
Profit 7,912 7,483
Profit (loss) attributable to non-controlling interests (16) (82)
Profit attributable to owners of parent 7,928 7,566
9
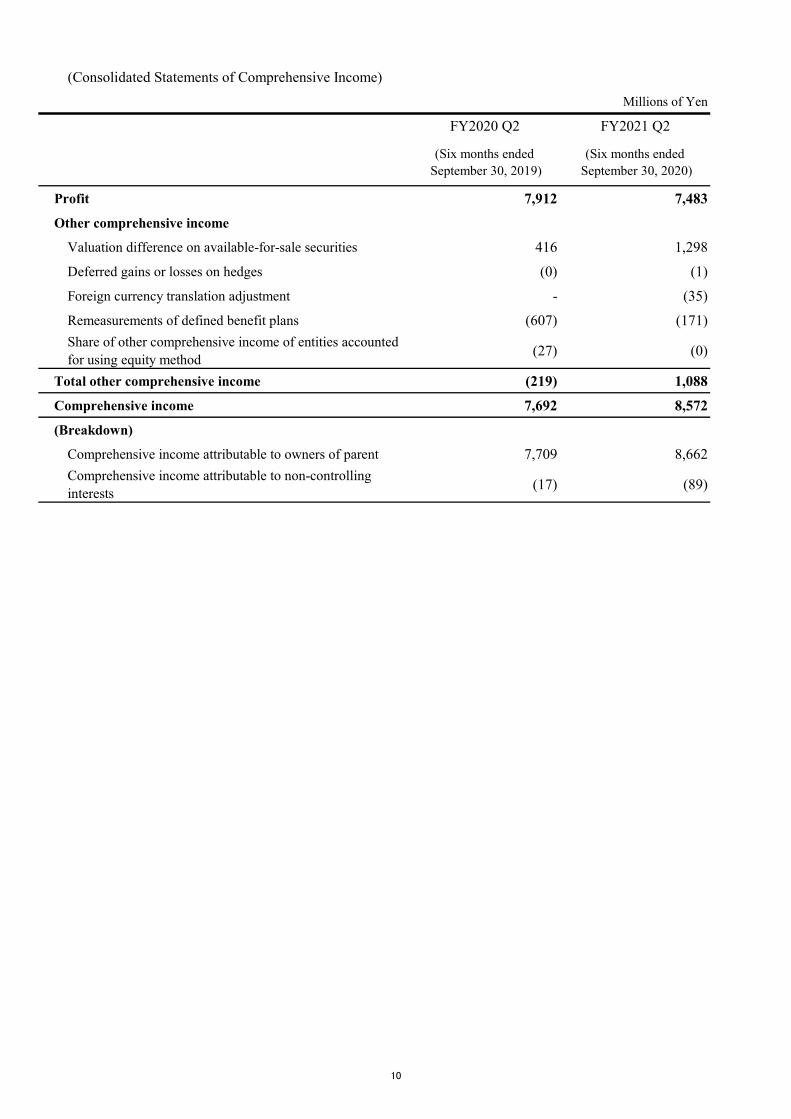
(Consolidated Statements of Comprehensive Income)
Millions of Yen
FY2020 Q2 FY2021 Q2
(Six months ended September 30, 2019)
(Six months ended September 30, 2020)
Profit 7,912 7,483
Other comprehensive income
Valuation difference on available-for-sale securities 416 1,298
Deferred gains or losses on hedges (0) (1)
Foreign currency translation adjustment - (35)
Remeasurements of defined benefit plans (607) (171)
Share of other comprehensive income of entities accountedfor using equity method
(27) (0)
Total other comprehensive income (219) 1,088
Comprehensive income 7,692 8,572
(Breakdown)
Comprehensive income attributable to owners of parent 7,709 8,662
Comprehensive income attributable to non-controllinginterests
(17) (89)
10

(3) Consolidated Statements of Cash Flows
Millions of Yen
FY2020 Q2 FY2021 Q2
(Six months ended September 30, 2019)
(Six months ended September 30, 2020)
Net cash provided by (used in) operating activities:Profit before income taxes 11,329 11,064Depreciation and amortization 5,436 5,325Impairment loss 284 -Amortization of goodwill 106 212Share of loss (profit) of entities accounted for using equity method 14 138Loss (gain) on sales of investment securities (31) (8)Loss (gain) on valuation of investment securities 68 470Increase (decrease) in provision for loss on contract development 64 (163)Increase (decrease) in other provisions (686) 174Increase (decrease) in retirement benefit liability 19 20Decrease (increase) in retirement benefit asset (948) (930)Increase (decrease) in remeasurements of defined benefit plans (875) (246)Interest and dividends income (358) (263)Interest expenses 36 51Decrease (increase) in notes and accounts receivable-trade 11,364 11,956Decrease (increase) in inventories (3,225) (728)Decrease (increase) in advances paid (763) 1,298Increase (decrease) in notes and accounts payable-trade (6,838) (2,183)Increase (decrease) in accrued expenses (404) (1,643)Other 1,011 (1,024)Subtotal 15,601 23,518Interest and dividends received 360 275Interest paid (37) (52)Income taxes (paid) refund (3,321) (5,650)Net cash provided by (used in) operating activities 12,603 18,091
Investing activities:Purchase of property, plant and equipment (1,466) (1,223)Purchase of intangible assets (2,635) (3,180)Purchase of investment securities (761) (746)Proceeds from sales of investment securities 70 12Purchase of shares of subsidiaries resulting in change in scope of consolidation (524) -Proceeds from purchase of shares of subsidiaries resulting in change in scope ofconsolidation - 146
Other 48 (11)Net cash provided by (used in) investing activities (5,269) (5,001)
Financing activities:Net increase (decrease) in short-term borrowings (1,050) -Proceeds from long-term borrowings 350 -Repayments of long-term borrowings (2,277) (2,202)Proceeds from sales and leasebacks 28 166Repayments of other borrowings (163) (320)Cash dividends paid (3,007) (3,764)Dividends paid to non-controlling interests (84) (96)Payments from changes in ownership interests in subsidiaries that do not result inchange in scope of consolidation - (281)
Other (1) (0)Net cash provided by (used in) financing activities (6,206) (6,498)
Effect of exchange rate change on cash and cash equivalents - (8)Net increase (decrease) in cash and cash equivalents 1,127 6,582Cash and cash equivalents at beginning of period 27,200 33,287Cash and cash equivalents at end of period 28,328 39,869
11
(4) Notes concerning the Quarterly Consolidated Financial Statements
(Notes on Going Concern Assumption)
Not applicable
(Notes on Significant Changes in Shareholders’ Equity)
Not applicable
12