ir presentation for second quarter, year ended march 2018 · ir presentation for second quarter,...
TRANSCRIPT

October, 2017
Ichiyoshi Securities Co., Ltd.
IR Presentation
for Second quarter, year ended March 2018
Stock Code:8624

Ⅰ: Business Results (Consolidated)
Operating revenue
12,401
Net operating
revenue11,699
Operating income
2,991
Current income
3,037
Net income attributable to
shareholders
of parent
company2,034
0
500
1,000
1,500
2,000
2,500
3,000
3,500
4,000
4,500
5,000
01503004506007509001,0501,2001,3501,5001,6501,8001,9502,1002,2502,4002,5502,7002,8503,0003,1503,3003,4503,6003,7503,9004,0504,2004,3504,5004,6504,8004,9505,1005,2505,4005,5505,7005,8506,0006,1506,3006,4506,6006,7506,9007,0507,2007,3507,5007,6507,8007,9508,1008,2508,4008,5508,7008,8509,0009,1509,3009,4509,6009,7509,90010,05010,20010,35010,50010,65010,80010,95011,10011,25011,40011,55011,70011,85012,00012,15012,30012,450
(JPY mil.)
1 April 2017 - 30 September 2017
FY 2016
2Q
FY 2017
2Q
Year-on-year
(%) Year-on-year
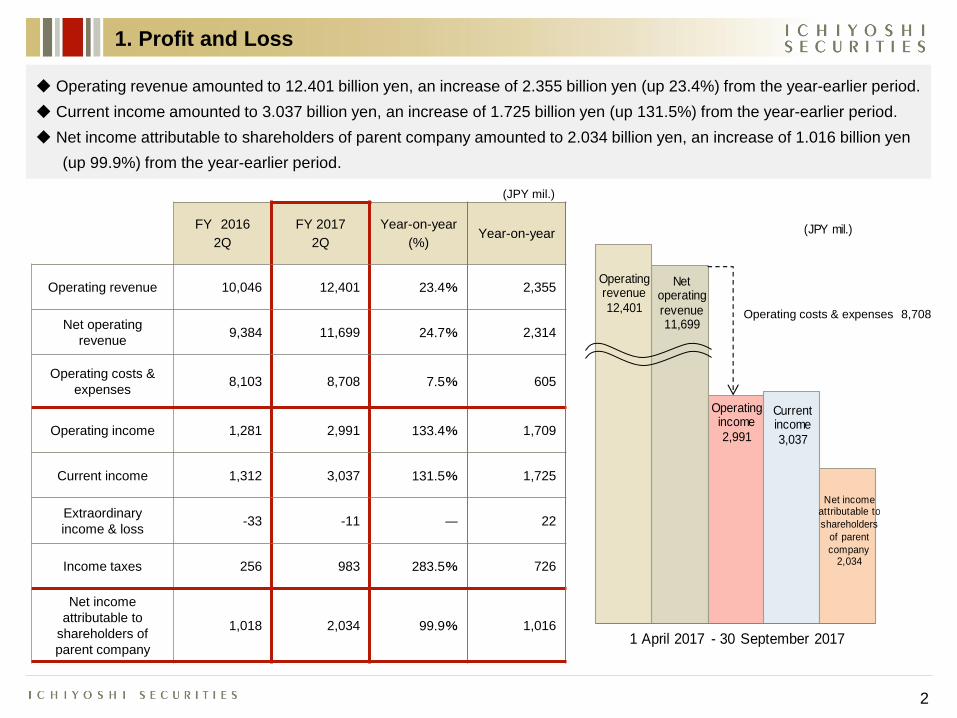
Operating revenue 10,046 12,401 23.4% 2,355
Net operating
revenue 9,384 11,699 24.7% 2,314
Operating costs &
expenses 8,103 8,708 7.5% 605
Operating income 1,281 2,991 133.4% 1,709
Current income 1,312 3,037 131.5% 1,725
Extraordinary
income & loss -33 -11 ― 22
Income taxes 256 983 283.5% 726
Net income
attributable to
shareholders of
parent company
1,018 2,034 99.9% 1,016
◆ Operating revenue amounted to 12.401 billion yen, an increase of 2.355 billion yen (up 23.4%) from the year-earlier period.
◆ Current income amounted to 3.037 billion yen, an increase of 1.725 billion yen (up 131.5%) from the year-earlier period.
◆ Net income attributable to shareholders of parent company amounted to 2.034 billion yen, an increase of 1.016 billion yen
(up 99.9%) from the year-earlier period.
Operating costs & expenses 8,708
1. Profit and Loss
2
(JPY mil.)

FY 2016
2Q
FY 2017
2Q
Year-on-year
(%) Year-on-year
Commission
revenue 9,162 11,472 25.2% 2,310
Gains on trading 86 68 -20.9% -18
Other operating
balance 51 59 15.7% 8
Interest &
dividend income 84 99 16.8% 14
Total 9,384 11,699 24.7% 2,314
◆ Commission revenue amounted to 11.472 billion yen, an increase of 2.31 billion yen (up 25.2%) from the year-earlier
period, as brokerage commissions on stocks swelled and etc.
◆ Gains on trading amounted to 68 million yen, a decrease of 18 million yen (down 20.9%) from the year-earlier period, as
trading on bonds, etc. slid.
(JPY mil.)
2. Breakdown of Net Operating Revenue
3
(JPY mil.)
9,162
11,472
0
5,000
10,000
15,000
2QFY 2016
2QFY 2017
Commission revenue
86
68
0
50
100
2Q
FY 2016
2Q
FY 2017
Gains on trading
51
59
30
40
50
60
70
2Q
FY 2016
2Q
FY 2017
84
99
50
100
2Q
FY 2016
2Q
FY 2017
Interest & dividend income Other operating balance
3,256
4,448
2,875
3,423 246
252 2,783
3,347 9,162
11,472
0
3,000
6,000
9,000
12,000
FY 2016 2Q FY 2017 2Q
Commissions from other sources
Underwriting
Distribution
Brokerage
3. Breakdown of Commission Revenue
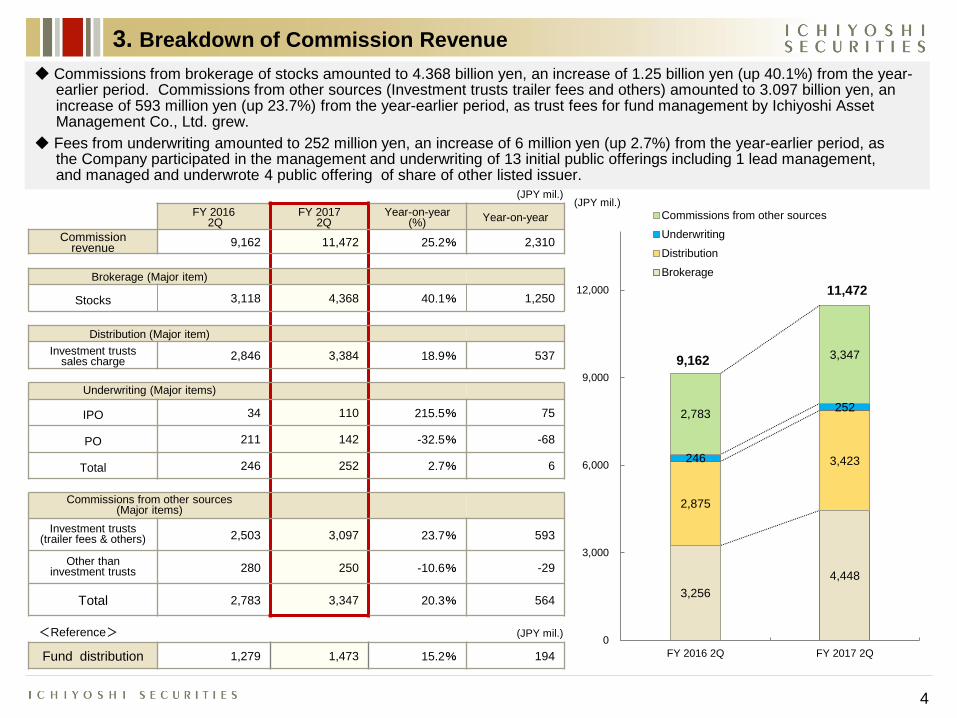
◆ Commissions from brokerage of stocks amounted to 4.368 billion yen, an increase of 1.25 billion yen (up 40.1%) from the year- earlier period. Commissions from other sources (Investment trusts trailer fees and others) amounted to 3.097 billion yen, an increase of 593 million yen (up 23.7%) from the year-earlier period, as trust fees for fund management by Ichiyoshi Asset Management Co., Ltd. grew. ◆ Fees from underwriting amounted to 252 million yen, an increase of 6 million yen (up 2.7%) from the year-earlier period, as the Company participated in the management and underwriting of 13 initial public offerings including 1 lead management, and managed and underwrote 4 public offering of share of other listed issuer.
(JPY mil.)
4
FY 2016 2Q
FY 2017 2Q
Year-on-year (%) Year-on-year
Commission revenue
9,162 11,472 25.2% 2,310
Brokerage (Major item)
Stocks 3,118 4,368 40.1% 1,250
Distribution (Major item)
Investment trusts sales charge
2,846 3,384 18.9% 537
Underwriting (Major items)
IPO 34 110 215.5% 75
PO 211 142 -32.5% -68
Total 246 252 2.7% 6
Commissions from other sources (Major items)
Investment trusts (trailer fees & others) 2,503 3,097 23.7% 593
Other than investment trusts 280 250 -10.6% -29
Total 2,783 3,347 20.3% 564
<Reference>
Fund distribution 1,279 1,473 15.2% 194
(JPY mil.)
(JPY mil.)

24 24
51
36
10
7
86
68
0
10
20
30
40
50
60
70
80
90
100
FY 2016 2Q FY 2017 2Q
Forex, etc. Bonds, etc. Stocks, etc.
4. Breakdown of Gains on Trading
FY 2016 2Q FY 2017 2Q Year-on-year
(%) Year-on-year
Stocks, etc. 24 24 -1.1% -0
Bonds・Forex, etc. 61 44 -28.7% -17
(Bonds, etc.) (51) (36) -29.8% -15
(Forex, etc.) (10) (7) -22.7% -2
Total 86 68 -20.9% -18
(JPY mil.)
◆ Gains on trading amounted to 68 million yen, a decrease of 18 million yen (down 20.9%) from the year-earlier period, as
trading on bonds slid and etc.
5
(JPY mil.)

(JPY mil.)
FY 2016 2Q FY 2017 2Q Year-on-year
(%) Year-on-year
Transaction related
expenses 800 878 9.8% 78
Personnel
expenses 4,609 4,986 8.2% 377
Property related
expenses 915 956 4.4% 40
Clerical expenses 1,137 1,178 3.7% 41
Depreciation 197 208 5.7% 11
Public charges 142 172 21.0% 30
Others 300 325 8.5% 25
Total 8,103 8,708 7.5% 605
<Reference> Fixed cost and Variable cost (FY 2017 2Q, non-consolidated basis)
Fixed cost 6,134
Variable cost 2,297
◆ Operating cost and expenses amounted to 8.78 billion yen, an increase of 605 million yen (up 7.5%) from the year-earlier
period, as personnel expenses and other items increased.
5. Operating Cost and Expenses
6
800 878
4,609 4,986
915
956
1,137
1,178 197
208 142
172 300
325 8,103
8,708
0
1,000
2,000
3,000
4,000
5,000
6,000
7,000
8,000
9,000
10,000
FY 2016 2Q FY 2017 2Q
Personnel expenses Property related expenses
Clerical expenses Depreciation
Public charges Others
(JPY mil.)
Transaction related expenses

6,173 6,109
47,533
60,376
0
10,000
20,000
30,000
40,000
50,000
60,000
70,000
FY 2016 FY 2017 2Q
Fixed assets
Current assets
33,099 34,627
20,607
31,858
0
10,000
20,000
30,000
40,000
50,000
60,000
70,000
FY 2016 FY 2017 2Q
Net w orth
Liabilities
6. Balance Sheets / Financial Results
7
FY 2017 2Q Year –on-year
Equity ratio
(%) 51.6 -9.5
Net worth per share (JPY) 804.62 35.44
Capital adequacy ratio
(non-consolidated basis)
(%)
606.8 14.9
Increase of segregated cash and statutory deposits, margin transaction assets and advance payments for subscriptions
66,485
53,706
53,706
66,485
Balance sheet Financial results
FY 2017 2Q Year-on-year
EPS (JPY) 47.71 24.11
ROE (%) 6.1 3.0
(JPY mil.) Total assets
Sum of liabilities and net worth
Decrease of land and
buildings
Increase of cash payable
to customers and margin
transaction liabilities
(JPY mil.)
Retained earnings
・Increase due to net income
・Decrease due to dividend
payments

Ⅱ: Business Circumstances

9
1,414 1,389 1,363 1,258 1,249 1,253 1,299 1,386 1,455 1,641
1,354 1,273 925
951 1,313
1,533 1,147
1,562 1,600
1,784
2,157
1,609
1,907
1,579
1,787 1,330 1,852
1,841
2,137
2,230
349
651 915
580
457
237
291
313
183
439
5,276
4,923 5,112
4,369
4,808
4,354
4,590
5,104
5,376
6,096
0
1,000
2,000
3,000
4,000
5,000
6,000
7,000
1Q FY 2015
2Q 3Q 4Q 1Q FY 2016
2Q 3Q 4Q 1Q FY 2017
2Q
Investment trusts (trailer fees and others)
Distribution
Brokerage
Underwriting and others
(JPY mil.)
1. Commission revenue

8,931 8,247 8,272 8,048 7,528 7,504 7,927 7,939 8,146 8,488
10,168
9,319 10,084
9,252
8,442 8,575
9,362 8,974 9,470
9,773
414
402
417
450
441 451
464 565
533 634
19,513
17,968
18,773
17,750
16,412 16,532
17,754 17,479 18,150
18,897
0
2,000
4,000
6,000
8,000
10,000
12,000
14,000
16,000
18,000
20,000
1Q FY 2015
2Q 3Q 4Q 1Q FY 2016
2Q 3Q 4Q 1Q FY 2017
2Q
Investment trusts Stocks Others
2. Customer Assets under Custody
(JPY 100 mil.)
10
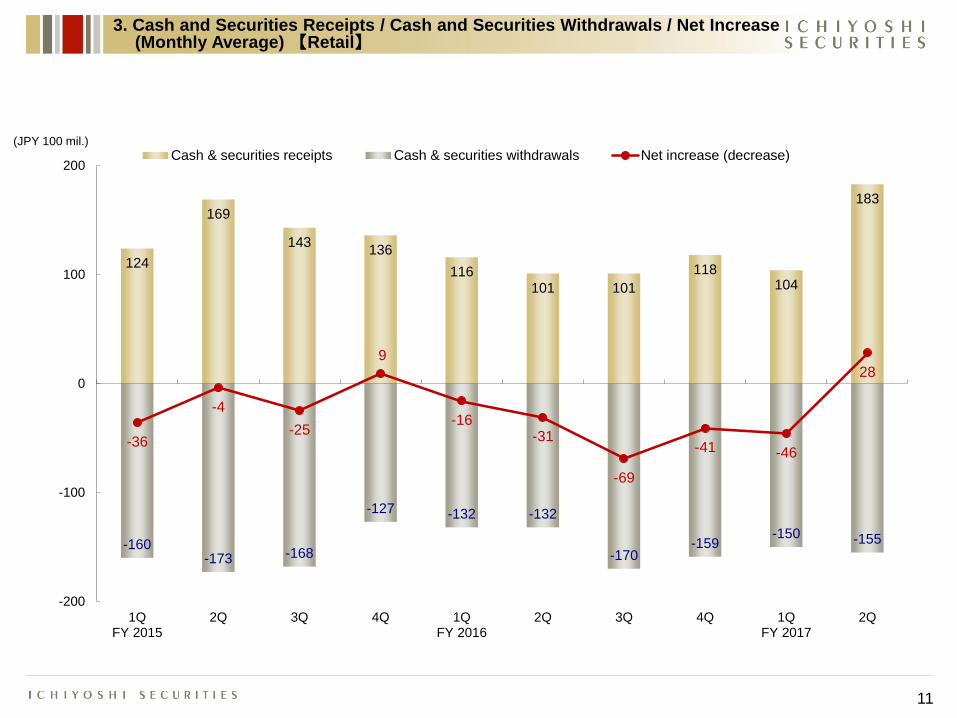
124
169
143 136
116 101 101
118 104
183
-160 -173 -168
-127 -132 -132
-170 -159
-150 -155
-36
-4
-25
9
-16 -31
-69
-41 -46
28
-200
-100
0
100
200
1QFY 2015
2Q 3Q 4Q 1QFY 2016
2Q 3Q 4Q 1QFY 2017
2Q
Cash & securities receipts Cash & securities withdrawals Net increase (decrease)(JPY 100 mil.)
3. Cash and Securities Receipts / Cash and Securities Withdrawals / Net Increase (Monthly Average) 【Retail】
11

(JPY 100 mil.)
4. Top 5 Best Selling Investment Trusts (Total Amounts of 3 Months)
12
FY 2015 FY 2016 FY 2017
1Q 2Q 3Q 4Q 1Q 2Q 3Q 4Q 1Q 2Q
Ichiyoshi Small-and mid -cap Growth Companies Fund 90 107 149 116 199 230
Ichiyoshi・Invesco World Small-and Mid -Cap Growth Companies Fund 98
LM Australia High Dividend Fund (Monthly dividend) 35 59 61 102 84 198 147
Nomura PIMCO World Income Strategy Fund (A・B・C・D) 45 52 53
LM US Dividend Increases for Consecutive Years Stock Fund (Semi-annual settlement, every three months settlement) 50 52
Ichiyoshi Japan High Dividend Stock & J- REIT Fund (Quarterly settlement, asset growth) 92 45
Shinko J-REIT Open 74 64 31 45
Fidelity US REIT Fund B - Non-hedged 44 146 148 28
BNY Mellon Global High Yield CB Fund 2016-04, 07, 11 67 50 37
Japan High Dividend Stock Fund 2016-12 Limited Additional Subscription Type / with early redemption clause 36
UBS Global CB Open 120 152 70 47
Pictet Global Income Stock Fund 37 56 43 35
LM Australia Monthly Distribution Fund 87 51 28 25
Pictet Emerging Country Income Stock Fund 64 36 25
Ichiyoshi Infrastructure Growth Stock Fund 92 32

5. Trend of Investment Trust Trailer Fee and its Cost Coverage
13
4,267 4,110 4,178 4,094 4,118
3,985 4,060 4,181
4,347 4,361
1,414 1,389 1,363 1,258 1,249 1,253 1,299
1,386 1,455 1,641
33.1%
33.8%
32.6%
30.7% 30.3%
31.4%
32.0%
33.1% 33.5%
37.6%
26%
28%
30%
32%
34%
36%
38%
0
500
1,000
1,500
2,000
2,500
3,000
3,500
4,000
4,500
5,000
1Q FY 2015
2Q 3Q 4Q 1Q FY 2016
2Q 3Q 4Q 1Q FY 2017
2Q
Cost (Left axis) Investment trust trailer fee and Wrap-account fee Cost coveradge (Right axis)
Investment trust trailer fee + Wrap-account fee
Cost (Operating cost & expenses) ※ Cost coverage ratio = X 100 (%)
(JPY mil.)

6. Number of Customer Accounts 【Retail】
14
166,641 166,913 167,144 166,340 166,049 165,228 164,870 163,383 161,983 161,645
38,943
35,401 36,528
34,633
32,262 32,418
34,229 33,919 34,606 35,262
0
10,000
20,000
30,000
40,000
50,000
0
20,000
40,000
60,000
80,000
100,000
120,000
140,000
160,000
180,000
200,000
1QFY 2015
2Q 3Q 4Q 1QFY 2016
2Q 3Q 4Q 1QFY 2017
2Q
Total no. of accounts of assets under custody
No. of accounts with more than JPY 10 mil. (right-hand scale)
(Accounts) (Accounts)

7. Number of New Customer Accounts and Ratio of Referrals 【Retail】
15
815
529
753
480
674 645
495 544
664
1,336
848
1,364
191 125 162
100 172 140
87 138 167
325 223 244
23.4% 23.6% 21.5% 20.8%
25.5% 21.7%
17.6%
25.4% 25.2% 24.3% 26.3%
17.9%
0
200
400
600
800
1,000
1,200
1,400
1,600
Oct.2016
Nov. Dec. Jan.2017
Feb. Mar. Apr. May Jun. Jul. Aug. Sep.
New customer accounts
Through referral
Ratio of referrals
(Accounts)

8. Accumulated Companies Lead- and Co-managed
16
951 955 970 980 984 993 1,002 1,013 1,017 1,027
35
39
41 42
44 44 44 45 45
46
0
10
20
30
40
50
60
0
200
400
600
800
1,000
1,200
1QFY 2015
2Q 3Q 4Q 1QFY 2016
2Q 3Q 4Q 1QFY 2017
2Q
Accumulated companies lead -and co-managed (left-hand scale)
Of which, number of accumulated companies lead-managed(right-hand scale)
(Companies) (Companies)

Ⅲ: Quarterly Transition

FY 2016 FY 2017 Quarter-on-
quarter Year-on-year
1Q 2Q 3Q 4Q 1Q 2Q
Operating revenue 5,273 4,772 5,053 5,614 5,866 6,535 11.4% 36.9%
Operating cost &
expenses 4,118 3,985 4,060 4,181 4,347 4,361 0.3% 9.4%
Current income 821 490 681 1,083 1,165 1,872 60.7% 281.7%
Extraordinary income 40 2 0 27 60 4 -92.0% 81.6%
Extraordinary loss 11 66 0 16 65 11 -82.3% -82.4%
Corporate tax 137 99 66 532 281 796 183.0% 702.6%
Tax adjustment 158 -139 177 -179 89 -184 ― ―
Net income attributable to
shareholders of parent company
552 465 433 731 785 1,249 58.9% 168.3%
1. Profit and Loss
(JPY mil.)
18
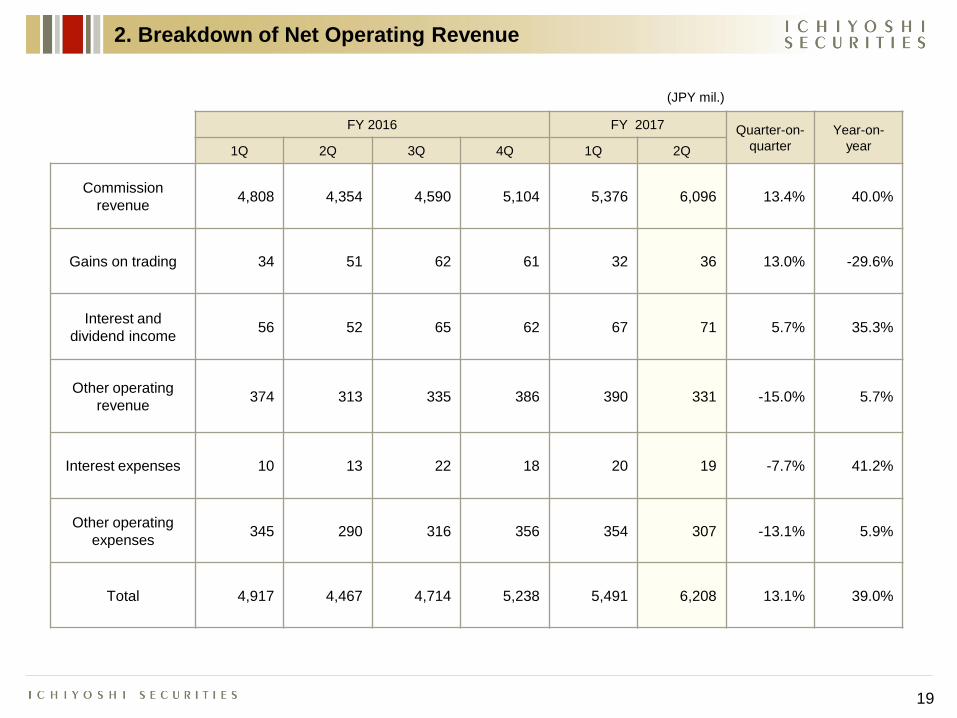
2. Breakdown of Net Operating Revenue
FY 2016 FY 2017 Quarter-on-
quarter
Year-on-
year 1Q 2Q 3Q 4Q 1Q 2Q
Commission
revenue 4,808 4,354 4,590 5,104 5,376 6,096 13.4% 40.0%
Gains on trading 34 51 62 61 32 36 13.0% -29.6%
Interest and
dividend income 56 52 65 62 67 71 5.7% 35.3%
Other operating
revenue 374 313 335 386 390 331 -15.0% 5.7%
Interest expenses 10 13 22 18 20 19 -7.7% 41.2%
Other operating
expenses 345 290 316 356 354 307 -13.1% 5.9%
Total 4,917 4,467 4,714 5,238 5,491 6,208 13.1% 39.0%
(JPY mil.)
19

3. Breakdown of Commission Revenue
FY 2016 FY 2017 Quarter-on-
quarter
Year-on-
year 1Q 2Q 3Q 4Q 1Q 2Q
Brokerage (Major item)
Stocks 1,787 1,330 1,852 1,841 2,137 2,230 4.4% 67.7%
Distribution (Major item)
Investment trusts
sales charge 1,313 1,533 1,147 1,562 1,600 1,784 11.5% 16.4%
Underwriting (Major items)
IPO 28 6 54 19 6 103 - -
PO 205 6 16 25 2 140 - -
Total 233 12 70 44 8 244 - -
Others (Major items)
Investment trusts (trailer fees and others) 1,249 1,253 1,299 1,386 1,455 1,641 12.9% 31.0%
Other than investment trusts 135 144 140 172 104 146 40.3% 1.1%
Total 1,385 1,398 1,439 1,559 1,559 1,788 14.7% 27.9%
(JPY mil.)
20

4. Breakdown of Gains on Trading
FY 2016 FY 2017 Quarter-on-
quarter Year-on-year
1Q 2Q 3Q 4Q 1Q 2Q
Stocks, etc. -5 29 20 38 11 12 9.3% -57.6%
Bonds・Forex, etc. 40 21 41 22 20 23 15.0% 8.4%
(Bonds, etc.) (40) (10) (35) (19) (16) (19) 14.2% 76.8%
(Forex, etc.) (-0) (10) (6) (3) (3) (4) 18.4% -60.5%
Total 34 51 62 61 32 36 13.0% -29.6%
(JPY mil.)
21

5. Operating Cost and Expenses
FY 2016 FY 2017 Quarter-on-
quarter
Year-on-
year 1Q 2Q 3Q 4Q 1Q 2Q
Transaction
related expenses 433 366 379 421 430 448 4.4% 22.5%
Personnel
expenses 2,292 2,317 2,309 2,335 2,470 2,516 1.8% 8.6%
Property related
expenses 464 451 445 454 484 472 -2.5% 4.6%
Clerical expenses 584 552 624 633 601 577 -3.9% 4.6%
Depreciation 98 99 98 110 102 106 4.2% 7.2%
Public charges 75 67 71 86 79 93 18.5% 39.3%
Allowances for
doubtful accounts - - - - 0 0 - -
Others 169 131 131 140 180 145 -19.1% 11.2%
Total 4,118 3,985 4,060 4,181 4,347 4,361 0.3% 9.4%
<Reference> Fixed cost and variable cost are inscribed on non-consolidated basis.
Fixed cost 3,040 2,966 2,986 3,018 3,103 3,031 -2.3% 2.2%
Variable cost 1,001 928 961 1,038 1,121 1,175 4.8% 26.7%
(JPY mil.)
22

6. Balance Sheets
FY 2016 FY 2017 Quarter-
on-quarter
Year-on-
year 1Q 2Q 3Q 4Q 1Q 2Q
Assets
Current assets 39,071 42,058 43,986 47,533 44,471 60,376 35.8% 43.6%
Fixed assets 6,352 5,919 6,102 6,173 6,075 6,109 0.6% 3.2%
Total assets 45,423 47,977 50,089 53,706 50,546 66,485 31.5% 38.6%
Liabilities
Current liabilities 12,483 14,802 17,227 20,081 16,797 31,333 86.5% 111.7%
Fixed liabilities 347 339 350 344 341 344 0.7% 1.3%
Total liabilities 13,011 15,323 17,758 20,607 17,319 31,858 83.9% 107.9%
Net worth
Net worth 32,412 32,654 32,330 33,099 33,226 34,627 4.2% 6.0%
Total liabilities &
net worth 45,423 47,977 50,089 53,706 50,546 66,485 31.5% 38.6%
(JPY mil.)
23

7. Financial Results
FY 2016 FY 2017 Quarter-on-
quarter
Year-on-
year 1Q 2Q 3Q 4Q 1Q 2Q
Total assets (JPY mil.) 45,423 47,977 50,089 53,706 50,546 66,485 31.5% 38.6%
Net worth (JPY mil.) 32,412 32,654 32,330 33,099 33,226 34,627 4.2% 6.0%
Equity ratio (%) 70.8 67.5 64.0 61.1 65.1 51.6 - -
Net worth per share
(JPY) 745.74 755.39 751.88 769.18 771.83 804.62 - -
Capital adequacy ratio
(%)
(non-consolidated basis)
580.8 592.6 584.0 591.9 593.2 606.8 - -
EPS (JPY) 12.79 23.60 33.77 50.89 18.43 47.71 - -
ROE (%) 1.7 3.1 4.4 6.6 2.4 6.1 - -
24
Disclaimer
・This document is produced by Ichiyoshi Securities Co., Ltd. based on the data as of September 30, 2017.
・Nothing in this document shall be considered as an offer to sell or solicit an offer to buy
any security, or other instrument, including securities issued by Ichiyoshi Securities Co., Ltd.
・This presentation is based on Japanese accounting standards.
・No part of this document shall be reproduced, stored in a retrieval system or transmitted in any
form or by any means, without the prior written permission of Ichiyoshi Securities Co., Ltd.
Ichiyoshi Securities Co., Ltd.
Financial instruments firm registered with the Kanto Local Finance Bureau (registration No. 24)
Member association: Japan Securities Dealers Association
Japan Investment Advisers Association