consideration of cut-off criteria for groundwater ... · consideration of cut-off criteria for...
TRANSCRIPT

-1-
Consideration of cut-off criteria for groundwater assessments of biocides
Background
In the past, cut-off criteria have been used to justify the low groundwater leaching
potential of biocide active substances and their metabolites. The typical criteria used
are a Koc of >500 L/Kg combined with a DT50 < 21 d1. If a substance has this
combination of properties, no formal leaching assessment may be necessary. At
TMII2013 the origin and continued relevance of these cut-off criteria was questioned.
The UK CA agreed to perform an assessment to test whether these criteria were still
appropriate for use with the latest versions of the FOCUS Groundwater models.
During the TMIII2013 discussions on the original version of this paper it was agreed
that the UK would perform some additional modelling to investigate a number of
additional parameters. The additional modelling investigates the impact of applying
the latest Q10 value recommended by EFSA (i.e. 2.58 versus 2.2 used in the original
paper). It also investigates the impact of using a default 1/n of 0.9 in place of 1.0 used
in the original modelling. Finally it checks the impact of a default soil DT50 of 30 d
rather than 21 d, to account for the likely default value for substances classed as
readily biodegradable.
Discussions following the presentation of the revised paper at TMIV 2013 identified
two important potential limitations of the work. Firstly there was concern that the
simulation of a single annual dose may underestimate leaching compared to a more
continuous emission (that may arise from leaching from a treated surface for
example). The second limitation was that the applicability of the cut off criteria to
metabolites had not been tested. Both these aspects have been explored in more detail
by the UK with the aid of further modelling. All new work is presented in this paper
as track changes to identify it from work already presented at TMIV2013.
Method
A dummy substance was created with the properties as outlined in Table 1 below.
Simulations were performed with single annual applications of 1000 kg a.s./(ha.y) to
the soil surface. Applications were made to crops of either maize, grassland or winter
cereals. Applications were made on either the 1st March or the 1
st of October each
year. Simulations were performed for all 9 standard FOCUS scenarios with a 26 year
model run. Modelling was performed with FOCUS PELMO v4.4.3 and FOCUS
PEARL v4.4.4.
The crops and application timings were intended to reflect reasonable worst case
simulations for the purposes of assessing the suitability of cut-off criteria for all
product types. Crops and timings were consistent with previous guidance from DE in
this area. Similarly a highly conservative application rate of 1000 kg a.s./(ha.y) was
chosen to assess the general suitability of the cut-off criteria.
1 For the purposes of this work, it has been assumed that the cut-off DT50 value of 21 d applies to a
reference temperature of 20°C (the default input temperature for the FOCUS models). This is a more
conservative approach than assuming it is for a reference temperature of 12°C (which would be
equivalent to a DT50 of only 11.1 d at 20°C). This approach makes the cut-off criteria applicable to a
greater number of substances.

-2-
Table 1: Dummy substance properties used in the assessment of cut-off criteria
Parameter Value Notes
Molar mass (g mol-1
) 350 Dummy value
Saturated vapour pressure (Pa at 20°C) 1E-14 Default low value to minimise
volatilisation
Solubility in water (mg L-1
at 20°C) 100 Dummy value
Koc (L Kg-1
) for PELMO 500 Cut-off criteria
Kom (L Kg-1
) for PEARL 290
Freundlich sorption exponent (1/n) 1 Default value
DT50 (20°C and pF 2) 21
Molar activation energy (Kj mol-1
) 54 Default equivalent to a Q10 of
2.2
Plant uptake 0 Default
All other input parameters were left as the FOCUS model defaults.
Following discussions at TMIII2013, additional simulations were performed with a
default Freundlich exponent (1/n) of 0.9 and a molar activation energy of
65.4 Kj mol-1
(equivalent of a Q10 of 2.582 in line with the latest value proposed by
EFSA and used for PPPR leaching assessments). To investigate these amended
parameters, simulations were run with the FOCUS PEARL v4.4.4 model for October
applications of 1000 kg a.s./(ha.y) only. All other parameters were as stated in Table
1 above. In addition, modelling was performed to test the impact of using a default
soil DT50 of 30 d. For the purposes of these simulations, it was assumed by the UK
CA that the default DT50 of 30 d applied to a reference temperature of 20°C (and not
the typical biocide reference temperature of 12°C). However it was subsequently
confirmed that this default should apply to a reference temperature of 12° (this is how
it is applied in EUSES). Since a DT50 of 30 d at 12°C equates to a DT50 of only
15.8 d at 20°C, the existing cut-off criteria assuming a DT50 of 21 d at 20°C are
already protective of substances that are readily biodegradable and attract the default
30 d DT50. No further work was actually needed to assess the impact of a 30 d DT50
and the results from these simulations have subsequently been removed to avoid
confusion and to ensure simple conservative cut-off criteria can be used. For these
additional simulations the combined worst case 1/n value of 1.0 and Q10 of 2.58 were
used. Initial simulations checked the combination of soil DT50 of 30 d and original
Koc trigger of 500 L kg-1
. Multiple simulations were run with Koc’s between 500 and
800 L kg-1
to determine the appropriate Koc trigger that resulted in acceptable
groundwater concentrations.
To examine the possible limitation of the work presented at TMIV2013 with regards
simulating a single application versus continuous emission, 4 different scenarios were
simulated:-
a single annual application of 1000 kg a.s./(ha.y) on 1st October (same as
original version of paper)
10 x 100 kg a.s./ha applied monthly (1st of every month except June and July
as a worst case)
2 Note that simulations were performed with an effective Q10 of 2.58 as a worst case only to test the
applicability of the cut-off criteria under these conditions. As previously agreed at TM, groundwater
leaching assessments should continue to use a Q10 of 2.2 (molar activation energy of 54 Kj mol-1
) for
consistency with the values used elsewhere for biocide environmental exposure assessments (e.g. a
Q10 of 2.2 is assumed in EUSES).

-3-
a single annual application of 1000 kg a.s./(ha.y) of an immobile precursor
(Kom = 1 x 10⁶ L/kg) degrading completely to a metabolite (to simulate more
continuous emission from a single source)
10 x 100 kg a.s./ha of an immobile precursor degrading completely to a
metabolite (to simulate more continuous emission from a multiple source
throughout the year)
Modelling 10 annual applications was consistent with the original guidance on how to
model leaching of PT8 substances. The value of 10 annual applications was a
limitation of the earlier versions of the PEARL model. Note that in PEARL v4.4.4 no
such limitation on number of applications exists. For the purposes of demonstrating
the impact of modelling single or multiple applications, the comparison of 1 versus 10
applications is considered sufficient.
Modelling was performed with FOCUS PEARL v4.4.4 and again considered
applications to grass, maize and winter cereal crops. In all simulations the parent and
metabolite had exactly the same fate and physic chemical properties as listed in Table
1 above (except for the Kom of the immobile precursor simulations). The formation
fraction for the metabolite was set to 1 and molecular weight was 350g/mol for parent
and metabolite. Therefore in each simulation the total loading of the metabolite
would always be 1000 kg/(ha.y). Modelling was performed always assuming a DT50
of 21 d, Q10 of 2.58 (worst case), Kom of 290 L/kg (equivalent to a Koc of 500 L/kg)
and a 1/n or either 0.9 or 1.0 to test the effect of non-linearity of sorption. Plant
uptake was always set to zero as a worst case. Standard FOCUS modelling was
performed assuming repeated annual applications and results are reported as the 80th
percentile annual average. Results are separated in Figures 6 and 7 based on the 1/n
assumed in the simulation. All other assumptions were identical in each set of
figures.
To examine the validity of the use of the cut-off criteria for metabolites the UK RMS
ran the same four scenarios as described above. The only difference was that in these
simulations, the parent was not simulated as an immobile precursor, but was
simulated with the same Kom of 290 L/kg (i.e. a moderately mobile parent degrading
completely to an identical, moderately mobile metabolite). These simulations were
intended to represent a worst case metabolite leaching assessment, where both parent
and metabolite had fate properties matching the cut-off criteria. Results are shown in
Figures 8 and 9 (note the colour coding of the scenarios changes compared to Figures
6 and 7, because metabolite leaching was significantly increased in these simulations).
Results
Results are summarised in the form of screenshots from the FOCUS models in
Figures 1 to 5 below.
For the FOCUS PEARL v4.4.4 simulations for the 1st March applications, all PECgw
concentrations were less than 0.1μg/l, even assuming a conservative application rate
of 1000 kg a.s./ha. The highest PECgw of 0.0362 μg/l was observed for simulation
on winter cereals at the Okehampton scenario.
For the FOCUS PEARL v4.4.4 simulations for the 1st October applications, all
PECgw concentrations were less than 0.1μg/l, except the simulations of grassland and

-4-
maize applications at the Piacenza scenario. For this scenario PECgw concentrations
of 0.130 and 0.129 μg/l respectively were observed.
For the FOCUS PEARL v4.4.4 simulations assuming a 1/n value of 0.9 and effective
Q10 of 2.58 for the 1st October applications, all PECgw concentrations were less than
0.1μg/l. This confirms that the original modelling presented in this paper (based on a
1/n value of 1.0 and effective Q10 of 2.2) was conservative. Results are shown in
Figure 2a.
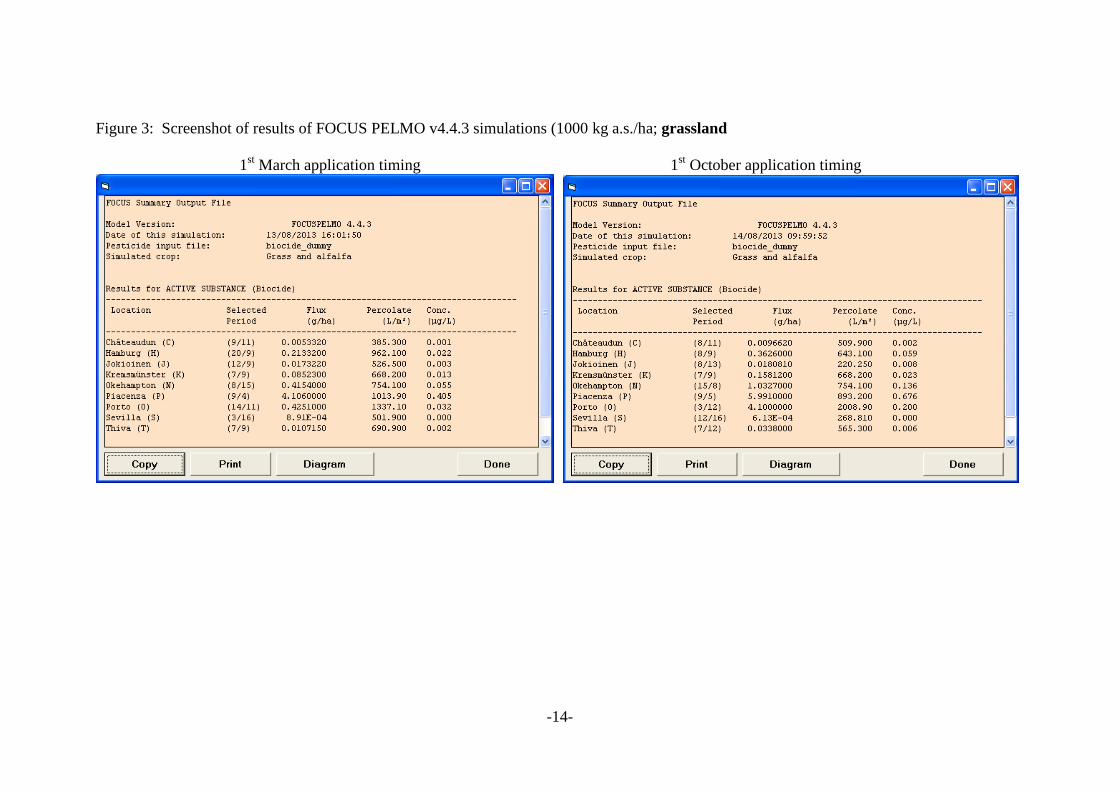
For the FOCUS PELMO v4.4.3 simulations for the 1st March applications, all PECgw
concentrations were less than 0.1μg/l, except the simulations of grassland and maize
applications at the Piacenza scenario For this scenario PECgw concentrations of
0.405 and 0.168 μg/l were observed.
For the FOCUS PELMO v4.4.3 simulations for the 1st October applications, all
PECgw concentrations were less than 0.1μg/l for the Châteaudun, Jokioinen,
Kremsmünster, Sevilla and Thiva scenarios. Concentrations were above 0.1μg/l for
all crops for the Okehampton, Piacenza and Porto scenarios, with a maximum PECgw
value of 0.676 μg/l for the Piacenza grassland simulation. In addition the Hamburg
scenario exceeded 0.1 μg/l for the winter cereal application only (PECgw of
0.147μg/l).
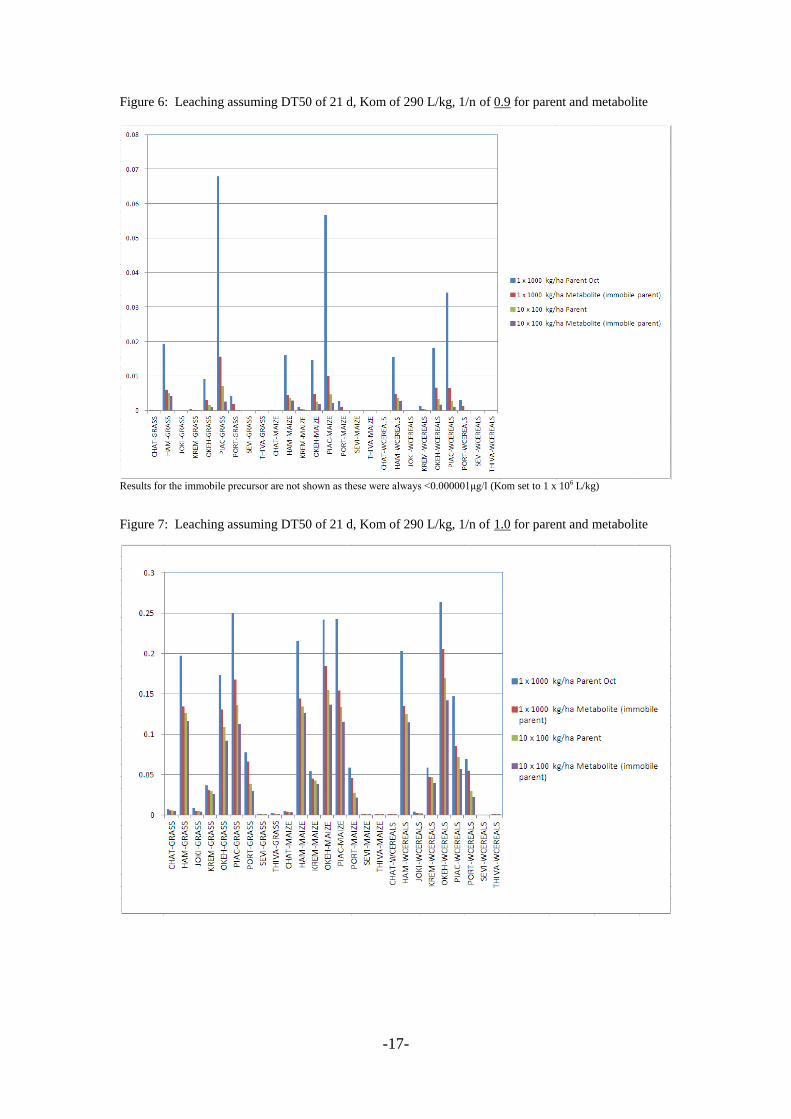
From Figures 6 and 7 the UK RMS concludes that the simulation of a single
application of 1000 kg a.s./(ha.yr) in October is conservative. This application pattern
(the blue bars in Figures 6 and 7) always gave higher PECgw values than the 10 x 100
kg application pattern or the metabolite simulations for each crop/scenario
combination. This can be explained by considering that the single application applies
the dose at a conservative time of year with regards leaching. In contrast the more
continuous applications (e.g. 10 x 100 kg and metabolite simulations) effectively
apply the dose throughout the year, including times when vulnerability to leaching is
reduced. The order of leaching potential of the four scenarios was as follows:-
1 x 1000 kg/ha parent > 1 x 1000 kg/ha metabolite > 10 x 100 kg/ha parent > 10 x 100 kg/ha
metabolite
The reduction in leaching from the single to the multiple application patterns is
greater where the 1/n is 0.9 compared to 1.0 (e.g. the difference between blue and
green bars in Figure 6 versus Figure 7). This is to be expected because the splitting of
the application over 10 smaller applications leads to a greater reduction in leaching
when sorption is assumed to be non-linear. This is because the smaller pore water
concentrations are associated with higher sorption when the 1/n < 1.0 based on the
Freundlich isotherm. However the simulations with a 1/n of 1.0 were more
conservative, resulting in higher PECgw values for each simulation. Again this is due
to the assumption of linear sorption, where there is no effective increase in sorption at
lower soil pore water concentrations compared to the simulations assuming a 1/n of
0.9.
The UK concludes that provided the single annual loading simulations have
considered the worst case time of year (i.e. October as in this case) there is no
increase in leaching potential from more continuous release of the same total load
throughout the year. Based on the results in this paper for the worst case combination
-5-
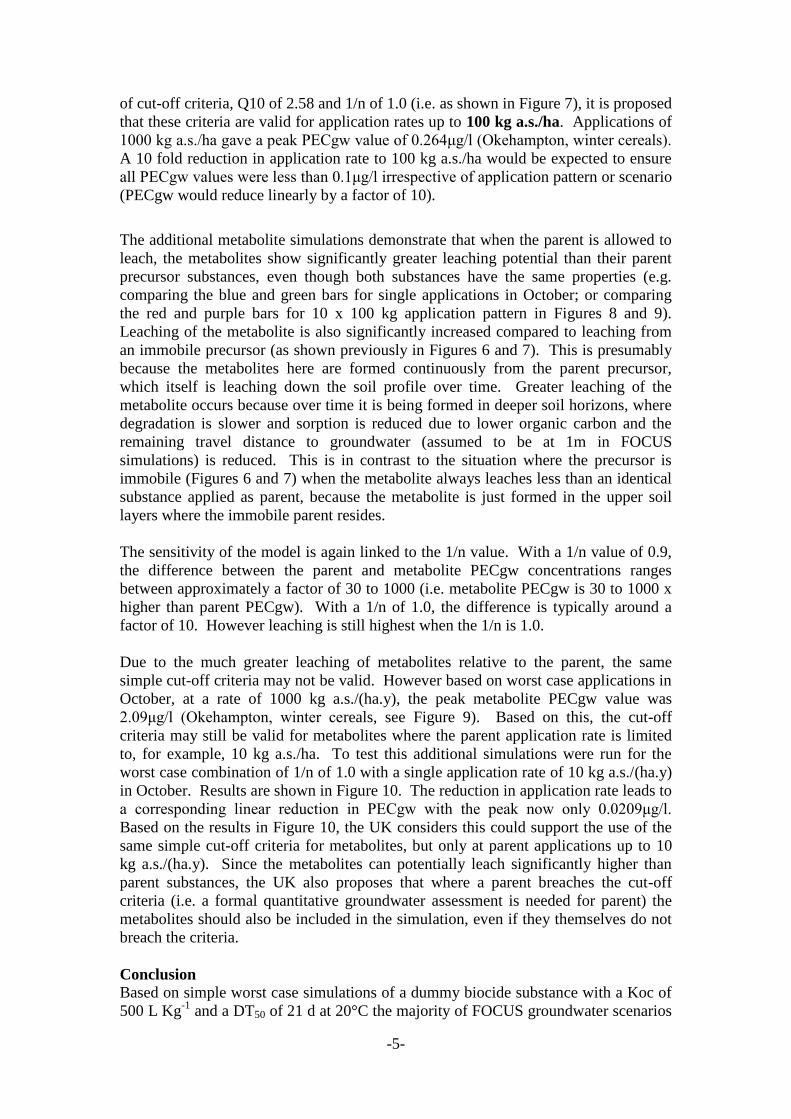
of cut-off criteria, Q10 of 2.58 and 1/n of 1.0 (i.e. as shown in Figure 7), it is proposed
that these criteria are valid for application rates up to 100 kg a.s./ha. Applications of
1000 kg a.s./ha gave a peak PECgw value of 0.264μg/l (Okehampton, winter cereals).
A 10 fold reduction in application rate to 100 kg a.s./ha would be expected to ensure
all PECgw values were less than 0.1μg/l irrespective of application pattern or scenario
(PECgw would reduce linearly by a factor of 10).
The additional metabolite simulations demonstrate that when the parent is allowed to
leach, the metabolites show significantly greater leaching potential than their parent
precursor substances, even though both substances have the same properties (e.g.
comparing the blue and green bars for single applications in October; or comparing
the red and purple bars for 10 x 100 kg application pattern in Figures 8 and 9).
Leaching of the metabolite is also significantly increased compared to leaching from
an immobile precursor (as shown previously in Figures 6 and 7). This is presumably
because the metabolites here are formed continuously from the parent precursor,
which itself is leaching down the soil profile over time. Greater leaching of the
metabolite occurs because over time it is being formed in deeper soil horizons, where
degradation is slower and sorption is reduced due to lower organic carbon and the
remaining travel distance to groundwater (assumed to be at 1m in FOCUS
simulations) is reduced. This is in contrast to the situation where the precursor is
immobile (Figures 6 and 7) when the metabolite always leaches less than an identical
substance applied as parent, because the metabolite is just formed in the upper soil
layers where the immobile parent resides.
The sensitivity of the model is again linked to the 1/n value. With a 1/n value of 0.9,
the difference between the parent and metabolite PECgw concentrations ranges
between approximately a factor of 30 to 1000 (i.e. metabolite PECgw is 30 to 1000 x
higher than parent PECgw). With a 1/n of 1.0, the difference is typically around a
factor of 10. However leaching is still highest when the 1/n is 1.0.
Due to the much greater leaching of metabolites relative to the parent, the same
simple cut-off criteria may not be valid. However based on worst case applications in
October, at a rate of 1000 kg a.s./(ha.y), the peak metabolite PECgw value was
2.09μg/l (Okehampton, winter cereals, see Figure 9). Based on this, the cut-off
criteria may still be valid for metabolites where the parent application rate is limited
to, for example, 10 kg a.s./ha. To test this additional simulations were run for the
worst case combination of 1/n of 1.0 with a single application rate of 10 kg a.s./(ha.y)
in October. Results are shown in Figure 10. The reduction in application rate leads to
a corresponding linear reduction in PECgw with the peak now only 0.0209μg/l.
Based on the results in Figure 10, the UK considers this could support the use of the
same simple cut-off criteria for metabolites, but only at parent applications up to 10
kg a.s./(ha.y). Since the metabolites can potentially leach significantly higher than
parent substances, the UK also proposes that where a parent breaches the cut-off
criteria (i.e. a formal quantitative groundwater assessment is needed for parent) the
metabolites should also be included in the simulation, even if they themselves do not
breach the criteria.
Conclusion
Based on simple worst case simulations of a dummy biocide substance with a Koc of
500 L Kg-1
and a DT50 of 21 d at 20°C the majority of FOCUS groundwater scenarios

-6-
gave concentrations less than 0.1μg/l. This was based on reasonable worst case
spring and autumn application timings following single annual doses of an
exaggerated application of 1000 kg a.s./(ha.y).
Some exceedence of the 0.1μg/l limit were observed, particularly for the Piacenza,
Okehampton and Porto scenarios. Numbers and levels of exceedence were higher for
the October applications using the FOCUS PELMO model. The maximum PECgw
value of 0.676 μg/l was observed for the Piacenza grassland simulation with PELMO.
These exceedences should be considered in the context of the highly exaggerated
application rate of 1000 kg a.s./(ha.y). Since PECgw concentrations were never
predicted to exceed 1 μg/l, it is reasonable to conclude that at lower application rates
(e.g. < 100 kg a.s./(ha.y)) all concentrations would be reduced by around an order of
magnitude and therefore within the acceptable level of 0.1μg/l3. For application rates
<100 kg a.s./ha it can be concluded that a substance meeting the cut-off criteria of
Koc of >500 L kg-1
and DT50 < 21 d would not result in significant exposure of
groundwater.
Based on these simple simulations, it is concluded that the existing cut-off criteria can
be supported to mitigate against the need for formal groundwater exposure
assessments for most active substances. If any biocide uses do result in extremely
high soil loadings (>100 kg a.s./ha) it is proposed that a formal FOCUS groundwater
assessment may need to be performed. This is because at these high loadings
substances may exceed the 0.1μg/l limit even when the cut-off criteria are met.
Based on this additional work including metabolites the UK would propose that the
basic cut-off criteria should be used to avoid the need for a full formal refinement of
FOCUS groundwater assessment in the following cases:-
For active substance only assessments (i.e. where no major metabolites are
formed) the standard cut-off criteria (DT50 <21 d at 20°C and Koc >500 L/kg)
could be used for biocide application rates up to 100 kg a.s./ha per year.
For assessments including metabolites, the standard cut-off criteria could be
used if a) both parent and metabolites meet the standard cut-off criteria and b)
the biocide application rates are less than 10 kg a.s./ha per year
Where a parent assessment is triggered based on the cut-off criteria (i.e.
because it has a DT50 > 21 d at 20°C or Koc <500L/kg), metabolites should
always be included irrespective of their properties.
The following tiered approach to biocide groundwater assessments is proposed:-
Tier 1: Estimation of PECgw as soil pore water concentration
Tier 2: Consideration of parent and all major metabolites against the cut-off
criteria listed above
Tier 3: Refinement of Tier 1 estimates using FOCUS PEARL (or PELMO)
and relevant Product Type specific guidance.
3 As an example, the worst case FOCUS PELMO simulation of October applications to grassland was
repeated with an application rate of 100 kg a.s./ha and gave a PECgw value of 0.068 μg/l (i.e. 10 x
lower than the 1000 kg a.s./ha simulation result of 0.676 μg/l)
-7-
These proposals are based on FOCUS groundwater modelling using PEARL v4.4.4
and PELMO v4.4.3 for three crops (grass, maize and winter cereals) at all 9 scenarios.
For worst case application timings in October and exaggerated application rates
between 10 and 100 kg of active substance and metabolite per ha per year, PECgw
estimates were <0.1μg/l. Such high environmental loadings of biocides are very
unlikely and mean that the cut-off criteria will have a large margin of safety for most
applications. The UK therefore concludes the criteria are still appropriate.
UK CA
8 April 2014

-8-
Figure 1: Screenshot of results of FOCUS PEARL v4.4.4 simulations (1st March; 1000 kg a.s./ha; grassland, maize and winter cereals)

-9-
Figure 2: Screenshot of results of FOCUS PEARL v4.4.4 simulations (1st October; 1000 kg a.s./ha; grassland, maize and winter cereals)

-10-
Figure 2a: Screenshot of results of FOCUS PEARL v4.4.4 simulations (1st October; 1000 kg a.s./ha; grassland, maize and winter cereals; 1/n =
0.9 and Q10 = 2.58; Koc = 500 L kg-1
DT50 = 21 d)

-11-
Figure 2b: Screenshot of results of FOCUS PEARL v4.4.4 simulations (1st October; 1000 kg a.s./ha; grassland, maize and winter cereals; 1/n =
1.0 and Q10 = 2.58; Koc = 500 L kg-1
DT50 = 30 d)

-12-
Figure 2c: Screenshot of results of FOCUS PEARL v4.4.4 simulations (1st October; 1000 kg a.s./ha; grassland, maize and winter cereals; 1/n =
1.0 and Q10 = 2.58; Koc = 775 L kg-1
DT50 = 30 d)

-13-
Figure 2d: Screenshot of results of FOCUS PEARL v4.4.4 simulations (1st October; 100 kg a.s./ha; grassland, maize and winter cereals; 1/n =
1.0 and Q10 = 2.58; Koc = 600 L kg-1
DT50 = 30 d)
-14-
Figure 3: Screenshot of results of FOCUS PELMO v4.4.3 simulations (1000 kg a.s./ha; grassland
1st March application timing 1
st October application timing

-15-
Figure 4: Screenshot of results of FOCUS PELMO v4.4.3 simulations (1000 kg a.s./ha; winter cereals)
1st March application timing 1
st October application timing

-16-
Figure 5: Screenshot of results of FOCUS PELMO v4.4.3 simulations (1000 kg a.s./ha; maize)
1st March application timing 1
st October application timing
-17-
Figure 6: Leaching assuming DT50 of 21 d, Kom of 290 L/kg, 1/n of 0.9 for parent and metabolite
Results for the immobile precursor are not shown as these were always <0.000001μg/l (Kom set to 1 x 10⁶ L/kg)
Figure 7: Leaching assuming DT50 of 21 d, Kom of 290 L/kg, 1/n of 1.0 for parent and metabolite

-18-
Figure 8: Leaching assuming DT50 of 21 d, Kom of 290 L/kg, 1/n of 0.9 for parent and metabolite
Figure 9: Leaching assuming DT50 of 21 d, Kom of 290 L/kg, 1/n of 1.0 for parent and metabolite

-19-
Figure 10: Leaching assuming DT50 of 21 d, Kom of 290 L/kg, 1/n of 1.0 for parent and metabolite
(single application of 10 kg a.s. on 1st October)