conserved fever pathways across vertebrates: a … fever pathways across vertebrates: a herpesvirus...
TRANSCRIPT

Cell Host & Microbe, Volume 21
Supplemental Information
Conserved Fever Pathways across Vertebrates:
A Herpesvirus Expressed Decoy TNF-a Receptor
Delays Behavioral Fever in Fish
Krzysztof Rakus, Maygane Ronsmans, Maria Forlenza, Maxime Boutier, M. CarlaPiazzon, Joanna Jazowiecka-Rakus, Derek Gatherer, Alekos Athanasiadis, FrédéricFarnir, Andrew J. Davison, Pierre Boudinot, Thomas Michiels, Geert F.Wiegertjes, and Alain Vanderplasschen
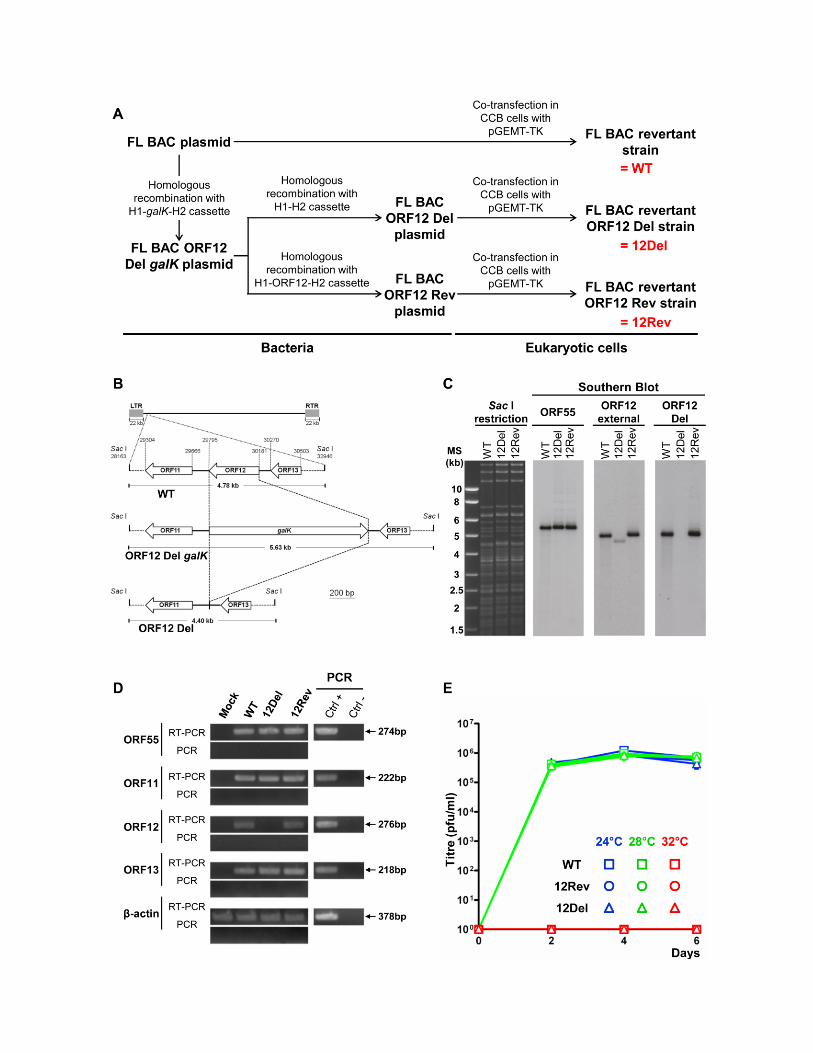

Figure S1 related to Figure 2 – Production and characterization of CyHV-3 ORF12 recombinant strains. (A)
Flow chart of steps performed to produce ORF12 recombinant plasmids and to reconstitute viral strains. (B) The
region of the CyHV-3 genome encoding ORF12 is illustrated for wild type (WT), ORF12 Del galK and ORF12 Del
genotypes. All coordinates correspond to the reference CyHV-3 sequence (NC_009127.1). (C) Structural analysis of
the genome of ORF12 recombinant strains by Sac I restriction and Southern blotting. (D) RT-PCR analysis of the
ORF12 genome region. (E) Effect of ORF12 deletion on viral growth in vitro. Replication kinetics of CyHV-3
ORF12 recombinant strains were compared with those of the WT strain using a multi-step growth assay at three
different temperatures. The data presented are the means + SD of triplicate measurements.
______________________________________________________________________________________________

Figure S2 related to Figure 3C. Binding of carp TNF-α1 and TNF-α2 to CyHV-3 secreted proteins. ELISAs
were performed with two sources of carp TNF-α: supernatant of transfected EPC cells (upper half of the figure) and
purified TNF-α1/ TNF-α2 expressed in bacteria (lower half). Binding of TNF-α1/ TNF-α2 was detected with
polyclonal anti-TNF-α antibodies (left column) or with a MAb anti-His (right column). The data are the mean + SD
of duplicate measurements. Results for which a significant difference was observed between the WT/12Rev and
12Del/Mock groups are marked by asterisks.
Movie S1 (M1) related to Figure 1B. Common carp express behavioral fever in response to CyHV-3 infection.
This movie starts with an animated cartoon illustrating the structure of the MCT used in this study and how the
MCTs were positioned in the room along a central axis of symmetry (warmest compartments being the closest to the
center of the room). The video then presents movies of fish that were mock-infected (left and first presented MCT)
or infected (right and second presented MCT) 7 days earlier with wild-type CyHV-3.
Movie S2 (M2) related to Figure 1C. Effect of water temperature on the development of CyHV-3 disease. This
video starts with an animated cartoon illustrating the structure of a MCT in which the tunnels were blocked by grids.
The video then presents a movie of fish that were infected 9 days earlier with wild-type CyHV-3 before their
distribution into the compartments of the MCT.
Movie S3 (M3) related to Figure 4. Anti-TNF-α antibodies inhibit the expression of behavioral fever induced
by CyHV-3 infection. This video starts with an animated cartoon explaining the flow chart of this experiment. Fish
were first infected with CyHV-3 and then injected three days later with anti-TNF-α antibodies (left and first
presented MCT) or irrelevant control antibodies (right and second presented MCT). Movies of the fish were recorded
at 6 dpi.
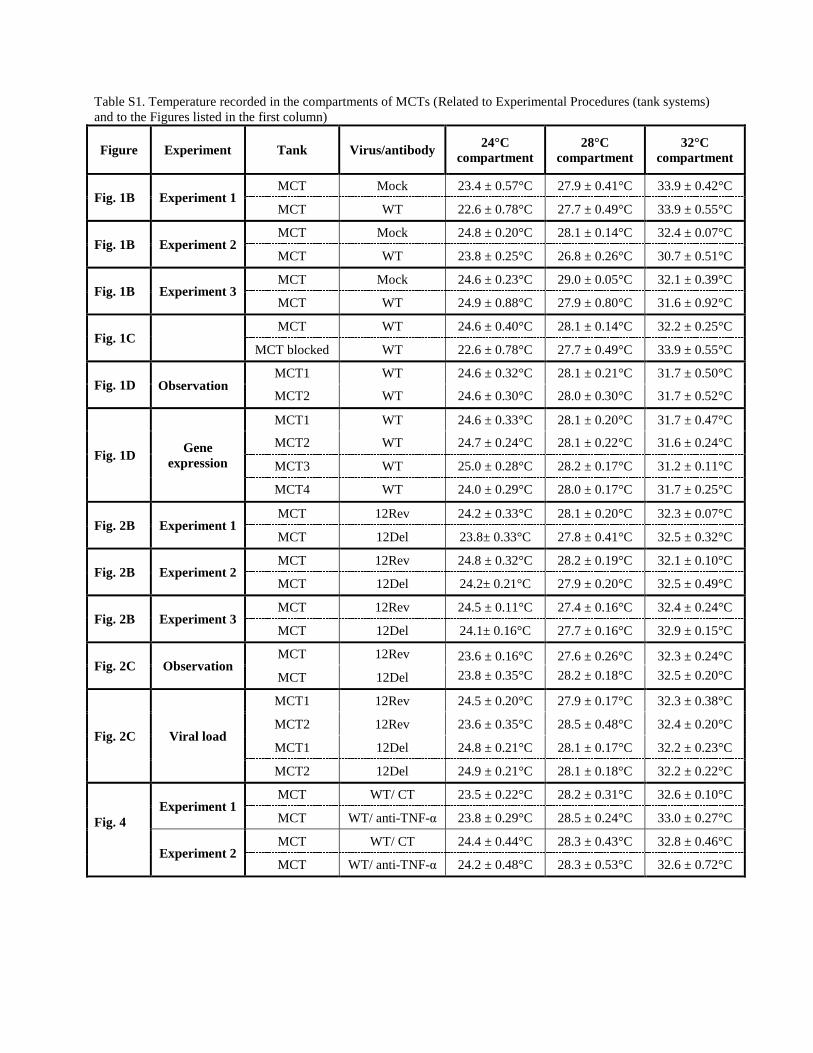
Table S1. Temperature recorded in the compartments of MCTs (Related to Experimental Procedures (tank systems)
and to the Figures listed in the first column)
Figure Experiment Tank Virus/antibody 24°C
compartment
28°C
compartment
32°C
compartment
Fig. 1B Experiment 1 MCT Mock 23.4 ± 0.57°C 27.9 ± 0.41°C 33.9 ± 0.42°C
MCT WT 22.6 ± 0.78°C 27.7 ± 0.49°C 33.9 ± 0.55°C
Fig. 1B Experiment 2 MCT Mock 24.8 ± 0.20°C 28.1 ± 0.14°C 32.4 ± 0.07°C
MCT WT 23.8 ± 0.25°C 26.8 ± 0.26°C 30.7 ± 0.51°C
Fig. 1B Experiment 3 MCT Mock 24.6 ± 0.23°C 29.0 ± 0.05°C 32.1 ± 0.39°C
MCT WT 24.9 ± 0.88°C 27.9 ± 0.80°C 31.6 ± 0.92°C
Fig. 1C
MCT WT 24.6 ± 0.40°C 28.1 ± 0.14°C 32.2 ± 0.25°C
MCT blocked WT 22.6 ± 0.78°C 27.7 ± 0.49°C 33.9 ± 0.55°C
Fig. 1D
Observation MCT1 WT 24.6 ± 0.32°C 28.1 ± 0.21°C 31.7 ± 0.50°C
MCT2 WT 24.6 ± 0.30°C 28.0 ± 0.30°C 31.7 ± 0.52°C
Fig. 1D
Gene
expression
MCT1 WT 24.6 ± 0.33°C 28.1 ± 0.20°C 31.7 ± 0.47°C
MCT2 WT 24.7 ± 0.24°C 28.1 ± 0.22°C 31.6 ± 0.24°C
MCT3 WT 25.0 ± 0.28°C 28.2 ± 0.17°C 31.2 ± 0.11°C
MCT4 WT 24.0 ± 0.29°C 28.0 ± 0.17°C 31.7 ± 0.25°C
Fig. 2B Experiment 1 MCT 12Rev 24.2 ± 0.33°C 28.1 ± 0.20°C 32.3 ± 0.07°C
MCT 12Del 23.8± 0.33°C 27.8 ± 0.41°C 32.5 ± 0.32°C
Fig. 2B Experiment 2 MCT 12Rev 24.8 ± 0.32°C 28.2 ± 0.19°C 32.1 ± 0.10°C
MCT 12Del 24.2± 0.21°C 27.9 ± 0.20°C 32.5 ± 0.49°C
Fig. 2B Experiment 3 MCT 12Rev 24.5 ± 0.11°C 27.4 ± 0.16°C 32.4 ± 0.24°C
MCT 12Del 24.1± 0.16°C 27.7 ± 0.16°C 32.9 ± 0.15°C
Fig. 2C Observation MCT 12Rev 23.6 ± 0.16°C 27.6 ± 0.26°C 32.3 ± 0.24°C
MCT 12Del 23.8 ± 0.35°C 28.2 ± 0.18°C 32.5 ± 0.20°C
Fig. 2C Viral load
MCT1 12Rev 24.5 ± 0.20°C 27.9 ± 0.17°C 32.3 ± 0.38°C
MCT2 12Rev 23.6 ± 0.35°C 28.5 ± 0.48°C 32.4 ± 0.20°C
MCT1 12Del 24.8 ± 0.21°C 28.1 ± 0.17°C 32.2 ± 0.23°C
MCT2 12Del 24.9 ± 0.21°C 28.1 ± 0.18°C 32.2 ± 0.22°C
Fig. 4
Experiment 1 MCT WT/ CT 23.5 ± 0.22°C 28.2 ± 0.31°C 32.6 ± 0.10°C
MCT WT/ anti-TNF-α 23.8 ± 0.29°C 28.5 ± 0.24°C 33.0 ± 0.27°C
Experiment 2 MCT WT/ CT 24.4 ± 0.44°C 28.3 ± 0.43°C 32.8 ± 0.46°C
MCT WT/ anti-TNF-α 24.2 ± 0.48°C 28.3 ± 0.53°C 32.6 ± 0.72°C
Supplemental Experimental Procedures
Production and characterization of CyHV-3 ORF12 recombinant strains
CyHV-3 ORF12 recombinant strains were produced by using BAC cloning and prokaryotic recombination
technologies (Figure S1). The parental plasmid was the CyHV-3 FL BAC clone (Boutier et al., 2015b). Recombinant
plasmids were produced by using galactokinase (galK) positive/negative selection in bacteria (Boutier et al., 2015b)
(Figure S1A) before reconstitution of infectious virus by transfection into CCB cells. The first recombination process
(galK positive selection) replaced ORF12 by galK, resulting in the FL BAC ORF12 Del galK plasmid.
Recombination was achieved by using the H1-galK-H2 recombination cassette, which consisted of the galK gene
flanked by 50 bp sequences of the CyHV-3 genome flanking ORF12. This recombination cassette was produced by
PCR by using the pgalK vector as a template and the primers listed in the Table below. The second recombination
process (galK negative selection) removed the galK gene (FL BAC ORF12 Del plasmid) or replaced the galK gene
by the CyHV-3 wild type ORF12 sequence (FL BAC ORF12 Rev plasmid). The FL BAC ORF12 Del plasmid was
obtained by recombination with the H1-H2 cassette. This cassette consisted of 50 bp of the CyHV-3 genome
upstream and downstream of ORF12. The FL BAC ORF12 Rev plasmid was produced by recombination with the
H1-ORF12-H2 cassette. This cassette was produced by PCR using the primers listed in the Table below and CyHV-3
FL DNA as the template. To reconstitute infectious virus, the recombinant BAC plasmids were co-transfected with
the pGEMT-TK plasmid (molecular ratio of 1:75) in CCB cells. Transfection with the pGEMT-TK plasmid induced
recombination upstream and downstream of the BAC cassette, leading to its complete removal and consequent
reversion to a wild-type ORF55 locus (FL BAC revertant strains). Plaques negative for enhanced green fluorescent
protein (EGFP) expression (encoded by the BAC cassette) were picked and amplified.
The structure (Figure S1C) and transcription (Figure S1D) of the ORF12 region of CyHV-3 recombinants were
characterized by Southern blot and RT-PCR analyses, respectively. Probes for Southern blot analyses were produced
by PCR using the primers listed in the Table below. Transcriptional analyses by RT-PCR were performed as
described previously (Boutier et al., 2015b) with the primers listed in the Table below.
For genetic characterization of CyHV-3 recombinants by full length genome sequencing, DNA (500 ng) was
sheared by sonication to an average size of 400 bp and prepared for sequencing by using a KAPA library preparation
kit (KAPA Biosystems). The fragments were A-tailed, ligated to the NEBnext Illumina adaptor (New England
Biolabs), and amplified by PCR. Index tags were added by six cycles of PCR using KAPA HiFi HotStart and
NEBnext indexing primers. The libraries were analyzed by using a MiSeq DNA sequencer running v2 chemistry
(Illumina). Approximately 1 million 250-nucleotide paired-end reads were obtained per sample. The reads were
prepared for assembly by using Trim Galore v. 0.2.2
(http://www.bioinformatics.babraham.ac.uk/projects/trim_galore). Sequence accuracy was checked by using BWA v.
0.6.2-r126 (Li and Durbin, 2010) to assemble the reads against the sequence of the parental strain (KP343683)
adapted by the conceptual mutagenesis performed and visualizing the alignment by using Tablet v. 1.13.08.05 (Milne
et al., 2013). The 12Rev virus exhibited a sequence identical to the parental sequence. As intended, the 12Del virus
completely lacks ORF12 (29795-30181). It also contains two nucleotide substitutions, the first a G to A transition at
240846 and the second an A to G transition at 58571. The former is a synonymous substitution in ORF139, and the
second a nonsynonymous substitution in ORF36 resulting in a N to D change, a polymorphism found in CyHV-3 and
in the orthologue of CyHV-2. In all viral genomes, two regions were of undetermined length: an A repeat and a GA
repeat located at 32540-32465 and 177568-177730 nt, respectively, in the CyHV-3 reference sequence
(NC_009127.1).
The fitness of the CyHV-3 recombinants to replicate in cell culture was investigated by multi-step growth curves as
described previously (Boutier et al., 2015b). Briefly, cultures of CCB cells were inoculated in triplicate with CyHV-3
at a MOI of 0.1 pfu/cell. Supernatants were collected from the infected cultures at successive intervals and stored at
-80°C. Titration of infectious viral particles was determined by duplicate plaque assays.
TNF-α binding assay
Binding of carp TNF-α to the CyHV-3 secretome was analyzed by ELISA (Forlenza et al., 2009). ELISA plates
were coated with 5 µg total protein from concentrated CCB supernatants. After blocking, plates were incubated with
the supernatants from EPC cells that had been transfected previously with pTNF-α1, pTNF-α2 or pEmpty, or with
purified carp TNF-α1/TNF-α2 expressed in bacteria (Forlenza et al., 2009). Bound TNF-α was quantified by using
two detection systems: rabbit anti-TNF-α antibodies followed by goat anti-rabbit IgG-HRP, or mouse monoclonal
(MAb) anti-His antibody (Quiagen) followed by goat anti-mouse IgG-HRP (Forlenza et al., 2009).

TNF-α bioluminescent reporter assay
EPC cells stably transfected with pNiFty2-Luc (InvivoGen) (Piazzon et al., 2015), hereafter referred to as
EPC-NFB-Luc cells, were used to measure TNF-α bioactivity. Supernatants from EPC cells, which had been
transfected previously with pTNF-α1, pTNF-α2 or pEmpty (Forlenza et al., 2009), were pre-incubated with
concentrated supernatants of CyHV-3-infected or mock-infected CCB cells (40 µg total protein) for 30 min at RT to
allow ORF12-TNF-α binding. EPC-NFB-Luc cells seeded in 96-well plates were stimulated with 50 µl of the pre-
incubated mixtures described above. After incubation for 6 h at 27°C, cells were lysed and bioluminescence was
measured. The fold change of luminescence was calculated by dividing the light units obtained for each sample by
the result obtained for the respective control sample.
Tank systems
A single chamber tank (SCT) system and a multi-chamber tank (MCT) system were used in this study (Figure 1A;
see also Supplemental Information M1). The SCT system consisted of an 80 L single compartment tank (width x
depth x height: 0.5 x 0.4 x 0.4 m) with a mean constant temperature of approximately 24, 28 or 32°C. The MCT
system consisted of a 144 L tank (width x depth x height: 1.2 x 0.3 x 0.4 m) subdivided into three equal
compartments by two rigid thermal insulation panels (6 cm thick and made of polyurethane foam). Neighboring
compartments were connected by a 0.4 m long transparent tunnel with a square cross-section (8 x 8 cm) placed at the
bottom of the tank. Each of the three chambers had independent aeration, circulation and filtering systems. A thermal
gradient (24°C - 28°C - 32°C) was established between the three chambers by cooling the first compartment and by
increasing heating of the second and third compartments. Temperatures in all three compartments were controlled by
measurements every 30 min. The observed temperatures of the MCTs used for the experiments in this manuscript are
presented as the mean ± SD in Table S1. To simplify reading of the manuscript, the theoretical gradient of 24°C -
28°C - 32°C is presented in the manuscript using the color code described in the legend of Figure 1. The MCTs were
placed in the experimental room as pairs around a central axis of symmetry, with the 32°C compartments being close
to this axis and the 24°C compartments being furthest away. The positions of the experimental groups were swapped
systematically between replicate tanks. In the MCTs, daily feeding was performed in the 24°C compartment
independently of the position of the fish.
Monitoring of fish position in the MCTs
Fish (n=15) were initially introduced into the 24°C compartment of the MCT, in which the tunnels were obstructed
by grids to prevent migration out of the compartment. After an acclimatization period of 3 weeks, the grids were
removed, and the distribution of fish into the three compartments was monitored over time. A digital camera
(Logitech HD Webcam c310) placed in front of each MCT recorded pictures every 3 min. The number of fish in
each compartment was counted manually from the images captured at each successive 30 min, resulting in 48
measurements per day. When the positions of the fish were not compatible with an accurate count, measurements
were made from the previous or following image (i.e. collected 3 min before or after image examined initially). The
results are presented as the mean + SD (n=48) of the number of fish observed per day in each compartment.
Statistical analyses
Most statistical analyses were performed by using linear models. The observations on fish position in MCTs
(Figure 1B and D, Figure 2B and Figure 4) were analyzed by using daily averages of the number of fish present in
each compartment for each replicate as follows: a mixed model was set up with these averages as dependent
variables and the status (WT or Mock, Figure 1B and D; 12Rev or 12Del, Figure 2B; and Ctrl or anti-TNF-α, Figure
4), the time and the interaction between time and status as independent variables. Due to the lack of some
observations (e.g. on the day of infection or at the end of the observation period or upon deaths), averages might
have been computed over unequal number of observations, requiring a weighting of the data (using the
corresponding number of observations) in order to estimate the standard errors correctly. Potential correlations
between successive measurements over the same set of fish were taken into account by a type 1 auto-regressive
structure using an Akaike Information Criterion comparison. Obtained estimators were then globally compared using
type 3 tests of the fixed effects of the model with a Kenward-Roger correction for the degrees of freedom. Post-hoc
comparisons of the sets of fish (WT or Mock, Figure 1B and D; 12Rev or 12Del, Figure 2B; and Ctrl or anti-TNF-α,
Figure 4) were then obtained for each day of the experiment, testing the null hypothesis that the means are actually
equal. Differences in viral load (data after log transformation) and cytokine expression (data after log transformation)
(Figure 1D) between CyHV-3 infected fish collected at various post-infection times and mock-infected fish sampled
at day 0 were analyzed by using a one-way ANOVA. Post-hoc comparisons between days were performed by using
Tukey’s test. These analyses were performed independently for each cytokine. The TNF-α binding assay (Figure 3C
and Figure S2), TNF-α neutralization assay (Figure 3D), virus load measurement (Figure 2A and C), and multi-step
growth curves (Figure S1E) were analyzed by using two- or three-way ANOVA. More precisely, for the binding
assay of TNF-α, the level of binding was modeled by using a linear model involving cell supernatants, TNF-α1 or
TNF-α2 volumes as well as their interactions. For the neutralization assay of TNF-α biological activity, the fold
change of luminescence (ratio of the TNF-α1 or TNF-α2 levels respective to the control supernatant level) was
modeled by using a linear model involving cell supernatants, cytokine (TNF-α1, TNF-α2 or control) supernatants,
and their interactions. For viral load, the viral genome copies (data after log transformation) were modeled by using a
linear model involving virus strains, tanks, and their interactions. For multi-step growth curves, the logarithm of the
titre was modeled by using a linear model involving the day, viral strains, temperature, and their interactions. For the
survival analyses (Figure 1C and 2A), a standard SAS LIFETEST procedure was performed. Survival curves were
compared pairwise. Statistical significance is represented as follows: -, not significant; *, p<0.05; **, p<0.01; ***,
p<0.001; and ****, p<0.0001. P-values <0.05 were considered significant.

Primer sets used in this study (related to Supplemental Experimental Procedures)
Primer name Sequence (5’- 3’)
Coordinates*/
accession
number
Synthesis of recombination cassettes
Cassette name H1-galK-H2 ORF12 galK F AGGCTGCACTGCTGCGCACAGTGACGAGTAGACGGTGGGA
GGTCGGTGAACCTGTTGACAATTAATCATCGGCA
29745-29794
ORF12 galK R CTTGTTTTACTATACTCTATCACATCTCCGACTTGATTTCTT
CTCAAACCTCAGCACTGTCCTGCTCCTT
30231-30182
H1-ORF12-H2 ORF12 Fw RVT ATGAAGAGTTTGTGTCGAGC 29668-29687
ORF12 Rev RVT GGCTACGTATAACTGTCATG 30312-30293
Synthesis of probes for Southern blot analysis
Probe name
CyHV-3 ORF55 ORF55InF AGCGCTACACCGAAGAGTCC 95990-96009
ORF55stopR TCACAGGATAGATATGTTACAAG 96516-96494
CyHV-3 ORF12 Del ORF12 Int Fw 5’ TCGTAGTCGCCCTGACATCC 29847-29866
ORF12 Int Rev 3’ AACTAGACACTCATCATGCGG 30122-30102
CyHV-3 ORF12 external ORF12 Fw 5’ GAATTTATATGCAGCGAGTG 29723-29742
ORF12 Rev 3’ TATTGTCTGTTTCTGTGCTC 30261-30242
Transcriptional analysis
Gene amplified CyHV-3 ORF11 ORF11 Fw CAACCCACAACAGCAGTACC 29595-29576
ORF11 Rev TTGCCCTGTCTCATCTTGGT 29374-29393
CyHV-3 ORF12 ORF12 Int Fw 5’ TCGTAGTCGCCCTGACATCC 29847-29866
ORF12 Int Rev 3’ AACTAGACACTCATCATGCGG 30122-30102
CyHV-3 ORF13 ORF13 Fw TGTGAGTCATGACAGTTATACGT 30286-30308
ORF13 Rev ATGACTGACTGGACATCGGC 30503-30484
CyHV-3 ORF55 ORF55 ATG Fw ATGGCTATGCTGGAACTGG 95866-95884
ORF55 In Rev GGCGCACCCAGTAGATTATG 96467-96448
Carp β-actin Actin-Fw ATGTACGTTGCCATCCAGGC M24113
Actin-Rev GCACCTGAACCTCTCATTGC
qPCR analysis for quantification of viral load
Gene amplified CyHV-3 ORF89 KHV-86F GACGCCGGAGACCTTGTG AF411803
KHV-163R CGGGTTCTTATTTTTGTCCTTGTT
KHV-109P (6FAM) CTTCCTCTGCTCGGCGAGCACG (BHQ1)
Carp glucokinase CgGluc-162F ACTGCGAGTGGAGACACATGAT AF053332
CgGluc-230R TCAGGTGTGGAGCGGACAT
CgGluc-185P (6FAM) AAGCCAGTGTCAAAATGCTGCCCACT (BHQ1)
RT-qPCR analysis for quantification of cytokine expression
Gene amplified
Carp 40S 40S-F CCGTGGGTGACATCGTTACA AB012087
40S-R TCAGGACATTGAACCTCACTGTCT
Carp il1β IL-1β-F AAGGAGGCCAGTGGCTCTGT AJ245635
IL-1β-R CCTGAAGAAGAGGAGGCTGTCA
Carp TNF-α1 and TNF-α2
TNF-α1 and 2-F GCTGTCTGCTTCACGCTCAA AJ311800 and
AJ311801
TNF-α1 and 2-R CCTTGGAAGTGACATTTGCTTTT
Carp il6a IL-6a-F CAGATAGCGGACGGAGGGGC KC858890
IL-6a-R GCGGGTCTCTTCGTGTCTT
Carp il6b IL-6b-F GGCGTATGAAGGAGCGAAGA KC858889
IL-6b-R ATCTGACCGATAGAGGAGCG
*Coordinates based on the reference CyHV-3 genome (Accession number: NC_009127.1)
Underlined: 50 bp corresponding to the CyHV-3 sequence. Red: sequence corresponding to galK

Supplemental References
Li, H., and Durbin, R. (2010). Fast and accurate long-read alignment with Burrows-Wheeler transform.
Bioinformatics 26, 589-595.
Milne, I., Stephen, G., Bayer, M., Cock, P.J., Pritchard, L., Cardle, L., Shaw, P.D., and Marshall, D. (2013). Using
Tablet for visual exploration of second-generation sequencing data. Brief. Bioinform. 14, 193-202.