conroe independent school district · effective september 1, 2018-august 31, 2019. conroe...
TRANSCRIPT

Effective
September 1, 2018 - August 31, 2019
Conroe Independent School District
2018-2019
Official Budget
3205 West Davis Conroe, Texas 77304-2098
www.conroeisd.net

Effective
September 1, 2018 - August 31, 2019
Conroe Independent School District
Official Budget
3205 West Davis Conroe, Texas 77304-2098
I s s u e d b y F i n a n c e O f f i c e
D a r r i n R i c e
C h i e f F i n a n c i a l O f f i c e r
J a n i t h S t o w e r s
B u s i n e s s & A c c o u n t i n g M a n a g e r
K a r e n G a r z a
B u s i n e s s & A c c o u n t i n g M a n a g e r
C y n d i W e s t r u p
S e n i o r A c c o u n t a n t
R a c h a e l B a t a l l a
S t a f f A c c o u n t a n t
www.conroeisd.net

Conroe Independent School District

Table of Contents
2018-19 Budget Introductory Section Principal Officials ............................................................................................................................ 1 Executive Summary .................................................................................................. 3 Certificate for Meritorious Budget Award ...................................................................................... 18
Organizational Section Organizational Chart ..................................................................................................................... 19 Vision Statement and Strategic Goals .......................................................................................... 20 2018-2019 District Improvement Plan .......................................................................................... 21 Financial Structure and Basis of Accounting ................................................................................ 43 Classification of Revenues and Expenditures .............................................................................. 44 Significant Financial Policies and Procedures .............................................................................. 48 Budget Policies and Development Procedures ............................................................................ 51 Budget Calendar ........................................................................................................................... 54 Budget Administration and Management Process ....................................................................... 57 Financial Section Financial Overview ....................................................................................................................... 59 Combined Budget Summary ........................................................................................................ 60 Combined Property Tax Rate Calculation Worksheet .................................................................. 62 Impact of Budget on Taxpayers .................................................................................................... 63 Tax Rate Comparisons ................................................................................................................. 64 General Fund General Fund Overview ................................................................................................................ 67 Budget Summary: 2018-2019 Summary by Major Object and Function ...................................... 72 Expenditure Summary by Major Object ........................................................................................ 73 Expenditure Summary by Major Object Within Function .............................................................. 74 Major Object Summary by Campus .............................................................................................. 78 Five Year Summary of Revenues and Expenditures ................................................................... 80 General Fund Organization Summaries Organizational Summaries ........................................................................................................... 81 Organizational Overview .............................................................................................................. 82 Superintendent Goals & Objectives.............................................................................................. 86 Deputy Superintendent of Operations Goals & Objectives .......................................................... 88 Deputy Superintendent of Schools Goals & Objectives ............................................................... 90 Financial Services Goals & Objectives ......................................................................................... 92 Legal Services Goals & Objectives .............................................................................................. 94 Security Goals & Objectives ......................................................................................................... 96 Campus ........................................................................................................................................ 98 Elementary / Intermediate Schools ............................................................................................... 99 Individual Elementary / Intermediate Schools Goals & Budgets ................................................ 100 Secondary Schools ..................................................................................................................... 187 Individual Secondary Schools Goals & Budgets ........................................................................ 188 Summer School .......................................................................................................................... 226
i

Table of Contents (continued)
Debt Service Fund Debt Service Fund Overview ...................................................................................................... 238 Five Year Summary of Revenues and Expenditures ................................................................. 229 Revenue and Expenditure Summary by Major Object ............................................................... 230 Debt Retirement Summary ......................................................................................................... 231 Schedule of Long Term Debt ...................................................................................................... 232 Debt Service Requirements Until Maturity ................................................................................. 234 Debt Service Requirements to Maturity by Issue Date............................................................... 235
Capital Projects Fund Capital Projects Fund Overview ................................................................................................. 239 Five Year Summary of Revenues and Expenditures ................................................................. 243 Revenue and Expenditure Summary by Major Object ............................................................... 244 Capital Projects Summary .......................................................................................................... 245 Capacity, Enrollment and Age by School ................................................................................... 248
Food Service Fund Food Service Special Revenue Fund Overview ......................................................................... 251 Goals & Objectives .................................................................................................................... 252 Five Year Summary of Revenues and Expenditures ................................................................. 253 Revenue and Expenditure Summary by Major Object ............................................................... 254
Informational Section Long-Range Financial Forecasts................................................................................................ 255 Financial Projections Summary .................................................................................................. 260 Impact of Budget on Taxpayers .................................................................................................. 268 Assessed and Estimated Value of Taxable Properties – Last Ten Fiscal Years ....................... 269 Property Tax Rates, Levies, and Collections – Last Ten Fiscal Years and 2019 Projection ..... 270 Financial Projections Enrollment ................................................................................................ 271 Revenue and Expenditure Forecasts ......................................................................................... 272
Personnel Salary Proposals......................................................................................................................... 275 General Fund Schedule of Payroll Expenditures by Function .................................................... 276 Position Counts by Year ............................................................................................................. 277 Budgeted Position Counts by Division and in Total.................................................................... 278 2018-19 Hiring Schedule ............................................................................................................ 279 Staffing Formulas........................................................................................................................ 280
Performance Measures Annual Accountability Summary ................................................................................................. 285 District Accountability Summary ................................................................................................. 286 Campus Accountability Summaries ............................................................................................ 288 Department Performance ........................................................................................................... 346 SAT / ACT Results..................................................................................................................... .348 Senior Exit Survey ...................................................................................................................... 349
Additional Information Location of Campuses ................................................................................................................ 353 2018-2019 Test Dates ................................................................................................................ 354 2018-2019 School Calendar ....................................................................................................... 357
Glossary of Terms .................................................................................................................... 359
ii

Introductory Section

Conroe Independent School District
Principal Officials
BOARD OF TRUSTEES
Length of Term Board of Trustees Service Expires Occupation
Mrs. Melanie Bush 4 Years 2018 Business Owner President Mr. Datren Williams 6 Years 2020 Financial Analyst 1st Vice President Mr. Skeeter Hubert 4 Years 2018 Financial Services 2nd Vice President Mr. Ray Sanders 8 Years 2018 Finance Counselor Secretary Mr. Scott Kid 6 Years 2020 Attorney Assistant Secretary Mr. John Husbands 15 Years 2020 Insurance Agent Immediate Past President Mr. Scott Moore 2 Years 2020 Pastor
Trustee
ADMINISTRATIVE OFFICIALS
Length Official Position of Service
Dr. Curtis Null Superintendent of Schools 16 Years
Dr. Chris Hines Deputy Superintendent 17 Years
Mr. Darrin Rice Chief Financial Officer 28 Years
Mr. James Kacur Assistant Superintendent of Operations 4 Years
Dr. Debbie Phillips Assistant Superintendent for Elementary Education 3 Year
Mr. Gregg Colschen Assistant Superintendent for Secondary Education 16 Years
Mrs. Carrie Galatas General Counsel 21 Years
1

Conroe Independent School District
2

Executive Summary Conroe Independent School District
Fiscal Year 2018-2019
Budget Information
The following document represents the financial plan for the Conroe Independent School District for the 2018-19 fiscal year. This document culminates an intensive process involving input from parents, citizens, campus and administrative staff, the Superintendent and the Board of Trustees. This budget provides the financial resources necessary to maintain our existing facilities, and provide the necessary funds to operate our sixty-four existing campuses.
This budget document and the year-end Comprehensive Annual Financial Report (CAFR) are the primary vehicles used to present the financial plan and the results of operations of the District. This document was prepared in the format necessary to meet the requirements of the Association of School Business Officials International (ASBO) Meritorious Budget Award.
ASBO presented their Budget Presentation Awards to the Conroe Independent School District for its annual budget for the fiscal year beginning September 1, 2017. In order to receive this award, a governmental unit must publish a budget document that meets program criteria as a policy document, as an operations guide, as a financial plan, and as a communication device.
This award is valid for a period of one year only. We believe our current budget continues to conform to program requirements, and we are submitting it to ASBO to determine its eligibility for another award.
However, the primary purpose of this document is to provide timely and useful information concerning the past, current, and projected financial status of the District in order to facilitate financial decisions that support the educational goals of the District.
Budget Overview & Highlights
Federal, state and local guidelines guide the budget development process. The annually adopted budget includes the General, Debt Service, Capital Projects and Food Service. Total expenditures for all funds are $784,018,882. This plan provides the resources necessary for reaching the goals established in the District’s improvement plan.
Projected Budget Percent
2017-18 2018-19 Change
General Fund 478,722,725$ 495,459,113$ 3.50%
Debt Service Fund 100,397,172 103,055,656 2.65%
Capital Projects Fund 154,440,171 163,504,113 5.87%
Food Service Fund 21,673,994 22,000,000 1.50%
Total 755,234,062$ 784,018,882$ 3.81%
Total Expenditures by Fund Comparison
3

Executive Summary (continued) As one of the largest employers in Houston’s northern suburbs, Conroe Independent School District has approximately 6,485 full time employees. The chart below will illustrate the changes in staffing levels proposed for 2018-19. In the past 5 years the district has added an additional 697 employees to meet student needs, maintain state and local class sizes, and provide a level of support for the various departments. The majority of the 697 added FTE’s occurred in the teacher category as a result of student growth.
Actual Actual Actual Projected Budgeted
Position 14-15 15-16 16-17 17-18 18-19
Administrators 185.0 186.0 190.0 192.0 200.0
Counselors 161.6 161.6 164.6 168.3 173.3
Librarians 61.0 61.0 62.0 63.0 65.0
Manual Trades 910.5 925.5 943.5 965.5 1,015.5
Nurses 59.2 60.2 61.2 62.2 64.2
Paraprofessionals/Aides 886.0 896.5 916.5 926.5 978.0
Professionals 99.9 107.4 111.4 116.4 117.9
Psych/OTPT Services - Paraprofessional 3.0 3.0 3.0 3.0 3.0
Psych/OTPT Services - Professionals 19.0 19.0 19.0 19.0 19.0
Special Ed - Paraprofessional 21.0 29.0 39.0 41.0 43.0
Special Ed - Professionals 22.8 22.8 24.8 32.8 33.8
Support Personnel 95.0 98.0 100.0 106.0 124.0
Teachers 3,264.1 3,358.6 3,447.6 3,549.9 3,647.9
Totals 5,788.1 5,928.6 6,082.6 6,245.6 6,484.6
Percentage Change 2.05% 2.43% 2.60% 2.68% 3.83%
Conroe Independent School District
Position Counts by Year
(General Fund only)
The District has experienced significant increases in enrollment over the last ten years of 1200-1600 students per year. This trend is expected to continue into the foreseeable future.
35,000
40,000
45,000
50,000
55,000
60,000
65,000
09/10 10/11 11/12 12/13 13/14 14/15 15/16 16/17 17/18 18/19
Enrollment Trend
A brief summary of each fund follows. Additional detailed information is included in the remainder of this document.
4

Executive Summary (continued)
General Fund
Revenues General Fund revenues are budgeted to increase $1,575,756, or 0.3% over 2017-18 projected revenue. The following table provides a comparison of revenues by source for the current year (projected) and the 2018-19-budget year.
Projected Budget Percent
2017-18 2018-19 Change
Local Sources 357,994,721$ 370,703,836$ 3.6%
State sources 136,189,132 131,571,646 -3.4%
Federal sources 6,515,873 - -100.0%
Total 500,699,726$ 502,275,482$ 0.3%
General Fund Revenue Sources Comparison
The decrease in State revenue is due primarily to the Robin Hood effect in the funding formulas. As the district’s property values increase, the state recaptures that increase in value by decreasing funding proportionately in the following fiscal year. A portion of the recapture was offset by student enrollment growth. The federal revenue that the District receives is based on Medicaid reimbursement application and is subject to federal regulations, therefore the District does not include this as budgeted revenue. The District will continue to apply for this funding. For the 2018-19 fiscal year, approximately 26% of the General Fund expenditures will be funded through state contributions. The remaining 74% will be funded locally.
26%
74%
General Fund2018-19 Revenue Budget
State Revenue
Local Revenue
5

Executive Summary (continued) The Texas Legislature meets biennially unless the Governor requests a special session. Attempts to reform Texas’ public school finance system failed during the 85th Regular Session of the Texas Legislature. However, the governor did call for a special session resulting in the passing of HB 21. Initially the bill would have provided an additional $1.8 billion in funding to public schools in Texas, which would have added $1.5 billion to the basic allotment. The Senate stripped the bill down to $300 million, focused primarily on various special education grants, support for small and rural schools, and the extension of ASATR to prevent many districts from closing schools. The bill also established a School Finance Commission to evaluate and suggest changes to Texas’ school finance system. For additional information on the State of Texas budget visit this website. http://www.lbb.state.tx.us/ . Although the actual calculations for state funding are rather complicated, the basic calculations are as follows:
The Tier I component of school funding represents the cost of providing basic educational services for students in the district. A school district’s entitlement in Tier 1 is determined by the various types of students that attend school in the district and the size of the district. Districts are entitled to a certain amount of revenue for each student, with those that are more expensive to educate generating more money through a series of “weights.” The total cost is divided between the state and the school district, with the district’s share determined by applying the district’s compressed maintenance and operations (M&O) tax rate (2005 adopted maintenance and operations [M&O] rate multiplied by 0.6667) to its taxable value, and the state paying the remaining portion. The district’s share remains the same regardless of how many additional students there are or what the total cost is, and property wealthy districts pay a larger percentage of their total entitlement than less wealthy districts. The basic allotment remains at $5,140.
In Tier II, the state will subsidize tax receipts as needed to produce a guaranteed level of revenue per student per penny of property tax levy. The guaranteed yield program provides funds for educational services beyond the basic programs financed through Tier I. The first level of Tier II was collapsed into the basic allotment so that the guaranteed yield for enrichment is paid on the tax effort that exceeds the compressed rate. The Tier II, Level II yield per student in weighted average daily attendance (WADA) was increased to $106.28 for 2018-2019.
In addition to the funds received under Tier I and II, the District recognizes as revenue the amounts contributed by the State of Texas to the Teacher Retirement System (TRS) on behalf of the District’s employees. This amount is also recognized as an expenditure. The State contributed 8.05% of all employees’ eligible gross earnings except for those District employees subject to statutory minimum requirements and those employees being paid from and participating in federally funded programs. The statutory minimum requirements (locally funded portion) are based on the State teacher schedule and then adjusted based on local tax rates. After determining the necessary level of expenditures to meet District educational goals and facility requirements and estimating State aid utilizing the above funding formula, the tax rate necessary to fund remaining expenditures is calculated. This calculation is based on estimated property values, after giving consideration to exemptions, including the homestead exemption.
$- $5
$10 $15 $20 $25 $30 $35 $40
2013/14 2014/15 2015/16 2016/17 2017/18 2018/19
Billio
ns
Tax Base Trend
`
6

Executive Summary (continued) Expenditures
General Fund expenditures are budgeted to increase $16,736,388 or 3.50% over 2017-18 projected expenditures. The following table provides a comparison of expenditures by object for the current year (projected) and the 2018-19 budget year:
Projected Budget Percent
2017-18 2018-19 Change
Payroll cost 425,748,009$ 442,197,112$ 3.86%
Purchased services 26,134,005 27,013,305 3.36%
Supplies 18,611,539 19,060,106 2.41%
Other operating 5,876,401 6,485,890 10.37%
Capital outlay 2,352,771 702,700 -70.13%
Total 478,722,725$ 495,459,113$ 3.50%
General Fund Expenditures by Object Comparison
Since the education of students is a labor-intensive process, payroll expenditures, including benefits comprise approximately 89.24% of the General Fund expenditures. Budgeted expenditures for salaries are determined in accordance with established staffing guidelines that are based on projected student enrollment at each individual campus.
89.24%
5.30%4.05%
1.30%
0.11%
General Fund Expenditures by Major Object
Payroll Cost
Purchase & cont. serv.
Supplies and materials
Other operating expend
Capital outlay
7

Executive Summary (continued) The following graph depicts the District’s budget emphasis on curriculum and instruction while continuing to control and monitor administrative expenditures.
84%
1%
2%
13% General Fund Expenditures by Major Function
Instruction
Instructional administration
General administration
Plant maintenance &operations
Debt Service Fund Debt Service fund revenue is budgeted to decrease $2,239,845 or 2.7% under 2017-2018 projected revenue. The 2018-19 Debt Service tax rate was reduced to $0.22 compared to $0.24 in 2017-18. As a result of the impact of Hurricane Harvey, Governor Abbott added Montgomery County to his state disaster declaration list on August 26, 2017, and he requested federal and state disaster assistance at that time. Because the District had increased expenditures in response to Hurricane Harvey, the District was then be eligible to raise its maintenance and operations taxes above the rollback rate without a ratifying election. This one time exception is in accordance with Section 26.08(a) of the Texas Tax Code. The District took advantage of this one
time exception and raised the M&O tax rate by two cents. In order to maintain the same overall tax rate of $1.28 the Debt Service rate was decreased by two cents. The following table provides a comparison of revenues by source for the current year (projected) and the 2018-2019 budget year:
Projected Budget Percent
2017-18 2018-19 Change
Local Sources $81,457,812 79,122,595$ -2.87%
State Sources 1,535,600 1,630,972 6.21%
Total 82,993,412$ 80,753,567$ -2.70%
Debt Service Fund Revenue Sources Comparison
Debt Service Fund expenditures are budgeted at $103,055,656, an increase of $2,658,484 or 2.58% over 2017-2018 projected expenditures.
8

Executive Summary (continued)
Capital Projects Fund
The Capital Projects fund accounts, on a project basis, for projects financed by the proceeds from bond issues, or for capital projects otherwise mandated to be accounted for in this fund. The capital projects fund utilizes the modified accrual basis of accounting.
Capital Projects fund expenditures are budgeted to increase $9,063,942 or 5.6% from 2017-2018 projected expenditures. The majority of capital projects approved in the 2015 bond referendum will be completed by August 2019. The following tables provides a detail of expenditures in the Capital Projects fund over the past four years and the 2018-19 budget year.
$0
$25,000
$50,000
$75,000
$100,000
$125,000
$150,000
$175,000
2014-15 2015-16 2016-17 2017-18 2018-19
Tho
usand
s
Expenditures
Food Service Fund
Food Service fund revenue for the 2018-19 school year is budgeted to remain consistent with the projected 2017-18 revenue. The following table provides a comparison of revenues by source for the current year projected and the 2018-19 budget year.
Projected Budget Percent
2017-18 2018-19 Change
Local Source 8,310,970$ 9,105,358$ 9.56%
State Source 95,752 - -100.00%
Federal sources 13,789,449 12,894,642 -6.49%
Total 22,196,171$ 22,000,000$ -0.88%
Food Service Fund Revenue Sources Comparison
Federal revenue in the Food Service Fund is received from the U. S. Department of Agriculture under the National School Lunch Program, the School Breakfast Program and the Food Distribution Program.
Food Service fund expenditures are budgeted at $22,000,000, an increase of $326,006 or 1.5% more than 2017-2018 projected expenditures.
The vast majority of the expenditures in the food service program are for labor and food costs. It is recommended that the fund balance for Food Service not exceed approximately three months of average food service operation expenditures. The current fund balance is projected at $3,517,732 which is within these guidelines. These balances must be used exclusively for allowable child nutrition program purposes.
9

Executive Summary (continued)
Long Range Financial Forecasts
General Fund & Debt Service Fund The general and debt service funds have two primary sources of revenue, tax collections and state funding. Expenditures in the general fund are allocated primarily to personnel while expenditures incurred in the debt service fund are for the payment of bond principal and interest. Many factors are taken into consideration when developing long range forecasts including enrollment projections, taxable value estimates, State aid estimates, legislative changes, and economic conditions that may impact the district.
Budgeted Projected Projected Projected
2018-19 2019-20 2020-21 2021-22
Total Revenue 502,275,482$ 507,244,938$ 507,398,028$ 518,054,652
Total Expenditures (495,459,113) (514,245,484) (533,713,093) (553,937,963)
Other Uses - - - -
Change in Fund Balance 6,816,369$ (7,000,546)$ (26,315,065)$ (35,883,311)$
Fund Balance - Beg of Year 138,088,222$ 144,904,591$ 137,904,045$ 111,588,980$
Fund Balance - End of Year 144,904,591$ 137,904,045$ 111,588,980$ 75,705,669$
Budgeted Projected Projected Projected
2018-19 2019-20 2020-21 2021-22
Total Revenue 80,753,567$ 90,848,190 94,432,699$ 98,160,094
Total Expenditures (103,055,656) (101,846,538) (101,846,319) (101,846,563)
Other Uses - 5,000,000 5,000,000 5,000,000
Change in Fund Balance (22,302,089)$ (5,998,348)$ (2,413,620)$ 1,313,531$
Fund Balance - Beg of Year 32,151,683$ 9,849,594$ 3,851,246$ 1,437,626$
Fund Balance - End of Year 9,849,594$ 3,851,246$ 1,437,626$ 2,751,157$
General Fund
Debt Service Fund
10

Executive Summary (continued)
Tax Rate Impact
The District’s tax rate consists of two separate components — maintenance and operations rate (General Fund) and a debt service rate. The overall 2018-19 combined rate will remain at $1.28 due to the factors discussed above. Taxes are calculated by dividing the assessed property value (less the homestead exemption amount, if applicable) by 100 and multiplying by the tax rate. The Montgomery County Appraisal District determines property values.
0.80
1.00
1.20
1.40
1.60
1.80
Co
mb
ine
d T
ax
Ra
te
Fiscal Year
Tax Rate History
Debt Service Maintenance & Operations
Budget Process and Significant Changes
The State, the TEA, and the local district formulate legal requirements for school district budgets. These requirements are stipulated in detail within the subsequent sections of this document.
The budget process begins in December of each year with the preparation of the budget calendar and enrollment projections. These enrollment forecasts are used extensively during the budget development stage to determine campus allotments and staffing allocations.
In order to decentralize the budget process, site-based decision making teams, working under the direction of each campus principal, contribute extensively to campus budget decisions. Each campus receives a basic allotment per student to be used for supplies, materials, equipment, staff development and other appropriate instructional costs. The basic allotment to campuses for the 2018-19 budget year has remained the same as the prior year. The site-based decision making teams make decisions concerning utilization of this allocation.
Budgets for non-campus units are developed by department heads and reviewed by the Superintendent and the Chief Financial Officer.
Established staffing guidelines are utilized to develop payroll budgets. Personnel units are allocated to each campus based on student enrollment following state mandated ratios as applicable. Non-campus personnel units are evaluated at each departmental budget. Additional personnel units are evaluated each year and after extensive review and analysis, recommendations are presented to the Board of Trustees.
Following this development process, consolidated budgetary information is presented to the Board of Trustees in workshops and regular meetings.
11

Executive Summary (continued) This information is summarized in this draft document and line item detail is provided, as requested, through written and oral supporting information.
Encumbrance accounting is utilized in all funds. Encumbrances for goods or purchased services are documented by purchase orders or contracts. Under Texas law, General Fund appropriations lapse each August 31, and encumbrances outstanding at that time are to be either canceled or appropriately provided for in the subsequent year's budget. Significant Changes The budget development process has not significantly changed for the 2018-19 fiscal year. One of the priorities when developing the budget for 2018-19 was managing the increased property tax revenue as a result of continued growth in assessed values. While we will benefit from the tax revenue growth in this year our focus was on planning for future reductions in funding from the state due to the increased property values.
District Profile
Residents of the District elect a seven-member Board of Trustees (the Board), each of whom serves for three years. Monthly meetings of the Board are posted and advertised as prescribed under state laws so that the Board may fulfill its charge to the students, parents, staff, and taxpayers of the District. Special meetings or study sessions are scheduled as needed. The Board has final control over all school matters except as limited by state law. The District’s vision of where it is headed is the culmination of months of study, collective thought, and thoughtful activities by all constituent groups in the District. 2018: A Vision for CISD
CISD is a learning community united in its commitment to ensuring all students graduate with confidence and competence. The schools and communities work together to provide performance
standards which can be applied to the real world. This is achieved through the implementation of quality in instruction, operations, and leadership.
Conroe ISD has developed a District Improvement Plan as well as Campus Improvement Plans based on comprehensive needs assessments. These plans guide the District and Campus Level Planning and Decision Making Committees in determining specific strategies which will strengthen the attainment of the District's vision. District and campus goals include:
Student achievement & post-secondary success;
Fiscal responsibility;
Recruitment, development & retention of staff;
Parents & community;
Safe schools;
Technology;
Communication; The annual budget serves as the foundation for the District’s financial planning and control. The District maintains budgetary controls throughout all of its financial systems. The objective of these controls is to ensure compliance with legal provisions embodied in the annually appropriated budget approved by the Board of Trustees. Activities of the general fund, special revenue funds, debt service fund and capital projects funds are included in the annually appropriated budget. The level of budgetary control (the level at which expenditures cannot legally exceed the appropriated amount) is established by function within each individual fund. The District also maintains an encumbrance accounting system as one technique of
12

Executive Summary (continued) accomplishing budgetary control. Although encumbered amounts lapse at year-end, they are generally re-appropriated as part of the next year's budget through a Board-adopted budget amendment.
Factors Affecting Financial Condition The information presented in the budget is perhaps best understood when it is considered within the broader perspective of the specific environment in which the District operates. Located just north of Houston, Texas in Montgomery County, serving the communities of Conroe, The Woodlands, Oak Ridge North, Shenandoah, and Cut ‘n Shoot, the District’s boundaries encompass approximately 348 square miles in Montgomery County and is a dynamic factor in the quality of life and economic development efforts of the area. Residential properties account for approximately 66.5% of net taxable AV, followed by commercial and industrial properties, which account for nearly 18.5% of net taxable AV. While the oil-and-gas industry and mineral production have a substantial presence in the regional economy, these activities make up a minimal amount of the tax base. Furthermore, the district is bisected by the Houston-Dallas Freeway (Interstate 45), U.S. Highway 75, and state highways 105 and 242. These highways connect residents with employment opportunities in the rapidly expanding Houston MSA, which we consider broad and diverse. Therefore, district population growth remains strong. Likewise, there has been substantial AV growth within the district as market values have continued to increase. The following table provides information on the district’s top ten taxpayers and employers.
Total Assessed Top Ten Employers Employee Count
Anadarko Realty Co 356,347,330$ Conroe Independent School District 7454
Entergy Texas Inc 171,285,260$ Anadarko Petroleum Corporation 3309
The Woodlands Mall 170,212,605$ Memorial Hermann The Woodlands Hospital 2454
McKesson Corporation 155,798,317$ Montgomery County 2211
IMI Market Street LLC 129,595,770$ Alright Solutions 1850
Woodlands Land Dev 128,878,592$ ExxonMobil 1800
HL Champion Holding Company LLC 115,000,000$ CHI St. Luke's Health The Woodlands 1650
Wal-Mart Real Estate 112,200,004$ Conroe Regional Medical Center 1226
Ball Metal Container Corp 92,227,300$ Lone Star College 1098
National Oilwell Varco 84,265,332$ Huntsman Corporation 1018
Top Ten Tax Payers
Conroe Independent School District is the 13th largest district in the State and the 65th largest in the United States, serving over 63,000 students at 63 campuses. The Conroe Independent School District is among the fastest growing school districts in the state with a growth of approximately 1,200-1,600 additional students each year (which represents 2.2 % of the total 63,014 student population), and is projected to surpass an enrollment of 74,000 students by the year 2027. Conroe ISD covers almost one-third of Montgomery County, which is the 7th fastest growing county in the United States according to recent Census Bureau estimates. Employment Trends & Economy Unlike most of the State and nation, unemployment has remained fairly stable or has declined in both Conroe and Montgomery County over the past several years. The predominantly residential district is in one of the fastest-growing counties in the state. The district is experiencing healthy tax base expansion. The district's underlying economy continues to experience significant growth, spurred by new residential and commercial development, particularly along the I-45 corridor. About 5,000 acres of land are in various stages of master planning or construction, which should add thousands of new residences over the next several years and could significantly affect district AV and enrollment. The relocation of several major and large corporate office to The Woodlands and South Montgomery County – Anadarko, McKesson, Hewitt & Associates, Denbury Onshore
13

Executive Summary (continued) LLC, Exxon Mobile etc. has had a positive impact on the tax base, while also bringing an influx of families and potential students to Montgomery Country and the schools of Conroe ISD. The chart below displays comparative employment statistics for the county, state and country.
Montgomery County
Year Personal Per Capita Percent Percent Percent
Ended Civilian Total Incomeª Personalª Unemployed Unemployed Unemployed
August 31 Labor Force Employment (In Thousands) Income County State U.S.
2009 210,934 194,632 20,366,481 45,490 7.7 8.1 9.6
2010 220,539 203,453 20,753,439 45,184 7.7 8.4 9.5
2011 227,955 210,846 22,882,899 48,508 7.5 8.4 9.1
2012 237,435 222,574 24,638,680 50,796 6.3 7 8.2
2013 244,071 231,189 26,549,916 53,192 5.3 6.3 7.3
2014 253,103 241,166 28,982,523 55,849 4.7 5.5 6.3
2015 250,993 240,362 32,516,990 60,490 4.2 4.4 5.2
2016 259,617 245,412 32,516,990 60,490 5.5 5.0 5
2017 261,159 249,459 32,516,990 60,490 4.5 4.5 4.5
2018 272,940 262,593 32,516,990 60,490 3.8 3.9 3.9
ª Personal & per capita income information is only available through 2015 therefore the same income was used through 2018
Labor Market Statistics
With strong collaborative ties with the chambers of commerce and the business community, with the other local governmental entities in the area and with the Lone Star College System, CISD is making new inroads in building support and targeting resources to achieve the greatest impact for all of our students. The financial, cultural, educational and recreational climate of the area is a testimony to the collective leadership and to the communities’ progressive attitude toward responsible growth and their vision of the future.
Major Indicators In looking at the most common indicators of quality in a school system, the following are examples of what is going on in the District: Test Scores In 2011-12 the TAKS test was replaced by a new standardized test called the State of Texas Assessment of Academic Readiness (STAAR). The district received an overall performance rating of “B” on the 2018 Accountability Summary. The district performed above state standards on all four Performance Indexes which include Student Achievement, Student Progress, Closing Performance Gaps and Postsecondary Readiness. In addition, the district met standard on all required safeguards which include Performance Rates, Participation Rates, & Graduation Rates. Scholastic Aptitude Test (SAT) scores have also risen over the last several years and are above the national averages even when a higher percentage of District students take the test than their peers across the nation. In 2017-18 Conroe ISD continues to test a high number of students on the SAT (2,454) and ACT (2,305). Attendance Rate - Despite the rapid growth in the District and the problems facing families today, the attendance rate (96.4%) in the District remains high.
14

Executive Summary (continued) Completion Rate - The District’s 2017 graduation rate was 95.6% and is well above the State average, meaning more students are finishing high school and are entering college or the work force. Student Attitude - In a survey used to evaluate the District’s curriculum areas, students revealed that they believe they are receiving a quality education.
Public Support - The 2015 Bond Referendum passed with a positive vote in every geographic area of the District. Patrons continue to be extremely supportive of the District’s efforts. The bond referendum includes the construction of new schools and classroom additions to accommodate student growth, improvements to aged buildings to sustain capacity, funding for robotics and Career and Technical Education facilities, and the continuation of safety and security upgrades. Other Information The District received its Financial Integrity Rating System of Texas (FIRST) score from the Texas Education Agency for fiscal year 2016-2017 and the District scored the highest rating attainable - “Superior”. Conroe ISD continues to receive recognition for transparency from the Texas Comptroller of Public Accounts earning Transparency Stars for Traditional Finances, Contracts & Procurement, and Debt Obligations. Conroe ISD was recognized by the Comptroller’s Office for being the state’s first local government entity to receive the Debt Obligations Transparency Star.
Conroe ISD has earned a 5‐Star Rating by the 2018 Texas Smart Schools. Conroe ISD is one of
only 3 ISD’s to receive a 5‐Star rating for all eight years.
Conroe ISD received a 1.1 rating from the Education Resource Group (ERG) for high academic performance by students and efficiency in spending. The District is 1 of 12 school districts in Texas to receive this top ranking.
Key Factors and Summary
Challenges The most significant challenge presented in forming the Conroe ISD budget is the continual increase in student enrollment of 1200-1600 per year. The continued increase of enrollment requires additional financial resources to fund areas such as, campus personnel, support staff, instructional facilities, equipment, and supplies. In addition to the recurring required increases that are necessary in every budget year, the opening of new campuses provides significant challenges. With these new costs the district has increased the 2018-19 General Fund budget by $16,736,388 or 3.5% over the projected expenditures for 2017-18. Payroll costs account for the largest portion of the increase at $15.8 million or 98.2% of the total budget increase. The District feels certain that even with these challenges the District will be able to maintain a constant and stable fund balance in the General Fund. Each section of this report will show how the challenges that face the District can be met due to the following factors.
Continued growth of the tax base (averaging 6.9% over past 10 yrs.)
Ability to raise the tax rate if necessary
State Funding being based on student attendance
Voter support for Bond Referendums
15

Executive Summary (continued) Funding Sources
The General and Debt Service funds receive funding from two major sources: tax revenues and state funding. The District receives approximately 74% of its revenues from local sources. Although the District’s student population is growing, the District tax base is growing at an even faster rate. With the growth in the District’s tax base, the District is able to provide adequate funding to cover the increased cost due to student growth, and provide resources necessary for reaching the goals established by the District. The Capital Projects Fund receives its funding from the proceeds from the sale of bonds. These bonds are approved through bond referendums that are approved by the voters in Conroe ISD. The last bond referendum was approved in 2015 in the amount of $487,000,000. The Food Service Special Revenue Fund has two major sources of revenue, national school lunch and breakfast program and user fees –i.e. student payments for meals. The national school program accounts for approximately (59%) of the budget and user fees generate (41%). The 2018-19 budget was developed according to goals and directions established by the Board of Trustees and the Superintendent. These goals are evident in all areas of the budget as resources are allocated as necessary to meet the established criteria. Acknowledgments - We would like to express appreciation to the Board of Trustees for concern in providing fiscal accountability to the patrons of our District and for its leadership in the development of one of the best educational operations within the State of Texas. Many hours have been devoted to this District by teachers, principals and administrators, and thanks is extended to the entire Conroe Independent School District Team who have worked so hard to provide a high-quality, cost-efficient education to the students we serve. Additionally, the preparation of this report was accomplished through much time and effort on the part of the District’s Finance Department and special appreciation is expressed to them.
16

Conroe Independent School District
17

This Meritorious Budget Award is presented to
CONROE INDEPENDENT SCHOOL DISTRICT
for excellence in the preparation and issuance of its budget for the Fiscal Year 2017–2018.
The budget adheres to the principles and standards of ASBO International’s Meritorious Budget Award criteria.
Charles E. Peterson, Jr. MBA, PRSBA, SFO John D. Musso, CAE, RSBA President Executive Director
18

Organizational Section

Su
per
inte
nd
ent
Dep
uty
Su
per
inte
nd
ent
CIS
D B
oar
d o
f T
rust
ees
Inte
rnal
Au
dit
or
Co
mm
un
icat
ion
s D
irec
tor
Ch
ief
Fin
anci
al
Off
icer
Dis
tric
t-L
evel
Pla
nn
ing
an
d D
ecis
ion
-Mak
ing
C
om
mit
tee
Gen
eral
Co
un
sel
Hu
man
Res
ou
rces
Dir
ecto
r
Ch
ief
of
Po
lice
Ass
ista
nt S
up
erin
ten
den
t o
f O
per
atio
ns
Net
wo
rk
Sy
stem
s D
irec
tor
Cu
sto
dia
l &
Mai
nte
nan
ce D
irec
tor
Pla
nn
ing
&
Co
nst
ruct
ion
Dir
ecto
r
Tra
nsp
ort
atio
n
Dir
ecto
r
Sp
ecia
l Ed
uca
tio
n D
irec
tor
Ass
essm
ent
&
Ev
alu
atio
n D
irec
tor
Ath
leti
cs
Dir
ecto
r
Co
mm
un
ity
O
utr
each
Dir
ecto
r In
form
atio
n S
yst
ems
Dir
ecto
r
Sch
oo
ls
Ass
ista
nt
Su
per
inte
nd
ent
fo
r E
lem
enta
ry
Ed
uca
tio
n
Ele
men
tary
E
du
cati
on
Dir
ecto
r
Fed
eral
Pro
gra
ms,
C
om
pli
ance
, &
Gra
nts
Dir
ecto
r
Ass
ista
nt S
up
erin
ten
den
t f
or
Sec
on
dar
y E
du
cati
on
Sch
oo
ls
Cu
rric
ulu
m,
Inst
ruct
ion
, & S
taff
D
evel
op
men
t D
irec
tor
Car
eer
& T
ech
nic
al
Ed
uca
tio
n D
irec
tor
Fin
e A
rts
Gu
idan
ce &
Co
un
seli
ng
C
oo
rdin
ato
r C
hil
d N
utr
itio
n
Dir
ecto
r S
afet
y
Co
ord
inat
or
19

Conroe Independent School District
Vision Statement
Conroe Independent School District is a learning community united in its commitment to ensuringall students graduate with confidence and competence. The schools and communities worktogether to provide performance standards which can be applied to the real world. This isachieved through the implementation of quality in instruction, operations, and leadership.
Strategic Goals
1. Student Achievement and Post-secondary SuccessCISD will maintain rigorous standards of achievement to prepare all students for graduationand post-secondary success.
2. Fiscal ResponsibilityCISD will maintain efficient and effective fiscal management of resources and operations tomaximize learning for all students.
3. Recruitment, Development, and Retention of StaffCISD will employ, develop, and retain highly qualified staff to maximize learning for allstudents.
4. Parents and CommunityCISD will work jointly with parents and the community to maximize learning for all studentsthrough collaborative partnerships and unity of purpose.
5. Safe SchoolsCISD will strive to ensure a safe and orderly environment conducive to learning for allstudents and staff.
6. TechnologyCISD will provide technology infrastructure, tools, and solutions to meet the administrativerequirements of the district and to maximize learning for all students.
7. CommunicationCISD will promote and enhance two-way communication among our staff and our communityto maximize the success of all students.
20

District Improvement Plan 2018-2019
Rating: Met Standard
GOAL 1: STUDENT ACHIEVEMENT AND POSTSECONDARY SUCCESS MASTER RIGOROUS ACADEMIC STANDARDS – STUDENT ACHIEVEMENT, STUDENT PROGRESS, CLOSING PERFORMANCE GAPS and SUCCESSFUL COMPLETION OF HIGH SCHOOL
ACCOUNTABILITY DOMAIN I: STUDENT ACHIEVEMENT - Evaluates performance across all subjects for all students on both general and alternate assessments; high schools include – College, Career, and Military Readiness (CCMR) indicators, and graduation rates.
DOMAIN I OBJECTIVES: All students/all subjects combined
2017-2018 Performance
85% Approaching Grade Level Standards
62% Meeting Grade Level Standards
34% Mastering Grade Level Standards
2018-2019 Goals (All students combined)
90% Approaching Grade Level Standards
67% Meeting Grade Level Standards
39% Mastering Grade Level Standards
DOMAIN II: SCHOOL PROGRESS - Measures district and campus outcomes in two areas:
Part A: Academic Progress –the number of students that grew at least one year academically (or are on track) as measured by Reading and Math STAAR results. Part B: Relative Performance – the achievement of all students relative to districts or campuses with similar economically disadvantaged percentages.
DOMAIN II OBJECTIVES: Reading and Math; all students, seven racial/ethnic groups, ELL, SpEd; weighted progress
2017-2018 Performance All Students Reading Math
Met Expected or Accelerated Growth measure 67% 66% 69% Met Accelerated Growth measure only 24% 22% 26%
2018-2019 Goals All Students Reading Math
Will meet Expected or Accelerated Growth measure 72% 71% 74% Will meet Accelerated Growth measure only 29% 27% 31%
FEDERAL ACCOUNTABILITY: CLOSING THE GAPS Support Area District Target Student Groups
Academic Achievement in Reading Academic Achievement in Math Growth in Reading Pacific Islander Growth in Math Graduation Rate African American, Economically Disadvantaged, English Learners, Special
Education
21

Support Area District Target Student Groups English Language Proficiency Student Success School Quality Special Education
DOMAIN III: CLOSING THE GAPS - Uses disaggregated data to demonstrate differentials among racial/ethnic groups, socioeconomic backgrounds, and other factors. The indicators included in this domain align the state accountability with Every Student Succeed Act (ESSA).
DOMAIN III OBJECTIVES: Reading and Math at Meets Grade Level Standards – All students, seven racial/ethnic groups, Eco Dis, SpEd, former SpEd, Current and monitored ELLs (through year 4), Continuously and Non-Continuously enrolled.
2017-2018 Performance:
Economically Disadvantaged Students
74% scored Approaching Grade Level Standards
17% scored Mastering Grade Level Standards
Focus Student Group: EL Current
61% scored Approaching Grade Level Standards
8% scored Mastering Grade Level Standards
Focus Student Group: SpEd Current
49% scored Approaching Grade Level Standards
9% scored Mastering Grade Level Standards
2018-2019 Goals:
Economically Disadvantaged Students
79% will score Approaching Grade Level Standards
22% will score Mastering Grade Level Standards
Focus Student Group: EL Current
66% will score Approaching Grade Level Standards
13% will score Mastering Grade Level Standards
Focus Student Group: SpEd Current
54% will score Approaching Grade Level Standards
14% will score Mastering Grade Level Standards
READING/ELA 2017-2018 Performance:
Economically Disadvantaged Students
70% scored Approaching Grade Level Standards
14% scored Mastering Grade Level Standards
Focus Student Group: EL Current
54% scored Approaching Grade Level Standards
6% scored Mastering Grade Level Standards
Focus Student Group: SpEd Current
43% scored Approaching Grade Level Standards
8% scored Mastering Grade Level Standards
2018-2019 Goals:
Economically Disadvantaged Students
75% will score Approaching Grade Level Standards
19% will score Mastering Grade Level Standards
Focus Student Group: EL Current
59% will score Approaching Grade Level Standards
11% will score Mastering Grade Level Standards
Focus Student Group: SpEd Current
48% will score Approaching Grade Level Standards
13% will score Mastering Grade Level Standards
TARGET/FOCUS:
• Re-examine effectiveness of small group instruction, including Guided Reading, through an in-depth examination ofclassroom practices.
• Focus on the critical role of accessible texts and the expert teaching in the process of reading.
22

• Focus on teaching in genres for an in-depth understanding, the implementation of teaching fiction and nonfiction, and textbridging reading with writing.
• Focus on higher levels of questioning and critical thinking.
READING/ELA CURRICULUM, INSTRUCTION AND STAFF DEVELOPMENT
• Provide support of Tier I Differentiated Instruction through modeling and training of best practices such as levels ofquestions and critical thinking.
• Provide staff development and planning support to increase quality instructional practices to grow readers by deepeningteacher understanding.
• Provide training on using literacy assessments to gather data to guide small group (Guided Reading) instruction.• Instructional Coaches will provide campus-based trainings throughout the school year, targeting current best practices in
the teaching of reading.• Professional development will demonstrate collaboration between ELA, SLA, Bilingual/ESL and Special Education
departments.• Support the inclusion of student choice in book selection to foster independent reading and increase reading capacity.• Integrate specially designed instruction (SDI) into lesson planning and consider SDI when creating learning activities,
assignments, assessments and projects.• Adapt content, methodology and/or delivery of instruction to eliminate barriers to access the curriculum and meet
individual needs.
WRITING 2017-2018 Performance:
Economically Disadvantaged Students
58% scored Approaching Grade Level Standards
7% scored Mastering Grade Level Standards
Focus Student Group: EL Current
42% scored Approaching Grade Level Standards
3% scored Mastering Grade Level Standards
Focus Student Group: SpEd Current
33% scored Approaching Grade Level Standards
5% scored Mastering Grade Level Standards
2018-2019 Goals:
Economically Disadvantaged Students
63% will score Approaching Grade Level Standards
12% will score Mastering Grade Level Standards
Focus Student Group: EL Current
47% will score Approaching Grade Level Standards
8% will score Mastering Grade Level Standards
Focus Student Group: SpEd Current
38% will score Approaching Grade Level Standards
10% will score Mastering Grade Level Standards
TARGET/FOCUS:
• Examine the fidelity of implementation of the Writing Workshop approach to writing instruction and the use of therecommended resources for the teaching of writing.
• Maintain the vertical alignment of a Writer’s Workshop approach to support the explicit teaching of writing.• Incorporate strategies within the workshop approach to support teaching grammar in context, how to help students
develop skill and craft in the revision process of writing, and how to move students from formulaic to authentic writing.
WRITING CURRICULUM, INSTRUCTION AND STAFF DEVELOPMENT
• Staff development will be provided at the Homegrown Writing Institute to train on the Writer’s Workshop approach toteaching writing using the Lucy Calkins Units of Study.
• Staff development on the teaching of grammar and revision strategies using research based best practices.• Provide campus based “customized” writing trainings throughout the school year.• Professional development will demonstrate collaboration between ELA, SLA, Bilingual/ESL and Special Education
departments.
23

• Professional learning opportunities will be provided to staff on the reciprocity of reading and writing.
MATH 2017-2018 Performance:
Economically Disadvantaged Students
81% scored Approaching Grade Level Standards
20% scored Mastering Grade Level Standards
Focus Student Group: EL Current
76% scored Approaching Grade Level Standards
14% scored Mastering Grade Level Standards
Focus Student Group: SpEd Current
58% scored Approaching Grade Level Standards
10% scored Mastering Grade Level Standards
2018-2019 Goals:
Economically Disadvantaged Students
86% will score Approaching Grade Level Standards
25% will score Mastering Grade Level Standards
Focus Student Group: EL Current
81% will score Approaching Grade Level Standards
19% will score Mastering Grade Level Standards
Focus Student Group: SpEd Current
63% will score Approaching Grade Level Standards
15% will score Mastering Grade Level Standards
TARGET/FOCUS:
• Provide professional learning opportunities for all math teachers in identifying individual academic needs of all studentpopulations and using Differentiated Instruction to develop math strategies to modify for identified gifted math studentsand/or close learning gaps.
• Provide strategies and professional learning opportunities in the use of age appropriate algebra readiness skills as part ofCISD Solves Math Structure.
• Focus small group math instruction such as in guided math, tracking individual progress through documentation usinganecdotal notes, and the implementation of effective tutorial programs for teachers.
MATH CURRICULUM, INSTRUCTION STRATEGIES AND STAFF DEVELOPMENT
• Provide staff development in the areas of guided math, the use of algebra tiles, and the understanding of the processstandards.
• 90 Minutes of Student-Centered Math• Numberless Word Problems• Numeracy, Open Question, and all Parallel Tasks• Math in Action Series• Integrate specially designed instruction (SDI) into lesson planning and consider SDI when creating learning activities,
assignments, assessments and projects.• Adapt content, methodology and/or delivery of instruction to eliminate barriers to access the curriculum and meet
individual needs.
24

SOCIAL STUDIES2017-2018 Performance:
Economically Disadvantaged Students
77% scored Approaching Grade Level Standards
28% scored Mastering Grade Level Standards
Focus Student Group: EL Current
52% scored Approaching Grade Level Standards
7% scored Mastering Grade Level Standards
Focus Student Group: SpEd Current
52% scored Approaching Grade Level Standards
12% scored Mastering Grade Level Standards
2018-2019 Goals:
Economically Disadvantaged Students
82% will score Approaching Grade Level Standards
33% will score Mastering Grade Level Standards
Focus Student Group: EL Current
57% will score Approaching Grade Level Standards
12% will score Mastering Grade Level Standards
Focus Student Group: SpEd Current
57% will score Approaching Grade Level Standards
17% will score Mastering Grade Level Standards
TARGET/FOCUS:
• Integrate content literacy strategies K-12 with Pre-Reading, During Reading, and After Reading support from the SocialStudies Strategy Manual.
• Provide classroom instruction utilizing Differentiated Instruction, Quality Questioning, Cooperative Learning, and FormativeAssessments.
• Assist teachers in designing units based on enduring understandings that answer essential questions.
SOCIAL STUDIES CURRICULUM, INSTRUCTION AND STAFF DEVELOPMENT
• Professional learning opportunities will be provided for teachers to develop their understanding of inquiry-based learning.• Training will be provided in engagement from the Social Studies Model by attending Social Studies Alive! and History Alive!• Teachers will be provided professional development in “Teaching Social Studies to ELL’s,” a text supported through Seidlitz
Education.• A focused group of teachers have been trained in 7 Steps to a Language-Rich Interactive Classroom and will continue to
receive support throughout the year.• Social Studies will provide strategies for teaching the literacy strand of the Social Studies Processing Standards at
Leadership Team Meetings.
SCIENCE2017-2018 Performance:
Economically Disadvantaged Students
78% scored Approaching Grade Level Standards
17% scored Mastering Grade Level Standards
Focus Student Group: EL Current
59% scored Approaching Grade Level Standards
4% scored Mastering Grade Level Standards
Focus Student Group: SpEd Current
53% scored Approaching Grade Level Standards
9% scored Mastering Grade Level Standards
2018-2019 Goals:
Economically Disadvantaged Students
83% will score Approaching Grade Level Standards
22% will score Mastering Grade Level Standards
Focus Student Group: EL Current
64% will score Approaching Grade Level Standards
9% will score Mastering Grade Level Standards
Focus Student Group: SpEd Current
58% will score Approaching Grade Level Standards
14% will score Mastering Grade Level Standards
25

TARGET/FOCUS:
• Provide support for teachers as they improve vocabulary building in Science through Science Interactive Word Walls andthe use of Marzano Words identified in the Scope and Sequences.
• Provide support for teachers as they work to build student critical thinking skills using CERs (Claim, Evidence, Reasoning).• Provide gifted services, to identified students that deliver challenging learning experiences with depth and complexity and
result in the creation of advanced-level products.
SCIENCE CURRICULUM, INSTRUCTION AND STAFF DEVELOPMENT
• Provide professional learning opportunities on Science Interactive Word Walls to science teachers.• Professional learning opportunities will be provided on science best practices including: Science Interactive Notebooks,
Designing and Building 5E Lessons, Quality Questioning, and small group instruction.• Science Instructional Staff will provide training in vocabulary building using Marzano’s Six Step Process for Building
Academic Vocabulary during summer and afterschool professional learning opportunities.• Professional learning opportunities will be provided by a Science Instructional Coach in the area of common assessment
writing during teacher planning meetings.• Provide professional learning opportunities to support teachers as they work to build student critical thinking skills using
CERs (Claim, Evidence, Reasoning).• The Science Department will oversee the completion of the online TEA Science Safety course by all secondary science
teachers.• Staff development will be provided on increasing student engagement in the science classroom using the Eric Jensen book,
Engaging Students with Poverty in Mind: Practical Strategies for Raising Achievement.
PHYSICAL EDUCATION AND HEALTH PERFORMANCE OBJECTIVE: 80% of all students will meet a minimum of two Healthy Fitness Zone standard, as measured by the FitnessGram assessment
HEALTH CURRICULUM, INSTRUCTION AND STAFF DEVELOPMENT
• Provide instruction that allows students Moderate to Vigorous Physical Activity (MVPA) 70% of class time.• Provide students with relevant curriculum on the dangers of vaping.• Provide students with relevant curriculum on the risk factors of substance abuse and distracted driving.• Assess student’s Health-Related fitness biannually using the FitnessGram assessment.
AT-RISK AND SPECIAL POPULATIONS STRATEGIES AND STAFF DEVELOPMENT – (Eco Dis, Dyslexia, GT, ELL, Immigrant, SpEd, Homeless)
• Provide intensive, systematic tutoring for identified at-risk students during the day, after school, and summer school(providing transportation if needed).
• Provide mentors to targeted at-risk students.• Provide intensive, explicit, systematic, research-based reading instruction to identified dyslexic at-risk students.• Ensure EL students receive appropriate English language acquisition and sheltered instruction.• Ensure language development of EL students through effective ELPS implementation in content instruction.• Provide RtI through Tier 1 research-based best practices and Tier II and III interventions to facilitate academic improvement
for identified students.• Provide educational options for students who are overage, need to recover credits, and students who can benefit from
accelerated instruction.• All teachers provide differentiated instructional strategies to improve the achievement of all at-risk students.• Review, revise, and implement daily attendance procedures to meet 95% average attendance.• Ensure students are in attendance during the assessment windows.• Provide additional support to students who are pregnant, students who are parents, homeless families, EL, special
education, and migrant families to ensure students are provided differentiated educational opportunities.• Promote students as “Future CISD High School Students” through activities within feeder and district, including: football
games, pep rallies, student visits, parades, “Education: Generation Texas Week”, etc.
26

• Provide visits to feeder campuses to ensure students experience a smooth transition.• Provide on-going, job embedded staff development by district coaches to campus teachers and instructional coaches to
build capacity and strengthen CISD best practices.• Provide new student registration for incoming students to ensure students and families have all the needed information.• Utilize research based instructional strategies and materials to meet the unique needs of students who are at-risk.
SUCCESSFUL COMPLETION OF HIGH SCHOOL/POSTSECONDARY READINESS DISTINCTION DESIGNATIONS
POSTSECONDARY READINESS INDICATORS ALL CAMPUSES
• Attendance rate is used in determining distinction designations for academic achievement in ELA/reading, mathematics,science, and social studies.
• Attendance rate will increase from 96.38 % in 2017-2018 to 97.0% in 2018-2019
3-8 CAMPUSES• Percentage of Grade 3–8 Results at Meets Grade Level or Above in Both Reading and Mathematics• Percentage of STAAR Results at Meets Grade Level or Above Standard (All Subjects)
HIGH SCHOOL CAMPUSES The best of the 4-year, 5-year or 6-year State Graduation rates is used for Domain I: All students, 7 race/ethnic groups, SpEd, and EL. The best of these graduation rates for the 2017 graduates was the 6-year rate at 97.4%.
Goal for 2018 graduates: The best of the 3 rates will increase from 97.4% to 97.5%
COLLEGE, CAREER, AND MILITARY READY GRADUATES:
• Satisfy the TSI requirement on TSIA, SAT or ACT in both ELA and math or successfully completing and earning credit for acollege prep course as defined.
• Met criterion score on an AP-exam in any subject (3, 4 or 5).• Earned dual course credits for at least 3 hours in ELA and Mathematics or 9 hours in any subject.• Earned an industry-based certification from approved list.• Earned an associate’s degree while in high school.• Graduated with completed IEP and Workforce Readiness (graduation type code 04, 05, 54, or 55)• Enlisted in the U.S. Armed Forces.• CTE coherent sequence graduates with at least one CTE course aligned with an industry-based certification and not met any
other criteria (1/2 credit).
MEET ELIGIBLE CAMPUS ACADEMIC ACHIEVEMENT DISTINCTION DESIGNATIONS (AADD) Elementary, Intermediate, Jr. High and High School Campuses
• 55% of indicators will be in top quartile
DROPOUT PREVENTION PROGRAM
• Campus staff will seek assistance from the Office of Dropout Prevention before assigning a dropout withdrawal code to astudent who is at-risk.
ATTENDANCE
• Campus administration will utilize the District’s Attendance Specialist as a liaison between the campus and the courtsystem.
• Campus staff will run attendance reports weekly, contact parents, and file truancy charges after 10 unexcused absences.• Campus staff will code unexcused and excused absences correctly.• Campus staff will utilize the Dropout Prevention Department for attendance interventions designed to lower the number of
unexcused absences.
27

COLLEGE READINESS/ADVANCED COURSES
• Ensure Advanced Placement and Pre-Advanced Placement course offerings are available and communicated to all studentsand student groups.
• Utilize the AP Potential Report to recruit underrepresented student groups for AP courses.• Promote and monitor progress in dual credit courses through a collaborative agreement with Lone Star College
Montgomery.• Increase the number of students taking AP Exams.
GRADUATION PLANS
• Monitor EL, Special Education, and CTE 4-year graduation plans.• Provide increased awareness of CTE Endorsements and Career Pathways for all students.
COLLEGE ADMISSIONS AND READINESS
• Maintain a rigorous curriculum that is aligned with SAT and ACT examinations.• Expand SAT preparation courses for high school students.• Increase college readiness awareness and CCR course enrollment in junior high schools.• Build rapport with junior high schools to increase college readiness awareness.• Increase the percentage of 11th graders scoring at or above the TSI College readiness standards (writing score of 340 with a
minimum of 4 on essay, a minimum Reading score of 351, and minimum Math TSI standard score of 350).• Offer College Prep Math and English 4 College Prep on each campus for graduating seniors to increase their college
readiness which will satisfy the TSI college ready exam (student must score a “C” or better).• Provide leadership, training, and follow-through on the implementation of certification and licensing opportunities for
students.• Provide leadership, training, and follow-through on the implementation of the certification and licensing reporting system
for CTE teachers.• Ensure the CTE TEKS are met and core content area TEKS are imbedded within CTE courses.• Provide hands-on training in use of industry standard hardware and software and equipment.• Provide staff development on certification testing across the curriculum.• Ensure staff and students utilize industry standard equipment and software as resources within curriculum and assessment.• Build teacher capacity to fully implement certification options within the instructional setting.• Provide meaningful opportunities for students to access certification standards for learning.
FINANCIAL RESOURCES General Operating, Elementary and Secondary State Compensatory Education Funds Title Funds IDEA, Part B High School Allotment Funds Bilingual Allotment Funds Gifted and Talented Allotment Funds
ADDITIONAL RESOURCES Teacher Content Leadership Teams and District and Campus Instructional Coaches Curriculum: CISD Instructional Model, CISD Reads, CISD Solves, CISD Investigates, CISD Remembers, CISD English Language Acquisition Model for Bilingual Education Programs, Gifted & Talented, RtI, Dyslexia Services Assessment: STAAR, STAAR A, STAAR L, STAAR Alt, STAAR Alt 2, TELPAS, District Benchmark Results, District Curriculum Checkpoints, Campus Common Assessments, Universal Screeners, BAS, DRA, OS, QPS, SAT, ACT, CogAT, IOWA, Logramos Systems: View It, Eduphoria, Dashboard Campus Improvement Plans Hobson’s Naviance Student (researching and planning college and career options) Road Trip Nation
28

FORMATIVE EVALUATIONS NOVEMBER, JANUARY Item analysis and data disaggregation of Benchmark assessments Staff Development: track number attending per campus; target for specific campus needs Content Leadership Team Meetings: track meeting attendance by campus (# general, special, and bilingual/ESL teachers) and follow-up campus delivery
SUMMATIVE EVALUATIONS JULY TEA Accountability Summary, TAPR, PBMAS, AMAOs, DVM, Special Education Evaluation
PROJECT MANAGERS Curriculum, Instruction and Staff Development Department including Reading/ELA, Math, Science, Social Studies, Guidance and Counseling, College Readiness; Advanced Programs; CTE; Federal Programs; Dropout Prevention; Gifted & Talented, Bilingual/ESL; Student Support; Section 504, Dyslexia and Reading Intervention; Early Childhood; Special Education; Assessment, Accountability and Evaluation.
Goal 2: FISCAL RESPONSIBILITY CISD will maintain efficient and effective fiscal management of resources and operations to maximize learning for all students.
Objective 2.1 – Effective and Efficient Use of Financial Resources Strategies
• Maintain high academic results in a cost effective manner.• Implement long-range revenue and budget plans.• Maintain a fund balance of 25%.• Provide essential positions needed to accommodate growth in student population.• Provide competitive compensation to attract and maintain quality personnel.• Monitor and Evaluate possible bond refunding opportunities.
Objective 2.2 – Successful Implementation of Capital Projects Strategies
• Implement long-range master facilities plan.• Conduct Bond Program Board Workshop.• Continue to monitor student growth and adjust implementation timeline for capital projects, as appropriate.• Working with the CISD Board of Trustees.
Objective 2.3 – Effective and Efficient Operations Strategies
• Continue implementation of energy management program.• Continue implementation of operations improvement plans.• Continue to optimize campus allocations.
Financial Resources General Fund, Fund Balance, Debt Service Fund, Capital Projects Fund, Special Revenue Funds; Food Service Fund, Instructional Materials Fund
Additional Resources Conroe ISD Employees
29

Monitoring Timeline Formative: November, January, February, April Summative: July
Formative Evaluation Financial Reports at Board meetings, Bond Update at Board meetings, Board Workshops
Summative Evaluation Meet Performance Indicators for FIRST Rating, Texas Smart Schools, ERG and District
Project Manager(s): Primary: Chief Financial Officer, Deputy Superintendent Support: Accounting and Business Managers and Director of P&C
Goal 3: RECRUITMENT, DEVELOPMENT, AND RETENTION OF STAFF CISD will employ, develop, and retain highly qualified staff to maximize learning for all students.
Objective 3.1 – Recruitment of Staff Strategies
• Ensure the appropriate certification for all professional and paraprofessional staff.• Increase communication opportunities with high school students, minority candidates, shortage area candidates,
professionals, and paraprofessionals through partnerships with area colleges and universities, local Chambers ofCommerce, College Educator Preparation Programs, CISD Education Foundation, and College Advisory Board(s).
• Continue to offer, market, and expand the CISD “Grow Our Own” initiative to increase the pool of applicants for bilingualprofessional positions and special education professional positions.
• Ensure the CISD Recruitment Program is updated and includes revised recruiting materials, a variety of advertising, andtraining for all recruiters. Provide CISD link to colleges, universities, and education-related professional organizations.Participate in college, university, and ACP Job Fairs to promote District and increase pool of qualified applicants.
• Utilize university and regional service center data to assist in identification of critical certification shortage areas, criticalteacher supply areas, and ACP local and state initiatives.
• Participate in Region 4 Human Resources Services Assistance.• Continue review of compensation incentives to attract applicants from outside CISD, as well as from existing staff.• Continually study the District’s ability to provide an ethnically and racially diverse staff and continue to develop a pool of
minority applicants and shortage area applicants.• Continue to develop pools of qualified candidates in specialized areas, such as school counselors, academic shortage areas,
and other designated pools.• Coordinate the recruitment, selection, hiring, and campus placement of District pool of bilingual teachers.• Host the CISD Teacher Job Fair and the CISD Auxiliary Job Fair to encourage employment in CISD, contingent upon staffing
needs.• Host a fall and spring Student Teacher Reception to encourage professional employment in CISD and build on the pool of
qualified substitutes.• Conduct annual meeting for the Council for Minority Recruitment & Retention.• Maintain database on student teachers’ placement and develop an evaluation for recruiting purposes.• Conduct electronic surveys at professional new hire orientation meetings to collect feedback on the CISD recruitment and
hiring processes.• Reward CISD high school graduates returning to the District to teach with a $100 gift card by tracking and reporting
information to the CISD Educational Foundation.• Continue to provide Sam Houston State University field level experience placement in all areas of CISD.• Continue to expand HR for Principals for principals and supervisors, which provides immediate access to information such
as staffing, funding sources, and pertinent documents relating to T-TESS, Eduphoria Appraise/Strive, Absence Management,recruiting, interviewing, Bilingual Pool, and other resources essential to streamlining HR’s role as it relates to the principals.
30

• Continue to create instructional guides and training presentations for principals regarding frequently used programs such asEduphoria, WinOcular, and Absence Management.
• Coordinate and assist with applicant screening and participate on interview committees.• Utilize Substitute Orientation meetings as a means to source hard-to-fill teaching positions and increase pool of qualified
applicants.• Continue to enhance social media presence by utilizing Facebook, LinkedIn, Job Boards, and Twitter for recruiting purposes.• Provide specialized training for campus and District administrators based on current needs.• Continue to offer visits to college and university campuses to share the benefits of living and working in CISD.• Continue to provide informational sessions for District paraprofessionals and auxiliary employees who are interested in
obtaining their teaching certification.• Partner with the CISD Educational Foundation by recruiting and screening bilingual and special education para-professionals
who wish to pursue a degree in the field of education.• Utilize current technology to streamline Human Resources processes, such as electronic contracts and letters of reasonable
assurance, use of iPads during applicant screening and Skype for interviews.• Maintain and update the Human Resources website to provide ease of access to pertinent information and a more
attractive, modern layout for prospective employees.• Collaborate with the high school campus sponsors of the Texas Association of Future Educators (TAFE) organization to
promote interest in the field of education among high school students in Conroe ISD.• Partner with Sam Houston State University by participating in their “Grow Your Own” teaching camp for high school
students wanting to become education majors.
Objective 3.2 – Staff Development Strategies
• Provide professional learning opportunities and support for beginning teachers through The Novice Teacher Academy (NTA)for novice teachers with 0-1 years’ experience.
• Continue to offer and participate in the Leadership Cooperative Training Series to develop leadership skills in currentpositions or in preparation to become assistant principals, curriculum coordinators, counselors, diagnosticians, specialists orother leadership roles.
• Participate in Leadership Cooperative in which identified staff can further develop their leadership capacity for current andfuture opportunities.
• Support cohorts with universities to develop Master of Education and Doctoral programs for professional staff members.• Assist employees by providing content area materials to any CISD employee for assistance with passing the appropriate
TExES exams.• Continue to provide programs/scholarships to assist instructional aides in becoming certified teachers in shortage areas.• Offer 2-day TExES ESL preparation workshop to CISD teachers seeking ESL endorsement.• Provide partial reimbursement to teachers who add the ESL endorsement to their teaching certificate.• Provide a pre-screening interview process for bilingual teacher applicants to verify the quality of language proficiency.• Provide updated information and materials to teachers and administrators regarding implementation, transition, and
general requirements of T-TESS and SLOs.• Create professional learning modules that can be completed online to reduce the amount of time taken away from
instruction on campuses.
Objective 3.3 – Retention of Staff Strategies
• Maintain a level of competitive salaries.• Provide a benefits package to employees that is comparable to or better than that of our peer districts and provide access
to the Conroe ISD Employee Health and Wellness Centers at reduced costs.• Provide option for employees to participate in a comprehensive Employee Wellness Program, and host the annual Health
Fair, which helps connect employees with health and wellness related providers in the community.• Conduct regular Substitute Feedback and Satisfaction Surveys.• Retention of Novice Teacher Academy Participants ranges 90% or above.
31

• Greet new CISD teachers at the District’s New Teacher Staff Development Sessions (An Intro to CISD) to encourageprofessional relationships with new staff.
• Summarize and analyze professional turnover based on yearly data to identify trends.• Create an exit survey which will be designed to help the District recognize patterns in in turnover in order to make positive
changes to reduce attrition.
Financial Resources General Operating, Title Funds, IDEA, Part B
Additional Resources Technology, Area colleges and universities, Advisory Boards, Chambers of Commerce, Region Service Centers, Employee Benefits Committee, Principals, Central Office Staff, CISD Mentor Teachers, Sam Houston State University, Student Teacher Supervisors, CISD Education Foundation, CISD High Schools, Human Resources Data
Monitoring Timeline Formative: November, January Summative: July
Formative Evaluation Position Control reports, Human Resources reports to CISD Board (at Board meetings and workshops), Agendas and data for Council for Minority Recruitment & Retention, Recruiting reports, University and Regional Service Center partnership meetings, Training and staff development agendas/reports, NTA agendas, TASB Salary Survey, Professional New Hire Surveys, Student Teacher Surveys, Employee Exit Surveys, Substitute Feedback and Satisfaction Surveys
Summative Evaluation Meet Performance Indicators for TAPR, ESSA, and District
Project Managers Director of Human Resources, Assistant Director of Human Resource, Coordinator of Human Resources, Recruitment/Retention Specialist, Bilingual/ESL Coordinator, Director of Curriculum, Instruction, & Staff Development, and NTA Facilitators
Goal 4: PARENTS AND COMMUNITY CISD will work jointly with parents and the community to maximize learning for all students through collaborative partnerships and unity of purpose.
Objective 4.1 – Parent and Family Involvement Strategies
• Retain CISD parent and community outreach programs to support the educational achievement of CISD students (ex: CISDNewcomer Center, parent education classes, parent technology classes, parent center at county library, GED classes,Hispanic Parent Nights, Parent Orientation sessions in Spanish, Family Learning Nights, Dyslexia Information sessions, on-line parent sessions to support accelerated math).
• Facilitate education sessions for parents at various community/campus locations in order to address a variety of topicsincluding study skills, child development, support programs within CISD, curriculum, assessment, etc.
• Maintain the Parent Resource Center, with English and Spanish support, for parents of students with disabilities to provideinformation on CISD procedures, programs, resources, and contacts.
• Continue to provide the Transition and Resource Fair for students with disabilities.• Host Early Childhood Fair to support young learners and bring awareness to the program.• Facilitate parent information sessions and collect input regarding rezoning process for new K-6 campus opening August of
2019.• Utilize parent committees to develop bond priorities.• Provide opportunities for families to be engaged in academic events.• Provide opportunities for parents to participate in shared decision making at the campus level and district level.
32

Objective 4.2 – Community and Business Partnerships • Develop and expand CISD CTE partnerships with community agencies, businesses, industry organizations, and governmental
agencies to increase job shadowing and internship opportunities for CISD students.• Continue the development and distribution of the Student Activity Guide to better inform parents about non-school
activities available to their students throughout the District.• Continue to host CTE Career Expo to encourage business, community and parental involvement in career planning for CISD
students.• Host a New Teacher Vendor Fair for community businesses and organizations.• Continue support of Junior Achievement partnership.• Launch partnership with Tri-County Behavioral Healthcare to provide mental health and crisis services on two campuses:
Armstrong and Grangerland.• Expand partnership with Lone Star Family Health Services to provide dental care at the Grangerland clinic.
Financial Resources General Operating, Title Funds, IDEA, Part B
Additional Resources Technology, Education for Tomorrow Alliance, Junior Achievement, Conroe ISD Web Page
Monitoring Timeline Formative: November, January Summative: July
Formative Evaluation Web posting of communications, current information, student pictures, and events; minutes of district meetings posted on website; distribution of Student Activity Guide; district brochures and informative literature; record of business and community partners; record of flyers posted on website
Summative Evaluation Meet Performance Indicators for District
Project Managers Deputy Superintendent Assistant Superintendents, Principals, Director of Communications, Director of Community Outreach and Drop Out Prevention, Director of Special Education, Director of Federal Programs, Coordinator of Guidance and Counseling, Coordinator of PE/Health, College Readiness Specialist
Goal 5: SAFE SCHOOLS CISD will strive to ensure a safe and orderly environment conducive to learning for all students and staff.
Objective 5.1 – Implement Safe Schools Plan Strategies
• Maintain the CISD Safe Schools Committee and the Campus/Departmental Emergency Operations Team to review andmake recommendations for the Safe Schools Plan.
• Ensure that the CISD Safe Schools Plan addresses the areas of mitigation/prevention, preparedness, response, andrecovery, as well as safety control, crisis management, facilities management, environmental control, transportationservices, and health services.
• Conduct a Safe Schools Audit on each campus and District facility every three years making recommendations forimprovements.
• Update students, parents, faculty, and staff annually on the CISD Student Code of Conduct as required.• Implement the inclement weather/disaster/emergency procedures/continuation of operations for CISD campuses and
facilities.
33

• Implement a CISD Multi-Hazard Emergency Operations Plan, including command management, preparedness, resourcemanagement, communications and information management, supporting technologies, ongoing management andmaintenance, as well as suicide prevention, conflict resolution, and violence prevention.
• Implement the Standard Response Protocol. This includes use of the following vocabulary used with first responders:Lockout, Lockdown, Evacuate, and Shelter.
• Continue to improve campus safety and security through implementation of 2015 Bond projects and new projects fromother revenue sources: burglar and surveillance systems; controlled access entrances; IP phone and intercom systems; firealarm system replacements; exterior lighting improvements; visitor ID software.
• Make recommendations for campus safety for all new campuses and new construction. Develop District standardsregarding video cameras, controlled access, and communication systems.
• Involve parents and community members to support a safe school environment.• Involve students, at appropriate grade levels, in campus safety committee meetings.• Provide training to District staff members to support the development of emergency operations and to assist building
leaders with Emergency Incident Command.• Coordinate Emergency Operations Plans with local emergency management agencies.• As required by HB 1942, the following CISD Board Policies relate to bullying: FDB; FO; FFH; FFI; FNC; FNG; and FOF.
Procedures addressing bullying are located on the CISD website. In addition, staff development regarding bullying has beenprovided to all campus teachers and administrators through the August 2018, online Safe Schools Training. District policiesand procedures will be reviewed and revised, if appropriate, to ensure compliance with the new legislation.
• Provide additional support for students by adding an Licensed Professional Counselor.• Provide additional support to campuses with additional police officers.• Develop a Special Threat Response Plan in coordination with the Montgomery County Office of Emergency Management
and the Conroe ISD Police Department.
Objective 5.2 – Provide Resources and Training for Safety and Security Strategies
• Review and expand educational and support programs that involve student partnerships with campus staff and policeofficers, including programs on resistance to tobacco, alcohol, and other drugs.
• Provide training for teachers in discipline management, bullying, suicide prevention, conflict resolution, dating violence(CISD Policy FFH Local), violence prevention, sexual abuse of children, “Culture of Kindness”, and Crisis PreventionIntervention (CPI).
• Provide anger management classes for students assigned to Alternative Education Program (AEP).• Provide C.R.A.S.E. and Emergency Operations Best Practices training for staff.• Montgomery County Office of Emergency Management Special Threat Response Plan in coordination Conroe ISD Police
Department.• Implement program on the elementary and intermediate campuses to address misbehavior and improve life/coping skills,
including the utilization of Differentiating the Environment training, the Texas Behavior Support Initiative (TBSI), and CrisisPrevention Intervention (CPI).
• Continue the implementation of anti-victimization/bullying programs such as Child Lures, Tricounty Behavioral HealthProgramming, Get Real About Violence, Challenge Day, Why try Curriculum, Yello Dino, Ophelia Project, Rude, Mean, orBullying, The Safer Side – Stranger Safety, Safe Side, The: Internet Safety, Safe School Ambassadors, PBIS FoundationsProactive and Positive Behavior Support System, Upstander vs. Bystander, The Wise Owl, and Bully Proof.
• Provide random locker searches, walk-through metal detector searches, and canine searches to deter possession ofweapons and drugs on campus.
• Promote the KidChat 24-hour phone line to receive and react to information relating to drugs, weapons, fighting, bullying,and other crimes or fear of possible crimes occurring on our campuses.
• Promote and provide training for the Anonymous Alerts mobile app for students and the community to anonymously sendin information relating to drugs, weapons, fighting, bullying, and other crimes or fear of possible crimes occurring on ourcampuses.
• Provide police officers to assist school officials in identifying, documenting, and investigating gang-related incidents andassist local agencies in conducting gang-related investigations involving District students, staff, and property.
34

• Provide Crisis Response Team training and support on campuses to teachers, counselors, and administration regardingpotential crisis situations with students and staff.
• Conduct safety, hazardous materials, blood-borne pathogen, bullying, cyberbullying, online predators, sexual harassment,suicide, and integrated pest management training to all staff members.
• Provide staff training on the Standard Response Protocol.• Provide access and training to administrators for the Emergency Response Information Portal where campus-based
emergency plans, drill, and resources will be kept, maintained, and managed.• Conduct fire, disaster, lock-downs, evacuation, reverse evacuation, table-top drills, intruder/active shooter drills,
reunification and other emergency drills to ensure the effectiveness of Emergency Operations Plans at the District andcampus level.
• Provide student/staff awareness programs in sexual abuse and dangers of drugs, alcohol, and tobacco.• Continue to train staff in CPR and AED procedures.• Offer internet safety training and sexual abuse awareness training for parents at campus level.• Ensure that American Disabilities Act (ADA) compliance is achieved as part of the scheduled maintenance and renovation
process in all CISD schools and educational programs.• Provide WeatherSentry SmartPhone access and training to campuses for real-time weather monitoring and alerts.• Provide professional development on a campus wide positive, proactive instructional approach to behavior through
implementation of PBIS Foundations.• Provide professional development on a positive, proactive, instructional approach to classroom management through
CHAMPS.• Provide professional development on a campus wide positive, proactive instructional approach to behavior through
implementation of PBIS Foundations.• Provide professional development on a positive, proactive, instructional approach to classroom management through
CHAMPS.
Financial Resources General Operating, Capital Projects Fund, Grants
Additional Resources Safe Schools Online, Dashboard, School Messenger, NOVA (National Organization of Victim Assistance), MSDS Online, Local Law Enforcement, Fire Departments, Offices of Emergency Management, Samuel McKay Everett Foundation, Montgomery County Crimestoppers, Texas School Safety Center, Texas Attorney General’s Office, Kid Chat, Anonymous Alerts, SafePlans/ERIP.
Monitoring Timeline Formative: November, January Summative: July
Formative Evaluation CISD Emergency Operations Plan: procedures for weather, disaster, emergency; CISD Crisis Management Plan; Committee agendas and sign-in sheets; Results of Safe Schools Audits; Record of programs/presentations/trainings for students and staff; Quarterly reports of police activity and safety drills, Anonymous Alerts reports, and Campus Emergency Plan and Drill reports.
Summative Evaluation Meet Performance Indicators for District
Project Managers Deputy Superintendent, Assistant Superintendent for Secondary Schools, Assistant Superintendent for Operations, Assistant Superintendent for Elementary Schools, District Safety Coordinator, Chief of CISD Police, Safe Schools Committee, Guidance and Counseling Coordinator
Goal 6: TECHNOLOGY CISD will provide technology infrastructure, tools, and solutions to meet the administrative requirements of the District and to maximize learning for all students.
35

Objective 6.1 – Maximize Teaching and Learning Technology Literacy Assessment Overall: Students will become proficient in the use of current technology.
Strategies
• Increase student opportunities for utilizing technology across the curriculum areas.• Think in meaningful ways to use the technology to represent what they know, and as a tool to promote learning and to
establish expectations.• Seamlessly apply technology across all subject and content areas.• Assure that technology is integral to all subject area instruction.• Within each grade level cluster, all Technology Applications TEKS are met.
a. Create and integrate lessons which include TEKS-based content, resources, and learning activities;b. Provide access to online-curriculum as appropriate.
• Utilize technology as a tool for information management, problem solving, and communication.
Objective 6.2 – Enhance Professional Practices Strategies
• Professional Development training will include:
a. integration of technology into teaching and learning;b. strategies to promote the regular creation and communication of new technology-supported learner-centered projects;c. resources to ensure the vertical alignment of Technology Application TEKS;d. resources to provide anytime, anywhere use of online database resources.
• Professional development will focus on the technological capabilities of educators to:a. use technology devices instructionally;b. encourage information literacy skills in their students;c. use collaborative cloud based tools for administrative and instructional tasks;d. use learning management system (LMS) to assist in anytime learning;e. teach students to use the internet safely.
• Professional development will focus on the leadership capabilities of administrators to:a. recognize and identify exemplary use of technology in instruction;b. demonstrate and model use of technology in daily work;c. ensure the integration of appropriate technologies to maximize learning and teaching.
• Professional development opportunities will focus on online learning:a. teachers are provided professional development in the creation of online courses in learning management system;b. teachers are provided professional development in the use of Edgenuity.
Objective 6.3 – Support Administration and Operations Strategies
• District and campus leadership promote a shared vision with policies that encourage continuous innovation withtechnology leading to increased student achievement.
• The District and campus administrators will provide vision and planning:
a. teachers and administrators have a vision for technology use for direct instruction and student use;b. administrators use technology tools for planning;c. assist the campuses in developing plans to address Technology Application TEKS and use technology to impose studentlearning;d. District Technology Steering committee meets to review and recommend technology direction.
36

• The District will allocate funds to support district technology needs.• Provide educators with access to student data for decision-making.
Objective 6.4 – Infrastructure to Support All Functions Strategies
• Student Technology:a. 2.0 or fewer students per Internet-connected device;b. provide for online student storage;c. provide desktop computers, iPad tablets, and Chromebooks;d. provide the infrastructure to support students bringing their own technology.
• Internet Access:a. direct connectivity to the Internet in 100% of the classrooms;b. adequate bandwidth within and between campuses;c. adequate bandwidth to the internet;d. minimum 1Gb connectivity to all classrooms within the campus;e. provide wireless for mobile devices.
• The technology works consistently, which requires a sufficient staff to support the installed computer equipment basealong with strategies and procedures to efficiently manage computer equipment.
Financial Resources General Operating, Elementary & Secondary, Bond, E-Rate, Title Funds
Additional Resources Principals, Campus plans, ViewIt, Eduphoria, Administrative Canvas course, District Staff Development Plan
Monitoring Timeline Formative: November, July Summative: July
Formative Evaluation Records of professional development in technology Campus and District Technology Plans align with strategies District technology budget supports Technology Plans Review of Instructional Coach log Technology Leadership visits each campus to review their technology plans and usage
Summative Evaluation Support Tickets worked in Eduphoria and Canvas Staff Development Reports
Project Manager(s): Directors of Technology, Instructional Technology Coordinator, Director of Curriculum and Instruction, Principals
Goal 7: Communication CISD will promote and enhance two-way communication among our staff and our community to maximize the success of all students.
Objective 7.1 – Effective Internal Communication Strategies
• Maintain the District’s procedures and practices for communicating with employees, Board of Trustees, and patrons/mediaregarding daily campus/District activities/events, special campus/District activities/events, urgent non-life threateningsituations, disaster/life-threatening situations, weather/natural disasters, and other special circumstances.
37

• Provide communications regarding District initiatives, programs, meetings, activities, operations, and leadership within andamong all departments and schools through a variety of media, including CISD website, newsletters, email announcements,campus/District meetings, newspaper, radio, television, and social media.
• Elicit comments and suggestions through committees, meetings, and surveys from within the CISD organization regardingimproving communications through webpage comments, email, District councils and committees, and campus personnel.
• Continue vertical meetings to discuss curriculum alignment, program alignment, and departmental issues (cadres; staffdevelopment; principals’ meetings; etc.).
• Continue horizontal meetings (grade level meetings by campus/feeder/or District; etc.) to discuss curriculum alignment,program alignment, and departmental issues.
Objective 7.2 – Effective External Communication Strategies
• Utilize the CISD website and social media accounts to promote campus and District events and information for parents,families, communities, and businesses.
• Continue producing and distributing press releases to area news media to inform the community of events, educationalprograms, and information, and to elicit community input.
• Provide factual, relevant information about District programs and initiatives to both the public and the District employeesthrough a variety of media (print, website, newsletters, social media, campus meetings, social networks, etc.).
• Provide information regarding demographic, financial, achievement, and student and staff data through published reportsfor parents, families, communities, and businesses.
• Elicit comments, suggestions, and questions from parents/families/communities/businesses through CISD website, socialmedia, and e-mail.
• Plan, coordinate, and advertise District-wide events.
Financial Resources General Operating
Additional Resources Communications Specialist, Graphics & Printing Coordinator, Audio/Video Production Specialist, Social Media, Campus Communicators & Webmasters, CISD Newcomers Centers, Translation services, Local Media, Technology
Monitoring Timeline Formative: November, January Summative: July
Formative Evaluation Record of contact with media, press releases, and social media posts and data; Website information is current and accurate
Summative Evaluation Meet Performance Indicators for District
Project Managers Director of Communications, Director of Curriculum and Instruction
38

Financial Resources 2018-2019 School Year
SCE Strategy Program/Service Funds Budgeted FTEs
Goal 1 At-Risk and Special Populations Strategy 7
General Education Teachers for At-Risk Students Campuses District SCE Indirect Cost
$31,741,725 585.00
Goal 1 At-Risk and Special Populations Strategy 1, 7
Secondary Campus Teachers and Paraprofessionals Serving At-Risk Students
$4,989,022 99.00
Goal 1 At-Risk and Special Populations Strategy 1
Academic Tutorials for At-Risk Students $420,805 7.55
Goal 1 At-Risk and Special Populations Strategy 11
Parent Education Specialist $63,969 1.00
Goal 1 At-Risk and Special Populations Strategy 17
PASS Overage Initiative $351,635 5.00
Goal 1 At-Risk and Special Populations Strategy 14
District At-Risk Instructional Coaches $335,382 9.00
Goal 1 At-Risk and Special Populations Strategy 14
Elementary/Intermediate Campus At-Risk Instructional Coaches and Intervention Teachers
$1,204,397 21.00
Goal 1 At-Risk and Special Populations Strategy 17
Instructional Materials for At-Risk Students $354,506 0.00
Goal 1 At-Risk and Special Populations Strategy 1
Tutorial Transportation for At-Risk Students $5,066 0.00
Total SCE $39,466,507 727.55
Title IA Strategy Program/Service Funds Budgeted FTEs
Goal 1 At-Risk and Special Populations Strategy 14
Instructional Coaches and Support $659,609 8.15
Goal 1 At-Risk and Special Populations Strategy 11, 16
Program Administration Supplies, Administrator (85%) and Secretary (75%)
$141,879 1.55
Goal 1 At-Risk and Special Populations Strategy 11
Homeless Support Paraprofessional $12,921 0.50
Goal 1 At-Risk and Special Populations Strategy 11
PASS Overage Initiative Support $272,890 4.00
Goal 3 Recruitment of Staff Strategy 1
HR Title I Certifications Paraprofessional (33%) and Legal Fees
$44,658 0.33
Goal 1 At-Risk and Special Populations Strategy 17
Private School Title I ELA Teacher for At-Risk PT $18,000 0.40
Goal 1 At-Risk and Special Populations Strategy 1, 16
Summer School Materials, Extra Duty and Transportation
$298,417 3.43
Goal 4 Parent and Family Involvement Strategy 1, 8, 9
Family Engagement Materials and Extra Duty $75,394 0.01
Total Title IA $1,523,768 18.37
39

Title IC Strategy Program/Service Funds Budgeted FTEs
Goal 1 At-Risk and Special Populations Strategy 11
Migrant Program Paraprofessional, Extra Duty, Mileage, and Materials
$31,057 1.01
Total Title IC $31,057 1.01
Title ID Strategy Program/Service Funds Budgeted FTEs
Goal 1 At-Risk and Special Populations Strategy 27, Goal 5 Training for Safety Strategy 3
Juvenile Delinquent Instructional Materials and Extra Duty
$130,475 .30
Total Title ID $130,475 .30
Title IIA Strategy Program/Service Funds Budgeted FTEs
Goal 1 At-Risk and Special Populations Strategy 14
Instructional Coaches and Support $310,958 3.85
Goal 1 At-Risk and Special Populations Strategy 1, 16
Program Administration Administrator (15%) and Secretaries (25%)
$59,994 1.10
Goal 1 At-Risk and Special Populations Strategy 17
Private Schools Staff Development $15,000 0.00
Goal 1 At-Risk and Special Populations Strategy 14, 16, 17
Staff Development Materials, Extra Duty, and Contracted Services
$967,505 4.60
Total Title IIA $1,353,457 9.55
Title III LEP Strategy Program/Service Funds Budgeted FTEs
Goal 1 At-Risk and Special Populations Strategy 14
Instructional Materials, Instructional Support for Dual Language Paraprofessional, and Extra Duty
$121,000 1.33
Goal 4 Parent and Family Strategy 1
Newcomer Social Worker and Instructional Support for Newcomer Program
$160,137 1.67
Goal 1 At-Risk and Special Populations Strategy 4, 5, 11, 14, 17
Staff Development Materials and Contracted Services
$93,923 0.41
Goal 1 At-Risk and Special Populations Strategy 16
Summer School $158,398 2.84
Goal 1 At-Risk and Special Populations Strategy 1, 16
Program Administration Secretary $16,111 0.25
Total Title III LEP $549,569 6.50
40

Title IV Strategy Program/Service Funds Budgeted FTEs
Goal 1 At-Risk and Special Populations Strategy 5, 11, 14
Instructional Coach (75%) and Support for English Language Learners and Staff Development
$183,088 2.50
Goal 1 At-Risk and Special Populations Strategy 16
Access to Fine Arts for Economically Disadvantaged and At-risk Students
$58,770 0.69
Goal 5 Training for School Safety Strategy 2, 7
Safe and Healthy Students Staff Development $64,753 0.00
Goal 6 Enhance Professional Practices Strategy 1, 2, 3, 4
Innovative Technology, Technology Instructional Coach Support, and Professional Development
$151,753 1.00
Goal 1 At-Risk and Special Populations Strategy 17, Goal 6 Enhance Professional Practices Strategy 1, 2
Private Schools Staff Development $6,000 0.00
Total Title IV $464,364 4.19
NON-DISCRIMINATION STATEMENT
The Conroe Independent School District is an equal opportunity employer and does not discriminate on the basis of race, color, national origin, sex, religion, age, or disability in employment matters, in its admissions policies, or by excluding from participation in, denying access to, or denying the benefits of district services, academic and/or vocational and technology programs, or activities as required by Title VI and Title VII of the Civil Rights
Act of 1964, as amended, Title IX of the Education Amendments of 1972, the First Amendment of the United States Constitution, the Age Discrimination Act of 1975, Section 504 of the Rehabilitation Act of 1973, as amended, and Title II of the Americans with Disabilities Act.
For information about Title IX rights, contact the Title IX Coordinator, 3205 W. Davis, Conroe, Texas 77304; (936) 709-7700. For information about Section 504/ADA rights, contact the Section 504/ADA Coordinator, 3205 W. Davis, Conroe, Texas 77304; (936) 709-7670.
41

CaneyCreek
Conroe
TheWoodlands
OakRidge
GrandOaks
Conroe ISD Campus Locations
MCJDC444
16A54
3912
5
158
27
3536
3720
26 34 27
3841
43
18
24
21
29
3019
17
28253331
9
6
10
3
23
42
45
49
50
51
C B
52
Grand Oaks ZoneHigh School 60 Grand Oaks High SchoolJunior High School 47 York Junior HighIntermediate Schools
48 Cox Intermediate 59 Clark IntermediateElementary Schools
51 Birnham Woods Elementary 58 Bradley Elementary46 Broadway Elementary19 Ford Elementary53 Snyder Elementary
Oak Ridge ZoneHigh School
33 Oak Ridge High School31 Oak Ridge HS - 9th grade campus
& Academy for Careers in Engineering & Science
Junior High School 52 Irons Junior HighIntermediate Schools 17 Vogel IntermediateElementary Schools
19 Ford Elementary28 Houser Elementary45 Kaufman Elementary25 Oak Ridge Elementary61 Suchma Elementary
The Woodlands ZoneHigh School
42 The Woodlands College Park HS& Academy of Science & Technology
34 The Woodlands High School 38 The Woodlands HS - 9th grade campusJunior High School
30 Knox Junior High32 McCullough Junior High
Intermediate Schools27 Collins Intermediate 36 Mitchell Intermediate 29 Wilkerson Intermediate
Elementary Schools37 Buckalew Elementary 35 Bush Elementary 18 David Elementary43 Deretchin Elementary (K-6)20 Galatas Elementary 21 Glen Loch Elementary 22 Hailey Elementary23 Lamar Elementary26 Powell Elementary24 Ride Elementary41 Tough Elementary (K-6)
13
40
14
55
156
32
11
57
Imperial Oaks
Birnh am W
oods Dr.
Al dine WestfieldRayford Rd. Rayford Rd.
Hardy Toll Rd.
47
4648
58
5953
60
Caney Creek ZoneHigh School 57 Caney Creek High SchoolJunior High School 13 Moorhead Junior HighIntermediate Schools 40 Grangerland Intermediate Elementary Schools
3 Austin Elementary 10 Creighton Elementary
6 Milam Elementary 9 San Jacinto Elementary
A Deane L. Sadler Administration/Technology Center3205 West Davis
Conroe, TX 77304-2098________________________________B CISD Police Command Center
2900 N. Loop 336 East Conroe, TX 77301________________________________C DAEP and JJAEP
2235 N. First StreetConroe, TX 77301
Grogan ’s Point Rd.22
FM 1485
FM 1314
Willis W
alukegan Rd.
FM 1485
Stidham Rd.
Magnolia BendOld Hum
ble Pipeline Rd.
I-45
I-45
I-45
Frazier
Frazier
Avenue M
Airp
ort R
d.
Teas Nursery Rd.
Hwy 105
Wilson Rd.
E. DallasHwy 105
Hwy 105
FM 1484Old Hwy 105
FM 14
84
Willis Walukegan Rd.
Whi
ppor
will
Albe
rt M
oorh
ead
Rd.
Old
Hou
ston
Rd.
FM 1314
FM 1314Ea
st Te
x Fre
eway
/Hwy
59
Hwy 242
Gulf Coast Rd.
FM 2090
FM 3083
Gladstell St.
Old
Mag
nolia
Rd.
Hope Rd.
Hwy 242Needham Rd.
College Park Dr.
Carri
age H
ills B
lvd
Research Forest
Kuyk
enda
hlKu
yken
dahl
Sleepy HollowTamina Rd .
Research Forest
Robinson Rd.
Kuyk
enda
hl
HannaRichards Rd.
Lake Woodlands Grogan’s Mill
N. Millbend S. Millbend
Sawdust
SawdustSawdust
Glen Loch Dr.
Woodlands Pkw.
Flintridge Pant
her C
ree
k
Goslin
g Rd.
Woodlands Pkw.
Coch
ran’s
Cros
sing
Creighton Rd.
Loop
336
Loop 336
Loop 336Loop 336
W. D allas
FM 14
84
San Jacinto River
San Jacinto R iver
Spring Creek
Spring Creek
Conroe Zone 12 Hauke Academic Alternative High School (9-12)MCJDC Montgomery County Juvenile Detention CenterHigh School
16 Conroe High School & Academy for Science & Health Professions
54 Conroe High School - 9th grade campusJunior High School
14 Peet Junior High 62 Stockton Junior High 15 Washington Junior High
Intermediate Schools49 Bozman Intermediate 44 Cryar Intermediate39 Travis Intermediate
Elementary Schools1 Anderson Elementary2 Armstrong Elementary3 Austin Elementary4 Giesinger Elementary5 Houston Elementary
56 Patterson Elementary11 Reaves Elementary
7 Rice Elementary 8 Runyan Elementary
55 Stewart Elementary (K-6)50 Wilkinson Elementary
61
62
42
Conroe Independent School District
Financial Structure and Basis of Accounting
Description of Entity The Conroe Independent School District is an independent public educational agency operating under applicable laws and regulations of the State of Texas. A seven member Board of Trustees elected to staggered three-year terms by the District’s residents autonomously governs the District. The Texas Education Agency and Southern Association of Colleges and Schools provide the District’s K-12 education accreditation. The District includes 64 campuses. There are 30 elementary schools, 3 Kindergarten-6th grade schools, 10 intermediates, 7 junior highs, 6 high schools, 3 science academies, 1 alternative high school, and 1 disciplinary alternative school. Three of the 5 High Schools have separate 9th grade campuses. The District occupies 348 square miles within Montgomery County, Texas and the 2018-2019 enrollment is estimated at over 63,000 students. Please refer to page 353, in the Informational section, for a map of the District.
Fund Accounting The Funds and accounts of the District have been established under the rules prescribed in the Financial Accounting and Reporting Module of the Texas Education Agency Financial Accountability System Resource Guide. This budget document contains detailed information for all funds for which the Board of Trustees is required to adopt annual budgets. Budgets for all funds are prepared using the same method of accounting as for financial reports (modified accrual). Under the modified accrual basis of accounting, revenues are recognized in the accounting period in which they become both measurable and available. Expenditures are recognized in the accounting period in which the fund liability is incurred, if measurable, except for principal and interest on general long-term debt which is recognized when due. Following is a description of the funds for which annual budgets are adopted.
General Fund The General Fund is used to account for all financial transactions not properly includable in other funds. The principal sources of revenue include local property taxes, state funding allocations and interest on fund investments. The District does receive other revenues; however they are not considered material or sustaining. Expenditures include all costs necessary for the daily operation of the schools.
Special Revenue Funds Special Revenue Funds are used to account for funds awarded to the District for the purpose of accomplishing specific educational tasks as defined by grantors in contracts or other agreements.
Food Service – used to account for the District’s Food Services Program including local, state and federal revenue sources and all costs associated with the operation of the program.
Debt Service Fund The Debt Service Fund is used to account for the payment of interest and principal on all bonds of the District. The primary source of revenue for the debt service fund is local property taxes.
Capital Projects Fund The Capital Projects Fund is used to account, on a project basis, for projects financed by the proceeds from bond issues, or for capital projects otherwise mandated to be accounted for in this fund. The capital projects fund utilizes the modified accrual basis of accounting.
43

Conroe Independent School District
Classification of Revenues and Expenditures
Section 44.007 of the Texas Education Code requires that a standard school district fiscal accounting system be adopted by each school district. The system must meet at least the minimum requirements prescribed by the State Board of Education and also be subject to review and comment by the state auditor. Additionally, the accounting system must conform with Generally Accepted Accounting Principles (GAAP). This section further requires that a report be provided at the time that the school district budget is filed showing financial information sufficient to enable the state board of education to monitor the funding process and to determine educational system costs by school district, campus and program.
A major purpose of the accounting code structure is to establish the standard school district fiscal accounting system required by law. Although certain codes within the overview may be used at local option, the sequence of the codes within the structure and the funds and chart of accounts are to be uniformly used by all school districts in accordance with GAAP.
Basic System Expenditure Code Composition
• Fund Code – A mandatory three digit code used for all financial transactions to identify thefund group and specific funds. The first digit refers to the fund group and the second andthird digits specify the fund.
• Function Code – A mandatory two digit code which identifies the purpose of the transaction isapplied to expenditures. The first digit identifies the major service area and the second digitrefers to the specific function within the area.
• Object Code – A mandatory four digit code identifying the nature and object of an account, atransaction or a source. The first of the four digits identifies the type of account ortransaction, the second digit identifies the major area and the third and fourth digits providefurther sub-classifications.
• Sub-Object – Optional code. At Conroe ISD this code is used to provide special accountability for certain programs or areas.
• Organization Code – A mandatory three digit code identifying the organization, i.e., campus,department.
• Fiscal Year Code – A mandatory single digit code which identifies the fiscal year of thetransaction or the project year of inception of a grant project.
• Program Intent Code – A two digit code used to designate services provided to students.
• Optional Code 3, 4 and 5 – Optional code that may be used to further describe thetransaction.
District revenues are classified by fund and object or source. There are three major sources: local sources, state sources and federal sources.
Expenditure budgets are legally adopted at the fund and function level; however, within this document we have included several additional presentations of expenditures. These presentations segregate expenditures by either organization or by major object. Major object codes are used to describe the type of items purchased or services obtained. The major object codes used in this document are: payroll and related costs, purchased and contracted services, supplies and materials, other operating expenditures and capital outlay. Fund codes have been previously described in the preceding Financial Structure section. Following is a description of the function codes used throughout this document.
44

Function Codes
General Descriptions
Function codes are grouped according to related activities in the following major areas:
10 Instruction and Instructional Related Services- This function series is used for
expenditures/expenses that provide direct interaction between staff and student to achieve learning. It includes expenses for the resources to achieve the appropriate student learning outcomes.
11 Instruction- This function is used for activities that deal directly with the interaction
between teachers and students. This function includes expenditures for direct classroom instruction and other activities that deliver, enhance, or direct the delivery of learning situations to students.
12 Instructional Resources and Media Services- This function is used for expenditures that
are directly and exclusively used for resource center, establishing and maintaining libraries, and other major facilities dealing with educational resources and media.
13 Curriculum Development and Instructional Staff Development- This function is used for
expenditures that are directly and exclusively used to aid instructional staff in planning, developing, and evaluating the process of providing learning experiences for students.
20 Instructional and School Leadership- This function series is used for
expenditures/expenses that relate to the managing, directing, supervising and leadership of staff who are providing either instructional or instructional-related services.
21 Instructional Leadership- This function encompasses those district-wide activities that have as their purpose managing, directing, and supervising the general and specific instructional programs and activities. For example, function 21 includes instructional supervisors and Assistant Superintendent for Instruction but does not include principals.
23 School Leadership- This function includes expenses for directing, managing and
supervising a school. It includes salaries and supplies for the principal, assistant principal and other administrative and clerical staff including attendance clerks.
30 Student Support Services- This function series is used for expenditures/expenses that directly support students.
31 Guidance, Counseling and Evaluation Service- This function includes expenses for testing and assessing students’ abilities, aptitudes, and interests with respect to career and educational goals and opportunities. It includes psychological services, testing, and counseling.
32 Social Work Services- This function includes expenditures that directly and exclusively
promote and improve school attendance. Examples include visiting teachers, home visitor aides, and truant officers.
33 Health Services- This function embraces the area of providing health services that are
not a part of direct instruction. It includes medical, dental, and nursing services.
45

Function Codes
General Descriptions 34 Student Transportation- This function includes the cost of providing management and
operational services for transporting students to and from school. Function 34 includes transportation supervisors and bus drivers but does not include field trips.
35 Food Services- This function includes the management of the food service program at
the schools and the serving of meals, lunches, or snacks in connection with school activities. Function 35 includes cooks and food purchases but does not include concession stands.
36 Cocurricular/Extracurricular Activities- This function incorporates those activities that are
student and curricular related but are not necessary to the regular instructional services. Function 36 includes athletic salary supplements paid exclusively for coaching, directing, or sponsoring extracurricular athletics but does not include salaries for teaching physical education .
40 Administrative Support Services- This function series is used to account for
expenditures/expenses that relate to the overall general administrative support services of the district.
41 General Administration- This function includes expenses incurred for the overall
administrative responsibilities of the school district. It includes expenses for the school board, superintendent’s office, personnel services, financial services, and administrative attendance personnel.
50 Support Services- This function series is used for expenditures/expenses that are used
for school district support services.
51 Facilities Maintenance and Operations- This function includes expenses incurred to keep the facilities and grounds open, clean, comfortable and in good working condition and state of repair, and insured. This function also includes expenses associated with warehousing and receiving services.
52 Security and Monitoring Services- This function is used for expenditures to keep student
and staff surroundings safe whether in transit to or from school, on a campus or participating in school-sponsored events at another location.
53 Data Processing Services- This function is used for expenditures for data processing
services, whether in-house or contracted. 60 Ancillary Services- This function series is used for expenditures/expenses that are for
school district support services supplemental to the operation of the school district.
61 Community Services- This function encompasses all other activities of the school district that are designed to provide a service or benefit to the community as a whole or a portion of the community.
46

Function Codes
General Descriptions 70 Debt Service- This function series is used for expenditures/expenses that are used for
the payment of debt principal and interest.
71 Debt Service- This function is used for expenditures that are for the retirement of recurring bond, capital lease principal, and other debt, related debt service fees, and for all debt interest.
80 Capital Outlay - This function series is used for expenditures/expenses that are for
acquisitions, construction, or major renovation of school district facilities.
81 Facilities Acquisition and Construction- This function includes expenses for acquisition of land and building, the remodeling of buildings, additions to buildings, and installation and extension of service systems and other built-in systems.
90 Intergovernmental Charges- This function series is used for the transfer of resources
from one governmental unit to another. 99 Other Intergovernmental Charges- This function is used for expenditures to other
governmental entities, such as county appraisal districts, for costs related to the appraisal of property.
47

Conroe Independent School District
Significant Financial Policies and Procedures The following financial policies and procedures of the District significantly influence the development of the annual budget. Cash Management The District’s cash management goals are as follows:
• Insure proper collateralization of deposits.
• Ensure adequate balances to cover cash disbursement needs.
• Maximize interest earnings.
• Minimize bank changes. These goals are accomplished by keeping bank balances as low as possible through transferring all available dollars into an investment pool. Additionally, treasuries, government discount notes, and commercial paper are purchased after considering yield and cash flow projections. Cash balances are monitored daily by the District through on-line banking. Using this system allows accounting personnel to minimize bank balances by only transferring into the accounts the funds necessary to cover the dollar amount of checks that have been presented to the bank each day. This keeps the low interest bearing bank balances at a minimum, thus maximizing interest earnings. Investment Policies The Board of Trustees has adopted a written investment policy regarding the investment of its funds as defined in the Public Funds Investment Act of 1995. This policy authorizes the District to invest in obligations of the U. S. Treasury, the State of Texas or certain U. S. agencies, certificates of deposit, repurchase agreements, commercial paper, money market and no-load mutual funds and public funds investment pools as permitted by Chapter 2256, Texas Government Code. The main goal of the investment program is to ensure its safety as well as to maximize financial returns within current market conditions in accordance with the District’s investment policy. Assets of the District shall be invested in instruments whose maturities do not exceed three years from the time of purchase. The Board may specifically authorize a longer maturity for a given investment, within legal limits. The investment portfolio shall be diversified in terms of investment instrument, maturity scheduling, and financial institutions to reduce the risk of loss. Monitoring is performed monthly as investment reports are submitted to the Board of Trustees for review. In addition, the District investment officer annually presents a comprehensive report on the investment program and investment activity. Debt Administration Debt service is a major area of cost due to the District’s building program that is primarily financed by the sale of general obligation bonds. The ratio of net bonded debt to assessed value for the District is 3.80%. Educational legislation has eliminated limits on outstanding debt; however, prior law limited debt to 10% of the assessed value and the District is well below that level. All principal and interest payments are due February 15th and August 15th of each year. On February 1st of each year, outstanding taxes become delinquent which permits the collection of a large majority of taxes levied before the long-term debt payments are due. The District’s bonds presently carry a favorable rating of “Aaa” with Moody’s Investment Service and “AAA” with Standard and Poor’s Investor Service.
48

Significant Financial Policies and Procedures (continued)
Debt Service Policy The Board of Directors may obtain funds to construct, acquire or equip school buildings, to purchase necessary sites, to purchase school buses, or to acquire, or refinance property financed under a contract entered under the Public Property Finance Act by issuing bonds and assessing annual ad valorem taxes sufficient to pay the principal and interest on the bonds as they come due. Before issuing bonds, the District must demonstrate to the Attorney General that, with respect to the proposed issuance, the District has a projected ability to pay the principal of and interest on the proposed bonds and all previously issued bond. The District has adopted the provisions of section 45 of the Texas Education Code requiring the levy each year of a tax rate, unlimited as to amount, sufficient to meet principal and interest requirements during the fiscal year. Resources from the property taxes for servicing bonded debt principal and interest are accumulated in, and expended from the Debt Service Fund (Article 278e-1, VCS). Texas statutes do not prescribe a debt limit; however, a practical economic debt limit of 10% of the assessed valuation is used by the district. Fund Balances and Net Position The District has adopted the provisions of GASB Statement No. 54, Fund Balance Reporting and Governmental Fund Type Definitions (GASB 54). In accordance with GASB 54 the District classifies governmental fund balances as follows: Non-Spendable – includes amounts that cannot be spent because they are either not in spendable form, or, for legal or contractual reasons, must be kept intact. This classification includes inventories, prepaid items and long term receivables. Restricted – includes fund balance amounts that are constrained for specific purposes which are externally imposed by providers, such as creditors or amounts restricted due to constitutional provisions or enabling legislation. This classification includes the child nutrition program, retirement of long term debt, construction programs and other federal and state grants. Committed – Committed fund balances are amounts constrained to specific purposes by the District itself, using a resolution passed by its highest decision making authority (the Board of Trustees). To be reported as committed, amounts cannot be used for any other purpose unless the District takes the same highest level of action to remove or change the constraint.
Assigned – includes fund balance amounts that are self imposed by the District to be used for a particular purpose. Fund balance can be assigned by the District’s Board, the Superintendent or the Chief Financial Officer pursuant to the District’s fund balance policy.
Unassigned – amounts that are available for any purpose are considered unassigned fund balance. Positive numbers can only be reported in the general fund. Net Position may serve over time as a useful indication of a government’s financial position. Net position on the Statement of Net Position includes the following: Net Investment in Capital Assets – this component of net position reports the difference between capital assets less both the accumulated depreciation and the outstanding balance of debt, excluding unspent proceeds, that is directly attributable to the acquisition, construction or improvement of these capital assets; Restricted –this component of net position reports the difference between assets and liabilities of the District that consist of assets with constraints placed on their use by external parties; Unrestricted –the difference between the assets and liabilities that is not reported in Net Investment in Capital Assets, or Restricted Net Position.
49

Significant Financial Policies and Procedures (continued) Reserve Policies
• General Fund & Debt Service Fund– The District strives to maintain a fund balance equal to 25% of operating expenditures for the general and debt service funds.
• Debt Service Fund – The District maintains a debt service fund balance of not more than 1/2 of the previous year’s required principal and interest payments for all outstanding bonds. If the fund balance exceeds this level, the excess is considered a reserve and is subject to rebate under arbitrage regulations.
• Food Service Fund – The fund balance for food service should not exceed three months of average food service operations expenditures. Average monthly food service expenditures are calculated by dividing the subsequent year’s budgeted expenditures by ten months since the food service department only operates for ten months out of the year.
Accounting Pronouncements The District has adopted the provisions of GASB Statement No. 68, Accounting and Financial Reporting for Pensions (GASB 68). The District also adopted the provisions of GASB Statement No. 75, Accounting and Financial Reporting for Postemployment Benefits Other Than Pensions (GASB 75). I detailed calculation will be performed in conjunction with the preparation of the District’s annual financial statements. Risk Management The District’s risk management program encompasses various means of protecting the District against loss. Property and casualty, health, and workers’ compensation insurance is provided by commercial carriers and liability insurance coverage is provided by the Texas Association of School Boards. The District also has local Safety Programs, a District Police Department and a written Investment Policy which ensures the safety of funds as well as maximizing the financial returns. Independent Audit and Financial Reporting In accordance with Section 221.256, Texas Education Code, public school districts in Texas shall have their accounts audited annually. The audit shall be made on an organization-wide basis and shall involve all funds types and accounts groups of the school district. In addition to meeting the requirements set forth in state statutes, the audit is also designed to meet the requirements of the federal Single Audit Act of 1984 and the related provisions of OMB Circular A-133 “Audits of State, Local Governments and Non-Profit Organizations.” Once the annual audit is complete, an Annual Financial and Compliance Report is prepared and submitted to the Texas Education Agency for review. The Annual Financial and Compliance Report is designed to meet the specific monitoring needs of the Texas Education Agency. Thus, a Comprehensive Annual Financial Report conforming to standards of both the Association of School Business Officials International and the Government Finance Officers Association is also prepared to better serve the needs of the taxpayers and other financial statement users.
50

Conroe Independent School District
Budget Policies and Development Procedures
The State, the Texas Education Agency (TEA) and each local district formulate legal requirements for school district budgets. Legal Requirements Sections 44.002 through 44.006 of the Texas Education Code establish the legal basis for budget development in school districts. The following items summarize the legal requirements from the code:
• The Superintendent is the budget officer for the District and prepares or causes the budget to be prepared.
• The District budget must be prepared by a date set by the State Board of Education, currently August 20th.
• The President of the Board of Trustees must call a public meeting of the Board of Trustees giving ten days public notice in a newspaper for the adoption of the District budget. Any taxpayer in the District may be present and participate in the meeting.
• No funds may be expended in any manner other than as provided for in the adopted budget. The Board does have the authority to amend the budget or adopt a supplementary emergency budget to cover unforeseen expenditures.
• The budget must be prepared in accordance with GAAP (generally accepted accounting principles) and State guidelines.
• The budget must be legally adopted before the adoption of the tax rate. Annual budgets must be prepared for the following funds: General Fund, Debt Service Fund, Technology Fund, Food Service and Special Revenue Funds. Budget Development Process Teachers, principals, community members and other staff of the District, under the direction of the Chief Financial Officer and the Superintendent, develop the budget. All expenditure allocations are determined based on projected revenue from state and local sources with the goals of maintaining an appropriate fund balance and combined tax rate while still meeting District educational goals. The budget process begins in December each year with the preparation of the budget calendar and enrollment projections. The enrollment projections contained in this plan form the basis for significant budgetary decisions including per pupil allocations to each campus, instructional staffing allocations and other required service levels. The Chief Financial Officer prepares revenue projections for all funds. These projections are based on enrollment projections, estimates of local tax revenue, State funding formulas, and other significant factors. The State funding formulas are extremely complex. The Texas Legislature meets every other year. Salaries and benefits comprise approximately 89.26% of the annual operating budget. Therefore, the Board of Trustees gives careful consideration to staffing allocations for both instructional and non-instructional positions. Additional personnel units are evaluated each year and, after extensive review and analysis, recommendations are presented to the Board of Trustees. Personnel units are allocated to each campus based on projected student enrollment following State mandated ratios as applicable. The budget amounts are then developed utilizing approved staffing guidelines and estimates of cost for each position. Projected costs for each position are based on the average cost of employees currently filling each position. Supplemental pay (coaches, department heads, etc.) is approved on a year-to-year basis and does not become part of the base salary of an employee. A salary supplement may be changed upward, downward or eliminated as the Board of Trustees deems is in the best interest of the District.
51
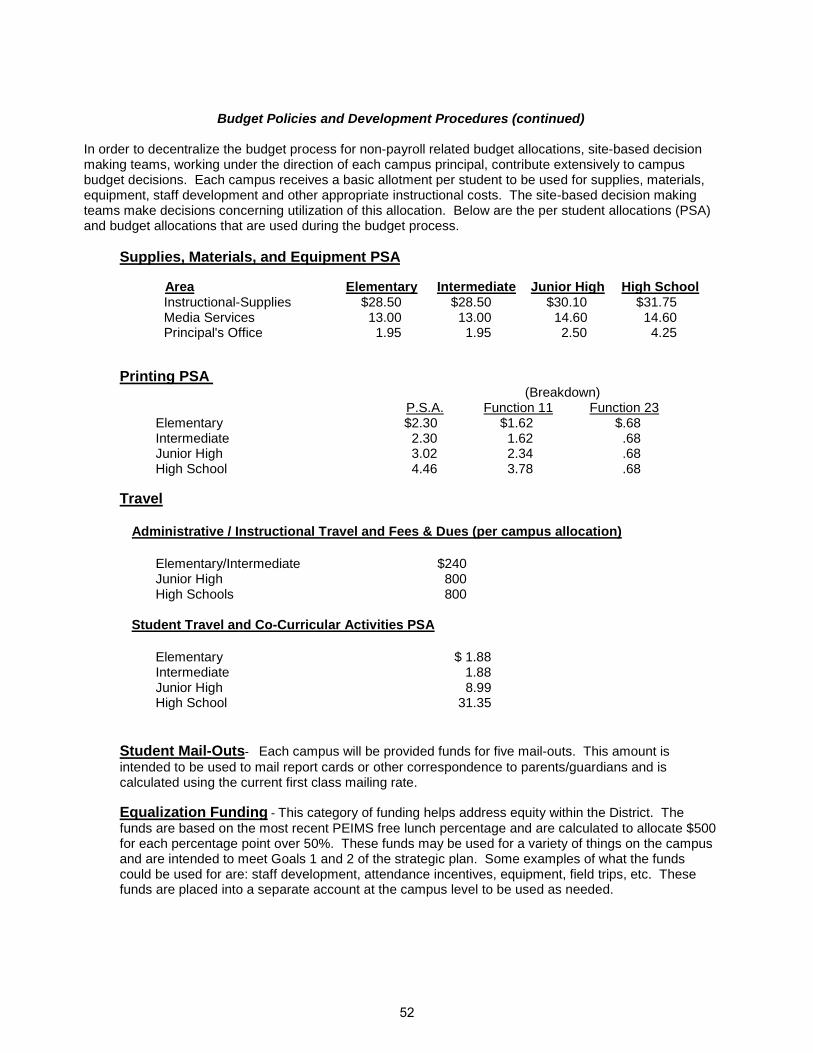
Budget Policies and Development Procedures (continued)
In order to decentralize the budget process for non-payroll related budget allocations, site-based decision making teams, working under the direction of each campus principal, contribute extensively to campus budget decisions. Each campus receives a basic allotment per student to be used for supplies, materials, equipment, staff development and other appropriate instructional costs. The site-based decision making teams make decisions concerning utilization of this allocation. Below are the per student allocations (PSA) and budget allocations that are used during the budget process.
Supplies, Materials, and Equipment PSA
Area Elementary Intermediate Junior High High School Instructional-Supplies $28.50 $28.50 $30.10 $31.75 Media Services 13.00 13.00 14.60 14.60 Principal's Office 1.95 1.95 2.50 4.25
Printing PSA (Breakdown) P.S.A. Function 11 Function 23 Elementary $2.30 $1.62 $.68 Intermediate 2.30 1.62 .68 Junior High 3.02 2.34 .68 High School 4.46 3.78 .68
Travel Administrative / Instructional Travel and Fees & Dues (per campus allocation)
Elementary/Intermediate $240 Junior High 800 High Schools 800 Student Travel and Co-Curricular Activities PSA
Elementary $ 1.88 Intermediate 1.88 Junior High 8.99 High School 31.35
Student Mail-Outs- Each campus will be provided funds for five mail-outs. This amount is
intended to be used to mail report cards or other correspondence to parents/guardians and is calculated using the current first class mailing rate.
Equalization Funding - This category of funding helps address equity within the District. The
funds are based on the most recent PEIMS free lunch percentage and are calculated to allocate $500 for each percentage point over 50%. These funds may be used for a variety of things on the campus and are intended to meet Goals 1 and 2 of the strategic plan. Some examples of what the funds could be used for are: staff development, attendance incentives, equipment, field trips, etc. These funds are placed into a separate account at the campus level to be used as needed.
52

Budget Policies and Development Procedures (continued)
Budgets for non-campus units are developed by department heads and reviewed by the Superintendent and the Chief Financial Officer. The Chief Financial Officer develops the Debt Service Fund budget. This budget is constructed based primarily on tax base assumptions (for local revenue projections), State funding estimates, and required and projected debt retirement requirements. The Food Service Fund budget is prepared by the Director of Child Nutrition. The Superintendent and Chief Financial Officer then review the budget for approval. Following this development process, consolidated budgetary information is presented to the Board of Trustees in workshops and regular meetings. This information is summarized in a variety of different presentations and line item detail is provided, as requested, through written and verbal supporting information. Significant dates and events included in the budget development process are summarized on the budget calendars on the following pages of this document. Capital Improvement Budget Policies Capital Projects Funds are used to account for the proceeds of general obligation bonds and related interest earnings and the expenditures of these funds for the construction and equipping of new school facilities, to purchase school sites, and renovations or repair of existing facilities. The Board of Trustees does not formally adopt the Capital Projects Funds budgets annually. These budgets are prepared on a project basis based on the proceeds available from bond issues and planned expenditures outlined in applicable bond ordinances. Capital Projects Fund equity is re-appropriated in each year’s budget through budget amendments until all available funds for acquisition and construction of facilities are utilized. Each major construction contract is approved based on the existing availability of bond proceeds and/or approved but not issued bonds. However, the impact of the Capital Projects Funds budgets must be considered during development of the annual budgets for all other funds. Future operating costs (staffing, utilities, etc.) associated with capital improvements and new facilities must be projected and included in the General Fund budget. Repayment of bonds issued for capital projects must be included in Debt Service Fund projections Additionally, certain capital outlay expenditures are budgeted in the General Fund. Other capital needs (buses, computers, etc.) are provided for in both the General Fund and the Technology Fund based on department head requests during the budget hearings. Before any Capital Improvement Projects are considered, a detailed demographic/enrollment study, and a review of existing facilities for optimization must be conducted by a competent demographer. These studies will determine if a new building is necessary to relieve existing buildings in demographic areas of the District. Whenever these assessments are being conducted, a District wide long-range facility master plan with associated cost and time frame must be considered and coordinated with District Financial Advisors.
53

Conroe Independent School District
Budget Calendar
Fiscal Year 2018-2019
December 5, 2017 Preliminary budget meeting of the Finance Office to discuss
budget development process
February 6, 2018 First meeting with the Board to discuss budget projections
and goals
January - February Projected enrollment figures developed and ready for use in
budget preparation
February 2018 Preliminary budget meeting with Finance Office and Deputy
Superintendent and Assistant Superintendents for
Secondary & Elementary Education to discuss budget
meetings with department heads and principals and overall
budget process
April 18, 2018 ELEMENTARY/INTERMEDIATE PRINCIPALS MTG
Distribute budget information to elementary and intermediate
campus principals. Discuss per pupil allocations, specific
budget needs, and mechanics of budgeting.
April 18, 2018 SECONDARY PRINCIPALS MEETING
Distribute budget information to secondary campus
principals. Discuss per pupil allocations, specific budget
needs, and mechanics of budgeting.
April 18, 2018 CURRICULUM & INSTRUCTION
Distribution budget information to Curriculum group
Feb-May Staffing allocation meetings with principals
54

Conroe Independent School District
Budget Calendar
Fiscal Year 2018-2019
April-May Finance Office to meet with individual support department
heads to distribute budget packets, and discuss budget
development process
May 11, 2018 Campus budgets due to Assistant Superintendents for
Secondary and Elementary Education
May 18, 2018 Campus budgets due to Finance Office
All departmental budgets due to the Finance Office
May-June Review campus and department budgets. Develop payroll
budgets.
June 2018 Revenue budgets developed based on estimated tax values.
Expenditure estimates based on submitted requests
including staffing changes and salary adjustments.
May - August Schedule meetings and review budget with the Board of
Trustees.
July 13, 2018 I M P O R T A N T
Official Notification Received for Chapter 41 Status
July 17, 2018 Regular Board Meeting (1st Budget Proposals)
July 19, 2018 Post Notice of public hearing on budget and tax rate.
55

Conroe Independent School District
Budget Calendar
Fiscal Year 2018-2019
July 2018 Meeting with District-Level Planning & Decision-Making
Committee to discuss 2018-19 Budget
July 25, 2018 FOR INFORMATION ONLY
District receives certified appraisal roll. Adjust revenue
projections.
August 1, 2018 Public hearing on 2018-19 Budget and Tax Rate. Special
Board Meeting to discuss budget
August 3, 2018 Publish “NOTICE OF PUBLIC MEETING TO DISCUSS
BUDGET AND TAX RATE”
(must be at least 10 days prior to public meeting).
August 21, 2018 REGULAR BOARD MEETING
1. Public hearing on 2018-19 Budget and Tax Rate.
2. Adopt 2018-19 Budget (Must be before adoption of tax
rate)
3. Set 2018-19 Tax Rate (Must adopt by component, i.e.
M&O and I&S).
September 1, 2018 Last date to complete the 2018-19 Chapter 41 Intent/Choice
Selection in TEASE
56

Conroe Independent School District
Budget Administration and Management Process
Adoption of the official budget by the Board of Trustees is only the first step in the budget process. Following adoption, the budget administration and management process begins. The budget administration and management process is the process of regulating expenditures throughout the fiscal year to ensure that they do not exceed authorized amounts and that they are used for intended, proper, and legal purposes.
Expenditure Control and Approvals
Expenditure appropriations are allocated between organizations or cost centers (campuses, departments, divisions, etc.). Each organization is assigned a budget manager (i.e., principal, department head). The budget manager is accountable for his organization’s portion of the General Fund budget. Each budget manager is authorized to approve the expenditure of funds within their respective organization provided that the funds are expended in accordance with District purchasing procedures and legal requirements.
This is accomplished through the use of the Standard Account Code System prescribed by the Texas Education Agency, which includes an organization code. This code system is described in detail within this document. Each budget manager (or designee) is granted on-line access to the accounting codes for their organization. This access includes purchase order, check requisition, account inquiry and reporting capabilities.
Purchase Orders The Board of Trustees approves all bid awards and contracts. Purchase orders are prepared for all tangible goods. Once a purchase order is entered and approved at the campus/departmental level, administrative regulations require that all purchase orders be forwarded to the Purchasing Department for verification of availability of funds, proper account coding, and compliance with legal purchasing procedures. Purchasing then sends the P.O. to the appropriate vendor. Once the P.O. is printed and mailed, an encumbrance is entered into the account code. Encumbrances are reservations of appropriations for open purchase orders for goods that have not yet been received. The purpose of the encumbrance is to insure that obligations are recognized as soon as financial commitments are made in order to prevent inadvertent over-expenditure of funds due to lack of information about future commitments.
The majority of goods are received at our Central Warehouse. The warehouse personnel prepare a receiving report either on-line or manually. Once the Accounts Payable Department matches the P.O., receiving report and vendor invoice, payment is made.
Check Requisitions Check requisitions are used for payment for services, employee travel, and relatively small dollar reimbursements. Check requisitions, along with the appropriate supporting documentation, are forwarded to the Finance Office for verification, approval, and payment.
Amending the Budget
The budget is legally adopted at the fund and function level. The Board of Trustees must, therefore, approve budget amendments that transfer funds between funds or functions. For example, appropriations for instruction cannot be transferred to administration without Board approval. All other required transfers that do not involve fund or function changes are reviewed, approved, and processed by the Finance Office.
57

Budget Administration and Management Process (continued)
Amending the Budget (continued) To reduce the number of transfers that require processing by the Finance Office, budgetary control accounts have been established so that budget managers are able to utilize their organization’s funds as necessary within the same fund and function without submitting an official budget amendment. Control accounts link several detail expenditure accounts to the same budgetary control balance. For example, assume that the general supplies detail account at a particular campus had no remaining budgetary balance and the warehouse supplies detail account in the same fund and function had a remaining budget balance. An expenditure could be made from the general supplies account without doing a budget transfer because the control account (which includes the warehouse supplies account) had enough funds to cover the expenditure. Monitoring the Budget The District’s interactive, on-line budgetary accounting and control system provides many useful reports to assist Board Members, Finance Office personnel, and budget managers in administering, monitoring, and controlling the implementation of the budget. This system provides many checks on account balances to insure that funds are not over-expended at the budgetary control account level. If sufficient funds are not available at the budgetary control account level, purchase order and check requisitions cannot be generated. The CFO carefully monitors comparisons between budget and actual expenditures to maintain cost control and to insure against over-spending for payroll and related accounts. On a monthly basis, management reviews financial projection reports generated by the District’s accounting system. At any period of time during the year, financial projections through the end of the fiscal year can be generated. This is done by taking the expenditures through a certain specified period in the current year divided by the percent of expenditures through this same period in the prior year divided by total actual expenditures in the prior year. This process of reviewing projected year-end expenditure levels, as well as current expenditure levels, provides an increased level of comfort in assuring budgetary compliance. Relevant financial reports are submitted to the Board of Trustees on a monthly basis. The final step in the budget monitoring process is the evaluation of the results of operations that are presented annually in the District’s Comprehensive Annual Financial Report (CAFR). Reporting to the Texas Education Agency (TEA) The District budget must be submitted to TEA via the Public Education Information Management System (PEIMS) transmission process as of the date established in the annual instructions for the system. TEA monitors for compliance at the district level only. This monitoring is a legal requirement to ensure mandatory expenditure levels in certain areas. In addition, amended budgets are reflected on the schedule comparing budget and actual results in the Annual Financial and Compliance Report. The requirement for filing the amended budget with TEA is formally met when the District submits its Annual Financial and Compliance Report.
58

Financial Section

Financial Overview Combined revenues for all funds are budgeted to decrease to $605 million for budget year 2018-19. This decrease is $4.5 million less than the combined projected revenues for 2017-18. The majority of the decrease is in federal revenue in the General Fund. The federal revenue that the District receives is based on Medicaid reimbursement claims and is subject to federal regulations, therefore the District does not include this as budgeted revenue. The majority of General and Debt Service fund revenues are generated by tax collections. The District has experienced dramatic increases in its tax base, averaging 6.9% over the past ten years.
$- $5
$10 $15 $20 $25 $30 $35 $40
2013/14 2014/15 2015/16 2016/17 2017/18 2018/19
Billio
ns
Tax Base Trend
`
We have provided several supporting schedules that show the Tax Rate effects for the District on pages 62-63. Revenues for the Capital Projects fund will be earned by investment income. All of the bonds approved in the 2015 bond referendum have been sold. The majority of projects approved in the 2015 bond referendum will be completed by the end of fiscal year 2018-19. In the Food Service Fund approximately (59%) of the revenue in this fund is received from the United States Department of Agriculture (USDA) under the National School Lunch Program and the School Breakfast Program. The remaining revenue (41%) is primarily generated from user fees i.e. student payments for meals. The Food Service revenue is budgeted to remain consistent with the 2017-18 projected revenues. The total 2018-19 combined fund expenditures are budgeted to increase to $784 million or 3.81% over 2017-18 projected expenditure levels. The majority of the increase in expenditures is in the General fund related to additional personnel for growth. A large portion of the personnel growth was a result of opening two new campuses in 2018-19 including Grand Oaks High School. Our number one goal as a district is student achievement so it is a priority in the budget process to provide the necessary funding to put an adequate number of teachers in the classroom as well as maintain a competitive pay structure to retain high quality teachers.
Projected Budget Percent
2017-18 2018-19 Change
General Fund 478,722,725$ 495,459,113$ 3.50%
Debt Service Fund 100,397,172 103,055,656 2.65%
Capital Projects Fund 154,440,171 163,504,113 5.87%
Food Service Fund 21,673,994 22,000,000 1.50%
Total 755,234,062$ 784,018,882$ 3.81%
Total Expenditures by Fund Comparison
59

2018-19
General Fund Debt Service Capital Pojects Food Service Total
Revenues
5710 Tax Collections 363,478,836$ 78,872,595$ -$ -$ 442,351,431$
5742 Investment earnings 3,425,000 250,000 352,914 - 4,027,914
5749 Miscellaneous 3,800,000 - - - 3,800,000
5751 Food service-meals - - - 9,105,362 9,105,362
Total Local Revenues 370,703,836 79,122,595 352,914 9,105,362 459,284,707
5810 Foundation school program 108,271,646 - - - 108,271,646
5829 Miscellaneous state revenue - 1,630,972 - - 1,630,972
5831 Teacher retirement on-behalf 23,300,000 - - - 23,300,000
Total State Revenues 131,571,646 1,630,972 - - 133,202,618
5921 School breakfast program - - - 2,545,220 2,545,220
5922 National school lunch program - - - 10,349,418 10,349,418
5929 Misc. Federal Revenues - - - - -
Total Federal Revenues - - - 12,894,638 12,894,638
Total Revenues 502,275,482 80,753,567 352,914 22,000,000 605,381,963
Expenditures
11 Instruction 315,098,815 - - - 315,098,815
12 Instructional resources & media 5,782,833 - - - 5,782,833
13 Staff development 3,814,145 - - - 3,814,145
21 Instructional administration 4,408,256 - - - 4,408,256
23 School administration 31,195,357 - - - 31,195,357
31 Guidance and counseling 15,670,999 - - - 15,670,999
32 Social work services 745,210 - - - 745,210
33 Health services 5,378,152 - - - 5,378,152
34 Student transportation 25,581,500 - - - 25,581,500
35 Food services - - - 20,471,000 20,471,000
36 Co-curricular activities 11,506,271 - - - 11,506,271
41 General administration 8,439,765 - - - 8,439,765
51 Plant maintenance & operations 49,046,719 - 437,480 1,529,000 51,013,199
52 School police 7,538,589 - - - 7,538,589
53 Technology 6,933,402 - - - 6,933,402
61 Community service 19,100 - - - 19,100
71 Debt service - 103,055,656 - - 103,055,656
81 Facilities acquisition & const. - - 163,066,633 - 163,066,633
99 Other Intergovernmental 4,300,000 4,300,000
Total Expenditures 495,459,113 103,055,656 163,504,113 22,000,000 784,018,882
Excess Revenues Over Expenditures 6,816,369 (22,302,089) (163,151,199) - (178,636,919)
Other Resources (Uses) - - - - -
Fund Balance-Beginning-Projected 138,088,222 32,151,683 169,400,938 3,517,732 343,158,575
Fund Balance-Ending-Projected 144,904,591$ 9,849,594$ 6,249,739$ 3,517,732$ 164,521,656$
Expenditures By Major Object
2018-19
General Fund Debt Service Capital Pojects Food Service Total
6100 Payroll Costs 442,197,112 - - 8,580,000 450,777,112
6200 Purchase & Cont Service 27,013,305 - 344,299 1,634,000 28,991,604
6300 Supplies and Materials 19,060,106 - 5,553,851 11,135,000 35,748,957
6400 Other Operating Expend 6,485,890 - - 30,000 6,515,890
6500 Debt Service 103,055,656 - - 103,055,656
6600 Capital Outlay 702,700 - 157,605,963 621,000 158,929,663
Total Expenditures 495,459,113 103,055,656 163,504,113 22,000,000 784,018,882
Note: Please see individual fund sub-sections for more detailed explanations of revenues, expenditures and fund balance.
-
Conroe Independent School District
Combined Budget Summary: 2018-19 Including 2017-18 Projected and 2016-17, 2015-16 & 2014-15 ActualGeneral Fund, Debt Service Fund, Capital Projects & Food Service Fund
60

2018-19 2017-18 2016-17 2015-16 2014-15
Total Projected Actual Actual Actual
Revenues
5710 Tax Collections 442,351,431$ 430,671,954$ 413,886,890$ 378,727,243$ 344,360,198$
5742 Investment earnings 4,027,914 8,440,463 5,091,776 2,058,651 1,401,637
5749 Miscellaneous 3,800,000 4,343,310 5,236,413 5,025,977 4,244,960
5751 Food service-meals 9,105,362 8,273,127 7,759,230 7,278,099 7,031,534
Total Local Revenues 459,284,707 451,728,854 431,974,309 393,089,970 357,038,329
5810 Foundation school program 108,271,646 111,275,991 111,735,410 135,298,280 134,575,901
5829 Miscellaneous state revenue 1,630,972 1,631,352 1,640,669 1,745,398 181,219
5831 Teacher retirement on-behalf 23,300,000 24,913,141 22,255,241 21,568,418 20,170,567
Total State Revenues 133,202,618 137,820,484 135,631,320 158,612,096 154,927,687
5921 School breakfast program 2,545,220 2,469,464 2,282,763 2,107,325 1,982,691
5922 National school lunch program 10,349,418 9,996,699 8,875,517 8,307,723 7,953,730
5929 Misc. Federal Revenues - 7,839,159 6,386,706 5,470,812 4,899,707
Total Federal Revenues 12,894,638 20,305,322 17,544,986 15,885,860 14,836,128
Total Revenues 605,381,963 609,854,660 585,150,615 567,587,926 526,802,144
Expenditures
11 Instruction 315,098,815 301,234,511 288,785,976 269,564,440 247,267,817
12 Instructional resources & media 5,782,833 5,457,300 5,202,042 5,011,418 4,951,934
13 Staff development 3,814,145 4,836,639 4,386,217 3,657,662 3,145,356
21 Instructional administration 4,408,256 4,329,347 4,079,657 3,934,071 3,286,308
23 School administration 31,195,357 30,817,959 29,677,029 28,107,247 26,886,312
31 Guidance and counseling 15,670,999 15,167,657 14,434,700 13,765,964 16,109,307
32 Social work services 745,210 748,800 736,712 571,904 418,316
33 Health services 5,378,152 5,377,890 5,204,205 4,959,713 4,727,352
34 Student transportation 25,581,500 26,775,039 23,384,228 20,375,121 19,892,018
35 Food services 20,471,000 20,001,196 18,368,540 17,840,912 17,473,807
36 Co-curricular activities 11,506,271 11,197,042 11,056,164 9,992,991 9,747,914
41 General administration 8,439,765 8,482,219 7,918,333 7,666,050 7,032,406
51 Plant maintenance & operations 51,013,199 50,766,774 46,178,553 43,297,530 45,926,656
52 School police 7,538,589 6,723,663 6,664,235 6,647,386 5,580,730
53 Technology 6,933,402 6,843,046 6,681,671 5,923,727 5,738,640
61 Community service 19,100 12,052 10,976 10,774 18,202
71 Debt service 103,055,656 100,397,172 91,669,974 84,233,299 82,992,639
81 Facilities acquisition & const. 163,066,633 152,179,500 160,265,189 90,052,427 36,040,328
99 Other Intergovernmental 4,300,000 3,886,256 3,436,384 3,082,741 2,760,118
Total Expenditures 784,018,882 755,234,062 728,140,785 618,695,377 539,996,160
Excess Revenues Over Expenditures (178,636,919) (145,379,402) (142,990,170) (51,107,451) (13,194,016)
Other Resources (Uses) - 204,067,486 150,031,120 133,071,085 37,373,212
Fund Balance-Beginning-Projected 343,158,575 284,470,491 277,429,541 195,465,907 171,286,711
Fund Balance-Ending-Projected 164,521,656$ 343,158,575$ 284,470,491$ 277,429,541$ 195,465,907$
2018-19 2017-18 2016-17 2015-16 2014-15
Total Projected Actual Actual Actual
6100 Payroll Costs 450,777,112$ 434,285,979$ 414,399,941$ 387,091,203$ 359,599,759$
6200 Purchase & Cont Service 28,991,604 28,313,432 27,474,211 25,544,036 29,948,638
6300 Supplies and Materials 35,748,957 41,901,680 33,047,627 31,072,025 28,852,163
6400 Other Operating Expend 6,515,890 5,907,579 5,914,543 4,566,377 4,237,144
6500 Debt Service 103,055,656 100,397,172 91,669,974 84,233,299 82,420,693
6600 Capital Outlay 158,929,663 144,428,220 155,634,489 86,188,437 34,937,763
Total Expenditures 784,018,882 755,234,062 728,140,785 618,695,377 539,996,160
- - - - -
Conroe Independent School District
General Fund, Debt Service Fund, Capital Projects & Food Service FundCombined Budget Summary: 2018-19 Including 2017-18 Projected and 2016-17, 2015-16 & 2014-15 Actual
61

General Debt Service Memo
Fund Fund Total
Requirements
Proposed Expenditure Budget 495,459,113$ 103,055,656$ 598,514,769$
Fund Balance Requirement 144,904,591 9,849,594 154,754,185
Total Requirements 640,363,704 112,905,250 753,268,954
Resources
Other Than Tax Levy:
Projected Fund Balance, 8/31/18 138,088,222 32,151,683 170,239,905
State Revenue 108,271,646 1,630,972 109,902,618
TRS On-behalf 23,300,000 - 23,300,000
Other Local Revenues 7,225,000 250,000 7,475,000
Operating Transfer - - -
Total Non-Tax Resources 276,884,868 34,032,655 310,917,523
Revenue Required From Current Tax Levy 363,478,836 78,872,595 442,351,431
Computation of Tax Rate
Revenue Required From Property Tax Levy 363,478,836 78,872,595 442,351,431
Estimated Taxable Value 35,737,543,316 35,737,543,316 35,737,543,316
Collection Rate Factor 96.00% 100.00% 96.60%
Adjusted Net Estimated Taxable Value 34,308,041,583 35,737,543,316 34,522,466,843
Tax Rate Needed Per $100 Valuation 1.06 0.220 1.280
Tax Rate Recommended 1.06$ 0.220 1.280
Prior Year Tax Rate 1.04$ 0.240 1.280
Conroe Independent School District
Combined Property Tax Rate Calculation Worksheet
2018-2019
62

2014-15 2015-16 2016-17 2017-18 2018-19
Assessed/Market value of a home 252,948$ 283,155$ 296,236$ 294,906$ 293,518$
Less: Homestead exemption 15,000 15,000 25,000 25,000 25,000
Taxable value 237,948 268,155 271,236 269,906 268,518
Total property tax rate 1.2800 1.2800 1.2800 1.2800 1.2800
Property tax due 3,046$ 3,432$ 3,472$ 3,455$ 3,437$
Percent of property tax due increase 12.06% 12.69% 1.15% -0.49% -0.51%
(decrease) from prior year
Each year the Montgomery County Appraisal District appraises property based on market conditions such as sales in
the surrounding areas. The above schedule shows how market conditions & tax rates would affect the amount of
property tax due through 2018-19 based on the overall trends of the District.
Conroe Independent School District
Impact of Budget on Taxpayers
$1,000
$1,500
$2,000
$2,500
$3,000
$3,500
$4,000
2014-15 2015-16 2016-17 2017-18 2018-19
Property Tax Due
63
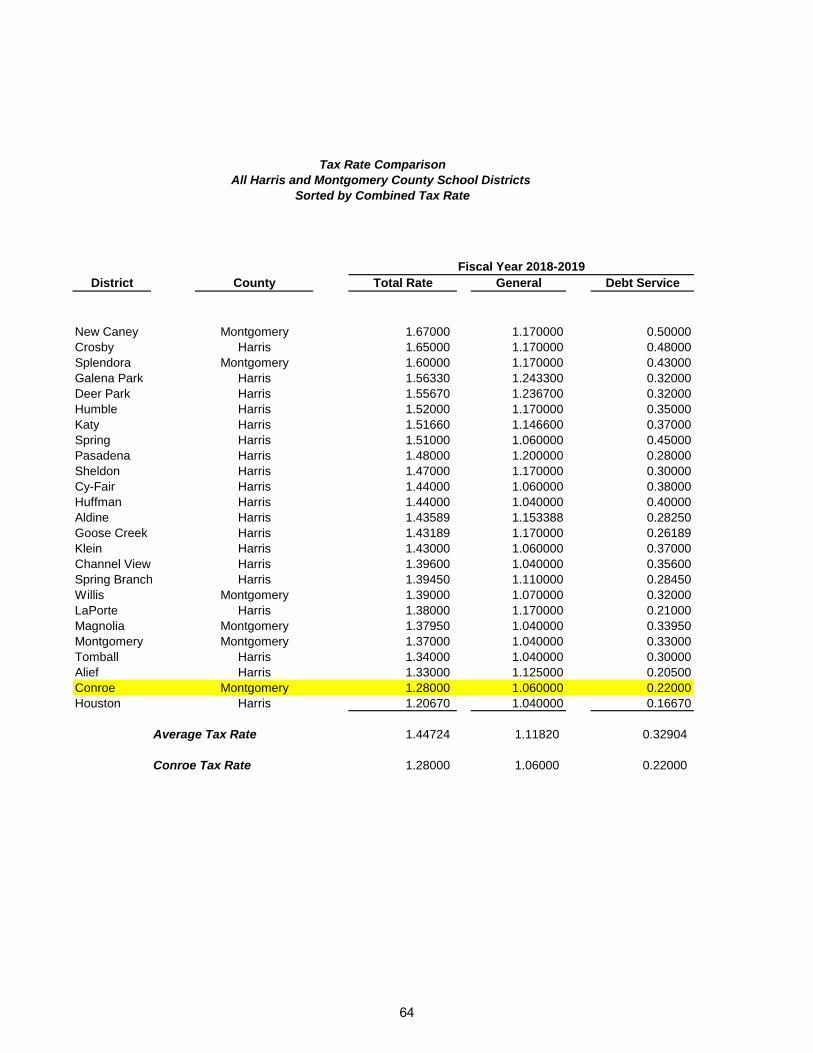
District County Total Rate General Debt Service
New Caney Montgomery 1.67000 1.170000 0.50000
Crosby Harris 1.65000 1.170000 0.48000
Splendora Montgomery 1.60000 1.170000 0.43000
Galena Park Harris 1.56330 1.243300 0.32000
Deer Park Harris 1.55670 1.236700 0.32000
Humble Harris 1.52000 1.170000 0.35000
Katy Harris 1.51660 1.146600 0.37000
Spring Harris 1.51000 1.060000 0.45000
Pasadena Harris 1.48000 1.200000 0.28000
Sheldon Harris 1.47000 1.170000 0.30000
Cy-Fair Harris 1.44000 1.060000 0.38000
Huffman Harris 1.44000 1.040000 0.40000
Aldine Harris 1.43589 1.153388 0.28250
Goose Creek Harris 1.43189 1.170000 0.26189
Klein Harris 1.43000 1.060000 0.37000
Channel View Harris 1.39600 1.040000 0.35600
Spring Branch Harris 1.39450 1.110000 0.28450
Willis Montgomery 1.39000 1.070000 0.32000
LaPorte Harris 1.38000 1.170000 0.21000
Magnolia Montgomery 1.37950 1.040000 0.33950
Montgomery Montgomery 1.37000 1.040000 0.33000
Tomball Harris 1.34000 1.040000 0.30000
Alief Harris 1.33000 1.125000 0.20500
Conroe Montgomery 1.28000 1.060000 0.22000
Houston Harris 1.20670 1.040000 0.16670
Average Tax Rate 1.44724 1.11820 0.32904
Conroe Tax Rate 1.28000 1.06000 0.22000
Tax Rate Comparison
All Harris and Montgomery County School Districts
Sorted by Combined Tax Rate
Fiscal Year 2018-2019
64

Combined Tax Rate Comparison
with area School Districts
$1.20
$1.25
$1.30
$1.35
$1.40
$1.45
$1.50
$1.55
Humble Katy Spring Cy-Fair Klein Conroe
65

Conroe Independent School District
66

Financial Section General Fund

General Fund The General Fund is the District’s principal fund, accounting for the majority of current operating expenditures. Recorded in the General Fund are transactions encompassing the approved current operating budget, related revenues, expenditures, assets, liabilities, and fund balance. Financial transactions of the District are recorded in detail in the general ledger by objects and functions within projects and programs. This fund has often been described as an operating or current fund and includes revenues from an ad valorem local maintenance tax, state funding, and other sources such as tuition, fees, and investment earnings.
Revenue Trends and Assumptions Enrollment Trend
The major estimate necessary to build the General Fund budget is student enrollment. State revenue estimates, as well as the campus expenditure budget allocations, rely heavily on enrollment data. The District has experienced significant increases in enrollment over the last ten years of approximately 13,400 students. This trend is expected to continue for the foreseeable future. Enrollment growth presents District personnel with significant challenges including additional personnel, instructional facilities, supplies, and materials.
35,000
40,000
45,000
50,000
55,000
60,000
65,000
09/10 10/11 11/12 12/13 13/14 14/15 15/16 16/17 17/18 18/19
Enrollment Trend
State Funding Trend State funding provides 26% of the revenue necessary to fund operating expenditures. The Texas Legislature meets biennially unless the Governor requests a special session. Attempts to reform Texas’ public school finance system failed during the 85th Regular Session of the Texas Legislature. However, the governor did call for a special session resulting in the passing of HB 21. Initially the bill would have provided an additional $1.8 billion in funding to public schools in Texas, which would have added $1.5 billion to the basic allotment. The Senate stripped the bill down to $300 million, focused primarily on various special education grants, support for small and rural schools, and the extension of ASATR to prevent many districts from closing schools. The bill also established a School Finance Commission to evaluate and suggest changes to Texas school finance system. For additional information on the State of Texas budget visit this
website. http://www.lbb.state.tx.us/.
The two primary components of the funding formula are (Tier I and II). The Tier I component of school funding represents the cost of providing basic educational services for students in the district. Tier I provides funding for regular education, special education, compensatory education, bilingual education, gifted and talented education, career and technology education and transportation. Under Tier I, the State subsidizes tax receipts as needed to produce a basic allotment for each student in average daily attendance. The district’s portion is calculated by using the compressed tax rate (2005 adopted maintenance and operations [M&O] rate multiplied by 0.6667). The basic allotment remains at $5,140 per average daily attendance A.D.A.
67

State Funding Trend (continued)
In Tier II, the state will subsidize tax receipts as needed to produce a guaranteed level of revenue per student per penny of property tax levy. The guaranteed yield program provides funds for educational services beyond the basic programs financed through Tier 1. The first level of Tier II was collapsed into the basic allotment so that the guaranteed yield for enrichment is paid on the tax effort that exceeds the compressed rate. The Tier II, Level II yield per student in weighted average daily attendance (WADA) was increased to $106.28.
Detailed calculations of State revenue estimates are in the Informational Section of this document and summarized below.
Projected Budget
2017-18 2018-19
Tier I :
Total allocation 410,028,339$ 413,857,045$
Less: Local Share (320,453,054) (336,014,571)
State share of Tier I 89,575,285 77,842,474
Tier II 20,167,853 28,862,212
Other Programs 1,532,853 1,566,960
Total state revenue 111,275,991$ 108,271,646$
Tax Base Trend The largest portion of funding in the General Fund is derived from local funding sources, primarily property taxes, which accounts for 72% of total budgeted funds. In order to budget both State and local revenues, the District must accurately estimate the taxable value of property within the District. The Montgomery County Appraisal District (MCAD) appraises all District property. Taxes are calculated by dividing the assessed property value (less the homestead exemption amount, if applicable) by 100 and multiplying by the tax rate. The District’s tax base continues to grow at a very healthy rate averaging 6.9% growth over the last 10 years. Conroe ISD’s maintenance and operations tax rate will increase to $1.06 in 2018-2019 compared to $1.04 for 2017-18. As a result of the impact of Hurricane Harvey, Governor Abbott added Montgomery County to his state disaster declaration list on August 26, 2017, and he requested federal and state disaster assistance at that time. Because the District had increased expenditures in response to Hurricane Harvey, the District was then be eligible to raise its maintenance and operations taxes above the rollback rate without a ratifying election. This one time exception is in accordance with Section 26.08(a) of the Texas Tax Code.
$- $5
$10 $15 $20 $25 $30 $35 $40
2013/14 2014/15 2015/16 2016/17 2017/18 2018/19
Bill
ions
Tax Base Trend
`
68

Revenue Trends and Assumptions (continued) The State revenue sources discussed above and local revenue from property tax collections make up approximately 94% of total revenue. The majority of the remaining 6% is amounts contributed by the State to the Teacher Retirement System (TRS) on behalf of the District’s employees. This amount is also recognized as an expenditure. The revenue estimate is set equal to the expenditure estimation, which is calculated at 8.05% of eligible earnings.
General Fund Revenue Sources Comparison
Projected Budget Percent
2017-18 2018-19 Change
Local Sources $ 357,994,721 $370,703,836 3.6%
State sources 136,189,132 131,571,646 -3.4%
Federal sources 6,515,873 - -100.0%
Total $ 500,699,726 $502,275,482 0.3%
Student Demographics The District’s student demographics consist of 48.3% White, 36% Hispanic, 7.7% African American, and 8% other. The District’s demographics are illustrated in the chart below. The District has an economically disadvantaged rate of 37%.
48.3%
36.0%
7.7%
8.0%
Conroe ISD Student Demographics
White Hispanic African American Other
69

Expenditure Summary The total General Fund expenditure budget for 2018-19 is $459,459,113. This is an increase of $16,739,388 or 3.5% over projected 2017-17 expenditure levels. As always, the majority of a school district’s expenditures are for personnel costs (89.26%). The compensation package provided for in the budget includes a competitive salary increase of $1,450 for teachers, librarians and nurses. Other professional staff received a 2.5% raise while support personnel received a 3.0% increase on the midpoint. The approximate cost of these salary increases is $9.22 million Other major General Fund expenditures include:
• Additional personnel related to growth $10.98 million
• Supplies and materials related to growth of $2.23 million.
Impact on Fund Balance The District’s fund balance in fiscal year 2017-18 is projected to be $138,088,222. This projected balance represents approximately three months of expenditures or 28% of the annual budgeted expenditures and provides needed stability given significant uncertainty in projections of future revenues and expenditures.
The current unassigned fund balance of 28% exceeds the District’s goal of 25% of the annual budget.
$0
$15
$30
$45
$60
$75
$90
$105
$120
$135
$150
2014 2015 2016 2017 2018
Mill
ion
s
General Fund BalancesRequired Minimum Balance Fund Balance in Excess of Target
70

Conroe Independent School District
71

2017-18
2016-17 Amended 2017-18 2018-19 Percent
Actual Budget Projected Proposed Inc/Dec
Revenues
5710 Tax collections 336,298,844$ 344,396,367$ 349,916,564$ 363,478,836$ 3.88%
5742 Investment earnings 2,083,841 2,200,000 3,734,947 3,425,000 -8.30%
5749 Miscellaneous 5,216,618 4,212,954 4,343,210 3,800,000 -12.51%
Total Local Revenues 343,599,303 350,809,321 357,994,721 370,703,836 3.55%
5810 Foundation school program 111,735,410 99,331,419 111,275,991 108,271,646 -2.70%
5831 Teacher retirement on-behalf 22,255,241 24,800,000 24,913,141 23,300,000 -6.48%
Total State Revenues 133,990,651 124,131,419 136,189,132 131,571,646 -3.39%
5929 Misc. federal revenues 5,040,830 4,788,469 6,515,873 - -100.00%
Total Revenues 482,630,784 479,729,209 500,699,726 502,275,482 0.31%
Expenditures
11 Instruction 288,785,976 304,963,814 301,234,511 315,098,815 4.60%
12 Instructional resources & media 5,202,042 5,556,531 5,457,300 5,782,833 5.97%
13 Staff development 4,386,217 5,829,209 4,836,639 3,814,145 -21.14%
21 Instructional administration 4,079,657 4,664,468 4,329,347 4,408,256 1.82%
23 School administration 29,677,029 30,774,027 30,817,959 31,195,357 1.22%
31 Guidance and counseling 14,434,700 15,432,586 15,167,657 15,670,999 3.32%
32 Social work services 736,712 768,759 748,800 745,210 -0.48%
33 Health service 5,204,205 5,908,932 5,377,890 5,378,152 0.00%
34 Student transportation 23,384,228 27,240,459 26,775,039 25,581,500 -4.46%
36 Co-curricular activities 11,056,164 11,805,984 11,197,042 11,506,271 2.76%
41 General administration 7,918,333 9,115,400 8,482,219 8,439,765 -0.50%
51 Plant maintenance & operations 44,719,151 47,926,175 46,331,456 49,046,719 5.86%
52 School police 6,664,235 7,010,175 6,723,663 7,538,589 12.12%
53 Technology 6,681,671 7,495,168 6,843,046 6,933,402 1.32%
61 Community service 10,976 23,100 12,052 19,100 58.48%
81 Facilities acquisition & const. 740,498 647,169 501,849 - -100.00%
99 Other Intergovernmental 3,436,384 4,000,000 3,886,256 4,300,000 10.65%
Total Expenditures 457,118,178 489,161,956 478,722,725 495,459,113 3.50%
Other Financing Sources & Uses
Other 16,000,000 18,200,000 18,200,000 - 100.00%
Total Other Financing Sources & Uses 16,000,000 18,200,000 18,200,000 - 100.00%
Total 473,118,178 507,361,956 496,922,725 495,459,113 -0.29%
Excess Revenues Over Expenditures 9,512,606$ (27,632,747)$ 3,777,001$ 6,816,369$
General Fund
Budget Summary: 2018-2019
Summary by Major Object and Function
72

2017-18
2016-17 Amended 2017-18 2018-19 Percent Percent
Actual Budget Projected Proposed Inc/Dec of Total
6100 Payroll Cost 406,264,157$ 429,448,274$ 425,748,009$ 442,197,112$ 3.86% 89.26%
6200 Purchase & cont. serv. 25,632,919 29,978,252 26,134,005 27,013,305 3.36% 5.45%
6300 Supplies and materials 16,730,289 20,464,667 18,611,539 19,060,106 2.41% 3.85%
6400 Other operating expend 5,894,715 6,466,634 5,876,401 6,485,890 10.37% 1.31%
6600 Capital outlay 2,596,098 2,804,129 2,352,771 702,700 -70.13% 0.14%
Total Expenditures 457,118,178$ 489,161,956$ 478,722,725$ 495,459,113$ 3.50% 100%
Budget Summary: 2018-2019
Expenditure Summary by Major Object
General Fund
89.26%
5.45%3.85%
1.31%
0.14%
General Fund Expenditures by Major Object
Payroll Cost
Purchase & cont. serv.
Supplies and materials
Other operating expend
Capital outlay
73
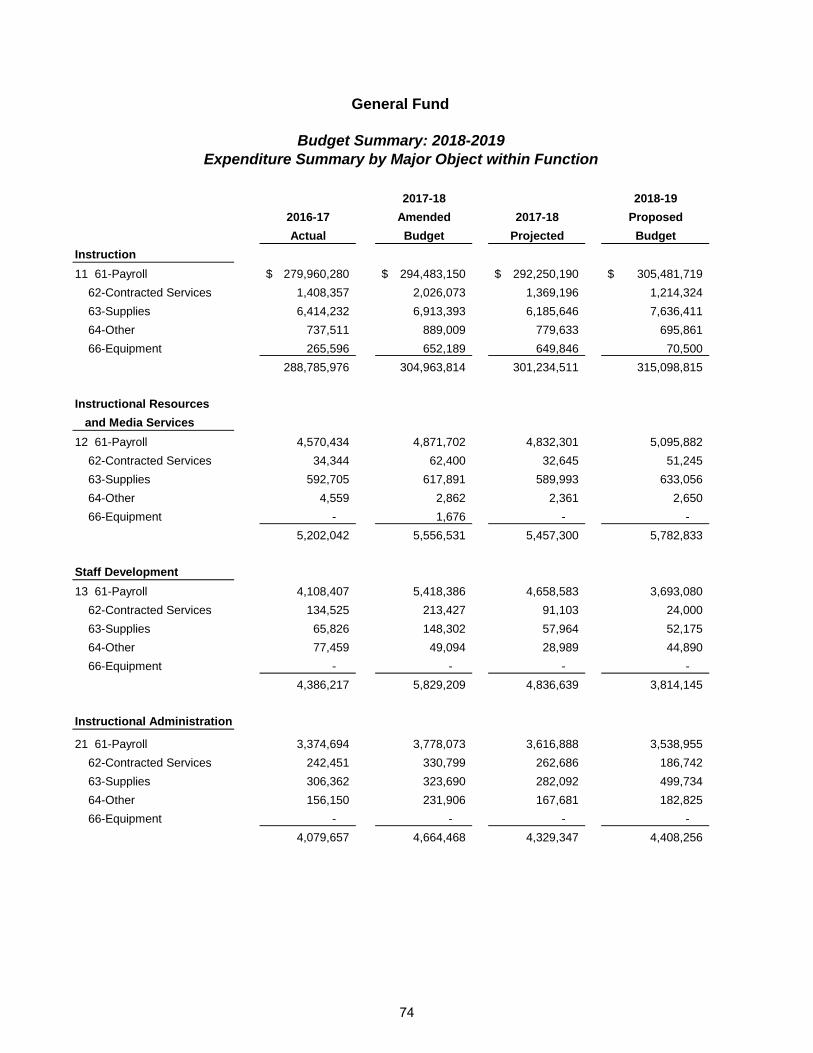
General Fund
2017-18 2018-19
2016-17 Amended 2017-18 Proposed
Actual Budget Projected Budget
Instruction
11 61-Payroll 279,960,280$ 294,483,150$ 292,250,190$ 305,481,719$
62-Contracted Services 1,408,357 2,026,073 1,369,196 1,214,324
63-Supplies 6,414,232 6,913,393 6,185,646 7,636,411
64-Other 737,511 889,009 779,633 695,861
66-Equipment 265,596 652,189 649,846 70,500
288,785,976 304,963,814 301,234,511 315,098,815
Instructional Resources
and Media Services
12 61-Payroll 4,570,434 4,871,702 4,832,301 5,095,882
62-Contracted Services 34,344 62,400 32,645 51,245
63-Supplies 592,705 617,891 589,993 633,056
64-Other 4,559 2,862 2,361 2,650
66-Equipment - 1,676 - -
5,202,042 5,556,531 5,457,300 5,782,833
Staff Development
13 61-Payroll 4,108,407 5,418,386 4,658,583 3,693,080
62-Contracted Services 134,525 213,427 91,103 24,000
63-Supplies 65,826 148,302 57,964 52,175
64-Other 77,459 49,094 28,989 44,890
66-Equipment - - - -
4,386,217 5,829,209 4,836,639 3,814,145
Instructional Administration
21 61-Payroll 3,374,694 3,778,073 3,616,888 3,538,955
62-Contracted Services 242,451 330,799 262,686 186,742
63-Supplies 306,362 323,690 282,092 499,734
64-Other 156,150 231,906 167,681 182,825
66-Equipment - - - -
4,079,657 4,664,468 4,329,347 4,408,256
Budget Summary: 2018-2019
Expenditure Summary by Major Object within Function
74

General Fund
2017-18 2018-19
2016-17 Amended 2017-18 Proposed
Actual Budget Projected Budget
Budget Summary: 2018-2019
Expenditure Summary by Major Object within Function
School Administration
23 61-Payroll 29,373,862 30,431,716 30,516,341 30,905,550
62-Contracted Services 14,131 14,789 14,114 13,449
63-Supplies 197,684 224,308 189,165 207,754
64-Other 91,352 103,139 98,339 68,604
66-Equipment - 75 - -
29,677,029 30,774,027 30,817,959 31,195,357
Guidance and Counseling
31 61-Payroll 13,817,954 14,597,049 14,670,270 15,109,720
62-Contracted Services 145,752 191,978 76,988 128,599
63-Supplies 423,971 582,178 373,556 380,548
64-Other 47,023 61,381 46,843 52,132
66-Equipment - - - -
14,434,700 15,432,586 15,167,657 15,670,999
Social Work Services
32 61-Payroll 725,542 749,500 734,369 735,310
62-Contracted Services - - - -
63-Supplies 1,751 3,054 2,747 5,650
64-Other 9,419 16,205 11,684 4,250
66-Equipment - - - -
736,712 768,759 748,800 745,210
Health Services
33 61-Payroll 5,013,432 5,440,506 5,132,660 5,243,202
62-Contracted Services 83,938 284,351 70,945 5,200
63-Supplies 91,674 165,900 163,260 127,550
64-Other 15,161 18,175 11,025 2,200
66-Equipment - - - -
5,204,205 5,908,932 5,377,890 5,378,152
75

General Fund
2017-18 2018-19
2016-17 Amended 2017-18 Proposed
Actual Budget Projected Budget
Budget Summary: 2018-2019
Expenditure Summary by Major Object within Function
Student Transportation
34 61-Payroll 19,351,277 21,428,548 21,422,967 21,632,713
62-Contracted Services 439,584 653,198 607,492 423,500
63-Supplies 2,578,719 3,958,295 3,853,688 3,047,187
64-Other 564,610 642,813 431,443 478,100
66-Equipment 450,038 557,605 459,449 -
23,384,228 27,240,459 26,775,039 25,581,500
Co-Curricular Activities
36 61-Payroll 6,634,150 6,984,093 7,010,618 7,406,880
62-Contracted Services 466,718 541,671 476,265 512,955
63-Supplies 1,076,200 1,550,957 1,094,318 959,773
64-Other 2,713,653 2,628,018 2,570,430 2,619,163
66-Equipment 165,443 101,245 45,411 7,500
11,056,164 11,805,984 11,197,042 11,506,271
General Administration
41 61-Payroll 6,082,127 6,476,920 6,427,311 6,569,165
62-Contracted Services 1,250,928 1,780,951 1,340,511 622,300
63-Supplies 223,235 358,212 295,989 397,985
64-Other 338,807 486,997 410,009 839,315
66-Equipment 23,236 12,320 8,399 11,000
7,918,333 9,115,400 8,482,219 8,439,765
Plant Maintenance
and Operation
51 61-Payroll 23,366,745 24,304,543 24,209,753 25,511,026
62-Contracted Services 15,842,880 18,184,624 16,681,540 17,509,662
63-Supplies 3,633,253 3,532,437 3,673,465 4,166,531
64-Other 1,089,525 1,260,292 1,248,849 1,425,500
66-Equipment 786,748 644,279 517,849 434,000
44,719,151 47,926,175 46,331,456 49,046,719
76

General Fund
2017-18 2018-19
2016-17 Amended 2017-18 Proposed
Actual Budget Projected Budget
Budget Summary: 2018-2019
Expenditure Summary by Major Object within Function
School Police
52 61-Payroll 6,025,697 6,294,800 6,092,507 6,922,900
62-Contracted Services 117,330 106,098 98,033 116,137
63-Supplies 339,164 365,300 321,806 278,152
64-Other 22,380 38,171 32,699 41,700
66-Equipment 159,664 205,806 178,618 179,700
6,664,235 7,010,175 6,723,663 7,538,589
Technology
53 61-Payroll 3,857,240 4,183,788 4,169,072 4,349,510
62-Contracted Services 2,010,839 1,542,118 1,091,565 1,893,192
63-Supplies 782,620 1,713,790 1,526,969 665,600
64-Other 26,097 34,972 34,940 25,100
66-Equipment 4,875 20,500 20,500 -
6,681,671 7,495,168 6,843,046 6,933,402
Community Service
61 61-Payroll 2,316 5,500 4,179 1,500
62-Contracted Services 4,758 12,000 5,516 12,000
63-Supplies 2,893 2,000 881 2,000
64-Other 1,009 3,600 1,476 3,600
66-Equipment - - - -
10,976 23,100 12,052 19,100
Facilities Acquisition
and Construction
81 62-Contracted Services - 33,775 29,150 -
63-Supplies - 4,960 - -
66-Equipment 740,498 608,434 472,699 -
740,498 647,169 501,849 -
Other Intergovernmental
99 62-Contracted Services 3,436,384 4,000,000 3,886,256 4,300,000
3,436,384 4,000,000 3,886,256 4,300,000
Other Uses 16,000,000 18,200,000 18,200,000 -
Total 473,118,178$ 507,361,956$ 496,922,725$ 495,459,113$
77
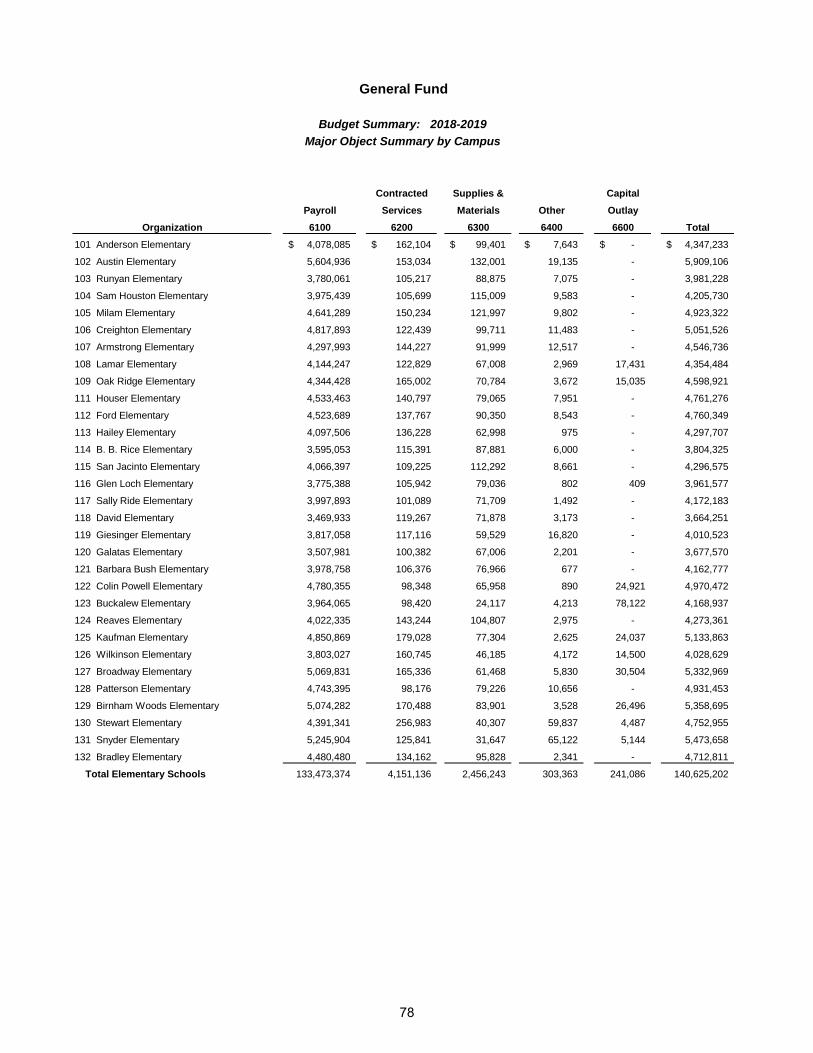
Contracted Supplies & Capital
Payroll Services Materials Other Outlay
Organization 6100 6200 6300 6400 6600 Total
101 Anderson Elementary 4,078,085$ 162,104$ 99,401$ 7,643$ -$ 4,347,233$
102 Austin Elementary 5,604,936 153,034 132,001 19,135 - 5,909,106
103 Runyan Elementary 3,780,061 105,217 88,875 7,075 - 3,981,228
104 Sam Houston Elementary 3,975,439 105,699 115,009 9,583 - 4,205,730
105 Milam Elementary 4,641,289 150,234 121,997 9,802 - 4,923,322
106 Creighton Elementary 4,817,893 122,439 99,711 11,483 - 5,051,526
107 Armstrong Elementary 4,297,993 144,227 91,999 12,517 - 4,546,736
108 Lamar Elementary 4,144,247 122,829 67,008 2,969 17,431 4,354,484
109 Oak Ridge Elementary 4,344,428 165,002 70,784 3,672 15,035 4,598,921
111 Houser Elementary 4,533,463 140,797 79,065 7,951 - 4,761,276
112 Ford Elementary 4,523,689 137,767 90,350 8,543 - 4,760,349
113 Hailey Elementary 4,097,506 136,228 62,998 975 - 4,297,707
114 B. B. Rice Elementary 3,595,053 115,391 87,881 6,000 - 3,804,325
115 San Jacinto Elementary 4,066,397 109,225 112,292 8,661 - 4,296,575
116 Glen Loch Elementary 3,775,388 105,942 79,036 802 409 3,961,577
117 Sally Ride Elementary 3,997,893 101,089 71,709 1,492 - 4,172,183
118 David Elementary 3,469,933 119,267 71,878 3,173 - 3,664,251
119 Giesinger Elementary 3,817,058 117,116 59,529 16,820 - 4,010,523
120 Galatas Elementary 3,507,981 100,382 67,006 2,201 - 3,677,570
121 Barbara Bush Elementary 3,978,758 106,376 76,966 677 - 4,162,777
122 Colin Powell Elementary 4,780,355 98,348 65,958 890 24,921 4,970,472
123 Buckalew Elementary 3,964,065 98,420 24,117 4,213 78,122 4,168,937
124 Reaves Elementary 4,022,335 143,244 104,807 2,975 - 4,273,361
125 Kaufman Elementary 4,850,869 179,028 77,304 2,625 24,037 5,133,863
126 Wilkinson Elementary 3,803,027 160,745 46,185 4,172 14,500 4,028,629
127 Broadway Elementary 5,069,831 165,336 61,468 5,830 30,504 5,332,969
128 Patterson Elementary 4,743,395 98,176 79,226 10,656 - 4,931,453
129 Birnham Woods Elementary 5,074,282 170,488 83,901 3,528 26,496 5,358,695
130 Stewart Elementary 4,391,341 256,983 40,307 59,837 4,487 4,752,955
131 Snyder Elementary 5,245,904 125,841 31,647 65,122 5,144 5,473,658
132 Bradley Elementary 4,480,480 134,162 95,828 2,341 - 4,712,811
Total Elementary Schools 133,473,374 4,151,136 2,456,243 303,363 241,086 140,625,202
General Fund
Budget Summary: 2018-2019
Major Object Summary by Campus
78

Contracted Supplies & Capital
Payroll Services Materials Other Outlay
Organization 6100 6200 6300 6400 6600 Total
General Fund
Budget Summary: 2018-2019
Major Object Summary by Campus
045 Wilkerson Intermediate 4,698,385 154,768 102,371 200 - 4,955,724
050 Collins Intermediate 3,956,144 133,946 103,512 237 - 4,193,839
067 Mitchell Intermediate 6,208,460 223,102 75,348 5,232 3,988 6,516,130
068 Grangerland Intermediate 6,712,243 417,334 127,804 9,688 - 7,267,069
069 Dolly Vogel Intermediate 6,062,131 216,486 119,950 3,935 - 6,402,502
070 Travis Intermediate 4,348,533 304,640 24,206 3,043 - 4,680,422
071 Coulson Tough K-6 5,448,981 224,488 13,296 5,398 75,190 5,767,353
073 Cryar Intermediate 4,744,238 207,097 83,803 1,278 - 5,036,416
074 Joel Deretchin K-6 5,070,956 210,958 96,348 4,620 - 5,382,882
077 Tom Cox Intermediate 4,475,006 202,033 96,560 4,206 - 4,777,805
078 Bozman Intermediate 4,972,967 225,174 98,095 2,865 - 5,299,101
080 Clark Intermediate 3,863,878 199,173 112,327 3,382 - 4,178,760
Total Intermediate Schools 60,561,922 2,719,199 1,053,620 44,084 79,178 64,458,003
041 Peet Junior High 8,614,068 302,484 253,361 41,913 - 9,211,826
043 Washington Junior High 6,471,335 265,748 190,711 50,706 - 6,978,500
046 Knox Junior High 7,361,203 324,519 252,374 36,666 - 7,974,762
049 York Junior High 7,139,410 275,988 278,217 36,205 - 7,729,820
051 Moorhead Junior High 7,480,716 308,345 248,815 49,770 - 8,087,646
053 McCullough Junior High 10,834,149 391,230 342,698 51,113 3,500 11,622,690
054 Irons Junior High 6,388,373 261,186 246,935 32,671 1,110 6,930,275
Total Junior High Schools 54,289,254 2,129,500 1,813,111 299,044 4,610 58,535,519
001 Conroe High 16,598,360 1,409,389 8,753,453 319,552 122,355 27,203,109
002 Hauke Alternative 2,068,815 102,673 38,913 91,000 - 2,301,401
003 The Woodlands High 23,695,547 1,244,189 1,052,245 404,445 - 26,396,426
005 Oak Ridge High 20,815,832 991,222 878,245 325,485 - 23,010,784
006 Academy of Science & Technology 772,410 5,377 41,180 3,518 - 822,485
008 Academy for Careers in Engineering 297,450 11,893 51,737 10,432 - 371,512
010 Discipline Alternative - JJAEP 1,793,077 19,733 46,003 7,200 - 1,866,013
011 Caney Creek High 13,803,913 512,123 711,724 234,239 - 15,261,999
013 Academy of Science & Health 754,859 829 65,963 11,000 - 832,651
014 The Woodlands College Park High 17,074,508 840,852 777,486 255,089 - 18,947,935
016 Grand Oaks High 7,510,964 736,418 719,382 155,293 - 9,122,057
201 Juvenile Detention 443,940 6,000 12,533 1,000 - 463,473
Total High Schools 105,629,675 5,880,698 13,148,864 1,818,253 122,355 126,599,845
Total Campus Costs 353,954,225$ 14,880,533$ 18,471,838$ 2,464,744$ 447,229$ 390,218,569$
Percent of Total 90.71% 3.81% 4.73% 0.63% 0.11% 100.00%
79

Actual Actual Actual Projected Budgeted
2014-15 2015-16 2016-17 2017-18 2018-19
Revenues
Local sources 284,917,123$ 313,691,107$ 343,599,303$ 357,994,721$ 370,703,836$
State sources 154,845,838 156,962,938 133,990,651 136,189,132 131,571,646
Federal sources 3,929,257 4,176,125 5,040,830 6,515,873 -
Total Revenues 443,692,218 474,830,170 482,630,784 500,699,726 502,275,482
Expenditures
Instruction 247,267,817 269,564,440 288,785,976 301,234,511 315,098,815
Instructional resources & media 4,951,934 5,011,418 5,202,042 5,457,300 5,782,833
Staff development 3,145,356 3,657,662 4,386,217 4,836,639 3,814,145
Instructional administration 3,286,308 3,934,071 4,079,657 4,329,347 4,408,256
School administration 26,886,312 28,107,247 29,677,029 30,817,959 31,195,357
Guidance and counseling 16,109,307 13,765,964 14,434,700 15,167,657 15,670,999
Social work services 418,316 571,904 736,712 748,800 745,210
Health service 4,727,352 4,959,713 5,204,205 5,377,890 5,378,152
Student transportation 19,892,018 20,375,121 23,384,228 26,775,039 25,581,500
Co-curricular activities 9,747,914 9,992,991 11,056,164 11,197,042 11,506,271
General administration 7,032,406 7,666,050 7,918,333 8,482,219 8,439,765
Plant maintenance & operations 41,821,469 41,850,941 44,719,151 46,331,456 49,046,719
School police 5,580,730 6,647,386 6,664,235 6,723,663 7,538,589
Technology 5,738,640 5,923,727 6,681,671 6,843,046 6,933,402
Community service 18,202 10,774 10,976 12,052 19,100
Facilities acquisition & const. 571,946 1,046,997 740,498 501,849 -
Other Intergovernmental 2,760,118 3,082,741 3,436,384 3,886,256 4,300,000
Total Expenditures 399,956,145 426,169,147 457,118,178 478,722,725 495,459,113
Revenues Over Expenditures 43,736,073 48,661,023 25,512,606 21,977,001 6,816,369
Other Financing Sources
Operating transfers in (out) (23,300,000) (45,550,000) (16,000,000) (18,200,000) -
Other resources - - - - -
Bond proceeds - - - - -
Total Other Financing Sources (23,300,000) (45,550,000) (16,000,000) (18,200,000) -
Revenues and Other Sources Over
Expenditures and Other 20,436,073 3,111,023 9,512,606 3,777,001 6,816,369
Fund Balance, beginning 101,251,519 121,687,592 124,798,615 134,311,221 138,088,222
Fund Balance, ending 121,687,592$ 124,798,615$ 134,311,221$ 138,088,222$ 144,904,591$
General Fund
Five Year Summary of Revenues and Expenditures
Years Ended August 31, 2015 - August 31, 2019 (Budgeted)
80

General Fund Organization Summaries
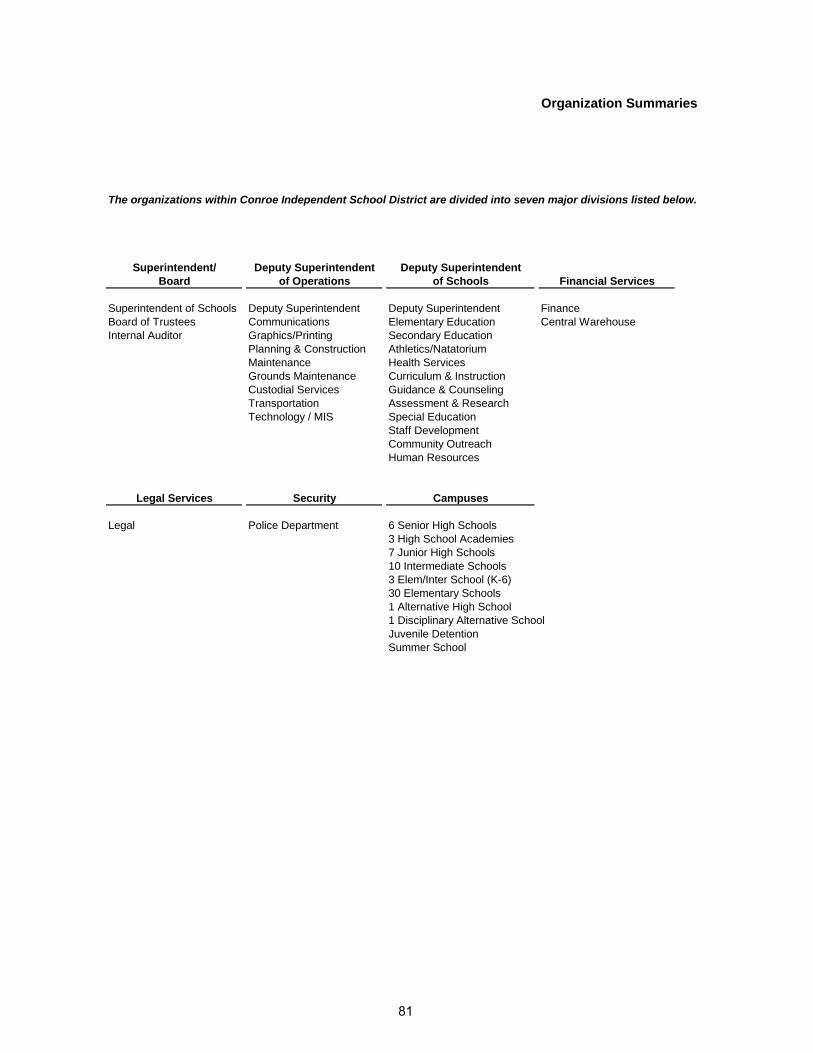
Organization Summaries
The organizations within Conroe Independent School District are divided into seven major divisions listed below.
Superintendent of Schools Deputy Superintendent Deputy Superintendent Finance
Board of Trustees Communications Elementary Education Central Warehouse
Internal Auditor Graphics/Printing Secondary Education
Planning & Construction Athletics/Natatorium
Maintenance Health Services
Grounds Maintenance Curriculum & Instruction
Custodial Services Guidance & Counseling
Transportation Assessment & Research
Technology / MIS Special Education
Staff Development
Community Outreach
Human Resources
Legal Police Department 6 Senior High Schools
3 High School Academies
7 Junior High Schools
10 Intermediate Schools
3 Elem/Inter School (K-6)
30 Elementary Schools
1 Alternative High School
1 Disciplinary Alternative School
Juvenile Detention
Summer School
Superintendent/
Legal Services
Board of Operations
Security Campuses
Financial Services
Deputy Superintendent
of Schools
Deputy Superintendent
81

Organizational Overview In the following pages of this document is an overview of the seven organizational divisions of the Conroe Independent School District. Each of the eight divisions has departments that are essential to the success of that area of expertise or responsibility. Each division may consist of one department or multiple departments. The overview will describe the activities, services, or functions of each division as well as the district employee who leads the division.
Superintendent/Board Superintendent of Schools – Dr. Curtis Null
This division consists of three areas: The Superintendent of Schools’ Office, the Board of Trustees, and the Internal Auditor. The Superintendent of Schools’ Office provides leadership, direction, coordination, and management of the District including the supervision of all employees, schools, and students. This office also presides over and facilitates meetings of the Board of Trustees, including the preparation of official minutes of the Board meetings. This division is also responsible for holding school district elections. The Board of Trustees conducts official meetings, legally required hearings, and work sessions to govern the District in all areas. The Board is also responsible for approving the budget and amendments to the budget, district policies, certifying legal documents, and signing all contracts. The office of the Internal Auditor provides the audit function for all areas of the District. These duties include auditing student activity funds, capital projects, and other areas of concern as requested by the Superintendent or the Audit Committee.
Deputy Superintendent of Operations
Deputy Superintendent of Operations – Mr. Jim Kacur The Deputy Superintendent of Operations division is comprised of nine areas: the Deputy Superintendent of Operations’ office, Communications, Graphics and Printing, Planning and Construction, Maintenance, Grounds Maintenance, Custodial Services, Transportation, and Technology/MIS. The Deputy Superintendent oversees these nine departments, assists the Superintendent, as well as coordinates several district activities. The Communication Services department is comprised of three components: Communications, Graphics, and the District Print Shop. The Conroe ISD Communications Department provides factual information representing the programs and people of CISD to all patrons in a timely and efficient manner. The Communications Office produces district-level publications and maintains and updates information daily on the CISD Website. General information items produced by the Communications Office include the CISD Overview and the CISD Campus Profiles, among others. The Communications Office is also responsible for the assembly and publication of the CISD Board Agenda, Board Book, and Board Meeting Summary. The Communications Department also serves as a direct liaison to the media, and fields media calls and inquiries on a daily basis. The department also addresses general information requests from those within and beyond the district boundaries who seek information on the District. The Graphics Department designs and creates district documents, as well as campus and departmental publications. The District’s Print Shop prints district publications and various projects requested by campuses and departments. The Print Shop is also in charge of the collection and delivery of the mail, both externally and internally. Planning and Construction supports the District by providing services to plan, construct, renovate, remodel, and maintain the physical facilities of the District. The Maintenance and Ground Maintenance departments provide the repair and upkeep of the District’s facilities, grounds, and equipment to ensure that a safe, functional environment is available for the education of all students. Custodial Services provides for the training, coordination, and supervision of the daily cleaning activities for all custodial personnel. Additional functions of the Custodial Services department include the coordination of the District’s biannual auction. The Transportation Department is charged with the safe transport of students to and from school as well as
82
the maintenance of the District’s buses. The Technology Department provides the acquisition, implementation, and utilization of all technologies that relate to instruction, instructional support, and administration. In addition, Technology plans, installs, and maintains the hardware, software, and communications infrastructure for the network systems upon which instructional and administrative applications are run. Technology provides systems and applications software services to the District for the Management Information Systems such as data processing support of central departments such as Payroll, Human Resources, Purchasing, Finance, and all campuses. The Director of Technology also oversees PEIMS (Public Education Information Management System) and Pupil Accounting as well as Library Services. The PEIMS department collects student, financial, and personnel data required for state reporting. Pupil Accounting provides oversight for student admissions and collects, maintains, and distributes student inactive and archival records.
Deputy Superintendent of Schools
Deputy Superintendent of Schools – Dr. Chris Hines
The Deputy Superintendent of Schools division consists of several departments including: the office of the Deputy Superintendent of Schools, the offices of the Assistant Superintendents for Elementary and Secondary Education, Athletics, Health Services, Curriculum & Instruction, Guidance and Counseling, Assessment and Evaluation, Special Education, Staff Development, Community Outreach, and Human Resources. The Deputy Superintendent of Schools oversees all areas of the department. The Assistant Superintendents for Elementary and Secondary Education oversee the campus principals and all departmental heads of curriculum. They ensure that all district, state, and federal guidelines are being met. In addition, the Assistant Superintendents make presentations to the Board of Trustees updating them on the educational status of the Districts’ students. The Athletics department provides a comprehensive program of competitive athletics for students in grades seven through twelve. The following sports are available for the students: boys – baseball, basketball, cross country, football, golf, power lifting, soccer, swimming, tennis, track, and wrestling; girls – basketball, cross country, golf, soccer, softball, swimming, tennis, track, and volleyball. The Athletics department schedules all events, arranges for the transportation of the students, and buys all equipment. Health Services oversees the nurses and nurses’ aides, and provides all necessary supplies to the campus clinics. The Curriculum department is comprised of departmental heads of each subject area, including Language Arts, Math, Science and Health, Social Studies, Career and Technology, Gifted and Talented, Fine Arts, Early Childhood, Parent Involvement, Bilingual and ESL, and Textbooks. These department heads are responsible for planning and implementing the District’s challenging comprehensive curriculum, which is aligned with the Texas Essential Knowledge and Skills and state and national assessments, to ensure that every student is prepared to pass the state assessment tests. They also provide administrative leadership and guidance functions of their respective departments. Many of the department heads are also responsible for applying, budgeting, implementing, and administering state and federal grant programs. Guidance and Counseling promotes and supports the academic success and personal well-being of all students. One of the responsibilities of the Assessment and Evaluation department is overseeing the mandatory assessments testing of the District’s students. The Special Education department is responsible for meeting the needs of all special needs children in the District. In addition, this department applies, budgets, implements, and administers state and federal special education grant programs. The Staff Development Department is responsible for coordinating CISD activities, Organizational Health program activities, graduate degree cohort programs with several universities, TxBESS first year teacher mentor program, and first year administrators mentor program. In addition, the Staff Development Department coordinates activities of numerous consultants; coordinates activities associated with the professional development library; coordinates activities associated with the National Board Certification Program; coordinates and publishes the CISD Staff Development Catalog; coordinates all activities held in the Professional Development Center; and coordinates the implementation of a wide variety of staff development programs for the District. The Human Resources department serves the District through multiple functions. Such services include the recruitment, interviewing, hiring, and processing activities to fill teacher and all job classification vacancies. In addition, the Human Resources department oversees
83

the maintaining of personnel records, certification, and employee benefits for all district employees as well as maintaining a computerized system to provide substitute employees.
Financial Services Chief Financial Officer – Darrin Rice
The Financial Services division is comprised of two departments: Finance and Central Warehouse. The Finance department is responsible for all cash and investing functions, accounting for special revenue and bond funds, accounting and financial reporting, payroll, accounts payable, purchasing, and fixed asset management. In addition, the Finance Department coordinates, develops, and controls the District’s annual budget based on district policies and TEA guidelines. The Central Warehouse is charged with the receiving and delivering of district purchases, as well as maintaining an inventory of supplies, which may be ordered by district campuses and departments.
Legal Services General Counsel – Carrie Galatas
The Legal department provides legal advice to the Board of Trustees and Administration, develops and monitors the implementation of Board Policy, and represents the District in litigation. The department also responds on behalf of the District to complaints and grievances filed with state and federal administrative agencies, complies with requests made pursuant to the Texas Public Information Act, and manages the District’s records retention and destruction policies. The department oversees interdistrict transfers, reviews all District contracts, monitors litigation assigned to outside counsel, provides training in related areas to employees, monitors complaints filed in accordance with Board Policy, presides over expulsion hearings, and conducts investigations of violations of Board Policy.
Security Chief of Police – William Harness
The Security division is comprised solely of the Conroe ISD Police Department. The Police Department is responsible for the safety of the students and staff of the District. The department is in charge of the hiring and training of officers, patrolling of campuses, monitoring of parking lots, as well as patrolling and monitoring athletic and extracurricular events. The Police Department is also instrumental in the District’s campaign for a “Drug-Free” environment, which includes the use of the District’s K-9 unit. Along with this includes the issuing of citations for tobacco use, truancy, and other district violations.
Campuses School Principals
The Conroe Independent School District consists of six senior high schools, three high school academies, seven junior high schools (grades 7 and 8), ten intermediate schools (grades 5 and 6), three elementary/intermediate schools (grades K – 6), thirty elementary schools (grades K – 4), one alternative high school, one disciplinary alternative school, and Juvenile Detention. The summer school program is also included in the campuses division. These campuses deliver instruction in regular program basic skills, bilingual and ESL programs, compensatory, remedial or tutorial programs, gifted and talented programs, special education programs, and vocational educational programs. In addition, students are offered the opportunity to participate in fine arts, athletics, and other extracurricular activities.
84

Conroe Independent School District
85

Superintendent Goals & Objectives
Dr. Curtis Null, Superintendent of Schools
GOAL 1:
Objectives:
GOAL 2:
Objectives:
GOAL 3:
Objectives:
GOAL 4:
Objectives:
GOAL 5:
Objectives:
GOAL 6:
Student Achievement and Post Secondary Success – CISD will maintain rigorous standards of achievement to prepare all students for graduation and post secondary success.
Master rigorous academic standards; close the achievement gap; and successful completion of high school.
Fiscal Responsibility – CISD will maintain efficient and effective fiscal management of resources and operations to maximize learning for all students.
Effective and efficient use of financial resources; successful implementation of capital projects; and effective and efficient operations.
Recruitment, Development, and Retention of Staff – CISD will employ, develop, and retain highly qualified staff to maximize learning for all students.
Recruitment of staff; staff development; and retention of staff.
Parents and Community – CISD will work jointly with parents and the community to maximize learning for all students through collaborative partnerships and unity of purpose.
Parent and family involvement and community and business partnerships.
Safe Schools – CISD will strive to ensure a safe and orderly environment conducive to learning for all students and staff.
Implement safe schools plan and provide resources and training for district safety and security.
Technology – CISD will provide technology infrastructure, tools, and solutions to meet the administrative requirements of the district and to maximize learning for all students.
Objectives: Maximize teaching and learning; enhance professional practices; support administration and operations; and infrastructure to support all functions.
GOAL 7: Communication – CISD will promote and enhance two-way communication among our staff and our community to maximize the success of all students.
Objectives: Effective internal communication and effective external communication.
86

Superintendent / Board2018-2019 General Fund Budget
Payroll cost: By position
Budgeted Staff Actual Amended Budget Projected Proposed Budget % of
2017-18 2018-19 2016-2017 2017-2018 2017-2018 2018-2019 Total
1.0 1.0 Administrators 436,464$ 450,605$ 543,776$ 467,384$ 32.36%
2.0 2.0 Professionals 184,709 197,844 197,145 188,851 13.07%
2.0 2.0 Paraprofessionals 84,654 85,369 91,725 94,260 6.53%
5.0 5.0 705,827 733,818 832,646 750,495 51.96%
Payroll related and benefits costs: 144,123 150,772 178,173 134,367 9.30%
Non-payroll cost: By functional area
41 General Administration 194,738 401,903 234,879 559,065 38.70%
51 Plant Maintenance & Operations 360 1,000 339 500 0.03%
195,098 402,903 235,218 559,565 38.74%
Total Annual Operating Budget 1,045,048$ 1,287,493$ 1,246,037$ 1,444,427$ 100.00%
Enrollment 59,764 61,360 61,580 63,014
Total Annual Operating Cost per Student 17.49$ 20.98$ 20.23$ 22.92$ 13.28%
87

Deputy Superintendent of Operations Goals & Objectives
Jim Kacur, Deputy Superintendent of Operations
Transportation
GOAL: To provide safe, reliable, efficient transportation for qualified students to and from school and school related activities.
Objective 1: Continue to maintain and/or improve transportation policies: walk-to-stop policy, maintenance procedures, accident procedures & new hire procedures.
Objective 2: Maintain transportation website with up-to-date information and add Shop link.
Objective 3: Continue to follow-up on selected items in Transportation’s review.
Objective 4: Continue to utilize the CISD phone messaging system for employee notifications.
Objective 5: Continue to research and implement new and existing technologies that will improve safety and day-to-day operations.
Objective 6: Meet the department’s allotted budget and continue to research ways to effectively reduce spending.
Objective 7: Continue to improve phone answering systems and procedures.
Objective 8: Seek out grants and new funding sources that are beneficial to CISD and Transportation. Objective 9: Maintain fleet projections for all District vehicles. Objective 10: Redevelop the Safe Bus Rider Program in order to educate students in Bus Safety. Objective 11: Conduct analysis and make recommendations for Administration as needed. Objective 12: Research and make recommendations on the purchase of new and used school buses. Objective 13: Continue to improve morale and hire new employees to fill vacancies.
Custodial
GOAL 1: Maintain a minimum of 22,480 sq. feet cleaned per custodian with reduced number of staff.
GOAL 2: Maintain modified “every other day” cleaning schedule for elementary and secondary campuses.
Maintenance
GOAL 1: To maintain all schools to their optimum potential for creating a safe learning environment.
GOAL 2: To maintain a safe working environment for all maintenance craft areas.
GOAL 3: The maintenance warehouse will provide superb parts and service at the best possible cost to the taxpayers of Conroe Independent School District.
Facilities Planning and Construction
GOAL 1: To provide solutions to everyday problems that arise in the district.
GOAL 2: To prioritize project schedules that allows cost effective measures to be utilized.
GOAL 3: To implement a task force that oversees quality, work force staff, and time completion of capital improvement projects.
88

Deputy Superintendent of Operations Division2018-2019 General Fund Budget
Payroll cost: By position
Budgeted Staff Actual Amended Budget Projected Proposed Budget % of
2017-18 2018-19 2016-2017 2017-2018 2017-2018 2018-2019 Total
1.5 1.5 Administrators 202,940$ 208,324$ 162,075$ 217,570$ 0.33%
46.4 47.4 Professionals 4,552,957 4,766,119 4,742,829 4,610,700 7.04%
57.1 58.1 Paraprofessionals 2,466,451 2,799,850 2,571,685 2,663,770 4.07%
6.0 6.0 Support Personnel 207,405 200,604 212,928 204,570 0.31%
965.5 1,015.5 Manual Trades 30,479,747 32,756,023 32,593,752 34,584,421 52.78%
1,076.5 1,128.5 37,909,500 40,730,920 40,283,269 42,281,031 64.53%
Payroll related and benefits costs: 9,022,838 9,540,732 9,861,188 9,500,838 14.50%
Non-payroll cost: By functional area
11 Instruction 188,316 456,091 352,380 244,900 0.37%
13 Curriculum & Instruction 7,811 8,629 8,116 7,000 0.01%
21 Instructional Leadership 13,244 13,550 13,615 13,550 0.02%
34 Student Transportation 4,032,951 5,811,911 5,352,072 3,948,787 6.03%
41 General Administration 191,025 210,489 203,607 253,992 0.39%
51 Plant Maintenance & Operations 7,080,660 7,960,507 7,942,233 6,693,170 10.21%
53 Data Processing 2,806,567 3,311,380 2,673,974 2,582,392 3.94%
81 Facilities Acq & Construction 499,288 241,069 236,529 - 0.00%
14,819,862 18,013,626 16,782,526 13,743,791 20.97%
Total Annual Operating Budget 61,752,200$ 68,285,278$ 66,926,983$ 65,525,660$ 100.00%
Enrollment 59,764 61,360 61,580 63,014
Total Annual Operating Cost per Student 1,033.27$ 1,112.86$ 1,086.83$ 1,039.86$ -4.32%
89

Deputy Superintendent of Schools Goals & Objectives
Dr. Chris Hines, Deputy Superintendent of Schools
GOAL 1:
Objectives:
GOAL 2:
Objectives:
GOAL 3:
Objectives:
GOAL 4:
Objectives:
GOAL 5:
Objectives:
GOAL 6:
Student Achievement and Post Secondary Success – CISD will maintain rigorous standards of achievement to prepare all students for graduation and post secondary success.
Master rigorous academic standards; close the achievement gap; and successful completion of high school.
Fiscal Responsibility – CISD will maintain efficient and effective fiscal management of resources and operations to maximize learning for all students.
Effective and efficient use of financial resources; successful implementation of capital projects; and effective and efficient operations.
Recruitment, Development, and Retention of Staff – CISD will employ, develop, and retain highly qualified staff to maximize learning for all students.
Recruitment of staff; staff development; and retention of staff.
Parents and Community – CISD will work jointly with parents and the community to maximize learning for all students through collaborative partnerships and unity of purpose.
Parent and family involvement and community and business partnerships.
Safe Schools – CISD will strive to ensure a safe and orderly environment conducive to learning for all students and staff.
Implement safe schools plan and provide resources and training for district safety and security.
Technology – CISD will provide technology infrastructure, tools, and solutions to meet the administrative requirements of the district and to maximize learning for all students.
Objectives: Maximize teaching and learning; enhance professional practices; support administration and operations; and infrastructure to support all functions.
GOAL 7: Communication – CISD will promote and enhance two-way communication among our staff and our community to maximize the success of all students.
Objectives: Effective internal communication and effective external communication.
90

Deputy Superintendent of Schools Division2018-2019 General Fund Budget
Payroll cost: By position
Budgeted Staff Actual Amended Budget Projected Proposed Budget % of
2017-18 2018-19 2016-2017 2017-2018 2017-2018 2018-2019 Total
52.0 52.5 Professionals 5,038,648$ 5,997,528$ 5,014,351$ 5,013,480$ 25.79%
40.5 40.5 Paraprofessionals 1,594,788 1,934,654 1,540,486 1,536,700 7.90%
15.5 15.5 Counselors 882,849 924,509 902,874 909,960 4.68%
19.0 19.0 Psych/OTPT Services - Professional 1,444,045 1,943,323 1,532,980 1,528,969 7.86%
3.0 3.0 Pysch/OTPT Services - Paraprofessional 214,901 224,804 235,870 242,946 1.25%
32.8 33.8 Special Ed - Professional 1,921,460 2,112,575 2,071,480 2,035,124 10.47%
41.0 43.0 Special Ed - Paraprofessionals 679,672 712,980 709,687 761,914 3.92%
2.0 2.0 Nurses 84,616 137,896 86,715 89,316 0.46%
54.8 54.8 Teachers 1,690,244 3,551,517 2,528,084 2,503,926 12.88%
260.6 264.1 13,551,223 17,539,786 14,622,527 14,622,335 75.21%
Payroll related and benefits costs: 1,893,101 2,049,686 2,158,909 1,915,879 9.85%
Non-payroll cost: By functional area
11 Instruction 637,389 1,111,974 667,134 613,538 3.16%
12 Instructional Resources 20,684 22 - - 0.00%
13 Curriculum & Instruction 190,302 353,182 138,147 21,000 0.11%
21 Instructional Leadership 691,719 872,845 698,844 855,751 4.40%
31 Guidance, Counseling & Eval. 359,188 570,785 251,023 421,487 2.17%
32 Social Work Services 7,192 15,009 10,650 5,900 0.03%
33 Health Services 140,218 412,624 191,786 79,350 0.41%
36 Co-curricular Activities 472,710 499,968 379,186 181,102 0.93%
41 General Administration 534,894 922,268 560,215 158,223 0.81%
51 Plant Maint. & Operations 808,323 699,256 600,467 550,015 2.83%
52 Security and Monitor Service - 18,974 18,974 - 0.00%
61 Community Service 8,660 17,600 7,873 17,600 0.09%
3,871,279 5,494,507 3,524,299 2,903,966 14.94%
Total Annual Operating Budget 19,315,603$ 25,083,979$ 20,305,735$ 19,442,180$ 100.00%
Enrollment 59,764 61,360 61,580 63,014
Total Annual Operating Cost per Student 323.20$ 408.80$ 329.75$ 308.54$ -6.43%
91

Financial Services Goals & Objectives
Darrin Rice, Chief Financial Officer
GOAL: Conroe ISD will maintain efficient and effective fiscal management of resources and operations to maximize learning for all students.
Objective 1: Effective and Efficient Use of Financial Resources
Maintain high academic results in a cost effective manner. Implement long-range revenue and budget plans. Maintain a fund balance of 16% to 24%. Provide essential positions needed to accommodate growth in student
population. Provide competitive compensation to attract and maintain quality personnel.
Objective 2: Successful Implementation of Capital Projects
Implement long-range master facilities plan. Continue to monitor student growth and adjust implementation timeline for
capital projects, as appropriate.
Objective 3: Effective and Efficient Operations
Continue to optimize campus allocations.
GOAL 2: Meet Performance Indicators for FIRST rating, Texas Smart Schools, ERG, and the District.
92

Financial Services Division2018-2019 General Fund Budget
Payroll cost: By position
Budgeted Staff Actual Amended Budget Projected Proposed Budget % of
2017-18 2018-19 2016-2017 2017-2018 2017-2018 2018-2019 Total
14.0 14.0 Professionals 1,116,656$ 1,278,085$ 1,141,433$ 1,249,370$ 13.00%
20.0 20.0 Paraprofessionals 788,572 888,060 839,128 885,980 9.22%
12.0 12.0 Support Personnel 356,077 373,459 365,215 386,270 4.02%
46.0 46.0 2,261,305 2,539,604 2,345,776 2,521,620 26.24%
Payroll related and benefits costs: 496,835 553,118 531,288 531,106 5.53%
Non-payroll cost: By functional area
41 General Administration 621,402 932,249 897,084 744,380 7.74%
51 Plant Maintenance & Operations 1,068,403 1,292,755 1,290,373 1,514,098 15.75%
99 Other Intergovernmental Charges 3,436,384 4,000,000 3,886,256 4,300,000 44.74%
5,126,189 6,225,004 6,073,713 6,558,478 68.24%
Total Annual Operating Budget 7,884,329$ 9,317,726$ 8,950,777$ 9,611,204$ 100.00%
Enrollment 59,764 61,360 61,580 63,014
Total Annual Operating Cost per Student 131.92$ 151.85$ 145.35$ 152.52$ 4.93%
93

Legal Services Goals & Objectives
Carrie Galatas, General Counsel
GOAL: To provide legal advice and training on legal matters affecting schools to District
staff members in order to comply with State and Federal laws and regulations thus reducing the District’s litigation exposure and in turn reducing costs associated with litigation.
94

Legal Services Division2018-2019 General Fund Budget
Payroll cost: By position
Budgeted Staff Actual Amended Budget Projected Proposed Budget % of
2017-18 2018-19 2016-2017 2017-2018 2017-2018 2018-2019 Total
1.0 1.0 Administrators 181,228$ 185,347$ 185,257$ 189,330$ 37.69%
1.0 1.0 Professionals 61,445 63,178 64,369 63,390 12.62%
1.0 1.0 Paraprofessionals 41,102 42,896 42,611 43,660 8.69%
3.0 3.0 283,775 291,421 292,237 296,380 59.00%
Payroll related and benefits costs: 46,766 49,272 50,974 51,027 10.16%
Non-payroll cost: By functional area
41 General Administration 294,147 171,571 159,123 154,940 30.84%
294,147 171,571 159,123 154,940 30.84%
Total Annual Operating Budget 624,688$ 512,264$ 502,334$ 502,347$ 100.00%
Enrollment 59,764 61,360 61,580 63,014
Total Annual Operating Cost per Student 10.45$ 8.35$ 8.16$ 7.97$ -2.27%
95

Security Goals & Objectives
William Harness, Chief of Police
GOAL: To protect the district’s students, employees, visitors, and properties. In tandem with the district’s management team, provide an orderly and safe learning environment where teachers may teach and students may have the opportunity to learn.
Objective 1: To establish and maintain effective and efficient police strategies through the deployment of its personnel and positive communication with students, parents, and campus administrators, district personnel and patrons.
Objective 2: To establish and maintain proactive measures that include prevention, intervention,
and safety strategies to students, parents, district personnel, and CISD patrons. Objective 3: To establish and maintain first responder readiness when managing crisis events
through monitoring campus safety plans, and providing site assessments, training, evaluating campus safety plans and crisis drills.
Objective 4: To establish and maintain communications with other law enforcement, emergency
medical and social agencies to enhance school and community safety while ensuring the most efficient use of district resources.
Objective 5: To establish and continue providing quality leadership and training to police
personnel that enhances officers’ skill level, whereas police personnel may be positive role models for students, as well as assist in attainment of the district’s mission of providing education while enhancing the professionalism of educational policing.
96

Security Division2018-2019 General Fund Budget
Payroll cost: By position
Budgeted Staff Actual Amended Budget Projected Proposed Budget % of
2017-18 2018-19 2016-2017 2017-2018 2017-2018 2018-2019 Total
1.0 1.0 Professionals 123,481$ 126,869$ 126,551$ 128,720$ 1.68%
1.0 1.0 Paraprofessionals 30,473 32,901 29,454 30,483 0.40%
88.0 106.0 Support Personnel 4,949,167 5,128,953 4,966,452 5,825,330 76.07%
90.0 108.0 5,103,121 5,288,723 5,122,457 5,984,533 78.15%
Payroll related and benefits costs: 919,844 1,005,077 998,340 968,618 12.65%
Non-payroll cost: By functional area
51 Plant Maintenance & Operations 72,245 87,000 82,635 88,536 1.16%
52 Security and Monitor Service 638,538 696,401 612,182 615,689 8.04%
710,783 783,401 694,817 704,225 9.20%
Total Annual Operating Budget 6,733,748$ 7,077,201$ 6,815,614$ 7,657,376$ 100.00%
Enrollment 59,764 61,360 61,580 63,014
Total Annual Operating Cost per Student 112.67$ 115.34$ 110.68$ 121.52$ 9.79%
97
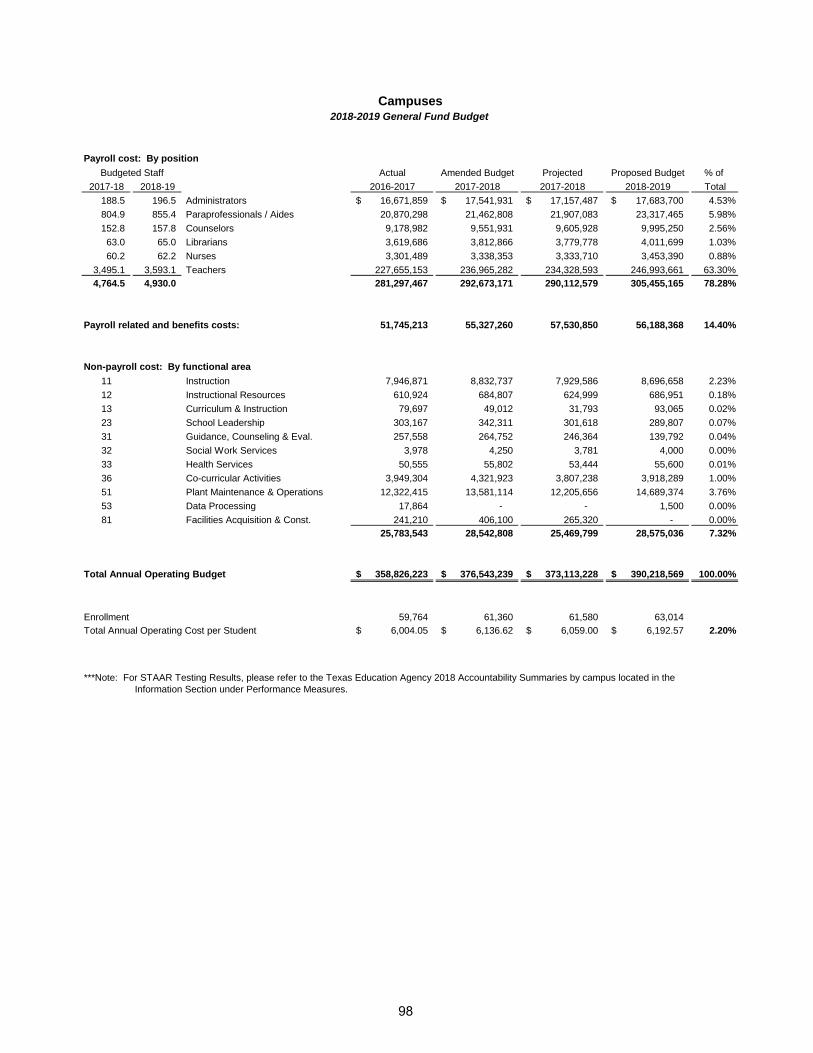
Campuses2018-2019 General Fund Budget
Payroll cost: By position
Budgeted Staff Actual Amended Budget Projected Proposed Budget % of
2017-18 2018-19 2016-2017 2017-2018 2017-2018 2018-2019 Total
188.5 196.5 Administrators 16,671,859$ 17,541,931$ 17,157,487$ 17,683,700$ 4.53%
804.9 855.4 Paraprofessionals / Aides 20,870,298 21,462,808 21,907,083 23,317,465 5.98%
152.8 157.8 Counselors 9,178,982 9,551,931 9,605,928 9,995,250 2.56%
63.0 65.0 Librarians 3,619,686 3,812,866 3,779,778 4,011,699 1.03%
60.2 62.2 Nurses 3,301,489 3,338,353 3,333,710 3,453,390 0.88%
3,495.1 3,593.1 Teachers 227,655,153 236,965,282 234,328,593 246,993,661 63.30%
4,764.5 4,930.0 281,297,467 292,673,171 290,112,579 305,455,165 78.28%
Payroll related and benefits costs: 51,745,213 55,327,260 57,530,850 56,188,368 14.40%
Non-payroll cost: By functional area
11 Instruction 7,946,871 8,832,737 7,929,586 8,696,658 2.23%
12 Instructional Resources 610,924 684,807 624,999 686,951 0.18%
13 Curriculum & Instruction 79,697 49,012 31,793 93,065 0.02%
23 School Leadership 303,167 342,311 301,618 289,807 0.07%
31 Guidance, Counseling & Eval. 257,558 264,752 246,364 139,792 0.04%
32 Social Work Services 3,978 4,250 3,781 4,000 0.00%
33 Health Services 50,555 55,802 53,444 55,600 0.01%
36 Co-curricular Activities 3,949,304 4,321,923 3,807,238 3,918,289 1.00%
51 Plant Maintenance & Operations 12,322,415 13,581,114 12,205,656 14,689,374 3.76%
53 Data Processing 17,864 - - 1,500 0.00%
81 Facilities Acquisition & Const. 241,210 406,100 265,320 - 0.00%
25,783,543 28,542,808 25,469,799 28,575,036 7.32%
Total Annual Operating Budget 358,826,223$ 376,543,239$ 373,113,228$ 390,218,569$ 100.00%
Enrollment 59,764 61,360 61,580 63,014
Total Annual Operating Cost per Student 6,004.05$ 6,136.62$ 6,059.00$ 6,192.57$ 2.20%
***Note: For STAAR Testing Results, please refer to the Texas Education Agency 2018 Accountability Summaries by campus located in the
Information Section under Performance Measures.
98

Elementary / Intermediate Schools2018-2019 General Fund Budget
Payroll cost: By position
Budgeted Staff Actual Amended Budget Projected Proposed Budget % of
2017-18 2018-19 2016-2017 2017-2018 2017-2018 2018-2019 Total
103.0 105.0 Administrators 8,715,953$ 9,024,325$ 9,032,582$ 9,237,880$ 4.50%
474.0 505.5 Paraprofessionals / Aides 11,412,874 11,789,049 12,182,246 12,918,380 6.30%
63.3 64.3 Counselors 3,656,214 3,681,478 3,840,798 4,001,460 1.95%
42.0 43.0 Librarians 2,497,258 2,667,540 2,608,396 2,748,063 1.34%
42.5 43.5 Nurses 2,352,903 2,412,091 2,413,870 2,511,820 1.22%
1,915.1 1,951.6 Teachers 123,686,500 128,041,813 127,859,455 132,757,596 64.73%
2,639.9 2,712.9 152,321,702 157,616,296 157,937,347 164,175,199 80.05%
Payroll related and benefits costs: 27,384,223 29,332,958 30,736,571 29,859,097 14.56%
Non-payroll cost: By functional area
11 Instruction 2,478,411 2,991,712 2,545,319 3,426,365 1.67%
12 Instructional Resources 293,538 355,653 326,678 333,199 0.16%
13 Curriculum & Instruction 32,748 16,690 10,061 1,740 0.00%
23 School Leadership 110,783 123,424 110,707 111,708 0.05%
31 Guidance, Counseling & Eval. 91,223 55,595 48,501 37,775 0.02%
33 Health Services 35,035 36,801 35,870 37,800 0.02%
36 Co-curricular Activities 10 2,411 2,371 1,308 0.00%
51 Plant Maintenance & Operations 5,998,751 6,990,279 6,159,306 7,097,514 3.46%
53 Data Processing 6,288 - - 1,500 0.00%
81 Facilities Acquisition & Const. 179,111 120,038 89,856 - 0.00%
9,225,898 10,692,603 9,328,669 11,048,909 5.39%
Total Annual Operating Budget 188,931,823$ 197,641,857$ 198,002,587$ 205,083,205$ 100.00%
Enrollment 33,261 33,705 34,140 34,894
Total Annual Operating Cost per Student 5,680.28$ 5,863.87$ 5,799.72$ 5,877.32$ 1.34%
99

Anderson Elementary Campus Goals & Objectives
Laura Quinones Acevedo, Principal
GOAL 1: Student Achievement and Post-Secondary Success Master rigorous academic standards – Student Achievement, Student Progress, and Closing
Performance Gaps
Student Achievement Objective
All subjects; all students 79% of all students combined over all subject areas approaching Grade Level Standards
Distinctions: Will meet AADD indicator for performance (Mastering Grade Level) in Reading/ELA, Writing, Math.
Student Progress Objective
Reading, Math; all students, 7 racial/ethnic groups, ELL, Sp Ed; weighted progress –
All Students/All Subjects 74% of students who will meet Expected or Accelerated Growth measures. 40% of students who will meet Accelerated Growth measures only.
Distinctions: 1. Will meet Top 25% Student Progress Distinction in Reading/ELA and Math.
2. Will meet AADD indicator for Accelerated Growth in Reading and Math.
Closing Performance Gaps
All subjects; Economically Disadvantaged Students and up to 7 racial/ethnic groups Economically Disadvantaged Students: 78% will score Approaching Grade Level Standards 54% will score Mastering Grade Level Standards
Racial/Ethnic group: Hispanic 72% will score Approaching Grade Level Standards 34% will score Mastering Grade Level Standards
Distinctions: Will meet Top 25% Closing Performance gaps Distinction in Reading/ELA and Math.
Post‐Secondary Readiness Increase Attendance Rate from 96.57% to 97.3%
GOAL 2: Recruitment, Development, and Retention of Staff
Objective: To recruit, retain, and develop highly qualified teachers and staff for all students.
GOAL 3: Parents and Community
Objective: To will work jointly with parents and the community to maximize learning for all students through two-way communication, collaborative partnerships, and unity of purpose.
GOAL 4: Safe Schools
Objective: To provide a safe and orderly school environment conducive to learning for all students and staff.
GOAL 5: Technology
Objective: To ensure that all students and staff utilize technology to maximize learning for all students and to enhance the educational practices of teachers.
100

Anderson Elementary School2018-2019 General Fund Budget
Payroll cost: By position
Budgeted Staff Actual Amended Budget Projected Proposed Budget % of
2017-18 2018-19 2016-2017 2017-2018 2017-2018 2018-2019 Total
2.0 2.0 Administrators 181,915$ 177,302$ 178,828$ 180,090$ 4.14%
13.0 13.0 Paraprofessionals / Aides 293,974 297,573 310,274 331,940 7.64%
1.0 1.0 Counselors 62,750 63,615 116,071 117,590 2.70%
1.0 1.0 Librarians 58,267 60,189 59,367 61,357 1.41%
1.0 1.0 Nurses 56,988 57,142 57,805 58,300 1.34%
37.3 36.3 Teachers 2,700,609 2,677,274 2,634,750 2,678,662 61.62%
55.3 54.3 3,354,503 3,333,095 3,357,095 3,427,939 78.85%
Payroll related and benefits costs: 649,087 662,930 687,835 650,146 14.96%
Non-payroll cost: By functional area
11 Instruction 62,459 68,597 67,309 84,116 1.93%
12 Instructional Resources 8,743 11,441 11,176 9,238 0.21%
13 Curriculum & Instruction 402 - - - 0.00%
23 School Leadership 3,571 3,552 3,340 1,819 0.04%
31 Guidance, Counseling & Eval. 1,746 823 818 675 0.02%
33 Health Services 827 600 599 600 0.01%
51 Plant Maintenance & Operations 125,507 187,264 137,907 172,700 3.97%
203,255 272,277 221,149 269,148 6.19%
Total Annual Operating Budget 4,206,845$ 4,268,302$ 4,266,079$ 4,347,233$ 100.00%
Enrollment 655 642 646 650
Total Annual Operating Cost per Student 6,422.66$ 6,648.45$ 6,603.84$ 6,688.05$ 1.28%
***Note: For STAAR Testing Results, please refer to the Texas Education Agency 2018 Accountability Summaries by campus located in the
Information Section under Performance Measures.
101

Austin Elementary Campus Goals & Objectives
Dr. Serena Pierson, Principal
GOAL 1: Student Achievement and Post-Secondary Success Master rigorous academic standards – Student Achievement, Student Progress, and Closing
Performance Gaps
Student Achievement Objective
All subjects; all students 70% of all students combined over all subject areas approaching Grade Level Standards; 40% Meeting Grade Level Standards; and 20% Mastering Grade Level Standards
Distinctions: Will meet AADD indicator for performance (Mastering Grade Level) in Reading/ELA, Writing, Math.
Student Progress Objective
Reading, Math; all students, 7 racial/ethnic groups, ELL, Sp Ed; weighted progress –
All Students/All Subjects 70% of students who will meet Expected or Accelerated Growth measures. 25% of students who will meet Accelerated Growth measures only.
Distinctions: 1. Will meet Top 25% Student Progress Distinction in Reading/ELA and Math.
2. Will meet AADD indicator for Accelerated Growth in Reading and Math.
Closing Performance Gaps
All subjects; Economically Disadvantaged Students and up to 7 racial/ethnic groups Economically Disadvantaged Students: 65% will score Approaching Grade Level Standards 25% will score Mastering Grade Level Standards
Distinctions: Will meet Top 25% Closing Performance gaps Distinction in Reading/ELA and Math.
Post‐Secondary Readiness Increase Attendance Rate from 96.1% to 96.6%
GOAL 2: Recruitment, Development, and Retention of Staff
Objective: To recruit, retain, and develop highly qualified teachers and staff for all students.
GOAL 3: Parents and Community
Objective: To will work jointly with parents and the community to maximize learning for all students through two-way communication, collaborative partnerships, and unity of purpose.
GOAL 4: Safe Schools
Objective: To provide a safe and orderly school environment conducive to learning for all students and staff.
GOAL 5: Technology
Objective: To ensure that all students and staff utilize technology to maximize learning for all students and to enhance the educational practices of teachers.
102

Austin Elementary School2018-2019 General Fund Budget
Payroll cost: By position
Budgeted Staff Actual Amended Budget Projected Proposed Budget % of
2017-18 2018-19 2016-2017 2017-2018 2017-2018 2018-2019 Total
3.0 3.0 Administrators 254,047$ 257,461$ 257,471$ 261,460$ 4.42%
14.0 18.0 Paraprofessionals / Aides 367,823 384,289 409,291 501,754 8.49%
1.0 1.0 Counselors 134,394 134,803 139,569 137,520 2.33%
1.0 1.0 Librarians 61,061 62,211 61,318 63,367 1.07%
1.0 1.0 Nurses 53,709 53,684 48,858 57,290 0.97%
60.9 55.9 Teachers 3,635,660 3,693,960 3,827,138 3,721,129 62.97%
80.9 79.9 4,506,694 4,586,408 4,743,645 4,742,520 80.26%
Payroll related and benefits costs: 847,450 886,741 947,341 862,416 14.59%
Non-payroll cost: By functional area
11 Instruction 71,733 77,064 73,500 121,606 2.06%
12 Instructional Resources 3,998 6,250 5,979 6,636 0.11%
13 Curriculum & Instruction 2,516 - - - 0.00%
23 School Leadership 5,771 6,000 6,161 6,091 0.10%
31 Guidance, Counseling & Eval. 2,462 2,794 2,766 1,675 0.03%
33 Health Services 749 1,350 1,349 600 0.01%
51 Plant Maintenance & Operations 136,782 146,859 142,717 167,562 2.84%
224,011 240,317 232,472 304,170 5.15%
Total Annual Operating Budget 5,578,155$ 5,713,466$ 5,923,458$ 5,909,106$ 100.00%
Enrollment 929 947 1,014 1,000
Total Annual Operating Cost per Student 6,004.47$ 6,033.23$ 5,841.67$ 5,909.11$ 1.15%
***Note: For STAAR Testing Results, please refer to the Texas Education Agency 2018 Accountability Summaries by campus located in the
Information Section under Performance Measures.
103
Runyan Elementary Campus Goals & Objectives
Tracy Voelker, Principal
GOAL 1: Student Achievement and Post-Secondary Success Master rigorous academic standards – Student Achievement, Student Progress, and Closing
Performance Gaps
Student Achievement Objective
All subjects; all students 80% of all students combined over all subject areas approaching Grade Level Standards
Distinctions: Will meet AADD indicator for performance (Mastering Grade Level) in Reading/ELA, Writing, Math.
Student Progress Objective
Reading, Math; all students, 7 racial/ethnic groups, ELL, Sp Ed; weighted progress –
All Students/All Subjects 75% of students who will meet Expected or Accelerated Growth measures. 35% of students who will meet Accelerated Growth measures only.
Distinctions: 1. Will meet Top 25% Student Progress Distinction in Reading/ELA and Math.
2. Will meet AADD indicator for Accelerated Growth in Reading and Math.
Closing Performance Gaps
All subjects; Economically Disadvantaged Students and up to 7 racial/ethnic groups Economically Disadvantaged Students: 80% will score Approaching Grade Level Standards 30% will score Mastering Grade Level Standards Racial/Ethnic Group: Hispanic: 80% will score Approaching Grade Level Standards 30% will score Mastering Grade Level Standards
Distinctions: Will meet Top 25% Closing Performance gaps Distinction in Reading/ELA and Math.
Post‐Secondary Readiness Increase Attendance Rate from 97% to 98%
GOAL 2: Recruitment, Development, and Retention of Staff
Objective: To recruit, retain, and develop highly qualified teachers and staff for all students.
GOAL 3: Parents and Community
Objective: To will work jointly with parents and the community to maximize learning for all students through two-way communication, collaborative partnerships, and unity of purpose.
GOAL 4: Safe Schools
Objective: To provide a safe and orderly school environment conducive to learning for all students and staff.
GOAL 5: Technology
Objective: To ensure that all students and staff utilize technology to maximize learning for all students and to enhance the educational practices of teachers.
104

Runyan Elementary School2018-2019 General Fund Budget
Payroll cost: By position
Budgeted Staff Actual Amended Budget Projected Proposed Budget % of
2017-18 2018-19 2016-2017 2017-2018 2017-2018 2018-2019 Total
2.0 2.0 Administrators 177,161$ 180,224$ 180,518$ 183,000$ 4.60%
12.0 11.0 Paraprofessionals / Aides 265,064 259,663 257,359 252,333 6.34%
1.5 1.5 Counselors 68,938 72,328 72,495 73,460 1.85%
1.0 1.0 Librarians 58,638 59,683 58,682 60,847 1.53%
1.5 1.5 Nurses 61,188 61,186 61,378 62,320 1.57%
42.1 39.1 Teachers 2,800,081 2,709,948 2,649,972 2,590,289 65.06%
60.1 56.1 3,431,070 3,343,032 3,280,404 3,222,249 80.94%
Payroll related and benefits costs: 593,098 600,659 622,449 557,812 14.01%
Non-payroll cost: By functional area
11 Instruction 63,763 53,032 50,312 72,444 1.82%
12 Instructional Resources 7,337 7,820 7,549 6,424 0.16%
13 Curriculum & Instruction 1,545 650 574 200 0.01%
23 School Leadership 3,207 2,800 2,575 2,784 0.07%
31 Guidance, Counseling & Eval. 2,161 1,356 1,181 1,525 0.04%
33 Health Services 1,453 1,600 1,598 1,600 0.04%
51 Plant Maintenance & Operations 104,779 121,948 98,452 116,190 2.92%
184,245 189,206 162,241 201,167 5.05%
Total Annual Operating Budget 4,208,413$ 4,132,897$ 4,065,094$ 3,981,228$ 100.00%
Enrollment 665 617 606 590
Total Annual Operating Cost per Student 6,328.44$ 6,698.37$ 6,708.08$ 6,747.84$ 0.59%
***Note: For STAAR Testing Results, please refer to the Texas Education Agency 2018 Accountability Summaries by campus located in the
Information Section under Performance Measures.
105

Sam Houston Elementary Campus Goals & Objectives
Viviana Harris, Principal
GOAL 1: Student Achievement and Post-Secondary Success Master rigorous academic standards – Student Achievement, Student Progress, and Closing
Performance Gaps
Student Achievement Objective
All subjects; all students 56% of all students combined over all subject areas approaching Grade Level Standards
Distinctions: Will meet AADD indicator for performance (Mastering Grade Level) in Reading/ELA, Writing, Math.
Student Progress Objective
Reading, Math; all students, 7 racial/ethnic groups, ELL, Sp Ed; weighted progress –
All Students/All Subjects 52% of students who will meet Expected or Accelerated Growth measures. 40% of students who will meet Accelerated Growth measures only.
Distinctions: 1. Will meet Top 25% Student Progress Distinction in Reading/ELA and Math.
2. Will meet AADD indicator for Accelerated Growth in Reading and Math.
Closing Performance Gaps
All subjects; Economically Disadvantaged Students and up to 7 racial/ethnic groups Economically Disadvantaged Students: 56% will score Approaching Grade Level Standards 17% will score Mastering Grade Level Standards Racial/Ethnic Group: African American: 40% will score Approaching Grade Level Standards 7% will score Mastering Grade Level Standards
Distinctions: Will meet Top 25% Closing Performance gaps Distinction in Reading/ELA and Math.
Post‐Secondary Readiness Increase Attendance Rate from 97.34% to 98%
GOAL 2: Recruitment, Development, and Retention of Staff
Objective: To recruit, retain, and develop highly qualified teachers and staff for all students.
GOAL 3: Parents and Community
Objective: To will work jointly with parents and the community to maximize learning for all students through two-way communication, collaborative partnerships, and unity of purpose.
GOAL 4: Safe Schools
Objective: To provide a safe and orderly school environment conducive to learning for all students and staff.
GOAL 5: Technology
Objective: To ensure that all students and staff utilize technology to maximize learning for all students and to enhance the educational practices of teachers.
106

Sam Houston Elementary School2018-2019 General Fund Budget
Payroll cost: By position
Budgeted Staff Actual Amended Budget Projected Proposed Budget % of
2017-18 2018-19 2016-2017 2017-2018 2017-2018 2018-2019 Total
3.0 3.0 Administrators 248,005$ 245,112$ 256,046$ 259,030$ 6.16%
12.2 11.2 Paraprofessionals / Aides 266,766 258,529 249,691 222,404 5.29%
1.5 1.5 Counselors 62,093 62,294 62,668 63,470 1.51%
1.0 1.0 Librarians 58,067 64,233 51,392 56,927 1.35%
1.0 1.0 Nurses 54,014 54,129 54,391 55,300 1.31%
35.9 32.4 Teachers 3,079,310 3,097,237 2,831,840 2,665,909 63.39%
54.6 50.1 3,768,255 3,781,534 3,506,028 3,323,040 79.01%
Payroll related and benefits costs: 720,249 729,926 754,218 652,399 15.51%
Non-payroll cost: By functional area
11 Instruction 71,687 111,369 109,385 106,022 2.52%
12 Instructional Resources 9,004 6,462 5,999 11,308 0.27%
13 Curriculum & Instruction 4,408 1,440 1,350 - 0.00%
23 School Leadership 1,459 1,906 2,024 1,508 0.04%
31 Guidance, Counseling & Eval. 2,310 1,160 1,160 675 0.02%
33 Health Services 593 600 600 600 0.01%
51 Plant Maintenance & Operations 97,553 115,104 91,063 110,178 2.62%
187,014 238,041 211,581 230,291 5.48%
Total Annual Operating Budget 4,675,518$ 4,749,501$ 4,471,827$ 4,205,730$ 100.00%
Enrollment 798 760 680 691
Total Annual Operating Cost per Student 5,859.05$ 6,249.34$ 6,576.22$ 6,086.44$ -7.45%
***Note: For STAAR Testing Results, please refer to the Texas Education Agency 2018 Accountability Summaries by campus located in the
Information Section under Performance Measures.
107

Ben Milam Elementary Campus Goals & Objectives
Gilberto Lozano, Principal
GOAL 1: Student Achievement and Post-Secondary Success Master rigorous academic standards – Student Achievement, Student Progress, and Closing
Performance Gaps
Student Achievement Objective
All subjects; all students 80% of all students combined over all subject areas approaching Grade Level Standards
Distinctions: Will meet AADD indicator for performance (Mastering Grade Level) in Reading/ELA, Writing, Math.
Student Progress Objective
Reading, Math; all students, 7 racial/ethnic groups, ELL, Sp Ed; weighted progress –
All Students/All Subjects 75% of students who will meet Expected or Accelerated Growth measures. 30% of students who will meet Accelerated Growth measures only.
Distinctions: 1. Will meet Top 25% Student Progress Distinction in Reading/ELA and Math.
2. Will meet AADD indicator for Accelerated Growth in Reading and Math.
Closing Performance Gaps
All subjects; Economically Disadvantaged Students and up to 7 racial/ethnic groups Economically Disadvantaged Students: 80% will score Approaching Grade Level Standards 50% will score Mastering Grade Level Standards Racial/Ethnic Group: White: 75% will score Approaching Grade Level Standards 30% will score Mastering Grade Level Standards
Distinctions: Will meet Top 25% Closing Performance gaps Distinction in Reading/ELA and Math.
Post‐Secondary Readiness Increase Attendance Rate from 97.2% to 97.8%
GOAL 2: Recruitment, Development, and Retention of Staff
Objective: To recruit, retain, and develop highly qualified teachers and staff for all students.
GOAL 3: Parents and Community
Objective: To will work jointly with parents and the community to maximize learning for all students through two-way communication, collaborative partnerships, and unity of purpose.
GOAL 4: Safe Schools
Objective: To provide a safe and orderly school environment conducive to learning for all students and staff.
GOAL 5: Technology
Objective: To ensure that all students and staff utilize technology to maximize learning for all students and to enhance the educational practices of teachers.
108
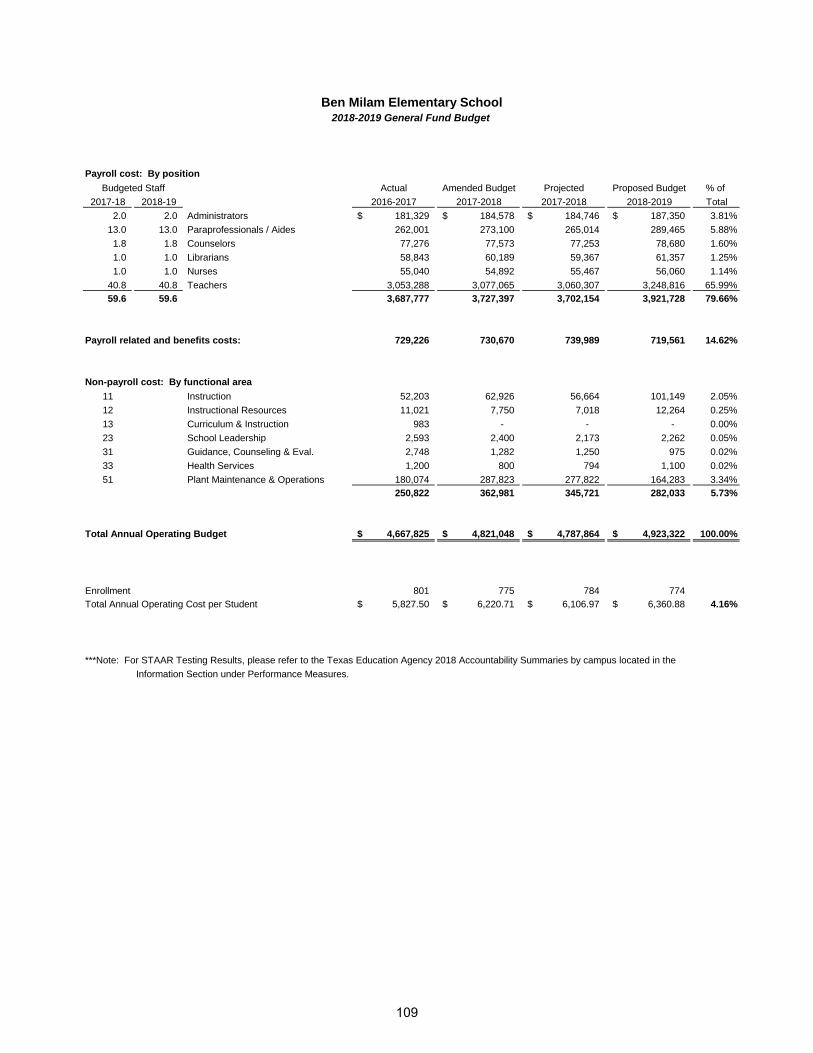
Ben Milam Elementary School2018-2019 General Fund Budget
Payroll cost: By position
Budgeted Staff Actual Amended Budget Projected Proposed Budget % of
2017-18 2018-19 2016-2017 2017-2018 2017-2018 2018-2019 Total
2.0 2.0 Administrators 181,329$ 184,578$ 184,746$ 187,350$ 3.81%
13.0 13.0 Paraprofessionals / Aides 262,001 273,100 265,014 289,465 5.88%
1.8 1.8 Counselors 77,276 77,573 77,253 78,680 1.60%
1.0 1.0 Librarians 58,843 60,189 59,367 61,357 1.25%
1.0 1.0 Nurses 55,040 54,892 55,467 56,060 1.14%
40.8 40.8 Teachers 3,053,288 3,077,065 3,060,307 3,248,816 65.99%
59.6 59.6 3,687,777 3,727,397 3,702,154 3,921,728 79.66%
Payroll related and benefits costs: 729,226 730,670 739,989 719,561 14.62%
Non-payroll cost: By functional area
11 Instruction 52,203 62,926 56,664 101,149 2.05%
12 Instructional Resources 11,021 7,750 7,018 12,264 0.25%
13 Curriculum & Instruction 983 - - - 0.00%
23 School Leadership 2,593 2,400 2,173 2,262 0.05%
31 Guidance, Counseling & Eval. 2,748 1,282 1,250 975 0.02%
33 Health Services 1,200 800 794 1,100 0.02%
51 Plant Maintenance & Operations 180,074 287,823 277,822 164,283 3.34%
250,822 362,981 345,721 282,033 5.73%
Total Annual Operating Budget 4,667,825$ 4,821,048$ 4,787,864$ 4,923,322$ 100.00%
Enrollment 801 775 784 774
Total Annual Operating Cost per Student 5,827.50$ 6,220.71$ 6,106.97$ 6,360.88$ 4.16%
***Note: For STAAR Testing Results, please refer to the Texas Education Agency 2018 Accountability Summaries by campus located in the
Information Section under Performance Measures.
109

Creighton Elementary Campus Goals & Objectives
Jennifer Watson, Principal
GOAL 1: Student Achievement and Post-Secondary Success Master rigorous academic standards – Student Achievement, Student Progress, and Closing
Performance Gaps
Student Achievement Objective
All subjects; all students 71% of all students combined over all subject areas approaching Grade Level Standards
Distinctions: Will meet AADD indicator for performance (Mastering Grade Level) in Reading/ELA, Writing, Math.
Student Progress Objective
Reading, Math; all students, 7 racial/ethnic groups, ELL, Sp Ed; weighted progress –
All Students/All Subjects 61% of students who will meet Expected or Accelerated Growth measures. 27% of students who will meet Accelerated Growth measures only.
Distinctions: 1. Will meet Top 25% Student Progress Distinction in Reading/ELA and Math.
2. Will meet AADD indicator for Accelerated Growth in Reading and Math.
Closing Performance Gaps
All subjects; Economically Disadvantaged Students and up to 7 racial/ethnic groups Economically Disadvantaged Students: 71% will score Approaching Grade Level Standards 21% will score Mastering Grade Level Standards Racial/Ethnic Group: Hispanic: 70% will score Approaching Grade Level Standards 22% will score Mastering Grade Level Standards
Distinctions: Will meet Top 25% Closing Performance gaps Distinction in Reading/ELA and Math.
Post‐Secondary Readiness Increase Attendance Rate from 95.9% to 96.6%
GOAL 2: Recruitment, Development, and Retention of Staff
Objective: To recruit, retain, and develop highly qualified teachers and staff for all students.
GOAL 3: Parents and Community
Objective: To will work jointly with parents and the community to maximize learning for all students through two-way communication, collaborative partnerships, and unity of purpose.
GOAL 4: Safe Schools
Objective: To provide a safe and orderly school environment conducive to learning for all students and staff.
GOAL 5: Technology
Objective: To ensure that all students and staff utilize technology to maximize learning for all students and to enhance the educational practices of teachers.
110

Creighton Elementary School2018-2019 General Fund Budget
Payroll cost: By position
Budgeted Staff Actual Amended Budget Projected Proposed Budget % of
2017-18 2018-19 2016-2017 2017-2018 2017-2018 2018-2019 Total
3.0 3.0 Administrators 261,981$ 266,418$ 266,368$ 270,380$ 5.35%
15.5 15.5 Paraprofessionals / Aides 312,133 327,796 338,116 353,940 7.01%
2.2 2.2 Counselors 65,396 68,979 65,455 65,990 1.31%
1.0 1.0 Librarians 59,165 60,189 60,828 62,357 1.23%
1.0 1.0 Nurses 58,943 59,669 60,060 60,810 1.20%
55.7 54.7 Teachers 3,280,549 3,287,616 3,235,676 3,237,530 64.09%
78.4 77.4 4,038,167 4,070,667 4,026,503 4,051,007 80.19%
Payroll related and benefits costs: 793,948 823,593 827,516 766,886 15.18%
Non-payroll cost: By functional area
11 Instruction 63,312 72,228 68,838 86,771 1.72%
12 Instructional Resources 12,206 26,314 26,050 12,054 0.24%
23 School Leadership 1,837 1,712 1,711 1,932 0.04%
31 Guidance, Counseling & Eval. 2,881 1,696 1,668 675 0.01%
33 Health Services 1,732 1,600 1,599 600 0.01%
51 Plant Maintenance & Operations 117,481 130,637 101,555 131,601 2.61%
199,449 234,187 201,421 233,633 4.62%
Total Annual Operating Budget 5,031,564$ 5,128,447$ 5,055,440$ 5,051,526$ 100.00%
Enrollment 889 878 876 854
Total Annual Operating Cost per Student 5,659.80$ 5,841.06$ 5,771.05$ 5,915.14$ 2.50%
***Note: For STAAR Testing Results, please refer to the Texas Education Agency 2018 Accountability Summaries by campus located in the
Information Section under Performance Measures.
111

Neil A. Armstrong Elementary Campus Goals & Objectives
Patricia Thacker, Principal
GOAL 1: Student Achievement and Post-Secondary Success Master rigorous academic standards – Student Achievement, Student Progress, and Closing
Performance Gaps
Student Achievement Objective
All subjects; all students 80% of all students combined over all subject areas approaching Grade Level Standards
Distinctions: Will meet AADD indicator for performance (Mastering Grade Level) in Reading/ELA, Writing, Math.
Student Progress Objective
Reading, Math; all students, 7 racial/ethnic groups, ELL, Sp Ed; weighted progress –
All Students/All Subjects 80% of students who will meet Expected or Accelerated Growth measures. 50% of students who will meet Accelerated Growth measures only.
Distinctions: 1. Will meet Top 25% Student Progress Distinction in Reading/ELA and Math.
2. Will meet AADD indicator for Accelerated Growth in Reading and Math.
Closing Performance Gaps
All subjects; Economically Disadvantaged Students and up to 7 racial/ethnic groups Economically Disadvantaged Students: 80% will score Approaching Grade Level Standards 40% will score Mastering Grade Level Standards
Distinctions: Will meet Top 25% Closing Performance gaps Distinction in Reading/ELA and Math.
Post‐Secondary Readiness Increase Attendance Rate from 97.4% to 98%
GOAL 2: Recruitment, Development, and Retention of Staff
Objective: To recruit, retain, and develop highly qualified teachers and staff for all students.
GOAL 3: Parents and Community
Objective: To will work jointly with parents and the community to maximize learning for all students through two-way communication, collaborative partnerships, and unity of purpose.
GOAL 4: Safe Schools
Objective: To provide a safe and orderly school environment conducive to learning for all students and staff.
GOAL 5: Technology
Objective: To ensure that all students and staff utilize technology to maximize learning for all students and to enhance the educational practices of teachers.
112

Neil A. Armstrong Elementary School2018-2019 General Fund Budget
Payroll cost: By position
Budgeted Staff Actual Amended Budget Projected Proposed Budget % of
2017-18 2018-19 2016-2017 2017-2018 2017-2018 2018-2019 Total
2.0 2.0 Administrators 164,035$ 166,067$ 167,613$ 168,900$ 3.71%
15.5 15.5 Paraprofessionals / Aides 332,792 334,327 306,031 290,083 6.38%
1.0 1.0 Counselors 66,373 68,477 68,723 69,620 1.53%
1.0 1.0 Librarians 63,351 64,233 61,528 63,367 1.39%
1.0 1.0 Nurses 55,375 55,726 56,218 56,890 1.25%
45.0 42.0 Teachers 2,827,811 3,163,315 3,050,836 2,961,412 65.13%
65.5 62.5 3,509,737 3,852,145 3,710,949 3,610,272 79.40%
Payroll related and benefits costs: 658,081 731,281 748,488 687,721 15.13%
Non-payroll cost: By functional area
11 Instruction 100,468 72,551 71,743 78,074 1.72%
12 Instructional Resources 3,249 5,250 5,000 5,840 0.13%
13 Curriculum & Instruction 2,313 2,000 1,982 500 0.01%
23 School Leadership 4,117 3,365 2,861 2,552 0.06%
31 Guidance, Counseling & Eval. 2,201 1,602 1,556 1,450 0.03%
33 Health Services 568 1,200 1,183 1,400 0.03%
51 Plant Maintenance & Operations 133,151 145,324 136,332 158,927 3.50%
246,067 231,292 220,657 248,743 5.47%
Total Annual Operating Budget 4,413,885$ 4,814,718$ 4,680,094$ 4,546,736$ 100.00%
Enrollment 726 785 700 708
Total Annual Operating Cost per Student 6,079.73$ 6,133.40$ 6,685.85$ 6,421.94$ -3.95%
***Note: For STAAR Testing Results, please refer to the Texas Education Agency 2018 Accountability Summaries by campus located in the
Information Section under Performance Measures.
113

Lamar Elementary Campus Goals & Objectives
Mary Jane Kirbo, Principal
GOAL 1: Student Achievement and Post-Secondary Success Master rigorous academic standards – Student Achievement, Student Progress, and Closing
Performance Gaps
Student Achievement Objective
All subjects; all students 90% of all students combined over all subject areas approaching Grade Level Standards
Distinctions: Will meet AADD indicator for performance (Mastering Grade Level) in Reading/ELA, Writing, Math.
Student Progress Objective
Reading, Math; all students, 7 racial/ethnic groups, ELL, Sp Ed; weighted progress –
All Students/All Subjects 80% of students who will meet Expected or Accelerated Growth measures. 50% of students who will meet Accelerated Growth measures only.
Distinctions: 1. Will meet Top 25% Student Progress Distinction in Reading/ELA and Math.
2. Will meet AADD indicator for Accelerated Growth in Reading and Math.
Closing Performance Gaps
All subjects; Economically Disadvantaged Students and up to 7 racial/ethnic groups Economically Disadvantaged Students: 80% will score Approaching Grade Level Standards 50% will score Mastering Grade Level Standards Racial/Ethnic Group: Hispanic: 90% will score Approaching Grade Level Standards 70% will score Mastering Grade Level Standards
Distinctions: Will meet Top 25% Closing Performance gaps Distinction in Reading/ELA and Math.
Post‐Secondary Readiness Increase Attendance Rate from 96.6% to 97.5%
GOAL 2: Recruitment, Development, and Retention of Staff
Objective: To recruit, retain, and develop highly qualified teachers and staff for all students.
GOAL 3: Parents and Community
Objective: To will work jointly with parents and the community to maximize learning for all students through two-way communication, collaborative partnerships, and unity of purpose.
GOAL 4: Safe Schools
Objective: To provide a safe and orderly school environment conducive to learning for all students and staff.
GOAL 5: Technology
Objective: To ensure that all students and staff utilize technology to maximize learning for all students and to enhance the educational practices of teachers.
114

Lamar Elementary School2018-2019 General Fund Budget
Payroll cost: By position
Budgeted Staff Actual Amended Budget Projected Proposed Budget % of
2017-18 2018-19 2016-2017 2017-2018 2017-2018 2018-2019 Total
2.0 2.0 Administrators 176,947$ 177,854$ 178,257$ 180,640$ 4.15%
10.5 10.5 Paraprofessionals / Aides 250,266 276,753 247,311 260,240 5.98%
2.0 2.0 Counselors 73,807 63,626 63,974 64,790 1.49%
1.0 1.0 Librarians 59,475 60,189 59,852 61,357 1.41%
1.0 1.0 Nurses 60,250 60,679 61,455 61,820 1.42%
44.7 45.7 Teachers 2,629,901 2,733,552 2,824,951 2,876,393 66.06%
61.2 62.2 3,250,646 3,372,653 3,435,800 3,505,240 80.50%
Payroll related and benefits costs: 583,314 625,656 661,272 639,007 14.67%
Non-payroll cost: By functional area
11 Instruction 34,150 52,672 46,622 66,940 1.54%
12 Instructional Resources 3,952 5,929 4,874 5,575 0.13%
13 Curriculum & Instruction 3,422 - - - 0.00%
23 School Leadership 3,745 1,872 1,782 1,566 0.04%
31 Guidance, Counseling & Eval. 2,393 1,134 1,107 675 0.02%
33 Health Services 600 601 601 600 0.01%
51 Plant Maintenance & Operations 107,834 144,396 116,895 134,881 3.10%
156,096 206,604 171,881 210,237 4.83%
Total Annual Operating Budget 3,990,056$ 4,204,913$ 4,268,953$ 4,354,484$ 100.00%
Enrollment 729 752 741 758
Total Annual Operating Cost per Student 5,473.33$ 5,591.64$ 5,761.07$ 5,744.70$ -0.28%
***Note: For STAAR Testing Results, please refer to the Texas Education Agency 2018 Accountability Summaries by campus located in the
Information Section under Performance Measures.
115

Oak Ridge Elementary Campus Goals & Objectives
Tami Eldridge, Principal
GOAL 1: Student Achievement and Post-Secondary Success Master rigorous academic standards – Student Achievement, Student Progress, and Closing
Performance Gaps
Student Achievement Objective
All subjects; all students 90% of all students combined over all subject areas approaching Grade Level Standards
Distinctions: Will meet AADD indicator for performance (Mastering Grade Level) in Reading/ELA, Writing, Math.
Student Progress Objective
Reading, Math; all students, 7 racial/ethnic groups, ELL, Sp Ed; weighted progress –
All Students/All Subjects 55% of students who will meet Expected or Accelerated Growth measures. 22% of students who will meet Accelerated Growth measures only.
Distinctions: 1. Will meet Top 25% Student Progress Distinction in Reading/ELA and Math.
2. Will meet AADD indicator for Accelerated Growth in Reading and Math.
Closing Performance Gaps
All subjects; Economically Disadvantaged Students and up to 7 racial/ethnic groups Economically Disadvantaged Students: 80% will score Approaching Grade Level Standards 30% will score Mastering Grade Level Standards Racial/Ethnic Group: Hispanic: 82% will score Approaching Grade Level Standards 32% will score Mastering Grade Level Standards
Distinctions: Will meet Top 25% Closing Performance gaps Distinction in Reading/ELA and Math.
Post‐Secondary Readiness Increase Attendance Rate from 96.5% to 97.3%
GOAL 2: Recruitment, Development, and Retention of Staff
Objective: To recruit, retain, and develop highly qualified teachers and staff for all students.
GOAL 3: Parents and Community
Objective: To will work jointly with parents and the community to maximize learning for all students through two-way communication, collaborative partnerships, and unity of purpose.
GOAL 4: Safe Schools
Objective: To provide a safe and orderly school environment conducive to learning for all students and staff.
GOAL 5: Technology
Objective: To ensure that all students and staff utilize technology to maximize learning for all students and to enhance the educational practices of teachers.
116

Oak Ridge Elementary School2018-2019 General Fund Budget
Payroll cost: By position
Budgeted Staff Actual Amended Budget Projected Proposed Budget % of
2017-18 2018-19 2016-2017 2017-2018 2017-2018 2018-2019 Total
2.0 2.0 Administrators 177,149$ 179,407$ 179,336$ 182,190$ 3.96%
12.4 12.9 Paraprofessionals / Aides 245,468 259,739 298,550 301,447 6.55%
1.5 1.5 Counselors 80,886 81,943 81,190 82,300 1.79%
1.0 1.0 Librarians 65,621 67,165 66,301 69,197 1.50%
1.0 1.0 Nurses 59,896 59,164 59,081 60,310 1.31%
41.1 42.1 Teachers 2,653,773 2,814,382 2,806,370 2,966,765 64.51%
59.0 60.5 3,282,793 3,461,800 3,490,828 3,662,209 79.63%
Payroll related and benefits costs: 593,646 650,625 694,555 682,219 14.83%
Non-payroll cost: By functional area
11 Instruction 78,854 68,274 50,582 72,233 1.57%
12 Instructional Resources 4,591 6,266 5,355 1,062 0.02%
23 School Leadership 1,979 4,363 3,815 3,944 0.09%
31 Guidance, Counseling & Eval. 2,448 954 775 675 0.01%
33 Health Services 599 600 600 600 0.01%
51 Plant Maintenance & Operations 175,142 168,079 151,576 175,979 3.83%
81 Facilities Acquisition & Const. - 15,035 - - 0.00%
263,613 263,571 212,703 254,493 5.53%
Total Annual Operating Budget 4,140,052$ 4,375,996$ 4,398,086$ 4,598,921$ 100.00%
Enrollment 724 743 751 766
Total Annual Operating Cost per Student 5,718.30$ 5,889.63$ 5,856.31$ 6,003.81$ 2.52%
***Note: For STAAR Testing Results, please refer to the Texas Education Agency 2018 Accountability Summaries by campus located in the
Information Section under Performance Measures.
117

Houser Elementary Campus Goals & Objectives
Angela Lozano, Principal
GOAL 1: Student Achievement and Post-Secondary Success Master rigorous academic standards – Student Achievement, Student Progress, and Closing
Performance Gaps
Student Achievement Objective
All subjects; all students 85% of all students combined over all subject areas approaching Grade Level Standards
Distinctions: Will meet AADD indicator for performance (Mastering Grade Level) in Reading/ELA, Writing, Math.
Student Progress Objective
Reading, Math; all students, 7 racial/ethnic groups, ELL, Sp Ed; weighted progress –
All Students/All Subjects 75% of students who will meet Expected or Accelerated Growth measures. 35% of students who will meet Accelerated Growth measures only.
Distinctions: 1. Will meet Top 25% Student Progress Distinction in Reading/ELA and Math.
2. Will meet AADD indicator for Accelerated Growth in Reading and Math.
Closing Performance Gaps
All subjects; Economically Disadvantaged Students and up to 7 racial/ethnic groups Economically Disadvantaged Students: 80% will score Approaching Grade Level Standards 40% will score Mastering Grade Level Standards Racial/Ethnic Group: African American: 65% will score Approaching Grade Level Standards (not scored – group too small) will score Mastering Grade Level Standards Racial/Ethnic Group: Hispanic: 85% will score Approaching Grade Level Standards 45% will score Mastering Grade Level Standards
Distinctions: Will meet Top 25% Closing Performance gaps Distinction in Reading/ELA and Math.
Post‐Secondary Readiness Increase Attendance Rate from 97.51% to 97.5%
GOAL 2: Recruitment, Development, and Retention of Staff
Objective: To recruit, retain, and develop highly qualified teachers and staff for all students.
GOAL 3: Parents and Community
Objective: To will work jointly with parents and the community to maximize learning for all students through two-way communication, collaborative partnerships, and unity of purpose.
GOAL 4: Safe Schools
Objective: To provide a safe and orderly school environment conducive to learning for all students and staff.
GOAL 5: Technology
Objective: To ensure that all students and staff utilize technology to maximize learning for all students and to enhance the educational practices of teachers.
118

Houser Elementary School2018-2019 General Fund Budget
Payroll cost: By position
Budgeted Staff Actual Amended Budget Projected Proposed Budget % of
2017-18 2018-19 2016-2017 2017-2018 2017-2018 2018-2019 Total
3.0 3.0 Administrators 248,346$ 251,492$ 257,854$ 254,550$ 5.35%
9.0 9.0 Paraprofessionals / Aides 293,484 260,687 307,024 270,005 5.67%
1.5 1.5 Counselors 61,790 64,029 64,598 65,430 1.37%
1.0 1.0 Librarians 55,675 56,731 56,181 57,917 1.22%
1.0 1.0 Nurses 55,127 55,120 55,737 56,280 1.18%
38.6 38.6 Teachers 3,072,799 3,034,203 3,034,040 3,140,134 65.95%
54.1 54.1 3,787,221 3,722,262 3,775,434 3,844,316 80.74%
Payroll related and benefits costs: 662,057 676,540 723,837 689,147 14.47%
Non-payroll cost: By functional area
11 Instruction 56,170 57,577 53,908 80,370 1.69%
12 Instructional Resources 5,105 5,650 5,381 3,716 0.08%
23 School Leadership 3,556 3,506 3,572 2,668 0.06%
31 Guidance, Counseling & Eval. 2,651 1,470 1,446 925 0.02%
33 Health Services 936 600 592 1,100 0.02%
51 Plant Maintenance & Operations 134,897 150,563 113,736 139,034 2.92%
203,315 219,366 178,635 227,813 4.78%
Total Annual Operating Budget 4,652,593$ 4,618,168$ 4,677,906$ 4,761,276$ 100.00%
Enrollment 789 746 824 838
Total Annual Operating Cost per Student 5,896.82$ 6,190.57$ 5,677.07$ 5,681.71$ 0.08%
***Note: For STAAR Testing Results, please refer to the Texas Education Agency 2018 Accountability Summaries by campus located in the
Information Section under Performance Measures.
119

Ford Elementary Campus Goals & Objectives
Paola Gorman, Principal
GOAL 1: Student Achievement and Post-Secondary Success Master rigorous academic standards – Student Achievement, Student Progress, and Closing
Performance Gaps
Student Achievement Objective
All subjects; all students 85% of all students combined over all subject areas approaching Grade Level Standards
Distinctions: Will meet AADD indicator for performance (Mastering Grade Level) in Reading/ELA, Writing, Math.
Student Progress Objective
Reading, Math; all students, 7 racial/ethnic groups, ELL, Sp Ed; weighted progress –
All Students/All Subjects 75% of students who will meet Expected or Accelerated Growth measures. 38% of students who will meet Accelerated Growth measures only.
Distinctions: 1. Will meet Top 25% Student Progress Distinction in Reading/ELA and Math.
2. Will meet AADD indicator for Accelerated Growth in Reading and Math.
Closing Performance Gaps
All subjects; Economically Disadvantaged Students and up to 7 racial/ethnic groups Economically Disadvantaged Students: 83% will score Approaching Grade Level Standards 30% will score Mastering Grade Level Standards Racial/Ethnic Group: Hispanic: 85% will score Approaching Grade Level Standards 35% will score Mastering Grade Level Standards Racial/Ethnic Group: African American: 70% will score Approaching Grade Level Standards 27% will score Mastering Grade Level Standards
Distinctions: Will meet Top 25% Closing Performance gaps Distinction in Reading/ELA and Math.
Post‐Secondary Readiness Increase Attendance Rate from 96% to 97%
GOAL 2: Recruitment, Development, and Retention of Staff
Objective: To recruit, retain, and develop highly qualified teachers and staff for all students.
GOAL 3: Parents and Community
Objective: To will work jointly with parents and the community to maximize learning for all students through two-way communication, collaborative partnerships, and unity of purpose.
GOAL 4: Safe Schools
Objective: To provide a safe and orderly school environment conducive to learning for all students and staff.
GOAL 5: Technology
Objective: To ensure that all students and staff utilize technology to maximize learning for all students and to enhance the educational practices of teachers.
120

Ford Elementary School2018-2019 General Fund Budget
Payroll cost: By position
Budgeted Staff Actual Amended Budget Projected Proposed Budget % of
2017-18 2018-19 2016-2017 2017-2018 2017-2018 2018-2019 Total
3.0 3.0 Administrators 249,906$ 239,240$ 244,425$ 245,660$ 5.16%
13.0 13.0 Paraprofessionals / Aides 330,774 329,953 314,482 288,644 6.06%
2.0 2.0 Counselors 67,036 68,477 68,723 69,620 1.46%
1.0 1.0 Librarians 66,016 67,165 67,116 69,197 1.45%
1.0 1.0 Nurses 53,157 53,280 53,835 54,450 1.14%
39.1 37.1 Teachers 3,412,432 3,304,994 3,179,587 3,064,602 64.38%
59.1 57.1 4,179,321 4,063,109 3,928,168 3,792,173 79.66%
Payroll related and benefits costs: 747,529 756,514 784,342 731,516 15.37%
Non-payroll cost: By functional area
11 Instruction 59,114 59,298 54,518 74,513 1.57%
12 Instructional Resources 2,981 1,250 999 4,513 0.09%
13 Curriculum & Instruction 596 2,000 - - 0.00%
23 School Leadership 3,968 7,050 6,847 6,613 0.14%
31 Guidance, Counseling & Eval. 2,458 2,140 1,361 675 0.01%
33 Health Services 583 600 598 600 0.01%
51 Plant Maintenance & Operations 142,609 151,377 142,359 149,746 3.15%
212,309 223,715 206,682 236,660 4.97%
Total Annual Operating Budget 5,139,159$ 5,043,338$ 4,919,192$ 4,760,349$ 100.00%
Enrollment 866 807 833 837
Total Annual Operating Cost per Student 5,934.36$ 6,249.49$ 5,905.39$ 5,687.39$ -3.69%
***Note: For STAAR Testing Results, please refer to the Texas Education Agency 2018 Accountability Summaries by campus located in the
Information Section under Performance Measures.
121

Hailey Elementary Campus Goals & Objectives
Tracy Horne, Principal
GOAL 1: Student Achievement and Post-Secondary Success Master rigorous academic standards – Student Achievement, Student Progress, and Closing
Performance Gaps
Student Achievement Objective
All subjects; all students 87% of all students combined over all subject areas approaching Grade Level Standards
Distinctions: Will meet AADD indicator for performance (Mastering Grade Level) in Reading/ELA, Writing, Math.
Student Progress Objective
Reading, Math; all students, 7 racial/ethnic groups, ELL, Sp Ed; weighted progress –
All Students/All Subjects 70% of students who will meet Expected or Accelerated Growth measures. 40% of students who will meet Accelerated Growth measures only.
Distinctions: 1. Will meet Top 25% Student Progress Distinction in Reading/ELA and Math.
2. Will meet AADD indicator for Accelerated Growth in Reading and Math.
Closing Performance Gaps
All subjects; Economically Disadvantaged Students and up to 7 racial/ethnic groups Economically Disadvantaged Students: 80% will score Approaching Grade Level Standards 50% will score Mastering Grade Level Standards Racial/Ethnic Group: African American: 85% will score Approaching Grade Level Standards 50% will score Mastering Grade Level Standards Racial/Ethnic Group: Hispanic: 90% will score Approaching Grade Level Standards 50% will score Mastering Grade Level Standards
Distinctions: Will meet Top 25% Closing Performance gaps Distinction in Reading/ELA and Math.
Post‐Secondary Readiness Increase Attendance Rate from 96.6% to 97.5%
GOAL 2: Recruitment, Development, and Retention of Staff
Objective: To recruit, retain, and develop highly qualified teachers and staff for all students.
GOAL 3: Parents and Community
Objective: To will work jointly with parents and the community to maximize learning for all students through two-way communication, collaborative partnerships, and unity of purpose.
GOAL 4: Safe Schools
Objective: To provide a safe and orderly school environment conducive to learning for all students and staff.
GOAL 5: Technology
Objective: To ensure that all students and staff utilize technology to maximize learning for all students and to enhance the educational practices of teachers.
122

Hailey Elementary School2018-2019 General Fund Budget
Payroll cost: By position
Budgeted Staff Actual Amended Budget Projected Proposed Budget % of
2017-18 2018-19 2016-2017 2017-2018 2017-2018 2018-2019 Total
2.0 2.0 Administrators 174,455$ 176,547$ 182,420$ 182,690$ 4.25%
9.2 9.7 Paraprofessionals / Aides 249,719 263,701 262,959 285,839 6.65%
1.0 1.0 Counselors 66,884 69,212 69,443 70,360 1.64%
1.0 1.0 Librarians 5,028 59,400 54,284 57,917 1.35%
1.0 1.0 Nurses 60,193 59,669 62,281 60,810 1.41%
41.2 45.2 Teachers 2,560,405 2,571,112 2,541,550 2,824,658 65.72%
55.4 59.9 3,116,684 3,199,641 3,172,937 3,482,274 81.03%
Payroll related and benefits costs: 532,314 570,740 584,666 615,232 14.32%
Non-payroll cost: By functional area
11 Instruction 26,614 83,908 78,582 51,653 1.20%
12 Instructional Resources 8,779 10,647 9,496 10,884 0.25%
23 School Leadership 1,283 1,433 1,348 3,132 0.07%
31 Guidance, Counseling & Eval. 2,625 1,069 881 1,075 0.03%
33 Health Services 582 600 600 1,200 0.03%
51 Plant Maintenance & Operations 106,447 167,379 104,892 132,257 3.08%
146,330 265,036 195,799 200,201 4.66%
Total Annual Operating Budget 3,795,328$ 4,035,417$ 3,953,402$ 4,297,707$ 100.00%
Enrollment 715 714 786 820
Total Annual Operating Cost per Student 5,308.15$ 5,651.84$ 5,029.77$ 5,241.11$ 4.20%
***Note: For STAAR Testing Results, please refer to the Texas Education Agency 2018 Accountability Summaries by campus located in the
Information Section under Performance Measures.
123

B. B. Rice Elementary Campus Goals & Objectives
Malinda Stewart, Principal
GOAL 1: Student Achievement and Post-Secondary Success Master rigorous academic standards – Student Achievement, Student Progress, and Closing
Performance Gaps
Student Achievement Objective
All subjects; all students 85% of all students combined over all subject areas approaching Grade Level Standards
Distinctions: Will meet AADD indicator for performance (Mastering Grade Level) in Reading/ELA, Writing, Math.
Student Progress Objective
Reading, Math; all students, 7 racial/ethnic groups, ELL, Sp Ed; weighted progress –
All Students/All Subjects 80% of students who will meet Expected or Accelerated Growth measures. 40% of students who will meet Accelerated Growth measures only.
Distinctions: 1. Will meet Top 25% Student Progress Distinction in Reading/ELA and Math.
2. Will meet AADD indicator for Accelerated Growth in Reading and Math.
Closing Performance Gaps
All subjects; Economically Disadvantaged Students and up to 7 racial/ethnic groups Economically Disadvantaged Students: 80% will score Approaching Grade Level Standards 40% will score Mastering Grade Level Standards Racial/Ethnic Group: Hispanic: 80% will score Approaching Grade Level Standards 40% will score Mastering Grade Level Standards
Distinctions: Will meet Top 25% Closing Performance gaps Distinction in Reading/ELA and Math.
Post‐Secondary Readiness Increase Attendance Rate from 96.9% to 97%
GOAL 2: Recruitment, Development, and Retention of Staff
Objective: To recruit, retain, and develop highly qualified teachers and staff for all students.
GOAL 3: Parents and Community
Objective: To will work jointly with parents and the community to maximize learning for all students through two-way communication, collaborative partnerships, and unity of purpose.
GOAL 4: Safe Schools
Objective: To provide a safe and orderly school environment conducive to learning for all students and staff.
GOAL 5: Technology
Objective: To ensure that all students and staff utilize technology to maximize learning for all students and to enhance the educational practices of teachers.
124

B. B. Rice Elementary School2018-2019 General Fund Budget
Payroll cost: By position
Budgeted Staff Actual Amended Budget Projected Proposed Budget % of
2017-18 2018-19 2016-2017 2017-2018 2017-2018 2018-2019 Total
2.0 2.0 Administrators 165,585$ 168,007$ 173,650$ 170,830$ 4.49%
4.5 4.5 Paraprofessionals / Aides 216,527 220,490 260,564 265,861 6.99%
1.0 1.0 Counselors 101,753 96,295 73,784 65,190 1.71%
1.0 1.0 Librarians 63,130 64,556 63,623 65,677 1.73%
1.0 1.0 Nurses 55,490 55,726 56,674 56,890 1.50%
34.7 31.7 Teachers 2,408,097 2,265,111 2,452,475 2,399,836 63.08%
44.2 41.2 3,010,582 2,870,185 3,080,770 3,024,284 79.50%
Payroll related and benefits costs: 565,977 545,700 624,186 570,769 15.00%
Non-payroll cost: By functional area
11 Instruction 50,136 50,981 46,270 73,732 1.94%
12 Instructional Resources 7,995 8,250 8,250 7,698 0.20%
13 Curriculum & Instruction 1,244 1,485 - - 0.00%
23 School Leadership 7,302 1,408 1,405 1,633 0.04%
31 Guidance, Counseling & Eval. 2,742 1,294 1,290 675 0.02%
33 Health Services 601 600 598 600 0.02%
51 Plant Maintenance & Operations 128,547 121,429 103,605 124,934 3.28%
198,567 185,447 161,418 209,272 5.50%
Total Annual Operating Budget 3,775,126$ 3,601,332$ 3,866,374$ 3,804,325$ 100.00%
Enrollment 581 568 595 604
Total Annual Operating Cost per Student 6,497.64$ 6,340.37$ 6,498.11$ 6,298.55$ -3.07%
***Note: For STAAR Testing Results, please refer to the Texas Education Agency 2018 Accountability Summaries by campus located in the
Information Section under Performance Measures.
125

San Jacinto Elementary Campus Goals & Objectives
Jamie Almond, Principal
GOAL 1: Student Achievement and Post-Secondary Success Master rigorous academic standards – Student Achievement, Student Progress, and Closing
Performance Gaps
Student Achievement Objective
All subjects; all students 72% of all students combined over all subject areas approaching Grade Level Standards
Distinctions: Will meet AADD indicator for performance (Mastering Grade Level) in Reading/ELA, Writing, Math.
Student Progress Objective
Reading, Math; all students, 7 racial/ethnic groups, ELL, Sp Ed; weighted progress –
All Students/All Subjects 52% of students who will meet Expected or Accelerated Growth measures. 23% of students who will meet Accelerated Growth measures only.
Distinctions: 1. Will meet Top 25% Student Progress Distinction in Reading/ELA and Math.
2. Will meet AADD indicator for Accelerated Growth in Reading and Math.
Closing Performance Gaps
All subjects; Economically Disadvantaged Students and up to 7 racial/ethnic groups Economically Disadvantaged Students: 68% will score Approaching Grade Level Standards 20% will score Mastering Grade Level Standards Racial/Ethnic Group: Hispanic: 65% will score Approaching Grade Level Standards 23% will score Mastering Grade Level Standards
Distinctions: Will meet Top 25% Closing Performance gaps Distinction in Reading/ELA and Math.
Post‐Secondary Readiness Increase Attendance Rate from 95.83% to 97%
GOAL 2: Recruitment, Development, and Retention of Staff
Objective: To recruit, retain, and develop highly qualified teachers and staff for all students.
GOAL 3: Parents and Community
Objective: To will work jointly with parents and the community to maximize learning for all students through two-way communication, collaborative partnerships, and unity of purpose.
GOAL 4: Safe Schools
Objective: To provide a safe and orderly school environment conducive to learning for all students and staff.
GOAL 5: Technology
Objective: To ensure that all students and staff utilize technology to maximize learning for all students and to enhance the educational practices of teachers.
126

San Jacinto Elementary School2018-2019 General Fund Budget
Payroll cost: By position
Budgeted Staff Actual Amended Budget Projected Proposed Budget % of
2017-18 2018-19 2016-2017 2017-2018 2017-2018 2018-2019 Total
2.0 2.0 Administrators 202,191$ 182,108$ 186,848$ 174,720$ 4.07%
13.5 14.5 Paraprofessionals / Aides 242,469 261,007 273,605 281,319 6.55%
1.0 1.0 Counselors 103,570 103,720 111,983 116,350 2.71%
1.0 1.0 Librarians 59,447 60,694 60,489 61,857 1.44%
1.0 1.0 Nurses 61,638 61,917 62,912 62,920 1.46%
42.4 41.4 Teachers 2,732,844 2,938,344 2,733,954 2,778,298 64.66%
60.9 60.9 3,402,159 3,607,790 3,429,791 3,475,464 80.89%
Payroll related and benefits costs: 559,447 615,589 629,990 590,933 13.75%
Non-payroll cost: By functional area
11 Instruction 52,882 68,650 47,673 95,914 2.23%
12 Instructional Resources 8,837 9,862 9,559 9,822 0.23%
13 Curriculum & Instruction 1,597 - - - 0.00%
23 School Leadership 7,377 6,516 6,369 3,480 0.08%
31 Guidance, Counseling & Eval. 1,967 804 425 675 0.02%
33 Health Services 521 600 591 600 0.01%
51 Plant Maintenance & Operations 98,791 112,842 98,852 119,687 2.79%
171,972 199,274 163,469 230,178 5.36%
Total Annual Operating Budget 4,133,578$ 4,422,653$ 4,223,250$ 4,296,575$ 100.00%
Enrollment 723 739 708 710
Total Annual Operating Cost per Student 5,717.26$ 5,984.65$ 5,965.04$ 6,051.51$ 1.45%
***Note: For STAAR Testing Results, please refer to the Texas Education Agency 2018 Accountability Summaries by campus located in the
Information Section under Performance Measures.
127

Glen Loch Elementary Campus Goals & Objectives
Cassie Hertzenberg, Principal
GOAL 1: Student Achievement and Post-Secondary Success Master rigorous academic standards – Student Achievement, Student Progress, and Closing
Performance Gaps
Student Achievement Objective
All subjects; all students 90% of all students combined over all subject areas approaching Grade Level Standards
Distinctions: Will meet AADD indicator for performance (Mastering Grade Level) in Reading/ELA, Writing, Math.
Student Progress Objective
Reading, Math; all students, 7 racial/ethnic groups, ELL, Sp Ed; weighted progress –
All Students/All Subjects 75% of students who will meet Expected or Accelerated Growth measures. 35% of students who will meet Accelerated Growth measures only.
Distinctions: 1. Will meet Top 25% Student Progress Distinction in Reading/ELA and Math.
2. Will meet AADD indicator for Accelerated Growth in Reading and Math.
Closing Performance Gaps
All subjects; Economically Disadvantaged Students and up to 7 racial/ethnic groups Economically Disadvantaged Students: 85% will score Approaching Grade Level Standards 35% will score Mastering Grade Level Standards Racial/Ethnic Group: Hispanic: 90% will score Approaching Grade Level Standards 40% will score Mastering Grade Level Standards
Distinctions: Will meet Top 25% Closing Performance gaps Distinction in Reading/ELA and Math.
Post‐Secondary Readiness Increase Attendance Rate from 96.1% to 97%
GOAL 2: Recruitment, Development, and Retention of Staff
Objective: To recruit, retain, and develop highly qualified teachers and staff for all students.
GOAL 3: Parents and Community
Objective: To will work jointly with parents and the community to maximize learning for all students through two-way communication, collaborative partnerships, and unity of purpose.
GOAL 4: Safe Schools
Objective: To provide a safe and orderly school environment conducive to learning for all students and staff.
GOAL 5: Technology
Objective: To ensure that all students and staff utilize technology to maximize learning for all students and to enhance the educational practices of teachers.
128

Glen Loch Elementary School2018-2019 General Fund Budget
Payroll cost: By position
Budgeted Staff Actual Amended Budget Projected Proposed Budget % of
2017-18 2018-19 2016-2017 2017-2018 2017-2018 2018-2019 Total
2.0 2.0 Administrators 185,271$ 187,571$ 185,734$ 188,660$ 4.76%
17.0 17.0 Paraprofessionals / Aides 234,622 252,040 241,664 241,409 6.09%
2.0 2.0 Counselors 63,791 64,848 63,962 64,780 1.64%
1.0 1.0 Librarians 46,698 60,694 59,498 61,857 1.56%
1.0 1.0 Nurses 54,193 54,129 54,819 55,300 1.40%
46.8 48.8 Teachers 2,473,124 2,530,358 2,377,176 2,570,360 64.88%
69.8 71.8 3,057,699 3,149,640 2,982,853 3,182,366 80.33%
Payroll related and benefits costs: 549,374 584,100 596,579 593,022 14.97%
Non-payroll cost: By functional area
11 Instruction 14,222 78,148 57,184 56,065 1.42%
12 Instructional Resources 5,729 9,766 8,054 9,822 0.25%
23 School Leadership 145 1,975 1,709 2,291 0.06%
31 Guidance, Counseling & Eval. 1,412 1,017 825 675 0.02%
33 Health Services 597 600 582 600 0.02%
51 Plant Maintenance & Operations 120,249 114,803 100,779 116,736 2.95%
81 Facilities Acquisition & Const. - 409 - - 0.00%
142,354 206,718 169,133 186,189 4.70%
Total Annual Operating Budget 3,749,427$ 3,940,458$ 3,748,565$ 3,961,577$ 100.00%
Enrollment 651 662 676 721
Total Annual Operating Cost per Student 5,759.49$ 5,952.35$ 5,545.21$ 5,494.56$ -0.91%
***Note: For STAAR Testing Results, please refer to the Texas Education Agency 2018 Accountability Summaries by campus located in the
Information Section under Performance Measures.
129

Sally K. Ride Elementary Campus Goals & Objectives
Megan Burnham, Principal
GOAL 1: Student Achievement and Post-Secondary Success Master rigorous academic standards – Student Achievement, Student Progress, and Closing
Performance Gaps
Student Achievement Objective
All subjects; all students 96% of all students combined over all subject areas approaching Grade Level Standards
Distinctions: Will meet AADD indicator for performance (Mastering Grade Level) in Reading/ELA, Writing, Math.
Student Progress Objective
Reading, Math; all students, 7 racial/ethnic groups, ELL, Sp Ed; weighted progress –
All Students/All Subjects 80% of students who will meet Expected or Accelerated Growth measures. 50% of students who will meet Accelerated Growth measures only.
Distinctions: 1. Will meet Top 25% Student Progress Distinction in Reading/ELA and Math.
2. Will meet AADD indicator for Accelerated Growth in Reading and Math.
Closing Performance Gaps
All subjects; Economically Disadvantaged Students and up to 7 racial/ethnic groups Economically Disadvantaged Students: 85% will score Approaching Grade Level Standards 50% will score Mastering Grade Level Standards Racial/Ethnic Group: Hispanic: 95% will score Approaching Grade Level Standards 50% will score Mastering Grade Level Standards Racial/Ethnic Group: White: 95% will score Approaching Grade Level Standards 60% will score Mastering Grade Level Standards
Distinctions: Will meet Top 25% Closing Performance gaps Distinction in Reading/ELA and Math.
Post‐Secondary Readiness Increase Attendance Rate from 97.4% to 98.5%
GOAL 2: Recruitment, Development, and Retention of Staff
Objective: To recruit, retain, and develop highly qualified teachers and staff for all students.
GOAL 3: Parents and Community
Objective: To will work jointly with parents and the community to maximize learning for all students through two-way communication, collaborative partnerships, and unity of purpose.
GOAL 4: Safe Schools
Objective: To provide a safe and orderly school environment conducive to learning for all students and staff.
GOAL 5: Technology
Objective: To ensure that all students and staff utilize technology to maximize learning for all students and to enhance the educational practices of teachers.
130

Sally K. Ride Elementary School2018-2019 General Fund Budget
Payroll cost: By position
Budgeted Staff Actual Amended Budget Projected Proposed Budget % of
2017-18 2018-19 2016-2017 2017-2018 2017-2018 2018-2019 Total
2.0 2.0 Administrators 177,918$ 180,803$ 180,891$ 183,580$ 4.40%
10.2 11.2 Paraprofessionals / Aides 222,462 228,565 241,653 274,079 6.57%
1.5 1.5 Counselors 67,444 67,679 69,214 68,830 1.65%
1.0 1.0 Librarians 63,189 64,233 66,335 65,377 1.57%
1.0 1.0 Nurses 63,150 62,803 64,128 63,930 1.53%
40.0 39.0 Teachers 2,487,088 2,633,676 2,677,399 2,727,360 65.37%
55.7 55.7 3,081,251 3,237,759 3,299,620 3,383,156 81.09%
Payroll related and benefits costs: 559,499 603,391 644,400 614,737 14.73%
Non-payroll cost: By functional area
11 Instruction 67,818 51,707 38,791 54,981 1.32%
12 Instructional Resources 7,713 8,413 8,118 8,888 0.21%
23 School Leadership 2,227 2,756 898 3,796 0.09%
31 Guidance, Counseling & Eval. 2,212 1,466 1,197 675 0.02%
33 Health Services 746 800 776 800 0.02%
51 Plant Maintenance & Operations 101,875 104,000 94,687 105,150 2.52%
53 Data Processing 5,408 - - - 0.00%
187,999 169,142 144,467 174,290 4.18%
Total Annual Operating Budget 3,828,749$ 4,010,292$ 4,088,487$ 4,172,183$ 100.00%
Enrollment 699 745 728 747
Total Annual Operating Cost per Student 5,477.47$ 5,382.94$ 5,616.05$ 5,585.25$ -0.55%
***Note: For STAAR Testing Results, please refer to the Texas Education Agency 2018 Accountability Summaries by campus located in the
Information Section under Performance Measures.
131

David Elementary Campus Goals & Objectives
Lee Allen, Principal
GOAL 1: Student Achievement and Post-Secondary Success Master rigorous academic standards – Student Achievement, Student Progress, and Closing
Performance Gaps
Student Achievement Objective
All subjects; all students 92% of all students combined over all subject areas approaching Grade Level Standards and 60% Mastering Grade Level Standards
Distinctions: Will meet AADD indicator for performance (Mastering Grade Level) in Reading/ELA, Writing, Math.
Student Progress Objective
Reading, Math; all students, 7 racial/ethnic groups, ELL, Sp Ed; weighted progress –
All Students/All Subjects 81% of students who will meet Expected or Accelerated Growth measures. 42% of students who will meet Accelerated Growth measures only.
Distinctions: 1. Will meet Top 25% Student Progress Distinction in Reading/ELA and Math.
2. Will meet AADD indicator for Accelerated Growth in Reading and Math.
Closing Performance Gaps
All subjects; Economically Disadvantaged Students and up to 7 racial/ethnic groups Economically Disadvantaged Students: 70% will score Approaching Grade Level Standards 35% will score Mastering Grade Level Standards Racial/Ethnic Group: Hispanic: 92% will score Approaching Grade Level Standards 63% will score Mastering Grade Level Standards
Distinctions: Will meet Top 25% Closing Performance gaps Distinction in Reading/ELA and Math.
Post‐Secondary Readiness Increase Attendance Rate from 97.1% to 97.2%
GOAL 2: Recruitment, Development, and Retention of Staff
Objective: To recruit, retain, and develop highly qualified teachers and staff for all students.
GOAL 3: Parents and Community
Objective: To will work jointly with parents and the community to maximize learning for all students through two-way communication, collaborative partnerships, and unity of purpose.
GOAL 4: Safe Schools
Objective: To provide a safe and orderly school environment conducive to learning for all students and staff.
GOAL 5: Technology
Objective: To ensure that all students and staff utilize technology to maximize learning for all students and to enhance the educational practices of teachers.
132

David Elementary School2018-2019 General Fund Budget
Payroll cost: By position
Budgeted Staff Actual Amended Budget Projected Proposed Budget % of
2017-18 2018-19 2016-2017 2017-2018 2017-2018 2018-2019 Total
2.0 2.0 Administrators 178,421$ 181,371$ 179,971$ 184,150$ 5.03%
12.0 12.0 Paraprofessionals / Aides 213,162 220,248 238,294 246,866 6.74%
1.0 1.0 Counselors 80,786 84,407 65,169 66,010 1.80%
1.0 1.0 Librarians 61,670 62,211 61,361 63,367 1.73%
1.0 1.0 Nurses 55,329 54,892 55,497 56,060 1.53%
35.9 33.9 Teachers 2,275,300 2,321,116 2,345,883 2,365,348 64.55%
52.9 50.9 2,864,668 2,924,245 2,946,175 2,981,801 81.38%
Payroll related and benefits costs: 481,444 509,857 518,184 488,132 13.32%
Non-payroll cost: By functional area
11 Instruction 29,954 62,953 15,420 59,563 1.63%
12 Instructional Resources 4,990 5,250 4,996 5,575 0.15%
13 Curriculum & Instruction - 680 - - 0.00%
23 School Leadership 1,223 1,418 1,284 1,550 0.04%
31 Guidance, Counseling & Eval. 2,747 1,609 1,569 675 0.02%
33 Health Services 597 600 598 600 0.02%
51 Plant Maintenance & Operations 93,946 110,222 102,041 126,355 3.45%
81 Facilities Acquisition & Const. 77,473 29 - - 0.00%
210,930 182,761 125,908 194,318 5.30%
Total Annual Operating Budget 3,557,042$ 3,616,863$ 3,590,267$ 3,664,251$ 100.00%
Enrollment 662 654 707 713
Total Annual Operating Cost per Student 5,373.18$ 5,530.37$ 5,078.17$ 5,139.20$ 1.20%
***Note: For STAAR Testing Results, please refer to the Texas Education Agency 2018 Accountability Summaries by campus located in the
Information Section under Performance Measures.
133

Giesinger Elementary Campus Goals & Objectives
Melissa Hammond, Principal
GOAL 1: Student Achievement and Post-Secondary Success Master rigorous academic standards – Student Achievement, Student Progress, and Closing
Performance Gaps
Student Achievement Objective
All subjects; all students 90% of all students combined over all subject areas approaching Grade Level Standards
Distinctions: Will meet AADD indicator for performance (Mastering Grade Level) in Reading/ELA, Writing, Math.
Student Progress Objective
Reading, Math; all students, 7 racial/ethnic groups, ELL, Sp Ed; weighted progress –
All Students/All Subjects 70% of students who will meet Expected or Accelerated Growth measures. 30% of students who will meet Accelerated Growth measures only.
Distinctions: 1. Will meet Top 25% Student Progress Distinction in Reading/ELA and Math.
2. Will meet AADD indicator for Accelerated Growth in Reading and Math.
Closing Performance Gaps
All subjects; Economically Disadvantaged Students and up to 7 racial/ethnic groups Economically Disadvantaged Students: 85% will score Approaching Grade Level Standards 25% will score Mastering Grade Level Standards Racial/Ethnic Group: Hispanic: 85% will score Approaching Grade Level Standards 45% will score Mastering Grade Level Standards
Distinctions: Will meet Top 25% Closing Performance gaps Distinction in Reading/ELA and Math.
Post‐Secondary Readiness Increase Attendance Rate from 96.28% to 98%
GOAL 2: Recruitment, Development, and Retention of Staff
Objective: To recruit, retain, and develop highly qualified teachers and staff for all students.
GOAL 3: Parents and Community
Objective: To will work jointly with parents and the community to maximize learning for all students through two-way communication, collaborative partnerships, and unity of purpose.
GOAL 4: Safe Schools
Objective: To provide a safe and orderly school environment conducive to learning for all students and staff.
GOAL 5: Technology
Objective: To ensure that all students and staff utilize technology to maximize learning for all students and to enhance the educational practices of teachers.
134

Giesinger Elementary School2018-2019 General Fund Budget
Payroll cost: By position
Budgeted Staff Actual Amended Budget Projected Proposed Budget % of
2017-18 2018-19 2016-2017 2017-2018 2017-2018 2018-2019 Total
2.0 2.0 Administrators 169,033$ 171,489$ 171,627$ 174,300$ 4.35%
9.0 9.0 Paraprofessionals / Aides 224,820 263,716 231,170 234,047 5.84%
1.0 1.0 Counselors 64,293 66,360 68,331 69,220 1.73%
1.0 1.0 Librarians 63,694 66,277 55,134 57,307 1.43%
1.0 1.0 Nurses 53,808 53,684 54,457 54,860 1.37%
36.7 40.2 Teachers 2,258,351 2,519,731 2,440,169 2,634,717 65.70%
50.7 54.2 2,833,999 3,141,257 3,020,888 3,224,451 80.40%
Payroll related and benefits costs: 545,726 609,913 601,325 592,607 14.78%
Non-payroll cost: By functional area
11 Instruction 69,227 84,693 68,651 54,867 1.37%
12 Instructional Resources 7,452 7,936 7,437 9,822 0.24%
13 Curriculum & Instruction 312 - - - 0.00%
23 School Leadership 3,482 5,672 5,593 928 0.02%
31 Guidance, Counseling & Eval. 1,801 1,684 1,668 675 0.02%
33 Health Services 608 600 590 600 0.01%
51 Plant Maintenance & Operations 123,294 124,484 107,275 126,573 3.16%
206,176 225,069 191,214 193,465 4.82%
Total Annual Operating Budget 3,585,901$ 3,976,239$ 3,813,427$ 4,010,523$ 100.00%
Enrollment 616 674 702 724
Total Annual Operating Cost per Student 5,821.27$ 5,899.46$ 5,432.23$ 5,539.40$ 1.97%
***Note: For STAAR Testing Results, please refer to the Texas Education Agency 2018 Accountability Summaries by campus located in the
Information Section under Performance Measures.
135

Galatas Elementary Campus Goals & Objectives
Denae Wilker, Principal
GOAL 1: Student Achievement and Post-Secondary Success Master rigorous academic standards – Student Achievement, Student Progress, and Closing
Performance Gaps
Student Achievement Objective
All subjects; all students 100% of all students combined over all subject areas approaching Grade Level Standards
Distinctions: Will meet AADD indicator for performance (Mastering Grade Level) in Reading/ELA, Writing, Math.
Student Progress Objective
Reading, Math; all students, 7 racial/ethnic groups, ELL, Sp Ed; weighted progress –
All Students/All Subjects 85% of students who will meet Expected or Accelerated Growth measures. 50% of students who will meet Accelerated Growth measures only.
Distinctions: 1. Will meet Top 25% Student Progress Distinction in Reading/ELA and Math.
2. Will meet AADD indicator for Accelerated Growth in Reading and Math.
Closing Performance Gaps
All subjects; Economically Disadvantaged Students and up to 7 racial/ethnic groups Economically Disadvantaged Students: 90% will score Approaching Grade Level Standards 40% will score Mastering Grade Level Standards Racial/Ethnic Group: Hispanic: 98% will score Approaching Grade Level Standards 70% will score Mastering Grade Level Standards Racial/Ethnic Group: Asian: 98% will score Approaching Grade Level Standards 70% will score Mastering Grade Level Standards
Distinctions: Will meet Top 25% Closing Performance gaps Distinction in Reading/ELA and Math.
Post‐Secondary Readiness Increase Attendance Rate from 97.2% to 97.5%
GOAL 2: Recruitment, Development, and Retention of Staff
Objective: To recruit, retain, and develop highly qualified teachers and staff for all students.
GOAL 3: Parents and Community
Objective: To will work jointly with parents and the community to maximize learning for all students through two-way communication, collaborative partnerships, and unity of purpose.
GOAL 4: Safe Schools
Objective: To provide a safe and orderly school environment conducive to learning for all students and staff.
GOAL 5: Technology
Objective: To ensure that all students and staff utilize technology to maximize learning for all students and to enhance the educational practices of teachers.
136

Galatas Elementary School2018-2019 General Fund Budget
Payroll cost: By position
Budgeted Staff Actual Amended Budget Projected Proposed Budget % of
2017-18 2018-19 2016-2017 2017-2018 2017-2018 2018-2019 Total
2.0 2.0 Administrators 175,550$ 177,059$ 177,981$ 179,850$ 4.89%
11.0 10.0 Paraprofessionals / Aides 245,184 244,943 256,256 245,825 6.68%
2.5 2.5 Counselors 68,236 68,477 68,723 69,620 1.89%
1.0 1.0 Librarians 61,048 62,211 61,633 63,367 1.72%
1.0 1.0 Nurses 60,438 60,680 61,645 61,820 1.68%
42.0 42.0 Teachers 2,400,391 2,343,989 2,272,392 2,378,696 64.68%
59.5 58.5 3,010,847 2,957,359 2,898,630 2,999,178 81.55%
Payroll related and benefits costs: 508,196 518,357 526,142 508,803 13.84%
Non-payroll cost: By functional area
11 Instruction 11,551 96,947 88,635 55,264 1.50%
12 Instructional Resources 5,975 13,020 10,432 7,167 0.19%
23 School Leadership 884 2,133 2,120 1,717 0.05%
31 Guidance, Counseling & Eval. 3,182 1,909 1,779 675 0.02%
33 Health Services 599 600 597 600 0.02%
51 Plant Maintenance & Operations 92,394 108,661 83,587 104,166 2.83%
114,585 223,270 187,150 169,589 4.61%
Total Annual Operating Budget 3,633,628$ 3,698,986$ 3,611,922$ 3,677,570$ 100.00%
Enrollment 672 630 639 636
Total Annual Operating Cost per Student 5,407.18$ 5,871.41$ 5,652.46$ 5,782.34$ 2.30%
***Note: For STAAR Testing Results, please refer to the Texas Education Agency 2018 Accountability Summaries by campus located in the
Information Section under Performance Measures.
137

Barbara Bush Elementary Campus Goals & Objectives
Judy Mills, Principal
GOAL 1: Student Achievement and Post-Secondary Success Master rigorous academic standards – Student Achievement, Student Progress, and Closing
Performance Gaps
Student Achievement Objective
All subjects; all students 100% of all students combined over all subject areas approaching Grade Level Standards
Distinctions: Will meet AADD indicator for performance (Mastering Grade Level) in Reading/ELA, Writing, Math.
Student Progress Objective
Reading, Math; all students, 7 racial/ethnic groups, ELL, Sp Ed; weighted progress –
All Students/All Subjects 80% of students who will meet Expected or Accelerated Growth measures. 45% of students who will meet Accelerated Growth measures only.
Distinctions: 1. Will meet Top 25% Student Progress Distinction in Reading/ELA and Math.
2. Will meet AADD indicator for Accelerated Growth in Reading and Math.
Closing Performance Gaps
All subjects; Economically Disadvantaged Students and up to 7 racial/ethnic groups Economically Disadvantaged Students: 90% will score Approaching Grade Level Standards 50% will score Mastering Grade Level Standards Racial/Ethnic Group: Hispanic: 95% will score Approaching Grade Level Standards 60% will score Mastering Grade Level Standards
Distinctions: Will meet Top 25% Closing Performance gaps Distinction in Reading/ELA and Math.
Post‐Secondary Readiness Increase Attendance Rate from 97% to 98%
GOAL 2: Recruitment, Development, and Retention of Staff
Objective: To recruit, retain, and develop highly qualified teachers and staff for all students.
GOAL 3: Parents and Community
Objective: To will work jointly with parents and the community to maximize learning for all students through two-way communication, collaborative partnerships, and unity of purpose.
GOAL 4: Safe Schools
Objective: To provide a safe and orderly school environment conducive to learning for all students and staff.
GOAL 5: Technology
Objective: To ensure that all students and staff utilize technology to maximize learning for all students and to enhance the educational practices of teachers.
138

Barbara Bush Elementary School2018-2019 General Fund Budget
Payroll cost: By position
Budgeted Staff Actual Amended Budget Projected Proposed Budget % of
2017-18 2018-19 2016-2017 2017-2018 2017-2018 2018-2019 Total
2.0 2.0 Administrators 178,843$ 181,748$ 182,334$ 184,520$ 4.43%
15.5 15.5 Paraprofessionals / Aides 287,329 216,556 237,456 235,369 5.65%
2.5 2.5 Counselors 68,465 69,212 74,114 66,640 1.60%
1.0 1.0 Librarians 60,060 61,705 60,733 62,857 1.51%
1.0 1.0 Nurses 55,907 55,423 56,395 56,590 1.36%
52.3 55.3 Teachers 2,550,837 2,707,037 2,735,389 2,777,876 66.73%
74.3 77.3 3,201,441 3,291,681 3,346,421 3,383,852 81.29%
Payroll related and benefits costs: 544,618 580,188 615,718 594,906 14.29%
Non-payroll cost: By functional area
11 Instruction 46,884 39,517 35,061 55,260 1.33%
12 Instructional Resources 9,022 8,852 8,292 10,411 0.25%
23 School Leadership 2,550 881 869 1,160 0.03%
31 Guidance, Counseling & Eval. 3,501 1,221 1,144 1,475 0.04%
33 Health Services 1,517 1,561 1,561 1,600 0.04%
51 Plant Maintenance & Operations 113,136 115,467 93,599 114,113 2.74%
81 Facilities Acquisition & Const. - 14 - - 0.00%
176,610 167,513 140,526 184,019 4.42%
Total Annual Operating Budget 3,922,669$ 4,039,382$ 4,102,665$ 4,162,777$ 100.00%
Enrollment 717 699 732 735
Total Annual Operating Cost per Student 5,470.95$ 5,778.80$ 5,604.73$ 5,663.64$ 1.05%
***Note: For STAAR Testing Results, please refer to the Texas Education Agency 2018 Accountability Summaries by campus located in the
Information Section under Performance Measures.
139

Colin L. Powell Elementary Campus Goals & Objectives
Lisa Garrison, Principal
GOAL 1: Student Achievement and Post-Secondary Success Master rigorous academic standards – Student Achievement, Student Progress, and Closing
Performance Gaps
Student Achievement Objective
All subjects; all students 90% of all students combined over all subject areas approaching Grade Level Standards
Distinctions: Will meet AADD indicator for performance (Mastering Grade Level) in Reading/ELA, Writing, Math.
Student Progress Objective
Reading, Math; all students, 7 racial/ethnic groups, ELL, Sp Ed; weighted progress –
All Students/All Subjects 80% of students who will meet Expected or Accelerated Growth measures. 50% of students who will meet Accelerated Growth measures only.
Distinctions: 1. Will meet Top 25% Student Progress Distinction in Reading/ELA and Math.
2. Will meet AADD indicator for Accelerated Growth in Reading and Math.
Closing Performance Gaps
All subjects; Economically Disadvantaged Students and up to 7 racial/ethnic groups Economically Disadvantaged Students: 85% will score Approaching Grade Level Standards 50% will score Mastering Grade Level Standards Racial/Ethnic Group: Hispanic: 90% will score Approaching Grade Level Standards 70% will score Mastering Grade Level Standards
Distinctions: Will meet Top 25% Closing Performance gaps Distinction in Reading/ELA and Math.
Post‐Secondary Readiness Increase Attendance Rate from 96.6% to 97.5%
GOAL 2: Recruitment, Development, and Retention of Staff
Objective: To recruit, retain, and develop highly qualified teachers and staff for all students.
GOAL 3: Parents and Community
Objective: To will work jointly with parents and the community to maximize learning for all students through two-way communication, collaborative partnerships, and unity of purpose.
GOAL 4: Safe Schools
Objective: To provide a safe and orderly school environment conducive to learning for all students and staff.
GOAL 5: Technology
Objective: To ensure that all students and staff utilize technology to maximize learning for all students and to enhance the educational practices of teachers.
140

Colin L. Powell Elementary School2018-2019 General Fund Budget
Payroll cost: By position
Budgeted Staff Actual Amended Budget Projected Proposed Budget % of
2017-18 2018-19 2016-2017 2017-2018 2017-2018 2018-2019 Total
2.0 3.0 Administrators 181,548$ 180,853$ 196,827$ 269,110$ 5.41%
13.5 13.5 Paraprofessionals / Aides 222,313 258,194 252,152 258,803 5.21%
1.5 1.5 Counselors 95,689 98,439 78,673 77,100 1.55%
1.0 1.0 Librarians 60,951 62,211 61,338 63,367 1.27%
1.0 1.0 Nurses 53,821 53,482 54,224 54,660 1.10%
42.2 44.2 Teachers 2,983,380 3,134,748 3,130,952 3,334,102 67.08%
61.2 64.2 3,597,702 3,787,927 3,774,166 4,057,142 81.62%
Payroll related and benefits costs: 634,968 693,626 722,135 723,213 14.55%
Non-payroll cost: By functional area
11 Instruction 48,904 74,299 64,431 76,663 1.54%
12 Instructional Resources 4,000 4,252 3,987 4,513 0.09%
23 School Leadership 2,173 4,758 4,103 2,900 0.06%
31 Guidance, Counseling & Eval. 2,885 1,373 957 675 0.01%
33 Health Services 580 1,200 599 1,200 0.02%
51 Plant Maintenance & Operations 100,503 129,922 85,612 104,166 2.10%
159,045 215,804 159,689 190,117 3.82%
Total Annual Operating Budget 4,391,715$ 4,697,357$ 4,655,990$ 4,970,472$ 100.00%
Enrollment 818 821 897 914
Total Annual Operating Cost per Student 5,368.84$ 5,721.51$ 5,190.62$ 5,438.15$ 4.77%
***Note: For STAAR Testing Results, please refer to the Texas Education Agency 2018 Accountability Summaries by campus located in the
Information Section under Performance Measures.
141

Buckalew Elementary Campus Goals & Objectives
Jill Price, Principal
GOAL 1: Student Achievement and Post-Secondary Success Master rigorous academic standards – Student Achievement, Student Progress, and Closing
Performance Gaps
Student Achievement Objective
All subjects; all students 100% of all students combined over all subject areas approaching Grade Level Standards
Distinctions: Will meet AADD indicator for performance (Mastering Grade Level) in Reading/ELA, Writing, Math.
Student Progress Objective
Reading, Math; all students, 7 racial/ethnic groups, ELL, Sp Ed; weighted progress –
All Students/All Subjects 82% of students who will meet Expected or Accelerated Growth measures. 50% of students who will meet Accelerated Growth measures only.
Distinctions: 1. Will meet Top 25% Student Progress Distinction in Reading/ELA and Math.
2. Will meet AADD indicator for Accelerated Growth in Reading and Math.
Closing Performance Gaps
All subjects; Economically Disadvantaged Students and up to 7 racial/ethnic groups Economically Disadvantaged Students: 78% will score Approaching Grade Level Standards 30% will score Mastering Grade Level Standards Racial/Ethnic Group: White: 95% will score Approaching Grade Level Standards 60% will score Mastering Grade Level Standards Racial/Ethnic Group: Hispanic: 94% will score Approaching Grade Level Standards 58% will score Mastering Grade Level Standards
Distinctions: Will meet Top 25% Closing Performance gaps Distinction in Reading/ELA and Math.
Post‐Secondary Readiness Increase Attendance Rate from 97.6% to 98%
GOAL 2: Recruitment, Development, and Retention of Staff
Objective: To recruit, retain, and develop highly qualified teachers and staff for all students.
GOAL 3: Parents and Community
Objective: To will work jointly with parents and the community to maximize learning for all students through two-way communication, collaborative partnerships, and unity of purpose.
GOAL 4: Safe Schools
Objective: To provide a safe and orderly school environment conducive to learning for all students and staff.
GOAL 5: Technology
Objective: To ensure that all students and staff utilize technology to maximize learning for all students and to enhance the educational practices of teachers.
142

Buckalew Elementary School2018-2019 General Fund Budget
Payroll cost: By position
Budgeted Staff Actual Amended Budget Projected Proposed Budget % of
2017-18 2018-19 2016-2017 2017-2018 2017-2018 2018-2019 Total
2.0 2.0 Administrators 175,563$ 176,220$ 177,416$ 179,010$ 4.29%
11.2 11.2 Paraprofessionals / Aides 223,099 228,385 268,544 271,428 6.51%
1.5 1.5 Counselors 113,291 114,255 114,450 127,710 3.06%
1.0 1.0 Librarians 62,068 62,211 55,539 57,307 1.37%
1.0 1.0 Nurses 62,822 62,803 64,733 63,930 1.53%
39.2 43.2 Teachers 2,333,164 2,323,332 2,358,410 2,657,778 63.75%
55.9 59.9 2,970,007 2,967,206 3,039,092 3,357,163 80.53%
Payroll related and benefits costs: 490,828 516,275 554,700 606,902 14.56%
Non-payroll cost: By functional area
11 Instruction 41,517 46,677 40,449 57,919 1.39%
12 Instructional Resources 4,469 4,763 4,750 4,338 0.10%
23 School Leadership 2,693 4,581 4,695 5,366 0.13%
31 Guidance, Counseling & Eval. 2,470 1,479 1,460 675 0.02%
33 Health Services 718 600 600 600 0.01%
51 Plant Maintenance & Operations 111,211 285,802 259,180 135,974 3.26%
163,078 343,902 311,134 204,872 4.91%
Total Annual Operating Budget 3,623,913$ 3,827,383$ 3,904,926$ 4,168,937$ 100.00%
Enrollment 645 619 632 622
Total Annual Operating Cost per Student 5,618.47$ 6,183.17$ 6,178.68$ 6,702.47$ 8.48%
***Note: For STAAR Testing Results, please refer to the Texas Education Agency 2018 Accountability Summaries by campus located in the
Information Section under Performance Measures.
143

O. A. Reaves Elementary Campus Goals & Objectives
Nicole Walker, Principal
GOAL 1: Student Achievement and Post-Secondary Success Master rigorous academic standards – Student Achievement, Student Progress, and Closing
Performance Gaps
Student Achievement Objective
All subjects; all students 85% of all students combined over all subject areas approaching Grade Level Standards
Distinctions: Will meet AADD indicator for performance (Mastering Grade Level) in Reading/ELA, Writing, Math.
Student Progress Objective
Reading, Math; all students, 7 racial/ethnic groups, ELL, Sp Ed; weighted progress –
All Students/All Subjects 75% of students who will meet Expected or Accelerated Growth measures. 45% of students who will meet Accelerated Growth measures only.
Distinctions: 1. Will meet Top 25% Student Progress Distinction in Reading/ELA and Math.
2. Will meet AADD indicator for Accelerated Growth in Reading and Math.
Closing Performance Gaps
All subjects; Economically Disadvantaged Students and up to 7 racial/ethnic groups Economically Disadvantaged Students: 85% will score Approaching Grade Level Standards 45% will score Mastering Grade Level Standards Racial/Ethnic Group: African American: 75% will score Approaching Grade Level Standards 25% will score Mastering Grade Level Standards Racial/Ethnic Group: Hispanic: 85% will score Approaching Grade Level Standards 40% will score Mastering Grade Level Standards
Distinctions: Will meet Top 25% Closing Performance gaps Distinction in Reading/ELA and Math.
Post‐Secondary Readiness Increase Attendance Rate from 96.8% to 98%
GOAL 2: Recruitment, Development, and Retention of Staff
Objective: To recruit, retain, and develop highly qualified teachers and staff for all students.
GOAL 3: Parents and Community
Objective: To will work jointly with parents and the community to maximize learning for all students through two-way communication, collaborative partnerships, and unity of purpose.
GOAL 4: Safe Schools
Objective: To provide a safe and orderly school environment conducive to learning for all students and staff.
GOAL 5: Technology
Objective: To ensure that all students and staff utilize technology to maximize learning for all students and to enhance the educational practices of teachers.
144

O.A. Reaves Elementary School2018-2019 General Fund Budget
Payroll cost: By position
Budgeted Staff Actual Amended Budget Projected Proposed Budget % of
2017-18 2018-19 2016-2017 2017-2018 2017-2018 2018-2019 Total
2.0 2.0 Administrators 161,746$ 176,547$ 179,437$ 180,300$ 4.22%
7.0 7.0 Paraprofessionals / Aides 213,326 213,394 272,965 280,715 6.57%
1.0 1.0 Counselors 96,093 99,009 119,485 122,010 2.86%
1.0 1.0 Librarians 69,527 70,510 61,798 63,367 1.48%
1.0 1.0 Nurses 59,281 59,164 59,847 60,310 1.41%
34.2 35.7 Teachers 2,612,677 2,589,013 2,569,209 2,667,912 62.43%
46.2 47.7 3,212,650 3,207,637 3,262,741 3,374,614 78.97%
Payroll related and benefits costs: 611,845 631,764 673,449 647,721 15.16%
Non-payroll cost: By functional area
11 Instruction 53,598 60,391 51,978 84,716 1.98%
12 Instructional Resources 5,985 6,250 5,999 6,636 0.16%
13 Curriculum & Instruction 1,213 420 420 - 0.00%
23 School Leadership 2,689 1,300 1,252 1,276 0.03%
31 Guidance, Counseling & Eval. 2,118 912 912 675 0.02%
33 Health Services 592 1,200 1,187 1,200 0.03%
51 Plant Maintenance & Operations 144,429 152,114 130,022 156,523 3.66%
210,624 222,587 191,770 251,026 5.87%
Total Annual Operating Budget 4,035,119$ 4,061,988$ 4,127,960$ 4,273,361$ 100.00%
Enrollment 692 681 708 718
Total Annual Operating Cost per Student 5,831.10$ 5,964.74$ 5,830.45$ 5,951.76$ 2.08%
***Note: For STAAR Testing Results, please refer to the Texas Education Agency 2018 Accountability Summaries by campus located in the
Information Section under Performance Measures.
145

George C. Kaufman III Elementary Campus Goals & Objectives
Tina Oliver, Principal
GOAL 1: Student Achievement and Post-Secondary Success Master rigorous academic standards – Student Achievement, Student Progress, and Closing
Performance Gaps
Student Achievement Objective
All subjects; all students 95% of all students combined over all subject areas approaching Grade Level Standards
Distinctions: Will meet AADD indicator for performance (Mastering Grade Level) in Reading/ELA, Writing, Math.
Student Progress Objective
Reading, Math; all students, 7 racial/ethnic groups, ELL, Sp Ed; weighted progress –
All Students/All Subjects 85% of students who will meet Expected or Accelerated Growth measures. 45% of students who will meet Accelerated Growth measures only.
Distinctions: 1. Will meet Top 25% Student Progress Distinction in Reading/ELA and Math.
2. Will meet AADD indicator for Accelerated Growth in Reading and Math.
Closing Performance Gaps
All subjects; Economically Disadvantaged Students and up to 7 racial/ethnic groups Economically Disadvantaged Students: 90% will score Approaching Grade Level Standards 40% will score Mastering Grade Level Standards Racial/Ethnic Group: Hispanic: 93% will score Approaching Grade Level Standards 50% will score Mastering Grade Level Standards
Distinctions: Will meet Top 25% Closing Performance gaps Distinction in Reading/ELA and Math.
Post‐Secondary Readiness Increase Attendance Rate from 97.2% to 97.3%
GOAL 2: Recruitment, Development, and Retention of Staff
Objective: To recruit, retain, and develop highly qualified teachers and staff for all students.
GOAL 3: Parents and Community
Objective: To will work jointly with parents and the community to maximize learning for all students through two-way communication, collaborative partnerships, and unity of purpose.
GOAL 4: Safe Schools
Objective: To provide a safe and orderly school environment conducive to learning for all students and staff.
GOAL 5: Technology
Objective: To ensure that all students and staff utilize technology to maximize learning for all students and to enhance the educational practices of teachers.
146
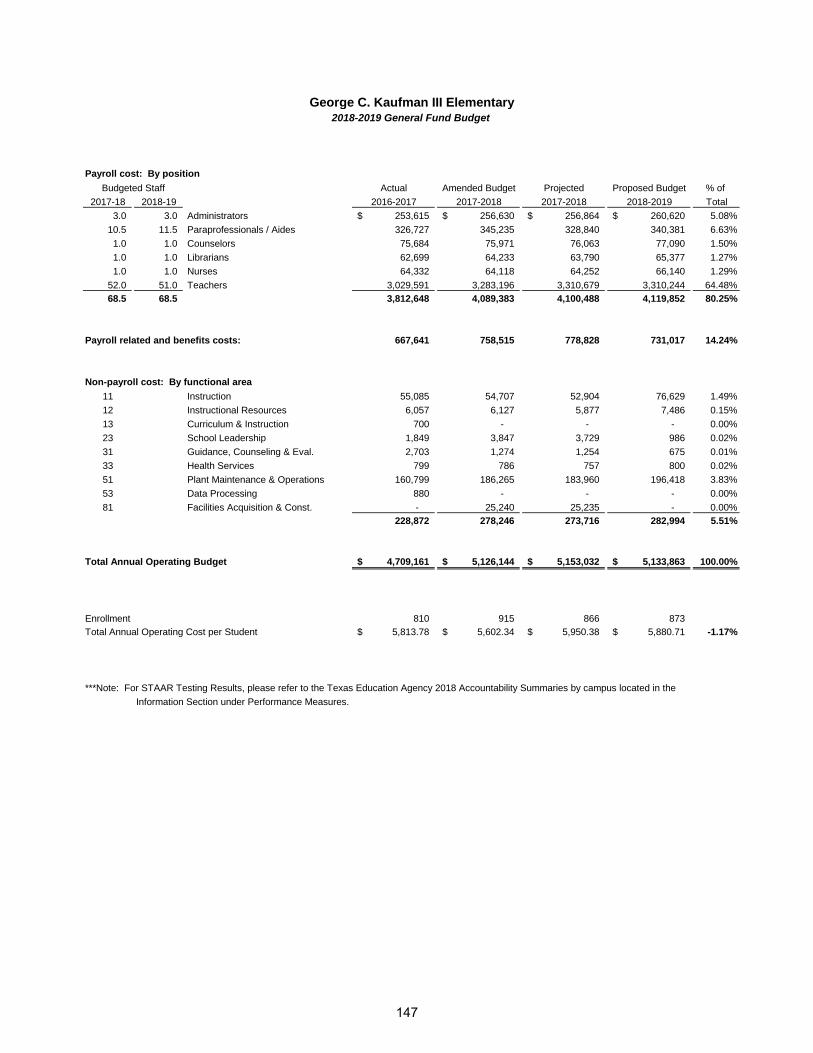
George C. Kaufman III Elementary2018-2019 General Fund Budget
Payroll cost: By position
Budgeted Staff Actual Amended Budget Projected Proposed Budget % of
2017-18 2018-19 2016-2017 2017-2018 2017-2018 2018-2019 Total
3.0 3.0 Administrators 253,615$ 256,630$ 256,864$ 260,620$ 5.08%
10.5 11.5 Paraprofessionals / Aides 326,727 345,235 328,840 340,381 6.63%
1.0 1.0 Counselors 75,684 75,971 76,063 77,090 1.50%
1.0 1.0 Librarians 62,699 64,233 63,790 65,377 1.27%
1.0 1.0 Nurses 64,332 64,118 64,252 66,140 1.29%
52.0 51.0 Teachers 3,029,591 3,283,196 3,310,679 3,310,244 64.48%
68.5 68.5 3,812,648 4,089,383 4,100,488 4,119,852 80.25%
Payroll related and benefits costs: 667,641 758,515 778,828 731,017 14.24%
Non-payroll cost: By functional area
11 Instruction 55,085 54,707 52,904 76,629 1.49%
12 Instructional Resources 6,057 6,127 5,877 7,486 0.15%
13 Curriculum & Instruction 700 - - - 0.00%
23 School Leadership 1,849 3,847 3,729 986 0.02%
31 Guidance, Counseling & Eval. 2,703 1,274 1,254 675 0.01%
33 Health Services 799 786 757 800 0.02%
51 Plant Maintenance & Operations 160,799 186,265 183,960 196,418 3.83%
53 Data Processing 880 - - - 0.00%
81 Facilities Acquisition & Const. - 25,240 25,235 - 0.00%
228,872 278,246 273,716 282,994 5.51%
Total Annual Operating Budget 4,709,161$ 5,126,144$ 5,153,032$ 5,133,863$ 100.00%
Enrollment 810 915 866 873
Total Annual Operating Cost per Student 5,813.78$ 5,602.34$ 5,950.38$ 5,880.71$ -1.17%
***Note: For STAAR Testing Results, please refer to the Texas Education Agency 2018 Accountability Summaries by campus located in the
Information Section under Performance Measures.
147

Bonnie Wilkinson Elementary Campus Goals & Objectives
Victor Uher, Principal
GOAL 1: Student Achievement and Post-Secondary Success Master rigorous academic standards – Student Achievement, Student Progress, and Closing
Performance Gaps
Student Achievement Objective
All subjects; all students 90% of all students combined over all subject areas approaching Grade Level Standards
Distinctions: Will meet AADD indicator for performance (Mastering Grade Level) in Reading/ELA, Writing, Math.
Student Progress Objective
Reading, Math; all students, 7 racial/ethnic groups, ELL, Sp Ed; weighted progress –
All Students/All Subjects 63% of students who will meet Expected or Accelerated Growth measures. 32% of students who will meet Accelerated Growth measures only.
Distinctions: 1. Will meet Top 25% Student Progress Distinction in Reading/ELA and Math.
2. Will meet AADD indicator for Accelerated Growth in Reading and Math.
Closing Performance Gaps
All subjects; Economically Disadvantaged Students and up to 7 racial/ethnic groups Economically Disadvantaged Students: 80% will score Approaching Grade Level Standards 30% will score Mastering Grade Level Standards Racial/Ethnic Group: Hispanic: 90% will score Approaching Grade Level Standards 35% will score Mastering Grade Level Standards
Distinctions: Will meet Top 25% Closing Performance gaps Distinction in Reading/ELA and Math.
Post‐Secondary Readiness Increase Attendance Rate from 96% to 97%
GOAL 2: Recruitment, Development, and Retention of Staff
Objective: To recruit, retain, and develop highly qualified teachers and staff for all students.
GOAL 3: Parents and Community
Objective: To will work jointly with parents and the community to maximize learning for all students through two-way communication, collaborative partnerships, and unity of purpose.
GOAL 4: Safe Schools
Objective: To provide a safe and orderly school environment conducive to learning for all students and staff.
GOAL 5: Technology
Objective: To ensure that all students and staff utilize technology to maximize learning for all students and to enhance the educational practices of teachers.
148

Bonnie Wilkinson Elementary School2018-2019 General Fund Budget
Payroll cost: By position
Budgeted Staff Actual Amended Budget Projected Proposed Budget % of
2017-18 2018-19 2016-2017 2017-2018 2017-2018 2018-2019 Total
2.0 2.0 Administrators 179,827$ 182,540$ 182,401$ 185,310$ 4.60%
6.0 4.0 Paraprofessionals / Aides 233,787 219,925 286,573 266,477 6.61%
1.0 1.0 Counselors 65,256 65,477 65,477 66,640 1.65%
1.0 1.0 Librarians 64,252 64,839 64,346 65,977 1.64%
1.0 1.0 Nurses 55,625 55,726 56,808 56,890 1.41%
33.0 33.0 Teachers 2,420,484 2,577,766 2,507,375 2,566,335 63.70%
44.0 42.0 3,019,231 3,166,273 3,162,980 3,207,629 79.62%
Payroll related and benefits costs: 570,488 620,662 640,163 595,398 14.78%
Non-payroll cost: By functional area
11 Instruction 41,347 49,666 21,200 62,243 1.55%
12 Instructional Resources 5,992 6,500 5,636 6,902 0.17%
13 Curriculum & Instruction 312 - - - 0.00%
23 School Leadership 2,306 1,000 1,073 1,392 0.03%
31 Guidance, Counseling & Eval. 2,217 1,189 1,163 675 0.02%
33 Health Services 598 600 599 600 0.01%
51 Plant Maintenance & Operations 171,347 135,778 136,744 153,790 3.82%
81 Facilities Acquisition & Const. 43,328 14,500 - - 0.00%
267,447 209,233 166,415 225,602 5.60%
Total Annual Operating Budget 3,857,166$ 3,996,168$ 3,969,558$ 4,028,629$ 100.00%
Enrollment 682 739 714 731
Total Annual Operating Cost per Student 5,655.67$ 5,407.53$ 5,559.61$ 5,511.12$ -0.87%
***Note: For STAAR Testing Results, please refer to the Texas Education Agency 2018 Accountability Summaries by campus located in the
Information Section under Performance Measures.
149

Sue Park Broadway Elementary Campus Goals & Objectives
Nikki Conley, Principal
GOAL 1: Student Achievement and Post-Secondary Success Master rigorous academic standards – Student Achievement, Student Progress, and Closing
Performance Gaps
Student Achievement Objective
All subjects; all students 92% of all students combined over all subject areas approaching Grade Level Standards
Distinctions: Will meet AADD indicator for performance (Mastering Grade Level) in Reading/ELA, Writing, Math.
Student Progress Objective
Reading, Math; all students, 7 racial/ethnic groups, ELL, Sp Ed; weighted progress –
All Students/All Subjects 80% of students who will meet Expected or Accelerated Growth measures. 41% of students who will meet Accelerated Growth measures only.
Distinctions: 1. Will meet Top 25% Student Progress Distinction in Reading/ELA and Math.
2. Will meet AADD indicator for Accelerated Growth in Reading and Math.
Closing Performance Gaps
All subjects; Economically Disadvantaged Students and up to 7 racial/ethnic groups Economically Disadvantaged Students: 83% will score Approaching Grade Level Standards 27% will score Mastering Grade Level Standards Racial/Ethnic Group: African American: 90% will score Approaching Grade Level Standards 30% will score Mastering Grade Level Standards Racial/Ethnic Group: Hispanic: 91% will score Approaching Grade Level Standards 40% will score Mastering Grade Level Standards
Distinctions: Will meet Top 25% Closing Performance gaps Distinction in Reading/ELA and Math.
Post‐Secondary Readiness Increase Attendance Rate from 97% to 98%
GOAL 2: Recruitment, Development, and Retention of Staff
Objective: To recruit, retain, and develop highly qualified teachers and staff for all students.
GOAL 3: Parents and Community
Objective: To will work jointly with parents and the community to maximize learning for all students through two-way communication, collaborative partnerships, and unity of purpose.
GOAL 4: Safe Schools
Objective: To provide a safe and orderly school environment conducive to learning for all students and staff.
GOAL 5: Technology
Objective: To ensure that all students and staff utilize technology to maximize learning for all students and to enhance the educational practices of teachers.
150

Sue Park Broadway Elementary2018-2019 General Fund Budget
Payroll cost: By position
Budgeted Staff Actual Amended Budget Projected Proposed Budget % of
2017-18 2018-19 2016-2017 2017-2018 2017-2018 2018-2019 Total
3.0 3.0 Administrators 259,329$ 256,553$ 256,021$ 260,550$ 4.89%
7.0 7.0 Paraprofessionals / Aides 338,665 347,853 326,650 340,037 6.38%
1.0 1.0 Counselors 79,182 79,492 79,511 80,590 1.51%
1.0 1.0 Librarians 59,283 60,189 59,960 61,357 1.15%
1.0 1.0 Nurses 57,555 57,647 58,378 58,800 1.10%
33.5 33.5 Teachers 3,801,943 3,308,182 3,397,890 3,506,487 65.75%
46.5 46.5 4,595,957 4,109,916 4,178,410 4,307,821 80.78%
Payroll related and benefits costs: 804,000 756,471 777,043 762,010 14.29%
Non-payroll cost: By functional area
11 Instruction 78,804 63,871 58,045 76,523 1.43%
12 Instructional Resources 6,018 6,250 5,160 6,636 0.12%
23 School Leadership 6 1,000 1,065 1,450 0.03%
31 Guidance, Counseling & Eval. 4,562 1,923 1,505 1,325 0.02%
33 Health Services 1,797 600 589 2,100 0.04%
51 Plant Maintenance & Operations 179,817 183,407 156,603 175,104 3.28%
81 Facilities Acquisition & Const. 51,810 - - - 0.00%
322,814 257,051 222,967 263,138 4.93%
Total Annual Operating Budget 5,722,771$ 5,123,438$ 5,178,420$ 5,332,969$ 100.00%
Enrollment 1,172 917 891 940
Total Annual Operating Cost per Student 4,882.91$ 5,587.17$ 5,811.92$ 5,673.37$ -2.38%
***Note: For STAAR Testing Results, please refer to the Texas Education Agency 2018 Accountability Summaries by campus located in the
Information Section under Performance Measures.
151

Charlie Patterson Elementary Campus Goals & Objectives
Julie Miller, Principal
GOAL 1: Student Achievement and Post-Secondary Success Master rigorous academic standards – Student Achievement, Student Progress, and Closing
Performance Gaps
Student Achievement Objective
All subjects; all students 82% of all students combined over all subject areas approaching Grade Level Standards
Distinctions: Will meet AADD indicator for performance (Mastering Grade Level) in Reading/ELA, Writing, Math.
Student Progress Objective
Reading, Math; all students, 7 racial/ethnic groups, ELL, Sp Ed; weighted progress –
All Students/All Subjects 47% of students who will meet Expected or Accelerated Growth measures. 35% of students who will meet Accelerated Growth measures only.
Distinctions: 1. Will meet Top 25% Student Progress Distinction in Reading/ELA and Math.
2. Will meet AADD indicator for Accelerated Growth in Reading and Math.
Closing Performance Gaps
All subjects; Economically Disadvantaged Students and up to 7 racial/ethnic groups Economically Disadvantaged Students: 80% will score Approaching Grade Level Standards 24% will score Mastering Grade Level Standards Racial/Ethnic Group: Hispanic: 83% will score Approaching Grade Level Standards 23% will score Mastering Grade Level Standards
Distinctions: Will meet Top 25% Closing Performance gaps Distinction in Reading/ELA and Math.
Post‐Secondary Readiness Increase Attendance Rate from 96.6% to 97%
GOAL 2: Recruitment, Development, and Retention of Staff
Objective: To recruit, retain, and develop highly qualified teachers and staff for all students.
GOAL 3: Parents and Community
Objective: To will work jointly with parents and the community to maximize learning for all students through two-way communication, collaborative partnerships, and unity of purpose.
GOAL 4: Safe Schools
Objective: To provide a safe and orderly school environment conducive to learning for all students and staff.
GOAL 5: Technology
Objective: To ensure that all students and staff utilize technology to maximize learning for all students and to enhance the educational practices of teachers.
152

Charlie Patterson Elementary2018-2019 General Fund Budget
Payroll cost: By position
Budgeted Staff Actual Amended Budget Projected Proposed Budget % of
2017-18 2018-19 2016-2017 2017-2018 2017-2018 2018-2019 Total
2.0 3.0 Administrators 178,075$ 201,340$ 184,589$ 267,840$ 5.43%
8.5 9.5 Paraprofessionals / Aides 253,084 265,768 292,557 328,533 6.66%
1.0 1.0 Counselors 60,895 64,029 64,367 65,190 1.32%
1.0 1.0 Librarians 60,802 62,433 59,862 61,857 1.25%
1.0 1.0 Nurses 58,030 57,647 57,971 58,800 1.19%
41.0 45.0 Teachers 2,836,385 2,910,738 2,941,940 3,194,544 64.78%
54.5 60.5 3,447,271 3,561,955 3,601,286 3,976,764 80.64%
Payroll related and benefits costs: 649,766 669,975 729,125 766,631 15.55%
Non-payroll cost: By functional area
11 Instruction 59,723 64,045 58,052 86,271 1.75%
12 Instructional Resources 977 1,250 956 1,327 0.03%
13 Curriculum & Instruction 1,171 - - - 0.00%
23 School Leadership 1,968 700 334 812 0.02%
31 Guidance, Counseling & Eval. 2,768 1,448 1,418 675 0.01%
33 Health Services 1,566 1,600 1,592 600 0.01%
51 Plant Maintenance & Operations 111,635 100,635 89,167 98,373 1.99%
179,808 169,678 151,519 188,058 3.81%
Total Annual Operating Budget 4,276,845$ 4,401,608$ 4,481,930$ 4,931,453$ 100.00%
Enrollment 762 775 802 815
Total Annual Operating Cost per Student 5,612.66$ 5,679.49$ 5,588.44$ 6,050.86$ 8.27%
***Note: For STAAR Testing Results, please refer to the Texas Education Agency 2018 Accountability Summaries by campus located in the
Information Section under Performance Measures.
153

Birnham Woods Elementary Campus Goals & Objectives
Natalie Buckley, Principal
GOAL 1: Student Achievement and Post-Secondary Success Master rigorous academic standards – Student Achievement, Student Progress, and Closing
Performance Gaps
Student Achievement Objective
All subjects; all students 92% of all students combined over all subject areas approaching Grade Level Standards; 75% Meeting Grade Level Standards; and 51% Mastering Grade Level Standards
Distinctions: Will meet AADD indicator for performance (Mastering Grade Level) in Reading/ELA, Writing, Math.
Student Progress Objective
Reading, Math; all students, 7 racial/ethnic groups, ELL, Sp Ed; weighted progress –
All Students/All Subjects 80% of students who will meet Expected or Accelerated Growth measures. 43% of students who will meet Accelerated Growth measures only.
Distinctions: 1. Will meet Top 25% Student Progress Distinction in Reading/ELA and Math.
2. Will meet AADD indicator for Accelerated Growth in Reading and Math.
Closing Performance Gaps
All subjects; Economically Disadvantaged Students and up to 7 racial/ethnic groups Economically Disadvantaged Students: 90% will score Approaching Grade Level Standards 40% will score Mastering Grade Level Standards Racial/Ethnic Group: African American: 92% will score Approaching Grade Level Standards 45% will score Mastering Grade Level Standards Racial/Ethnic Group: Hispanic: 90% will score Approaching Grade Level Standards 50% will score Mastering Grade Level Standards
Distinctions: Will meet Top 25% Closing Performance gaps Distinction in Reading/ELA and Math.
Post‐Secondary Readiness Increase Attendance Rate from 97.07% to 97.4%
GOAL 2: Recruitment, Development, and Retention of Staff
Objective: To recruit, retain, and develop highly qualified teachers and staff for all students.
GOAL 3: Parents and Community
Objective: To will work jointly with parents and the community to maximize learning for all students through two-way communication, collaborative partnerships, and unity of purpose.
GOAL 4: Safe Schools
Objective: To provide a safe and orderly school environment conducive to learning for all students and staff.
GOAL 5: Technology
Objective: To ensure that all students and staff utilize technology to maximize learning for all students and to enhance the educational practices of teachers.
154

Birnham Woods Elementary School2018-2019 General Fund Budget
Payroll cost: By position
Budgeted Staff Actual Amended Budget Projected Proposed Budget % of
2017-18 2018-19 2016-2017 2017-2018 2017-2018 2018-2019 Total
2.0 2.0 Administrators 253,537$ 252,332$ 246,385$ 250,060$ 4.67%
7.5 7.5 Paraprofessionals / Aides 265,268 248,994 278,385 276,630 5.16%
1.0 1.0 Counselors 72,884 63,228 96,487 110,350 2.06%
1.0 1.0 Librarians 67,472 68,077 67,857 70,087 1.31%
1.0 1.0 Nurses 56,148 55,971 56,551 56,890 1.06%
46.0 46.5 Teachers 3,878,563 3,744,614 3,503,911 3,550,357 66.25%
58.5 59.0 4,593,872 4,433,216 4,249,576 4,314,374 80.51%
Payroll related and benefits costs: 786,868 784,645 806,018 759,908 14.18%
Non-payroll cost: By functional area
11 Instruction 61,808 68,790 59,722 87,169 1.63%
12 Instructional Resources 12,795 10,723 10,473 12,052 0.22%
23 School Leadership 2,345 2,233 1,994 2,320 0.04%
31 Guidance, Counseling & Eval. 3,700 1,269 1,170 675 0.01%
33 Health Services 1,100 1,300 1,298 1,300 0.02%
51 Plant Maintenance & Operations 159,412 214,730 194,406 180,897 3.38%
241,160 299,045 269,063 284,413 5.31%
Total Annual Operating Budget 5,621,900$ 5,516,906$ 5,324,657$ 5,358,695$ 100.00%
Enrollment 1,169 991 984 1,038
Total Annual Operating Cost per Student 4,809.15$ 5,567.01$ 5,411.24$ 5,162.52$ -4.60%
***Note: For STAAR Testing Results, please refer to the Texas Education Agency 2018 Accountability Summaries by campus located in the
Information Section under Performance Measures.
155

Jean Stewart Elementary K-6 Campus Goals & Objectives
Dr. Julie English, Principal
GOAL 1: Student Achievement and Post-Secondary Success Master rigorous academic standards – Student Achievement, Student Progress, and Closing
Performance Gaps
Student Achievement Objective
All subjects; all students 95% of all students combined over all subject areas approaching Grade Level Standards
Distinctions: Will meet AADD indicator for performance (Mastering Grade Level) in Reading/ELA, Writing, Math, and Grade 5 Science.
Student Progress Objective
Reading, Math; all students, 7 racial/ethnic groups, ELL, Sp Ed; weighted progress –
All Students/All Subjects 75% of students who will meet Expected or Accelerated Growth measures. 45% of students who will meet Accelerated Growth measures only.
Distinctions: 1. Will meet Top 25% Student Progress Distinction in Reading/ELA and Math.
2. Will meet AADD indicator for Accelerated Growth in Reading and Math.
Closing Performance Gaps
All subjects; Economically Disadvantaged Students and up to 7 racial/ethnic groups Economically Disadvantaged Students: 90% will score Approaching Grade Level Standards 45% will score Mastering Grade Level Standards Racial/Ethnic Group: Hispanic: 95% will score Approaching Grade Level Standards 45% will score Mastering Grade Level Standards
Distinctions: Will meet Top 25% Closing Performance gaps Distinction in Reading/ELA and Math.
Post‐Secondary Readiness Increase Attendance Rate from 96.7% to 98%
GOAL 2: Recruitment, Development, and Retention of Staff
Objective: To recruit, retain, and develop highly qualified teachers and staff for all students.
GOAL 3: Parents and Community
Objective: To will work jointly with parents and the community to maximize learning for all students through two-way communication, collaborative partnerships, and unity of purpose.
GOAL 4: Safe Schools
Objective: To provide a safe and orderly school environment conducive to learning for all students and staff.
GOAL 5: Technology
Objective: To ensure that all students and staff utilize technology to maximize learning for all students and to enhance the educational practices of teachers.
156

Jean E. Stewart K-6 School2018-2019 General Fund Budget
Payroll cost: By position
Budgeted Staff Actual Amended Budget Projected Proposed Budget % of
2017-18 2018-19 2016-2017 2017-2018 2017-2018 2018-2019 Total
2.0 2.0 Administrators 203,443$ 181,416$ 160,940$ 118,970$ 2.50%
7.5 9.5 Paraprofessionals / Aides 241,400 245,211 276,904 307,477 6.47%
2.0 2.0 Counselors 63,576 65,477 65,303 66,640 1.40%
1.0 1.0 Librarians 57,958 58,376 58,167 59,550 1.25%
1.0 1.0 Nurses 60,755 60,680 61,305 61,820 1.30%
44.0 45.0 Teachers 3,059,436 3,124,280 3,073,233 3,104,021 65.31%
57.5 60.5 3,686,568 3,735,440 3,695,852 3,718,478 78.24%
Payroll related and benefits costs: 694,107 716,415 732,854 672,863 14.16%
Non-payroll cost: By functional area
11 Instruction 70,007 64,692 62,000 84,390 1.78%
12 Instructional Resources - 3,839 3,309 3,716 0.08%
13 Curriculum & Instruction 1,305 - - - 0.00%
23 School Leadership 2,076 2,000 1,973 1,160 0.02%
31 Guidance, Counseling & Eval. 2,016 922 842 675 0.01%
33 Health Services 599 600 595 600 0.01%
51 Plant Maintenance & Operations 216,782 248,321 225,597 271,073 5.70%
81 Facilities Acquisition & Const. - 64,433 64,433 - 0.00%
292,785 384,807 358,749 361,614 7.61%
Total Annual Operating Budget 4,673,460$ 4,836,662$ 4,787,455$ 4,752,955$ 100.00%
Enrollment 703 785 729 803
Total Annual Operating Cost per Student 6,647.88$ 6,161.35$ 6,567.15$ 5,919.00$ -9.87%
***Note: For STAAR Testing Results, please refer to the Texas Education Agency 2018 Accountability Summaries by campus located in the
Information Section under Performance Measures.
157

Ann K. Snyder Elementary Campus Goals & Objectives
Crystal Poncho, Principal
GOAL 1: Student Achievement and Post-Secondary Success Master rigorous academic standards – Student Achievement, Student Progress, and Closing
Performance Gaps
Student Achievement Objective
All subjects; all students 95% of all students combined over all subject areas approaching Grade Level Standards
Distinctions: Will meet AADD indicator for performance (Mastering Grade Level) in Reading/ELA, Writing, Math.
Student Progress Objective
Reading, Math; all students, 7 racial/ethnic groups, ELL, Sp Ed; weighted progress –
All Students/All Subjects 90% of students who will meet Expected or Accelerated Growth measures. 50% of students who will meet Accelerated Growth measures only.
Distinctions: 1. Will meet Top 25% Student Progress Distinction in Reading/ELA and Math.
2. Will meet AADD indicator for Accelerated Growth in Reading and Math.
Closing Performance Gaps
All subjects; Economically Disadvantaged Students and up to 7 racial/ethnic groups Economically Disadvantaged Students: 95% will score Approaching Grade Level Standards 50% will score Mastering Grade Level Standards Racial/Ethnic Group: Hispanic: 95% will score Approaching Grade Level Standards 50% will score Mastering Grade Level Standards Racial/Ethnic Group: African American: 90% will score Approaching Grade Level Standards 50% will score Mastering Grade Level Standards
Distinctions: Will meet Top 25% Closing Performance gaps Distinction in Reading/ELA and Math.
Post‐Secondary Readiness Increase Attendance Rate from 97.2% to 97.5%
GOAL 2: Recruitment, Development, and Retention of Staff
Objective: To recruit, retain, and develop highly qualified teachers and staff for all students.
GOAL 3: Parents and Community
Objective: To will work jointly with parents and the community to maximize learning for all students through two-way communication, collaborative partnerships, and unity of purpose.
GOAL 4: Safe Schools
Objective: To provide a safe and orderly school environment conducive to learning for all students and staff.
GOAL 5: Technology
Objective: To ensure that all students and staff utilize technology to maximize learning for all students and to enhance the educational practices of teachers.
158

Ann Snyder Elementary School2018-2019 General Fund Budget
Payroll cost: By position
Budgeted Staff Actual Amended Budget Projected Proposed Budget % of
2017-18 2018-19 2016-2017 2017-2018 2017-2018 2018-2019 Total
3.0 3.0 Administrators 250,758$ 249,208$ 250,520$ 253,230$ 4.63%
15.0 15.0 Paraprofessionals / Aides 326,856 319,461 344,216 332,417 6.07%
1.0 1.0 Counselors 112,740 116,155 133,128 138,240 2.53%
1.0 1.0 Librarians 62,950 64,839 64,201 65,977 1.21%
1.0 1.0 Nurses 54,346 54,129 54,804 55,300 1.01%
47.0 50.0 Teachers 3,604,035 3,250,389 3,376,419 3,595,564 65.69%
68.0 71.0 4,411,685 4,054,181 4,223,288 4,440,728 81.13%
Payroll related and benefits costs: 782,351 769,680 802,166 805,176 14.71%
Non-payroll cost: By functional area
11 Instruction 53,403 50,347 42,117 81,847 1.50%
12 Instructional Resources 7,942 8,250 7,988 8,760 0.16%
13 Curriculum & Instruction 1,198 3,007 1,300 - 0.00%
23 School Leadership 2,301 4,519 4,142 5,801 0.11%
31 Guidance, Counseling & Eval. 3,023 1,348 761 675 0.01%
33 Health Services 599 600 597 600 0.01%
51 Plant Maintenance & Operations 157,994 135,232 116,158 130,071 2.38%
226,460 203,303 173,063 227,754 4.16%
Total Annual Operating Budget 5,420,496$ 5,027,164$ 5,198,517$ 5,473,658$ 100.00%
Enrollment 1,065 857 949 991
Total Annual Operating Cost per Student 5,089.67$ 5,866.00$ 5,477.89$ 5,523.37$ 0.83%
***Note: For STAAR Testing Results, please refer to the Texas Education Agency 2018 Accountability Summaries by campus located in the
Information Section under Performance Measures.
159
Lucille Bradley Elementary Campus Goals & Objectives
Dr. Christine Butler, Principal
GOAL 1: Student Achievement and Post-Secondary Success Master rigorous academic standards – Student Achievement, Student Progress, and Closing
Performance Gaps
Student Achievement Objective
All subjects; all students 87% of all students combined over all subject areas approaching Grade Level Standards; 60% Meeting Grade Level Standards; and 38% Mastering Grade Level Standards
Distinctions: Will meet AADD indicator for performance (Mastering Grade Level) in Reading/ELA, Writing, Math.
Student Progress Objective
Reading, Math; all students, 7 racial/ethnic groups, ELL, Sp Ed; weighted progress –
All Students/All Subjects 60% of students who will meet Expected or Accelerated Growth measures. 20% of students who will meet Accelerated Growth measures only.
Distinctions: 1. Will meet Top 25% Student Progress Distinction in Reading/ELA and Math.
2. Will meet AADD indicator for Accelerated Growth in Reading and Math.
Closing Performance Gaps
All subjects; Economically Disadvantaged Students and up to 7 racial/ethnic groups Economically Disadvantaged Students: 84% will score Approaching Grade Level Standards 23% will score Mastering Grade Level Standards Racial/Ethnic Group: African American: 83% will score Approaching Grade Level Standards 28% will score Mastering Grade Level Standards Racial/Ethnic Group: Hispanic: 83% will score Approaching Grade Level Standards 29% will score Mastering Grade Level Standards
Distinctions: Will meet Top 25% Closing Performance gaps Distinction in Reading/ELA and Math.
Post‐Secondary Readiness Attendance Rate will be 96%.
GOAL 2: Recruitment, Development, and Retention of Staff
Objective: To recruit, retain, and develop highly qualified teachers and staff for all students.
GOAL 3: Parents and Community
Objective: To will work jointly with parents and the community to maximize learning for all students through two-way communication, collaborative partnerships, and unity of purpose.
GOAL 4: Safe Schools
Objective: To provide a safe and orderly school environment conducive to learning for all students and staff.
GOAL 5: Technology
Objective: To ensure that all students and staff utilize technology to maximize learning for all students and to enhance the educational practices of teachers.
160

Lucille Bradley Elementary School2018-2019 General Fund Budget
Payroll cost: By position
Budgeted Staff Actual Amended Budget Projected Proposed Budget % of
2017-18 2018-19 2016-2017 2017-2018 2017-2018 2018-2019 Total
3.0 3.0 Administrators 30,068$ 274,970$ 252,529$ 255,980$ 5.43%
7.5 9.5 Paraprofessionals / Aides 23,887 149,565 215,315 251,625 5.34%
1.0 1.0 Counselors 8,739 65,715 63,962 64,780 1.37%
1.0 1.0 Librarians 6,107 59,400 64,332 66,477 1.41%
1.0 1.0 Nurses 5,192 58,153 50,323 54,250 1.15%
48.0 48.0 Teachers 285,107 2,863,379 3,039,375 3,120,848 66.22%
61.5 63.5 359,100 3,471,182 3,685,836 3,813,960 80.93%
Payroll related and benefits costs: 22,823 672,855 676,270 666,520 14.14%
Non-payroll cost: By functional area
11 Instruction 18,057 68,657 65,689 73,182 1.55%
12 Instructional Resources - 11,885 11,277 12,054 0.26%
13 Curriculum & Instruction 2,247 - - - 0.00%
23 School Leadership 2,600 1,767 1,767 1,932 0.04%
31 Guidance, Counseling & Eval. - 679 677 675 0.01%
33 Health Services - 1,295 1,295 1,300 0.03%
51 Plant Maintenance & Operations 17,357 152,850 131,068 143,188 3.04%
40,261 237,133 211,773 232,331 4.93%
Total Annual Operating Budget 422,184$ 4,381,170$ 4,573,879$ 4,712,811$ 100.00%
Enrollment - 907 793 854
Total Annual Operating Cost per Student -$ 4,830.40$ 5,767.82$ 5,518.51$ -4.32%
***Note: For STAAR Testing Results, please refer to the Texas Education Agency 2018 Accountability Summaries by campus located in the
Information Section under Performance Measures.
161

Coulson Tough K-6 Campus Goals & Objectives
Shawn Creswell, Principal
GOAL 1: Student Achievement and Post-Secondary Success Master rigorous academic standards – Student Achievement, Student Progress, and Closing
Performance Gaps
Student Achievement Objective
All subjects; all students 97% of all students combined over all subject areas approaching Grade Level Standards
Distinctions: Will meet AADD indicator for performance (Mastering Grade Level) in Reading/ELA, Writing, Math, and Grade 5 Science.
Student Progress Objective
Reading, Math; all students, 7 racial/ethnic groups, ELL, Sp Ed; weighted progress –
All Students/All Subjects 80% of students who will meet Expected or Accelerated Growth measures. 50% of students who will meet Accelerated Growth measures only.
Distinctions: 1. Will meet Top 25% Student Progress Distinction in Reading/ELA and Math.
2. Will meet AADD indicator for Accelerated Growth in Reading and Math.
Closing Performance Gaps
All subjects; Economically Disadvantaged Students and up to 7 racial/ethnic groups Economically Disadvantaged Students: 92% will score Approaching Grade Level Standards 60% will score Mastering Grade Level Standards Racial/Ethnic Group: Hispanic: 93% will score Approaching Grade Level Standards 60% will score Mastering Grade Level Standards Racial/Ethnic Group: White: 98% will score Approaching Grade Level Standards 60% will score Mastering Grade Level Standards
Distinctions: Will meet Top 25% Closing Performance gaps Distinction in Reading/ELA and Math.
Post‐Secondary Readiness Increase Attendance Rate from 97.6% to 98%
GOAL 2: Recruitment, Development, and Retention of Staff
Objective: To recruit, retain, and develop highly qualified teachers and staff for all students.
GOAL 3: Parents and Community
Objective: To will work jointly with parents and the community to maximize learning for all students through two-way communication, collaborative partnerships, and unity of purpose.
GOAL 4: Safe Schools
Objective: To provide a safe and orderly school environment conducive to learning for all students and staff.
GOAL 5: Technology
Objective: To ensure that all students and staff utilize technology to maximize learning for all students and to enhance the educational practices of teachers.
162

Coulson Tough K-6 School2018-2019 General Fund Budget
Payroll cost: By position
Budgeted Staff Actual Amended Budget Projected Proposed Budget % of
2017-18 2018-19 2016-2017 2017-2018 2017-2018 2018-2019 Total
3.0 3.0 Administrators 272,449$ 263,859$ 267,131$ 267,950$ 4.65%
14.5 12.5 Paraprofessionals / Aides 409,921 398,223 447,635 404,759 7.02%
1.0 1.0 Counselors 164,243 106,573 124,696 129,210 2.24%
1.0 1.0 Librarians 64,934 66,356 65,592 67,487 1.17%
1.0 1.0 Nurses 63,708 63,309 64,143 64,430 1.12%
48.0 47.0 Teachers 3,752,166 3,480,759 3,676,576 3,698,112 64.12%
68.5 65.5 4,727,421 4,379,079 4,645,773 4,631,948 80.31%
Payroll related and benefits costs: 798,845 780,029 876,605 817,033 14.17%
Non-payroll cost: By functional area
11 Instruction 59,490 67,964 61,017 79,985 1.39%
12 Instructional Resources 4,998 3,430 2,886 3,716 0.06%
13 Curriculum & Instruction - 1,004 893 - 0.00%
23 School Leadership 3,217 2,475 1,859 4,176 0.07%
31 Guidance, Counseling & Eval. 3,644 2,144 2,104 1,725 0.03%
33 Health Services 1,590 600 588 1,200 0.02%
51 Plant Maintenance & Operations 185,707 216,614 184,620 227,570 3.95%
81 Facilities Acquisition & Const. - 190 - - 0.00%
258,646 294,421 253,967 318,372 5.52%
Total Annual Operating Budget 5,784,912$ 5,453,529$ 5,776,345$ 5,767,353$ 100.00%
Enrollment 947 864 889 834
Total Annual Operating Cost per Student 6,108.67$ 6,311.95$ 6,497.58$ 6,915.29$ 6.43%
***Note: For STAAR Testing Results, please refer to the Texas Education Agency 2018 Accountability Summaries by campus located in the
Information Section under Performance Measures.
163

Joel Deretchin K-6 Campus Goals & Objectives
Alicia Reeves, Principal
GOAL 1: Student Achievement and Post-Secondary Success Master rigorous academic standards – Student Achievement, Student Progress, and Closing
Performance Gaps
Student Achievement Objective
All subjects; all students 100% of all students combined over all subject areas approaching Grade Level Standards
Distinctions: Will meet AADD indicator for performance (Mastering Grade Level) in Reading/ELA, Writing, Math, and Grade 5 Science.
Student Progress Objective
Reading, Math; all students, 7 racial/ethnic groups, ELL, Sp Ed; weighted progress –
All Students/All Subjects 90% of students who will meet Expected or Accelerated Growth measures. 50% of students who will meet Accelerated Growth measures only.
Distinctions: 1. Will meet Top 25% Student Progress Distinction in Reading/ELA and Math.
2. Will meet AADD indicator for Accelerated Growth in Reading and Math.
Closing Performance Gaps
All subjects; Economically Disadvantaged Students and up to 7 racial/ethnic groups Economically Disadvantaged Students: 100% will score Approaching Grade Level Standards 50% will score Mastering Grade Level Standards Racial/Ethnic Group: African American: 100% will score Approaching Grade Level Standards 75% will score Mastering Grade Level Standards Racial/Ethnic Group: Hispanic: 100% will score Approaching Grade Level Standards 75% will score Mastering Grade Level Standards
Distinctions: Will meet Top 25% Closing Performance gaps Distinction in Reading/ELA and Math.
Post‐Secondary Readiness Increase Attendance Rate from 97.4% to 97.5%
GOAL 2: Recruitment, Development, and Retention of Staff
Objective: To recruit, retain, and develop highly qualified teachers and staff for all students.
GOAL 3: Parents and Community
Objective: To will work jointly with parents and the community to maximize learning for all students through two-way communication, collaborative partnerships, and unity of purpose.
GOAL 4: Safe Schools
Objective: To provide a safe and orderly school environment conducive to learning for all students and staff.
GOAL 5: Technology
Objective: To ensure that all students and staff utilize technology to maximize learning for all students and to enhance the educational practices of teachers.
164

Joel Deretchin K-6 School2018-2019 General Fund Budget
Payroll cost: By position
Budgeted Staff Actual Amended Budget Projected Proposed Budget % of
2017-18 2018-19 2016-2017 2017-2018 2017-2018 2018-2019 Total
4.0 4.0 Administrators 254,085$ 257,721$ 251,052$ 253,860$ 4.72%
12.0 10.0 Paraprofessionals / Aides 292,332 301,284 296,774 254,469 4.73%
2.0 2.0 Counselors 164,897 172,563 152,592 180,260 3.35%
1.0 1.0 Librarians 73,944 75,227 73,079 76,287 1.42%
1.0 1.0 Nurses 57,401 57,497 54,118 54,250 1.01%
40.3 39.3 Teachers 3,684,191 3,520,244 3,515,631 3,497,923 64.98%
60.3 57.3 4,526,850 4,384,536 4,343,246 4,317,049 80.20%
Payroll related and benefits costs: 767,479 769,679 817,179 752,907 13.99%
Non-payroll cost: By functional area
11 Instruction 62,037 73,582 62,637 76,679 1.42%
12 Instructional Resources 5,434 5,500 4,939 5,840 0.11%
13 Curriculum & Instruction 1,411 - - - 0.00%
23 School Leadership 2,300 4,276 4,226 4,960 0.09%
31 Guidance, Counseling & Eval. 2,350 1,231 903 775 0.01%
33 Health Services 441 600 538 600 0.01%
51 Plant Maintenance & Operations 193,854 202,699 178,860 224,072 4.16%
81 Facilities Acquisition & Const. 6,500 188 188 - 0.00%
274,327 288,076 252,291 312,926 5.81%
Total Annual Operating Budget 5,568,656$ 5,442,291$ 5,412,716$ 5,382,882$ 100.00%
Enrollment 1,015 945 949 898
Total Annual Operating Cost per Student 5,486.36$ 5,759.04$ 5,703.60$ 5,994.30$ 5.10%
***Note: For STAAR Testing Results, please refer to the Texas Education Agency 2018 Accountability Summaries by campus located in the
Information Section under Performance Measures.
165

Wilkerson Intermediate Campus Goals & Objectives
J. J. Daw, Principal
GOAL 1: Student Achievement and Post-Secondary Success Master rigorous academic standards – Student Achievement, Student Progress, and Closing
Performance Gaps
Student Achievement Objective
All subjects; all students 90% of all students combined over all subject areas approaching Grade Level Standards
Distinctions: Will meet AADD indicator for performance (Mastering Grade Level) in Reading/ELA, Writing, Math, and Grade 5 Science.
Student Progress Objective
Reading, Math; all students, 7 racial/ethnic groups, ELL, Sp Ed; weighted progress –
All Students/All Subjects 75% of students who will meet Expected or Accelerated Growth measures. 44% of students who will meet Accelerated Growth measures only.
Distinctions: 1. Will meet Top 25% Student Progress Distinction in Reading/ELA and Math.
2. Will meet AADD indicator for Accelerated Growth in Reading and Math.
Closing Performance Gaps
All subjects; Economically Disadvantaged Students and up to 7 racial/ethnic groups Economically Disadvantaged Students: 80% will score Approaching Grade Level Standards 45% will score Mastering Grade Level Standards Racial/Ethnic Group: African American: 76% will score Approaching Grade Level Standards 40% will score Mastering Grade Level Standards Racial/Ethnic Group: Hispanic: 90% will score Approaching Grade Level Standards 44% will score Mastering Grade Level Standards
Distinctions: Will meet Top 25% Closing Performance gaps Distinction in Reading/ELA and Math.
Post‐Secondary Readiness Increase Attendance Rate from 96.1% to 97%
GOAL 2: Recruitment, Development, and Retention of Staff
Objective: To recruit, retain, and develop highly qualified teachers and staff for all students.
GOAL 3: Parents and Community
Objective: To will work jointly with parents and the community to maximize learning for all students through two-way communication, collaborative partnerships, and unity of purpose.
GOAL 4: Safe Schools
Objective: To provide a safe and orderly school environment conducive to learning for all students and staff.
GOAL 5: Technology
Objective: To ensure that all students and staff utilize technology to maximize learning for all students and to enhance the educational practices of teachers.
166

Wilkerson Intermediate School2018-2019 General Fund Budget
Payroll cost: By position
Budgeted Staff Actual Amended Budget Projected Proposed Budget % of
2017-18 2018-19 2016-2017 2017-2018 2017-2018 2018-2019 Total
2.0 2.0 Administrators 184,503$ 186,699$ 187,736$ 189,580$ 3.83%
13.0 14.0 Paraprofessionals / Aides 271,752 297,004 314,827 365,541 7.38%
1.0 1.0 Counselors 69,379 69,626 72,026 70,770 1.43%
1.0 1.0 Librarians 60,662 62,211 61,218 63,367 1.28%
1.0 1.0 Nurses 60,394 60,175 60,525 61,310 1.24%
56.4 57.4 Teachers 2,865,558 3,044,567 3,133,933 3,230,359 65.18%
74.4 76.4 3,512,248 3,720,282 3,830,265 3,980,927 80.33%
Payroll related and benefits costs: 635,098 696,220 750,603 717,458 14.48%
Non-payroll cost: By functional area
11 Instruction 48,587 55,458 48,409 83,547 1.69%
12 Instructional Resources 7,401 18,497 18,294 8,495 0.17%
23 School Leadership - 1,000 649 1,160 0.02%
31 Guidance, Counseling & Eval. 502 925 497 675 0.01%
33 Health Services 593 600 598 600 0.01%
51 Plant Maintenance & Operations 119,500 136,489 136,044 162,862 3.29%
176,583 212,969 204,491 257,339 5.19%
Total Annual Operating Budget 4,323,929$ 4,629,471$ 4,785,359$ 4,955,724$ 100.00%
Enrollment 734 752 785 794
Total Annual Operating Cost per Student 5,890.91$ 6,156.21$ 6,096.00$ 6,241.47$ 2.39%
***Note: For STAAR Testing Results, please refer to the Texas Education Agency 2018 Accountability Summaries by campus located in the
Information Section under Performance Measures.
167

Collins Intermediate Campus Goals & Objectives
Shelli LeBlanc, Principal
GOAL 1: Student Achievement and Post-Secondary Success Master rigorous academic standards – Student Achievement, Student Progress, and Closing
Performance Gaps
Student Achievement Objective
All subjects; all students 98% of all students combined over all subject areas approaching Grade Level Standards
Distinctions: Will meet AADD indicator for performance (Mastering Grade Level) in Reading/ELA, Writing, Math, and Grade 5 Science.
Student Progress Objective
Reading, Math; all students, 7 racial/ethnic groups, ELL, Sp Ed; weighted progress –
All Students/All Subjects 85% of students who will meet Expected or Accelerated Growth measures. 45% of students who will meet Accelerated Growth measures only.
Distinctions: 1. Will meet Top 25% Student Progress Distinction in Reading/ELA and Math.
2. Will meet AADD indicator for Accelerated Growth in Reading and Math.
Closing Performance Gaps
All subjects; Economically Disadvantaged Students and up to 7 racial/ethnic groups Economically Disadvantaged Students: 55% will score Approaching Grade Level Standards 35% will score Mastering Grade Level Standards Racial/Ethnic Group: Hispanic: 98% will score Approaching Grade Level Standards 55% will score Mastering Grade Level Standards Racial/Ethnic Group: White: 99% will score Approaching Grade Level Standards 65% will score Mastering Grade Level Standards Racial/Ethnic Group: African American: 90% will score Approaching Grade Level Standards 50% will score Mastering Grade Level Standards
Distinctions: Will meet Top 25% Closing Performance gaps Distinction in Reading/ELA and Math.
Post‐Secondary Readiness Increase Attendance Rate from 97.4% to 97.8%
GOAL 2: Recruitment, Development, and Retention of Staff
Objective: To recruit, retain, and develop highly qualified teachers and staff for all students.
GOAL 3: Parents and Community
Objective: To will work jointly with parents and the community to maximize learning for all students through two-way communication, collaborative partnerships, and unity of purpose.
GOAL 4: Safe Schools
Objective: To provide a safe and orderly school environment conducive to learning for all students and staff.
GOAL 5: Technology
Objective: To ensure that all students and staff utilize technology to maximize learning for all students and to enhance the educational practices of teachers.
168

Collins Intermediate School2018-2019 General Fund Budget
Payroll cost: By position
Budgeted Staff Actual Amended Budget Projected Proposed Budget % of
2017-18 2018-19 2016-2017 2017-2018 2017-2018 2018-2019 Total
2.0 2.0 Administrators 182,947$ 186,447$ 167,189$ 184,320$ 4.40%
6.5 8.5 Paraprofessionals / Aides 225,105 243,776 207,849 255,427 6.09%
1.0 1.0 Counselors 68,668 66,360 108,409 102,820 2.45%
1.0 1.0 Librarians 64,118 65,345 64,716 66,477 1.59%
1.0 1.0 Nurses 56,006 55,601 55,991 56,590 1.35%
45.7 48.7 Teachers 2,337,476 2,494,966 2,496,921 2,723,881 64.95%
57.2 62.2 2,934,320 3,112,495 3,101,075 3,389,515 80.82%
Payroll related and benefits costs: 476,860 518,814 549,452 566,629 13.51%
Non-payroll cost: By functional area
11 Instruction 33,136 66,527 38,295 83,392 1.99%
12 Instructional Resources 9,475 9,682 7,651 8,495 0.20%
23 School Leadership 340 509 463 580 0.01%
31 Guidance, Counseling & Eval. 681 858 551 675 0.02%
33 Health Services 599 600 594 600 0.01%
36 Co-curricular Activities - 40 - - 0.00%
51 Plant Maintenance & Operations 106,290 123,380 118,483 143,953 3.43%
150,521 201,596 166,037 237,695 5.67%
Total Annual Operating Budget 3,561,701$ 3,832,905$ 3,816,564$ 4,193,839$ 100.00%
Enrollment 703 703 757 771
Total Annual Operating Cost per Student 5,066.43$ 5,452.21$ 5,041.70$ 5,439.48$ 7.89%
***Note: For STAAR Testing Results, please refer to the Texas Education Agency 2018 Accountability Summaries by campus located in the
Information Section under Performance Measures.
169

Mitchell Intermediate Campus Goals & Objectives
Paula Klapesky, Principal
GOAL 1: Student Achievement and Post-Secondary Success Master rigorous academic standards – Student Achievement, Student Progress, and Closing
Performance Gaps
Student Achievement Objective
All subjects; all students 99% of all students combined over all subject areas approaching Grade Level Standards; 85% meeting Grade Level Standards; and 50% mastering Grade Level Standards
Distinctions: Will meet AADD indicator for performance (Mastering Grade Level) in Reading/ELA, Writing, Math, and Grade 5 Science.
Student Progress Objective
Reading, Math; all students, 7 racial/ethnic groups, ELL, Sp Ed; weighted progress –
All Students/All Subjects 85% of students who will meet Expected or Accelerated Growth measures. 50% of students who will meet Accelerated Growth measures only.
Distinctions: 1. Will meet Top 25% Student Progress Distinction in Reading/ELA and Math.
2. Will meet AADD indicator for Accelerated Growth in Reading and Math.
Closing Performance Gaps
All subjects; Economically Disadvantaged Students and up to 7 racial/ethnic groups Economically Disadvantaged Students: 90% will score Approaching Grade Level Standards 40% will score Mastering Grade Level Standards Racial/Ethnic Group: African American: 90% will score Approaching Grade Level Standards 40% will score Mastering Grade Level Standards Racial/Ethnic Group: Hispanic: 98% will score Approaching Grade Level Standards 60% will score Mastering Grade Level Standards
Distinctions: Will meet Top 25% Closing Performance gaps Distinction in Reading/ELA and Math.
Post‐Secondary Readiness Increase Attendance Rate from 97.2% to 98%
GOAL 2: Recruitment, Development, and Retention of Staff
Objective: To recruit, retain, and develop highly qualified teachers and staff for all students.
GOAL 3: Parents and Community
Objective: To will work jointly with parents and the community to maximize learning for all students through two-way communication, collaborative partnerships, and unity of purpose.
GOAL 4: Safe Schools
Objective: To provide a safe and orderly school environment conducive to learning for all students and staff.
GOAL 5: Technology
Objective: To ensure that all students and staff utilize technology to maximize learning for all students and to enhance the educational practices of teachers.
170

Mitchell Intermediate School2018-2019 General Fund Budget
Payroll cost: By position
Budgeted Staff Actual Amended Budget Projected Proposed Budget % of
2017-18 2018-19 2016-2017 2017-2018 2017-2018 2018-2019 Total
4.0 3.0 Administrators 328,322$ 335,400$ 325,010$ 263,710$ 4.05%
18.9 19.4 Paraprofessionals / Aides 369,368 376,072 364,540 384,729 5.90%
3.0 3.0 Counselors 154,307 154,901 160,213 157,120 2.41%
1.0 1.0 Librarians 67,557 69,326 67,642 71,336 1.09%
1.0 1.0 Nurses 54,878 55,282 53,831 56,060 0.86%
67.6 66.6 Teachers 4,193,802 4,278,978 4,196,596 4,332,712 66.49%
95.5 94.0 5,168,234 5,269,959 5,167,832 5,265,667 80.81%
Payroll related and benefits costs: 926,850 972,121 997,068 942,793 14.47%
Non-payroll cost: By functional area
11 Instruction 112,812 92,794 73,975 93,939 1.44%
12 Instructional Resources 7,999 8,500 7,906 7,964 0.12%
23 School Leadership 3,029 485 562 3,692 0.06%
31 Guidance, Counseling & Eval. 2,382 2,258 1,371 1,275 0.02%
33 Health Services 3,099 3,100 3,099 3,100 0.05%
51 Plant Maintenance & Operations 172,965 237,433 177,979 196,200 3.01%
53 Data Processing - - - 1,500 0.02%
302,286 344,570 264,892 307,670 4.72%
Total Annual Operating Budget 6,397,370$ 6,586,650$ 6,429,792$ 6,516,130$ 100.00%
Enrollment 1,229 1,194 1,242 1,165
Total Annual Operating Cost per Student 5,205.35$ 5,516.46$ 5,176.97$ 5,593.24$ 8.04%
***Note: For STAAR Testing Results, please refer to the Texas Education Agency 2018 Accountability Summaries by campus located in the
Information Section under Performance Measures.
171

Grangerland Intermediate Campus Goals & Objectives
Karen Jones, Principal
GOAL 1: Student Achievement and Post-Secondary Success Master rigorous academic standards – Student Achievement, Student Progress, and Closing
Performance Gaps
Student Achievement Objective
All subjects; all students 75% of all students combined over all subject areas approaching Grade Level Standards
Distinctions: Will meet AADD indicator for performance (Mastering Grade Level) in Reading/ELA, Writing, Math, and Grade 5 Science.
Student Progress Objective
Reading, Math; all students, 7 racial/ethnic groups, ELL, Sp Ed; weighted progress –
All Students/All Subjects 56% of students who will meet Expected or Accelerated Growth measures. 15% of students who will meet Accelerated Growth measures only.
Distinctions: 1. Will meet Top 25% Student Progress Distinction in Reading/ELA and Math.
2. Will meet AADD indicator for Accelerated Growth in Reading and Math.
Closing Performance Gaps
All subjects; Economically Disadvantaged Students and up to 7 racial/ethnic groups Economically Disadvantaged Students: 73% will score Approaching Grade Level Standards 14% will score Mastering Grade Level Standards Racial/Ethnic Group: Hispanic: 72% will score Approaching Grade Level Standards 12% will score Mastering Grade Level Standards
Distinctions: Will meet Top 25% Closing Performance gaps Distinction in Reading/ELA and Math.
Post‐Secondary Readiness Increase Attendance Rate from 96% to 97%
GOAL 2: Recruitment, Development, and Retention of Staff
Objective: To recruit, retain, and develop highly qualified teachers and staff for all students.
GOAL 3: Parents and Community
Objective: To will work jointly with parents and the community to maximize learning for all students through two-way communication, collaborative partnerships, and unity of purpose.
GOAL 4: Safe Schools
Objective: To provide a safe and orderly school environment conducive to learning for all students and staff.
GOAL 5: Technology
Objective: To ensure that all students and staff utilize technology to maximize learning for all students and to enhance the educational practices of teachers.
172

Grangerland Intermediate School2018-2019 General Fund Budget
Payroll cost: By position
Budgeted Staff Actual Amended Budget Projected Proposed Budget % of
2017-18 2018-19 2016-2017 2017-2018 2017-2018 2018-2019 Total
3.0 4.0 Administrators 263,370$ 266,456$ 278,393$ 357,630$ 4.92%
10.5 11.5 Paraprofessionals / Aides 372,896 415,488 379,841 421,144 5.80%
2.0 2.0 Counselors 141,372 142,944 142,766 145,500 2.00%
1.0 1.0 Librarians 65,783 66,760 66,036 68,287 0.94%
1.0 1.0 Nurses 59,047 58,658 50,378 59,800 0.82%
64.5 69.5 Teachers 3,852,216 3,985,045 4,255,426 4,581,125 63.04%
82.0 89.0 4,754,684 4,935,351 5,172,840 5,633,486 77.52%
Payroll related and benefits costs: 935,790 996,365 1,087,138 1,078,757 14.84%
Non-payroll cost: By functional area
11 Instruction 71,969 147,052 126,455 133,380 1.84%
12 Instructional Resources 8,836 10,449 3,931 3,747 0.05%
13 Curriculum & Instruction 145 - - - 0.00%
23 School Leadership 6,048 2,332 - 2,681 0.04%
31 Guidance, Counseling & Eval. 760 1,716 1,388 2,125 0.03%
33 Health Services 595 600 561 600 0.01%
51 Plant Maintenance & Operations 347,716 350,076 343,370 412,293 5.67%
436,069 512,225 475,705 554,826 7.63%
Total Annual Operating Budget 6,126,543$ 6,443,941$ 6,735,683$ 7,267,069$ 100.00%
Enrollment 1,057 1,073 1,092 1,185
Total Annual Operating Cost per Student 5,796.16$ 6,005.54$ 6,168.21$ 6,132.55$ -0.58%
***Note: For STAAR Testing Results, please refer to the Texas Education Agency 2018 Accountability Summaries by campus located in the
Information Section under Performance Measures.
173

Dolly Vogel Intermediate Campus Goals & Objectives
Tara Vandermark, Principal
GOAL 1: Student Achievement and Post-Secondary Success Master rigorous academic standards – Student Achievement, Student Progress, and Closing
Performance Gaps
Student Achievement Objective
All subjects; all students 90% of all students combined over all subject areas approaching Grade Level Standards
Distinctions: Will meet AADD indicator for performance (Mastering Grade Level) in Reading/ELA, Writing, Math, and Grade 5 Science.
Student Progress Objective
Reading, Math; all students, 7 racial/ethnic groups, ELL, Sp Ed; weighted progress –
All Students/All Subjects 70% of students who will meet Expected or Accelerated Growth measures. 25% of students who will meet Accelerated Growth measures only.
Distinctions: 1. Will meet Top 25% Student Progress Distinction in Reading/ELA and Math.
2. Will meet AADD indicator for Accelerated Growth in Reading and Math.
Closing Performance Gaps
All subjects; Economically Disadvantaged Students and up to 7 racial/ethnic groups Economically Disadvantaged Students: 85% will score Approaching Grade Level Standards 25% will score Mastering Grade Level Standards Racial/Ethnic Group: African American: 80% will score Approaching Grade Level Standards 25% will score Mastering Grade Level Standards Racial/Ethnic Group: Hispanic: 88% will score Approaching Grade Level Standards 25% will score Mastering Grade Level Standards
Distinctions: Will meet Top 25% Closing Performance gaps Distinction in Reading/ELA and Math.
Post‐Secondary Readiness Increase Attendance Rate from 96.9% to 97.2%
GOAL 2: Recruitment, Development, and Retention of Staff
Objective: To recruit, retain, and develop highly qualified teachers and staff for all students.
GOAL 3: Parents and Community
Objective: To will work jointly with parents and the community to maximize learning for all students through two-way communication, collaborative partnerships, and unity of purpose.
GOAL 4: Safe Schools
Objective: To provide a safe and orderly school environment conducive to learning for all students and staff.
GOAL 5: Technology
Objective: To ensure that all students and staff utilize technology to maximize learning for all students and to enhance the educational practices of teachers.
174

Dolly Vogel Intermediate School2018-2019 General Fund Budget
Payroll cost: By position
Budgeted Staff Actual Amended Budget Projected Proposed Budget % of
2017-18 2018-19 2016-2017 2017-2018 2017-2018 2018-2019 Total
2.0 2.0 Administrators 264,858$ 268,594$ 267,997$ 271,950$ 4.25%
14.4 15.4 Paraprofessionals / Aides 298,298 320,388 273,832 300,121 4.69%
3.0 3.0 Counselors 141,494 140,330 163,322 165,140 2.58%
1.0 1.0 Librarians 64,272 65,345 64,188 66,477 1.04%
1.0 1.0 Nurses 58,662 58,658 59,488 59,800 0.93%
71.2 71.2 Teachers 3,930,020 4,223,528 4,161,163 4,251,869 66.41%
92.6 93.6 4,757,604 5,076,843 4,989,990 5,115,357 79.90%
Payroll related and benefits costs: 833,436 914,875 969,680 946,774 14.79%
Non-payroll cost: By functional area
11 Instruction 126,760 94,004 78,439 114,903 1.79%
12 Instructional Resources 8,974 12,500 12,306 12,423 0.19%
13 Curriculum & Instruction - 100 - - 0.00%
23 School Leadership 4,000 4,000 3,914 2,900 0.05%
31 Guidance, Counseling & Eval. 859 804 616 775 0.01%
33 Health Services 598 1,207 1,201 600 0.01%
51 Plant Maintenance & Operations 167,458 183,757 185,018 208,770 3.26%
308,649 296,372 281,494 340,371 5.32%
Total Annual Operating Budget 5,899,689$ 6,288,090$ 6,241,164$ 6,402,502$ 100.00%
Enrollment 1,067 1,147 1,104 1,129
Total Annual Operating Cost per Student 5,529.23$ 5,482.21$ 5,653.23$ 5,670.95$ 0.31%
***Note: For STAAR Testing Results, please refer to the Texas Education Agency 2018 Accountability Summaries by campus located in the
Information Section under Performance Measures.
175

Travis Intermediate Campus Goals & Objectives
Charita Smith, Principal
GOAL 1: Student Achievement and Post-Secondary Success Master rigorous academic standards – Student Achievement, Student Progress, and Closing
Performance Gaps
Student Achievement Objective
All subjects; all students 82% of all students combined over all subject areas approaching Grade Level Standards
Distinctions: Will meet AADD indicator for performance (Mastering Grade Level) in Reading/ELA, Writing, Math, and Grade 5 Science.
Student Progress Objective
Reading, Math; all students, 7 racial/ethnic groups, ELL, Sp Ed; weighted progress –
All Students/All Subjects 67% of students who will meet Expected or Accelerated Growth measures. 20% of students who will meet Accelerated Growth measures only.
Distinctions: 1. Will meet Top 25% Student Progress Distinction in Reading/ELA and Math.
2. Will meet AADD indicator for Accelerated Growth in Reading and Math.
Closing Performance Gaps
All subjects; Economically Disadvantaged Students and up to 7 racial/ethnic groups Economically Disadvantaged Students: 81% will score Approaching Grade Level Standards 70% will score Mastering Grade Level Standards Racial/Ethnic Group: African American: 71% will score Approaching Grade Level Standards 7% will score Mastering Grade Level Standards Racial/Ethnic Group: Hispanic: 82% will score Approaching Grade Level Standards 64% will score Mastering Grade Level Standards
Distinctions: Will meet Top 25% Closing Performance gaps Distinction in Reading/ELA and Math.
Post‐Secondary Readiness Increase Attendance Rate from 97.92% to 98%
GOAL 2: Recruitment, Development, and Retention of Staff
Objective: To recruit, retain, and develop highly qualified teachers and staff for all students.
GOAL 3: Parents and Community
Objective: To will work jointly with parents and the community to maximize learning for all students through two-way communication, collaborative partnerships, and unity of purpose.
GOAL 4: Safe Schools
Objective: To provide a safe and orderly school environment conducive to learning for all students and staff.
GOAL 5: Technology
Objective: To ensure that all students and staff utilize technology to maximize learning for all students and to enhance the educational practices of teachers.
176

Travis Intermediate School2018-2019 General Fund Budget
Payroll cost: By position
Budgeted Staff Actual Amended Budget Projected Proposed Budget % of
2017-18 2018-19 2016-2017 2017-2018 2017-2018 2018-2019 Total
2.0 2.0 Administrators 183,697$ 181,987$ 182,034$ 184,890$ 3.95%
4.5 7.5 Paraprofessionals / Aides 297,136 304,020 294,461 355,018 7.59%
1.8 1.8 Counselors 73,066 73,336 73,482 74,460 1.59%
1.0 1.0 Librarians 61,888 59,683 58,702 60,847 1.30%
1.0 1.0 Nurses 54,631 55,120 52,639 56,280 1.20%
40.3 41.3 Teachers 2,731,782 2,970,311 2,800,082 2,934,820 62.70%
50.6 54.6 3,402,200 3,644,457 3,461,400 3,666,315 78.33%
Payroll related and benefits costs: 646,907 710,250 697,108 682,218 14.58%
Non-payroll cost: By functional area
11 Instruction 86,884 89,442 78,788 93,510 2.00%
12 Instructional Resources 8,122 8,877 8,213 10,138 0.22%
13 Curriculum & Instruction 1,520 3,244 3,244 240 0.01%
23 School Leadership 1,164 1,238 1,292 1,574 0.03%
31 Guidance, Counseling & Eval. 791 910 1,022 775 0.02%
33 Health Services 595 600 592 600 0.01%
36 Co-curricular Activities 10 2,371 2,371 1,308 0.03%
51 Plant Maintenance & Operations 183,705 203,669 200,506 223,744 4.78%
282,791 310,351 296,028 331,889 7.09%
Total Annual Operating Budget 4,331,898$ 4,665,058$ 4,454,536$ 4,680,422$ 100.00%
Enrollment 615 635 647 696
Total Annual Operating Cost per Student 7,043.74$ 7,346.55$ 6,884.91$ 6,724.74$ -2.33%
***Note: For STAAR Testing Results, please refer to the Texas Education Agency 2018 Accountability Summaries by campus located in the
Information Section under Performance Measures.
177

Cryar Intermediate Campus Goals & Objectives
Bethany Medford, Principal
GOAL 1: Student Achievement and Post-Secondary Success Master rigorous academic standards – Student Achievement, Student Progress, and Closing
Performance Gaps
Student Achievement Objective
All subjects; all students 86% of all students combined over all subject areas approaching Grade Level Standards
Distinctions: Will meet AADD indicator for performance (Mastering Grade Level) in Reading/ELA, Writing, Math, and Grade 5 Science.
Student Progress Objective
Reading, Math; all students, 7 racial/ethnic groups, ELL, Sp Ed; weighted progress –
All Students/All Subjects 62% of students who will meet Expected or Accelerated Growth measures. 18% of students who will meet Accelerated Growth measures only.
Distinctions: 1. Will meet Top 25% Student Progress Distinction in Reading/ELA and Math.
2. Will meet AADD indicator for Accelerated Growth in Reading and Math.
Closing Performance Gaps
All subjects; Economically Disadvantaged Students and up to 7 racial/ethnic groups Economically Disadvantaged Students: 80% will score Approaching Grade Level Standards 17% will score Mastering Grade Level Standards Racial/Ethnic Group: African American: 80% will score Approaching Grade Level Standards 16% will score Mastering Grade Level Standards Racial/Ethnic Group: Hispanic: 86% will score Approaching Grade Level Standards 16% will score Mastering Grade Level Standards
Distinctions: Will meet Top 25% Closing Performance gaps Distinction in Reading/ELA and Math.
Post‐Secondary Readiness Increase Attendance Rate from 96.6% to 97.6%
GOAL 2: Recruitment, Development, and Retention of Staff
Objective: To recruit, retain, and develop highly qualified teachers and staff for all students.
GOAL 3: Parents and Community
Objective: To will work jointly with parents and the community to maximize learning for all students through two-way communication, collaborative partnerships, and unity of purpose.
GOAL 4: Safe Schools
Objective: To provide a safe and orderly school environment conducive to learning for all students and staff.
GOAL 5: Technology
Objective: To ensure that all students and staff utilize technology to maximize learning for all students and to enhance the educational practices of teachers.
178

Cryar Intermediate School2018-2019 General Fund Budget
Payroll cost: By position
Budgeted Staff Actual Amended Budget Projected Proposed Budget % of
2017-18 2018-19 2016-2017 2017-2018 2017-2018 2018-2019 Total
3.0 3.0 Administrators 129,399$ 162,333$ 182,528$ 185,180$ 3.68%
14.0 16.5 Paraprofessionals / Aides 273,501 284,119 278,505 318,615 6.33%
2.0 2.0 Counselors 115,881 117,555 128,066 136,660 2.71%
1.0 1.0 Librarians 74,345 75,333 74,433 77,117 1.53%
1.0 1.0 Nurses 53,032 53,280 52,054 54,450 1.08%
49.8 56.3 Teachers 2,653,291 2,601,141 2,818,828 3,230,641 64.15%
70.8 79.8 3,299,449 3,293,761 3,534,414 4,002,663 79.47%
Payroll related and benefits costs: 585,035 606,762 691,662 741,575 14.72%
Non-payroll cost: By functional area
11 Instruction 50,049 63,729 54,719 78,631 1.56%
12 Instructional Resources 14,685 9,146 8,607 12,211 0.24%
13 Curriculum & Instruction 312 - - - 0.00%
23 School Leadership 378 4,447 4,430 1,019 0.02%
31 Guidance, Counseling & Eval. 229 685 518 675 0.01%
33 Health Services 570 600 585 600 0.01%
51 Plant Maintenance & Operations 185,134 188,265 155,226 199,042 3.95%
251,357 266,872 224,085 292,178 5.80%
Total Annual Operating Budget 4,135,841$ 4,167,395$ 4,450,161$ 5,036,416$ 100.00%
Enrollment 655 664 707 757
Total Annual Operating Cost per Student 6,314.26$ 6,276.20$ 6,294.43$ 6,653.13$ 5.70%
***Note: For STAAR Testing Results, please refer to the Texas Education Agency 2018 Accountability Summaries by campus located in the
Information Section under Performance Measures.
179

Tom Cox Intermediate Campus Goals & Objectives
Debbie Spoon, Principal
GOAL 1: Student Achievement and Post-Secondary Success Master rigorous academic standards – Student Achievement, Student Progress, and Closing
Performance Gaps
Student Achievement Objective
All subjects; all students 92% of all students combined over all subject areas approaching Grade Level Standards
Distinctions: Will meet AADD indicator for performance (Mastering Grade Level) in Reading/ELA, Writing, Math, and Grade 5 Science.
Student Progress Objective
Reading, Math; all students, 7 racial/ethnic groups, ELL, Sp Ed; weighted progress –
All Students/All Subjects 75% of students who will meet Expected or Accelerated Growth measures. 30% of students who will meet Accelerated Growth measures only.
Distinctions: 1. Will meet Top 25% Student Progress Distinction in Reading/ELA and Math.
2. Will meet AADD indicator for Accelerated Growth in Reading and Math.
Closing Performance Gaps
All subjects; Economically Disadvantaged Students and up to 7 racial/ethnic groups Economically Disadvantaged Students: 90% will score Approaching Grade Level Standards 50% will score Mastering Grade Level Standards Racial/Ethnic Group: African American: 90% will score Approaching Grade Level Standards 50% will score Mastering Grade Level Standards Racial/Ethnic Group: Hispanic: 91% will score Approaching Grade Level Standards 50% will score Mastering Grade Level Standards
Distinctions: Will meet Top 25% Closing Performance gaps Distinction in Reading/ELA and Math.
Post‐Secondary Readiness Increase Attendance Rate from 97% to 97.5%
GOAL 2: Recruitment, Development, and Retention of Staff
Objective: To recruit, retain, and develop highly qualified teachers and staff for all students.
GOAL 3: Parents and Community
Objective: To will work jointly with parents and the community to maximize learning for all students through two-way communication, collaborative partnerships, and unity of purpose.
GOAL 4: Safe Schools
Objective: To provide a safe and orderly school environment conducive to learning for all students and staff.
GOAL 5: Technology
Objective: To ensure that all students and staff utilize technology to maximize learning for all students and to enhance the educational practices of teachers.
180

Tom Cox Intermediate School2018-2019 General Fund Budget
Payroll cost: By position
Budgeted Staff Actual Amended Budget Projected Proposed Budget % of
2017-18 2018-19 2016-2017 2017-2018 2017-2018 2018-2019 Total
4.0 2.0 Administrators 333,515$ 331,898$ 318,455$ 189,890$ 3.97%
14.0 12.5 Paraprofessionals / Aides 302,166 316,952 298,033 291,451 6.10%
2.0 1.0 Counselors 145,473 146,010 134,048 83,070 1.74%
1.0 1.0 Librarians 60,195 61,705 60,893 62,857 1.32%
1.0 1.0 Nurses 55,949 58,117 59,204 58,800 1.23%
72.0 46.0 Teachers 4,327,805 4,575,345 4,335,727 3,108,510 65.06%
94.0 63.5 5,225,103 5,490,027 5,206,360 3,794,578 79.42%
Payroll related and benefits costs: 923,505 1,001,831 1,019,442 680,428 14.24%
Non-payroll cost: By functional area
11 Instruction 80,536 92,660 71,925 71,479 1.50%
12 Instructional Resources 17,114 18,505 18,472 11,988 0.25%
13 Curriculum & Instruction 1,251 600 238 800 0.02%
23 School Leadership 3,070 2,941 2,735 2,157 0.05%
31 Guidance, Counseling & Eval. 1,138 956 767 775 0.02%
33 Health Services 600 600 600 600 0.01%
51 Plant Maintenance & Operations 194,428 199,281 171,934 215,000 4.50%
298,137 315,543 266,671 302,799 6.34%
Total Annual Operating Budget 6,446,745$ 6,807,401$ 6,492,473$ 4,777,805$ 100.00%
Enrollment 1,312 1,385 1,478 830
Total Annual Operating Cost per Student 4,913.68$ 4,915.09$ 4,392.74$ 5,756.39$ 31.04%
***Note: For STAAR Testing Results, please refer to the Texas Education Agency 2018 Accountability Summaries by campus located in the
Information Section under Performance Measures.
181

Bozman Intermediate Campus Goals & Objectives
Amber Debeaumont, Principal
GOAL 1: Student Achievement and Post-Secondary Success Master rigorous academic standards – Student Achievement, Student Progress, and Closing
Performance Gaps
Student Achievement Objective
All subjects; all students 88% of all students combined over all subject areas approaching Grade Level Standards
Distinctions: Will meet AADD indicator for performance (Mastering Grade Level) in Reading/ELA, Writing, Math, and Grade 5 Science.
Student Progress Objective
Reading, Math; all students, 7 racial/ethnic groups, ELL, Sp Ed; weighted progress –
All Students/All Subjects 64% of students who will meet Expected or Accelerated Growth measures. 20% of students who will meet Accelerated Growth measures only.
Distinctions: 1. Will meet Top 25% Student Progress Distinction in Reading/ELA and Math.
2. Will meet AADD indicator for Accelerated Growth in Reading and Math.
Closing Performance Gaps
All subjects; Economically Disadvantaged Students and up to 7 racial/ethnic groups Economically Disadvantaged Students: 84% will score Approaching Grade Level Standards 22% will score Mastering Grade Level Standards Racial/Ethnic Group: African American: 93% will score Approaching Grade Level Standards 25% will score Mastering Grade Level Standards Racial/Ethnic Group: Hispanic: 85% will score Approaching Grade Level Standards 22% will score Mastering Grade Level Standards
Distinctions: Will meet Top 25% Closing Performance gaps Distinction in Reading/ELA and Math.
Post‐Secondary Readiness Increase Attendance Rate from 97.97% to 98.3%
GOAL 2: Recruitment, Development, and Retention of Staff
Objective: To recruit, retain, and develop highly qualified teachers and staff for all students.
GOAL 3: Parents and Community
Objective: To will work jointly with parents and the community to maximize learning for all students through two-way communication, collaborative partnerships, and unity of purpose.
GOAL 4: Safe Schools
Objective: To provide a safe and orderly school environment conducive to learning for all students and staff.
GOAL 5: Technology
Objective: To ensure that all students and staff utilize technology to maximize learning for all students and to enhance the educational practices of teachers.
182

Bozman Intermediate School2018-2019 General Fund Budget
Payroll cost: By position
Budgeted Staff Actual Amended Budget Projected Proposed Budget % of
2017-18 2018-19 2016-2017 2017-2018 2017-2018 2018-2019 Total
3.0 3.0 Administrators 263,211$ 262,464$ 257,299$ 261,250$ 4.93%
8.5 12.5 Paraprofessionals / Aides 275,147 256,063 305,871 345,063 6.51%
1.0 1.0 Counselors 67,444 67,679 68,580 68,830 1.30%
1.0 1.0 Librarians 57,348 58,773 58,800 59,947 1.13%
1.0 1.0 Nurses 47,455 53,280 53,466 54,450 1.03%
46.0 47.0 Teachers 3,220,779 3,333,272 3,262,327 3,395,146 64.07%
60.5 65.5 3,931,384 4,031,531 4,006,343 4,184,686 78.97%
Payroll related and benefits costs: 714,453 762,159 811,880 788,281 14.88%
Non-payroll cost: By functional area
11 Instruction 80,697 87,255 81,671 91,267 1.72%
12 Instructional Resources 7,586 8,100 8,047 12,388 0.23%
13 Curriculum & Instruction 625 - - - 0.00%
23 School Leadership 1,955 1,858 1,857 1,607 0.03%
31 Guidance, Counseling & Eval. 777 808 779 900 0.02%
33 Health Services 599 601 600 600 0.01%
51 Plant Maintenance & Operations 176,220 194,899 188,568 219,372 4.14%
268,459 293,521 281,522 326,134 6.15%
Total Annual Operating Budget 4,914,296$ 5,087,211$ 5,099,745$ 5,299,101$ 100.00%
Enrollment 802 799 797 859
Total Annual Operating Cost per Student 6,127.55$ 6,366.97$ 6,398.68$ 6,168.92$ -3.59%
***Note: For STAAR Testing Results, please refer to the Texas Education Agency 2018 Accountability Summaries by campus located in the
Information Section under Performance Measures.
183

Katherine Clark Intermediate Campus Goals & Objectives
Lindsay Ardoin, Principal
GOAL 1: Student Achievement and Post-Secondary Success Master rigorous academic standards – Student Achievement, Student Progress, and Closing
Performance Gaps
Student Achievement Objective
All subjects; all students 95% of all students combined over all subject areas approaching Grade Level Standards; 75% meeting Grade Level Standards; and 45% mastering Grade Level Standards
Distinctions: Will meet AADD indicator for performance (Mastering Grade Level) in Reading/ELA, Writing, Math, and Grade 5 Science.
Student Progress Objective
Reading, Math; all students, 7 racial/ethnic groups, ELL, Sp Ed; weighted progress –
All Students/All Subjects 69% of students who will meet Expected or Accelerated Growth measures. 35% of students who will meet Accelerated Growth measures only.
Distinctions: 1. Will meet Top 25% Student Progress Distinction in Reading/ELA and Math.
2. Will meet AADD indicator for Accelerated Growth in Reading and Math.
Closing Performance Gaps
All subjects; Economically Disadvantaged Students and up to 7 racial/ethnic groups Economically Disadvantaged Students: 85% will score Approaching Grade Level Standards 25% will score Mastering Grade Level Standards Focus Group: Special Education: 60% will score Approaching Grade Level Standards 20% will score Mastering Grade Level Standards Focus Group: English Learners: 80% will score Approaching Grade Level Standards 20% will score Mastering Grade Level Standards
Distinctions: Will meet Top 25% Closing Performance gaps Distinction in Reading/ELA and Math.
Post‐Secondary Readiness Attendance Rate will be 98%
GOAL 2: Recruitment, Development, and Retention of Staff
Objective: To recruit, retain, and develop highly qualified teachers and staff for all students.
GOAL 3: Parents and Community
Objective: To will work jointly with parents and the community to maximize learning for all students through two-way communication, collaborative partnerships, and unity of purpose.
GOAL 4: Safe Schools
Objective: To provide a safe and orderly school environment conducive to learning for all students and staff.
GOAL 5: Technology
Objective: To ensure that all students and staff utilize technology to maximize learning for all students and to enhance the educational practices of teachers.
184

Clark Intermediate School2018-2019 General Fund Budget
Payroll cost: By position
Budgeted Staff Actual Amended Budget Projected Proposed Budget % of
2017-18 2018-19 2016-2017 2017-2018 2017-2018 2018-2019 Total
- 2.0 Administrators -$ -$ 30,911$ 150,140$ 3.59%
- 14.0 Paraprofessionals / Aides - - 30,213 294,651 7.05%
- 2.0 Counselors - - 10,250 145,810 3.49%
- 1.0 Librarians - - 6,885 60,047 1.44%
- 1.0 Nurses - - 5,744 58,800 1.41%
- 44.0 Teachers - - 284,998 2,555,516 61.15%
- 64.0 - - 369,001 3,264,964 78.13%
Payroll related and benefits costs: - - 42,971 598,914 14.33%
Non-payroll cost: By functional area
11 Instruction - 22,011 12,754 76,564 1.83%
12 Instructional Resources - - - 2,655 0.06%
13 Curriculum & Instruction - 60 60 - 0.00%
23 School Leadership - 7,440 4,137 6,381 0.15%
31 Guidance, Counseling & Eval. - - - 675 0.02%
33 Health Services - - - 600 0.01%
51 Plant Maintenance & Operations - - 10,450 228,007 5.46%
- 29,511 27,401 314,882 7.54%
Total Annual Operating Budget -$ 29,511$ 439,373$ 4,178,760$ 100.00%
Enrollment - - - 801
Total Annual Operating Cost per Student -$ -$ -$ 5,216.93$ 100.00%
***Note: Clark Intermediate School opened in the 2018-2019 school year.
185

Conroe Independent School District
186

Secondary Schools2018-2019 General Fund Budget
Payroll cost: By position
Budgeted Staff Actual Amended Budget Projected Proposed Budget % of
2017-18 2018-19 2016-2017 2017-2018 2017-2018 2018-2019 Total
85.5 91.5 Administrators 7,955,906$ 8,517,606$ 8,124,905$ 8,445,820$ 4.56%
330.9 349.9 Paraprofessionals / Aides 9,457,424 9,673,759 9,724,837 10,399,085 5.62%
89.5 93.5 Counselors 5,522,768 5,870,453 5,765,130 5,993,790 3.24%
21.0 22.0 Librarians 1,122,428 1,145,326 1,171,382 1,263,636 0.68%
17.7 18.7 Nurses 948,586 926,262 919,840 941,570 0.51%
1,580.0 1,641.5 Teachers 103,968,653 108,923,469 106,469,138 114,236,065 61.70%
2,124.6 2,217.1 128,975,765 135,056,875 132,175,232 141,279,966 76.31%
Payroll related and benefits costs: 24,360,990 25,994,302 26,794,279 26,329,271 14.22%
Non-payroll cost: By functional area
11 Instruction 5,468,460 5,841,025 5,384,267 5,270,293 2.85%
12 Instructional Resources 317,386 329,154 298,321 353,752 0.19%
13 Curriculum & Instruction 46,949 32,322 21,732 91,325 0.05%
23 School Leadership 192,384 218,887 190,911 178,099 0.10%
31 Guidance, Counseling & Eval. 166,335 209,157 197,863 102,017 0.06%
32 Social Work Services 3,978 4,250 3,781 4,000 0.00%
33 Health Services 15,520 19,001 17,574 17,800 0.01%
36 Co-curricular Activities 3,949,294 4,319,512 3,804,867 3,916,981 2.12%
51 Plant Maintenance & Operations 6,323,664 6,590,835 6,046,350 7,591,860 4.10%
53 Data Processing 11,576 - - - 0.00%
81 Facilities Acquisition & Const. 62,099 286,062 175,464 - 0.00%
16,557,645 17,850,205 16,141,130 17,526,127 9.47%
Total Annual Operating Budget 169,894,400$ 178,901,382$ 175,110,641$ 185,135,364$ 100.00%
Enrollment 26,503 27,655 27,440 28,120
Total Annual Operating Cost per Student 6,410.38$ 6,469.04$ 6,381.58$ 6,583.76$ 3.17%
187

Peet Junior High School Campus Goals & Objectives
Chris Kuempel, Principal
GOAL 1: Student Achievement and Post-Secondary Success Master rigorous academic standards – Student Achievement, Student Progress, and Closing
Performance Gaps
Student Achievement Objective
All subjects; all students 85% of all students combined over all subject areas approaching Grade Level Standards
Distinctions: Will meet AADD indicator for performance (Mastering Grade Level) in Reading/ELA, Writing, Math, Grade 8 Science, and Grade 8 Social Studies. Reading and Math: will meet AADD indicators for performance and participation in Algebra I.
Student Progress Objective
Reading, Math; all students, 7 racial/ethnic groups, ELL, Sp Ed; weighted progress –
All Students/All Subjects 75% of students who will meet Expected or Accelerated Growth measures. 25% of students who will meet Accelerated Growth measures only.
Distinctions: 1. Will meet Top 25% Student Progress Distinction in Reading/ELA and Math.
2. Will meet AADD indicator for Accelerated Growth in Reading and Math.
Closing Performance Gaps
All subjects; Economically Disadvantaged Students and up to 7 racial/ethnic groups Economically Disadvantaged Students: 85% will score Approaching Grade Level Standards 25% will score Mastering Grade Level Standards Racial/Ethnic Group: African American: 85% will score Approaching Grade Level Standards 25% will score Mastering Grade Level Standards Racial/Ethnic Group: Hispanic: 85% will score Approaching Grade Level Standards 25% will score Mastering Grade Level Standards
Distinctions: Will meet Top 25% Closing Performance gaps Distinction in Reading/ELA and Math.
Post‐Secondary Readiness Increase Attendance Rate from 95.9% to 97%
GOAL 2: Recruitment, Development, and Retention of Staff
Objective: To recruit, retain, and develop highly qualified teachers and staff for all students.
GOAL 3: Parents and Community
Objective: To will work jointly with parents and the community to maximize learning for all students through two-way communication, collaborative partnerships, and unity of purpose.
GOAL 4: Safe Schools
Objective: To provide a safe and orderly school environment conducive to learning for all students and staff.
GOAL 5: Technology
Objective: To ensure that all students and staff utilize technology to maximize learning for all students and to enhance the educational practices of teachers.
188

Peet Junior High School2018-2019 General Fund Budget
Payroll cost: By position
Budgeted Staff Actual Amended Budget Projected Proposed Budget % of
2017-18 2018-19 2016-2017 2017-2018 2017-2018 2018-2019 Total
4.0 4.0 Administrators 334,237$ 360,097$ 335,767$ 342,410$ 3.72%
15.4 15.4 Paraprofessionals / Aides 540,763 525,607 584,562 548,861 5.96%
2.0 2.0 Counselors 163,893 167,019 249,674 297,720 3.23%
1.0 1.0 Librarians 75,378 78,750 74,372 78,627 0.85%
1.0 1.0 Nurses 63,806 63,713 64,028 65,230 0.71%
81.0 82.0 Teachers 5,309,331 5,688,848 5,793,660 5,927,087 64.34%
104.4 105.4 6,487,408 6,884,034 7,102,063 7,259,935 78.81%
Payroll related and benefits costs: 1,207,790 1,314,566 1,446,157 1,354,133 14.70%
Non-payroll cost: By functional area
11 Instruction 130,675 254,316 249,600 209,025 2.27%
12 Instructional Resources 7,037 11,500 11,244 10,087 0.11%
13 Curriculum & Instruction 2,033 - - - 0.00%
23 School Leadership 5,207 12,000 11,902 2,610 0.03%
31 Guidance, Counseling & Eval. 7,083 8,224 8,224 1,174 0.01%
33 Health Services 1,198 700 697 700 0.01%
36 Co-curricular Activities 58,818 68,064 68,591 87,240 0.95%
51 Plant Maintenance & Operations 241,869 247,415 249,041 286,922 3.11%
453,920 602,219 599,299 597,758 6.49%
Total Annual Operating Budget 8,149,118$ 8,800,819$ 9,147,519$ 9,211,826$ 100.00%
Enrollment 1,344 1,422 1,426 1,423
Total Annual Operating Cost per Student 6,063.33$ 6,189.04$ 6,414.81$ 6,473.52$ 0.92%
***Note: For STAAR Testing Results, please refer to the Texas Education Agency 2018 Accountability Summaries by campus located in the
Information Section under Performance Measures.
189

Washington Junior High School Campus Goals & Objectives
Hartwell Brown, Principal
GOAL 1: Student Achievement and Post-Secondary Success Master rigorous academic standards – Student Achievement, Student Progress, and Closing
Performance Gaps
Student Achievement Objective
All subjects; all students 75% of all students combined over all subject areas approaching Grade Level Standards; 45% meeting Grade Level Standards; and 15% mastering Grade Level Standards.
Distinctions: Will meet AADD indicator for performance (Mastering Grade Level) in Reading/ELA, Writing, Math, Grade 8 Science, and Grade 8 Social Studies. Reading and Math: will meet AADD indicators for performance and participation in Algebra I.
Student Progress Objective
Reading, Math; all students, 7 racial/ethnic groups, ELL, Sp Ed; weighted progress –
All Students/All Subjects 70% of students who will meet Expected or Accelerated Growth measures. 25% of students who will meet Accelerated Growth measures only.
Distinctions: 1. Will meet Top 25% Student Progress Distinction in Reading/ELA and Math.
2. Will meet AADD indicator for Accelerated Growth in Reading and Math.
Closing Performance Gaps
All subjects; Economically Disadvantaged Students and up to 7 racial/ethnic groups Economically Disadvantaged Students: 75% will score Approaching Grade Level Standards 15% will score Mastering Grade Level Standards Racial/Ethnic Group: African American: 80% will score Approaching Grade Level Standards 20% will score Mastering Grade Level Standards Racial/Ethnic Group: Hispanic: 75% will score Approaching Grade Level Standards 15% will score Mastering Grade Level Standards
Distinctions: Will meet Top 25% Closing Performance gaps Distinction in Reading/ELA and Math.
Post‐Secondary Readiness Increase Attendance Rate from 96.6% to 97%
GOAL 2: Recruitment, Development, and Retention of Staff
Objective: To recruit, retain, and develop highly qualified teachers and staff for all students.
GOAL 3: Parents and Community
Objective: To will work jointly with parents and the community to maximize learning for all students through two-way communication, collaborative partnerships, and unity of purpose.
GOAL 4: Safe Schools
Objective: To provide a safe and orderly school environment conducive to learning for all students and staff.
GOAL 5: Technology
Objective: To ensure that all students and staff utilize technology to maximize learning for all students and to enhance the educational practices of teachers.
190

Washington Junior High School2018-2019 General Fund Budget
Payroll cost: By position
Budgeted Staff Actual Amended Budget Projected Proposed Budget % of
2017-18 2018-19 2016-2017 2017-2018 2017-2018 2018-2019 Total
3.0 3.0 Administrators 275,311$ 295,184$ 276,846$ 281,020$ 4.03%
13.5 15.5 Paraprofessionals / Aides 365,050 387,891 415,381 494,725 7.09%
2.0 2.0 Counselors 134,950 142,923 135,528 137,290 1.97%
1.0 1.0 Librarians 25,234 57,945 59,097 61,357 0.88%
1.0 1.0 Nurses 60,308 59,669 59,978 60,810 0.87%
50.5 52.0 Teachers 4,114,261 4,254,990 4,209,285 4,392,927 62.95%
71.0 74.5 4,975,114 5,198,602 5,156,115 5,428,129 77.78%
Payroll related and benefits costs: 958,393 1,022,101 1,082,570 1,043,206 14.95%
Non-payroll cost: By functional area
11 Instruction 152,175 236,626 228,096 146,135 2.09%
12 Instructional Resources 11,727 14,200 12,665 14,866 0.21%
13 Curriculum & Instruction 373 - - - 0.00%
23 School Leadership 3,325 3,600 3,597 3,712 0.05%
31 Guidance, Counseling & Eval. 3,441 3,799 2,853 1,080 0.02%
33 Health Services 670 1,200 1,190 600 0.01%
36 Co-curricular Activities 77,591 51,972 47,899 84,455 1.21%
51 Plant Maintenance & Operations 244,528 247,653 227,533 256,317 3.67%
493,830 559,050 523,833 507,165 7.27%
Total Annual Operating Budget 6,427,337$ 6,779,753$ 6,762,518$ 6,978,500$ 100.00%
Enrollment 773 813 758 824
Total Annual Operating Cost per Student 8,314.80$ 8,339.18$ 8,921.53$ 8,469.05$ -5.07%
***Note: For STAAR Testing Results, please refer to the Texas Education Agency 2018 Accountability Summaries by campus located in the
Information Section under Performance Measures.
191

Knox Junior High School Campus Goals & Objectives
Joe Daw, Principal
GOAL 1: Student Achievement and Post-Secondary Success Master rigorous academic standards – Student Achievement, Student Progress, and Closing
Performance Gaps
Student Achievement Objective
All subjects; all students 95% of all students combined over all subject areas approaching Grade Level Standards
Distinctions: Will meet AADD indicator for performance (Mastering Grade Level) in Reading/ELA, Writing, Math, Grade 8 Science, and Grade 8 Social Studies. Reading and Math: will meet AADD indicators for performance and participation in Algebra I.
Student Progress Objective
Reading, Math; all students, 7 racial/ethnic groups, ELL, Sp Ed; weighted progress –
All Students/All Subjects 85% of students who will meet Expected or Accelerated Growth measures. 40% of students who will meet Accelerated Growth measures only.
Distinctions: 1. Will meet Top 25% Student Progress Distinction in Reading/ELA and Math.
2. Will meet AADD indicator for Accelerated Growth in Reading and Math.
Closing Performance Gaps
All subjects; Economically Disadvantaged Students and up to 7 racial/ethnic groups Economically Disadvantaged Students: 85% will score Approaching Grade Level Standards 35% will score Mastering Grade Level Standards Racial/Ethnic Group: African American: 95% will score Approaching Grade Level Standards 35% will score Mastering Grade Level Standards Racial/Ethnic Group: Hispanic: 90% will score Approaching Grade Level Standards 45% will score Mastering Grade Level Standards
Distinctions: Will meet Top 25% Closing Performance gaps Distinction in Reading/ELA and Math.
Post‐Secondary Readiness Increase Attendance Rate from 96.4% to 97.3%
GOAL 2: Recruitment, Development, and Retention of Staff
Objective: To recruit, retain, and develop highly qualified teachers and staff for all students.
GOAL 3: Parents and Community
Objective: To will work jointly with parents and the community to maximize learning for all students through two-way communication, collaborative partnerships, and unity of purpose.
GOAL 4: Safe Schools
Objective: To provide a safe and orderly school environment conducive to learning for all students and staff.
GOAL 5: Technology
Objective: To ensure that all students and staff utilize technology to maximize learning for all students and to enhance the educational practices of teachers.
192

Knox Junior High School2018-2019 General Fund Budget
Payroll cost: By position
Budgeted Staff Actual Amended Budget Projected Proposed Budget % of
2017-18 2018-19 2016-2017 2017-2018 2017-2018 2018-2019 Total
3.0 3.0 Administrators 346,280$ 369,308$ 348,328$ 354,200$ 4.44%
13.0 13.0 Paraprofessionals / Aides 439,641 471,002 451,301 459,008 5.76%
2.0 2.0 Counselors 141,471 152,511 150,033 144,600 1.81%
1.0 1.0 Librarians 61,611 60,513 61,703 63,367 0.79%
1.0 1.0 Nurses 58,324 59,128 54,043 54,250 0.68%
73.5 77.0 Teachers 4,784,742 5,004,280 4,900,636 5,136,192 64.41%
93.5 97.0 5,832,069 6,116,742 5,966,044 6,211,617 77.89%
Payroll related and benefits costs: 1,072,917 1,141,240 1,164,716 1,149,586 14.42%
Non-payroll cost: By functional area
11 Instruction 113,690 234,494 212,406 157,404 1.97%
12 Instructional Resources 16,797 18,000 17,846 19,113 0.24%
13 Curriculum & Instruction 470 - - - 0.00%
23 School Leadership 11,475 11,830 11,690 14,850 0.19%
31 Guidance, Counseling & Eval. 6,009 6,525 5,883 1,781 0.02%
33 Health Services 1,640 1,750 1,638 1,400 0.02%
36 Co-curricular Activities 93,705 74,415 71,800 87,494 1.10%
51 Plant Maintenance & Operations 238,510 296,458 282,286 331,517 4.16%
482,296 643,472 603,549 613,559 7.69%
Total Annual Operating Budget 7,387,282$ 7,901,454$ 7,734,309$ 7,974,762$ 100.00%
Enrollment 1,370 1,388 1,415 1,442
Total Annual Operating Cost per Student 5,392.18$ 5,692.69$ 5,465.94$ 5,530.35$ 1.18%
***Note: For STAAR Testing Results, please refer to the Texas Education Agency 2018 Accountability Summaries by campus located in the
Information Section under Performance Measures.
193

York Junior High School Campus Goals & Objectives
Brian Lee, Principal
GOAL 1: Student Achievement and Post-Secondary Success Master rigorous academic standards – Student Achievement, Student Progress, and Closing
Performance Gaps
Student Achievement Objective
All subjects; all students 90% of all students combined over all subject areas approaching Grade Level Standards; 65% meeting Grade Level Standards; and 40% mastering Grade Level Standards.
Distinctions: Will meet AADD indicator for performance (Mastering Grade Level) in Reading/ELA, Writing, Math, Grade 8 Science, and Grade 8 Social Studies. Reading and Math: will meet AADD indicators for performance and participation in Algebra I.
Student Progress Objective
Reading, Math; all students, 7 racial/ethnic groups, ELL, Sp Ed; weighted progress –
All Students/All Subjects 75% of students who will meet Expected or Accelerated Growth measures. 30% of students who will meet Accelerated Growth measures only.
Distinctions: 1. Will meet Top 25% Student Progress Distinction in Reading/ELA and Math.
2. Will meet AADD indicator for Accelerated Growth in Reading and Math.
Closing Performance Gaps
All subjects; Economically Disadvantaged Students and up to 7 racial/ethnic groups Economically Disadvantaged Students: 85% will score Approaching Grade Level Standards 25% will score Mastering Grade Level Standards Racial/Ethnic Group: African American: 80% will score Approaching Grade Level Standards 25% will score Mastering Grade Level Standards Racial/Ethnic Group: Hispanic: 90% will score Approaching Grade Level Standards 30% will score Mastering Grade Level Standards
Distinctions: Will meet Top 25% Closing Performance gaps Distinction in Reading/ELA and Math.
Post‐Secondary Readiness Increase Attendance Rate from 97% to 97.3%
GOAL 2: Recruitment, Development, and Retention of Staff
Objective: To recruit, retain, and develop highly qualified teachers and staff for all students.
GOAL 3: Parents and Community
Objective: To will work jointly with parents and the community to maximize learning for all students through two-way communication, collaborative partnerships, and unity of purpose.
GOAL 4: Safe Schools
Objective: To provide a safe and orderly school environment conducive to learning for all students and staff.
GOAL 5: Technology
Objective: To ensure that all students and staff utilize technology to maximize learning for all students and to enhance the educational practices of teachers.
194

York Junior High School2018-2019 General Fund Budget
Payroll cost: By position
Budgeted Staff Actual Amended Budget Projected Proposed Budget % of
2017-18 2018-19 2016-2017 2017-2018 2017-2018 2018-2019 Total
2.0 3.0 Administrators 265,420$ 287,775$ 250,258$ 350,450$ 4.53%
9.0 9.0 Paraprofessionals / Aides 392,465 428,656 405,641 423,837 5.48%
2.0 2.0 Counselors 131,911 141,987 134,950 134,670 1.74%
1.0 1.0 Librarians 60,500 59,624 60,513 62,357 0.81%
1.0 1.0 Nurses 53,936 53,684 54,309 54,860 0.71%
70.1 75.1 Teachers 4,297,542 4,672,428 4,618,547 5,006,090 64.76%
85.1 91.1 5,201,774 5,644,154 5,524,218 6,032,264 78.04%
Payroll related and benefits costs: 986,454 1,092,325 1,080,732 1,107,146 14.32%
Non-payroll cost: By functional area
11 Instruction 139,574 228,858 212,828 178,059 2.30%
12 Instructional Resources 17,957 20,616 18,660 20,594 0.27%
13 Curriculum & Instruction 60 - - - 0.00%
23 School Leadership 3,226 3,150 1,783 5,776 0.07%
31 Guidance, Counseling & Eval. 6,963 8,203 7,874 2,687 0.03%
33 Health Services 556 600 589 600 0.01%
36 Co-curricular Activities 59,917 67,581 68,424 84,842 1.10%
51 Plant Maintenance & Operations 246,676 259,954 245,829 297,852 3.85%
474,929 588,962 555,987 590,410 7.64%
Total Annual Operating Budget 6,663,157$ 7,325,441$ 7,160,937$ 7,729,820$ 100.00%
Enrollment 1,223 1,348 1,379 1,438
Total Annual Operating Cost per Student 5,448.21$ 5,434.30$ 5,192.85$ 5,375.40$ 3.52%
***Note: For STAAR Testing Results, please refer to the Texas Education Agency 2018 Accountability Summaries by campus located in the
Information Section under Performance Measures.
195

Moorhead Junior High School Campus Goals & Objectives
Roberto Garcia, Principal
GOAL 1: Student Achievement and Post-Secondary Success Master rigorous academic standards – Student Achievement, Student Progress, and Closing
Performance Gaps
Student Achievement Objective
All subjects; all students 80% of all students combined over all subject areas approaching Grade Level Standards; 40% meeting Grade Level Standards; and 20% mastering Grade Level Standards.
Distinctions: Will meet AADD indicator for performance (Mastering Grade Level) in Reading/ELA, Writing, Math, Grade 8 Science, and Grade 8 Social Studies. Reading and Math: will meet AADD indicators for performance and participation in Algebra I.
Student Progress Objective
Reading, Math; all students, 7 racial/ethnic groups, ELL, Sp Ed; weighted progress –
All Students/All Subjects 80% of students who will meet Expected or Accelerated Growth measures. 25% of students who will meet Accelerated Growth measures only.
Distinctions: 1. Will meet Top 25% Student Progress Distinction in Reading/ELA and Math.
2. Will meet AADD indicator for Accelerated Growth in Reading and Math.
Closing Performance Gaps
All subjects; Economically Disadvantaged Students and up to 7 racial/ethnic groups Economically Disadvantaged Students: 75% will score Approaching Grade Level Standards 15% will score Mastering Grade Level Standards Racial/Ethnic Group: Hispanic: 80% will score Approaching Grade Level Standards 20% will score Mastering Grade Level Standards
Distinctions: Will meet Top 25% Closing Performance gaps Distinction in Reading/ELA and Math.
Post‐Secondary Readiness Increase Attendance Rate from 96% to 97%
GOAL 2: Recruitment, Development, and Retention of Staff
Objective: To recruit, retain, and develop highly qualified teachers and staff for all students.
GOAL 3: Parents and Community
Objective: To will work jointly with parents and the community to maximize learning for all students through two-way communication, collaborative partnerships, and unity of purpose.
GOAL 4: Safe Schools
Objective: To provide a safe and orderly school environment conducive to learning for all students and staff.
GOAL 5: Technology
Objective: To ensure that all students and staff utilize technology to maximize learning for all students and to enhance the educational practices of teachers.
196

Moorhead Junior High School2018-2019 General Fund Budget
Payroll cost: By position
Budgeted Staff Actual Amended Budget Projected Proposed Budget % of
2017-18 2018-19 2016-2017 2017-2018 2017-2018 2018-2019 Total
4.0 4.0 Administrators 346,667$ 364,180$ 342,750$ 347,370$ 4.30%
16.0 15.0 Paraprofessionals / Aides 505,812 503,371 519,360 511,231 6.32%
2.0 2.0 Counselors 206,697 217,768 209,933 215,500 2.66%
1.0 1.0 Librarians 68,447 67,988 68,674 71,707 0.89%
1.0 1.0 Nurses 56,248 56,636 53,830 54,250 0.67%
70.0 71.0 Teachers 4,770,926 4,845,792 4,877,407 5,053,399 62.48%
94.0 94.0 5,954,797 6,055,735 6,071,954 6,253,457 77.32%
Payroll related and benefits costs: 1,156,236 1,216,674 1,296,305 1,227,259 15.17%
Non-payroll cost: By functional area
11 Instruction 133,917 242,879 208,370 194,935 2.41%
12 Instructional Resources 10,318 10,540 10,081 10,300 0.13%
23 School Leadership 3,806 3,550 3,397 4,524 0.06%
31 Guidance, Counseling & Eval. 5,887 6,537 5,745 1,356 0.02%
33 Health Services 2,122 2,447 2,259 2,400 0.03%
36 Co-curricular Activities 64,860 73,281 69,693 90,098 1.11%
51 Plant Maintenance & Operations 258,802 244,127 247,361 303,317 3.75%
479,712 583,361 546,906 606,930 7.50%
Total Annual Operating Budget 7,590,745$ 7,855,770$ 7,915,165$ 8,087,646$ 100.00%
Enrollment 1,037 1,091 1,102 1,128
Total Annual Operating Cost per Student 7,319.91$ 7,200.52$ 7,182.55$ 7,169.90$ -0.18%
***Note: For STAAR Testing Results, please refer to the Texas Education Agency 2018 Accountability Summaries by campus located in the
Information Section under Performance Measures.
197

McCullough Junior High School Campus Goals & Objectives
Chris McCord, Principal
GOAL 1: Student Achievement and Post-Secondary Success Master rigorous academic standards – Student Achievement, Student Progress, and Closing
Performance Gaps
Student Achievement Objective
All subjects; all students 96% of all students combined over all subject areas approaching Grade Level Standards; 80% meeting Grade Level Standards; and 50% mastering Grade Level Standards.
Distinctions: Will meet AADD indicator for performance (Mastering Grade Level) in Reading/ELA, Writing, Math, Grade 8 Science, and Grade 8 Social Studies. Reading and Math: will meet AADD indicators for performance and participation in Algebra I.
Student Progress Objective
Reading, Math; all students, 7 racial/ethnic groups, ELL, Sp Ed; weighted progress –
All Students/All Subjects 75% of students who will meet Expected or Accelerated Growth measures. 33% of students who will meet Accelerated Growth measures only.
Distinctions: 1. Will meet Top 25% Student Progress Distinction in Reading/ELA and Math.
2. Will meet AADD indicator for Accelerated Growth in Reading and Math.
Closing Performance Gaps
All subjects; Economically Disadvantaged Students and up to 7 racial/ethnic groups Economically Disadvantaged Students: 87% will score Approaching Grade Level Standards 43% will score Mastering Grade Level Standards Racial/Ethnic Group: African American: 80% will score Approaching Grade Level Standards 20% will score Mastering Grade Level Standards
Distinctions: Will meet Top 25% Closing Performance gaps Distinction in Reading/ELA and Math.
Post‐Secondary Readiness Increase Attendance Rate from 97.4% to 97.5%
GOAL 2: Recruitment, Development, and Retention of Staff
Objective: To recruit, retain, and develop highly qualified teachers and staff for all students.
GOAL 3: Parents and Community
Objective: To will work jointly with parents and the community to maximize learning for all students through two-way communication, collaborative partnerships, and unity of purpose.
GOAL 4: Safe Schools
Objective: To provide a safe and orderly school environment conducive to learning for all students and staff.
GOAL 5: Technology
Objective: To ensure that all students and staff utilize technology to maximize learning for all students and to enhance the educational practices of teachers.
198

McCullough Junior High School2018-2019 General Fund Budget
Payroll cost: By position
Budgeted Staff Actual Amended Budget Projected Proposed Budget % of
2017-18 2018-19 2016-2017 2017-2018 2017-2018 2018-2019 Total
6.0 6.0 Administrators 386,702$ 474,254$ 451,077$ 452,160$ 3.89%
17.0 16.0 Paraprofessionals / Aides 619,217 587,899 591,524 587,022 5.05%
4.0 4.0 Counselors 284,454 301,418 294,400 289,850 2.49%
1.0 1.0 Librarians 63,950 57,140 64,081 60,896 0.52%
1.0 1.0 Nurses 59,176 59,572 60,427 60,310 0.52%
115.5 112.5 Teachers 7,602,590 7,730,591 7,625,611 7,623,688 65.59%
144.5 140.5 9,016,089 9,210,874 9,087,120 9,073,926 78.07%
Payroll related and benefits costs: 1,703,145 1,811,772 1,899,183 1,760,223 15.14%
Non-payroll cost: By functional area
11 Instruction 181,364 252,885 230,614 214,911 1.85%
12 Instructional Resources 32,582 35,350 33,073 31,855 0.27%
13 Curriculum & Instruction 3,720 - - - 0.00%
23 School Leadership 5,725 9,022 8,969 10,548 0.09%
31 Guidance, Counseling & Eval. 9,199 10,709 9,750 1,230 0.01%
33 Health Services 1,589 2,300 2,258 1,500 0.01%
36 Co-curricular Activities 95,891 105,431 95,031 130,414 1.12%
51 Plant Maintenance & Operations 379,591 364,745 343,739 398,083 3.43%
53 Data Processing 2,581 - - - 0.00%
712,242 780,442 723,434 788,541 6.78%
Total Annual Operating Budget 11,431,476$ 11,803,088$ 11,709,737$ 11,622,690$ 100.00%
Enrollment 2,232 2,258 2,208 2,143
Total Annual Operating Cost per Student 5,121.63$ 5,227.23$ 5,303.32$ 5,423.56$ 2.27%
***Note: For STAAR Testing Results, please refer to the Texas Education Agency 2018 Accountability Summaries by campus located in the
Information Section under Performance Measures.
199

Irons Junior High School Campus Goals & Objectives
Jeff Fuller, Principal
GOAL 1: Student Achievement and Post-Secondary Success Master rigorous academic standards – Student Achievement, Student Progress, and Closing
Performance Gaps
Student Achievement Objective
All subjects; all students 92% of all students combined over all subject areas approaching Grade Level Standards; 70% meeting Grade Level Standards; and 35% mastering Grade Level Standards
Distinctions: Will meet AADD indicator for performance (Mastering Grade Level) in Reading/ELA, Writing, Math, Grade 8 Science, and Grade 8 Social Studies. Reading and Math: will meet AADD indicators for performance and participation in Algebra I.
Student Progress Objective
Reading, Math; all students, 7 racial/ethnic groups, ELL, Sp Ed; weighted progress –
All Students/All Subjects 80% of students who will meet Expected or Accelerated Growth measures. 30% of students who will meet Accelerated Growth measures only.
Distinctions: 1. Will meet Top 25% Student Progress Distinction in Reading/ELA and Math.
2. Will meet AADD indicator for Accelerated Growth in Reading and Math.
Closing Performance Gaps
All subjects; Economically Disadvantaged Students and up to 7 racial/ethnic groups Economically Disadvantaged Students: 85% will score Approaching Grade Level Standards 25% will score Mastering Grade Level Standards Racial/Ethnic Group: African American: 81% will score Approaching Grade Level Standards 23% will score Mastering Grade Level Standards Racial/Ethnic Group: Hispanic: 88% will score Approaching Grade Level Standards 28% will score Mastering Grade Level Standards
Distinctions: Will meet Top 25% Closing Performance gaps Distinction in Reading/ELA and Math.
Post‐Secondary Readiness Increase Attendance Rate from 96% to 97%
GOAL 2: Recruitment, Development, and Retention of Staff
Objective: To recruit, retain, and develop highly qualified teachers and staff for all students.
GOAL 3: Parents and Community
Objective: To will work jointly with parents and the community to maximize learning for all students through two-way communication, collaborative partnerships, and unity of purpose.
GOAL 4: Safe Schools
Objective: To provide a safe and orderly school environment conducive to learning for all students and staff.
GOAL 5: Technology
Objective: To ensure that all students and staff utilize technology to maximize learning for all students and to enhance the educational practices of teachers.
200

Irons Junior High School2018-2019 General Fund Budget
Payroll cost: By position
Budgeted Staff Actual Amended Budget Projected Proposed Budget % of
2017-18 2018-19 2016-2017 2017-2018 2017-2018 2018-2019 Total
3.0 3.0 Administrators 266,713$ 288,449$ 270,357$ 274,150$ 3.96%
13.0 12.0 Paraprofessionals / Aides 432,641 471,593 393,597 375,528 5.42%
3.0 3.0 Counselors 136,637 146,639 141,197 140,100 2.02%
1.0 1.0 Librarians 64,249 64,320 64,757 66,987 0.97%
1.0 1.0 Nurses 53,676 53,684 53,246 54,860 0.79%
65.0 66.5 Teachers 4,374,182 4,444,409 4,244,052 4,458,416 64.33%
86.0 86.5 5,328,098 5,469,094 5,167,206 5,370,041 77.49%
Payroll related and benefits costs: 1,021,507 1,071,544 1,068,022 1,018,332 14.69%
Non-payroll cost: By functional area
11 Instruction 139,737 191,532 172,571 149,647 2.16%
12 Instructional Resources 15,373 17,633 15,973 17,945 0.26%
13 Curriculum & Instruction 60 - - - 0.00%
23 School Leadership 3,921 2,763 1,875 3,248 0.05%
31 Guidance, Counseling & Eval. 5,898 6,937 5,824 2,181 0.03%
33 Health Services 2,058 2,900 2,579 2,900 0.04%
36 Co-curricular Activities 56,344 61,193 57,517 91,520 1.32%
51 Plant Maintenance & Operations 216,983 241,362 239,419 274,461 3.96%
440,374 524,320 495,758 541,902 7.82%
Total Annual Operating Budget 6,789,979$ 7,064,958$ 6,730,986$ 6,930,275$ 100.00%
Enrollment 1,120 1,105 1,088 1,142
Total Annual Operating Cost per Student 6,062.48$ 6,393.63$ 6,186.57$ 6,068.54$ -1.91%
***Note: For STAAR Testing Results, please refer to the Texas Education Agency 2018 Accountability Summaries by campus located in the
Information Section under Performance Measures.
201

Conroe High School Campus Goals & Objectives
Rotasha Smith, Principal
GOAL 1: Student Achievement and Post-Secondary Success Master rigorous academic standards – Student Achievement, Student Progress, and Closing
Performance Gaps
Student Achievement Objective
All subjects; all students 82% of all students combined over all subject areas approaching Grade Level Standards; 57% student meeting Grade Level Standards; and 17% mastering Grade Level Standards.
Distinctions: Will meet AADD indicator for performance in End of course English I, English II, Algebra I, Biology, and US History. Reading and Math: will meet AADD indicators for performance and participation in SAT, ACT, and AP. Science will meet AADD indicators for performance and participation in ACT and AP. Social Studies will meet AADD indicators for performance and participation in AP.
Student Progress Objective
Reading, Math; all students, 7 racial/ethnic groups, ELL, Sp Ed; weighted progress –
All Students/All Subjects 57% of students who will meet Expected or Accelerated Growth measures. 13% of students who will meet Accelerated Growth measures only.
Distinctions: 1. Will meet Top 25% Student Progress Distinction in ELA and Math.
2. Will meet indicator for Accelerated Growth in ELA and Math.
Closing Performance Gaps
All subjects; Economically Disadvantaged Students and up to 7 racial/ethnic groups Economically Disadvantaged Students: 77% will score Approaching Grade Level Standards 17% will score Mastering Grade Level Standards Racial/Ethnic Group: African American: 72% will score Approaching Grade Level Standards 13% will score Mastering Grade Level Standards Racial/Ethnic Group: Hispanic: 78% will score Approaching Grade Level Standards 17% will score Mastering Grade Level Standards
Distinctions: Will meet Top 25% Closing Performance gaps Distinction in ELA and Math.
Post‐Secondary Readiness Increase Attendance Rate from 95% to 95.5%
GOAL 2: Recruitment, Development, and Retention of Staff
Objective: To recruit, retain, and develop highly qualified teachers and staff for all students.
GOAL 3: Parents and Community
Objective: To will work jointly with parents and the community to maximize learning for all students through two-way communication, collaborative partnerships, and unity of purpose.
GOAL 4: Safe Schools
Objective: To provide a safe and orderly school environment conducive to learning for all students and staff.
GOAL 5: Technology
Objective: To ensure that all students and staff utilize technology to maximize learning for all students and to enhance the educational practices of teachers.
202

Conroe High School2018-2019 General Fund Budget
Payroll cost: By position
Budgeted Staff Actual Amended Budget Projected Proposed Budget % of
2017-18 2018-19 2016-2017 2017-2018 2017-2018 2018-2019 Total
12.5 12.5 Administrators 1,207,962$ 1,288,708$ 1,228,994$ 1,251,780$ 4.60%
50.5 49.5 Paraprofessionals / Aides 1,414,232 1,475,722 1,439,007 1,497,084 5.50%
14.4 14.4 Counselors 893,678 999,402 921,509 916,100 3.37%
3.0 3.0 Librarians 132,069 132,062 138,198 143,520 0.53%
3.0 3.0 Nurses 132,948 113,778 115,016 116,090 0.43%
235.5 241.0 Teachers 15,127,035 15,963,994 14,574,802 16,518,940 60.72%
318.9 323.4 18,907,924 19,973,666 18,417,526 20,443,514 75.15%
Payroll related and benefits costs: 3,632,932 3,919,726 3,765,434 3,845,154 14.13%
Non-payroll cost: By functional area
11 Instruction 1,117,787 885,544 841,497 899,547 3.31%
12 Instructional Resources 21,354 19,481 15,410 23,891 0.09%
13 Curriculum & Instruction 13,477 14,029 13,951 52,575 0.19%
23 School Leadership 57,890 76,491 72,163 33,852 0.12%
31 Guidance, Counseling & Eval. 26,808 33,590 33,182 60,798 0.22%
32 Social Work 3,978 4,250 3,781 4,000 0.01%
33 Health Services 1,228 1,299 1,299 1,300 0.00%
36 Co-curricular Activities 585,623 958,165 674,270 653,847 2.40%
51 Plant Maintenance & Operations 1,090,878 1,305,611 1,116,938 1,184,631 4.35%
81 Facilities Acquisition & Const. 18,500 100,000 - - 0.00%
2,937,523 3,398,460 2,772,491 2,914,441 10.71%
Total Annual Operating Budget 25,478,379$ 27,291,852$ 24,955,451$ 27,203,109$ 100.00%
Enrollment 3,400 3,641 3,565 3,691
Total Annual Operating Cost per Student 7,493.64$ 7,495.70$ 7,000.13$ 7,370.12$ 5.29%
***Note: For STAAR Testing Results, please refer to the Texas Education Agency 2018 Accountability Summaries by campus located in the
Information Section under Performance Measures.
203
Hauke Academic Alternative High School Campus Goals & Objectives
Dr. John Williams, Principal
GOAL 1: Student Achievement and Post-Secondary Success Master rigorous academic standards – Student Achievement, Student Progress, and Closing
Performance Gaps
Student Achievement Objective
All subjects; all students 66% of all students combined over all subject areas approaching Grade Level Standards; 45% student meeting Grade Level Standards; and 10% mastering Grade Level Standards.
Distinctions: Will meet AADD indicator for performance in End of course English I, English II, Algebra I, Biology, and US History. Reading and Math: will meet AADD indicators for performance and participation in SAT, ACT, and AP. Science will meet AADD indicators for performance and participation in ACT and AP. Social Studies will meet AADD indicators for performance and participation in AP.
Student Progress Objective
Reading, Math; all students, 7 racial/ethnic groups, ELL, Sp Ed; weighted progress –
All Students/All Subjects 40% of students who will meet Expected Growth measures.
Closing Performance Gaps
All subjects; Economically Disadvantaged Students and up to 7 racial/ethnic groups Economically Disadvantaged Students: 40% will score Approaching Grade Level Standards 10% will score Mastering Grade Level Standards Racial/Ethnic Group: African American: 45% will score Approaching Grade Level Standards 5% will score Mastering Grade Level Standards Racial/Ethnic Group: Hispanic: 60% will score Approaching Grade Level Standards 5% will score Mastering Grade Level Standards
Post‐Secondary Readiness Increase Attendance Rate from 92% to 96%
GOAL 2: Recruitment, Development, and Retention of Staff
Objective: To recruit, retain, and develop highly qualified teachers and staff for all students.
GOAL 3: Parents and Community
Objective: To will work jointly with parents and the community to maximize learning for all students through two-way communication, collaborative partnerships, and unity of purpose.
GOAL 4: Safe Schools
Objective: To provide a safe and orderly school environment conducive to learning for all students and staff.
GOAL 5: Technology
Objective: To ensure that all students and staff utilize technology to maximize learning for all students and to enhance the educational practices of teachers.
204

Hauke Academic Alternative High School2018-2019 General Fund Budget
Payroll cost: By position
Budgeted Staff Actual Amended Budget Projected Proposed Budget % of
2017-18 2018-19 2016-2017 2017-2018 2017-2018 2018-2019 Total
2.0 2.0 Administrators 109,345$ 117,423$ 110,468$ 113,130$ 4.92%
3.0 3.0 Paraprofessionals / Aides 86,177 69,962 95,891 72,449 3.15%
2.5 2.5 Counselors 73,042 76,021 73,335 74,310 3.23%
1.0 1.0 Librarians 57,207 56,727 58,049 58,400 2.54%
1.4 1.4 Nurses 56,256 56,692 42,235 - 0.00%
17.4 17.4 Teachers 1,343,521 1,400,703 1,382,686 1,422,251 61.80%
27.3 27.3 1,725,548 1,777,528 1,762,664 1,740,540 75.63%
Payroll related and benefits costs: 324,680 343,052 355,498 328,275 14.26%
Non-payroll cost: By functional area
11 Instruction 75,386 84,084 70,423 117,272 5.10%
12 Instructional Resources 2,065 1,350 1,070 1,433 0.06%
13 Curriculum & Instruction 60 - - - 0.00%
23 School Leadership 2,002 500 427 580 0.03%
31 Guidance, Counseling & Eval. 455 987 128 737 0.03%
33 Health Services 184 200 113 200 0.01%
51 Plant Maintenance & Operations 86,288 104,332 97,829 112,364 4.88%
81 Facilities Acquisition & Const. 2,500 126 126 - 0.00%
168,940 191,579 170,116 232,586 10.11%
Total Annual Operating Budget 2,219,168$ 2,312,159$ 2,288,278$ 2,301,401$ 100.00%
Enrollment 138 138 142 142
Total Annual Operating Cost per Student 16,080.93$ 16,754.78$ 16,114.63$ 16,207.05$ 0.57%
***Note: For STAAR Testing Results, please refer to the Texas Education Agency 2018 Accountability Summaries by campus located in the
Information Section under Performance Measures.
205

The Woodlands High School Campus Goals & Objectives
Dr. Ted Landry, Principal
GOAL 1: Student Achievement and Post-Secondary Success Master rigorous academic standards – Student Achievement, Student Progress, and Closing
Performance Gaps
Student Achievement Objective
All subjects; all students 97% of all students combined over all subject areas approaching Grade Level Standards
Distinctions: Will meet AADD indicator for performance in End of course English I, English II, Algebra I, Biology, and US History. Reading and Math: will meet AADD indicators for performance and participation in SAT, ACT, AP, and Algebra 1. Science will meet AADD indicators for performance and participation in ACT and AP. Social Studies will meet AADD indicators for performance and participation in AP.
Student Progress Objective
Reading, Math; all students, 7 racial/ethnic groups, ELL, Sp Ed; weighted progress –
All Students/All Subjects 75% of students who will meet Expected or Accelerated Growth measures. 15% of students who will meet Accelerated Growth measures only.
Distinctions: 1. Will meet Top 25% Student Progress Distinction in ELA and Math.
2. Will meet indicator for Accelerated Growth in ELA and Math.
Closing Performance Gaps
All subjects; Economically Disadvantaged Students and up to 7 racial/ethnic groups Economically Disadvantaged Students: 88% will score Approaching Grade Level Standards 25% will score Mastering Grade Level Standards Racial/Ethnic Group: African American: 94% will score Approaching Grade Level Standards 23% will score Mastering Grade Level Standards Racial/Ethnic Group: Hispanic: 95% will score Approaching Grade Level Standards 42% will score Mastering Grade Level Standards
Distinctions: Will meet Top 25% Closing Performance gaps Distinction in ELA and Math.
Post‐Secondary Readiness Increase Attendance Rate from 96.5% to 98%
GOAL 2: Recruitment, Development, and Retention of Staff
Objective: To recruit, retain, and develop highly qualified teachers and staff for all students.
GOAL 3: Parents and Community
Objective: To will work jointly with parents and the community to maximize learning for all students through two-way communication, collaborative partnerships, and unity of purpose.
GOAL 4: Safe Schools
Objective: To provide a safe and orderly school environment conducive to learning for all students and staff.
GOAL 5: Technology
Objective: To ensure that all students and staff utilize technology to maximize learning for all students and to enhance the educational practices of teachers.
206

The Woodlands High School2018-2019 General Fund Budget
Payroll cost: By position
Budgeted Staff Actual Amended Budget Projected Proposed Budget % of
2017-18 2018-19 2016-2017 2017-2018 2017-2018 2018-2019 Total
13.0 13.0 Administrators 1,281,691$ 1,331,716$ 1,228,769$ 1,187,650$ 4.50%
52.7 53.7 Paraprofessionals / Aides 1,215,280 1,269,740 1,235,382 1,320,409 5.00%
18.1 18.1 Counselors 1,002,242 1,041,920 984,847 945,410 3.58%
3.0 3.0 Librarians 192,386 195,375 192,710 201,190 0.76%
2.0 2.0 Nurses 110,949 108,400 111,813 112,540 0.43%
234.2 234.2 Teachers 15,761,054 16,341,700 15,882,545 16,288,164 61.71%
323.0 324.0 19,563,602 20,288,851 19,636,066 20,055,363 75.98%
Payroll related and benefits costs: 3,563,080 3,739,767 3,863,934 3,640,184 13.79%
Non-payroll cost: By functional area
11 Instruction 995,307 846,697 805,658 692,584 2.62%
12 Instructional Resources 62,005 66,487 62,170 66,364 0.25%
13 Curriculum & Instruction 10,677 7,293 7,293 14,000 0.05%
23 School Leadership 46,451 31,146 23,795 18,562 0.07%
31 Guidance, Counseling & Eval. 28,199 38,679 36,738 5,611 0.02%
33 Health Services 1,299 1,305 1,303 1,300 0.00%
36 Co-curricular Activities 1,094,670 1,032,459 961,503 762,641 2.89%
51 Plant Maintenance & Operations 1,061,518 1,096,440 916,591 1,139,817 4.32%
81 Facilities Acquisition & Const. 11,429 23,965 15,338 - 0.00%
3,311,555 3,144,471 2,830,389 2,700,879 10.23%
Total Annual Operating Budget 26,438,237$ 27,173,089$ 26,330,389$ 26,396,426$ 100.00%
Enrollment 4,410 4,461 4,336 4,348
Total Annual Operating Cost per Student 5,995.07$ 6,091.26$ 6,072.51$ 6,070.94$ -0.03%
***Note: For STAAR Testing Results, please refer to the Texas Education Agency 2018 Accountability Summaries by campus located in the
Information Section under Performance Measures.
207

Oak Ridge High School Campus Goals & Objectives
Tommy Johnson, Principal
GOAL 1: Student Achievement and Post-Secondary Success Master rigorous academic standards – Student Achievement, Student Progress, and Closing
Performance Gaps
Student Achievement Objective
All subjects; all students 95% of all students combined over all subject areas approaching Grade Level Standards; 85% student meeting Grade Level Standards; and 34% mastering Grade Level Standards.
Distinctions: Will meet AADD indicator for performance in End of course English I, English II, Algebra I, Biology, and US History. Reading and Math: will meet AADD indicators for performance and participation in SAT, ACT, AP, Algebra 1. Science will meet AADD indicators for performance and participation in ACT and AP. Social Studies will meet AADD indicators for performance and participation in AP.
Student Progress Objective
Reading, Math; all students, 7 racial/ethnic groups, ELL, Sp Ed; weighted progress –
All Students/All Subjects 68% of students who will meet Expected or Accelerated Growth measures. 20% of students who will meet Accelerated Growth measures only.
Distinctions: 1. Will meet Top 25% Student Progress Distinction in ELA and Math.
2. Will meet indicator for Accelerated Growth in ELA and Math.
Closing Performance Gaps
All subjects; Economically Disadvantaged Students and up to 7 racial/ethnic groups Economically Disadvantaged Students: 86% will score Approaching Grade Level Standards 25% will score Mastering Grade Level Standards Racial/Ethnic Group: Hispanic: 91% will score Approaching Grade Level Standards 30% will score Mastering Grade Level Standards Racial/Ethnic Group: Two or More: 91% will score Approaching Grade Level Standards 30% will score Mastering Grade Level Standards
Distinctions: Will meet Top 25% Closing Performance gaps Distinction in ELA and Math.
Post‐Secondary Readiness Increase Attendance Rate from 95.5% to 96.5%
GOAL 2: Recruitment, Development, and Retention of Staff
Objective: To recruit, retain, and develop highly qualified teachers and staff for all students.
GOAL 3: Parents and Community
Objective: To will work jointly with parents and the community to maximize learning for all students through two-way communication, collaborative partnerships, and unity of purpose.
GOAL 4: Safe Schools
Objective: To provide a safe and orderly school environment conducive to learning for all students and staff.
GOAL 5: Technology
Objective: To ensure that all students and staff utilize technology to maximize learning for all students and to enhance the educational practices of teachers.
208

Oak Ridge High School2018-2019 General Fund Budget
Payroll cost: By position
Budgeted Staff Actual Amended Budget Projected Proposed Budget % of
2017-18 2018-19 2016-2017 2017-2018 2017-2018 2018-2019 Total
13.0 11.0 Administrators 1,205,030$ 1,292,099$ 1,182,009$ 971,930$ 4.22%
51.8 48.8 Paraprofessionals / Aides 1,430,929 1,450,063 1,423,587 1,396,465 6.07%
15.5 13.5 Counselors 871,875 948,956 902,168 797,080 3.46%
3.0 3.0 Librarians 128,847 125,988 129,074 133,803 0.58%
2.0 2.0 Nurses 127,001 126,436 124,776 129,460 0.56%
236.5 198.0 Teachers 14,843,758 15,918,877 15,488,529 14,106,872 61.31%
321.8 276.3 18,607,440 19,862,419 19,250,143 17,535,610 76.21%
Payroll related and benefits costs: 3,527,566 3,837,890 3,959,008 3,280,222 14.26%
Non-payroll cost: By functional area
11 Instruction 946,541 860,346 726,270 665,902 2.89%
12 Instructional Resources 36,039 46,065 39,297 45,449 0.20%
13 Curriculum & Instruction 60 10,000 - - 0.00%
23 School Leadership 26,148 19,294 18,897 18,292 0.08%
31 Guidance, Counseling & Eval. 29,076 35,779 33,985 7,511 0.03%
33 Health Services 1,300 1,300 735 1,300 0.01%
36 Co-curricular Activities 632,096 793,660 716,091 562,833 2.45%
51 Plant Maintenance & Operations 894,523 874,044 842,586 893,665 3.88%
53 Data Processing 8,995 - - - 0.00%
81 Facilities Acquisition & Const. - 1,920 - - 0.00%
2,574,778 2,642,408 2,377,861 2,194,952 9.54%
Total Annual Operating Budget 24,709,784$ 26,342,717$ 25,587,012$ 23,010,784$ 100.00%
Enrollment 4,133 4,398 4,415 3,483
Total Annual Operating Cost per Student 5,978.66$ 5,989.70$ 5,795.47$ 6,606.60$ 14.00%
***Note: For STAAR Testing Results, please refer to the Texas Education Agency 2018 Accountability Summaries by campus located in the
Information Section under Performance Measures.
209

Academy of Science and Technology Campus Goals
Dr. Susan Caffery, Headmaster
GOAL 1: Student Achievement and Post-Secondary Success Master rigorous academic standards – Student Achievement, Student Progress, and Closing
Performance Gaps
Student Achievement Objective
All subjects; all students 100% of all students combined over all subject areas approaching Grade Level Standards; 100% student meeting Grade Level Standards; and 100% mastering Grade Level Standards.
Distinctions: Will meet AADD indicator for performance in End of course English I, English II, Algebra I, Biology, and US History. Reading and Math: will meet AADD indicators for performance and participation in SAT, ACT, AP, and Algebra 1. Science will meet AADD indicators for performance and participation in ACT and AP. Social Studies will meet AADD indicators for performance and participation in AP.
Student Progress Objective
Reading, Math; all students, 7 racial/ethnic groups, ELL, Sp Ed; weighted progress –
All Students/All Subjects 100% of students who will meet Expected or Accelerated Growth measures. 100% of students who will meet Accelerated Growth measures only.
Distinctions: 1. Will meet Top 25% Student Progress Distinction in ELA and Math.
2. Will meet indicator for Accelerated Growth in ELA and Math.
Closing Performance Gaps
All subjects; Economically Disadvantaged Students and up to 7 racial/ethnic groups Economically Disadvantaged Students: 100% will score Approaching Grade Level Standards 100% will score Mastering Grade Level Standards Racial/Ethnic Group: African American: 100% will score Approaching Grade Level Standards 95% will score Mastering Grade Level Standards Racial/Ethnic Group: Hispanic: 100% will score Approaching Grade Level Standards 100% will score Mastering Grade Level Standards
Distinctions: Will meet Top 25% Closing Performance gaps Distinction in ELA and Math.
Post‐Secondary Readiness Increase Attendance Rate from 96.1% to 96.5%
GOAL 2: Recruitment, Development, and Retention of Staff
Objective: To recruit, retain, and develop highly qualified teachers and staff for all students.
GOAL 3: Parents and Community
Objective: To will work jointly with parents and the community to maximize learning for all students through two-way communication, collaborative partnerships, and unity of purpose.
GOAL 4: Safe Schools
Objective: To provide a safe and orderly school environment conducive to learning for all students and staff.
GOAL 5: Technology
Objective: To ensure that all students and staff utilize technology to maximize learning for all students and to enhance the educational practices of teachers.
210

Academy of Science and Technology2018-2019 General Fund Budget
Payroll cost: By position
Budgeted Staff Actual Amended Budget Projected Proposed Budget % of
2017-18 2018-19 2016-2017 2017-2018 2017-2018 2018-2019 Total
1.0 1.0 Administrators 104,059$ 109,096$ 106,626$ 108,460$ 13.19%
1.0 1.0 Paraprofessionals / Aides 32,605 35,764 37,835 38,384 4.67%
- - Counselors - - - - 0.00%
- - Librarians - - - - 0.00%
- - Nurses - - - - 0.00%
7.5 7.5 Teachers 508,132 509,892 494,618 509,565 61.95%
9.5 9.5 644,796 654,752 639,079 656,409 79.81%
Payroll related and benefits costs: 109,989 121,181 124,545 116,001 14.10%
Non-payroll cost: By functional area
11 Instruction 45,248 53,185 47,167 48,250 5.87%
23 School Leadership 767 800 176 928 0.11%
31 Guidance, Counseling & Eval. - 350 - 350 0.04%
36 Co-curricular Activities 32,148 24,820 25,148 - 0.00%
51 Plant Maintenance & Operations - - - 547 0.07%
78,163 79,155 72,491 50,075 6.09%
Total Annual Operating Budget 832,948$ 855,088$ 836,115$ 822,485$ 100.00%
Enrollment 284 285 282 273
Total Annual Operating Cost per Student 2,932.92$ 3,000.31$ 2,964.95$ 3,012.77$ 1.61%
*Note: The Academy of Science and Technology's STAAR results are included in the The Woodlands College Park High School's results.
211

Academy for Careers in Engineering and Science Campus Goals
Dr. Mike Papadimitriou, Headmaster
GOAL 1: Student Achievement and Post-Secondary Success Master rigorous academic standards – Student Achievement, Student Progress, and Closing
Performance Gaps
Student Achievement Objective
All subjects; all students 100% of all students combined over all subject areas approaching Grade Level Standards; 100% student meeting Grade Level Standards; and 100% mastering Grade Level Standards.
Distinctions: Will meet AADD indicator for performance in End of course English I, English II, Algebra I, Biology, and US History. Reading and Math: will meet AADD indicators for performance and participation in SAT, ACT, and AP. Science will meet AADD indicators for performance and participation in ACT and AP. Social Studies will meet AADD indicators for performance and participation in AP.
Student Progress Objective
Reading, Math; all students, 7 racial/ethnic groups, ELL, Sp Ed; weighted progress –
All Students/All Subjects 100% of students who will meet Expected or Accelerated Growth measures. 100% of students who will meet Accelerated Growth measures only.
Distinctions: 1. Will meet Top 25% Student Progress Distinction in ELA and Math.
2. Will meet indicator for Accelerated Growth in ELA and Math.
Closing Performance Gaps
All subjects; Economically Disadvantaged Students and up to 7 racial/ethnic groups Economically Disadvantaged Students: 100% will score Approaching Grade Level Standards 100% will score Mastering Grade Level Standards Focus: Special Education: 100% will score Approaching Grade Level Standards 100% will score Mastering Grade Level Standards Focus Group: ELL: 100% will score Approaching Grade Level Standards 100% will score Mastering Grade Level Standards
Distinctions: Will meet Top 25% Closing Performance gaps Distinction in ELA and Math.
Post‐Secondary Readiness Attendance Rate will be 96.2%
GOAL 2: Recruitment, Development, and Retention of Staff
Objective: To recruit, retain, and develop highly qualified teachers and staff for all students.
GOAL 3: Parents and Community
Objective: To will work jointly with parents and the community to maximize learning for all students through two-way communication, collaborative partnerships, and unity of purpose.
GOAL 4: Safe Schools
Objective: To provide a safe and orderly school environment conducive to learning for all students and staff.
GOAL 5: Technology
Objective: To ensure that all students and staff utilize technology to maximize learning for all students and to enhance the educational practices of teachers.
212

Academy for Careers in Engineering and Science2018-2019 General Fund Budget
Payroll cost: By position
Budgeted Staff Actual Amended Budget Projected Proposed Budget % of
2017-18 2018-19 2016-2017 2017-2018 2017-2018 2018-2019 Total
- 1.0 Administrators -$ -$ 20,952$ 62,150$ 16.73%
- 1.0 Paraprofessionals / Aides - - 9,217 36,250 9.76%
- - Counselors - - - - 0.00%
- - Librarians - - - - 0.00%
- - Nurses - - - - 0.00%
- 2.5 Teachers - 2,611 20,755 156,640 42.16%
- 4.5 - 2,611 50,924 255,040 68.65%
Payroll related and benefits costs: - 171 7,868 42,410 11.42%
Non-payroll cost: By functional area
11 Instruction - 78,259 50,199 45,053 12.13%
13 Curriculum & Instruction - - - 5,000 1.35%
23 School Leadership - 2,151 2,026 14,037 3.78%
36 Co-curricular Activities - - - 9,972 2.68%
51 Plant Maintenance & Operations - 21,923 15,682 - 0.00%
- 102,333 67,907 74,062 19.94%
Total Annual Operating Budget -$ 105,115$ 126,699$ 371,512$ 100.00%
Enrollment - - - 74
Total Annual Operating Cost per Student -$ -$ -$ 5,020.43$ 100.00%
*Note: The Academy for Careers in Engineering and Science's STAAR results are included in the Oak Ridge High School's results.
***Note: The Academy for Careers in Engineering and Science opened in the 2018-2019 school year.
213

Discipline Alternative Campus - DAEP / JJAEP Campus Goals & Objectives
Jeffery Eldridge, Principal
GOAL 1: Student Achievement and Post-Secondary Success Master rigorous academic standards – Student Achievement, Student Progress, and Closing
Performance Gaps
Student Achievement Objective
All subjects; all students n/a% of all students combined over all subject areas approaching Grade Level Standards
Distinctions: Will meet AADD indicator for performance in End of course English I, English II, Algebra I, Biology, and US History. Reading and Math: will meet AADD indicators for performance and participation in SAT, ACT, and AP. Science will meet AADD indicators for performance and participation in ACT and AP. Social Studies will meet AADD indicators for performance and participation in AP.
Student Progress Objective
Reading, Math; all students, 7 racial/ethnic groups, ELL, Sp Ed; weighted progress –
All Students/All Subjects n/a% of students who will meet Expected or Accelerated Growth measures. n/a% of students who will meet Accelerated Growth measures only.
Distinctions: 1. Will meet Top 25% Student Progress Distinction in ELA and Math.
2. Will meet indicator for Accelerated Growth in ELA and Math.
Closing Performance Gaps
All subjects; Economically Disadvantaged Students and up to 7 racial/ethnic groups Economically Disadvantaged Students: n/a% will score Approaching Grade Level Standards n/a% will score Mastering Grade Level Standards
Distinctions: Will meet Top 25% Closing Performance gaps Distinction in ELA and Math.
Post‐Secondary Readiness Increase Attendance Rate from n/a% to n/a%
GOAL 2: Recruitment, Development, and Retention of Staff
Objective: To recruit, retain, and develop highly qualified teachers and staff for all students.
GOAL 3: Parents and Community
Objective: To will work jointly with parents and the community to maximize learning for all students through two-way communication, collaborative partnerships, and unity of purpose.
GOAL 4: Safe Schools
Objective: To provide a safe and orderly school environment conducive to learning for all students and staff.
GOAL 5: Technology
Objective: To ensure that all students and staff utilize technology to maximize learning for all students and to enhance the educational practices of teachers.
214

Discipline Alternative Campus - DAEP/JJAEP2018-2019 General Fund Budget
Payroll cost: By position
Budgeted Staff Actual Amended Budget Projected Proposed Budget % of
2017-18 2018-19 2016-2017 2017-2018 2017-2018 2018-2019 Total
1.0 1.0 Administrators 109,937$ 117,940$ 112,669$ 114,600$ 6.14%
2.0 2.0 Paraprofessionals / Aides 96,953 97,529 81,710 81,513 4.37%
2.0 2.0 Counselors 83,916 86,158 83,585 84,740 4.54%
- - Librarians - - - - 0.00%
0.3 0.3 Nurses - - 190 - 0.00%
18.1 18.1 Teachers 1,160,646 1,193,328 1,209,665 1,253,507 67.18%
23.4 23.4 1,451,452 1,494,955 1,487,819 1,534,360 82.23%
Payroll related and benefits costs: 247,157 265,552 276,007 258,717 13.86%
Non-payroll cost: By functional area
11 Instruction 54,034 41,575 35,365 58,727 3.15%
23 School Leadership - 300 - - 0.00%
31 Guidance, Counseling & Eval. 400 400 400 - 0.00%
33 Health Services 89 100 93 - 0.00%
51 Plant Maintenance & Operations 37,335 25,704 10,483 14,209 0.76%
91,858 68,079 46,341 72,936 3.91%
Total Annual Operating Budget 1,790,467$ 1,828,586$ 1,810,167$ 1,866,013$ 100.00%
Enrollment 35 34 40 41
Total Annual Operating Cost per Student 51,156.20$ 53,781.94$ 45,254.18$ 45,512.51$ 0.57%
***Note: For STAAR Testing Results, please refer to the Texas Education Agency 2018 Accountability Summaries by campus located in the
Information Section under Performance Measures.
215

Caney Creek High School Campus Goals & Objectives
Dr. Jeff Stichler, Principal
GOAL 1: Student Achievement and Post-Secondary Success Master rigorous academic standards – Student Achievement, Student Progress, and Closing
Performance Gaps
Student Achievement Objective
All subjects; all students 75% of all students combined over all subject areas approaching Grade Level Standards; 55% student meeting Grade Level Standards; and 14% mastering Grade Level Standards.
Distinctions: Will meet AADD indicator for performance in End of course English I, English II, Algebra I, Biology, and US History. Reading and Math: will meet AADD indicators for performance and participation in SAT, ACT, and AP. Science will meet AADD indicators for performance and participation in ACT and AP. Social Studies will meet AADD indicators for performance and participation in AP.
Student Progress Objective
Reading, Math; all students, 7 racial/ethnic groups, ELL, Sp Ed; weighted progress –
All Students/All Subjects 45% of students who will meet Expected or Accelerated Growth measures. 8% of students who will meet Accelerated Growth measures only.
Distinctions: 1. Will meet Top 25% Student Progress Distinction in ELA and Math.
2. Will meet indicator for Accelerated Growth in ELA and Math.
Closing Performance Gaps
All subjects; Economically Disadvantaged Students and up to 7 racial/ethnic groups Economically Disadvantaged Students: 73% will score Approaching Grade Level Standards 13% will score Mastering Grade Level Standards Racial/Ethnic Group: Hispanic: 74% will score Approaching Grade Level Standards 12% will score Mastering Grade Level Standards
Distinctions: Will meet Top 25% Closing Performance gaps Distinction in ELA and Math.
Post‐Secondary Readiness Increase Attendance Rate from 94.6% to 95.1%
GOAL 2: Recruitment, Development, and Retention of Staff
Objective: To recruit, retain, and develop highly qualified teachers and staff for all students.
GOAL 3: Parents and Community
Objective: To will work jointly with parents and the community to maximize learning for all students through two-way communication, collaborative partnerships, and unity of purpose.
GOAL 4: Safe Schools
Objective: To provide a safe and orderly school environment conducive to learning for all students and staff.
GOAL 5: Technology
Objective: To ensure that all students and staff utilize technology to maximize learning for all students and to enhance the educational practices of teachers.
216

Caney Creek High School2018-2019 General Fund Budget
Payroll cost: By position
Budgeted Staff Actual Amended Budget Projected Proposed Budget % of
2017-18 2018-19 2016-2017 2017-2018 2017-2018 2018-2019 Total
8.0 8.0 Administrators 755,402$ 809,781$ 757,420$ 773,700$ 5.07%
34.0 35.0 Paraprofessionals / Aides 849,675 862,628 875,466 942,765 6.18%
9.0 9.0 Counselors 630,298 651,152 641,995 650,800 4.26%
2.0 2.0 Librarians 67,396 67,109 67,961 72,056 0.47%
1.0 1.0 Nurses 54,013 53,684 57,137 57,790 0.38%
124.5 127.0 Teachers 8,333,517 8,630,294 8,737,639 9,080,134 59.50%
178.5 182.0 10,690,301 11,074,648 11,137,618 11,577,245 75.86%
Payroll related and benefits costs: 2,134,614 2,199,237 2,324,770 2,226,668 14.59%
Non-payroll cost: By functional area
11 Instruction 650,169 680,273 674,839 503,560 3.30%
12 Instructional Resources 30,892 19,000 19,000 20,175 0.13%
13 Curriculum & Instruction 60 - - - 0.00%
23 School Leadership 10,129 20,062 20,175 23,245 0.15%
31 Guidance, Counseling & Eval. 15,589 20,126 19,707 5,273 0.03%
33 Health Services 799 2,200 2,200 2,200 0.01%
36 Co-curricular Activities 427,055 410,002 368,678 433,847 2.84%
51 Plant Maintenance & Operations 430,798 418,359 345,045 469,786 3.08%
81 Facilities Acquisition & Const. 18,500 - - - 0.00%
1,583,991 1,570,022 1,449,644 1,458,086 9.55%
Total Annual Operating Budget 14,408,906$ 14,843,907$ 14,912,032$ 15,261,999$ 100.00%
Enrollment 1,935 2,082 2,042 2,078
Total Annual Operating Cost per Student 7,446.46$ 7,129.64$ 7,302.66$ 7,344.56$ 0.57%
***Note: For STAAR Testing Results, please refer to the Texas Education Agency 2018 Accountability Summaries by campus located in the
Information Section under Performance Measures.
217

Academy for Science and Health Professions Campus Goals
Dr. Terri Benson, Headmaster
GOAL 1: Student Achievement and Post-Secondary Success Master rigorous academic standards – Student Achievement, Student Progress, and Closing
Performance Gaps
Student Achievement Objective
All subjects; all students 100% of all ASHP students combined over all subject areas approaching Grade Level Standards; 100% ASHP student meeting Grade Level Standards; and 85% mastering Grade Level Standards.
Distinctions: Will meet AADD indicator for performance in End of course English I, English II, Algebra I, Biology, and US History. Reading and Math: will meet AADD indicators for performance and participation in SAT, ACT, and AP. Science will meet AADD indicators for performance and participation in ACT and AP. Social Studies will meet AADD indicators for performance and participation in AP.
Student Progress Objective
Reading, Math; all students, 7 racial/ethnic groups, ELL, Sp Ed; weighted progress –
All Students/All Subjects 100% of students who will meet Expected or Accelerated Growth measures. 50% of students who will meet Accelerated Growth measures only.
Distinctions: 1. Will meet Top 25% Student Progress Distinction in ELA and Math.
2. Will meet indicator for Accelerated Growth in ELA and Math.
Closing Performance Gaps
All subjects; Economically Disadvantaged Students and up to 7 racial/ethnic groups Economically Disadvantaged Students: 100% will score Approaching Grade Level Standards 100% will score Mastering Grade Level Standards Racial/Ethnic Group: African American: 100% will score Approaching Grade Level Standards 100% will score Mastering Grade Level Standards Racial/Ethnic Group: Hispanic: 100% will score Approaching Grade Level Standards 100% will score Mastering Grade Level Standards
Distinctions: Will meet Top 25% Closing Performance gaps Distinction in ELA and Math.
Post‐Secondary Readiness Increase Attendance Rate from 95% to 95.5%
GOAL 2: Recruitment, Development, and Retention of Staff
Objective: To recruit, retain, and develop highly qualified teachers and staff for all students.
GOAL 3: Parents and Community
Objective: To will work jointly with parents and the community to maximize learning for all students through two-way communication, collaborative partnerships, and unity of purpose.
GOAL 4: Safe Schools
Objective: To provide a safe and orderly school environment conducive to learning for all students and staff.
GOAL 5: Technology
Objective: To ensure that all students and staff utilize technology to maximize learning for all students and to enhance the educational practices of teachers.
218

Academy of Science and Health Professions2018-2019 General Fund Budget
Payroll cost: By position
Budgeted Staff Actual Amended Budget Projected Proposed Budget % of
2017-18 2018-19 2016-2017 2017-2018 2017-2018 2018-2019 Total
1.0 1.0 Administrators 103,534$ 108,486$ 105,222$ 107,920$ 12.96%
1.0 1.0 Paraprofessionals / Aides 38,670 39,947 40,633 40,544 4.87%
- - Counselors - - - - 0.00%
- - Librarians - - - - 0.00%
- - Nurses - - - - 0.00%
7.0 7.0 Teachers 473,931 480,918 478,660 487,548 58.55%
9.0 9.0 616,135 629,351 624,515 636,012 76.38%
Payroll related and benefits costs: 115,552 121,736 123,383 118,847 14.27%
Non-payroll cost: By functional area
11 Instruction 46,430 47,004 47,094 61,040 7.33%
13 Curriculum & Instruction 300 1,000 488 1,000 0.12%
23 School Leadership 4,428 5,300 4,701 7,599 0.91%
36 Co-curricular Activities 2,820 5,462 5,427 7,606 0.91%
51 Plant Maintenance & Operations - - - 547 0.07%
53,978 58,766 57,710 77,792 9.34%
Total Annual Operating Budget 785,665$ 809,853$ 805,608$ 832,651$ 100.00%
Enrollment 405 421 395 377
Total Annual Operating Cost per Student 1,939.91$ 1,923.64$ 2,039.51$ 2,208.62$ 8.29%
*Note: The Academy of Science and Health Professions' STAAR results are included in the Conroe High School's results.
219

The Woodlands College Park High School Campus Goals & Objectives
Dr. Mark Murrell, Principal
GOAL 1: Student Achievement and Post-Secondary Success Master rigorous academic standards – Student Achievement, Student Progress, and Closing
Performance Gaps
Student Achievement Objective
All subjects; all students 92% of all students combined over all subject areas approaching Grade Level Standards; 87% student meeting Grade Level Standards; and 42% mastering Grade Level Standards.
Distinctions: Will meet AADD indicator for performance in End of course English I, English II, Algebra I, Biology, and US History. Reading and Math: will meet AADD indicators for performance and participation in SAT, ACT, AP, Algebra 1. Science will meet AADD indicators for performance and participation in ACT and AP. Social Studies will meet AADD indicators for performance and participation in AP.
Student Progress Objective
Reading, Math; all students, 7 racial/ethnic groups, ELL, Sp Ed; weighted progress –
All Students/All Subjects 65% of students who will meet Expected or Accelerated Growth measures. 20% of students who will meet Accelerated Growth measures only.
Distinctions: 1. Will meet Top 25% Student Progress Distinction in ELA and Math.
2. Will meet indicator for Accelerated Growth in ELA and Math.
Closing Performance Gaps
All subjects; Economically Disadvantaged Students and up to 7 racial/ethnic groups Economically Disadvantaged Students: 80% will score Approaching Grade Level Standards 20% will score Mastering Grade Level Standards Racial/Ethnic Group: African American: 85% will score Approaching Grade Level Standards 20% will score Mastering Grade Level Standards Racial/Ethnic Group: Hispanic: 90% will score Approaching Grade Level Standards 35% will score Mastering Grade Level Standards
Distinctions: Will meet Top 25% Closing Performance gaps Distinction in ELA and Math.
Post‐Secondary Readiness Increase Attendance Rate from 96.1% to 96.5%
GOAL 2: Recruitment, Development, and Retention of Staff
Objective: To recruit, retain, and develop highly qualified teachers and staff for all students.
GOAL 3: Parents and Community
Objective: To will work jointly with parents and the community to maximize learning for all students through two-way communication, collaborative partnerships, and unity of purpose.
GOAL 4: Safe Schools
Objective: To provide a safe and orderly school environment conducive to learning for all students and staff.
GOAL 5: Technology
Objective: To ensure that all students and staff utilize technology to maximize learning for all students and to enhance the educational practices of teachers.
220

The Woodlands College Park High School2018-2019 General Fund Budget
Payroll cost: By position
Budgeted Staff Actual Amended Budget Projected Proposed Budget % of
2017-18 2018-19 2016-2017 2017-2018 2017-2018 2018-2019 Total
9.0 10.0 Administrators 857,616$ 903,110$ 850,015$ 870,860$ 4.60%
36.0 35.0 Paraprofessionals / Aides 965,256 955,422 1,013,149 976,225 5.15%
11.0 12.0 Counselors 767,704 794,125 794,589 862,930 4.55%
2.0 2.0 Librarians 125,154 121,785 125,693 128,073 0.68%
1.0 1.0 Nurses 61,945 61,186 62,761 62,320 0.33%
168.5 173.5 Teachers 10,842,780 11,501,526 10,999,446 11,538,070 60.89%
227.5 233.5 13,620,455 14,337,154 13,845,653 14,438,478 76.20%
Payroll related and benefits costs: 2,500,793 2,700,489 2,756,336 2,636,030 13.91%
Non-payroll cost: By functional area
11 Instruction 546,426 545,157 504,540 525,473 2.77%
12 Instructional Resources 53,240 48,932 41,832 49,906 0.26%
13 Curriculum & Instruction 15,599 - - 11,750 0.06%
23 School Leadership 7,884 6,928 2,316 7,541 0.04%
31 Guidance, Counseling & Eval. 21,328 28,125 27,570 5,024 0.03%
33 Health Services 788 700 621 700 0.00%
36 Co-curricular Activities 667,756 581,857 568,817 486,845 2.57%
51 Plant Maintenance & Operations 890,698 831,708 765,592 786,188 4.15%
81 Facilities Acquisition & Const. 11,170 160,051 160,000 - 0.00%
2,214,889 2,203,458 2,071,288 1,873,427 9.89%
Total Annual Operating Budget 18,336,137$ 19,241,101$ 18,673,277$ 18,947,935$ 100.00%
Enrollment 2,642 2,748 2,819 2,850
Total Annual Operating Cost per Student 6,940.25$ 7,001.86$ 6,624.08$ 6,648.40$ 0.37%
***Note: For STAAR Testing Results, please refer to the Texas Education Agency 2018 Accountability Summaries by campus located in the
Information Section under Performance Measures.
221

Grand Oaks High School Campus Goals & Objectives
Dr. Chris Povich, Principal
GOAL 1: Student Achievement and Post-Secondary Success Master rigorous academic standards – Student Achievement, Student Progress, and Closing
Performance Gaps
Student Achievement Objective
All subjects; all students 92% of all students combined over all subject areas approaching Grade Level Standards; 74% meeting Grade Level Standards; and 34% mastering Grade Level Standards.
Distinctions: Will meet AADD indicator for performance in End of course English I, English II, Algebra I, Biology, and US History. Reading and Math: will meet AADD indicators for performance and participation in SAT, ACT, AP, Algebra 1. Science will meet AADD indicators for performance and participation in ACT and AP. Social Studies will meet AADD indicators for performance and participation in AP.
Student Progress Objective
Reading, Math; all students, 7 racial/ethnic groups, ELL, Sp Ed; weighted progress –
All Students/All Subjects 66% of students who will meet Expected or Accelerated Growth measures. 30% of students who will meet Accelerated Growth measures only.
Distinctions: 1. Will meet Top 25% Student Progress Distinction in ELA and Math.
2. Will meet indicator for Accelerated Growth in ELA and Math.
Closing Performance Gaps
All subjects; Economically Disadvantaged Students and up to 7 racial/ethnic groups Economically Disadvantaged Students: 85% will score Approaching Grade Level Standards 22% will score Mastering Grade Level Standards Focus Group: Special Ed: 54% will score Approaching Grade Level Standards 9% will score Mastering Grade Level Standards Focus Group: English Learners: 63% will score Approaching Grade Level Standards 12% will score Mastering Grade Level Standards
Distinctions: Will meet Top 25% Closing Performance gaps Distinction in ELA and Math.
Post‐Secondary Readiness Attendance Rate will be 97.5%.
GOAL 2: Recruitment, Development, and Retention of Staff
Objective: To recruit, retain, and develop highly qualified teachers and staff for all students.
GOAL 3: Parents and Community
Objective: To will work jointly with parents and the community to maximize learning for all students through two-way communication, collaborative partnerships, and unity of purpose.
GOAL 4: Safe Schools
Objective: To provide a safe and orderly school environment conducive to learning for all students and staff.
GOAL 5: Technology
Objective: To ensure that all students and staff utilize technology to maximize learning for all students and to enhance the educational practices of teachers.
222

Grand Oaks High School2018-2019 General Fund Budget
Payroll cost: By position
Budgeted Staff Actual Amended Budget Projected Proposed Budget % of
2017-18 2018-19 2016-2017 2017-2018 2017-2018 2018-2019 Total
- 5.0 Administrators -$ -$ 146,378$ 481,880$ 5.28%
- 22.0 Paraprofessionals / Aides - - 73,219 554,475 6.08%
- 5.0 Counselors - 2,454 47,387 302,690 3.32%
- 1.0 Librarians - - 6,500 61,296 0.67%
- 1.0 Nurses - - 6,051 58,800 0.64%
- 74.0 Teachers - 2,259 631,463 4,944,856 54.21%
- 108.0 - 4,713 910,998 6,403,997 70.20%
Payroll related and benefits costs: - 306 131,562 1,106,967 12.14%
Non-payroll cost: By functional area
11 Instruction - 70,380 60,032 389,981 4.28%
12 Instructional Resources - - - 21,774 0.24%
13 Curriculum & Instruction - - - 7,000 0.08%
23 School Leadership - 10,000 3,022 8,195 0.09%
31 Guidance, Counseling & Eval. - - - 5,037 0.06%
33 Health Services - - - 700 0.01%
36 Co-curricular Activities - 11,150 5,978 343,327 3.76%
51 Plant Maintenance & Operations - - 94,696 835,079 9.15%
- 91,530 163,728 1,611,093 17.66%
Total Annual Operating Budget -$ 96,549$ 1,206,288$ 9,122,057$ 100.00%
Enrollment - - - 1,196
Total Annual Operating Cost per Student -$ -$ -$ 7,627.14$ 100.00%
***Note: Grand Oaks High School opened in the 2018-2019 school year.
223

Juvenile Detention Center Campus Goals & Objectives
Jeffery Eldridge, Principal
GOAL 1: Student Achievement and Post-Secondary Success Master rigorous academic standards – Student Achievement, Student Progress, and Closing
Performance Gaps
Student Achievement Objective
All subjects; all students n/a% of all students combined over all subject areas approaching Grade Level Standards
Distinctions: Will meet AADD indicator for performance in End of course English I, English II, Algebra I, Biology, and US History. Reading and Math: will meet AADD indicators for performance and participation in SAT, ACT, and AP. Science will meet AADD indicators for performance and participation in ACT and AP. Social Studies will meet AADD indicators for performance and participation in AP.
Student Progress Objective
Reading, Math; all students, 7 racial/ethnic groups, ELL, Sp Ed; weighted progress –
All Students/All Subjects n/a% of students who will meet Expected or Accelerated Growth measures. n/a% of students who will meet Accelerated Growth measures only.
Distinctions: 1. Will meet Top 25% Student Progress Distinction in ELA and Math.
2. Will meet indicator for Accelerated Growth in ELA and Math.
Closing Performance Gaps
All subjects; Economically Disadvantaged Students and up to 7 racial/ethnic groups Economically Disadvantaged Students: n/a% will score Approaching Grade Level Standards n/a% will score Mastering Grade Level Standards
Distinctions: Will meet Top 25% Closing Performance gaps Distinction in ELA and Math.
Post‐Secondary Readiness Increase Attendance Rate from n/a% to n/a%
GOAL 2: Recruitment, Development, and Retention of Staff
Objective: To recruit, retain, and develop highly qualified teachers and staff for all students.
GOAL 3: Parents and Community
Objective: To will work jointly with parents and the community to maximize learning for all students through two-way communication, collaborative partnerships, and unity of purpose.
GOAL 4: Safe Schools
Objective: To provide a safe and orderly school environment conducive to learning for all students and staff.
GOAL 5: Technology
Objective: To ensure that all students and staff utilize technology to maximize learning for all students and to enhance the educational practices of teachers.
224

Juvenile Detention Center2018-2019 General Fund Budget
Payroll cost: By position
Budgeted Staff Actual Amended Budget Projected Proposed Budget % of
2017-18 2018-19 2016-2017 2017-2018 2017-2018 2018-2019 Total
- - Administrators -$ -$ -$ -$ 0.00%
2.0 2.0 Paraprofessionals / Aides 32,058 40,963 38,375 42,310 9.13%
- - Counselors - - - - 0.00%
- - Librarians - - - - 0.00%
- - Nurses - - - - 0.00%
5.2 5.2 Teachers 320,705 336,029 299,132 331,719 71.57%
7.2 7.2 352,763 376,992 337,507 374,029 80.70%
Payroll related and benefits costs: 98,185 74,973 68,249 69,911 15.08%
Non-payroll cost: By functional area
11 Instruction - 6,931 6,698 12,788 2.76%
31 Guidance, Counseling & Eval. - 187 - 187 0.04%
51 Plant Maintenance & Operations 4,667 11,000 5,700 6,558 1.41%
4,667 18,118 12,398 19,533 4.21%
Total Annual Operating Budget 455,615$ 470,083$ 418,154$ 463,473$ 100.00%
Enrollment 22 22 28 27
Total Annual Operating Cost per Student 20,709.77$ 21,367.41$ 14,934.07$ 17,165.67$ 14.94%
***Note: For STAAR Testing Results, please refer to the Texas Education Agency 2018 Accountability Summaries by campus located in the
Information Section under Performance Measures.
225

Summer School2018-2019 General Fund Budget
Payroll cost: By position
Budgeted Staff Actual Amended Budget Projected Proposed Budget % of
2017-18 2018-19 2016-2017 2017-2018 2017-2018 2018-2019 Total
- - Administrators 45,449$ 39,000$ 43,069$ 49,000$ 4.63%
- - Paraprofessionals / Aides 56,390 - 49,669 64,000 6.05%
- - Counselors 11,850 14,000 8,850 13,000 1.23%
- - Librarians 5,000 6,500 5,000 6,000 0.57%
- - Nurses 21,100 21,000 15,351 24,000 2.27%
- - Teachers 724,385 894,414 674,053 839,350 79.38%
- - 864,174 974,914 795,992 995,350 94.14%
Payroll related and benefits costs: 19,045 - 30,804 - 0.00%
Non-payroll cost: By functional area
11 Instruction 53,120 79,862 35,221 62,000 5.86%
53,120 79,862 35,221 62,000 5.86%
Total Annual Operating Budget 936,339$ 1,054,776$ 862,017$ 1,057,350$ 100.00%
Enrollment 59,764 61,360 61,580 63,014
Total Annual Operating Cost per Student 15.67$ 17.19$ 14.00$ 16.78$ 19.87%
**Note: Summer School does not include budgeted staff due to the fact that all payroll consists of extra duty pay for current staff
members included at the campuses.
226

Financial Section Debt Service Fund

Debt Service Fund Debt Service Fund Overview The Debt Service Fund accounts for payments of principal, interest, and related fees on the District’s general obligation bonds. Under Texas law, only these debt service payments can be charged to this fund. The Debt Service Fund is funded by a designated allocation of the property tax rate. During fiscal year 2015-2016, the district passed a $487,000,000 bond referendum. Subsequently, the District has issued all $487,000,000 of these bonds. The bonds will be used to build several new schools, major classroom renovations, safety and security upgrades, CTE upgrades and the addition of two robotics labs at the high school level. Debt Service Policy The Board of Directors may obtain funds to construct, acquire or equip school buildings, to purchase necessary sites, to purchase school buses, or to acquire, or refinance property financed under a contract entered under the Public Property Finance Act by issuing bonds and assessing annual ad valorem taxes sufficient to pay the principal and interest on the bonds as they come due. Before issuing bonds, the District must demonstrate to the Attorney General that, with respect to the proposed issuance, the District has a projected ability to pay the principal of and interest on the proposed bonds and all previously issued bond. The District has adopted the provisions of section 45 of the Texas Education Code requiring the levy each year of a tax rate, unlimited as to amount, sufficient to meet principal and interest requirements during the fiscal year. Resources from the property taxes for servicing bonded debt principal and interest are accumulated in, and expended from the Debt Service Fund (Article 278e-1, VCS). Texas statutes do not prescribe a debt limit; however, a practical economic debt limit of 10% of the assessed valuation is represented in the chart below.
Computation of Legal Debt Margin Assessed Value $35,737,543,316 Debt Limit (Percent of 18-19 School Year Assessed Value) 10% Maximum Legal Debt 3,573,754,332 Amount of Debt Applicable to Debt Limit: Total Bonded Debt $ 1,215,100,000 Less Reserve for Retirement of Bonded Debt 32,151,683 Total Amount of Debt Applicable to Debt Limit 1,182,948,317 Legal Debt Margin $ 2,390,806,015
$0
$1,000,000,000
$2,000,000,000
$3,000,000,000
2014-2015 2015-2016 2016-2017 2017-2018 2018-2019
5 Year Debt Margin
227

Debt Service Expenditures The current year expenditure budget consists of the following amounts: $46,300,000 for bond principal payments and $56,755,656 for bond interest and fee payments. Total 2018-19 budgeted expenditures for the Debt Service Fund are $103,055,656. Detailed debt service requirements are located within this section of the budget document.
$0
$20,000,000
$40,000,000
$60,000,000
$80,000,000
$100,000,000
$120,000,000
2014-15 2015-16 2016-17 2017-18 2018-19
Debt Service Expenditures
Interest & fees Principal
228

2014-15 2015-16 2016-17 2017-18 2018-19
Actual Actual Actual Projected Budgeted
Revenues
Local sources 65,018,299$ 71,374,061$ 78,649,756$ 81,457,812$ 79,122,595$
State sources - 1,555,365 1,552,158 1,535,600 1,630,972
Total Revenues 65,018,299 72,929,426 80,201,914 82,993,412 80,753,567
Expenditures
Debt Service:
Principal 36,635,000 37,800,000 40,185,000 44,390,000 46,300,000
Interest & fees 45,785,693 46,433,299 51,484,974 56,007,172 56,755,656
Total Expenditures 82,420,693 84,233,299 91,669,974 100,397,172 103,055,656
Revenues Over (Under) (17,402,394) (11,303,873) (11,468,060) (17,403,760) (22,302,089)
Expenditures
Other Financing Sources (Uses)
Operating transfers 16,000,000 10,000,000 16,000,000 10,000,000 -
Proceeds from refunding bonds 259,086,992 29,087,195 81,820,104 115,424,320 -
Payment to refunding bond agent (259,169,776) (28,766,110) (81,788,984) (113,356,834) -
Total Other Financing Sources (Uses) 15,917,216 10,321,085 16,031,120 12,067,486 -
Revenues and Other Sources
Over (Under) Expenditures (1,485,178) (982,788) 4,563,060 (5,336,274) (22,302,089)
Fund Balances, beginning 35,392,863 33,907,685 32,924,897 37,487,957 32,151,683
Fund Balances, ending 33,907,685$ 32,924,897$ 37,487,957$ 32,151,683$ 9,849,594$
Debt Service Fund
Five Year Summary of Revenues and Expenditures
$-
$10,000,000
$20,000,000
$30,000,000
$40,000,000
2014-15 2015-16 2016-17 2017-18 2018-19
Fund Balance
229

2017-18
2016-17 Amended 2017-18 2018-19 Percent
Actual Budget Projected Budgeted of Total
Revenues
Local sources 78,649,756$ 81,369,743$ 81,457,812$ 79,122,595$ 97.98%
State Sources 1,552,158 1,370,230 1,535,600 1,630,972 2.02%
Total Revenues 80,201,914 82,739,973 82,993,412 80,753,567 100.00%
Expenditures by object
Debt Service 91,669,974 93,544,913 100,397,172 103,055,656 100.00%
Total Expenditures 91,669,974 93,544,913 100,397,172 103,055,656 100.00%
Exess of Revenues Over
(Under) Expenditures (11,468,060)$ (10,804,940)$ (17,403,760)$ (22,302,089)$
Debt Service Fund
Budget Summary: 2018-19
Revenue & Expenditure Summary by Major Object
230
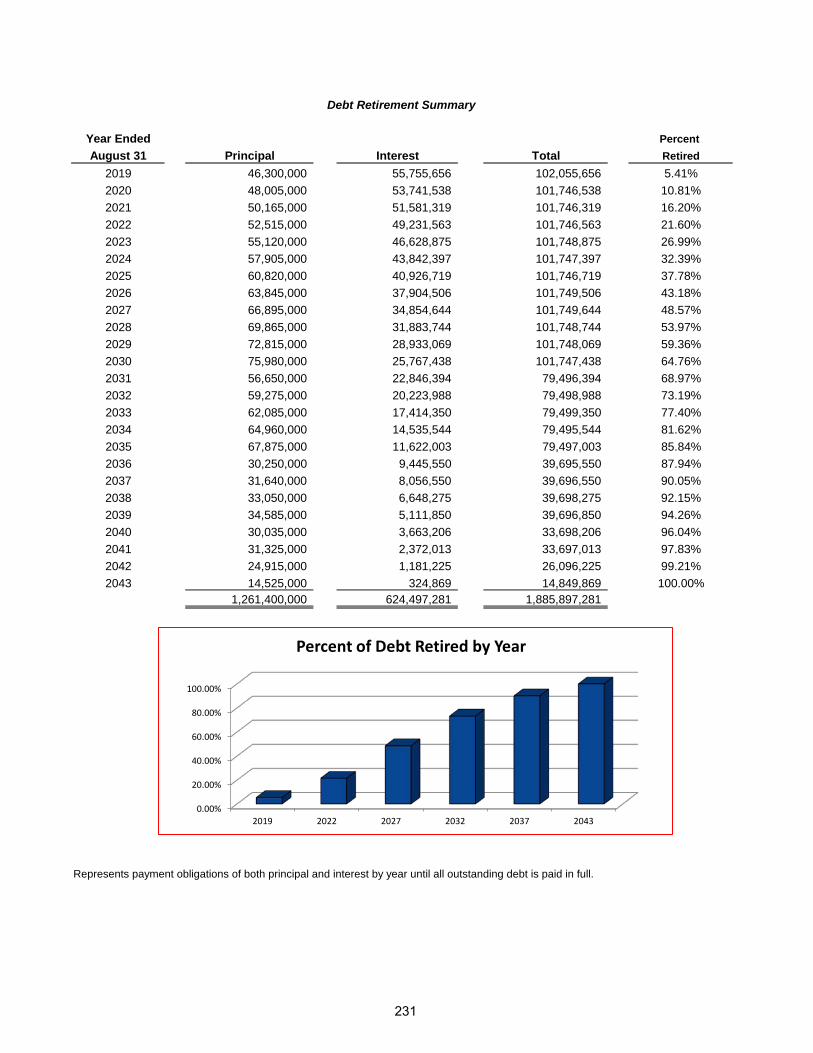
Year Ended Percent
August 31 Principal Interest Total Retired
2019 46,300,000 55,755,656 102,055,656 5.41%
2020 48,005,000 53,741,538 101,746,538 10.81%
2021 50,165,000 51,581,319 101,746,319 16.20%
2022 52,515,000 49,231,563 101,746,563 21.60%
2023 55,120,000 46,628,875 101,748,875 26.99%
2024 57,905,000 43,842,397 101,747,397 32.39%
2025 60,820,000 40,926,719 101,746,719 37.78%
2026 63,845,000 37,904,506 101,749,506 43.18%
2027 66,895,000 34,854,644 101,749,644 48.57%
2028 69,865,000 31,883,744 101,748,744 53.97%
2029 72,815,000 28,933,069 101,748,069 59.36%
2030 75,980,000 25,767,438 101,747,438 64.76%
2031 56,650,000 22,846,394 79,496,394 68.97%
2032 59,275,000 20,223,988 79,498,988 73.19%
2033 62,085,000 17,414,350 79,499,350 77.40%
2034 64,960,000 14,535,544 79,495,544 81.62%
2035 67,875,000 11,622,003 79,497,003 85.84%
2036 30,250,000 9,445,550 39,695,550 87.94%
2037 31,640,000 8,056,550 39,696,550 90.05%
2038 33,050,000 6,648,275 39,698,275 92.15%
2039 34,585,000 5,111,850 39,696,850 94.26%
2040 30,035,000 3,663,206 33,698,206 96.04%
2041 31,325,000 2,372,013 33,697,013 97.83%
2042 24,915,000 1,181,225 26,096,225 99.21%
2043 14,525,000 324,869 14,849,869 100.00%
1,261,400,000 624,497,281 1,885,897,281
Represents payment obligations of both principal and interest by year until all outstanding debt is paid in full.
Debt Retirement Summary
0.00%
20.00%
40.00%
60.00%
80.00%
100.00%
2019 2022 2027 2032 2037 2043
Percent of Debt Retired by Year
231

Retired/
Original Amount Issued Refunded
Interest Issue Outstanding Current Current
Description Rate Amount Aug 31, 2017 Year Year
Unlimited Tax Refunding Bonds, Series 2004B 3.40-3.50% $ 43,862,645 $ 23,585,000 $ - $ 3,730,000
Unlimited Tax Schoolhouse Bonds, Series 2009A 2.00-5.75% 83,805,000 1,315,000 - 1,315,000
Unlimited Tax Schoolhouse Bonds, Series 2009B 2.25-5.00% 17,880,000 9,835,000 - 1,705,000
Unlimited Tax Schoolhouse Bonds, Series 2010 2.00-4.50% 26,865,000 15,475,000 - 11,750,000
Unlimited Tax Schoolhouse Bonds, Series 2011 2.00-5.25% 82,410,000 26,990,000 - 22,720,000
Unlimited Tax Schoolhouse Bonds, Series 2011 REF 2.00-5.00% 133,615,000 105,585,000 - 12,935,000
Unlimited Tax Schoolhouse Bonds, Series 2012 2.00-5.00% 125,810,000 113,895,000 - 45,545,000
Unlimited Tax Schoolhouse Bonds, Series 2012A 2.00-5.00% 205,215,000 178,365,000 - 32,425,000
Unlimited Tax Schoolhouse Bonds, Series 2014 2.00-5.00% 76,920,000 70,000,000 - 625,000
Unlimited Tax Schoolhouse Bonds, Series 2014A 2.00-5.00% 129,205,000 112,010,000 - 8,165,000
Unlimited Tax Schoolhouse Bonds, Series 2014B 2.00-5.00% 21,085,000 19,705,000 - 740,000
Unlimited Tax Schoolhouse Bonds, Series 2015 2.00-5.00% 117,665,000 117,330,000 - 175,000
Unlimited Tax Schoolhouse Bonds, Series 2016 5.00% 138,015,000 135,825,000 - 2,865,000
Unlimited Tax Schoolhouse Bonds, Series 2016A 3.00-4.00% 206,675,000 206,675,000 - 1,405,000
Unlimited Tax Schoolhouse Bonds, Series 2017 5.00% 97,540,000 - 97,540,000 1,065,000
Unlimited Tax Schoolhouse Bonds, Series 2018 5.00% 174,435,000 - 174,435,000 -
Total General Obligation Bonds $ 1,681,002,645 $ 1,136,590,000 $ 271,975,000 $ 147,165,000
CONROE INDEPENDENT SCHOOL DISTRICT
SCHEDULE OF LONG TERM DEBT
FOR THE YEAR ENDED AUGUST 31, 2018
232

Amount Interest Requirements Sept 1, 2020
Outstanding Current Year Ending August 31, 2019 Year Ending August 31, 2020 Interest
Aug 31, 2018 Year Principal Interest Principal Interest To Maturity
$ 19,855,000 $ 818,100 $ 6,410,000 $ 649,975 $ 6,625,000 $ 405,300 $ 136,400
- 24,656 - - - - -
8,130,000 354,781 2,610,000 261,825 2,820,000 147,225 48,937
3,725,000 180,219 710,000 148,831 760,000 115,756 1,430,516
4,270,000 245,625 1,350,000 179,750 1,425,000 110,375 37,375
92,650,000 4,927,482 13,315,000 4,279,813 11,810,000 3,659,394 9,702,240
68,350,000 3,235,425 2,940,000 3,148,500 3,025,000 3,059,025 26,207,625
145,940,000 6,385,400 1,695,000 6,232,450 1,845,000 6,163,600 47,132,850
69,375,000 3,430,500 630,000 3,417,950 2,600,000 3,346,650 25,520,925
103,845,000 4,614,587 8,310,000 4,244,262 8,780,000 3,858,563 27,834,031
18,965,000 746,550 720,000 731,950 700,000 714,250 4,943,875
117,155,000 5,125,700 1,535,000 5,103,950 1,565,000 5,068,300 50,549,300
132,960,000 6,452,675 3,545,000 6,292,425 3,755,000 6,109,925 67,499,125
205,270,000 8,538,400 1,445,000 8,509,900 1,210,000 8,483,350 94,052,125
96,475,000 3,974,280 - 4,392,200 - 4,392,200 34,330,800
174,435,000 4,867,906 1,085,000 8,161,875 1,085,000 8,107,625 125,573,963
$ 1,261,400,000 $ 53,922,286 $ 46,300,000 $ 55,755,656 $ 48,005,000 $ 53,741,538 $ 515,000,087
233

Conroe Independent School District
Debt Service Requirments Until Maturity
August 31, 2018
Year Ended
August 31 Principal Interest
2019 $46,300,000 $55,755,656
2020 48,005,000 53,741,538
2021 50,165,000 51,581,319
2022 52,515,000 49,231,563
2023 55,120,000 46,628,875
2024 57,905,000 43,842,397
2025 60,820,000 40,926,719
2026 63,845,000 37,904,506
2027 66,895,000 34,854,644
2028 69,865,000 31,883,744
2029 72,815,000 28,933,069
2030 75,980,000 25,767,438
2031 56,650,000 22,846,394
2032 59,275,000 20,223,988
2033 62,085,000 17,414,350
2034 64,960,000 14,535,544
2035 67,875,000 11,622,003
2036 30,250,000 9,445,550
2037 31,640,000 8,056,550
2038 33,050,000 6,648,275
2039 34,585,000 5,111,850
2040 30,035,000 3,663,206
2041 31,325,000 2,372,013
2042 24,915,000 1,181,225
2043 14,525,000 324,869
$1,261,400,000 $624,497,281
Principal, 9/1/17 $1,136,590,000
Principal payments (44,390,000)
Debt refunded (102,775,000)
Principal Issued New 271,975,000
Total Principal, 8/31/18 $1,261,400,000
Current Interest Bonds
$0
$20
$40
$60
$80
$100
$120
2019
2020
2021
2022
2023
2024
2025
2026
2027
2028
2029
2030
2031
2032
2033
2034
2035
2036
2037
2038
2039
2040
2041
2042
2043
Mill
ions
Debt Service Requirements Until Maturity
Interest Principal
234

Debt Service Fund
Debt Service to Maturity by Issue Date
2009 B 2010
Face Amounts Interest Total Face Amounts Interest Total Face Amounts Interest Total
2019 6,410,000.00 649,975.00 7,059,975.00 2,610,000.00 261,825.00 2,871,825.00 710,000.00 148,831.26 858,831.26
2020 6,625,000.00 405,300.00 7,030,300.00 2,820,000.00 147,225.00 2,967,225.00 760,000.00 115,756.26 875,756.26
2021 6,820,000.00 136,400.00 6,956,400.00 2,700,000.00 48,937.50 2,748,937.50 - 98,656.26 98,656.26
2022 - - - - - - - 98,656.26 98,656.26
2023 - - - - - - - 98,656.26 98,656.26
2024 - - - - - - - 98,656.26 98,656.26
2025 - - - - - - - 98,656.26 98,656.26
2026 - - - - - - - 98,656.26 98,656.26
2027 - - - - - - - 98,656.26 98,656.26
2028 - - - - - - - 98,656.26 98,656.26
2029 - - - - - - - 98,656.26 98,656.26
2030 - - - - - - - 98,656.26 98,656.26
2031 - - - - - - - 98,656.26 98,656.26
2032 - - - - - - - 98,656.26 98,656.26
2033 - - - - - - - 98,656.26 98,656.26
2034 - - - - - - - 98,656.26 98,656.26
2035 - - - - - - 2,255,000.00 49,328.13 2,304,328.13
2036 - - - - - - - - -
2037 - - - - - - - - -
2038 - - - - - - - - -
2039 - - - - - - - - -
2040 - - - - - - - - -
2041 - - - - - - - - -
2042 - - - - - - - - -
2043 - - - - - - - - -
19,855,000.00 1,191,675.00 21,046,675.00 8,130,000.00 457,987.50 8,587,987.50 3,725,000.00 1,695,103.29 5,420,103.29
2011 B 2012
Face Amounts Interest Total Face Amounts Interest Total Face Amounts Interest Total
2019 1,350,000.00 179,750.00 1,529,750.00 13,315,000.00 4,279,812.51 17,594,812.51 2,940,000.00 3,148,500.00 6,088,500.00
2020 1,425,000.00 110,375.00 1,535,375.00 11,810,000.00 3,659,393.76 15,469,393.76 3,025,000.00 3,059,025.00 6,084,025.00
2021 1,495,000.00 37,375.00 1,532,375.00 8,570,000.00 3,155,487.51 11,725,487.51 3,145,000.00 2,935,025.00 6,080,025.00
2022 - - - 14,395,000.00 2,582,406.26 16,977,406.26 3,290,000.00 2,774,150.00 6,064,150.00
2023 - - - 12,255,000.00 1,916,356.26 14,171,356.26 2,340,000.00 2,633,400.00 4,973,400.00
2024 - - - 15,670,000.00 1,218,678.13 16,888,678.13 2,590,000.00 2,510,150.00 5,100,150.00
2025 - - - 8,295,000.00 621,500.00 8,916,500.00 6,220,000.00 2,289,900.00 8,509,900.00
2026 - - - 8,340,000.00 207,812.50 8,547,812.50 6,585,000.00 1,969,775.00 8,554,775.00
2027 - - - - - - 2,270,000.00 1,759,750.00 4,029,750.00
2028 - - - - - - 2,360,000.00 1,667,150.00 4,027,150.00
2029 - - - - - - 2,450,000.00 1,579,450.00 4,029,450.00
2030 - - - - - - 890,000.00 1,516,700.00 2,406,700.00
2031 - - - - - - 2,425,000.00 1,433,825.00 3,858,825.00
2032 - - - - - - 3,705,000.00 1,289,475.00 4,994,475.00
2033 - - - - - - 7,640,000.00 1,014,750.00 8,654,750.00
2034 - - - - - - 8,030,000.00 623,000.00 8,653,000.00
2035 - - - - - - 8,445,000.00 211,125.00 8,656,125.00
2036 - - - - - - - - -
2037 - - - - - - - - -
2038 - - - - - - - - -
2039 - - - - - - - - -
2040 - - - - - - - - -
2041 - - - - - - - - -
2042 - - - - - - - - -
2043 - - - - - - - - -
4,270,000.00 327,500.00 4,597,500.00 92,650,000.00 17,641,446.93 110,291,446.93 68,350,000.00 32,415,150.00 100,765,150.00
2004 B
2011 A
235

Debt Service Fund
Debt Service to Maturity by Issue Date
2019
2020
2021
2022
2023
2024
2025
2026
2027
2028
2029
2030
2031
2032
2033
2034
2035
2036
2037
2038
2039
2040
2041
2042
2043
2019
2020
2021
2022
2023
2024
2025
2026
2027
2028
2029
2030
2031
2032
2033
2034
2035
2036
2037
2038
2039
2040
2041
2042
2043
2014 2014A
Face Amounts Interest Total Face Amounts Interest Total Face Amounts Interest Total
1,695,000.00 6,232,450.00 7,927,450.00 630,000.00 3,417,950.00 4,047,950.00 8,310,000.00 4,244,262.50 12,554,262.50
1,845,000.00 6,163,600.00 8,008,600.00 2,600,000.00 3,346,650.00 5,946,650.00 8,780,000.00 3,858,562.50 12,638,562.50
2,010,000.00 6,091,250.00 8,101,250.00 7,620,000.00 3,091,150.00 10,711,150.00 8,325,000.00 3,472,562.50 11,797,562.50
8,485,000.00 5,886,100.00 14,371,100.00 3,845,000.00 2,804,525.00 6,649,525.00 4,050,000.00 3,204,812.50 7,254,812.50
6,220,000.00 5,560,900.00 11,780,900.00 4,450,000.00 2,597,150.00 7,047,150.00 4,245,000.00 3,005,437.50 7,250,437.50
3,985,000.00 5,305,775.00 9,290,775.00 4,445,000.00 2,374,775.00 6,819,775.00 4,460,000.00 2,798,062.50 7,258,062.50
4,115,000.00 5,103,275.00 9,218,275.00 4,945,000.00 2,140,025.00 7,085,025.00 4,740,000.00 2,594,012.50 7,334,012.50
4,255,000.00 4,894,025.00 9,149,025.00 5,705,000.00 1,873,775.00 7,578,775.00 4,940,000.00 2,400,412.50 7,340,412.50
21,700,000.00 4,345,150.00 26,045,150.00 6,780,000.00 1,561,650.00 8,341,650.00 5,875,000.00 2,154,737.50 8,029,737.50
22,645,000.00 3,436,525.00 26,081,525.00 1,780,000.00 1,347,650.00 3,127,650.00 11,470,000.00 1,778,462.50 13,248,462.50
23,630,000.00 2,479,650.00 26,109,650.00 1,870,000.00 1,256,400.00 3,126,400.00 11,930,000.00 1,319,562.50 13,249,562.50
24,680,000.00 1,471,900.00 26,151,900.00 1,965,000.00 1,160,525.00 3,125,525.00 6,695,000.00 964,531.25 7,659,531.25
3,765,000.00 879,600.00 4,644,600.00 2,105,000.00 1,058,775.00 3,163,775.00 2,010,000.00 801,312.50 2,811,312.50
3,940,000.00 705,800.00 4,645,800.00 2,215,000.00 950,775.00 3,165,775.00 2,085,000.00 724,531.25 2,809,531.25
4,120,000.00 524,900.00 4,644,900.00 2,330,000.00 837,150.00 3,167,150.00 2,165,000.00 644,843.75 2,809,843.75
4,315,000.00 334,625.00 4,649,625.00 2,445,000.00 717,775.00 3,162,775.00 2,250,000.00 562,062.50 2,812,062.50
4,535,000.00 113,375.00 4,648,375.00 2,560,000.00 605,450.00 3,165,450.00 2,330,000.00 476,187.50 2,806,187.50
- - - 2,565,000.00 490,125.00 3,055,125.00 2,140,000.00 392,375.00 2,532,375.00
- - - 2,700,000.00 358,500.00 3,058,500.00 2,230,000.00 296,500.00 2,526,500.00
- - - 2,835,000.00 220,125.00 3,055,125.00 2,350,000.00 182,000.00 2,532,000.00
- - - 2,985,000.00 74,625.00 3,059,625.00 2,465,000.00 61,625.00 2,526,625.00
- - - - - - - - -
- - - - - - - - -
- - - - - - - - -
- - - - - - - - -
145,940,000.00 59,528,900.00 205,468,900.00 69,375,000.00 32,285,525.00 101,660,525.00 103,845,000.00 35,936,856.25 139,781,856.25
2015A 2016
Face Amounts Interest Total Face Amounts Interest Total Face Amounts Interest Total
720,000.00 731,950.00 1,451,950.00 1,535,000.00 5,103,950.00 6,638,950.00 3,545,000.00 6,292,425.00 9,837,425.00
700,000.00 714,250.00 1,414,250.00 1,565,000.00 5,068,300.00 6,633,300.00 3,755,000.00 6,109,925.00 9,864,925.00
680,000.00 693,550.00 1,373,550.00 1,625,000.00 5,012,025.00 6,637,025.00 3,980,000.00 5,916,550.00 9,896,550.00
715,000.00 672,625.00 1,387,625.00 2,995,000.00 4,918,987.50 7,913,987.50 4,005,000.00 5,716,925.00 9,721,925.00
795,000.00 649,975.00 1,444,975.00 3,130,000.00 4,788,325.00 7,918,325.00 4,390,000.00 5,507,050.00 9,897,050.00
800,000.00 626,050.00 1,426,050.00 3,275,000.00 4,640,700.00 7,915,700.00 4,530,000.00 5,284,050.00 9,814,050.00
810,000.00 597,850.00 1,407,850.00 3,430,000.00 4,485,575.00 7,915,575.00 4,885,000.00 5,048,675.00 9,933,675.00
825,000.00 565,150.00 1,390,150.00 3,565,000.00 4,346,350.00 7,911,350.00 5,355,000.00 4,792,675.00 10,147,675.00
3,280,000.00 483,050.00 3,763,050.00 5,145,000.00 4,189,975.00 9,334,975.00 6,180,000.00 4,504,300.00 10,684,300.00
3,245,000.00 352,550.00 3,597,550.00 5,380,000.00 3,952,575.00 9,332,575.00 6,430,000.00 4,253,350.00 10,683,350.00
3,210,000.00 223,450.00 3,433,450.00 5,630,000.00 3,705,475.00 9,335,475.00 6,695,000.00 3,989,525.00 10,684,525.00
3,185,000.00 79,625.00 3,264,625.00 11,670,000.00 3,301,125.00 14,971,125.00 6,995,000.00 3,647,275.00 10,642,275.00
- - - 12,385,000.00 2,699,750.00 15,084,750.00 5,915,000.00 3,324,525.00 9,239,525.00
- - - 13,015,000.00 2,064,750.00 15,079,750.00 6,225,000.00 3,021,025.00 9,246,025.00
- - - 13,685,000.00 1,397,250.00 15,082,250.00 6,545,000.00 2,701,775.00 9,246,775.00
- - - 14,300,000.00 787,000.00 15,087,000.00 6,875,000.00 2,366,275.00 9,241,275.00
- - 14,825,000.00 259,437.50 15,084,437.50 7,230,000.00 2,013,650.00 9,243,650.00
- - - - - - 5,925,000.00 1,684,775.00 7,609,775.00
- - - - - - 6,230,000.00 1,380,900.00 7,610,900.00
- - - - - - 6,550,000.00 1,061,400.00 7,611,400.00
- - - - - - 6,885,000.00 725,525.00 7,610,525.00
- - - - - - 6,780,000.00 417,800.00 7,197,800.00
- - - - - - 7,055,000.00 141,100.00 7,196,100.00
- - - - - - - - -
- - - - - - - - -
18,965,000.00 6,390,075.00 25,355,075.00 117,155,000.00 60,721,550.00 177,876,550.00 132,960,000.00 79,901,475.00 212,861,475.00
2012A
2014B
236

Debt Service Fund
Debt Service to Maturity by Issue Date
2019
2020
2021
2022
2023
2024
2025
2026
2027
2028
2029
2030
2031
2032
2033
2034
2035
2036
2037
2038
2039
2040
2041
2042
2043
Grand
Face Amounts Interest Total Face Amounts Interest Total Face Amounts Interest Total TOTAL
1,445,000.00 8,509,900.00 9,954,900.00 - 4,392,200.00 4,392,200.00 1,085,000.00 8,161,875.00 9,246,875.00 102,055,656.27
1,210,000.00 8,483,350.00 9,693,350.00 - 4,392,200.00 4,392,200.00 1,085,000.00 8,107,625.00 9,192,625.00 101,746,537.52
1,885,000.00 8,452,400.00 10,337,400.00 - 4,392,200.00 4,392,200.00 1,310,000.00 8,047,750.00 9,357,750.00 101,746,318.77
9,360,000.00 8,199,550.00 17,559,550.00 - 4,392,200.00 4,392,200.00 1,375,000.00 7,980,625.00 9,355,625.00 101,746,562.52
9,095,000.00 7,738,175.00 16,833,175.00 6,480,000.00 4,230,200.00 10,710,200.00 1,720,000.00 7,903,250.00 9,623,250.00 101,748,875.02
10,280,000.00 7,253,800.00 17,533,800.00 6,065,000.00 3,916,575.00 9,981,575.00 1,805,000.00 7,815,125.00 9,620,125.00 101,747,396.89
8,625,000.00 6,781,175.00 15,406,175.00 12,850,000.00 3,443,700.00 16,293,700.00 1,905,000.00 7,722,375.00 9,627,375.00 101,746,718.76
8,710,000.00 6,347,800.00 15,057,800.00 13,560,000.00 2,783,450.00 16,343,450.00 2,005,000.00 7,624,625.00 9,629,625.00 101,749,506.26
9,370,000.00 5,895,800.00 15,265,800.00 4,195,000.00 2,339,575.00 6,534,575.00 2,100,000.00 7,522,000.00 9,622,000.00 101,749,643.76
9,850,000.00 5,415,300.00 15,265,300.00 4,495,000.00 2,167,275.00 6,662,275.00 2,210,000.00 7,414,250.00 9,624,250.00 101,748,743.76
8,800,000.00 5,037,050.00 13,837,050.00 6,275,000.00 1,942,975.00 8,217,975.00 2,325,000.00 7,300,875.00 9,625,875.00 101,748,068.76
9,070,000.00 4,769,000.00 13,839,000.00 8,390,000.00 1,576,350.00 9,966,350.00 2,440,000.00 7,181,750.00 9,621,750.00 101,747,437.51
6,985,000.00 4,528,175.00 11,513,175.00 12,185,000.00 1,122,900.00 13,307,900.00 8,875,000.00 6,898,875.00 15,773,875.00 79,496,393.76
13,395,000.00 4,155,500.00 17,550,500.00 4,930,000.00 780,600.00 5,710,600.00 9,765,000.00 6,432,875.00 16,197,875.00 79,498,987.51
13,945,000.00 3,608,700.00 17,553,700.00 1,390,000.00 654,200.00 2,044,200.00 10,265,000.00 5,932,125.00 16,197,125.00 79,499,350.01
7,840,000.00 3,173,000.00 11,013,000.00 8,775,000.00 450,900.00 9,225,900.00 10,130,000.00 5,422,250.00 15,552,250.00 79,495,543.76
8,160,000.00 2,853,000.00 11,013,000.00 6,885,000.00 137,700.00 7,022,700.00 10,650,000.00 4,902,750.00 15,552,750.00 79,497,003.13
8,495,000.00 2,519,900.00 11,014,900.00 - - - 11,125,000.00 4,358,375.00 15,483,375.00 39,695,550.00
8,840,000.00 2,173,200.00 11,013,200.00 - - - 11,640,000.00 3,847,450.00 15,487,450.00 39,696,550.00
9,200,000.00 1,812,400.00 11,012,400.00 - - - 12,115,000.00 3,372,350.00 15,487,350.00 39,698,275.00
9,575,000.00 1,436,900.00 11,011,900.00 - - - 12,675,000.00 2,813,175.00 15,488,175.00 39,696,850.00
9,965,000.00 1,046,100.00 11,011,100.00 - - - 13,290,000.00 2,199,306.25 15,489,306.25 33,698,206.25
10,375,000.00 639,300.00 11,014,300.00 - - - 13,895,000.00 1,591,612.50 15,486,612.50 33,697,012.50
10,795,000.00 215,900.00 11,010,900.00 - - - 14,120,000.00 965,325.00 15,085,325.00 26,096,225.00
- - - - - - 14,525,000.00 324,868.75 14,849,868.75 14,849,868.75
205,270,000.00 111,045,375.00 316,315,375.00 96,475,000.00 43,115,200.00 139,590,200.00 174,435,000.00 141,843,462.50 316,278,462.50 1,885,897,281.47
20182016 A 2017
237

Conroe Independent School District
238

Financial Section Capital Projects Fund

Capital Projects Fund Capital Projects Fund Overview The Capital Projects Fund accounts, on a project basis, are for projects financed by the proceeds from bond issues, or for capital projects otherwise mandated to be accounted for in this fund. The Capital Projects Fund utilizes the modified accrual basis of accounting. Enrollment in CISD for the 2017-2018 school year was 61,580, enrollment for the 2018-2019 school year is estimated at 63,014, and enrollment for the 2026-2026 school year is estimated to reach 72,560 students. The district is continuing to show steady growth as indicated in the most recent demographic study completed in 2015. The Population and Survey Analysts (PASA) completed a Demographic Update for Conroe I.S.D. by studying student residential locations, potential growth, housing trends, and economic factors inherent to the District. PASA studied the expected long-term trends for the District, and created a dataset to use in planning for the next ten years. With this in mind, the CISD Board of Trustees established the 2015 CISD Facility Planning Committee for the purpose of reviewing the district’s projected growth and instructional needs for the next three to five years. The Facilities Planning Committee was also charged with making a recommendation to the Board of Trustees to address those needs while impacting the tax rate as minimally as possible. The Facilities Planning Committee met over a three-month period and made their recommendations to the Board of Trustees at the June 16, 2015 Board of Trustees Meeting. That recommendation became the blueprint for the 2015 CISD Bond Referendum. At the August 18, 2015 Board of Trustees’ Meeting, the Board approved a $487,000,000 bond referendum. On November 3, 2015 voters approved the $487,000,000 proposition, which includes the construction of new schools and classroom additions to accommodate student growth, improvements to aged buildings to sustain capacity, funding for robotics and Career and Technical Education Facilities, and the continuation of technology and safety and security upgrades. The patrons of CISD have traditionally been very supportive of the District’s bond referenda. This support is evidenced by the passage of the 1992, 1994, 1998, 2001, 2004, 2008 and 2015 referenda that the patrons of CISD overwhelmingly approved to build new facilities and address District needs. Capital Projects Fund – 2015 Bond Referendum On November 3, 2015 voters approved the 2015 CISD Bond Referendum. The projects and status of the proposition are as follows: Proposition 1 $487,000,000 New schools: One new High School One new Junior High Schools One new Intermediate School Two new Elementary Schools Additions and renovations: Conroe High School Renovation Knox Junior High School addition Stewart Elementary Build-out Austin Elementary Renovation
239

District Wide Improvements Improvements are scheduled for all campuses in all feeder zones (Conroe, The Woodlands, Oak Ridge, and Caney Creek). Prioritized improvements are unique for each campus and were established based on priorities set by each campus. These improvements include but are not limited to air conditioning & heating improvements, electrical upgrades, parking expansions and ADA (Accessibility) improvements.
Ancillary Needs and Governmental Compliance Transportation needs (more buses) Technology improvements and upgrades Career & Technology Education Facilities upgrades and additions Robotics labs for Caney Creek HS and The Woodlands College Park HS Safety and security improvements Future land purchases
240

Project Description Plan Amount
Funds
Expended &
Encumbered
Estimate to
Complete
Project
Forecast
Variance
Favorable
(Unfavorable)
Expected
Completion
%
Complete
Knox JHS Addition 046 12,190,910 10,661,086 300,014 10,961,100 1,229,810 Aug 17 99%
Land Purchases 10,000,000 8,779,769 1,220,231 10,000,000 - Aug 16 88%
Bradley Elementary (Flex 17) - 132 25,938,117 30,141,252 430,201 30,571,453 (4,633,336) Aug 17 99%
Clark Intermediate Flex 18 - 080 27,467,730 30,201,305 1,006,611 31,207,916 (3,740,186) Aug 18 99%
OR Elementary K-6 Flex 19 - 133 29,088,053 26,709,989 3,100,658 29,810,647 (722,594) Aug 19 18%
Grand Oaks High School - 016 141,527,923 148,819,845 5,260,218 154,080,063 (12,552,140) Aug 18 99%
Conroe High School - 001 59,040,458 37,251,958 18,214,529 55,466,487 3,573,971 Aug 19 81%
Conroe New Jr. High - 055 58,374,850 55,638,426 5,597,492 61,235,918 (2,861,068) Aug 20 12%
Jean Stewart Build out - 130 1,162,743 714,812 172,390 887,202 275,541 Aug 18 78%
Austin Elementary Renovation - 102 17,853,494 19,701,299 (118,154) 19,583,145 (1,729,651) Aug 19 19%
Grangerland Addition *** 5,500,000 4,971,350 528,650 5,500,000 - Aug 17 99%
Irons Jr. High Addition *** 5,000,000 3,887,405 1,112,595 5,000,000 - Jan 19 49%
Technology 21,651,418 12,512,299 9,139,119 21,651,418 - Aug 19 58%
Technology *** 10,825,709 8,391,457 2,434,252 10,825,709 - Aug 19 78%
Life Cycle - LC 40,529,775 30,666,480 5,771,118 36,437,598 4,092,177 Aug 19 84%
Priority One Projects-LC*** 10,424,290 10,305,630 118,660 10,424,290 - Aug 16 99%
Safety and Security - SS 13,622,507 13,817,374 81,986 13,899,360 (276,853) Aug 19 99%
CTE & Robotics 5,202,000 7,014,694 32,749 7,047,443 (1,845,443) Aug 16 99%
Buses*** 6,495,425 6,405,454 89,971 6,495,425 - Aug 19 99%
Scoreboard Replacements *** 3,200,000 3,128,226 71,774 3,200,000 - Aug 18 99%
Totals 505,095,402 469,720,110 54,565,064 524,285,174 (19,189,772)
Contingency 23,350,021 4,160,249
Grand Total 528,445,423 528,445,423
School Bonds Authorized 487,000,000
School Bonds Sold 487,000,000
Balance to Sell -
*** Items are paid for by General
Fund Transfer 41,445,424
Status of 2015 Bond Referendum & Capital Projects (As of 8/31/18)
241

Capital Projects Fund Expenditures The current year capital projects expenditure budget is $163,504,113, which is an increase of 11,388,982 from the 2017-2018 projected expenditures. This budget increase is due to construction beginning for the third phase of the 2015 bond projects. This includes a new junior high and elementary school. Capital Projects Fund - Fund Balance The fund balance in the Capital Projects Fund is budgeted to be 6,249,739 by the end 2018-2019.
242

2014-15 2015-16 2016-17 2017-18 2018-19
Actual Actual Actual Projected Budgeted
Revenues
Local sources 71,373$ 737,438$ 1,926,226$ 3,965,351$ 352,914$
Total Revenues 71,373 737,438 1,926,226 3,965,351 352,914
Expenditures
Plant Maintenance and Operations 2,655,312 - - 2,762,520 437,480
Facilities Acquisition and Construction 36,040,328 89,005,430 159,524,691 151,677,651 163,066,633
Total Expenditures 38,695,640 89,005,430 159,524,691 154,440,171 163,504,113
Revenues Over (Under)
Expenditures (38,624,267) (88,267,992) (157,598,465) (150,474,820) (163,151,199)
Other Financing Sources (Uses)
Operating transfers in/(out) 4,300,000 33,300,000 - 8,200,000 -
Sale of Real Property 455,996 - - -
General Obligation Bond Proceeds 40,000,000 135,000,000 150,000,000 202,000,000 -
Total Other Financing Sources (Uses) 44,755,996 168,300,000 150,000,000 210,200,000 -
Revenues and Other Sources
Over (Under) Expenditures 6,131,729 80,032,008 (7,598,465) 59,725,180 (163,151,199)
Fund Balances, beginning 31,110,486 37,242,215 117,274,223 109,675,758 169,400,938
Fund Balances, ending 37,242,215$ 117,274,223$ 109,675,758$ 169,400,938$ 6,249,739$
Capital Projects Fund
Five Year Summary of Revenues and Expenditures
$0
$25,000
$50,000
$75,000
$100,000
$125,000
$150,000
$175,000
2014-15 2015-16 2016-17 2017-18 2018-19
Thousands
Expenditures
243
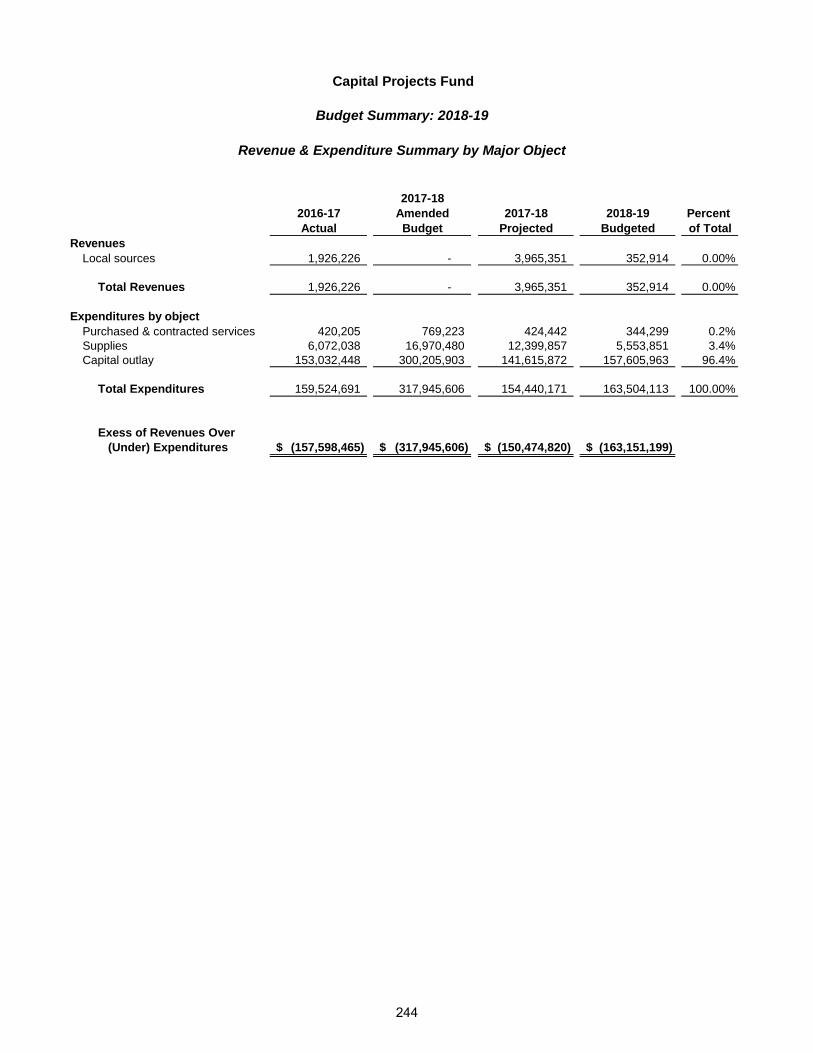
2017-18
2016-17 Amended 2017-18 2018-19 Percent
Actual Budget Projected Budgeted of Total
Revenues
Local sources 1,926,226 - 3,965,351 352,914 0.00%
Total Revenues 1,926,226 - 3,965,351 352,914 0.00%
Expenditures by object
Purchased & contracted services 420,205 769,223 424,442 344,299 0.2%
Supplies 6,072,038 16,970,480 12,399,857 5,553,851 3.4%
Capital outlay 153,032,448 300,205,903 141,615,872 157,605,963 96.4%
Total Expenditures 159,524,691 317,945,606 154,440,171 163,504,113 100.00%
Exess of Revenues Over
(Under) Expenditures (157,598,465)$ (317,945,606)$ (150,474,820)$ (163,151,199)$
Capital Projects Fund
Budget Summary: 2018-19
Revenue & Expenditure Summary by Major Object
244

Conroe Independent School District
Capital Projects Summary Project: Knox Junior High Addition Description:
The capital projects fund is providing $12.1 million to add 10 new science classrooms and an addition to the field house. The addition will add 26,078 square feet to the building. Status: This project is 100% complete as of August 2017. Operating Budget Impact:
The overall impact on the budget for this addition is expected at approximately 70,000 for custodial services and utilities.
Project: Bradley Elementary Description:
The capital projects fund is providing $25.9 million for a new elementary school. The new 125,121 square foot facility will have the capacity to service 1,000 students in the Oak Ridge feeder system. Status: This project is 100% complete as of August 2017. Operating Budget Impact:
The overall impact on the budget for this campus, based on a projected enrollment of 800 students, is expected at approximately $3.5 million with the majority of the cost being in staffing expense of $3.1 million. The remaining expense will include cost for maintenance, custodial, utilities, and supplies.
Project: Clark Intermediate- (Flex 18) Description: The capital projects fund is providing $27.4 million for a new intermediate school. The new 125,121 square foot facility will have the capacity to service 1,000 students in the Oak Ridge feeder system. Status: This project is 100% complete as of August 2018 . Operating Budget Impact: The overall impact on the budget for this campus, based on a projected enrollment of 650 students, is expected at approximately $3.5 million with the majority of the cost being in staffing expense of $3.2 million. The remaining expense will include cost for maintenance, custodial, utilities, and supplies.
245

Project: Oak Ridge K-6 School- (Flex 19) Description: The capital projects fund is providing $29 million for a new kindergarten through 6th grade school. The new 125,121 square foot facility will have the capacity to service 1,000 students in the Oak Ridge feeder system. Status: This project is 18% complete and has an estimated completion date of August 2019. Operating Budget Impact:
The overall impact on the budget for this campus, based on a projected enrollment of 600 students, is expected at approximately $3.1 million with the majority of the cost being in staffing expense of $2.8 million. The remaining expense will include cost for maintenance, custodial, utilities, and supplies. Project: Grand Oaks High School Description: The capital projects fund is providing $141.5 million for a high school. The new 522,651 square foot facility will have the capacity to service 3,000 students in the Oak Ridge feeder system. Status: This project is 100% complete as of August 2018. Operating Budget Impact: The overall impact on the budget for this campus, based on a projected enrollment of 1,500 students, is expected at approximately $6.6 million with the majority of the cost being in staffing expense of $5 million. The remaining expense will include cost for maintenance, custodial, utilities, and supplies. Project: Conroe High School classroom renovations/additions Description: The capital projects fund is providing $59 million for renovations to mechanical systems. This renovation will cause the loss of several classrooms. New classrooms will be built. Status: This project is 81% complete and has an estimated completion date of August 2019. Operating Budget Impact:
The overall impact on the budget has not been determined yet. Project: Conroe New Junior High Description: The capital projects fund is providing $58.3 million for a new Jr. High School in the Conroe feeder system. The new 207,000 square foot facility will have the capacity to service 1,200 students. Status: This project is12% complete and has an estimated completion date of August 2020. .
246

Operating Budget Impact: The overall impact on the budget for this campus, based on a projected enrollment of 1,000, is expected at approximately $3.6 million with the majority of the cost being in staffing expense of $3.1 million. The remaining expense will include cost for maintenance, custodial, utilities, and supplies. Project: Stewart Elementary Build-out Description: The capital projects fund is providing $1.1 million to build-out the remaining 200 seat capacity school in the Conroe feeder system. Status: This project is 100% complete and has an estimated completion date of August 2018. Operating Budget Impact: The build-out includes finishing the existing interior space to provide eight classrooms. The overall impact of the budget will be in staffing, depending on enrollment. Project: Austin Elementary Renovation Description: The capital projects fund is providing $17.8 million to renovate the existing structure of the building. The capacity will not be increased. Status: This project is 19% complete and has an estimated completion date of August 2019. Operating Budget Impact: The overall impact on the budget for this campus is expected at approximately $100,000 for custodial and utility expenses. Project: Grangerland Addition Description: The capital projects fund is providing $5.5 million for the addition of eight classrooms. Status: This project is 100% complete as of August 2017. Operating Budget Impact: This addition is replacing portable buildings so this should have no impact on the budget.
Project: Technology/Life Cycle/Safety & Security/CTE Robotics/Transportation Description: The capital projects fund is providing $32.4 million for technology, $50.9 million for life cycle improvements, $13.6 million for security, $5.2 million for CTE/Robotics and $6.5 million for new buses. This funding is being used to support the District’s goals.
247

2018/2019
Enrollment Capacity Age of Building
Elementaries:
Anderson 650 800 23
Armstrong 708 770 48
Austin 1,000 950 65
Birnham Woods 1,038 1,000 8
Bradley 854 1,000 0
Buckalew 622 770 19
Bush 735 850 21
Broadway 940 1,000 10
Creighton 854 770 37
David 713 700 27
Deretchin 566 600 12
Ford 837 900 39
Galatas 636 850 23
Giesinger 724 700 27
Glen Loch 721 600 37
Hailey 820 680 39
Houser 838 900 37
Houston 691 1,000 10
Kaufman 873 1,000 11
Lamar 758 770 46
Milam 774 1,000 11
OakRidge 766 750 44
Patterson 815 1,000 3
Powell 914 850 23
Reaves 718 730 43
Rice 604 730 39
Ride 747 660 34
Runyan 590 610 50
San Jacinto 710 850 37
Snyder 991 1,000 4
Stewart 621 630 3
Tough 522 835 15
Wilkinson 731 1,000 8Total Elementary: 25,081 27,255
Intermediates:
Bozman 859 1,000 8
Clark 801 1,000 0
Collins 771 800 27
Cox 830 1,000 9
Cryar 757 1,000 13
Deretchin 332 585 12
Grangerland 1,185 1,185 9
Mitchell 1,165 1,200 21
Stewart 182 170 3
Tough 312 350 15
Travis 696 700 91
Vogel 1,129 1,185 16
Wilkerson 794 730 43
Total Intermediate: 9,813 10,905
Junior Highs:
Irons 1,142 1,200 5
Knox 1,442 1,400 39
McCullough 2,143 2,300 41
Moorhead 1,128 1,100 16
Peet 1,423 1,500 4
Washington 824 750 66
York 1,438 1,500 10
Total Junior High: 9,540 9,750
High Schools:
Caney Creek 2,078 2,890 22
Conroe 2,992 3,300 55
Conroe 9th 1,076 1,200 22
Grand Oaks 1,196 3,000 0
Hauke Alternative 142 250 78
Oak Ridge 2,982 2,300 36
Oak Ridge-9th Grade Campus 575 1,350 32
The Woodlands 3,258 3,100 21
The Woodlands- 9th Grade Campus 1,090 1,300 17
The Woodlands College Park 3,123 2,850 12
DAEP/JJAEP 68 66
Total High School: 18,580 21,606
District Totals: 63,014 69,516
School Name
Capacity, Enrollment and Age by School
248

School Name Capacity
2018/2019
Enrollment
Elementary 27,255 25,081
Intermediate 10,905 9,813
Junior High 9,750 9,540
High School 21,606 18,580
Capacity, Enrollment by School Grade Level
- 2,000 4,000 6,000 8,000
10,000 12,000 14,000 16,000 18,000 20,000 22,000 24,000 26,000 28,000 30,000
Ele
menta
ry
Inte
rme
dia
te
Ju
nio
r H
igh
Hig
h S
ch
ool
Enrollment Compared to Capacity
Capacity
2018/2019 Enrollment
249

Conroe Independent School District
250

Financial Section Food Service Fund

Food Service Special Revenue Fund The District’s food service operations are accounted for in the Food Service Special Revenue Fund. Although special revenue funds are generally not included in the annual budget adopted by the Board of Trustees, TEA regulations require inclusion of the food service fund. Approximately (59%) of the revenue in this fund is received from the United States Department of Agriculture (USDA) under the National School Lunch Program and the School Breakfast Program. The remaining revenue (41%) is primarily generated from user fees – i.e. student payments for meals and is budgeted based on prior year actual information and projected enrollment. The Food Service revenue is budgeted to decrease by $196,171 or .89% less than the 2017-2018 projected revenues. The following table provides a comparison of revenues by source for the 2018-2019 budget year.
Food Service expenditures consist primarily of payroll (39%) and supplies and materials (51%). The majority of the supplies and materials budget consists of expenditures for food. Food Service fund expenditures are budgeted at $22,000,000, an increase of $326,006 or 1.48% higher than 2017-2018 projected expenditures. It is recommended that the fund balance for Food Service not exceed approximately three months of average food service operation expenditures. The current fund balance is projected at $3,517,732 which is within these guidelines. These balances must be used exclusively for allowable child nutrition program purposes.
251

Child Nutrition Goals & Objectives
Robyn Hughes, Director of Child Nutrition
Mission: The Power Station will provide quality meals and service that exceed Child Nutrition guidelines, while maintaining a financially self sufficient department
GOAL 1: Add an additional Child Nutrition Field Supervisor to provide adequate
supervision of kitchen managers. Child Nutrition will fund this position.
GOAL 2: Decreasing student charges by 10% with identifying students early in the school
year who qualify for free and reduced lunch and ensure an application is completed.
GOAL 3: Focus on providing on-site training to employees on campuses that consistently
needs improvements on kitchen inspections/observations.
GOAL 4: Create special menus and activities for National School Lunch Week and
National School Breakfast Week to raise awareness of the benefits of school meals.
252

2014-15 2015-16 2016-17 2017-18 2018-19
Actual Actual Actual Projected Budgeted
Revenues
Local sources 7,031,534$ 7,287,364$ 7,799,024$ 8,310,970$ 9,105,362$
State Sources 81,849 93,793 88,511 95,752 -
Federal sources 10,906,871 11,709,735 12,504,156 13,789,449 12,894,638
Total Revenues 18,020,254 19,090,892 20,391,691 22,196,171 22,000,000
Expenditures by function
Food service 17,473,807 17,840,912 18,368,540 20,001,196 20,471,000
Maintenance & Operations 1,449,875 1,446,589 1,459,402 1,672,798 1,529,000
Total Expenditures 18,923,682 19,287,501 19,827,942 21,673,994 22,000,000
Revenues Over (Under) (903,428) (196,609) 563,749 522,177 -
Expenditures
Fund Balances, beginning 3,531,843 2,628,415 2,431,806 2,995,555 3,517,732
Fund Balances, ending 2,628,415$ 2,431,806$ 2,995,555$ 3,517,732$ 3,517,732$
Food Service Fund
Five Year Summary of Revenues and Expenditures
10.00%
13.00%
16.00%
19.00%
$1,500,000
$2,000,000
$2,500,000
$3,000,000
$3,500,000
$4,000,000
$4,500,000
$5,000,000
2014-15 2015-16 2016-17 2017-18 2018-19
Fund Balance as a % of Expenditures
Fund Balance % of Total Expenditures
253

2017-18
2016-2017 Amended 2017-18 2018-2019 Percent
Actual Budget Projected Budgeted of Total
Revenues
Local sources 7,799,024$ 8,429,784$ 8,310,970$ 9,105,358$ 41.39%
State Sources 88,511 - 95,752 -
Federal sources 12,504,156 11,485,466 13,789,449 12,894,642 58.61%
Total Revenues 20,391,691 19,915,250 22,196,172 22,000,000 100.00%
Expenditures by object
Payroll 8,135,784 8,172,800 8,537,970 8,580,000 39.0%
Purchased & contracted services 1,421,087 1,843,314 1,754,985 1,634,000 7.4%
Supplies 10,245,300 10,476,207 10,890,284 11,135,000 50.6%
Other operating expense 19,828 31,348 31,178 30,000 0.1%
Capital outlay 5,943 478,621 459,577 621,000 2.8%
Total Expenditures 19,827,942 21,002,290 21,673,994 22,000,000 100.00%
Exess of Revenues Over
(Under) Expenditures 563,749$ (1,087,040)$ 522,178$ -$
Food Service Fund
Budget Summary: 2018-19
Revenue & Expenditure Summary by Major Object
39.0%
7.4%50.6%
0.1% 2.8%
Expenditures by Major Object
Payroll
Purchased & contracted services
Supplies
Other operating expense
Capital outlay
254

Informational Section

Long Range Financial Forecasts The following financial forecasts are used to determine the impact of current financial decisions on subsequent fiscal years. The models are updated, reviewed, and evaluated more by the Chief Financial Officer and Business & Accounting Managers, as circumstances change. The model used for the General and Debt Service Funds is much more detailed than the ones used for Capital Projects and Food Service Funds, since many more factors and assumptions are involved. Review and evaluation of these plans, in conjunction with the budget development process, insures that short-term financial decisions are made only after consideration of the long-term consequences.
General and Debt Service Forecasts Revenue Sources The general and debt service funds have two primary sources of revenue, tax collections and state funding. The collection of taxes is the primary source of revenue for both the general and debt service fund. Tax collections make up approximately 77% of the revenue for both funds. Tax revenues are increasing due to rising property values and significant growth in the district. The second source of revenue comes from state funding. State funding generates approximately 23% of the revenues for these funds. Although state funding is only 23% of the revenue budget it requires a more complex calculation to derive the amount of funding that the District will receive.
23.0%
77.0%
2018-19 Revenue Budget (General Fund & Debt Service Fund Combined)
State
Local Taxes
Expenditures The total General Fund expenditure budget for 2018-19 is $495,459,113. This is an increase of $16,736,388 over projected 2017-18 expenditure levels. As always, the majority of expenditures for the school district are personnel costs.
89.26%
5.45%3.85%
1.31%
0.14%
General Fund Expenditures by Major Object
Payroll Cost
Purchase & cont. serv.
Supplies and materials
Other operating expend
Capital outlay
255

Long Range Financial Forecasts (continued) General Fund, fund balance is projected to increase from $134.3 million in 2016-17 to $138.1 million in 2017-18. The increase in fund balance is a result of enrollment growth and steady increases in local property tax values. The District feels certain it will be able to maintain a constant and stable fund balance in the General Fund.
0
20,000,000
40,000,000
60,000,000
80,000,000
100,000,000
120,000,000
140,000,000
160,000,000
2008 2009 2010 2011 2012 2013 2014 2015 2016 2017 2018
General Fund Balances
The Debt Service fund, 2018-2019 expenditures consist of the following amounts: $46.3 million for bond principal payments and $56.8 million for bond interest and fee payments. Total 2018-19 budgeted expenditures for the Debt Service fund are $103.1. The fund balance is projected to decrease to $9.8 million in 2018-2019. The District feels comfortable that we can maintain a constant and stable fund balance for the Debt Service fund. Projection Model Following this section, you will see a variety of schedules and calculations that are used by the District in projecting its revenues and expenditures for future years. The schedules for the General and Debt Service funds are listed first from pages 262-263. The financial projection summary listed on pages 262-263 is a composite of all the calculations performed on the preceding worksheets pages 264-273. The Capital Projects Fund and Food Service Fund projections are listed on pages 274-275. Additional information is provided in the remainder of this section. Throughout this model we use projected amounts for the current fiscal year (2017-18), and proposed amounts for the next budget year (2018-19) to project the subsequent three fiscal years. In addition to reviewing past trends, we also take into consideration many other factors. Further explanation of each component is listed below: Projection Model Components Summary The summary sheet is a composite of all the calculations performed on each of the other worksheets described below. The summary section of the Long-Range Plan consolidates enrollment projections, taxable value estimates, State aid estimates, and many other factors into a single comprehensive financial plan, and calculates the effect on the projected tax rate for each subsequent fiscal year. The 2018-19 budgeted tax rate in the general fund is $1.06 which is an increase of 2 cents from the 2017-18 tax rate. As a result of the impact of Hurricane Harvey, Governor Abbott added Montgomery County to his state disaster declaration list on August 26, 2017, and he requested federal and state disaster assistance at that time. Because the District had increased expenditures in response to Hurricane Harvey, the District was then be eligible to raise its maintenance and operations taxes above the rollback rate without a ratifying election. This one time exception is in accordance with Section 26.08(a) of the Texas Tax Code. Under current law, the maximum tax rate a school district can have in the general fund is $1.17.
256
Long Range Financial Forecasts (continued)
The debt service summary included in the long-range projection allows for estimated increases in debt requirements due to future bond sales. The accompanying debts schedules represent only the amounts due as of September 1, 2018 since complete information is not available on future bond sales. The debt service tax rate is budgeted to decrease to $.22 cents for fiscal year 2018-19.
Assumptions The assumptions section is used to consolidate variables entered in other sections and to input other data required in the computations of future year expenditures and revenues. Many of the parameters are directly input in this section – taxable value, collection percentage, salary increases, and utility costs for new facilities. Other values, such as enrollment and ADA are linked from other worksheets. Debt Schedule
This debt requirement worksheet represents the current debt requirements as of September 1, 2018 only. The summary schedule discussed above includes amounts for anticipated new debt from future bond sales. State Revenue Estimate Worksheets The calculations on these worksheets are based on the current state funding formula. Three of the most critical factors in estimating General Fund State aid are ADA projections, FTE’s for special education students, and taxable values. ADA figures are linked from the enrollment sheet and taxable values are linked from the assumption sheet. Special Education FTE’s are projected based on historical percentage growth rates for each instructional arrangement. The most critical factor in calculating Debt Service State aid under both the IFA and EDA programs is debt service requirements. These figures are linked from the debt schedule. Statistics This section provides additional information concerning historical and projected statistical information for the District. Enrollment Enrollment projections are one of the most significant factors in the budget development and long-range financial planning process. Enrollment projections are designed to predict the student enrollment of the District based on geographic data, student data, migration data, and historical data of student populations. The District uses two models to produce enrollment projections. The first method, Cohort Survival, uses historical data to project the number of students based on a survival rate. This survival rate is based on three key elements:
Progressors – Students who are promoted to the next grade level within the District
Retained – Students who are retained at their current grade within the District
Migrants – Students who are new, first time students in the District The other model used to predict enrollment growth is Linear Regression Trend Analysis. This method uses historical data (ten years) to determine a best-fit trend line per grade level. This model projects an even growth rate based on this trend line and is very effective when growth patterns are somewhat consistent. In addition to these statistical algorithms, we also, through the use of a comprehensive database, monitor the growth of every subdivision and apartment complex within the District. Information regarding the age and number of units, along with the number of students, allows us to develop profiles on these developments. Utilizing these profiles, we can anticipate enrollment trends of new developments as well as changes, such as renovations to aging apartment complexes. The combination of statistical trends and detailed development information allows the District to forecast trends, as well as prepare for exceptions.
257

Long Range Financial Forecasts (continued)
Capital Projects Fund
The District currently has issued $487 million of the $487 million in bonds available to sell from the 2015 bond referendum. An extensive list of all projects included in the 2015 bond referendum are included in Capital Projects section of this document.
Food Service Special Revenue Fund
Forecasts for this fund are based on a revenue and expenditures per student basis for the current budget year (2018-19) and adjusted for projected increases due to inflation and growth in participation.
258

Conroe Independent School District
259

2017-18 2018-19 2019-20 2020-21 2021-22Projected Budget Projected Projected Projected
General Fund
Tax Rate $1.0400 $1.0600 $1.0400 $1.0400 $1.0400
Revenues
5700 Total local revenue 357,994,721$ 370,703,836$ 393,762,269$ 399,173,788$ 415,269,821$
5800 Total state revenue 136,189,132 131,571,646 113,482,669 108,224,240 102,784,831
5900 Total federal sources 6,515,873 - - - -
5000 Total revenues 500,699,726 502,275,482 507,244,938 507,398,028 518,054,652
Expenditures
6100 Total payroll costs 425,748,009 442,197,112 459,884,996 478,280,396 497,411,612
6200 Total contracted services 26,134,005 27,013,305 27,553,571 28,104,643 28,666,735
6300 Total supplies & materials 18,611,539 19,060,106 19,441,308 19,830,134 20,226,737
6400 Total other fees 5,876,401 6,485,890 6,615,608 6,747,920 6,882,879
6600 Total capital outlay 2,352,771 702,700 750,000 750,000 750,000
Total expenditures 478,722,725 495,459,113 514,245,484 533,713,093 553,937,963
Other Financing Sources & Uses (18,200,000) - - - -
Fund Balance - Beg. of Year 134,311,221 138,088,222 144,904,591 137,904,045 111,588,980
Fund Balance - End of Year 138,088,222$ 144,904,591$ 137,904,045$ 111,588,980$ 75,705,669$
Conroe Independent School DistrictFinancial Projection: Summary
260

2017-18 2018-19 2019-20 2020-21 2021-22
Projected Budget Projected Projected Projected
Debt Service FundTax Rate $0.2400 $0.2200 $0.2400 $0.2400 $0.2400
Revenues
5700 Total local revenue 81,457,812$ 79,122,595$ 89,200,908$ 92,768,944$ 96,479,702$
5800 Total state revenue 1,535,600 1,630,972 1,647,282 1,663,755 1,680,392
5000 Total revenues 82,993,412 80,753,567 90,848,190 94,432,699 98,160,094
Expenditures
6000 Total expenditures 100,397,172 103,055,656 101,846,538 101,846,319 101,846,563
7020 Other resources 12,067,486 - 5,000,000 5,000,000 5,000,000
Fund Balance - Beg. of Year 37,487,957 32,151,683 9,849,594 3,851,246 1,437,625
Fund Balance - End of Year 32,151,683$ 9,849,594$ 3,851,246$ 1,437,625$ 2,751,156$
Combined Tax Rate $1.2800 $1.2800 $1.2800 $1.2800 $1.2800
Inc/(Dec) in Combined Tax Rate $0.0000 $0.0000 $0.0000 $0.0000
Conroe Independent School DistrictFinancial Projection: Summary
261

Budget Projected Projected Projected
General Funds 2017-18 2018-19 2019-20 2020-21 2021-22
Current - Taxable Value MCAD 33,799,892,825$ 35,737,543,316$ 37,167,045,049$ 38,653,726,851$ 40,199,875,925$
% Increase from prior year 4.25% 5.73% 3.50% 3.50% 3.50%
Collections % 100.00% 100.00% 100.00% 100.00% 100.00%
Projected Student Enrollment 61,580 63,014 64,414 65,814 67,214
Student ADA 58,001 59,233 60,549 61,865 63,181
Salary Increase 2.50% 2.00% 2.0% 2.0% 2.0%
Conroe Independent School District
Financial Projection: Assumptions
262

Year Ended Percent
August 31 Principal Interest Total Retired
2019 $ 46,300,000 $ 55,755,656 $ 102,055,656 5.41%
2020 48,005,000 53,741,538 101,746,538 10.81%
2021 50,165,000 51,581,319 101,746,319 16.20%
2022 52,515,000 49,231,563 101,746,563 21.60%
2023 55,120,000 46,628,875 101,748,875 26.99%
2024 57,905,000 43,842,397 101,747,397 32.39%
2025 60,820,000 40,926,719 101,746,719 37.78%
2026 63,845,000 37,904,506 101,749,506 43.18%
2027 66,895,000 34,854,644 101,749,644 48.57%
2028 69,865,000 31,883,744 101,748,744 53.97%
2029 72,815,000 28,933,069 101,748,069 59.36%
2030 75,980,000 25,767,438 101,747,438 64.76%
2031 56,650,000 22,846,394 79,496,394 68.97%
2032 59,275,000 20,223,988 79,498,988 73.19%
2033 62,085,000 17,414,350 79,499,350 77.40%
2034 64,960,000 14,535,544 79,495,544 81.62%
2035 67,875,000 11,622,003 79,497,003 85.84%
2036 30,250,000 9,445,550 39,695,550 87.94%
2037 31,640,000 8,056,550 39,696,550 90.05%
2038 33,050,000 6,648,275 39,698,275 92.15%
2039 34,585,000 5,111,850 39,696,850 94.26%
2040 30,035,000 3,663,206 33,698,206 96.04%
2041 31,325,000 2,372,013 33,697,013 97.83%
2042 24,915,000 1,181,225 26,096,225 99.21%
2043 14,525,000 324,869 14,849,869 100.00%
$ 1,261,400,000 $ 624,497,281 $ 1,885,897,281
Represents payment obligations of both principal and interest by year until all outstanding debt is paid in full.
Debt Retirement Summary
0.00%
20.00%
40.00%
60.00%
80.00%
100.00%
2019 2023 2028 2033 2038 2043
Percent of Debt Retired by Year
263

Budget Projected Projected Projected
2018-19 2019-20 2020-21 2021-22
Student Counts:
Refined ADA (PreK-12) 59,233 60,549 61,865 63,181
Projected Increase in ADA 2.12% 2.22% 2.17% 2.13%
Special Education FTEs:
Homebound 2.145 2.161 2.182 2.204
Hospital Class 2.763 2.767 2.794 2.822
Speech Therapy 84.788 85.598 86.454 87.318
Resource Room 645.852 652.255 658.778 665.365
S/C Mild/Moderate/Severe 499.657 504.491 509.536 514.632
Off Home Campus 2.346 2.388 2.412 2.436
VAC 8.693 8.691 8.778 8.866
Nonpublic contracts - - - -
Res Care & Treatment 5.930 5.992 6.052 6.113
Total Special Ed FTEs (Calculated #) 1,252.174 1,264.343 1,276.986 1,289.756
Total Weighted FTEs (Calculated #) 3,929.529 3,967.739 4,007.414 4,047.488
Career & Technology FTEs 2,571.990 2,590.707 2,616.614 2,642.780
Regular ADA (Calculated#) 55,408.996 56,693.950 57,971.400 59,248.624
Mainstream ADA 1,138.843 1,149.305 1,160.798 1,172.406
Compensatory Education Enrollment 25,023.000 26,146.375 26,407.839 26,674.917
FTEs of Pregnant Students 3.523 3.529 3.564 3.599
Bilingual ADA 7,588.036 7,620.449 7,658.551 7,696.844
G T Operational Enrollment (Max 5% of ADA) 2,961.658 3,027.458 3,093.258 3,159.058
Number of Full-time Employees(exc admin & teachers) 3,097 3,120 3,151 3,183
Number of Part-time Employees 145 146 148 149
Other Data
Current Year Tax Collections (M&O+I&S) 457,440,554 475,738,176 494,767,699 514,558,411
Prior year CPTD 33,601,457,056 35,737,543,316 37,167,045,049 38,653,726,851
Prior year ADJ CPTD 33,601,457,056 35,737,543,316 37,167,045,049 38,653,726,851
Estimated Current Year Value 35,737,543,316 37,167,045,049 38,653,726,851 40,199,875,925
Prior Year I&S Tax Collections 80,854,517 78,622,595 89,200,908 92,768,943
Current Year M&O Taxes Collected 378,817,959 386,537,268 401,998,756 418,078,709
Guaranteed Level (Tier II, Level II) 106.28 106.28 106.28 106.28
Weighted ADA (Calculated #) 74,181 75,869 77,379 78,890
IFA Debt Payment 102,055,656 101,746,538 101,746,319 101,746,563
Small/Sparse School Data:
Square Miles 348 348 348 348
Highest Grade Taught 12 12 12 12
Basic Allotment Data:
Basic Allotment 5,140 5,140 5,140 5,140
Cost of Education Index 1.16 1.16 1.16 1.16
Adjusted Basic Allotment 5,724 5,724 5,724 5,724
Conroe Independent School District
Financial Projection: State Revenues EstimatesBased on Current State Funding Formula
264

Budget Projected Projected Projected
2018-19 2019-20 2020-21 2021-22
Conroe Independent School District
Financial Projection: State Revenues EstimatesBased on Current State Funding Formula
Tier I Funding
Regular Block Grant 317,161,033$ 322,362,711$ 329,626,289$ 336,887,675$
Regular Special Education Block Grant 22,356,877 22,424,262 22,648,505 22,874,990
Mainstream 7,170,609 7,188,442 7,260,327 7,332,930
Care & Treatment Facility Student 135,767 136,284 137,646 139,023
Less Charge for District Share (331,250) (344,739) (344,739) (344,739)
Career & Technology Block Grant 19,892,272 19,896,006 20,094,967 20,295,820
Gifted & Talented Block Grant 2,034,304 2,065,695 2,110,592 2,155,488
Comp Ed Block Grant 28,646,330 29,733,658 30,030,994 30,331,304
Comp Ed Pregnant Allotment 48,598 48,352 48,836 49,324
Bilingual Education Block Grant 4,343,392 4,332,987 4,354,652 4,376,425
High School Allotment 4,723,845 4,828,796 4,933,747 5,038,698
New Instructional Facilities Allotment 413,699 540,500 - -
Transportation Allotment 7,261,569 7,552,944 7,704,003 7,704,003
Total Cost of Tier I 413,857,045 420,765,898 428,605,819 436,840,941
Less: Local Share of Tier I Cost (336,014,571) (354,981,018) (369,180,258) (383,947,469)
State Share of Tier I Cost 77,842,474$ 65,784,880$ 59,425,561$ 52,893,472$
Foundation School Fund Detail
State Share of Tier I 77,842,474 65,784,880 59,425,561 52,893,472
Tier II Entitlement 28,862,212 21,819,489 21,904,731 21,962,737
Other Programs
Staff Allotment 1,566,960 1,578,300 1,593,948 1,628,622
Total Other Programs 1,566,960 1,578,300 1,593,948 1,628,622
Less Available School Fund (25,954,305) (11,846,632) (22,705,935) (12,373,032)
Total Foundation 82,317,341$ 77,336,037$ 60,218,305$ 64,111,799$
State Aid By Funding Source
Foundation School 82,317,341 77,336,037 60,218,305 64,111,799
Available School Fund-State Portion 25,954,305 11,846,632 22,705,935 12,373,032
Total State Aid 108,271,646$ 89,182,669$ 82,924,240$ 76,484,831$
265

Maintenace & Operations% State % Property % Tax Local % Total %
Year Enrollment ADA Inc Revenue Inc Value Inc Rate Revenue Inc Expenditures Inc
09/10 49,629 46,280 3% 137,429,383$ 0% 19,868,233,651$ 8.2% 1.04$ 209,308,872$ 6% 311,060,458$ 0%
10/11 51,170 47,883 3% 136,941,421 0% 20,272,987,620 2.0% 1.04 215,189,936 3% 313,768,706 1%
11/12 52,664 49,498 3% 126,004,383 -8% 20,990,342,459 3.5% 1.04 223,874,813 4% 322,453,532 3%
12/13 53,934 50,465 2% 132,085,800 5% 22,009,980,056 4.9% 1.04 234,580,314 5% 339,536,941 5%
13/14 55,009 51,830 3% 152,693,932 16% 23,908,871,455 8.6% 1.04 252,830,482 8% 368,889,550 9%
14/15 56,363 53,165 3% 154,845,838 1% 26,928,550,056 12.6% 1.04 284,917,123 13% 399,956,145 8%
15/16 58,239 54,147 2% 156,962,938 1% 29,840,409,057 10.8% 1.04 313,691,107 10% 426,169,147 7%
16/17 59,764 56,653 5% 133,990,651 -15% 32,423,298,323 8.7% 1.04 343,599,303 10% 457,118,178 7%
17/18 61,580 58,001 2% 124,131,419 -7% 33,799,892,825 4.2% 1.04 357,994,721 4% 478,722,725 5%
18/19 63,014 59,233 2% 131,571,646 6% 34,982,889,074 3.5% 1.06 370,703,836 4% 495,459,113 3%
19/20 64,414 60,549 2% 113,482,669 -14% 36,207,290,192 3.5% 1.04 393,762,269 6% 514,245,484 4%
20/21 65,814 61,865 2% 108,224,240 -5% 37,474,545,348 3.5% 1.04 399,173,788 1% 533,713,093 4%
21/22 67,214 63,181 2% 102,784,831 38,786,154,435 3.5% 1.04 415,269,821 4% 553,937,963 4%
Debt Service
Debt % Tax Combined
Year Requirement Inc Rate Tax Rate
09/10 64,083,400$ 14.558% 0.245$ 1.285$
10/11 63,860,446 -0.348% 0.255 1.2950
11/12 71,398,242 11.804% 0.255 1.2950
12/13 76,163,263 6.674% 0.250 1.2900
13/14 78,769,779 3.422% 0.245 1.2850
14/15 80,171,033 1.779% 0.240 1.2800
15/16 83,142,150 3.706% 0.240 1.2800
16/17 90,252,945 8.553% 0.240 1.2800
17/18 98,312,286 8.930% 0.240 1.2800
18/19 102,055,656 3.808% 0.220 1.2800
19/20 101,746,538 -0.303% 0.240 1.2800
20/21 101,746,319 0.000% 0.240 1.2800
21/22 101,746,563 0.000% 0.240 1.2800
Financial Projection: Statistics
Conroe Independent School District
266

Conroe Independent School District
267

2014-15 2015-16 2016-17 2017-18 2018-19
Assessed/Market value of a home 252,948$ 283,155$ 296,236$ 294,906$ 293,518$
Less: Homestead exemption 15,000 15,000 25,000 25,000 25,000
Taxable value 237,948 268,155 271,236 269,906 268,518
Total property tax rate 1.2800 1.2800 1.2800 1.2800 1.2800
Property tax due 3,046$ 3,432$ 3,472$ 3,455$ 3,437$
Percent of property tax due increase 12.06% 12.69% 1.15% -0.49% -0.51%
(decrease) from prior year
Each year the Montgomery County Appraisal District appraises property based on market conditions such as sales in
the surrounding areas. The above schedule shows how market conditions & tax rates would affect the amount of
property tax due through 2018-19 based on the overall trends of the District.
Conroe Independent School District
Impact of Budget on Taxpayers
$1,000
$1,500
$2,000
$2,500
$3,000
$3,500
$4,000
2014-15 2015-16 2016-17 2017-18 2018-19
Property Tax Due
268

Real Property Personal Property Total Ratio of Total
Year Ended Total Assessed Assessed Assessed Assessed to Total
August 31 Market Value Actual Value Actual Value Actual Value Estimated Actual
2010 $ 22,991,662,878 $ 17,018,008,478 $ 2,668,225,173 $ 19,686,233,651 100.0%
2011 23,991,799,971 17,781,737,609 2,491,250,011 20,272,987,620 100.0%
2012 24,686,808,151 18,323,816,339 2,666,526,120 20,990,342,459 100.0%
2013 26,050,843,481 19,138,270,459 2,871,709,597 22,009,980,056 100.0%
2014 28,246,187,070 20,648,910,108 3,259,961,347 23,908,871,455 100.0%
2015 31,782,194,180 23,379,122,531 3,549,427,525 26,928,550,056 100.0%
2016 35,825,808,317 25,996,570,366 3,843,838,691 29,840,409,057 100.0%
2017 38,424,242,936 28,494,152,908 3,929,145,415 32,423,298,323 100.0%
2018 39,920,030,760 29,934,646,693 3,865,246,132 33,799,892,825 100.0%
2019 42,415,177,701 31,615,123,172 4,122,420,144 35,737,543,316 100.0%
Determining Assessed Value:
The market approach to value is based on sales prices of similar properties. It compares the property being appraised to similar properties that have
recently sold and then adjusts the comparable properties differences between them and the property being appraised.
The income approach is based on income and expense data and is used to determine the present worth of future benefits. It seeks to determine what
an investor would pay now for a future revenue stream anticipated to be received from the property.
The cost approach is based on what it would it cost to replace the building (improvement) with one of equal utility. Depreciation is applied and the
estimate is added to the land value.
Conroe Independent School District
Assessed and Estimated Value of Taxable Properties
Last Ten Fiscal Years
Montgomery Country Appraisal District determines the value of all taxable property within the county boundaries. Tax Code Section 25.18 requires
appraisal districts to reappraise all property in its jurisdiction at least once every three years. Tax Code Section 23.01 requires that appraisal districts
comply with the Uniform Standards of Professional Appraisal Practice if mass appraisal is used and that the same appraisal methods and techniques be
used in appraising the same or similar kinds of property. Individual characteristics that affect the property's market value must be evaluated in determining
the property's market value.
Before appraisals begin, Montgomery Country Appraisal District compiles a list of taxable property. The list contains a description and the name and
address of the owner for each property. In a mass appraisal, the appraisal district then classifies properties according to a variety of factors, such as size,
use and construction type. Using data from recent property sales, the appraisal district appraises the value of typical properties in each class. Taking into
account differences such as age or location, the appraisal district uses typical property values to appraise all the properties in each class.
Three common approaches that the appraisal district may use in appraising property are the sales comparison (market) approach, the income approach
and the cost approach.
269

Fiscal Year Current Percent Delinquent Total
Ended Tax of Levy Tax Tax
August 31, Tax Rateª Tax Levy Collections Collected Collections Collections
2009 1.2700$ 233,321,671$ 230,631,076$ 98.8% 2,584,330$ 233,215,406$
2010 1.2850 253,535,631 250,811,874 98.9% 1,456,066 252,267,940
2011 1.2950 262,177,711 259,312,291 98.9% 1,600,590 260,912,881
2012 1.2950 271,586,936 269,231,387 99.1% 2,402,018 271,633,405
2013 1.2900 283,604,775 281,471,393 99.2% 2,044,470 283,515,863
2014 1.2850 306,032,828 303,640,582 99.2% 1,655,510 305,296,092
2015 1.2800 342,333,079 340,022,635 99.3% 2,151,240 342,173,875
2016 1.2800 378,256,391 375,151,982 99.2% 1,948,425 377,100,407
2017 1.2800 412,503,483 409,238,612 99.2% 2,235,332 411,473,944
2018 1.2800 429,095,967 426,070,764 99.3% 2,204,097 428,274,861
2019 1.2800 457,440,554 454,925,698 99.2% 2,514,856 457,440,554
ª Per $100 of assessed value
Conroe Independent School District
Property Tax Rates, Levies, and Collections
Last Ten Fiscal Years and 2019 Projected
270

11/12 12/13 13/14 14/15 15/16 16/17 17/18 18/19
EE 251 238 212 241 236 273 279 298
Pre-K 1,423 1,456 1,385 1,319 1,308 1,290 1,395 1,452
Kindergarten 3,865 3,992 4,048 4,186 4,151 4,129 4,210 4,298
Grade 1 4,171 4,178 4,378 4,445 4,606 4,546 4,442 4,636
Grade 2 4,050 4,214 4,207 4,384 4,531 4,706 4,651 4,576
Grade 3 4,144 4,141 4,244 4,263 4,549 4,689 4,912 4,790
Grade 4 4,092 4,126 4,160 4,317 4,373 4,621 4,836 5,008
Elementary 21,996 22,345 22,634 23,155 23,754 24,254 24,725 25,058
Grade 5 4,021 4,130 4,188 4,293 4,467 4,498 4,850 4,952
Grade 6 3,916 4,022 4,138 4,207 4,372 4,510 4,565 4,881
Intermediate 7,937 8,152 8,326 8,500 8,839 9,008 9,415 9,833
Grade 7 4,075 4,122 4,193 4,324 4,425 4,589 4,713 4,744
Grade 8 3,811 4,092 4,241 4,313 4,495 4,523 4,684 4,816
Junior High 7,886 8,214 8,434 8,637 8,920 9,112 9,397 9,560
Grade 9 4,162 4,231 4,329 4,505 4,584 4,662 4,802 4,824
Grade 10 3,894 3,890 4,061 4,310 4,475 4,680 4,873 4,785
Grade 11 3,496 3,711 3,659 3,728 4,018 4,165 4,310 4,745
Grade 12 3,293 3,391 3,566 3,528 3,649 3,883 4,092 4,209
High School 14,845 15,223 15,615 16,071 16,726 17,390 18,077 18,563
Total 52,664 53,934 55,009 56,363 58,239 59,764 61,614 63,014
Increase from Prior Yr. 1,494 1,270 1,075 1,354 1,876 1,525 1,850 1,400
ADA 47,883 49,498 50,465 51,830 53,165 54,147 58,001 59,233
19/20 20/21 21/22 22/23 23/24 24/25 25/26 26/27
EE 276 282 288 294 300 306 312 318
Pre-K 1,527 1,560 1,594 1,627 1,660 1,693 1,726 1,760
Kindergarten 4,622 4,723 4,823 4,924 5,024 5,125 5,225 5,326
Grade 1 4,972 5,080 5,189 5,297 5,405 5,513 5,621 5,729
Grade 2 4,986 5,094 5,203 5,311 5,419 5,528 5,636 5,744
Grade 3 5,001 5,110 5,219 5,327 5,436 5,545 5,653 5,762
Grade 4 4,934 5,042 5,149 5,256 5,363 5,470 5,578 5,685
Elementary 26,319 26,891 27,463 28,035 28,607 29,179 29,751 30,323
Grade 5 4,934 5,041 5,148 5,255 5,363 5,470 5,577 5,684
Grade 6 4,821 4,926 5,031 5,135 5,240 5,345 5,450 5,554
Intermediate 9,755 9,967 10,179 10,391 10,603 10,815 11,027 11,239
Grade 7 4,924 5,031 5,138 5,245 5,352 5,459 5,566 5,673
Grade 8 4,921 5,028 5,135 5,242 5,349 5,456 5,563 5,670
Junior High 9,845 10,059 10,273 10,486 10,700 10,914 11,128 11,342
Grade 9 5,064 5,174 5,284 5,395 5,505 5,615 5,725 5,835
Grade 10 4,902 5,009 5,116 5,222 5,329 5,435 5,542 5,648
Grade 11 4,403 4,498 4,594 4,690 4,785 4,881 4,977 5,073
Grade 12 4,126 4,216 4,305 4,395 4,485 4,574 4,664 4,754
High School 18,496 18,898 19,300 19,702 20,104 20,506 20,907 21,309
Total 64,414 65,814 67,214 68,614 70,014 71,414 72,814 74,214
Increase from Prior Yr. 1,400 1,400 1,400 1,400 1,400 1,400 1,400 1,400
ADA 60,549 61,865 63,181 64,497 65,813 67,129 68,445 69,761
Conroe Independent School District
Financial Projections: Enrollment
271

2018-19 2019-20 2020-21 2021-22
Proposed Projected Projected Projected
Revenues
Local sources 352,914$ -$ -$ -$
Total Revenues 352,914 - - -
Expenditures
81 Facilities Acquisition and Construction
6600 Capital outlay 174,872,124 - - -
Total Function 81 174,872,124 - - -
Revenues Over
(Under) Expenditures (174,519,210) - - -
Other Financing Sources (Uses)
General Obligation Bond Proceeds - - - -
Total Other Financing
Sources (Uses) - - - -
Revenues and Other Sources
Over (Under) Expenditures (174,519,210) - - -
Fund Balances, beginning 180,768,949 6,249,739 6,249,739 6,249,739
Fund Balances, ending 6,249,739$ 6,249,739$ 6,249,739$ 6,249,739$
The majority of capital projects related to the 2015 bond referendum are scheduled to be completed by August 2019.
Capital Projects Fund
Revenue and Expenditure Forecasts
Years Ended August 31, 2019 - August 31, 2022
272

2018-19 2019-20 2020-21 2021-22
Proposed Projected Projected Projected
Revenues
Local sources 9,105,362$ 9,287,469 9,473,218 9,662,682
Federal sources 12,894,638 12,959,111 13,023,907 13,089,027
Total Revenues 22,000,000 22,246,580 22,497,125 22,751,709
Expenditures
35 Food Service
6100 Payroll 8,580,000 8,676,166 8,773,879 8,873,167
6200 Purchase and contracted services 1,634,000 1,652,314 1,670,923 1,689,831
6300 Supplies and materials 11,135,000 11,259,803 11,386,613 11,515,467
6400 Other operation expenditures 30,000 30,336 30,678 31,025
6600 Capital outlay 621,000 627,960 635,032 642,220
Total Function 35 22,000,000 22,246,580 22,497,125 22,751,709
Total Expenditures 22,000,000 22,246,580 22,497,125 22,751,709
Excess Revenues Over
(Under) Expenditures -$ -$ -$ -$
Food Service Fund
Revenue and Expenditure Forecasts
Years Ended August 31, 2019- August 31, 2022
273

Conroe Independent School District
274

Informational Section Personnel

Salary Proposals The Conroe Independent School District (CISD) utilizes the Texas Association of School Boards (TASB) as its compensation consultant. Each year TASB reviews our plan and may make adjustments to allow for changes in the competitive job market. The highlights of the pay plan are listed below: • In establishing the plan, a market study was completed to compare positions in our school district with similar positions in surrounding school districts as well as private industry. • Similar positions are placed in common pay groups based on the knowledge, skills, and effort required. • For each position, there is a midpoint which represents the market rate for the position. • In 2018-19, salary adjustments were made based on a percentage increase on the midpoint for each pay group. Current teachers received a raise in the amount of $1,450, starting teacher pay was increased to $53,700. The percentage increase was 3% for all support positions and 2.5% for all other professional positions. • If an employee’s current rate of pay was below the midpoint, the percentage increase was higher. If the current rate of pay is higher than the midpoint, the percentage increase is less. • The goal each year is to make us more competitive with other school districts with whom we compete for employees.
275

Actual Actual Actual Projected Budgeted
Function 2014-15 2015-16 2016-17 2017-18 2018-19
11 Instruction 239,871,891$ 261,209,026$ 279,960,280$ 292,252,150$ 306,778,014$
12 Instructional Resources 4,342,285 4,412,309 4,570,433 4,832,314 5,099,089
13 Curriculum & Instruction 2,960,502 3,490,607 4,108,407 4,658,596 4,344,815
21 Instructional Leadership 2,720,582 3,161,788 3,374,694 3,616,901 3,681,159
23 School Leadership 26,700,541 27,907,219 29,373,862 30,516,432 30,905,550
31 Guidance, Counseling, & Eval. 15,538,727 13,078,201 13,817,954 14,670,308 15,109,720
32 Social Work Services 401,340 555,066 725,542 734,369 735,310
33 Health Services 4,415,789 4,739,299 5,013,432 5,132,673 5,610,983
34 Student Transportation 15,686,305 17,718,860 19,351,277 21,392,738 21,632,713
36 Co-curricular Activities 6,168,393 6,223,534 6,634,150 7,010,618 7,437,475
41 General Administration 5,264,186 5,629,181 6,082,127 6,427,362 6,639,165
51 Plant Maintenance & Operations 19,964,035 22,304,249 23,366,745 24,209,766 25,511,026
52 Security & Monitor Service 5,046,661 5,486,901 6,025,697 6,092,597 6,922,900
53 Data Processing 3,274,108 3,693,589 3,857,240 4,169,085 4,349,510
61 Community Services 6,977 1,975 2,316 4,179 1,500
Total General Fund Payroll
Expenditures 352,362,322$ 379,611,804$ 406,264,156$ 425,720,088$ 444,758,929$
Percentage Increase 8.8% 7.7% 7.0% 4.8% 4.5%
Conroe Independent School District
General FundSchedule of Payroll Expenditures by Function
276

Actual Actual Actual Projected Budgeted
Position 14-15 15-16 16-17 17-18 18-19
Administrators 185.0 186.0 190.0 192.0 200.0
Counselors 161.6 161.6 164.6 168.3 173.3
Librarians 61.0 61.0 62.0 63.0 65.0
Manual Trades 910.5 925.5 943.5 965.5 1,015.5
Nurses 59.2 60.2 61.2 62.2 64.2
Paraprofessionals/Aides 886.0 896.5 916.5 926.5 978.0
Professionals 99.9 107.4 111.4 116.4 117.9
Psych/OTPT Services - Paraprofessional 3.0 3.0 3.0 3.0 3.0
Psych/OTPT Services - Professionals 19.0 19.0 19.0 19.0 19.0
Special Ed - Paraprofessional 21.0 29.0 39.0 41.0 43.0
Special Ed - Professionals 22.8 22.8 24.8 32.8 33.8
Support Personnel 95.0 98.0 100.0 106.0 124.0
Teachers 3,264.1 3,358.6 3,447.6 3,549.9 3,647.9
Totals 5,788.1 5,928.6 6,082.6 6,245.6 6,484.6
Percentage Change 2.05% 2.43% 2.60% 2.68% 3.83%
Conroe Independent School District
Position Counts by Year
(General Fund only)
277

Deputy Deputy
Supt. Supt. Financial Supt./ 18-19
Position Schools Operations Services Board Legal Security Campuses Total
Administrators - 1.5 - 1.0 1.0 - 196.5 200.0
Counselors 15.5 - - - - - 157.8 173.3
Librarians - - - - - - 65.0 65.0
Manual Trades - 1,015.5 - - - - - 1,015.5
Nurses 2.0 - - - - - 62.2 64.2
Paraprofessionals/Aides 40.5 58.1 20.0 2.0 1.0 1.0 855.4 978.0
Professionals 52.5 47.4 14.0 2.0 1.0 1.0 - 117.9
Psych/OTPT Services - Paraprof. 3.0 - - - - - - 3.0
Psych/OTPT Services - Prof. 19.0 - - - - - - 19.0
Special Ed - Paraprofessional 43.0 - - - - - - 43.0
Special Ed - Professionals 33.8 - - - - - - 33.8
Support Personnel - 6.0 12.0 - - 106.0 - 124.0
Teachers 54.8 - - - - - 3,593.1 3,647.9
Totals 264.1 1,128.5 46.0 5.0 3.0 108.0 4,930.0 6,484.6
Percentage of Total 4.07% 17.40% 0.71% 0.08% 0.05% 1.67% 76.03% 100.00%
Conroe Independent School District
Budgeted Position Counts by Division and in Total
(General Fund only)
4%
17%
2%
76%
1%
Position Counts by Division
Dep Supt Schools
Dep Supt Operations
Security
Campuses
Other
0
25
50
75
100
125
150
175
200
11-12 12-13 13-14 14-15 15-16 16-17
Financial Operations CampususInstruction SecurityOther
500
1000
1500
2000
2500
3000
3500
4000
4500
5000
Position Counts by Year
278

Conroe Independent School DistrictTEACHERS, LIBRARIANS, ARD FACILITATORS, AND NURSES
HIRING SCHEDULE2018-2019 School Year Only
__________________________________Master’s DegreeThe salary scale for teachers with a master’s degree isbased on the bachelor’s degree scale noted here, plusa stipend of $1,800 per year.__________________________________Doctorate DegreeThe salary scale for teachers with a doctorate degree(degree must be in the subject area taught andreceived from an accredited university) is based onthe bachelor’s degree scale noted here, plus a stipendof $1,800 per year.__________________________________Bilingual CertificationThe salary scale for teachers with Texas bilingualcertification, who are assigned to a bilingualclassroom, is based on the bachelor's degree scalenoted here, plus a stipend of $4,000 per year.__________________________________
Years of Bachelor’s degreeExperience 187 days
0 $53,700
1 $53,950
2 $54,150
3 $54,350
4 $54,550
5 $54,990
6 $55,370
7 $55,745
8 $55,970
9 $56,270
10 $56,570
11 $56,970
12 $57,470
13 $57,970
14 $58,470
15 $58,970
16 $59,470
17 $59,970
18 $60,470
19 $60,970
20 $61,470
21 $61,970
22 $62,570
23 $63,070
24 $63,570
25+ $64,070
* Creditable years of experience as ofSeptember 1, 2018.
Salaries are developed for one year only.Future salaries cannot be predicted from
this schedule.
279
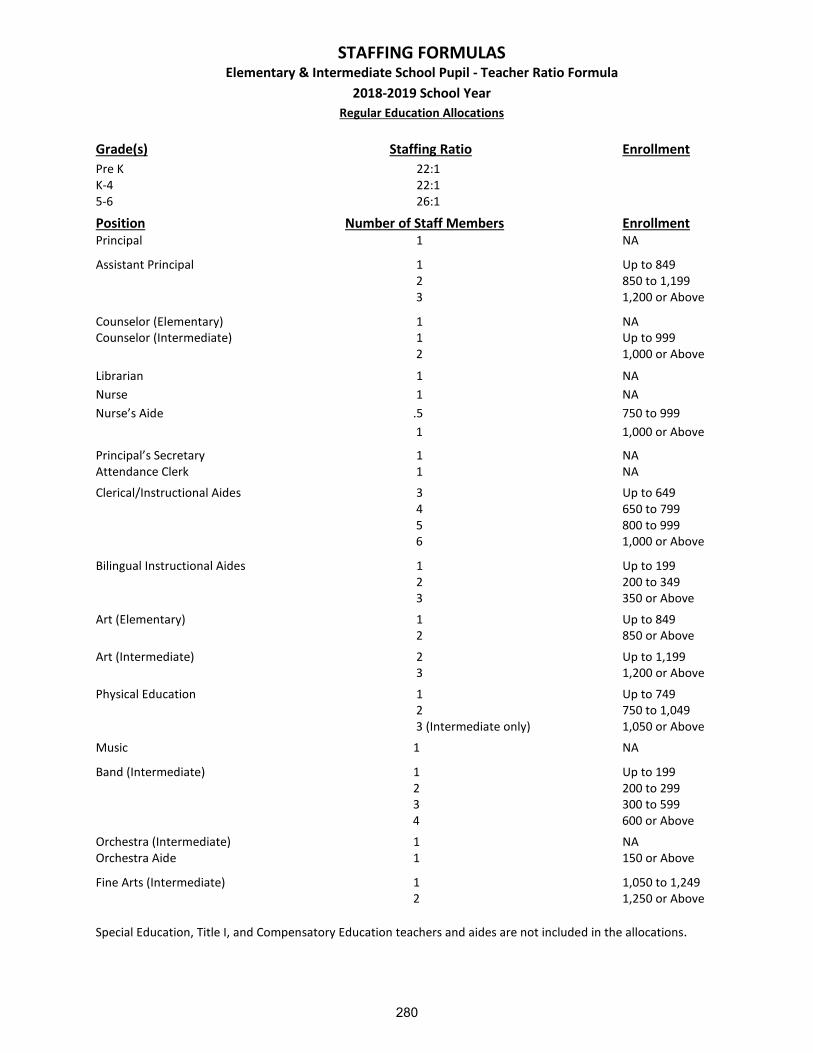
STAFFING FORMULAS
Elementary & Intermediate School Pupil - Teacher Ratio Formula 2018-2019 School Year
Regular Education Allocations
Grade(s) Staffing Ratio Enrollment Pre K 22:1 K-4 22:1 5-6 26:1
Position Number of Staff Members Enrollment Principal 1 NA
Assistant Principal 1 Up to 849 2 850 to 1,199 3 1,200 or Above
Counselor (Elementary) 1 NA Counselor (Intermediate) 1 Up to 999 2 1,000 or Above
Librarian 1 NA Nurse 1 NA Nurse’s Aide .5 750 to 999 1 1,000 or Above
Principal’s Secretary 1 NA Attendance Clerk 1 NA
Clerical/Instructional Aides 3 Up to 649 4 650 to 799 5 800 to 999 6 1,000 or Above
Bilingual Instructional Aides 1 Up to 199 2 200 to 349 3 350 or Above
Art (Elementary) 1 Up to 849 2 850 or Above
Art (Intermediate) 2 Up to 1,199 3 1,200 or Above
Physical Education 1 Up to 749 2 750 to 1,049 3 (Intermediate only) 1,050 or Above
Music 1 NA
Band (Intermediate) 1 Up to 199 2 200 to 299 3 300 to 599 4 600 or Above
Orchestra (Intermediate) 1 NA Orchestra Aide 1 150 or Above
Fine Arts (Intermediate) 1 1,050 to 1,249 2 1,250 or Above Special Education, Title I, and Compensatory Education teachers and aides are not included in the allocations.
280

STAFFING FORMULAS
Junior High School Pupil – Teacher Ratio Formula 2018-2019 School Year
Regular Education Allocations The initial allocation is based on a teacher pupil ratio of 22:1. Bonus units may be given to provide for unusual scheduling problems.
Position Principal Assistant Principals Counselors *AP or Counselor Band Director Assistant Band Director Choir Director Orchestra Librarian Dyslexia Teacher/504 Nurse Nurses Aide Clerical Aides Principal’s Secretary A/P Secretary Counselor’s Secretary Attendance Clerk Receptionist ISS Aide Technology Tech Add’l Aides(including Library Aide) Student Success Teacher
Number of Staff Members
1 2 3
2 3 1 1 1 1 1 1
.5 1 .5 1 1 1 1 1 1 1 1 2 4 5 6 7 1
Enrollment N/A Up to 1,499 1,500 or Above
Up to 1,499 1,500 or Above 1,200 or Above N/A 150 or Above N/A N/A N/A N/A N/A 750 to 999 1,000 or Above
N/A N/A N/A N/A N/A N/A N/A Up to 899 900 to 1,099 1,100 to 1,499 1,500 to 1,999 2,000 and above
N/A
*Note: Campuses may have either an Assistant Principal or a Counselor when enrollment reaches 1,200. Special Education and Compensatory Education teachers and aides are not included in the allocations.
281

STAFFING FORMULAS Ninth Grade Campus – Teacher Ratio Formula
2018-2019 School Year Regular Education Allocations
The initial allocation is based on a teacher pupil ration of 22:1. Bonus units may be given to provide for unusual scheduling problems. Position Number of Staff Members Enrollment Principal 1 N/A Assistant Principals 2 Up to 1,499 3 1,500 or Above Counselors 2 Up to 1,499 Assistant Band Director 1 Choir Director 1 N/A Dyslexia Teacher/504 .5 N/A ESL Teacher 1 Athletic Trainer 1 Librarian 1 N/A Nurse 1 N/A Nurses’ Aide .5 750 to 999 1 1,000 or Above Clerical Aides Principal’s Secretary 1 N/A A/P Secretary 1 N/A Counselor’s Secretary 1 N/A Attendance Clerk 1 N/A Receptionist 1 N/A ISS Aide 1 N/A Technology Tech 1 N/A Add’l Aides (including Library Aide) 2 Up to 749 3 750 to 1,099 4 1,100 or Above Note: Special Education and Compensatory Education teachers and aides are not included in the allocations.
282

STAFFING FORMULAS High School Pupil – Teacher Ratio Formula
2018-2019 School Year Regular Education Allocations
The initial allocation is based on a teacher pupil ratio of 22:1. Bonus units may be given to provide for unusual scheduling problems. Position Principal Associate Principals Assistant Principals Counselors Band Director Assistant Band Director Choir Director Accompanist Athletic Director Athletic Trainers Orchestra Librarian Library Aide Dyslexia/504 Nurse Nurses Aide Clerical Aides Principal’s Secretary Assoc & A/P Secretary Counselor’s Secretary Athletic Secretary Attendance Clerk Budget Clerk Activity Fund Secretary Receptionist Registrar Textbook ISS Aide Technology Tech Add’l Aides
Number of Staff Members
1 2 2 3 4 5 6 7
5 6 7 8 9
10
1 1 1 1 1 2 1 1 2 1
.5 1 1 1 3 1 1 1 1 1 1 1 1 1 1 3 4 5 6 7 8 9
10
Enrollment N/A N/A Up to 999 1,000 to 1,499 1,500 to 1,999 2,000 to 2,499 2,500 to 2,999 3,000 to 3,499
Up to 999 1,000 to 1,499 1,500 to 1,999 2,000 to 2,499 2,500 to 2,999 3,000 to 3,499 N/A N/A N/A N/A N/A N/A 2,000 or Above N/A N/A N/A N/A N/A N/A N/A N/A N/A N/A N/A N/A N/A N/A N/A N/A Up to 1,199 1,200 to 1,399 1,400 to 1,599 1,600 to 1,799 1,800 to 1,999 2,000 to 2,199 2,200 to 2,499 2,500 or Above
Special Education and Compensatory Education teachers and aides are not included in the allocations.
283

Conroe Independent School District
284

Informational Section Performance Measures

Conroe Independent SChool dIStrICt
AnnuAl ACCountAbIlIty SummArIeS
Executive Summary
The success of CISD is attributable to the collective and shared work of its teachers, students, administrators, support staff, and parents. CISD is committed to its vision that all students will graduate with competence and confidence. The District continues to grow in both enrollment and diversity, steadily adding more than a thousand students each year. The ethnic makeup of the District continues to diversify with the addition of more students who identify as Hispanic, African-American, and two or more races.
Beginning this school year, districts were rated with a letter grade A, B, C, D, or F. Each district is assigned a letter grade for overall performance and performance in each of the three domains. Conroe ISD received a letter grade of B in the overall performance and all three domains.
Campuses are also analyzed using the three domains: Student Achievement, School Progress, and Closing the Gaps. The domains combine results from STAAR assessments, graduation rates, rates of students completing the various graduation plans, student demonstrating progress, and other indicators. The domains are as follows:
Domain I: Student Achievement provides a snapshot of performance across subjects. Domain II: School Progress measures year-to-year student progress and relative progress. Domain III: Closing Performance Gaps emphasizes the academic achievement of student groups.
Campuses that receive an accountability rating of met standard are eligible to earn distinction designations. Distinction designations are available for achievement in several different areas and awarded to campuses based on performance relative to a group of campuses of similar type, size, grade span, and student demographics. The distinction designation indicators are separate from those used to evaluate accountability ratings. Both districts and campuses are eligible to earn a distinction designation in postsecondary readiness.
Federal accountability requires all schools and the district to meet closing the gaps support areas in the areas of student achievement and student progress in reading and math, graduation rate, English language proficiency, student success, and school quality. Performance results are disaggregated to analyze the performance of each student group for each of the indicators.
Committed to Excellence
285

CONROE ISD
STUDENT ACHIEVEMENT
B89 out of 100
The Student Achievement domain tells ushow much students know and are able todo at the end of the school year.
SCHOOL PROGRESS
B88 out of 100
The School Progress domain shows us howstudents are performing over time andcompares that progress to similar schools.
CLOSING THE GAPS
B89 out of 100
The Closing the Gaps domain tells us howwell di�erent populations of students in adistrict are performing.
57 Schools 61,323 Students Enrolled
HOW WELL IS THIS DISTRICT PERFORMINGOVERALL?
B89 out of 100
UNDERSTANDING OVERALL PERFORMANCE
This report card is designed to tell us how well we are helpingstudents reach grade level and how well we are preparing themfor success after high school. Much like the grades we givestudents, we can use these grades to identify ways to help schoolsimprove over time. The overall grade is based on performance inthree di�erent areas, or domains, which are noted below.
DISTINCTIONSPostsecondary Readiness
286
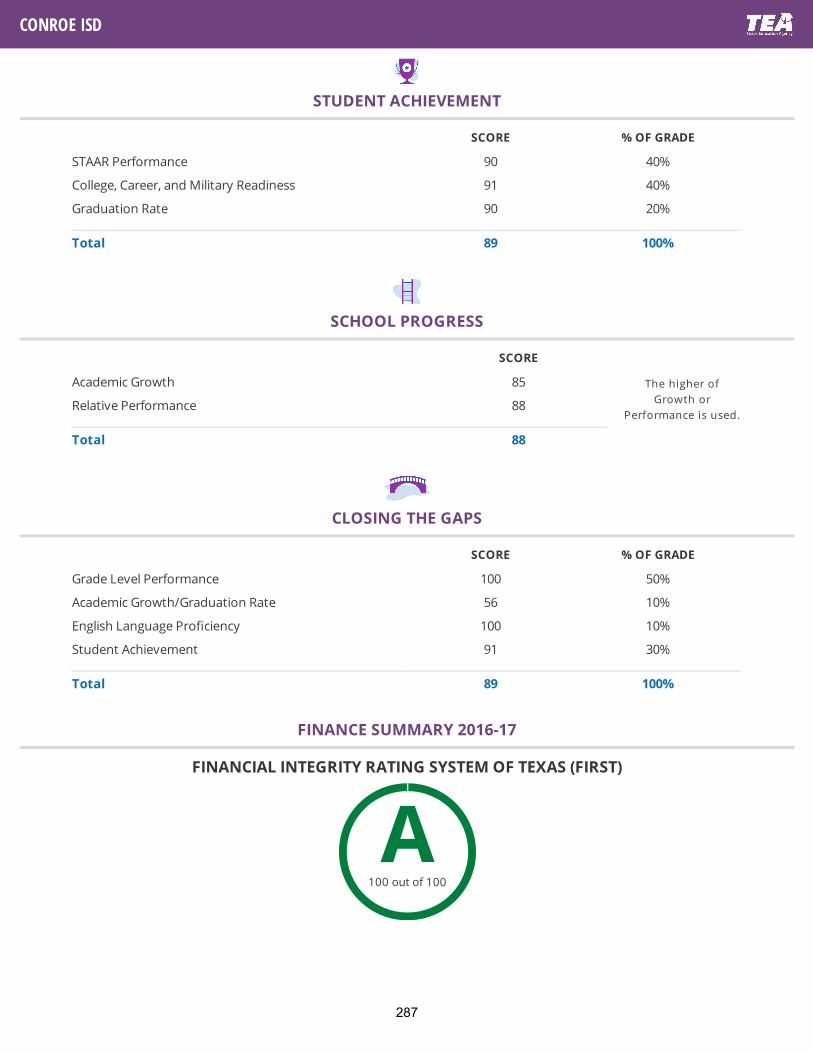
CONROE ISD
STUDENT ACHIEVEMENT
SCHOOL PROGRESS
CLOSING THE GAPS
SCORE % OF GRADE
STAAR Performance 90 40%
College, Career, and Military Readiness 91 40%
Graduation Rate 90 20%
Total 89 100%
SCORE
Academic Growth 85
Relative Performance 88
Total 88
The higher ofGrowth or
Performance is used.
SCORE % OF GRADE
Grade Level Performance 100 50%
Academic Growth/Graduation Rate 56 10%
English Language Pro�ciency 100 10%
Student Achievement 91 30%
Total 89 100%
FINANCE SUMMARY 2016-17
FINANCIAL INTEGRITY RATING SYSTEM OF TEXAS (FIRST)
A100 out of 100
287

Accountability Data Search Help
Texas Education Agency2018 Accountability Ratings Overall Summary
CONROE H S (170902001) - CONROE ISD
Component
ScoreScaled
Score RatingOverall 79 Met Standard Student Achievement 81 Met Standard STAAR Performance 50 77 College, Career and Military Readiness 49 81 Graduation Rate 97.9 90 School Progress 81 Met Standard Academic Growth 62 69 Met Standard Relative Performance (Eco Dis: 57.2%) 50 81 Met Standard Closing the Gaps 47 74 Met Standard
Distinction Designations
ELA/Reading Not EarnedMathematics Not EarnedScience EarnedSocial Studies EarnedComparative Academic Growth Not EarnedPostsecondary Readiness Not EarnedComparative Closing the Gaps Not Earned
288

Accountability Data Search Help
Texas Education Agency2018 Accountability Ratings Overall Summary
HAUKE ALTER ED (170902002) - CONROE ISD
Component
ScoreScaled
Score RatingOverall 80 Met Alternative Standard Student Achievement 85 Met Alternative Standard STAAR Performance 34 84 College, Career and Military Readiness 16 81 Graduation Rate 100 95 School Progress 73 Met Alternative Standard Academic Growth 52 73 Met Alternative Standard Relative Performance (Eco Dis: 46.2%) Not Rated Closing the Gaps 8 68 Met Alternative Standard
Notes:
- This is an Alternative Education campus. This campus was evaluated by alternative education accountability provisions.
Distinction Designations
ELA/Reading Not EligibleMathematics Not EligibleScience Not EligibleSocial Studies Not EligibleComparative Academic Growth Not EligiblePostsecondary Readiness Not EligibleComparative Closing the Gaps Not Eligible
289

Accountability Data Search Help
Texas Education Agency2018 Accountability Ratings Overall Summary
THE WOODLANDS H S (170902003) - CONROE ISD
Component
ScoreScaled
Score RatingOverall 93 Met Standard Student Achievement 95 Met Standard STAAR Performance 75 94 College, Career and Military Readiness 86 97 Graduation Rate 99.1 95 School Progress 81 Met Standard Academic Growth 71 81 Met Standard Relative Performance (Eco Dis: 5.3%) 81 81 Met Standard Closing the Gaps 92 88 Met Standard
Distinction Designations
ELA/Reading EarnedMathematics EarnedScience EarnedSocial Studies EarnedComparative Academic Growth Not EarnedPostsecondary Readiness EarnedComparative Closing the Gaps Not Earned
290

Accountability Data Search Help
Texas Education Agency2018 Accountability Ratings Overall Summary
OAK RIDGE H S (170902005) - CONROE ISD
Component
ScoreScaled
Score RatingOverall 89 Met Standard Student Achievement 90 Met Standard STAAR Performance 62 91 College, Career and Military Readiness 60 90 Graduation Rate 97.4 90 School Progress 81 Met Standard Academic Growth 71 81 Met Standard Relative Performance (Eco Dis: 24.9%) 61 76 Met Standard Closing the Gaps 87 86 Met Standard
Distinction Designations
ELA/Reading Not EarnedMathematics Not EarnedScience Not EarnedSocial Studies Not EarnedComparative Academic Growth Not EarnedPostsecondary Readiness Not EarnedComparative Closing the Gaps Not Earned
291

Accountability Data Search Help
Texas Education Agency2018 Accountability Ratings Overall Summary
JJAEP (170902010) - CONROE ISD
Component
ScoreScaled
Score RatingOverall Not Rated Student Achievement Not Rated STAAR Performance College, Career and Military Readiness Graduation Rate School Progress Not Rated Academic Growth Not Rated Relative Performance (Eco Dis: 57.5%) Not Rated Closing the Gaps Not Rated
Distinction Designations
ELA/Reading Not EligibleMathematics Not EligibleScience Not EligibleSocial Studies Not EligibleComparative Academic Growth Not EligiblePostsecondary Readiness Not EligibleComparative Closing the Gaps Not Eligible
292

Accountability Data Search Help
Texas Education Agency2018 Accountability Ratings Overall Summary
CANEY CREEK H S (170902011) - CONROE ISD
Component
ScoreScaled
Score RatingOverall 75 Met Standard Student Achievement 77 Met Standard STAAR Performance 43 72 College, Career and Military Readiness 47 79 Graduation Rate 95.7 85 School Progress 79 Met Standard Academic Growth 59 65 Met Standard Relative Performance (Eco Dis: 70.1%) 45 79 Met Standard Closing the Gaps 24 67 Met Standard
Distinction Designations
ELA/Reading Not EarnedMathematics Not EarnedScience EarnedSocial Studies Not EarnedComparative Academic Growth Not EarnedPostsecondary Readiness Not EarnedComparative Closing the Gaps Not Earned
293

Accountability Data Search Help
Texas Education Agency2018 Accountability Ratings Overall Summary
COLLEGE PARK H S (170902014) - CONROE ISD
Component
ScoreScaled
Score RatingOverall 90 Met Standard Student Achievement 92 Met Standard STAAR Performance 69 92 College, Career and Military Readiness 75 94 Graduation Rate 96 90 School Progress 81 Met Standard Academic Growth 71 81 Met Standard Relative Performance (Eco Dis: 16.8%) 72 81 Met Standard Closing the Gaps 86 86 Met Standard
Distinction Designations
ELA/Reading EarnedMathematics EarnedScience EarnedSocial Studies Not EarnedComparative Academic Growth Not EarnedPostsecondary Readiness Not EarnedComparative Closing the Gaps Not Earned
294

Accountability Data Search Help
Texas Education Agency2018 Accountability Ratings Overall Summary
PEET J H (170902041) - CONROE ISD
Component
ScoreScaled
Score RatingOverall 87 Met Standard Student Achievement 81 Met Standard STAAR Performance 50 81 College, Career and Military Readiness Graduation Rate School Progress 86 Met Standard Academic Growth 77 86 Met Standard Relative Performance (Eco Dis: 53.9%) 50 82 Met Standard Closing the Gaps 87 88 Met Standard
Distinction Designations
ELA/Reading Not EarnedMathematics EarnedScience Not EarnedSocial Studies Not EarnedComparative Academic Growth EarnedPostsecondary Readiness Not EarnedComparative Closing the Gaps Earned
295

Accountability Data Search Help
Texas Education Agency2018 Accountability Ratings Overall Summary
WASHINGTON J H (170902043) - CONROE ISD
Component
ScoreScaled
Score RatingOverall 89 Met Standard Student Achievement 76 Met Standard STAAR Performance 45 76 College, Career and Military Readiness Graduation Rate School Progress 89 Met Standard Academic Growth 79 89 Met Standard Relative Performance (Eco Dis: 86.2%) 45 88 Met Standard Closing the Gaps 88 89 Met Standard
Distinction Designations
ELA/Reading EarnedMathematics EarnedScience Not EarnedSocial Studies Not EarnedComparative Academic Growth EarnedPostsecondary Readiness EarnedComparative Closing the Gaps Earned
296

Accountability Data Search Help
Texas Education Agency2018 Accountability Ratings Overall Summary
WILKERSON INT (170902045) - CONROE ISD
Component
ScoreScaled
Score RatingOverall 88 Met Standard Student Achievement 88 Met Standard STAAR Performance 58 88 College, Career and Military Readiness Graduation Rate School Progress 85 Met Standard Academic Growth 70 77 Met Standard Relative Performance (Eco Dis: 41.7%) 58 85 Met Standard Closing the Gaps 87 88 Met Standard
Distinction Designations
ELA/Reading EarnedMathematics Not EarnedScience Not EarnedSocial Studies Not EligibleComparative Academic Growth Not EarnedPostsecondary Readiness EarnedComparative Closing the Gaps Earned
297

Accountability Data Search Help
Texas Education Agency2018 Accountability Ratings Overall Summary
KNOX J H (170902046) - CONROE ISD
Component
ScoreScaled
Score RatingOverall 93 Met Standard Student Achievement 93 Met Standard STAAR Performance 70 93 College, Career and Military Readiness Graduation Rate School Progress 91 Met Standard Academic Growth 81 91 Met Standard Relative Performance (Eco Dis: 22.7%) 70 87 Met Standard Closing the Gaps 94 94 Met Standard
Distinction Designations
ELA/Reading EarnedMathematics EarnedScience EarnedSocial Studies EarnedComparative Academic Growth EarnedPostsecondary Readiness EarnedComparative Closing the Gaps Not Earned
298

Accountability Data Search Help
Texas Education Agency2018 Accountability Ratings Overall Summary
YORK J H (170902049) - CONROE ISD
Component
ScoreScaled
Score RatingOverall 93 Met Standard Student Achievement 91 Met Standard STAAR Performance 65 91 College, Career and Military Readiness Graduation Rate School Progress 88 Met Standard Academic Growth 78 88 Met Standard Relative Performance (Eco Dis: 17.8%) 65 77 Met Standard Closing the Gaps 97 97 Met Standard
Distinction Designations
ELA/Reading Not EarnedMathematics Not EarnedScience Not EarnedSocial Studies Not EarnedComparative Academic Growth Not EarnedPostsecondary Readiness Not EarnedComparative Closing the Gaps Not Earned
299

Accountability Data Search Help
Texas Education Agency2018 Accountability Ratings Overall Summary
COLLINS INT (170902050) - CONROE ISD
Component
ScoreScaled
Score RatingOverall 96 Met Standard Student Achievement 94 Met Standard STAAR Performance 77 94 College, Career and Military Readiness Graduation Rate School Progress 88 Met Standard Academic Growth 78 88 Met Standard Relative Performance (Eco Dis: 11.1%) 77 86 Met Standard Closing the Gaps 100 100 Met Standard
Distinction Designations
ELA/Reading EarnedMathematics EarnedScience EarnedSocial Studies Not EligibleComparative Academic Growth EarnedPostsecondary Readiness EarnedComparative Closing the Gaps Earned
300

Accountability Data Search Help
Texas Education Agency2018 Accountability Ratings Overall Summary
MOORHEAD J H (170902051) - CONROE ISD
Component
ScoreScaled
Score RatingOverall 84 Met Standard Student Achievement 73 Met Standard STAAR Performance 41 73 College, Career and Military Readiness Graduation Rate School Progress 86 Met Standard Academic Growth 77 86 Met Standard Relative Performance (Eco Dis: 73.5%) 41 80 Met Standard Closing the Gaps 68 80 Met Standard
Distinction Designations
ELA/Reading Not EarnedMathematics Not EarnedScience Not EarnedSocial Studies Not EarnedComparative Academic Growth EarnedPostsecondary Readiness Not EarnedComparative Closing the Gaps Not Earned
301

Accountability Data Search Help
Texas Education Agency2018 Accountability Ratings Overall Summary
MCCULLOUGH J H (170902053) - CONROE ISD
Component
ScoreScaled
Score RatingOverall 96 Met Standard Student Achievement 94 Met Standard STAAR Performance 77 94 College, Career and Military Readiness Graduation Rate School Progress 90 Met Standard Academic Growth 80 90 Met Standard Relative Performance (Eco Dis: 8.2%) 77 84 Met Standard Closing the Gaps 100 100 Met Standard
Distinction Designations
ELA/Reading EarnedMathematics Not EarnedScience EarnedSocial Studies EarnedComparative Academic Growth EarnedPostsecondary Readiness EarnedComparative Closing the Gaps Earned
302

Accountability Data Search Help
Texas Education Agency2018 Accountability Ratings Overall Summary
IRONS J H (170902054) - CONROE ISD
Component
ScoreScaled
Score RatingOverall 91 Met Standard Student Achievement 89 Met Standard STAAR Performance 59 89 College, Career and Military Readiness Graduation Rate School Progress 88 Met Standard Academic Growth 78 88 Met Standard Relative Performance (Eco Dis: 35.4%) 59 83 Met Standard Closing the Gaps 95 95 Met Standard
Distinction Designations
ELA/Reading Not EarnedMathematics EarnedScience Not EarnedSocial Studies Not EarnedComparative Academic Growth EarnedPostsecondary Readiness Not EarnedComparative Closing the Gaps Earned
303

Accountability Data Search Help
Texas Education Agency2018 Accountability Ratings Overall Summary
MITCHELL INT (170902067) - CONROE ISD
Component
ScoreScaled
Score RatingOverall 97 Met Standard Student Achievement 95 Met Standard STAAR Performance 80 95 College, Career and Military Readiness Graduation Rate School Progress 90 Met Standard Academic Growth 80 90 Met Standard Relative Performance (Eco Dis: 8.4%) 80 87 Met Standard Closing the Gaps 100 100 Met Standard
Distinction Designations
ELA/Reading EarnedMathematics EarnedScience Not EligibleSocial Studies Not EligibleComparative Academic Growth EarnedPostsecondary Readiness EarnedComparative Closing the Gaps Earned
304

Accountability Data Search Help
Texas Education Agency2018 Accountability Ratings Overall Summary
GRANGERLAND INT (170902068) - CONROE ISD
Component
ScoreScaled
Score RatingOverall 76 Met Standard Student Achievement 73 Met Standard STAAR Performance 41 73 College, Career and Military Readiness Graduation Rate School Progress 80 Met Standard Academic Growth 62 60 Met Standard Relative Performance (Eco Dis: 73.7%) 41 80 Met Standard Closing the Gaps 21 66 Met Standard
Distinction Designations
ELA/Reading Not EarnedMathematics Not EarnedScience Not EarnedSocial Studies Not EligibleComparative Academic Growth Not EarnedPostsecondary Readiness Not EarnedComparative Closing the Gaps Not Earned
305

Accountability Data Search Help
Texas Education Agency2018 Accountability Ratings Overall Summary
VOGEL INT (170902069) - CONROE ISD
Component
ScoreScaled
Score RatingOverall 84 Met Standard Student Achievement 86 Met Standard STAAR Performance 56 86 College, Career and Military Readiness Graduation Rate School Progress 83 Met Standard Academic Growth 68 74 Met Standard Relative Performance (Eco Dis: 41.1%) 56 83 Met Standard Closing the Gaps 63 78 Met Standard
Distinction Designations
ELA/Reading Not EarnedMathematics Not EarnedScience Not EarnedSocial Studies Not EligibleComparative Academic Growth Not EarnedPostsecondary Readiness Not EarnedComparative Closing the Gaps Not Earned
306

Accountability Data Search Help
Texas Education Agency2018 Accountability Ratings Overall Summary
TRAVIS INT (170902070) - CONROE ISD
Component
ScoreScaled
Score RatingOverall 85 Met Standard Student Achievement 76 Met Standard STAAR Performance 45 76 College, Career and Military Readiness Graduation Rate School Progress 88 Met Standard Academic Growth 69 75 Met Standard Relative Performance (Eco Dis: 91.7%) 45 88 Met Standard Closing the Gaps 66 79 Met Standard
Distinction Designations
ELA/Reading EarnedMathematics EarnedScience EarnedSocial Studies Not EligibleComparative Academic Growth Not EarnedPostsecondary Readiness EarnedComparative Closing the Gaps Earned
307

Accountability Data Search Help
Texas Education Agency2018 Accountability Ratings Overall Summary
TOUGH EL (170902071) - CONROE ISD
Component
ScoreScaled
Score RatingOverall 93 Met Standard Student Achievement 94 Met Standard STAAR Performance 76 94 College, Career and Military Readiness Graduation Rate School Progress 88 Met Standard Academic Growth 80 88 Met Standard Relative Performance (Eco Dis: 4.0%) 76 81 Met Standard Closing the Gaps 94 89 Met Standard
Distinction Designations
ELA/Reading Not EarnedMathematics Not EarnedScience Not EarnedSocial Studies Not EligibleComparative Academic Growth Not EarnedPostsecondary Readiness Not EarnedComparative Closing the Gaps Not Earned
308

Accountability Data Search Help
Texas Education Agency2018 Accountability Ratings Overall Summary
CRYAR INTERMEDIATE (170902073) - CONROE ISD
Component
ScoreScaled
Score RatingOverall 76 Met Standard Student Achievement 77 Met Standard STAAR Performance 46 77 College, Career and Military Readiness Graduation Rate School Progress 80 Met Standard Academic Growth 60 59 Improvement Required Relative Performance (Eco Dis: 57.7%) 46 80 Met Standard Closing the Gaps 22 66 Met Standard
Distinction Designations
ELA/Reading Not EarnedMathematics Not EarnedScience Not EarnedSocial Studies Not EligibleComparative Academic Growth Not EarnedPostsecondary Readiness Not EarnedComparative Closing the Gaps Not Earned
309

Accountability Data Search Help
Texas Education Agency2018 Accountability Ratings Overall Summary
DERETCHIN EL (170902074) - CONROE ISD
Component
ScoreScaled
Score RatingOverall 97 Met Standard Student Achievement 95 Met Standard STAAR Performance 80 95 College, Career and Military Readiness Graduation Rate School Progress 89 Met Standard Academic Growth 81 89 Met Standard Relative Performance (Eco Dis: 6.1%) 80 85 Met Standard Closing the Gaps 100 100 Met Standard
Distinction Designations
ELA/Reading EarnedMathematics EarnedScience EarnedSocial Studies Not EligibleComparative Academic Growth Not EarnedPostsecondary Readiness EarnedComparative Closing the Gaps Earned
310
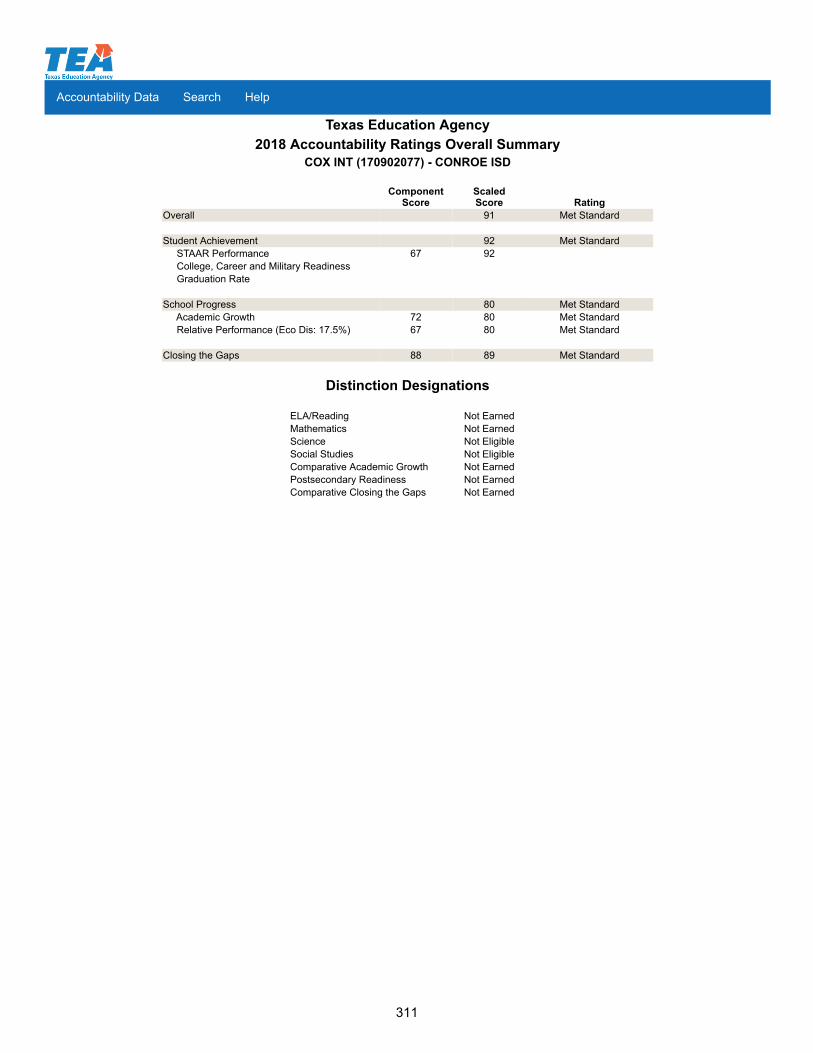
Accountability Data Search Help
Texas Education Agency2018 Accountability Ratings Overall Summary
COX INT (170902077) - CONROE ISD
Component
ScoreScaled
Score RatingOverall 91 Met Standard Student Achievement 92 Met Standard STAAR Performance 67 92 College, Career and Military Readiness Graduation Rate School Progress 80 Met Standard Academic Growth 72 80 Met Standard Relative Performance (Eco Dis: 17.5%) 67 80 Met Standard Closing the Gaps 88 89 Met Standard
Distinction Designations
ELA/Reading Not EarnedMathematics Not EarnedScience Not EligibleSocial Studies Not EligibleComparative Academic Growth Not EarnedPostsecondary Readiness Not EarnedComparative Closing the Gaps Not Earned
311

Accountability Data Search Help
Texas Education Agency2018 Accountability Ratings Overall Summary
BOZMAN INT (170902078) - CONROE ISD
Component
ScoreScaled
Score RatingOverall 85 Met Standard Student Achievement 83 Met Standard STAAR Performance 52 83 College, Career and Military Readiness Graduation Rate School Progress 87 Met Standard Academic Growth 66 70 Met Standard Relative Performance (Eco Dis: 59.3%) 52 87 Met Standard Closing the Gaps 67 80 Met Standard
Distinction Designations
ELA/Reading Not EarnedMathematics Not EarnedScience EarnedSocial Studies Not EligibleComparative Academic Growth Not EarnedPostsecondary Readiness EarnedComparative Closing the Gaps Not Earned
312

Accountability Data Search Help
Texas Education Agency2018 Accountability Ratings Overall Summary
ANDERSON EL (170902101) - CONROE ISD
Component
ScoreScaled
Score RatingOverall 83 Met Standard Student Achievement 75 Met Standard STAAR Performance 47 75 College, Career and Military Readiness Graduation Rate School Progress 85 Met Standard Academic Growth 78 85 Met Standard Relative Performance (Eco Dis: 82.3%) 47 83 Met Standard Closing the Gaps 83 79 Met Standard
Distinction Designations
ELA/Reading EarnedMathematics EarnedScience Not EligibleSocial Studies Not EligibleComparative Academic Growth EarnedPostsecondary Readiness EarnedComparative Closing the Gaps Earned
313

Accountability Data Search Help
Texas Education Agency2018 Accountability Ratings Overall Summary
AUSTIN EL (170902102) - CONROE ISD
Component
ScoreScaled
Score RatingOverall 76 Met Standard Student Achievement 71 Met Standard STAAR Performance 42 71 College, Career and Military Readiness Graduation Rate School Progress 75 Met Standard Academic Growth 72 75 Met Standard Relative Performance (Eco Dis: 77.7%) 42 75 Met Standard Closing the Gaps 81 78 Met Standard
Distinction Designations
ELA/Reading Not EarnedMathematics EarnedScience Not EligibleSocial Studies Not EligibleComparative Academic Growth EarnedPostsecondary Readiness Not EarnedComparative Closing the Gaps Earned
314

Accountability Data Search Help
Texas Education Agency2018 Accountability Ratings Overall Summary
RUNYAN EL (170902103) - CONROE ISD
Component
ScoreScaled
Score RatingOverall 71 Met Standard Student Achievement 70 Met Standard STAAR Performance 41 70 College, Career and Military Readiness Graduation Rate School Progress 75 Met Standard Academic Growth 57 56 Improvement Required Relative Performance (Eco Dis: 85.7%) 41 75 Met Standard Closing the Gaps 27 62 Met Standard
Distinction Designations
ELA/Reading Not EarnedMathematics EarnedScience Not EligibleSocial Studies Not EligibleComparative Academic Growth Not EarnedPostsecondary Readiness EarnedComparative Closing the Gaps Not Earned
315

Accountability Data Search Help
Texas Education Agency2018 Accountability Ratings Overall Summary
HOUSTON EL (170902104) - CONROE ISD
Component
ScoreScaled
Score RatingOverall 54 Improvement Required Student Achievement 56 Improvement Required STAAR Performance 31 56 College, Career and Military Readiness Graduation Rate School Progress 59 Improvement Required Academic Growth 59 57 Improvement Required Relative Performance (Eco Dis: 90.1%) 31 59 Improvement Required Closing the Gaps 10 43 Improvement Required
Distinction Designations
ELA/Reading Not EarnedMathematics Not EarnedScience Not EligibleSocial Studies Not EligibleComparative Academic Growth Not EarnedPostsecondary Readiness Not EarnedComparative Closing the Gaps Not Earned
316

Accountability Data Search Help
Texas Education Agency2018 Accountability Ratings Overall Summary
MILAM EL (170902105) - CONROE ISD
Component
ScoreScaled
Score RatingOverall 67 Met Standard Student Achievement 67 Met Standard STAAR Performance 39 67 College, Career and Military Readiness Graduation Rate School Progress 70 Met Standard Academic Growth 55 55 Improvement Required Relative Performance (Eco Dis: 76.3%) 39 70 Met Standard Closing the Gaps 25 61 Met Standard
Distinction Designations
ELA/Reading Not EarnedMathematics Not EarnedScience Not EligibleSocial Studies Not EligibleComparative Academic Growth Not EarnedPostsecondary Readiness Not EarnedComparative Closing the Gaps Not Earned
317

Accountability Data Search Help
Texas Education Agency2018 Accountability Ratings Overall Summary
CREIGHTON EL (170902106) - CONROE ISD
Component
ScoreScaled
Score RatingOverall 64 Met Standard Student Achievement 65 Met Standard STAAR Performance 38 65 College, Career and Military Readiness Graduation Rate School Progress 69 Met Standard Academic Growth 62 59 Improvement Required Relative Performance (Eco Dis: 79.9%) 38 69 Met Standard Closing the Gaps 16 51 Improvement Required
Distinction Designations
ELA/Reading Not EarnedMathematics Not EarnedScience Not EligibleSocial Studies Not EligibleComparative Academic Growth Not EarnedPostsecondary Readiness Not EarnedComparative Closing the Gaps Not Earned
318

Accountability Data Search Help
Texas Education Agency2018 Accountability Ratings Overall Summary
ARMSTRONG EL (170902107) - CONROE ISD
Component
ScoreScaled
Score RatingOverall 76 Met Standard Student Achievement 70 Met Standard STAAR Performance 41 70 College, Career and Military Readiness Graduation Rate School Progress 77 Met Standard Academic Growth 68 69 Met Standard Relative Performance (Eco Dis: 91.7%) 41 77 Met Standard Closing the Gaps 55 72 Met Standard
Distinction Designations
ELA/Reading Not EarnedMathematics EarnedScience Not EligibleSocial Studies Not EligibleComparative Academic Growth EarnedPostsecondary Readiness EarnedComparative Closing the Gaps Earned
319

Accountability Data Search Help
Texas Education Agency2018 Accountability Ratings Overall Summary
LAMAR EL (170902108) - CONROE ISD
Component
ScoreScaled
Score RatingOverall 89 Met Standard Student Achievement 88 Met Standard STAAR Performance 58 88 College, Career and Military Readiness Graduation Rate School Progress 85 Met Standard Academic Growth 78 85 Met Standard Relative Performance (Eco Dis: 34.2%) 58 79 Met Standard Closing the Gaps 95 90 Met Standard
Distinction Designations
ELA/Reading EarnedMathematics EarnedScience Not EligibleSocial Studies Not EligibleComparative Academic Growth EarnedPostsecondary Readiness Not EarnedComparative Closing the Gaps Earned
320

Accountability Data Search Help
Texas Education Agency2018 Accountability Ratings Overall Summary
OAK RIDGE EL (170902109) - CONROE ISD
Component
ScoreScaled
Score RatingOverall 81 Met Standard Student Achievement 85 Met Standard STAAR Performance 56 85 College, Career and Military Readiness Graduation Rate School Progress 82 Met Standard Academic Growth 60 58 Improvement Required Relative Performance (Eco Dis: 46.2%) 56 82 Met Standard Closing the Gaps 53 71 Met Standard
Distinction Designations
ELA/Reading Not EarnedMathematics Not EarnedScience Not EligibleSocial Studies Not EligibleComparative Academic Growth Not EarnedPostsecondary Readiness EarnedComparative Closing the Gaps Not Earned
321

Accountability Data Search Help
Texas Education Agency2018 Accountability Ratings Overall Summary
HOUSER EL (170902111) - CONROE ISD
Component
ScoreScaled
Score RatingOverall 71 Met Standard Student Achievement 74 Met Standard STAAR Performance 46 74 College, Career and Military Readiness Graduation Rate School Progress 70 Met Standard Academic Growth 62 59 Improvement Required Relative Performance (Eco Dis: 52.9%) 46 70 Met Standard Closing the Gaps 35 65 Met Standard
Distinction Designations
ELA/Reading Not EarnedMathematics EarnedScience Not EligibleSocial Studies Not EligibleComparative Academic Growth Not EarnedPostsecondary Readiness Not EarnedComparative Closing the Gaps Not Earned
322

Accountability Data Search Help
Texas Education Agency2018 Accountability Ratings Overall Summary
FORD EL (170902112) - CONROE ISD
Component
ScoreScaled
Score RatingOverall 84 Met Standard Student Achievement 88 Met Standard STAAR Performance 58 88 College, Career and Military Readiness Graduation Rate School Progress 85 Met Standard Academic Growth 63 59 Improvement Required Relative Performance (Eco Dis: 50.9%) 58 85 Met Standard Closing the Gaps 58 73 Met Standard
Distinction Designations
ELA/Reading Not EarnedMathematics Not EarnedScience Not EligibleSocial Studies Not EligibleComparative Academic Growth Not EarnedPostsecondary Readiness EarnedComparative Closing the Gaps Not Earned
323

Accountability Data Search Help
Texas Education Agency2018 Accountability Ratings Overall Summary
HAILEY EL (170902113) - CONROE ISD
Component
ScoreScaled
Score RatingOverall 77 Met Standard Student Achievement 80 Met Standard STAAR Performance 53 80 College, Career and Military Readiness Graduation Rate School Progress 77 Met Standard Academic Growth 65 62 Met Standard Relative Performance (Eco Dis: 45.0%) 53 77 Met Standard Closing the Gaps 48 70 Met Standard
Distinction Designations
ELA/Reading Not EarnedMathematics Not EarnedScience Not EligibleSocial Studies Not EligibleComparative Academic Growth Not EarnedPostsecondary Readiness Not EarnedComparative Closing the Gaps Not Earned
324

Accountability Data Search Help
Texas Education Agency2018 Accountability Ratings Overall Summary
RICE EL (170902114) - CONROE ISD
Component
ScoreScaled
Score RatingOverall 74 Met Standard Student Achievement 75 Met Standard STAAR Performance 47 75 College, Career and Military Readiness Graduation Rate School Progress 75 Met Standard Academic Growth 64 60 Met Standard Relative Performance (Eco Dis: 57.5%) 47 75 Met Standard Closing the Gaps 57 72 Met Standard
Distinction Designations
ELA/Reading Not EarnedMathematics Not EarnedScience Not EligibleSocial Studies Not EligibleComparative Academic Growth Not EarnedPostsecondary Readiness Not EarnedComparative Closing the Gaps Not Earned
325

Accountability Data Search Help
Texas Education Agency2018 Accountability Ratings Overall Summary
SAN JACINTO EL (170902115) - CONROE ISD
Component
ScoreScaled
Score RatingOverall 72 Met Standard Student Achievement 69 Met Standard STAAR Performance 40 69 College, Career and Military Readiness Graduation Rate School Progress 72 Met Standard Academic Growth 66 65 Met Standard Relative Performance (Eco Dis: 78.2%) 40 72 Met Standard Closing the Gaps 50 71 Met Standard
Distinction Designations
ELA/Reading Not EarnedMathematics Not EarnedScience Not EligibleSocial Studies Not EligibleComparative Academic Growth Not EarnedPostsecondary Readiness Not EarnedComparative Closing the Gaps Not Earned
326

Accountability Data Search Help
Texas Education Agency2018 Accountability Ratings Overall Summary
GLEN LOCH EL (170902116) - CONROE ISD
Component
ScoreScaled
Score RatingOverall 73 Met Standard Student Achievement 76 Met Standard STAAR Performance 48 76 College, Career and Military Readiness Graduation Rate School Progress 70 Met Standard Academic Growth 59 57 Improvement Required Relative Performance (Eco Dis: 46.0%) 48 70 Met Standard Closing the Gaps 39 66 Met Standard
Distinction Designations
ELA/Reading Not EarnedMathematics Not EarnedScience Not EligibleSocial Studies Not EligibleComparative Academic Growth Not EarnedPostsecondary Readiness Not EarnedComparative Closing the Gaps Not Earned
327

Accountability Data Search Help
Texas Education Agency2018 Accountability Ratings Overall Summary
RIDE EL (170902117) - CONROE ISD
Component
ScoreScaled
Score RatingOverall 92 Met Standard Student Achievement 93 Met Standard STAAR Performance 71 93 College, Career and Military Readiness Graduation Rate School Progress 85 Met Standard Academic Growth 78 85 Met Standard Relative Performance (Eco Dis: 11.0%) 71 79 Met Standard Closing the Gaps 93 88 Met Standard
Distinction Designations
ELA/Reading Not EarnedMathematics Not EarnedScience Not EligibleSocial Studies Not EligibleComparative Academic Growth Not EarnedPostsecondary Readiness EarnedComparative Closing the Gaps Not Earned
328

Accountability Data Search Help
Texas Education Agency2018 Accountability Ratings Overall Summary
DAVID EL (170902118) - CONROE ISD
Component
ScoreScaled
Score RatingOverall 95 Met Standard Student Achievement 93 Met Standard STAAR Performance 72 93 College, Career and Military Readiness Graduation Rate School Progress 89 Met Standard Academic Growth 81 89 Met Standard Relative Performance (Eco Dis: 11.7%) 72 81 Met Standard Closing the Gaps 100 100 Met Standard
Distinction Designations
ELA/Reading EarnedMathematics EarnedScience Not EligibleSocial Studies Not EligibleComparative Academic Growth EarnedPostsecondary Readiness EarnedComparative Closing the Gaps Earned
329

Accountability Data Search Help
Texas Education Agency2018 Accountability Ratings Overall Summary
GIESINGER EL (170902119) - CONROE ISD
Component
ScoreScaled
Score RatingOverall 80 Met Standard Student Achievement 82 Met Standard STAAR Performance 54 82 College, Career and Military Readiness Graduation Rate School Progress 72 Met Standard Academic Growth 69 70 Met Standard Relative Performance (Eco Dis: 35.1%) 54 72 Met Standard Closing the Gaps 64 74 Met Standard
Distinction Designations
ELA/Reading Not EarnedMathematics Not EarnedScience Not EligibleSocial Studies Not EligibleComparative Academic Growth Not EarnedPostsecondary Readiness Not EarnedComparative Closing the Gaps Not Earned
330

Accountability Data Search Help
Texas Education Agency2018 Accountability Ratings Overall Summary
GALATAS EL (170902120) - CONROE ISD
Component
ScoreScaled
Score RatingOverall 97 Met Standard Student Achievement 96 Met Standard STAAR Performance 82 96 College, Career and Military Readiness Graduation Rate School Progress 86 Met Standard Academic Growth 77 83 Met Standard Relative Performance (Eco Dis: 2.1%) 82 86 Met Standard Closing the Gaps 100 100 Met Standard
Distinction Designations
ELA/Reading Not EarnedMathematics Not EarnedScience Not EligibleSocial Studies Not EligibleComparative Academic Growth Not EarnedPostsecondary Readiness EarnedComparative Closing the Gaps Earned
331

Accountability Data Search Help
Texas Education Agency2018 Accountability Ratings Overall Summary
BUSH EL (170902121) - CONROE ISD
Component
ScoreScaled
Score RatingOverall 96 Met Standard Student Achievement 94 Met Standard STAAR Performance 74 94 College, Career and Military Readiness Graduation Rate School Progress 86 Met Standard Academic Growth 79 86 Met Standard Relative Performance (Eco Dis: 11.8%) 74 83 Met Standard Closing the Gaps 100 100 Met Standard
Distinction Designations
ELA/Reading Not EarnedMathematics EarnedScience Not EligibleSocial Studies Not EligibleComparative Academic Growth EarnedPostsecondary Readiness EarnedComparative Closing the Gaps Earned
332

Accountability Data Search Help
Texas Education Agency2018 Accountability Ratings Overall Summary
POWELL EL (170902122) - CONROE ISD
Component
ScoreScaled
Score RatingOverall 91 Met Standard Student Achievement 92 Met Standard STAAR Performance 69 92 College, Career and Military Readiness Graduation Rate School Progress 82 Met Standard Academic Growth 76 82 Met Standard Relative Performance (Eco Dis: 18.6%) 69 82 Met Standard Closing the Gaps 92 87 Met Standard
Distinction Designations
ELA/Reading Not EarnedMathematics EarnedScience Not EligibleSocial Studies Not EligibleComparative Academic Growth Not EarnedPostsecondary Readiness EarnedComparative Closing the Gaps Not Earned
333

Accountability Data Search Help
Texas Education Agency2018 Accountability Ratings Overall Summary
BUCKALEW EL (170902123) - CONROE ISD
Component
ScoreScaled
Score RatingOverall 96 Met Standard Student Achievement 94 Met Standard STAAR Performance 76 94 College, Career and Military Readiness Graduation Rate School Progress 91 Met Standard Academic Growth 84 91 Met Standard Relative Performance (Eco Dis: 5.1%) 76 81 Met Standard Closing the Gaps 100 100 Met Standard
Distinction Designations
ELA/Reading EarnedMathematics EarnedScience Not EligibleSocial Studies Not EligibleComparative Academic Growth EarnedPostsecondary Readiness Not EarnedComparative Closing the Gaps Earned
334

Accountability Data Search Help
Texas Education Agency2018 Accountability Ratings Overall Summary
REAVES EL (170902124) - CONROE ISD
Component
ScoreScaled
Score RatingOverall 81 Met Standard Student Achievement 78 Met Standard STAAR Performance 51 78 College, Career and Military Readiness Graduation Rate School Progress 85 Met Standard Academic Growth 63 59 Improvement Required Relative Performance (Eco Dis: 72.5%) 51 85 Met Standard Closing the Gaps 61 73 Met Standard
Distinction Designations
ELA/Reading EarnedMathematics EarnedScience Not EligibleSocial Studies Not EligibleComparative Academic Growth Not EarnedPostsecondary Readiness EarnedComparative Closing the Gaps Not Earned
335

Accountability Data Search Help
Texas Education Agency2018 Accountability Ratings Overall Summary
KAUFMAN EL (170902125) - CONROE ISD
Component
ScoreScaled
Score RatingOverall 94 Met Standard Student Achievement 92 Met Standard STAAR Performance 67 92 College, Career and Military Readiness Graduation Rate School Progress 83 Met Standard Academic Growth 77 83 Met Standard Relative Performance (Eco Dis: 13.9%) 67 75 Met Standard Closing the Gaps 100 100 Met Standard
Distinction Designations
ELA/Reading Not EarnedMathematics Not EarnedScience Not EligibleSocial Studies Not EligibleComparative Academic Growth Not EarnedPostsecondary Readiness Not EarnedComparative Closing the Gaps Earned
336

Accountability Data Search Help
Texas Education Agency2018 Accountability Ratings Overall Summary
WILKINSON EL (170902126) - CONROE ISD
Component
ScoreScaled
Score RatingOverall 73 Met Standard Student Achievement 77 Met Standard STAAR Performance 50 77 College, Career and Military Readiness Graduation Rate School Progress 69 Met Standard Academic Growth 54 55 Improvement Required Relative Performance (Eco Dis: 39.6%) 50 69 Met Standard Closing the Gaps 33 64 Met Standard
Distinction Designations
ELA/Reading Not EarnedMathematics Not EarnedScience Not EligibleSocial Studies Not EligibleComparative Academic Growth Not EarnedPostsecondary Readiness Not EarnedComparative Closing the Gaps Not Earned
337

Accountability Data Search Help
Texas Education Agency2018 Accountability Ratings Overall Summary
BROADWAY EL (170902127) - CONROE ISD
Component
ScoreScaled
Score RatingOverall 94 Met Standard Student Achievement 92 Met Standard STAAR Performance 68 92 College, Career and Military Readiness Graduation Rate School Progress 79 Met Standard Academic Growth 74 79 Met Standard Relative Performance (Eco Dis: 9.7%) 68 74 Met Standard Closing the Gaps 99 98 Met Standard
Distinction Designations
ELA/Reading Not EarnedMathematics Not EarnedScience Not EligibleSocial Studies Not EligibleComparative Academic Growth Not EarnedPostsecondary Readiness Not EarnedComparative Closing the Gaps Not Earned
338
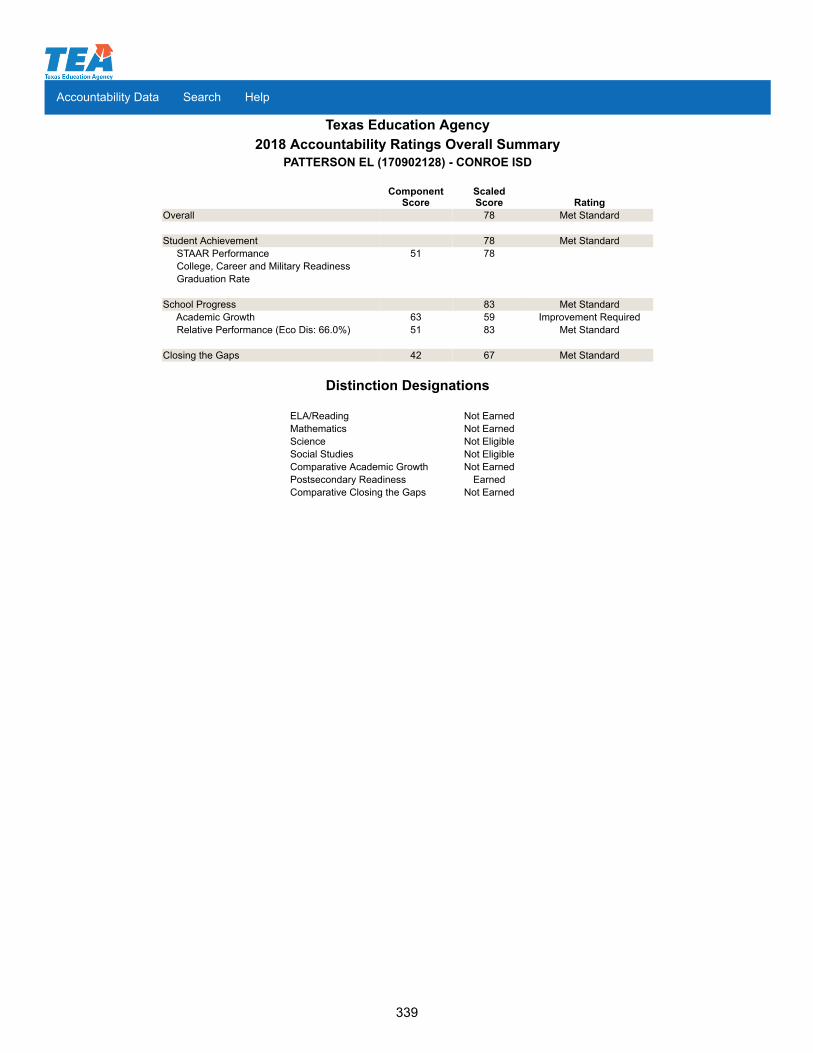
Accountability Data Search Help
Texas Education Agency2018 Accountability Ratings Overall Summary
PATTERSON EL (170902128) - CONROE ISD
Component
ScoreScaled
Score RatingOverall 78 Met Standard Student Achievement 78 Met Standard STAAR Performance 51 78 College, Career and Military Readiness Graduation Rate School Progress 83 Met Standard Academic Growth 63 59 Improvement Required Relative Performance (Eco Dis: 66.0%) 51 83 Met Standard Closing the Gaps 42 67 Met Standard
Distinction Designations
ELA/Reading Not EarnedMathematics Not EarnedScience Not EligibleSocial Studies Not EligibleComparative Academic Growth Not EarnedPostsecondary Readiness EarnedComparative Closing the Gaps Not Earned
339

Accountability Data Search Help
Texas Education Agency2018 Accountability Ratings Overall Summary
BIRNHAM WOODS EL (170902129) - CONROE ISD
Component
ScoreScaled
Score RatingOverall 93 Met Standard Student Achievement 92 Met Standard STAAR Performance 69 92 College, Career and Military Readiness Graduation Rate School Progress 89 Met Standard Academic Growth 81 89 Met Standard Relative Performance (Eco Dis: 11.7%) 69 77 Met Standard Closing the Gaps 98 96 Met Standard
Distinction Designations
ELA/Reading EarnedMathematics EarnedScience Not EligibleSocial Studies Not EligibleComparative Academic Growth EarnedPostsecondary Readiness Not EarnedComparative Closing the Gaps Not Earned
340

Accountability Data Search Help
Texas Education Agency2018 Accountability Ratings Overall Summary
STEWART EL (170902130) - CONROE ISD
Component
ScoreScaled
Score RatingOverall 91 Met Standard Student Achievement 91 Met Standard STAAR Performance 63 91 College, Career and Military Readiness Graduation Rate School Progress 83 Met Standard Academic Growth 77 83 Met Standard Relative Performance (Eco Dis: 20.9%) 63 75 Met Standard Closing the Gaps 96 92 Met Standard
Distinction Designations
ELA/Reading Not EarnedMathematics Not EarnedScience EarnedSocial Studies Not EligibleComparative Academic Growth Not EarnedPostsecondary Readiness Not EarnedComparative Closing the Gaps Not Earned
341

Accountability Data Search Help
Texas Education Agency2018 Accountability Ratings Overall Summary
SNYDER EL (170902131) - CONROE ISD
Component
ScoreScaled
Score RatingOverall 96 Met Standard Student Achievement 93 Met Standard STAAR Performance 73 93 College, Career and Military Readiness Graduation Rate School Progress 94 Met Standard Academic Growth 89 94 Met Standard Relative Performance (Eco Dis: 12.4%) 73 83 Met Standard Closing the Gaps 100 100 Met Standard
Distinction Designations
ELA/Reading EarnedMathematics EarnedScience Not EligibleSocial Studies Not EligibleComparative Academic Growth EarnedPostsecondary Readiness EarnedComparative Closing the Gaps Earned
342

Accountability Data Search Help
Texas Education Agency2018 Accountability Ratings Overall Summary
BRADLEY EL (170902132) - CONROE ISD
Component
ScoreScaled
Score RatingOverall 79 Met Standard Student Achievement 80 Met Standard STAAR Performance 53 80 College, Career and Military Readiness Graduation Rate School Progress 66 Met Standard Academic Growth 66 65 Met Standard Relative Performance (Eco Dis: 29.9%) 53 66 Met Standard Closing the Gaps 69 75 Met Standard
Distinction Designations
ELA/Reading Not EarnedMathematics Not EarnedScience Not EligibleSocial Studies Not EligibleComparative Academic Growth Not EarnedPostsecondary Readiness Not EarnedComparative Closing the Gaps Not Earned
343

Accountability Data Search Help
Texas Education Agency2018 Accountability Ratings Overall Summary
JUVENILE DETENTION CTR (170902201) - CONROE ISD
Component
ScoreScaled
Score RatingOverall Not Rated Student Achievement Not Rated STAAR Performance College, Career and Military Readiness Graduation Rate School Progress Not Rated Academic Growth Not Rated Relative Performance (Eco Dis: 32.1%) Not Rated Closing the Gaps Not Rated
Notes:
- This is an Alternative Education campus. This campus was evaluated by alternative education accountability provisions.
Distinction Designations
ELA/Reading Not EligibleMathematics Not EligibleScience Not EligibleSocial Studies Not EligibleComparative Academic Growth Not EligiblePostsecondary Readiness Not EligibleComparative Closing the Gaps Not Eligible
344

Conroe Independent School District
345

Department Performance The 2017-2018 school year resulted in the achievement of goals throughout many District departments. Transportation Conroe ISD’s Transportation Department continued to make improvements to its processes by executing implementation of digital radios for the Department (buses, white fleet, and offices). The bus installation for digital radios was completed over the summer on 540 buses. The office installation for digital radios was initiated and carried over to the following school year due to equipment availability.
Transportation also initiated the process for Student Monitoring. They met with our GPS and routing software vendors to plan and get estimates on the requirements needed to implement a student monitoring system on all buses. Preliminary work was completed. A pilot project is planned for the next school year. As student safety and reliability is a priority for our Transportation Department, bus specifications were revised and cost analysis were performed to determine the department’s needs. The department recommended purchasing new/used buses, MPV’s, and a medium duty wrecker. The District approved acquiring 10 new buses and 1 MPV for the upcoming school year. The Transportation Department completed an initial A/C Retro Fits project that was scheduled for 25 buses. This project will help improve student safety and reduce student discipline along with improving employee morale, hiring and retention. The department also secured funding to replace/repower bus engines. The funding will service approximately 15 buses. The Transportation Department competed all necessary steps to start 3rd Party CDL testing for the upcoming school year. 3rd Party Testing allows the District to perform the behind-the-wheel final test for new hires attempting to obtain their CDL. By having our own Tester it allows us to schedule employees much sooner. It reduces cost and increases availability. We are in the process of having another employee become CDL Tester qualified in order to improve the efficiency of our hiring process even more Custodial & Maintenance The Department continues to look for ways to improve and reduce cost. The department is devoted to researching and adding new technology to cut down on manual processes and man-hours. The use of iPhones, iPads, and portable computer devices are used by all supervisors and most technicians in Custodial and Maintenance. This continues to increase efficiency and the processing of work orders in a timely manner. The improved technology has improved the response to campuses and increased communication with campus personnel regarding their maintenance, facility rentals, and custodial needs. The department has improved the use of Docushare, an electronic invoice processing software and electronic employee personnel files, to include the addition of automating the electronic submission and approval of the District's facility enhancement forms request. This process has allowed for a more efficient process for managing request for
campus and department facility improvements.
346

Departmental Performance Continued
Custodial & Maintenance Continued The Department strives to reduce accidents in the work place. The Department continues to see improvement with the accident review committee that was created in 2017. The goal is to reduce accidents through awareness and training. The Department has continued to train staff. Management, safety, OSHA, technology, and craft specific training was provided for the maintenance and custodial leaders and employees. The In addition, all Custodial and Maintenance coordinators and department administrators have achieved Texas Association of School Business Officers (TASBO) certification. This has created a work environment that continues to concentrate on safety and efficiency. This is extremely important, as the Custodial and Maintenance departments completed over 50,000 work orders with more than a 95% being complete and more than 81% completed within seven days of submission in 2017-
2018. Child Nutrition Child Nutrition Department implemented an online system to accept free/reduced lunch applications for all students. This will help increase efficiency and effectiveness to the Department. The Department also gained a 5% increase in the number of meals served to the students. The popular menu choices and quality food offered has increased lunch participation. Professional development was provided through monthly training classes for managers to help deal with employees and ensure they understand the importance of food safety and food quality. Cafeteria improvements were made by renovating serving lines for two elementary schools, Giesinger and Bush and installing new equipment, cooler/freezer, at Giesinger and Bush Elementary.
347

Year National State District
2013-2014 1010 971 1064
2014-2015 1006 924 1075
2015-2016 1002 934 1056
2016-2017 1070 1019 1143
2017-2018 1049 1032 1148
* Note: The SAT Test scores were redesigned in 2016-2017.
Year National State District
2013-2014 21.0 20.9 23.5
2014-2015 21.0 20.9 24.1
2015-2016 20.8 20.6 23.2
2016-2017 21.0 20.7 23.5
2017-2018 20.8 20.6 23.2
ACT Scores
SAT Scores
Conroe Independent School District
District PerformanceSAT / ACT Results
(Combined Critical Reading & Math)
920
970
1020
1070
1120
1170
National State District
SAT Scores
2013-2014 2014-2015 2015-2016 2016-2017 2017-2018
20
21
22
23
24
25
National State District
ACT Scores
2013-2014 2014-2015 2015-2016 2016-2017 2017-2018
348

Senior Survey Results 17-18 Question 1: What area(s) do you plan to pursue immediately after high school?
4-yr College 52.4%2-yr College 27.1%Voc/Tech School 1.5%Work Full Time 7.7%Work Part Time 5.4%Apprenticeship 0.4%Military 3.7%Other 1.8%
Question 2: Ethnic origin
African American 8.6%Asian 6.3%Hispanic 32.0%Native American 1.0%White/Caucasian 54.3%Other 2.7%
Question 3: Gender
Male 49.6%
Female 50.4%
Total 100.0%
Question 4: In which grade did you begin working at an after-school job?
9th 8.6%
10th 21.6%
11th 24.9%
12th 19.5%
NA
1-yr 10.3%
2-yr 12.8%
3-yr 13.3%
4-yr 50.7%
NA 12.8%
Total 100.0%
Question 6: My school counselors provided me with accurate and useful information.
Strongly Agree 31.5%
Agree 56.8%
Disagree 8.4%
Strongly Disagree 3.3%
Total 100.0%
Question 5: During my time at ______ High School, I was involved in extracurricular activities such
as sports, fine arts, clubs, etc.
349

Senior Survey Results 17-18
Strongly Agree 22.7%
Agree 62.4%
Disagree 11.8%
Strongly Disagree 3.1%
Total 100.0%
Question 8: I had enough elective choices to allow me to explore different career opportunities.
Strongly Agree 32.1%
Agree 53.8%
Disagree 12.1%
Strongly Disagree 2.0%
Total 100.0%
Question 9: I believe that I will be able to find a job that will support me.
Strongly Agree 55.1%
Agree 42.2%
Disagree 2.1%
Strongly Disagree 0.5%
Total 100.0%
Question 10: I experienced significant harassment from other students.
Strongly Agree 4.9%Agree 10.8%Disagree 47.9%Strongly Disagree 36.4%Total 100.0%
Question 11: My teachers held high standards and required quality work.
Strongly Agree 31.9%
Agree 59.9%
Disagree 6.9%
Strongly Disagree 1.4%
Total 100.0%
Question 12: I had the opportunity to take higher level and more challenging courses.
Strongly Agree 52.6%
Agree 40.0%
Disagree 6.1%
Strongly Disagree 1.3%
Total 100.0%
Question 7: The teachers at ______ High School made learning exciting and encouraged me to
continue my education.
350

Senior Survey Results 17-18 Question 13: The adults at ______ High School cared about my success.
Strongly Agree 31.6%
Agree 58.1%
Disagree 8.2%
Strongly Disagree 2.1%
Total 100.0%
Question 14: I had a very good learning experience at ______ High School.
Strongly Agree 29.8%
Agree 59.4%
Disagree 8.4%
Strongly Disagree 2.4%
Total 100.0%
Question 15: ______ High School provided a safe environment.
Strongly Agree 29.0%
Agree 58.8%
Disagree 9.3%
Strongly Disagree 3.0%
Total 100.0%
Question 16: I feel prepared for the transition from _____ High School to college or the work place.
Strongly Agree 34.0%Agree 53.3%Disagree 10.3%Strongly Disagree 2.4%Total 100.0%
Question 17:_____ High School provided me a strong foundation in the use of technology.
Strongly Agree 24.0%Agree 55.9%Disagree 17.0%Strongly Disagree 3.1%Total 100.0%
Question 18: My parents have been very involved in my education.
Strongly Agree 43.9%
Agree 41.5%
Disagree 11.0%
Strongly Disagree 3.6%
Total 100.0%
351

Senior Survey Results 17-18 Question 19: I made a strong effort to succeed at _____ High School.
Strongly Agree 43.0%
Agree 48.5%
Disagree 6.7%
Strongly Disagree 1.6%
Add Answer Choice here 0.2%
Total 100.0%
Question 20: The College and Career Center was very helpful to me.
Strongly Agree 39.4%
Agree 48.6%
Disagree 8.6%
Strongly Disagree 3.4%
Total 100.0%
Question 21: My assistant principal was fair and consistent.
Strongly Agree 30.6%
Agree 57.8%
Disagree 7.7%
Strongly Disagree 3.9%
Total 100.0%
352

Informational Section Additional Information

CaneyCreek
Conroe
TheWoodlands
OakRidge
GrandOaks
Conroe ISD Campus Locations
MCJDC444
16A54
3912
5
158
27
3536
3720
26 34 27
3841
43
18
24
21
29
3019
17
28253331
9
6
10
3
23
42
45
49
50
51
C B
52
Grand Oaks ZoneHigh School 60 Grand Oaks High SchoolJunior High School 47 York Junior HighIntermediate Schools 48 Cox Intermediate 59 Clark IntermediateElementary Schools 51 Birnham Woods Elementary 58 Bradley Elementary 46 Broadway Elementary 19 Ford Elementary 53 Snyder Elementary
Oak Ridge ZoneHigh School 33 Oak Ridge High School 31 Oak Ridge HS - 9th grade campus & Academy for Careers in Engineering & ScienceJunior High School 52 Irons Junior HighIntermediate Schools 17 Vogel IntermediateElementary Schools 19 Ford Elementary 28 Houser Elementary 45 Kaufman Elementary 25 Oak Ridge Elementary 61 Suchma Elementary
The Woodlands ZoneHigh School 42 The Woodlands College Park HS & Academy of Science & Technology 34 The Woodlands High School 38 The Woodlands HS - 9th grade campusJunior High School 30 Knox Junior High 32 McCullough Junior HighIntermediate Schools 27 Collins Intermediate 36 Mitchell Intermediate 29 Wilkerson IntermediateElementary Schools 37 Buckalew Elementary 35 Bush Elementary 18 David Elementary 43 Deretchin Elementary (K-6) 20 Galatas Elementary 21 Glen Loch Elementary 22 Hailey Elementary 23 Lamar Elementary 26 Powell Elementary 24 Ride Elementary 41 Tough Elementary (K-6)
13
40
14
55
156
32
11
57
Imperial Oaks
Birnh am W
oods Dr.
Al dine WestfieldRayford Rd. Rayford Rd.
Hardy Toll Rd.
47
4648
58
5953
60
Caney Creek ZoneHigh School 57 Caney Creek High SchoolJunior High School 13 Moorhead Junior HighIntermediate Schools 40 Grangerland Intermediate Elementary Schools 3 Austin Elementary 10 Creighton Elementary 6 Milam Elementary 9 San Jacinto Elementary
A Deane L. Sadler Administration/ Technology Center 3205 West Davis Conroe, TX 77304-2098________________________________B CISD Police Command Center 2900 N. Loop 336 East Conroe, TX 77301________________________________C DAEP and JJAEP 2235 N. First Street Conroe, TX 77301
Grogan ’s Point Rd.22
FM 1485
FM 1314
Willis W
alukegan Rd.
FM 1485
Stidham Rd.
Magnolia BendOld Hum
ble Pipeline Rd.
I-45
I-45
I-45
Frazier
Frazier
Avenue M
Airp
ort R
d.
Teas Nursery Rd.
Hwy 105
Wilson Rd.
E. DallasHwy 105
Hwy 105
FM 1484Old Hwy 105
FM 14
84
Willis Walukegan Rd.
Whi
ppor
will
Albe
rt M
oorh
ead
Rd.
Old
Hou
ston
Rd.
FM 1314
FM 1314Ea
st Te
x Fre
eway
/Hwy
59
Hwy 242
Gulf Coast Rd.
FM 2090
FM 3083
Gladstell St.
Old
Mag
nolia
Rd.
Hope Rd.
Hwy 242Needham Rd.
College Park Dr.
Carri
age H
ills B
lvd
Research Forest
Kuyk
enda
hlKu
yken
dahl
Sleepy HollowTamina Rd .
Research Forest
Robinson Rd.
Kuyk
enda
hl
HannaRichards Rd.
Lake Woodlands Grogan’s Mill
N. Millbend S. Millbend
Sawdust
SawdustSawdust
Glen Loch Dr.
Woodlands Pkw.
Flintridge Pant
her C
ree
k
Goslin
g Rd.
Woodlands Pkw.
Coch
ran’s
Cros
sing
Creighton Rd.
Loop
336
Loop 336
Loop 336Loop 336
W. D allas
FM 14
84
San Jacinto River
San Jacinto R iver
Spring Creek
Spring Creek
Conroe Zone 12 Hauke Academic Alternative High School (9-12)MCJDC Montgomery County Juvenile Detention CenterHigh School 16 Conroe High School & Academy for Science & Health Professions 54 Conroe High School - 9th grade campusJunior High School 14 Peet Junior High 62 Stockton Junior High 15 Washington Junior High Intermediate Schools 49 Bozman Intermediate 44 Cryar Intermediate 39 Travis IntermediateElementary Schools 1 Anderson Elementary 2 Armstrong Elementary 3 Austin Elementary 4 Giesinger Elementary 5 Houston Elementary 56 Patterson Elementary 11 Reaves Elementary 7 Rice Elementary 8 Runyan Elementary 55 Stewart Elementary (K-6) 50 Wilkinson Elementary
61
62
353

Date: Assessment: Description:
August 20, 2018-September 14, 2018 Benchmark Universal Screening-Gr 7-8
September 4, 2018 - October 2, 2018 Benchmark Universal Screening-Math Gr 1-6
September 10-28, 2018 Benchmark Universal Screening Lang Arts Gr 1-6
September 10-28, 2018 Benchmark ELA Writing Gr 8
September 17, 2018-October 5, 2018 Benchmark Universal Screening Lang Arts Kinder
October 9-12, 2018 PSAT College Readiness Gr 8-9 JHS
October 9-12, 2018 Benchmark District #1 ELA Reading Gr 7
October 22, 2018-November 2nd, 2018 CogAT Gifted & Talented Gr. 2
October 22-26, 2018 Benchmark Sci Gr 5
October 29, 2018-November 2, 2018 Benchmark Writing Gr 4
October 29, 2018-November 2, 2018 Benchmark Reading Gr 5
October 29, 2018-November 9, 2018 Benchmark ELA- Gr 7 Writing
October 30, 2018-November 9, 2018 Benchmark Social Studies Gr 8
November 2018 Interim Assessment Opportunity#1
November 5-9, 2018 Benchmark Math Gr 5
November 5-16, 2018 Benchmark District #1 Math Gr 7-8
November 5-16, 2018 Benchmark District #1 ELA Reading Gr 8
November 10, 2018 CBE Fall Session
November 13-17, 2018 Benchmark Science Gr 6
November 26, 2018 -December 14, 2018 Benchmark District #2 Lang Arts Universal Screening Kinder
November 26-30, 2018 Benchmark Reading Gr 3-6
December 1, 2018 CBE Fall Session
December 3-7, 2018 Benchmark Math Gr 3-6
December 3-7, 2018 STAAR Eng I, Eng II, Alg 1, Bio & U.S. History
January 7 -31, 2019 Benchmark Universal Screening Lang Arts Gr 7-8
January 8, 2019 -February 8, 2019 Benchmark Universal Screening Math Gr 1-6
January 14-18, 2019 Benchmark Science Gr 7-8
January 8-25, 2019 Benchmark lan Arts Universal Screening -Gr 1-6
January 28, 2019-February 8, 2019 Benchmark ELA-Writing GR 7
January 28, 2019-February 8, 2019 Spring GT CogAT, Iowa and Logramos
January 2019-Early March 2019 NAEP Reading, Math, Sci Gr 4, 8 & 12 and HS Transcript Study
2018-2019 Test Dates
354

Date: Assessment: Description:
2018-2019 Test Dates
February 4-8, 2019 Benchmark District #2-Reading Gr 5
February 4-15, 2019 Benchmark District #2-Math- Gr 8
February 11-15, 2019 Benchmark District #2 Writing -Gr 4
February 16, 2019 CBE Spring Session
February 18, 2019- March 1, 2019 Benchmark District #2 ELA Reading- Gr8
February 25, 2019-March 1, 2019 Benchmark District #2 Math- Gr 5
February 25, 2019-March 1, 2019 Benchmark District #2 Writing- Gr 3 & 6
February 25, 2019-March 1, 2019 Benchmark District #2 Reading- Gr 7
February 25, 2019-March 1, 2019 Benchmark District #2 Writing- Gr 7
February 25, 2019-March 8, 2019 Benchmark Social Studies- Gr 8
February 25, 2019-April 5, 2019 TELPAS/TELPAS ALT Listening,Speaking, Reading and Writing
March 2nd, 2019 CBE Spring Session
March 25-29, 2019 Benchmark Reading -Gr 3-6
March 25-29, 2019 Benchmark Science -Gr 5
April 1-5, 2019 Benchmark Science -Gr 8
April 1-5, 2019 Benchmark Math -Gr 3,4 & 6
April 1-7, 2019 Benchmark Math- Gr 7
April 1-19, 2019 STAAR ALT Gr 3-8 and EOC
April 9, 2019 STAAR Writing 4/7, Math 5/8, Eng I
April 10, 2019 STAAR Reading Gr 5/8
April 11, 2019 STAAR English II
April 12, 2019 STAAR Makeup sessions
May 6-10, 2019 STAAR Alg 1, Bio, US History
May 6-17, 2019 Benchmark Social Studies Gr 7
May 6-24, 2019 Benchmark Science Gr 7
May 13-17, 2019 Benchmark Math Gr 2
May 13, 2019 STAAR Math-Gr 3-4 ,6-7 & 5- 8 (Retest)
May 13-24, 2019 GT K-1/Logramos
May 14, 2019 STAAR Reading Gr 3-4
May 14, 2019 STAAR Reading Gr 5/8 Retest
May 15, 2019 STAAR Science Gr 5/8 & Alg II
355

Date: Assessment: Description:
2018-2019 Test Dates
May 16, 2019 STAAR Social Studies Gr 8
May 17, 2019 STAAR Makeup Sessions
May 20-24, 2019 Benchmark Social Studies Gr 3-6
May 20-24, 2019 Benchmark Science Gr 4
May 31, 2019 CBE Summer Session
June 3, 2019 CBE Summer Session I
June 4-6, 2019 GT K-1/Logramos Testing Window
June 24, 2019 STAAR Eng I
June 25, 2019 STAAR Math 5/8 & Eng II
June 26, 2019 STAAR Reading -5/8 & Eng II
June 28, 2019 STAAR Make up sessions
June 24-28, 2019 STAAR ALG I , Bio, Hisory
July 26, 2019 CBE Summer Session II
July 29, 2019 CBE Summer Session II
356

Days of Instruction Students Teachers_________________________________________________
1st Semester 84 91_________________________________________________
2nd Semester 93 96 _________________________________________________
Total Days 177 187
Grading Periods1st Semester
_________________________________________________ Grading period Ends _________________________________________________
1st October 5_________________________________________________
2nd December 19 _________________________________________________
2nd Semester_________________________________________________ Grading period Ends _________________________________________________
1st March 8 _________________________________________________
2nd May 30_________________________________________________
StudentsStarting date ................... August 15Ending date.........................May 30
StaffStarting date .....................August 6Ending date......................... May 31
Student HolidaysLabor Day ................... September 3Holiday........................... October 8Thanksgiving .......... November 19-23Winter Break.............. Dec. 20 - Jan. 7Martin Luther King, Jr. Day....... Jan. 21Presidents’ Day.............. February 18Spring Break.................. March 11-15Holiday.....................April 19 and 22Memorial Day...................... May 27
Teacher Work DaysAugust 14January 7
May 31
Staff DevelopmentAugust 6-14February 18
Student Early ReleaseOctober 5
December 19March 8May 30
Staff Make-up DaysMake-up days for inclement weather
(if needed), are:
Staff: June 1 Flex
4/11/18
The Conroe Independent School District (District) as an equal opportunity educational provider and employer does not discriminate on the basis of race, color, national origin, sex, religion, age, or disability in educational programs or activities that it operates or in employment matters. The District is required by Title VI and Title VII of the Civil Rights Act of 1964, as amended, Title IX of the Education Amendments of 1972, the Age Discrimination Act of 1975, as amended, Section 504 of the Rehabilitation Act of 1973, the Americans with Disabilities Act, as well as Board policy not to
discriminate in such a manner. For information about Title IX rights or Section 504/ADA rights, contact the Title IX Coordinator or the Section 504/ADA coordinator at
3205 W. Davis, Conroe, TX 77304; (936) 709-7752.
August 2018 September 2018 October 2018
November 2018 December 2018 January 2019
February 2019 March 2019 April 2019
May 2019 June 2019 July 2019
1
2 3 4 5 6 7 8
9 10 11 12 13 14 15
16 17 18 19 20 21 22
23 24 25 26 27 28 29
30
Report Cards Individual campuses will report distribution date for report cards a�er each grading period.
2018 - 2019School Calendar
1 2 3 4 5
6 7 8 9 10 11 12
13 14 15 16 17 18 19
20 21 22 23 24 25 26
27 28 29 30 31
1 2 3 4 5 6
7 8 9 10 11 12 13
14 15 16 17 18 19 20
21 22 23 24 25 26 27
28 29 30 31
1 2 3 4 5 6
7 8 9 10 11 12 13
14 15 16 17 18 19 20
21 22 23 24 25 26 27
28 29 30
1 2
3 4 5 6 7 8 9
10 11 12 13 14 15 16
17 18 19 20 21 22 23
24 25 26 27 28 29 30
31
1 2 3 4
5 6 7 8 9 10 11
12 13 14 15 16 17 18
19 20 21 22 23 24 25
26 27 28 29 30 31
1
2 3 4 5 6 7 8
9 10 11 12 13 14 15
16 17 18 19 20 21 22
23 24 25 26 27 28 29
30 31
1 2 3
4 5 6 7 8 9 10
11 12 13 14 15 16 17
18 19 20 21 22 23 24
25 26 27 28 29 30
1
2 3 4 5 6 7 8
9 10 11 12 13 14 15
16 17 18 19 20 21 22
23 24 25 26 27 28 29
30
1 2 3 4 5 6
7 8 9 10 11 12 13
14 15 16 17 18 19 20
21 22 23 24 25 26 27
28 29 30 31
1 2
3 4 5 6 7 8 9
10 11 12 13 14 15 16
17 18 19 20 21 22 23
24 25 26 27 28
1 2 3 4
5 6 7 8 9 10 11
12 13 14 15 16 17 18
19 20 21 22 23 24 25
26 27 28 29 30 31
357

Conroe Independent School District
358

GLOSSARY This glossary contains definitions of terms used in this guide and such additional terms as seem necessary to common understandings concerning financial accounting procedures for schools. Several terms, which are not primarily financial accounting terms, have been included because of their significance for school financial accounting. The glossary is arranged alphabetically with appropriate cross-referencing where necessary. Abatement – A complete or partial cancellation of a levy imposed by a governmental unit.
Abatements usually apply to tax levies, special assessments, and service charges. School accountants usually consider an abatement to be a reduction of a previously recorded expenditure or receipt item by such things as refunds, rebates, and collections for loss or damage to school property.
Account – A descriptive heading under which are recorded financial transactions that are similar
in terms of a given frame of reference such as purpose, object, or source. Accounting Period – A period at the end of which and for which financial statements are prepared,
i.e., September 1st through August 31st. Accrual – An accrual allows an entity to record expenses and revenues for which it expects to
expend cash or receive cash, respectively, in a future reporting period. ACT – Acronym for American College Test. ADA – Acronym for Average Daily Attendance. Admission, Review and Dismissal (ARD) Committee– Each school district or special education
shared services arrangement shall establish at least one ARD committee which shall make decisions concerning the educational program of a student referred for special education. All members of the ARD committee shall have the opportunity to participate in a collaborative manner in developing the Individual Education Plan (IEP).
Administration – Those activities that have as their purpose the general regulation, direction, and
control of the affairs of the local education agency that are system-wide and not confined to one school. Subject or narrow phase of school activity.
AEIS – Acronym for Academic Excellence Indicator System. Allocation – A part of a lump sum appropriation which is designated for expenditure by specific
organization units and/or for special purposes, activities, or objects. Appraisal – (1) The act of appraising. (2) The estimated value resulting from such action. Appraise – To make an estimate of value, particularly of the value of property. Note, if the property
is valued for purposes of taxation, the less-inclusive term “assess” is substituted for the above term.
Appropriation Account – A budgetary account set up to record specific authorization to spend.
The account is credited with original and any supplemental appropriations and is charged with expenditures and encumbrances.
ARD – Acronym for Admission, Review, Dismissal.
359

ASATR – Acronym for Additional State Aid for Tax Reduction. Assess – To value property officially for the purpose of taxation. Note, the term is also sometimes
used to denote the levy of taxes but such usage is not correct because it fails to distinguish between the valuation process and the tax levy process.
Assessed Valuation – A valuation set upon real estate or other property by a government as a
basis for levying taxes. Assets – Property owned by a local education agency that has a monetary value. AV - Acronym for Assessed Value Balanced Budget – A budget in which the expenditures incurred during a given period are matched
by revenues. Bill – (1) A term used to denote a law or statute passed by certain legislative bodies. A bill has
greater legal formality and standing than a resolution. (2) A statement of an amount owing for goods and services sold on open account.
Board of Education – The elected or appointed body that has been created according to State
law and vested with responsibilities for educational activities in a given geographical area. These bodies are sometimes called school boards, governing boards, boards of directors, school committees, school trustees, etc. This definition relates to the general term and covers State boards, intermediate administrative unit boards, and local basic administrative unit boards.
Bond – A written promise, generally under seal, to pay a specified sum of money, called the face
value, at a fixed time in the future, called the date of maturity, and carrying interest at a fixed rate, usually payable periodically. The difference between a note and a bond is that the latter usually runs for a longer period of time and requires greater legal formality.
Bonded Debt – The part of the school district debt which is covered by outstanding bonds of the
district, sometimes called “Funded Debt or Bonded Indebtedness.” Bonds Authorized and Unissued – Bonds which have been legally authorized but not issued and
which can be issued and sold without further authorization. Bonds Issued – Bonds sold. Bonds Payable – The face value of bonds issued and unpaid. Budget – A plan of financial operation embodying an estimate of proposed expenditures for a given
period or purpose and the proposed means of financing them. The budget usually consists of three parts. The first part contains a message from the budget-making authority together with a summary of the proposed expenditures and the means of financing them. The second part consists of schedules supporting the summary. These schedules show in detail the proposed expenditures and means of financing them together with information as to past years’ actual revenues and expenditures and other data used in making the estimates. The third part is composed of drafts of the appropriation, revenue, and borrowing measures necessary to put the budget into effect.
Budgetary Accounts – Those accounts necessary to reflect budget operations and conditions,
such as estimate revenues, appropriations, encumbrances, the net balance, and other related information.
360
Capital Budget – A plan of proposed capital outlays and the means of financing them for the fiscal period. It is usually a part of the current budget. A capital program is sometimes referred to as a capital budget.
Capital Outlays – Expenditures that result in the acquisition of or addition to fixed assets. Capital Program – A plan for capital expenditures to be incurred each year over a fixed period of
years to meet capital needs arising from the long term work program or otherwise. It sets forth each project or other contemplated expenditure in which the local education agency is to have a part and specified the full resources estimated to be available to finance the projected expenditures.
CASE – Acronym for Community and School Engagement Rating. Cocurricular Activities – Direct and personal services for public school pupils such as
interscholastic athletics, entertainment, publications, clubs, band, and orchestra that are managed or operated by the student body under the guidance and direction of an adult and are not part of the regular instructional program.
Community Services – Those services that are provided for the community as a whole or some
segment of the community and which are not restricted to the public schools or adult education programs.
Consultant – A resource person who provides assistance to the regular personnel through
conference, demonstration, research, or other means. There are two types of consultants – those retained on a temporary basis and those who are permanently employed.
Contracted Services – Labor, material, and other costs for services rendered by personnel who
are not on the payroll of the local education agency. Current – As used in this manual, the term has reference to the fiscal year in progress. Current Expenditures Per Pupil – Current expenditures for a given period of time divided by a
pupil unit of measure (average daily membership, average daily attendance, etc.) Current Year’s Tax Levy – Taxes levied for the current fiscal period. Debt – An obligation resulting from the borrowing of money or from the purchase of goods and
services. Debts of local education agencies include bonds, warrants, notes, etc. Debt Limit – The maximum amount of gross or net debt that is legally permitted. Debt Service Fund – A fund used to account for the accumulation of resources and payment of
principal and interest on all bonds. Deficit – The excess of the obligations of a fund over the fund’s resources. Delinquent Taxes – Taxes remaining unpaid on and after the date on which they become
delinquent by statute. DTR – Acronym for District Tax Rate. Estimated Revenue – When the accounts are kept on an accrual basis, this term designates the
amount of revenue estimated to accrue during a given period regardless of whether or not it is all to be collected during the period.
Expenditures – This includes total charges incurred, whether paid or unpaid, for current expense,
capital outlay, and debt service. (Transfers between funds, encumbrances, and payments
361

of cash in settlement of liabilities already accounted as expenditures are not considered as expenditures.)
Expenses – Charges incurred, whether paid of unpaid, for operation, maintenance, interest, and
other charges that are presumed to benefit the current fiscal period. Fiscal Year – A twelve-month period of time to which the annual budget applies and at the end of
which a local education agency determines its financial position and the results of its operations.
Fixed Assets – Land, building, machinery, furniture, and other equipment that the school district
intends to hold or continue to use over a long period of time. “Fixed” denotes probability or intent to continue use or possession and does not indicate immobility of an asset.
Food Service - Those activities which have as their purpose the preparation and serving of regular
and incidental meals, lunches, or snacks in connection with school activities. FTE – Acronym for full-time equivalent. Function – As applied to expenditures, this term has reference to an activity or service aimed at
accomplishing a certain purpose or end; for example, instruction, instructional administration, plant maintenance and operations.
Fund – A sum of money or other resources set-aside for specific activities of a school district. The
fund accounts constitute a complete entity and all of the financial transactions for the particular fund are recorded in them.
Fund Balance – The excess of assets of a fund over its liabilities and reserves. During the fiscal
year prior to closing, it represents the excess of the fund’s assets and estimated revenues for the period over its liabilities, reserves, and appropriations for the period.
GAAP – Acronym for Generally Accepted Accounting Principles. General Fund – A fund used to finance the ordinary operations of the local education agency. It
is available for a legally authorized purpose and consists of money not specifically designated for some other particular purpose.
Instruction – The activities dealing directly with the teaching of students or improving the quality
of teaching. Interest – A fee charged a borrower for the use of money. Inventory – A detailed list or record showing quantities, descriptions, values, units of measure, and
unit prices of property on hand. I & S – Acronym for Interest & Sinking Fund (Debt Service Fund). ISD – Acronym for Independent School District. Levy – (Verb) To impose taxes or special assessments. (Noun) The total of taxes or special
assessments imposed by a governmental unit. Long Term Loan – A loan which extends for more than five years from the date the loan was
obtained and is not secured by serial or term bonds. Such loans are not legal in Texas under the general statutes.
MSA- Acronym for Metropolitan Statistical Area
362

M & O – Acronym for Maintenance and Operations Fund (General Fund). Modified Accrual Basis of Accounting – A basis of accounting in which expenditures are accrued
but revenues are accounted for when it becomes measurable and available. Object – As applied to expenditures, this term has reference to an article or service received; for
example, payroll costs, purchased and contracted services, materials and supplies. Payroll – A list of individual employees entitled to pay with the amount due to each for personal
services rendered. Personnel, Full Time – School employees who occupy positions whose duties require them to be
on the job on school days throughout the school year or at least the number of hours the schools in the system are in session.
Personnel, Part Time – Personnel who occupy positions whose duties require less than full time
service. This includes those employed full time for part of the school year, part time for all of the school year and part time for part of the school year. See also Personnel, Full Time.
Plant Maintenance (Plant Repairs and Repairs and Replacements of Equipment) – Those
activities which are concerned with keeping the grounds, buildings and equipment at their original condition, completeness or efficiency either through repairs or by replacements of property (anything less than replacement of a total building).
Principal of a School – The administrative head of a school (not school district) to whom has been
delegated the major responsibility for the coordination and supervision of the activities of the school.
Principal of Bonds – The face value of bonds. Program – The definition of an effort to accomplish a specific objective or objectives consistent
with funds or resources available. Budgets and actual revenue and expenditure records may be maintained per program.
Program Budget – A budget wherein expenditures are based primarily on programs of work and
secondarily on character and object. A program budget is a transitional type of budget between the traditional character and object number on the one hand and the performance budget on the other.
NCLB – Acronym for No Child Left Behind. Refunding Bonds – Bonds issued to pay off bonds already outstanding. Refined Average Daily Attendance – Refined average daily attendance is based on the number
of days of instruction in the school year. The aggregate eligible days attendance is divided by the number of days of instruction to compute the refined average daily attendance.
Reimbursement – Cash or other assets received as a repayment of the cost of work or services
performed or of other expenditures made for, or on behalf of, another governmental unit or department, individual, firm, or corporation.
Reserve – An amount set aside for a specified purpose or an account which records a portion of
the fund balance which is to be segregated for some future use and, therefore, is not available for further appropriation and expenditure.
"Robin Hood" Plan Chapter 41 Wealth Equalization. Chapter 41 of the Texas Education Code
requires school districts that are property wealthy to share their wealth with school districts that are property poor. Also sometimes referred to as the "share the wealth".
363

Salary – The total amount regularly paid or stipulated to be paid to an individual before deductions
for personal services rendered while on the payroll of the school district. Payments for sabbatical leave are also considered as salary.
SAT – Acronym for Standardized Achievement Tests. School – A division of the school system consisting of a group of pupils composed of one or more
teachers to give instruction of a defined type and housed in a school plant of one or more buildings. More than one school may be housed in one school plant as is the case when the elementary and secondary programs are housed in the same school plant.
School, Elementary – A school classified as elementary by State and local practice and composed
of any span of grades not above grade six. In this District this term includes kindergartens and pre-kindergartens if they are under the control of the local board of education.
School, Intermediate – A separately organized intermediate elementary school between early
elementary and middle school. In this District intermediate schools include grades five and six.
School, Junior High – A separately organized secondary school between elementary,
intermediate, and senior high school. In this District junior high schools include grades seven and eight.
School, Public – A school operated by publicly elected or appointed school officials in which the
program and activities are under the control of these officials and which is supported by public funds.
School, Secondary – In this handbook a secondary school comprises any span of grades
beginning with the next grade following the elementary/intermediate school and ending with or below grade 12, including junior high schools, the different type of high schools and alternative high schools.
School, Senior High – A school offering the final years of high school work necessary for
graduation, invariably preceded by a junior high school in the same system. School, Summer – The name applied to the school session carried on during the period between
the end of the regular school term and the beginning of the next regular school term. SDAA – Acronym for State Developed Alternative Assessment. Serial Bonds – Bonds whose principal is to be repaid in periodic installments over the life of the
issue. STAAR – Acronym for State of Texas Assessments of Academic Readiness STaR Chart – Texas School Technology and Readiness Chart is designed to help teachers,
campuses, and districts determine their progress toward meeting the goals of the Long-Range Plan for Technology as well as meeting the goals of the district.
State Aid for Education – Any grant made by a State government for the support of education. Student Wealth – Assessed value of property divided by school enrollment. Supplemental Taxes – Taxes levied subsequent to the initial levy to add property omitted from the
original tax roll(s).
364

Supply – A material item of an expendable nature that is consumed, worn out, or deteriorated in use or one that loses its identity through fabrication or incorporation into a different or more complex unit or substance.
TAAS – Acronym for Texas Assessment Academic Skills exam. TAKS – Acronym for Texas Assessment of Knowledge and Skills exam. Taxes – Compulsory charges levied by a governmental unit for the purpose of financing services
performed for the common benefit. The term includes licenses and permits. It does not include special assessments.
TEA – Acronym for Texas Education Agency. TEASE- Acronym for Texas Education Agency Security Environment TRS – Acronym for Teacher Retirement System. Unencumbered Balance of Appropriation – That portion of an appropriation not yet expended
or encumbered. The balance remaining after deducting from the appropriation the accumulated expenditures and outstanding encumbrances.
Unexpended Balance of Appropriation – That portion of an appropriation not yet expended. The
balance remaining after deducting from the appropriation the accumulated expenditures. Unit Cost – Expenditures for a function, activity, or service divided by the total number of units for
which the function, activity, or service was provided. WADA – Acronym for Weighted Average Daily Attendance.
365

Conroe Independent School District
366

3205 West Davis Conroe, Texas 77304-2098
www.conroeisd.net