confocal rheology probes the structure and mechanics of ... pdfs... · article confocal rheology...
TRANSCRIPT
Article
Confocal Rheology Probes the Structure andMechanics of Collagen through the Sol-GelTransition
Khanh-Hoa Tran-Ba,1 Daniel J. Lee,1 Jieling Zhu,1 Keewook Paeng,1 and Laura J. Kaufman1,*1Department of Chemistry, Columbia University, New York, New York
ABSTRACT Fibrillar type I collagen-based hydrogels are commonly used in tissue engineering and as matrices for biophysicalstudies. Mechanical and structural properties of these gels are known to be governed by the conditions under which fibrillogen-esis occurs, exhibiting variation as a function of protein concentration, temperature, pH, and ionic strength. Deeper understand-ing of how macroscopic structure affects viscoelastic properties of collagen gels over the course of fibrillogenesis providesfundamental insight into biopolymer gel properties and promises enhanced control over the properties of such gels. Here,we investigate type I collagen fibrillogenesis using confocal rheology—simultaneous confocal reflectance microscopy, confocalfluorescence microscopy, and rheology. The multimodal approach allows direct comparison of how viscoelastic properties trackthe structural evolution of the gel on fiber and network length scales. Quantitative assessment and comparison of each imagingmodality and the simultaneously collected rheological measurements show that the presence of a system-spanning structureoccurs at a time similar to rheological determinants of gelation. Although this and some rheological measures are consistentwith critical gelation through percolation, additional rheological and structural properties of the gel are found to be inconsistentwith this theory. This study clarifies how structure sets viscoelasticity during collagen fibrillogenesis and more broadly highlightsthe utility of multimodal measurements as critical test-beds for theoretical descriptions of complex systems.
INTRODUCTION
Type I collagen is the most abundant protein in themammalian extracellular matrix and plays a role in abroad variety of critical functions in mammals includingtissue scaffolding, cell adhesion and migration, and woundhealing (1–3). In recent years, collagen I matrices haveregularly been prepared in vitro for use in biophysicalexperiments and bioengineering applications (4–8). Forexample, reconstituted collagen hydrogels have beenemployed as physiologically relevant, tunable environ-ments for investigating how cells respond to environmentsof different stiffness in three dimensions. For such studies,characterization of mechanical properties and structureof the matrix is critical, as cells may alter their behaviorin response not only to altered gel stiffness but alsoindependently to accompanying changes in gel networkstructure (9–13).
Submitted April 13, 2017, and accepted for publication August 18, 2017.
*Correspondence: [email protected]
Keewook Paeng’s present address is Department of Chemistry, Sungkyunk-
wan University (SKKU), Suwon, Republic of Korea.
Editor: Celeste Nelson.
1882 Biophysical Journal 113, 1882–1892, October 17, 2017
http://dx.doi.org/10.1016/j.bpj.2017.08.025
� 2017 Biophysical Society.
The self-assembly of collagen has primarily beendescribed with and tested against nucleation and growththeories (12,14–17). Indeed, it has been shown that a degreeof independent control over structural and mechanical prop-erties of collagen gels can be obtained through exploitingthe putative nucleation and growth based self-assemblyof these systems (12). Within nucleation-based models,three distinct regimes are expected in the self-assembly ofcollagen from a set of monomers to a fully assembled fibroushydrogel. These are the lag, growth, and plateau phases:during the lag phase, collagen monomers form critical nucleithat develop into fibrillar structures during the growth phaseuntil monomers are depleted, the plateau phase. This modelpredicts sigmoidal development of various experimentalobservables and was initially suggested based on the devel-opment of turbidity during collagen self-assembly (14,15).
Whereas nucleation and growth theory correctly predictsturbidity development during collagen self-assembly, thetheory (and turbidity measurements) cannot distinguishbetween a final structure consisting of, for example, a set ofdisconnected collagen fibers and a spanning network ofthe same. In contrast, both imaging and rheological mea-surements indicate that at concentrations typically used in
Confocal Rheology of Collagen Gelation
experiments employing reconstituted collagen, fibrillarcollagen structures do form a spanning network that canwith-stand stress. To describe the sol-gel transitions that occur insuch self-assembling systems common in biology, nucleationand growth theories are insufficient and additional theoriessuch as those of phase transitions, including geometric andrigidity percolation transitions, have been invoked (18–23).
Percolation theory describes gelation within the frame-work of critical phenomena, as a phase transition due togradual interconnection of clusters to form a single sys-tem-spanning cluster (a network) (20,24). Critical gelationas formulated by Winter and co-workers (24–31) predictsa variety of rheological behaviors, including power-lawscaling of loss and storage moduli with frequency in the vi-cinity of the sol-gel transition (or gelation point)—behaviorthat has been observed in some chemical and physical gels,including biological ones. Through connections with andextensions of percolation theory, the predicted structure ofnetworks going through critical gelation has also beendescribed (32–37). Understanding whether network struc-ture and mechanical properties of collagen networks canbe explained through critical gelation theory or other rela-tively simple approaches could enhance control over theseproperties in such systems, in analogy to the manner inwhich nucleation and growth has been exploited.
To assess whether the sol-gel transition in self-assemblingcollagen systems occurs through critical gelation, the evolu-tion of structure and viscoelasticity in the system mustbe followed during self-assembly. Although a few studieshave attempted to do so through side-by-side imaging andrheology studies (19,38), multimodal, simultaneous interro-gation of these properties is needed for unambiguous com-parison. Such studies could provide a critical test-bed fortheories describing collagen gelation aswell as those predict-ing collagen mechanical properties from structure (39–46).
Here, we use a multimodal confocal rheology apparatus tomonitor structural and viscoelastic evolution of collagen dur-ing its self-assembly and through the sol-gel transition. Thisapproach allows comparison of the sol-gel transition to pre-dictions of critical gelation theory.We show that the collagensystem displays a network spanning structure at a gelationtime defined through rheology as well as a scaling relation-ship consistent with gelation through percolation. However,other rheological and structural predictions of critical gela-tion theory do not hold in the collagen system under study.These findings highlight the power of the simultaneoustracking of structure and viscoelasticity to critically assesstheoretical approaches to describing complex systems.
MATERIALS AND METHODS
Chemicals and materials
High concentration type I acid-solubilized (AS) collagen (8.5–10 mg/mL,
in 0.02 M acetic acid, pH ¼ 2, rat tail), 4-(2-hydroxyethyl)-1-piperazinee-
thanesulfonic acid (1 M), sodium hydroxide (1 M), and sodium bicarbonate
(7.5%) were purchased from Corning (Corning, NY) and used without
further purification. Dulbecco’s modified Eagle’s medium (10�), ATTO
647N (with n-hydroxysuccimide-ester functionality, lex ¼ 646 nm, lem ¼664 nm), dimethyl sulfoxide, and acetic acid (99.7%) were purchased
from Sigma-Aldrich (St. Louis, MO) and used without further purification.
Dialysis tubing (Side-A-Lyzer, 20 k molecular weight cutoff; Sigma-
Aldrich) was used for purification of labeled collagen.
Fluorophore labeling of collagen monomers
Type I AS collagen monomers were conjugated with ATTO 647N fluo-
rescent dye molecules following a procedure reported previously (47,48).
Briefly, ATTO dye stock in dimethyl sulfoxide was prepared and
added to a 3.0 mg/mL collagen solution in 0.01 M sodium bicarbonate
(pH ¼ 9). The conjugation reaction was carried out at 4�C in the dark for
1 day. For purification, the product was dialyzed against 0.02 M acetic
acid for 3 days (or until the acetic acid was colorless) at 4�C in the dark
using mini-dialysis tubing. The acetic acid solution in the tubing was
changed twice a day. The final product was stored at 4�C in the dark at
pH ¼ 2 until use.
Preparation of ATTO-doped collagen gels
Collagen gels of 1.0 mg/mL were prepared by diluting a 3.0 mg/mL stock
solution (prepared from high concentration stock, in 0.02 M acetic
acid) with 10% Dulbecco’s modified Eagle’s medium, 2.5% 4-(2-hydrox-
yethyl)-1-piperazineethanesulfonic acid, and deionized H2O. The stock so-
lution was then doped with 3.0 mg/mL ATTO-labeled collagen (in 0.02 M
acetic acid). The final ratio of labeled to unlabeled collagen was 1:20.
All solutions were prepared and held on ice (�10 min) to allow air bubbles
induced by mixing to dissipate. To initiate collagen fibrillogenesis, 10 mL of
1 M NaOH was added to 700 mL solution for neutralization (pH z 7.4).
The ionic strength of all gel solutions was I z 0.13.
Confocal rheology instrumentation
Confocal rheology experiments were conducted on a modified rheometer
(MCR 302; Anton Paar, Graz, Austria) with an open bottom configuration
that allows for placement of a 60�, water-immersion objective lens
(UPLAPO, 60XW3, N.A. ¼ 1.2; Olympus, Tokyo, Japan) under the lower
plate, with height controlled with a manual micrometer. This configuration
allowed for simultaneous confocal imaging and rheology (Fig. 1) in a
manner similar to that described by Besseling et al. (49). The rheometer
was equipped with a solvent trap to minimize sample evaporation. Peltier
temperature control was provided from both the bottom of the rheometer
stage and the top, where a heating element is present in the inner hood of
the solvent trap, to limit possible temperature gradients in the sample.
The temperature was set to 25�C for 15 min to equilibrate and maintained
at 25�C during the measurements. A polycarbonate cone (CP50-1/PC;
1� tilt angle, 50 mm diameter, 100 mm truncation gap; Anton Paar) was
used for cone-plate rheology measurements in oscillatory mode. Glass
coverslips were custom made (UQG Optics, Cambridge, United Kingdom)
to fit the round bottom of the rheometer stage. Samples were illuminated
using Helium-Neon lasers (lex ¼ 543 and 633 nm; Melles Griot, Carlsbad,
CA) directed out the back of an inverted confocal laser scanning micro-
scope (Fluoview 300; Olympus) through a custom multiple lens/mirror sys-
tem to ensure the same magnification as if imaged on the confocal stage.
The objective, which was modified with a homebuilt heater, was placed
slightly off-center to avoid imaging directly at the truncation point of the
cone. The truncation gap was 100 mm in height, and the thickest portions
of the samples were �530 mm. At the objective focal point in the xy
plane of the sample, the gap was �210 mm. This sample configuration
Biophysical Journal 113, 1882–1892, October 17, 2017 1883
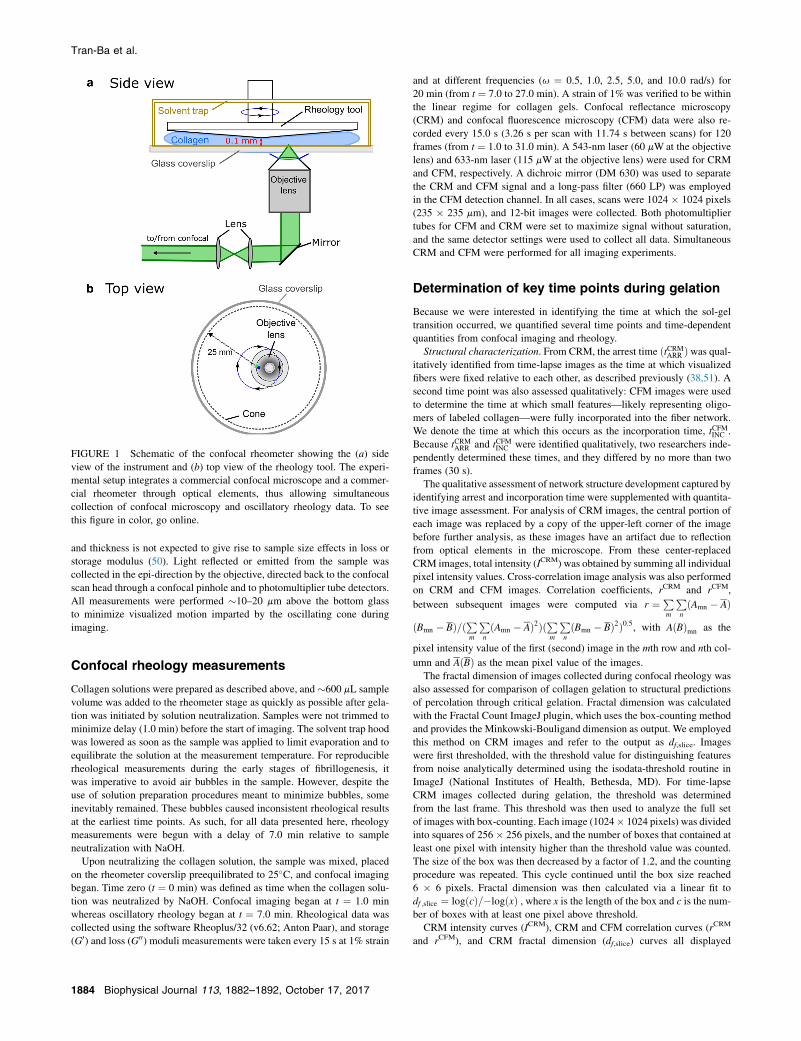
FIGURE 1 Schematic of the confocal rheometer showing the (a) side
view of the instrument and (b) top view of the rheology tool. The experi-
mental setup integrates a commercial confocal microscope and a commer-
cial rheometer through optical elements, thus allowing simultaneous
collection of confocal microscopy and oscillatory rheology data. To see
this figure in color, go online.
Tran-Ba et al.
and thickness is not expected to give rise to sample size effects in loss or
storage modulus (50). Light reflected or emitted from the sample was
collected in the epi-direction by the objective, directed back to the confocal
scan head through a confocal pinhole and to photomultiplier tube detectors.
All measurements were performed �10–20 mm above the bottom glass
to minimize visualized motion imparted by the oscillating cone during
imaging.
Confocal rheology measurements
Collagen solutions were prepared as described above, and �600 mL sample
volume was added to the rheometer stage as quickly as possible after gela-
tion was initiated by solution neutralization. Samples were not trimmed to
minimize delay (1.0 min) before the start of imaging. The solvent trap hood
was lowered as soon as the sample was applied to limit evaporation and to
equilibrate the solution at the measurement temperature. For reproducible
rheological measurements during the early stages of fibrillogenesis, it
was imperative to avoid air bubbles in the sample. However, despite the
use of solution preparation procedures meant to minimize bubbles, some
inevitably remained. These bubbles caused inconsistent rheological results
at the earliest time points. As such, for all data presented here, rheology
measurements were begun with a delay of 7.0 min relative to sample
neutralization with NaOH.
Upon neutralizing the collagen solution, the sample was mixed, placed
on the rheometer coverslip preequilibrated to 25�C, and confocal imaging
began. Time zero (t ¼ 0 min) was defined as time when the collagen solu-
tion was neutralized by NaOH. Confocal imaging began at t ¼ 1.0 min
whereas oscillatory rheology began at t ¼ 7.0 min. Rheological data was
collected using the software Rheoplus/32 (v6.62; Anton Paar), and storage
(G0) and loss (G00) moduli measurements were taken every 15 s at 1% strain
1884 Biophysical Journal 113, 1882–1892, October 17, 2017
and at different frequencies (u ¼ 0.5, 1.0, 2.5, 5.0, and 10.0 rad/s) for
20 min (from t ¼ 7.0 to 27.0 min). A strain of 1% was verified to be within
the linear regime for collagen gels. Confocal reflectance microscopy
(CRM) and confocal fluorescence microscopy (CFM) data were also re-
corded every 15.0 s (3.26 s per scan with 11.74 s between scans) for 120
frames (from t ¼ 1.0 to 31.0 min). A 543-nm laser (60 mWat the objective
lens) and 633-nm laser (115 mWat the objective lens) were used for CRM
and CFM, respectively. A dichroic mirror (DM 630) was used to separate
the CRM and CFM signal and a long-pass filter (660 LP) was employed
in the CFM detection channel. In all cases, scans were 1024 � 1024 pixels
(235 � 235 mm), and 12-bit images were collected. Both photomultiplier
tubes for CFM and CRM were set to maximize signal without saturation,
and the same detector settings were used to collect all data. Simultaneous
CRM and CFM were performed for all imaging experiments.
Determination of key time points during gelation
Because we were interested in identifying the time at which the sol-gel
transition occurred, we quantified several time points and time-dependent
quantities from confocal imaging and rheology.
Structural characterization. From CRM, the arrest time ðtCRMARR Þwas qual-itatively identified from time-lapse images as the time at which visualized
fibers were fixed relative to each other, as described previously (38,51). A
second time point was also assessed qualitatively: CFM images were used
to determine the time at which small features—likely representing oligo-
mers of labeled collagen—were fully incorporated into the fiber network.
We denote the time at which this occurs as the incorporation time, tCFMINC .
Because tCRMARR and tCFMINC were identified qualitatively, two researchers inde-
pendently determined these times, and they differed by no more than two
frames (30 s).
The qualitative assessment of network structure development captured by
identifying arrest and incorporation time were supplemented with quantita-
tive image assessment. For analysis of CRM images, the central portion of
each image was replaced by a copy of the upper-left corner of the image
before further analysis, as these images have an artifact due to reflection
from optical elements in the microscope. From these center-replaced
CRM images, total intensity (ICRM) was obtained by summing all individual
pixel intensity values. Cross-correlation image analysis was also performed
on CRM and CFM images. Correlation coefficients, rCRM and rCFM,
between subsequent images were computed via r ¼ P
m
P
nðAmn � AÞ
ðBmn � BÞ=ðPm
P
nðAmn � AÞ2ÞðP
m
P
nðBmn � BÞ2Þ0:5, with AðBÞmn as the
pixel intensity value of the first (second) image in the mth row and nth col-
umn and AðBÞ as the mean pixel value of the images.
The fractal dimension of images collected during confocal rheology was
also assessed for comparison of collagen gelation to structural predictions
of percolation through critical gelation. Fractal dimension was calculated
with the Fractal Count ImageJ plugin, which uses the box-counting method
and provides the Minkowski-Bouligand dimension as output. We employed
this method on CRM images and refer to the output as df,slice. Images
were first thresholded, with the threshold value for distinguishing features
from noise analytically determined using the isodata-threshold routine in
ImageJ (National Institutes of Health, Bethesda, MD). For time-lapse
CRM images collected during gelation, the threshold was determined
from the last frame. This threshold was then used to analyze the full set
of images with box-counting. Each image (1024� 1024 pixels) was divided
into squares of 256� 256 pixels, and the number of boxes that contained at
least one pixel with intensity higher than the threshold value was counted.
The size of the box was then decreased by a factor of 1.2, and the counting
procedure was repeated. This cycle continued until the box size reached
6 � 6 pixels. Fractal dimension was then calculated via a linear fit to
df ;slice ¼ logðcÞ=�logðxÞ , where x is the length of the box and c is the num-
ber of boxes with at least one pixel above threshold.
CRM intensity curves (ICRM), CRM and CFM correlation curves (rCRM
and rCFM), and CRM fractal dimension (df,slice) curves all displayed
Confocal Rheology of Collagen Gelation
sigmoidal shapes. The first derivative of the sigmoidal fit was used to
extract time points of interest, where 5, 50, and 95% of the final value
was present. We term these lag, inflection, and plateau times in accordance
with the sigmoidal shape and the nucleation and growth interpretation of
turbidity curves in collagen fibrillogenesis (12,15,51,52).
Rheological characterization. Oscillatory rheologywas used to determine
other key time points in the gelation process. The crossover time, tRHEOCO , was
defined as the time at which the storage and loss moduli crossed, which may
depend on the frequency atwhichoscillatory rheology is performed (53). The
crossover timewas determined by fitting straight lines to the threeG0 andG00
data points surrounding the time point at which G0 was first larger than G00.The gel point, tRHEOGEL , was determined within the critical gelation model
described previously (20,24,26,27,54). For percolation through critical gela-
tion, the gel point is a characteristic that, unlike the crossover time, does not
depend on applied frequency (53). Thus, tRHEOGEL was obtained by identifying
the time at which the slope, D, of the viscoelastic impedance spectra of
storage, G0(u), and loss moduli, G00(u), were the same, such that G0(u) fG00(u) f uD (54), as will be discussed further in Results.
RESULTS
Qualitative description of gelation probed byconfocal rheology
In advance of simultaneous confocal imaging and oscillatoryrheology measurements, control experiments on 1.0 mg/mLcollagen samples gelled at 25�C were performed to confirmthat the intrinsic collagen gelation characteristics werenot perturbed by confocal microscopy at low laser power,rheology at low strain, or sample confinement (as imposed
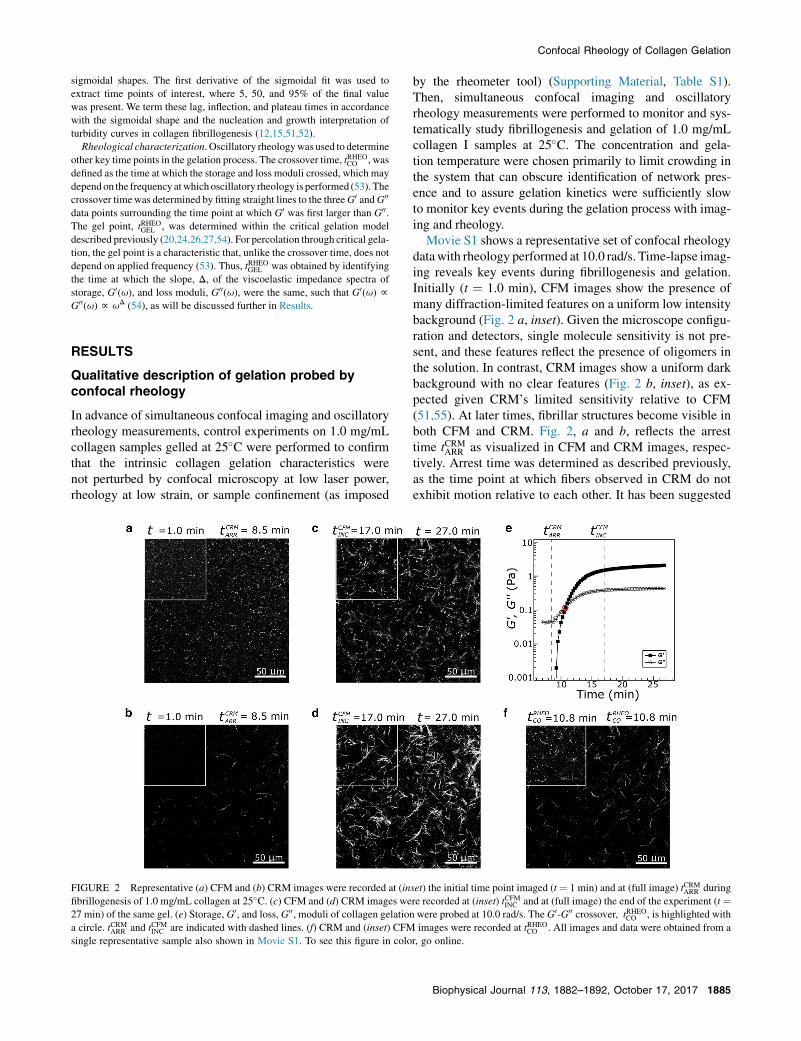
FIGURE 2 Representative (a) CFM and (b) CRM images were recorded at (in
fibrillogenesis of 1.0 mg/mL collagen at 25�C. (c) CFM and (d) CRM images we
27 min) of the same gel. (e) Storage, G0, and loss, G00, moduli of collagen gelation
a circle. tCRMARR and tCFMINC are indicated with dashed lines. (f) CRM and (inset) CFM
single representative sample also shown in Movie S1. To see this figure in colo
by the rheometer tool) (Supporting Material, Table S1).Then, simultaneous confocal imaging and oscillatoryrheology measurements were performed to monitor and sys-tematically study fibrillogenesis and gelation of 1.0 mg/mLcollagen I samples at 25�C. The concentration and gela-tion temperature were chosen primarily to limit crowding inthe system that can obscure identification of network pres-ence and to assure gelation kinetics were sufficiently slowto monitor key events during the gelation process with imag-ing and rheology.
Movie S1 shows a representative set of confocal rheologydatawith rheology performed at 10.0 rad/s. Time-lapse imag-ing reveals key events during fibrillogenesis and gelation.Initially (t ¼ 1.0 min), CFM images show the presence ofmany diffraction-limited features on a uniform low intensitybackground (Fig. 2 a, inset). Given the microscope configu-ration and detectors, single molecule sensitivity is not pre-sent, and these features reflect the presence of oligomers inthe solution. In contrast, CRM images show a uniform darkbackground with no clear features (Fig. 2 b, inset), as ex-pected given CRM’s limited sensitivity relative to CFM(51,55). At later times, fibrillar structures become visible inboth CFM and CRM. Fig. 2, a and b, reflects the arresttime tCRMARR as visualized in CFM and CRM images, respec-tively. Arrest time was determined as described previously,as the time point at which fibers observed in CRM do notexhibit motion relative to each other. It has been suggested
set) the initial time point imaged (t ¼ 1 min) and at (full image) tCRMARR during
re recorded at (inset) tCFMINC and at (full image) the end of the experiment (t ¼were probed at 10.0 rad/s. The G0-G00 crossover, tRHEOCO , is highlighted with
images were recorded at tRHEOCO . All images and data were obtained from a
r, go online.
Biophysical Journal 113, 1882–1892, October 17, 2017 1885

Tran-Ba et al.
that this represents the time at which the fibers form a system-spanning structure (38). After this time, additional fibrillarstructures become evident and they grow brighter in CRM,with CRM intensity reflecting increasing fiber width (51).In CFM, features also are seen to assemble into fibers onthe same timescale. Due to the photostability of ATTO647N, fluorescence images could be collected through theentirety of the gelation process, which had not been possiblewith FITC-labeled collagen used in a previous study (51).This allowed visualization of the time point shown inFig. 2 c (inset), where small features present in the initiallyvisualized solution are fully associated with fibers andexhibit no additional motion, tCFMINC . After this time, CRMimages continue to brighten to a certain extent (Fig. 2 d).Fig. 2, c and d, showsCFMandCRM images near the conclu-sion of the experiment, where a fully developed gel is presentand negligible further evolution of structure or mechanicalproperties occurs. The final collagen structure, despite beingformed on the rheometer and during oscillatory rheology,shows prototypical microstructure for a collagen gel formedat 25�C, with both single and bundled fibers. As in previousreports, the labeling of collagenmonomers with fluorophoressomewhat diminishes bundling that otherwise occurs in lowtemperature AS collagen gelation (39,51).
The simultaneously collected rheology is shown for therepresentative sample in Fig. 2 e. Initially (t ¼ 7.0 min), theloss modulus, G00, is very small (�0.05 Pa) and the storagemodulus, G0, is undetectable, consistent with the presenceof a Newtonian liquid. As gelation proceeds, G0 becomesdetectable and G0 and G00 increase, with G0 increasing faster
FIGURE 3 Time-course of average storage (G0, solid diamonds) and loss (G00,at 25�C. Rheology measurements were performed at five angular frequencies: (a)
frequency, 4–6 samples were interrogated and error bars represent SD of the m
1886 Biophysical Journal 113, 1882–1892, October 17, 2017
thanG00: this leads to a crossover point, tRHEOCO whereG00 ¼G0,as denoted in Fig. 2 e. The CRM and CFM images at thecrossover time are shown in Fig. 2 f and inset, respectively.
Comparison of rheological features to criticalgelation predictions
The crossover time, tRHEOCO , may be expected to be similar totCRMARR , as both have been associated with the sol-gel transitionand the existence of a sample-spanning network, but that wasnot found here. Instead, the crossover time was found to beconsistently later than arrest time, a finding echoing ourearlier results with nonsimultaneous imaging and rheology(38). Crossover time is expected to be frequency dependent:measurements probing viscoelasticity with high frequencyoscillatory rheology probe shorter timescales and shorterlength scales than low frequency measurements (56). Assuch, the sol-gel transition cannot be determined directlyfrom oscillatory rheology at a given frequency (53).
Given the potential frequency-dependence of the cross-over time and the possibility of identifying a frequency-inde-pendent gelation time through comparison to percolationtheory, additional imaging and rheology measurementswere performed at u ¼ 0.5, 2.5, and 10.0 rad/s. In all cases,gel structure and key time points of interest obtained fromimaging did not differ significantly as a function of oscilla-tory rheology frequency with or without accompanyingconfocal microscopy (SupportingMaterial, Table S2). Addi-tional measurements were taken without simultaneousimaging, and Fig. 3 shows the time-course of average storage
open squares) moduli recorded during fibrillogenesis of 1.0 mg/mL collagen
0.5 rad/s, (b) 1.0 rad/s, (c) 2.5 rad/s, (d) 5.0 rad/s, and (e) 10.0 rad/s. At each
easurements. To see this figure in color, go online.
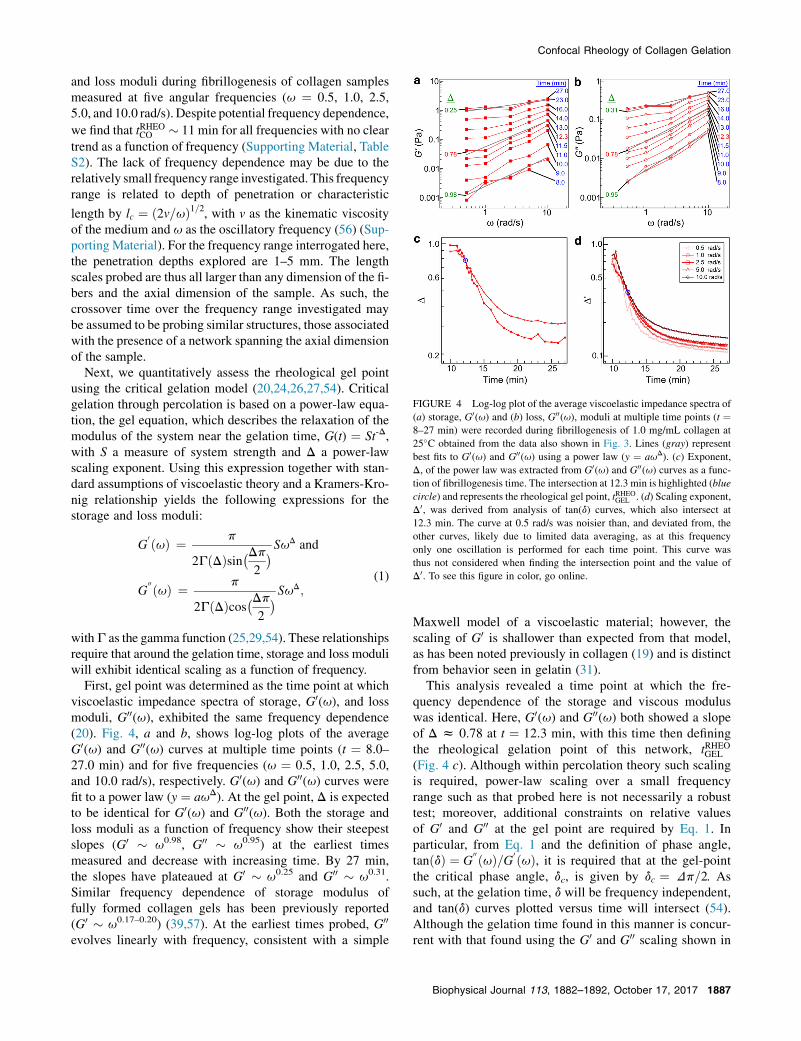
FIGURE 4 Log-log plot of the average viscoelastic impedance spectra of
(a) storage, G0(u) and (b) loss, G00(u), moduli at multiple time points (t ¼8–27 min) were recorded during fibrillogenesis of 1.0 mg/mL collagen at
25�C obtained from the data also shown in Fig. 3. Lines (gray) represent
best fits to G0(u) and G00(u) using a power law (y ¼ auD). (c) Exponent,
D, of the power law was extracted from G0(u) and G00(u) curves as a func-tion of fibrillogenesis time. The intersection at 12.3 min is highlighted (blue
circle) and represents the rheological gel point, tRHEOGEL . (d) Scaling exponent,
D0, was derived from analysis of tan(d) curves, which also intersect at
12.3 min. The curve at 0.5 rad/s was noisier than, and deviated from, the
other curves, likely due to limited data averaging, as at this frequency
only one oscillation is performed for each time point. This curve was
thus not considered when finding the intersection point and the value of
D0. To see this figure in color, go online.
Confocal Rheology of Collagen Gelation
and loss moduli during fibrillogenesis of collagen samplesmeasured at five angular frequencies (u ¼ 0.5, 1.0, 2.5,5.0, and 10.0 rad/s). Despite potential frequency dependence,
we find that tRHEOCO � 11 min for all frequencies with no cleartrend as a function of frequency (Supporting Material, TableS2). The lack of frequency dependence may be due to therelatively small frequency range investigated. This frequencyrange is related to depth of penetration or characteristic
length by lc ¼ ð2v=uÞ1=2, with v as the kinematic viscosityof the medium and u as the oscillatory frequency (56) (Sup-porting Material). For the frequency range interrogated here,the penetration depths explored are 1–5 mm. The lengthscales probed are thus all larger than any dimension of the fi-bers and the axial dimension of the sample. As such, thecrossover time over the frequency range investigated maybe assumed to be probing similar structures, those associatedwith the presence of a network spanning the axial dimensionof the sample.
Next, we quantitatively assess the rheological gel pointusing the critical gelation model (20,24,26,27,54). Criticalgelation through percolation is based on a power-law equa-tion, the gel equation, which describes the relaxation of themodulus of the system near the gelation time, G(t) ¼ St-D,with S a measure of system strength and D a power-lawscaling exponent. Using this expression together with stan-dard assumptions of viscoelastic theory and a Kramers-Kro-nig relationship yields the following expressions for thestorage and loss moduli:
G0 ðuÞ ¼ p
2GðDÞsin�Dp2
� SuD and
G00 ðuÞ ¼ p
2GðDÞcos�Dp2
� SuD;
(1)
withG as the gamma function (25,29,54). These relationshipsrequire that around the gelation time, storage and loss moduli
will exhibit identical scaling as a function of frequency.First, gel point was determined as the time point at whichviscoelastic impedance spectra of storage, G0(u), and lossmoduli, G00(u), exhibited the same frequency dependence(20). Fig. 4, a and b, shows log-log plots of the averageG0(u) and G00(u) curves at multiple time points (t ¼ 8.0–27.0 min) and for five frequencies (u ¼ 0.5, 1.0, 2.5, 5.0,and 10.0 rad/s), respectively. G0(u) and G00(u) curves werefit to a power law (y ¼ auD). At the gel point, D is expectedto be identical for G0(u) and G00(u). Both the storage andloss moduli as a function of frequency show their steepestslopes (G0 � u0.98, G00 � u0.95) at the earliest timesmeasured and decrease with increasing time. By 27 min,the slopes have plateaued at G0 � u0.25 and G00 � u0.31.Similar frequency dependence of storage modulus offully formed collagen gels has been previously reported(G0 � u0.17–0.20) (39,57). At the earliest times probed, G00
evolves linearly with frequency, consistent with a simple
Maxwell model of a viscoelastic material; however, thescaling of G0 is shallower than expected from that model,as has been noted previously in collagen (19) and is distinctfrom behavior seen in gelatin (31).
This analysis revealed a time point at which the fre-quency dependence of the storage and viscous moduluswas identical. Here, G0(u) and G00(u) both showed a slopeof D z 0.78 at t ¼ 12.3 min, with this time then definingthe rheological gelation point of this network, tRHEOGEL
(Fig. 4 c). Although within percolation theory such scalingis required, power-law scaling over a small frequencyrange such as that probed here is not necessarily a robusttest; moreover, additional constraints on relative valuesof G0 and G00 at the gel point are required by Eq. 1. Inparticular, from Eq. 1 and the definition of phase angle,tanðdÞ ¼ G
00 ðuÞ=G0 ðuÞ, it is required that at the gel-pointthe critical phase angle, dc, is given by dc ¼ Dp=2. Assuch, at the gelation time, d will be frequency independent,and tan(d) curves plotted versus time will intersect (54).Although the gelation time found in this manner is concur-rent with that found using the G0 and G00 scaling shown in
Biophysical Journal 113, 1882–1892, October 17, 2017 1887
Tran-Ba et al.
Fig. 4, a and c (t ¼ 12.3 min), the exponent (D0) isdifferent, with D0 ¼ 0.37 (Fig. 4 d).
Given that the scaling exponent may only range from 0 to1 and has typically been found to vary between 0.5 and0.8 in physical and chemical gels where percolation theoryholds (20,26,28–30,58,59), the values obtained from the twoapproaches are notably different. The discrepancy betweenthe two approaches requires that the prefactor ratio for G0
and G00 is inconsistent with Eq. 1. Because collagen gelationdynamics are highly sensitive to sample concentration andgelation temperature and because early time measurementsof the storage moduli were quite noisy, particularly forlow frequency measurements, we considered whether thediscrepancy between D and D0 could be related to these is-sues. However, neither including additional measurementsnor excluding measurements that diverged most from theaverage at early times changed the outcome: in all cases, po-wer-law scaling of storage and loss moduli yielded D> 0.70but the same exponent extracted from tan(dc) data wasnotably lower (<0.45).
Comparison of structural features to criticalgelation predictions
Given the inconsistency in identified scaling exponents(D versus D0) and the potential frequency dependence ofcrossover time, we cannot identify the sol-gel transitionunambiguously using rheology. However, we note thateach approach to determining gel point through rheologyleads to identification of time points in rather close vicinity,with tRHEOCO occurring at �11 min and tRHEOGEL at 12.3 min.Although tRHEOCO and tRHEOGEL occur in close vicinity, the arresttime identified through imaging tCRMARR is earlier (�9 min).The arrest time has previously been associated with the
1888 Biophysical Journal 113, 1882–1892, October 17, 2017
emergence of a system-spanning structure (38) and wouldthus be expected to occur concurrent with gelation asdefined rheologically. It is possible the visual identificationof this time point does point to a spanning structure; how-ever, it is also possible it instead represents an earlier eventin the gelation process, when fibers are sufficiently largesuch that their relative motion cannot be detected by eyebut a spanning structure is not yet present.
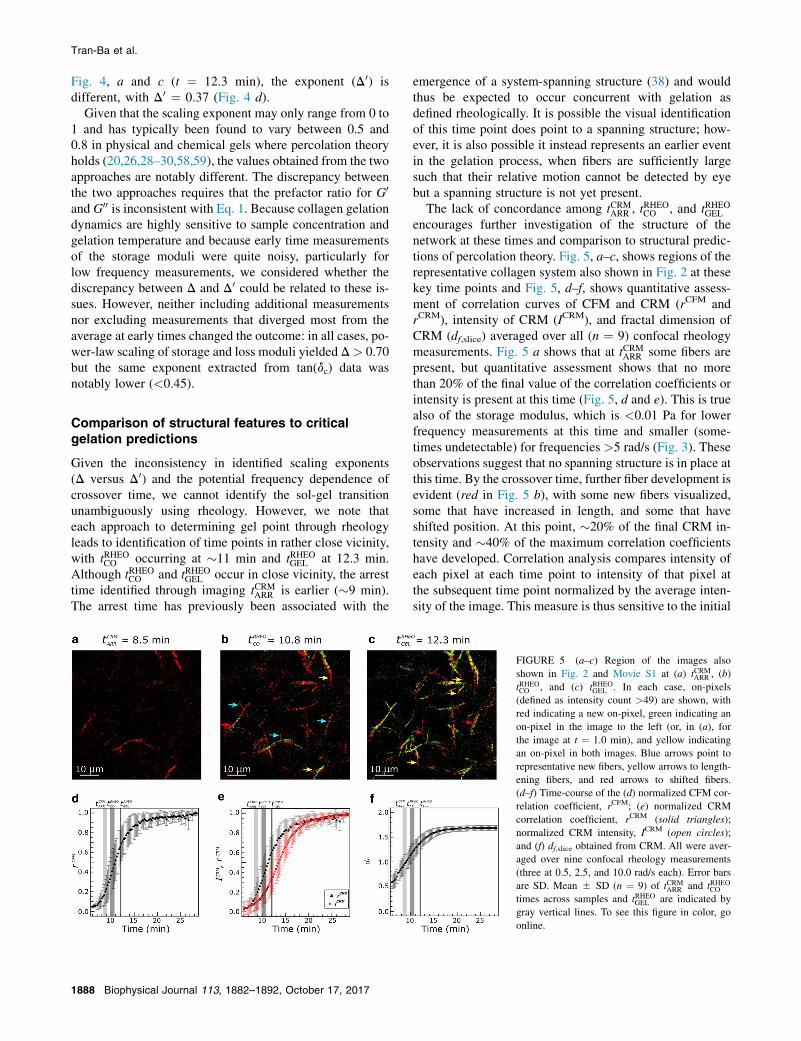
The lack of concordance among tCRMARR , tRHEOCO , and tRHEOGEL
encourages further investigation of the structure of thenetwork at these times and comparison to structural predic-tions of percolation theory. Fig. 5, a–c, shows regions of therepresentative collagen system also shown in Fig. 2 at thesekey time points and Fig. 5, d–f, shows quantitative assess-ment of correlation curves of CFM and CRM (rCFM andrCRM), intensity of CRM (ICRM), and fractal dimension ofCRM (df,slice) averaged over all (n ¼ 9) confocal rheologymeasurements. Fig. 5 a shows that at tCRMARR some fibers arepresent, but quantitative assessment shows that no morethan 20% of the final value of the correlation coefficients orintensity is present at this time (Fig. 5, d and e). This is truealso of the storage modulus, which is <0.01 Pa for lowerfrequency measurements at this time and smaller (some-times undetectable) for frequencies >5 rad/s (Fig. 3). Theseobservations suggest that no spanning structure is in place atthis time. By the crossover time, further fiber development isevident (red in Fig. 5 b), with some new fibers visualized,some that have increased in length, and some that haveshifted position. At this point, �20% of the final CRM in-tensity and �40% of the maximum correlation coefficientshave developed. Correlation analysis compares intensity ofeach pixel at each time point to intensity of that pixel atthe subsequent time point normalized by the average inten-sity of the image. This measure is thus sensitive to the initial
FIGURE 5 (a–c) Region of the images also
shown in Fig. 2 and Movie S1 at (a) tCRMARR , (b)
tRHEOCO , and (c) tRHEOGEL . In each case, on-pixels
(defined as intensity count >49) are shown, with
red indicating a new on-pixel, green indicating an
on-pixel in the image to the left (or, in (a), for
the image at t ¼ 1.0 min), and yellow indicating
an on-pixel in both images. Blue arrows point to
representative new fibers, yellow arrows to length-
ening fibers, and red arrows to shifted fibers.
(d–f) Time-course of the (d) normalized CFM cor-
relation coefficient, rCFM; (e) normalized CRM
correlation coefficient, rCRM (solid triangles);
normalized CRM intensity, ICRM (open circles);
and (f) df,slice obtained from CRM. All were aver-
aged over nine confocal rheology measurements
(three at 0.5, 2.5, and 10.0 rad/s each). Error bars
are SD. Mean 5 SD (n ¼ 9) of tCRMARR and tRHEOCO
times across samples and tRHEOGEL are indicated by
gray vertical lines. To see this figure in color, go
online.

Confocal Rheology of Collagen Gelation
appearance of structures as well as to changes in the positionof structures. It will not be sensitive to changes in intensitythat affect the full field of view, such as the increase in CRMsignal due to fiber thickening. This is consistent with thefaster rise of the correlation coefficients, rCRM and rCFM,relative to ICRM, as well as the similarity of tCFMINC and theplateau times of rCRM and rCFM (Table 1). At tRHEOGEL , fewnew fibers are seen relative to the gel at the crossovertime, but the fibers are both longer and brighter thanthose at crossover, with fiber thickening continuing until�20 min, the plateau time associated with ICRM (Table 1).
The multimodal measurements here also allow compari-son to structural predictions of percolation theory in andaround the gel point. In particular, classical percolation the-ory predicts the critical gel will have a 3D fractal dimension,df,3D, of 2.5 at the gel point (32,37). Extensions of thistheory have led to the prediction
df ;3D ¼ 5
2ð2D� 3Þ=ðD� 3Þ; (2)
for critical gels in 3D (28,60). The box-counting method of
determining fractal dimension on 2D confocal reflectanceimages returns the df,slice evolution shown in Fig. 5 f. Attime points before tCRMARR , no or very few features are present,and df,slice assessment returns an unphysical result<1. How-
ever, starting at approximately tCRMARR , df,slice grows from�1.0to 1.7 by �16 min. We interpret these changes as due to theappearance of fibers and their growth in length. The value ofdf,slice increases rapidly across the time regime associatedwith the sol-gel transition as identified through imaging
(tCRMARR �9 min) and rheology (tRHEOCO �11 min and
tRHEOGEL ¼ 12.3 min). This continuing evolution suggests
that the incipient network associated with the transitionevolves rapidly until at least the rheological identificationof gelation, with df,slice with values of 1.0, 1.26, and 1.44,respectively, at these three time points. As for correlationcoefficients and distinct from CRM intensity growth curves,we expect little change in fractal dimension during fiber
TABLE 1 Key Time Points Associated with Collagen Gelation
Average Time (min 5 SD)
tLAG tCRMARR tRHEOCO
rCFM 6.3 5 0.6 — —
rCRM 6.3 5 1.2 8.7 5 0.6b —
ICRM 7.5 5 1.1 — —
df,slice 2.0 5 1.1 — —
GRHEO — — 10.6 5 1.1
Mean 5 SD of nine samples monitored with confocal rheology during fibrillog
indicated in the leftmost column unless otherwise noted, with rCFM and rCRM a
curve, df,slice as the CRM fractal dimension, and GRHEO as the rheological storage
time points at which the curves rise to 5, 50, and 95% of their final value, respec
frequency dependent rheology. The p values obtained from two-tailed, unequal
Material and Table S4.atCFMINC is the time at which oligomeric structures are fully incorporated into fibrbtCRMARR is the time at which fibrillar structures are apparently fixed in position an
thickening, explaining the similar plateau times for correla-tion coefficients and df,slice evolution (Table 1).
From Eq. 2, the expected fractal dimension of the collagennetworks at the gel point assuming the scaling exponentfound from the approach depicted in Fig. 4, a–c (D ¼0.78), is df,3D¼ 1.6 whereas that obtained from the approachdepicted in Fig. 4 d (D¼ 0.37) is df,3D¼ 2.1. Although thereis a known relationship between df,3D and df,slice for theHausdorff dimension, an alternative approach to describingfractal objects that is computationally challenging tocalculate, there is no such established relationship for theMinkowski-Bouligand dimension (61,62). As such, onecannot immediately compare the fractal dimension obtainedthrough 2D confocal imaging to those predicted from perco-lation theory. Although the rapidity of gelation does notallow 3D stacks to be collected during the process, weanalyzed 2D slices and 3D reconstructions from fully formedgels to find typical relationships between df,3D and df,slice inthese systems (Supporting Material). We note that previousstudies have shown correlation between df,3D and df,slice di-mensions, with df,3D typically 0.7–1.0 higher than df,slice,with the upper limit recalling the relationship between Haus-dorff dimension as obtained from 2D and 3D information(61–63). Our own analysis suggests df,3D ¼ df,slice þ 0.9(Supporting Material; Fig. S1; Table S3). As such, weconclude that df,3D of the gel at tRHEOGEL is �2.3. This is wellover the value predicted from percolation theory (df,3D ¼1.6) using Eq. 2 and the scaling exponent obtained from fre-quency dependence of the moduli as well as greater than thatfrom the scaling exponent obtained from the convergence oftan(dc). This finding further emphasizes the inconsistencybetween predictions of percolation theory through criticalgelation and measurements of collagen self-assembly.
DISCUSSION
Themultimodal measurements performed here reveal incon-sistency between collagen self-assembly and the rheological
tINF tRHEOGEL tCFMINC tPL
11.2 5 1.1 — 17.1 5 1.7a 16.1 5 2.2
11.5 5 1.1 — — 16.8 5 2.0
13.1 5 1.2 — — 19.7 5 1.4
8.9 5 1.1 — — 15.6 5 1.5
— 12.3 — —
enesis of 1.0 mg/mL collagen at 25�C. All data were obtained from curves
s the CFM and CRM image correlation curves, ICRM as the CRM intensity
modulus curve. tLAG, tINF, and tPL correspond to lag, inflection, and plateau
tively. tRHEOCO is the crossover time and tRHEOGEL is the gel point extracted from
variance t-tests comparing all time points are provided in the Supporting
illar structures and was extracted from CFM video data.
d was extracted from CRM video data.
Biophysical Journal 113, 1882–1892, October 17, 2017 1889
Tran-Ba et al.
and structural predictions of critical gelation through perco-lation, and we conclude that the sol-gel transition of collagenat the relatively low concentration of 1.0 mg/mL and rela-tively low temperature of 25�C does not proceed throughcritical gelation as described previously (20,24,26,27,54).This finding is in contrast to some previous rheology-basedmeasurements that showed consistency with percolation the-ory for collagen gels (19,64). In particular, Forgacs et al. (19)found that a 1.7 mg/mL collagen gel formed at 12�C andprobed rheologically between�0.2 and 7.0 rad/s in a mannersimilar to that used in this study was consistent with percola-tion theory and yielded D ¼ 0.70. Curtis et al. (64) studiedcollagen gelation through optimal Fourier rheometry, whichuses chirped waveforms to probe multiple rheological fre-quencies simultaneously and is suitable for systems withhigh strain sensitivity. Using this approach and probing fre-quencies of �6.0–60.0 rad/s, Curtis et al. (64) found thatcollagen gels prepared at 28�C exhibited consistency withpercolation theory and concentration-dependent scaling ex-ponents, with D � 0.82 for a 4 mg/mL gel and D � 0.62for an 8 mg/mL gel. We propose that discrepancy betweenour finding and the studies cited above can be attributed tothe fact that gelation at the concentration and temperatureexplored in this study leads to thick fiber, large pore size, het-erogeneous hydrogels compared to AS collagen gelation athigher temperatures, and/or concentrations (39,65). Theconditions used in this study were chosen to facilitateidentification of the time at which a system-spanning struc-ture was first present, a challenge in higher concentra-tion systems and/or those gelled at higher temperature.Higher-concentration, higher-gelation temperature collagengels are more homogeneous and have smaller pore size,structural characteristics more similar to those present inchemical gels where percolation theory has been more regu-larly and successfully applied. Indeed, complex networks—in particular physical and/or thermoreversible gels—havebeen found to show less consistency with critical gelationtheory than chemically cross-linked gels. In one case,rheology was used to study the gelation of the bacterial poly-ester poly(b-hydroxyoctanoate). The systemwas found to gothrough the sol-gel transition in amanner consistentwith crit-ical gelation at some temperatures, but at others it apparentlywent through the sol-gel transition without passing through astage with the self-similar structure of a critical gel (66). Theauthors proposed that at these temperatures slow nucleationled to long-range heterogeneity that in turn led to failure topass through a critical gel, a situation highly analogous tothe low-concentration, low-temperature collagen gelationstudied here.
Beyond differences in concentration and gelation temper-ature between this and previous studies, a key difference inthis study is the multimodal approach that allowed simulta-neous assessment of mechanical properties and networkstructure during gelation, providing additional measureswith which to compare the gelation process to predictions
1890 Biophysical Journal 113, 1882–1892, October 17, 2017
of critical gelation theory. In addition to finding collagengelation is inconsistent with predictions of percolationtheory that can be tested through rheology, simultaneousimaging provides additional evidence that collagen gelationis inconsistent with percolation through a critical gel. Inparticular, we find higher than expected fractal dimensionfor networks over the time regime when a network spanningstructure is first present relative to that predicted by perco-lation theory extended to be applicable to polymeric gela-tion. Indeed, we find values for fractal dimension in thistime range more similar to those predicted by classic perco-lation theory (df,3D ¼ 2.5). Perhaps to describe collagengelation the simpler picture of classic percolation with aset of rigid rods is more appropriate than theory developedfor flexible chains with flexible bonds, as also reflected byrecent modeling of the origin of strain stiffening in collagengels (44,46).
CONCLUSIONS
In this study, we used simultaneous CRM, CFM, andrheology to probe the structural and mechanical evolutionof collagen I through the sol-gel transition. Direct compar-ison of data recorded by microscopy and rheology allowsevolving structure on the fiber and network length scalesto be correlated with evolving viscoelastic properties.Such measurements provide a detailed picture of the devel-oping gel structurally: after neutralization, numerous fibersform and grow rapidly in length, with fiber lengtheningand thickening occurring concurrently and fiber thickeningcontinuing through the end of the gelation process. Theconfocal rheometer measurements also allow careful com-parison to rheological and structural predictions of criticalgelation theory. Rheology suggested the presence of a span-ning structure for the 1.0 mg/mL collagen gels assembled at25�C studied here at 12.3 min, with storage and loss moduliboth displaying power-law scaling with a scaling exponentof D ¼ 0.78 at that time; however, the ratio of the moduliat that time suggested a much lower value of the scalingexponent. This inconsistency with percolation theory wasreinforced by the finding that the fractal dimension washigher than that predicted by the theory at this time point.Despite notable differences between our findings and pre-dictions of percolation theory, aspects of the sol-gel transi-tion described by percolation theory appear relevant forthe collagen gelation process: for example, relatively earlyin gelation, a system-spanning structure exists that acts asa template for additional growth, through lengthening andthickening of fibers rather than through new fiber forma-tion. The dual rheological and structural measurements per-formed here served as a critical test-bed for percolationtheory in the case of collagen gelation. More broadly,this study demonstrates the utility of confocal rheologyfor quantitative characterization of evolving viscoelasticand structural properties of complex systems, measurements

Confocal Rheology of Collagen Gelation
that can address fundamental questions and suggest paths tocontrolling properties of self-assembling systems.
SUPPORTING MATERIAL
Supporting Materials and Methods, one figure, four tables, and one
movie are available at http://www.biophysj.org/biophysj/supplemental/
S0006-3495(17)30918-9.
AUTHOR CONTRIBUTIONS
K.-H.T.-B., J.Z., and L.J.K. designed the project. K.-H.T.-B. and J.Z.
collected data. K.-H.T.-B., D.J.L., J.Z., and L.J.K. contributed analytical
tools. K.-H.T.-B., D.J.L., and L.J.K. analyzed data. K.P. designed and tested
the confocal rheometer. K.-H.T.-B. and L.J.K. wrote the manuscript.
ACKNOWLEDGMENTS
The authors thank Prof. Angelo Cacciuto, Dr. Jaesung Yang, Dr. Dat Tien
Hoang, and Dr. Joseph Harder for helpful discussions.
This work was supported by the National Science Foundation (NSF) via a
Graduate Research Fellowship for J. Z. and by the National Science Foun-
dation (NSF) and the National Institutes of Health (NIH) under grant award
PESO 1227297.
REFERENCES
1. Alberts, B. 2008. Molecular Biology of the Cell. Garland Science, NewYork, NY.
2. Rozario, T., and D. W. DeSimone. 2010. The extracellular matrixin development and morphogenesis: a dynamic view. Dev. Biol.341:126–140.
3. Mouw, J. K., G. Ou, and V. M. Weaver. 2014. Extracellular matrixassembly: a multiscale deconstruction. Nat. Rev. Mol. Cell Biol.15:771–785.
4. Glowacki, J., and S. Mizuno. 2008. Collagen scaffolds for tissue engi-neering. Biopolymers. 89:338–344.
5. Cen, L., W. Liu, ., Y. Cao. 2008. Collagen tissue engineering:development of novel biomaterials and applications. Pediatr. Res.63:492–496.
6. Friedl, P., and E. B. Brocker. 2000. The biology of cell locomo-tion within three-dimensional extracellular matrix. Cell. Mol. LifeSci. 57:41–64.
7. Wolf, K., M. Te Lindert, ., P. Friedl. 2013. Physical limits of cellmigration: control by ECM space and nuclear deformation and tuningby proteolysis and traction force. J. Cell Biol. 201:1069–1084.
8. Lee, C. H., A. Singla, and Y. Lee. 2001. Biomedical applications ofcollagen. Int. J. Pharm. 221:1–22.
9. Miron-Mendoza,M., J. Seemann, and F. Grinnell. 2010. The differentialregulation of cell motile activity throughmatrix stiffness and porosity inthree-dimensional collagen matrices. Biomaterials. 31:6425–6435.
10. Doyle, A. D., and K. M. Yamada. 2016. Mechanosensing via cell-ma-trix adhesions in 3D microenvironments. Exp. Cell Res. 343:60–66.
11. Wells, R. G. 2008. The role of matrix stiffness in regulating cellbehavior. Hepatology. 47:1394–1400.
12. Yang, Y. L., S. Motte, and L. J. Kaufman. 2010. Pore size variable typeI collagen gels and their interaction with glioma cells. Biomaterials.31:5678–5688.
13. Guzman, A., M. J. Ziperstein, and L. J. Kaufman. 2014. The effect offibrillar matrix architecture on tumor cell invasion of physically chal-lenging environments. Biomaterials. 35:6954–6963.
14. Wood, G. C., and M. K. Keech. 1960. The formation of fibrils fromcollagen solutions. 1. The effect of experimental conditions: kineticand electron-microscope studies. Biochem. J. 75:588–598.
15. Wood, G. C. 1960. The formation of fibrils from collagen solutions. 2.A mechanism of collagen-fibril formation. Biochem. J. 75:598–605.
16. Comper, W. D., and A. Veis. 1977. Characterization of nuclei in in vitrocollagen fibril formation. Biopolymers. 16:2133–2142.
17. Comper, W. D., and A. Veis. 1977. The mechanism of nucleation forin vitro collagen fibril formation. Biopolymers. 16:2113–2131.
18. Broedersz, C. P., X. Mao, ., F. C. MacKintosh. 2011. Criticality andisostaticity in fibre networks. Nat. Phys. 7:983–988.
19. Forgacs, G., S. A. Newman, ., E. Sackmann. 2003. Assembly ofcollagen matrices as a phase transition revealed by structural and rheo-logic studies. Biophys. J. 84:1272–1280.
20. Sahimi, M. 1994. Applications of Percolation Theory. Taylor & Fran-cis, Boca Raton, FL.
21. Das, M., D. A. Quint, and J. M. Schwarz. 2012. Redundancy and coop-erativity in the mechanics of compositely crosslinked filamentousnetworks. PLoS One. 7:e35939.
22. Thorpe, M. F., D. J. Jacobs, and B. R. Djordjevic. 1996. Generic rigid-ity percolation. In Condensed Matter Theories. Nova Science, NewYork, NY, pp. 407–424.
23. Picu, R. C. 2011. Mechanics of random fiber networks: a review. SoftMatter. 7:6768–6785.
24. Winter, H. H. 2002. The critical gel. In Structure and Dynamics ofPolymer and Colloidal Systems, Vol. 568. NATO Science Series.R. Borsali and R. Pecora, eds. Springer, Dordrecht, the Netherlands,pp. 439–470.
25. Chambon, F., and H. H. Winter. 1987. Linear viscoelasticity at the gelpoint of a crosslinking PDMS with imbalanced stoichiometry. J. Rheol.31:683–697.
26. Winter, H. H., and F. Chambon. 1986. Analysis of linear viscoelasticityof a crosslinking polymer at the gel point. J. Rheol. 30:367–382.
27. Winter, H. H. 1987. Evolution of rheology during chemical gelation.Prog. Colloid Polym. Sci. 75:104–110.
28. Scanlan, J. C., and H. H. Winter. 1991. The evolution of viscoelasticitynear the gel point of end-linking poly(dimethylsiloxane)s. Makromol.Chem. Macromol. Symp. 45:11–21.
29. te Nijenhuis, K. 1997. Thermoreversible networks. Adv. Polym. Sci.130:1–235.
30. Yu, J. M., P. Dubois, ., G. L. Homme. 1996. Triblock copolymerbased thermoreversible gels. 2. Analysis of the sol-gel transition.Macromolecules. 29:5384–5391.
31. Djabourov, M., J. Leblond, and P. Papon. 1988. Gelation of aqueousgelatin solutions. II. Rheology of the sol-gel transition. J. Phys.49:333–343.
32. Muthukumar, M., and H. H. Winter. 1986. Fractal dimension of a cross-linking polymer at the gel point. Macromolecules. 19:1284–1285.
33. Cates, M. E. 1985. Brownian dynamics of self-similar macromole-cules. J. Physique. 46:1059–1077.
34. de Gennes, P.-G. 1979. Scaling Concepts in Polymer Physics. CornellUniversity Press, Ithaca, NY.
35. Stockmayer, W. H. 1943. Theory of molecular size distribution and gelformation in branched chain polymers. J. Chem. Phys. 11:45–55.
36. Flory, P. J. 1941. Molecular size distribution in three-dimensional poly-mers. I. Gelation. J. Am. Chem. Soc. 63:3083–3090.
37. Stauffer, D., A. Coniglio, and M. Adam. 1982. Gelation and criticalphenomena. Adv. Polym. Sci. 44:103–158.
38. Yang, Y. L., and L. J. Kaufman. 2009. Rheology and confocal reflec-tance microscopy as probes of mechanical properties and structureduring collagen and collagen/hyaluronan self-assembly. Biophys. J.96:1566–1585.
Biophysical Journal 113, 1882–1892, October 17, 2017 1891
Tran-Ba et al.
39. Yang, Y. L., L. M. Leone, and L. J. Kaufman. 2009. Elastic moduli ofcollagen gels can be predicted from two-dimensional confocal micro-scopy. Biophys. J. 97:2051–2060.
40. Morse, D. C. 1998. Viscoelasticity of concentrated isotropic solutionsof semiflexible polymers. 1. Model and stress tensor. Macromolecules.31:7030–7043.
41. Raub, C. B., J. Unruh,., S. C. George. 2008. Image correlation spec-troscopy of multiphoton images correlates with collagen mechanicalproperties. Biophys. J. 94:2361–2373.
42. Morse, D. C. 1998. Viscoelasticity of concentrated isotropic solu-tions of semiflexible polymers. 2. Linear response. Macromolecules.31:7044–7067.
43. MacKintosh, F. C., J. K€as, and P. A. Janmey. 1995. Elasticity of semi-flexible biopolymer networks. Phys. Rev. Lett. 75:4425–4428.
44. Licup, A. J., S. M€unster, ., F. C. MacKintosh. 2015. Stress controlsthe mechanics of collagen networks. Proc. Natl. Acad. Sci. USA.112:9573–9578.
45. Sharma, A., A. J. Licup,., F. C. MacKintosh. 2016. Strain-controlledcriticality governs the nonlinear mechanics of fibre networks. Nat.Phys. 12:584–587.
46. Stein, A. M., D. A. Vader,., L. M. Sander. 2011. The micromechanicsof three-dimensional collagen-I gels. Complexity. 16:22–28.
47. Kalia, J., and R. T. Raines. 2010. Advances in bioconjugation. Curr.Org. Chem. 14:138–147.
48. Stephanopoulos, N., and M. B. Francis. 2011. Choosing an effectiveprotein bioconjugation strategy. Nat. Chem. Biol. 7:876–884.
49. Besseling, R., L. Isa,., W. C. K. Poon. 2009. Quantitative imaging ofcolloidal flows. Adv. Colloid Interface Sci. 146:1–17.
50. Arevalo, R. C., J. S. Urbach, and D. L. Blair. 2010. Size-dependentrheology of type-I collagen networks. Biophys. J. 99:L65–L67.
51. Zhu, J., and L. J. Kaufman. 2014. Collagen I self-assembly: revealingthe developing structures that generate turbidity. Biophys. J. 106:1822–1831.
52. Brightman, A. O., B. P. Rajwa, ., S. L. Voytik-Harbin. 2000. Time-lapse confocal reflection microscopy of collagen fibrillogenesis andextracellular matrix assembly in vitro. Biopolymers. 54:222–234.
53. Winter, H. H. 1987. Can the gel point of a cross-linking polymer bedetected by the G0-G00 crossover. Polym. Eng. Sci. 27:1698–1702.
1892 Biophysical Journal 113, 1882–1892, October 17, 2017
54. Goodwin, J., and R. Hughes. 2008. Rheology for Chemists. RoyalSociety of Chemistry, Cambridge, United Kingdom.
55. Jawerth, L. M., S. M€unster, ., D. A. Weitz. 2010. A blind spot inconfocal reflection microscopy: the dependence of fiber brightnesson fiber orientation in imaging biopolymer networks. Biophys. J.98:L1–L3.
56. Landau, L. D., and E. M. Lifschitz. 1987. Fluid Mechanics, 2nd Ed.Butterworth-Heinemann, Oxford, United Kingdom.
57. Knapp, D. M. 1997. Rheology of reconstituted type I collagen gel inconfined compression. J. Rheol. 41:971–993.
58. Nijenhuis, K. T., and H. H. Winter. 1989. Mechanical properties at thegel point of a crystallizing poly(vinyl-chloride) solution. Macromole-cules. 22:411–414.
59. Durand, D., M. Delsanti,., J. M. Luck. 1987. Frequency-dependenceof viscoelastic properties of branched polymers near gelation threshold.Europhys. Lett. 3:297–301.
60. Hess, W., T. A. Vilgis, and H. H. Winter. 1988. Dynamical criticalbehavior during chemical gelation and vulcanization.Macromolecules.21:2536–2542.
61. Liao, J. Y. H., C. Selomulya, ., R. Amal. 2005. On different ap-proaches to estimate the mass fractal dimension of coal aggregates.Part. Part. Syst. Charact. 22:299–309.
62. Akkari, H., I. Bhouri,., M. H. Bedoui. 2008. On the relations between2D and 3D fractal dimensions: theoretical approach and clinical appli-cation in bone imaging. Math. Model. Nat. Phenom. 3:48–75.
63. Thill, A., S. Veerapaneni,., D. Snidaro. 1998. Determination of struc-ture of aggregates by confocal scanning laser microscopy. J. ColloidInterface Sci. 204:357–362.
64. Curtis, D. J., A. Holder, ., K. Hawkins. 2015. Validation of optimalFourier rheometry for rapidly gelling materials and its application inthe study of collagen gelation. J. Non-Newt. Fluid Mech. 222:253–259.
65. Raub, C. B., V. Suresh,., S. C. George. 2007. Noninvasive assessmentof collagen gel microstructure and mechanics using multiphoton mi-croscopy. Biophys. J. 92:2212–2222.
66. Richtering, H. W., K. D. Gagnon, ., H. H. Winter. 1992. Physicalgelation of a bacterial thermoplastic elastomer. Macromolecules.25:2429–2433.