confidence intervals - forum annuel du gdr vision - 2016 · jean-michel hupé cerco, université de...
TRANSCRIPT

Jean-Michel Hupé
CerCo, Université de Toulouse Paul Sabatier & CNRS
Preparation to the Statistics Workshop of the GDR Vision
October 2016
Confidence Intervals
Statistics in experimental science
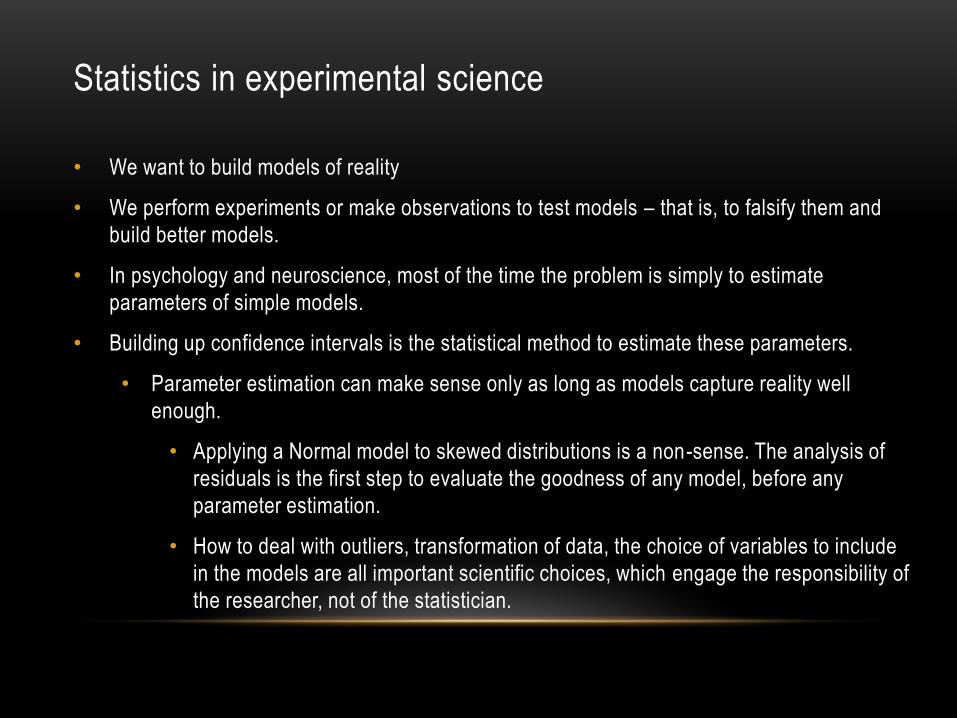
• We want to build models of reality
• We perform experiments or make observations to test models – that is, to falsify them and
build better models.
• In psychology and neuroscience, most of the time the problem is simply to estimate
parameters of simple models.
• Building up confidence intervals is the statistical method to estimate these parameters.
• Parameter estimation can make sense only as long as models capture reality well
enough.
• Applying a Normal model to skewed distributions is a non-sense. The analysis of
residuals is the first step to evaluate the goodness of any model, before any
parameter estimation.
• How to deal with outliers, transformation of data, the choice of variables to include
in the models are all important scientific choices, which engage the responsibility of
the researcher, not of the statistician.

Statistics in experimental science
• We need statistics because our models and our measures are not precise enough. In
particular, we can’t control all the parameters.
• This lack of precision introduces randomness in measurements.
• Statistic tools help us to evaluate the strength of our models in face of randomness.
• The parameters we want to estimate are called “population” values or “statistics”. A statistic
can be
• a mean
• a percentage
• a correlation
• a slope
• …
Inferences based on sampling theory
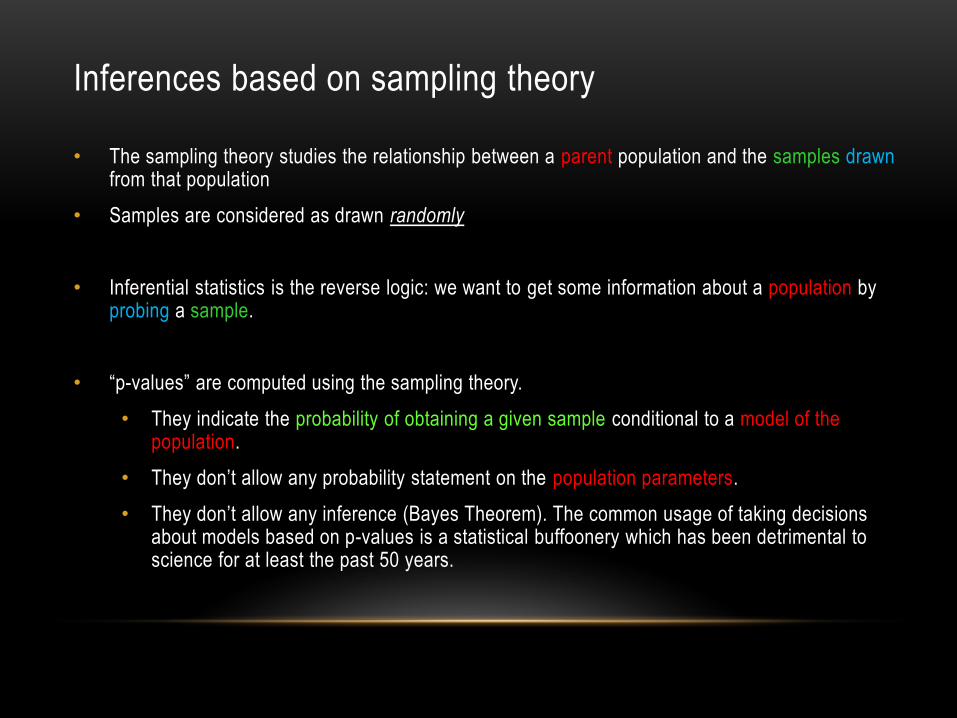
• The sampling theory studies the relationship between a parent population and the samples drawn from that population
• Samples are considered as drawn randomly
• Inferential statistics is the reverse logic: we want to get some information about a population by probing a sample.
• “p-values” are computed using the sampling theory.
• They indicate the probability of obtaining a given sample conditional to a model of the population.
• They don’t allow any probability statement on the population parameters.
• They don’t allow any inference (Bayes Theorem). The common usage of taking decisions about models based on p-values is a statistical buffoonery which has been detrimental to science for at least the past 50 years.
Inferences based on sampling theory
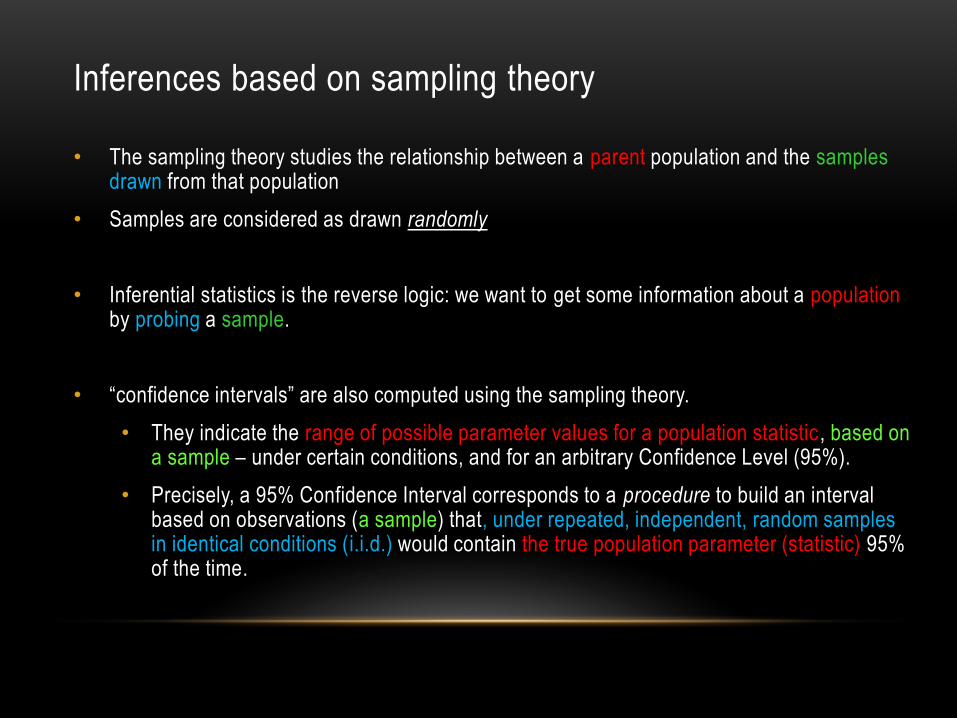
• The sampling theory studies the relationship between a parent population and the samples drawn from that population
• Samples are considered as drawn randomly
• Inferential statistics is the reverse logic: we want to get some information about a populationby probing a sample.
• “confidence intervals” are also computed using the sampling theory.
• They indicate the range of possible parameter values for a population statistic, based on a sample – under certain conditions, and for an arbitrary Confidence Level (95%).
• Precisely, a 95% Confidence Interval corresponds to a procedure to build an interval based on observations (a sample) that, under repeated, independent, random samples in identical conditions (i.i.d.) would contain the true population parameter (statistic) 95% of the time.
Inferences based on sampling theory
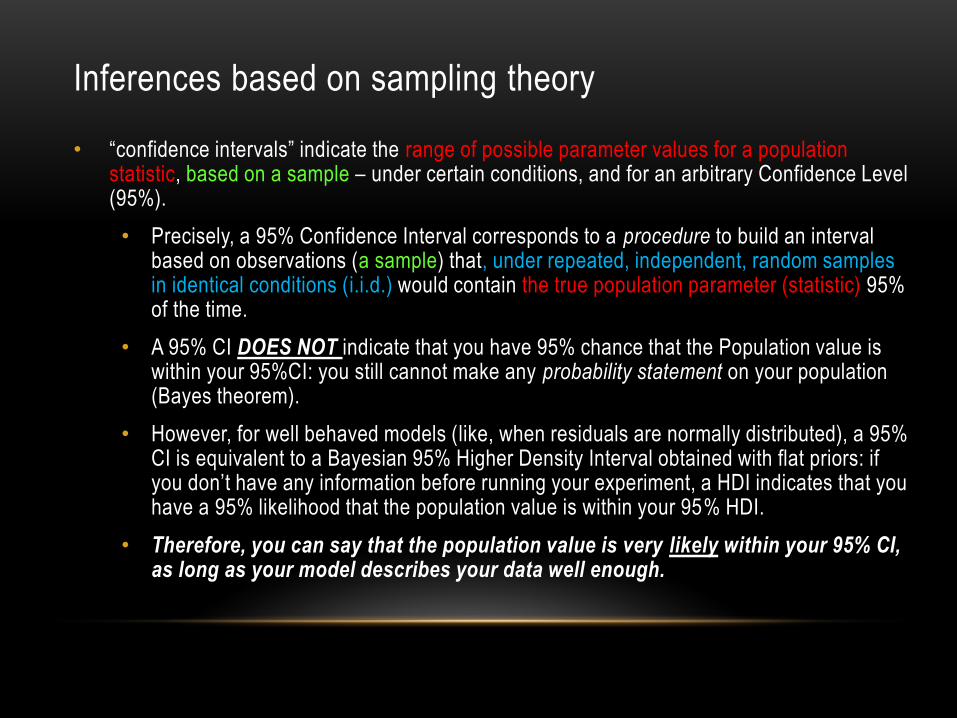
• “confidence intervals” indicate the range of possible parameter values for a population statistic, based on a sample – under certain conditions, and for an arbitrary Confidence Level (95%).
• Precisely, a 95% Confidence Interval corresponds to a procedure to build an interval based on observations (a sample) that, under repeated, independent, random samples in identical conditions (i.i.d.) would contain the true population parameter (statistic) 95% of the time.
• A 95% CI DOES NOT indicate that you have 95% chance that the Population value is within your 95%CI: you still cannot make any probability statement on your population (Bayes theorem).
• However, for well behaved models (like, when residuals are normally distributed), a 95% CI is equivalent to a Bayesian 95% Higher Density Interval obtained with flat priors: if you don’t have any information before running your experiment, a HDI indicates that you have a 95% likelihood that the population value is within your 95% HDI.
• Therefore, you can say that the population value is very likely within your 95% CI, as long as your model describes your data well enough.

Sampling theoryPopulation Ω: (N, m, σ)
N individuals, each individual has a characteristic xi
Mean 𝑚 =1
𝑁 𝑖=1𝑁 𝑥𝑖
Standard deviation 𝜎 =1
𝑁 𝑖=1𝑁 𝑥𝑖 −𝑚
2
Samples (n, 𝑥, 𝜎′) of size n
𝑥1, 𝜎′1 mean and standard deviation of characteristic xi in sample 1
𝑥2, 𝜎′2 mean and standard deviation of characteristic xi in sample 2
…
Sampling distribution 𝑋(μ𝑋
, σ𝑋)
𝑥1, 𝑥2, … constitute a sampling distribution of means
The sampling theory studies the relationship between a parent population and the samples drawn
from that population
Samples are considered as drawn randomly

Sampling theoryIf each individual is drawn randomly, X is a random variable
The law of X is uniform X(Ω) = { X1, …, XN}
p(X = Xs) = 1/N
E(X) = m
V(X) = σ2
𝑥1, 𝑥2, … means of characteristic xi in each sample can be interpreted as realizations of a random
variable 𝑋 with E(𝑋) = μ𝑋
(𝑋 sampling distribution of means)
𝑥, 𝜎′ in a sample are random variables
Theorem: the random variable 𝑥 is defined by its
mean E(𝑥) = m = μ𝑋
standard deviation S(𝑥) =𝜎
𝑛= σ
𝑋
For non-exhaustive draws with replacements
Central Limit Theorem: for n > 30, the law of 𝑋 is asymptotically normal 𝑁(μ𝑋, σ
𝑋) = 𝑁(m ,
𝜎
𝑛)
m
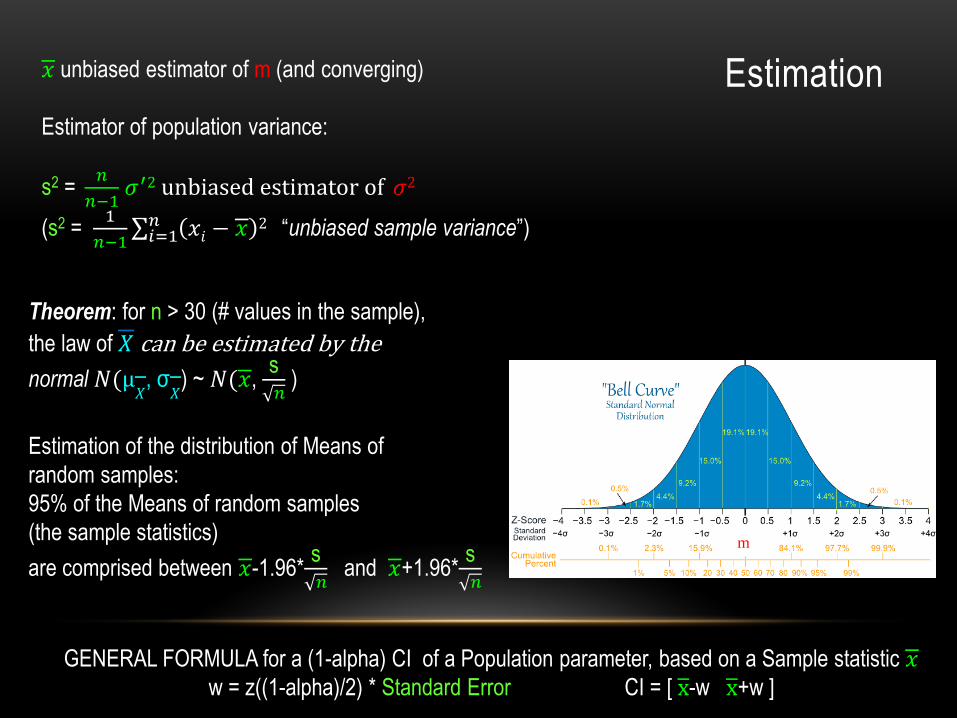
Estimation𝑥 unbiased estimator of m (and converging)
Estimator of population variance:
s2 =𝑛
𝑛−1𝜎′2 unbiased estimator of 𝜎2
(s2 = 1
𝑛−1 𝑖=1𝑛 𝑥𝑖 − 𝑥
2 “unbiased sample variance”)
Theorem: for n > 30 (# values in the sample),
the law of 𝑋 can be estimated by the
normal 𝑁(μ𝑋, σ
𝑋) ~ 𝑁(𝑥,
s𝑛
)
Estimation of the distribution of Means of
random samples:
95% of the Means of random samples
(the sample statistics)
are comprised between 𝑥-1.96*s𝑛
and 𝑥+1.96*s𝑛
m
GENERAL FORMULA for a (1-alpha) CI of a Population parameter, based on a Sample statistic 𝑥w = z((1-alpha)/2) * Standard Error CI = [ x-w x+w ]

• If our model is correct
• = one single population value with random noise: Gaussian model
• check the residuals
• similar variances if several groups
• no outlier
• we can estimate the parameter of the model (the population value), and
• 95% of the random samples will include the population value within their 95% CI
• Check it with simulations in R or Matlab
• Or using Cumming’s Excel macros:
http://www.latrobe.edu.au/psy/research/cognitive-and-developmental-psychology/esci
ESCI chapters 1-4 Jul 4 2011.xlsm, sheet CIjumping
DEFINITION OF A CONFIDENCE INTERVAL
THE SCIENTIFIC CONFIDENCE CRISIS
For those who still care about p-values …
(“Null Hypothesis Significance Tests”, NHST)
Why most published results are false in psychology and
neuroscience
• “partout dans le monde, les centres de recherche semblaient de plus en plus avancer à l’aveuglette, dans un empirisme dénué de sens. Aucun résultat ne permettait d’approcher de la moindre conclusion, ni même de formuler la moindre hypothèse théorique”
Michel Houellebecq, Les particules élémentaires, 1998
• Obvious responses
• Science is produced by human beings
• Humans are incompetent (data analysis), ambitious, lazy, dishonest. They have cognitive biases, they are believers. Logic runs against human cognitive habits.
• A structural culprit
• NHST. Jacob Cohen (1994): ‘I make no pretense of the originality of my remarks […]. David Bakan said back in 1966 that his claim that “a great deal of mischief has been associated” with the test of significance “is hardly original”, that it is “what everybody knows” […] We, as teachers […] are responsible for the ritualization of NHST.’

“Significance tests as sorcery” (Lambdin 2012, quoting Andreski
1972)
• Test of significance as “statistical shamanism”: Many scientists make the claims they do empirical, real science, “not because they have corroborated, diverse evidence supporting them as accurate descriptors of reality, but rather because they desire their opinions to become reality”.
• "the continuing popularity of significance tests in our peer-reviewed journals is at best embarrassing and at worst intellectually dishonest”
• “The plain fact is that 70 years ago Ronald Fisher gave scientists a mathematical machine for turning baloney into breakthroughs, and flukes into funding. It is time to pull the plug. ”
Robert Matthews, Sunday Telegraph, 1998
• The question today is not whether NHST are sound or not. They are not.
See the authoritative criticism of p-values by the American Statistical Association:
Ronald L. Wasserstein & Nicole A. Lazar (2016): The ASA’s statement on p -values: context, process, and purpose, The American Statistician, DOI:10.1080/00031305.2016.1154108.
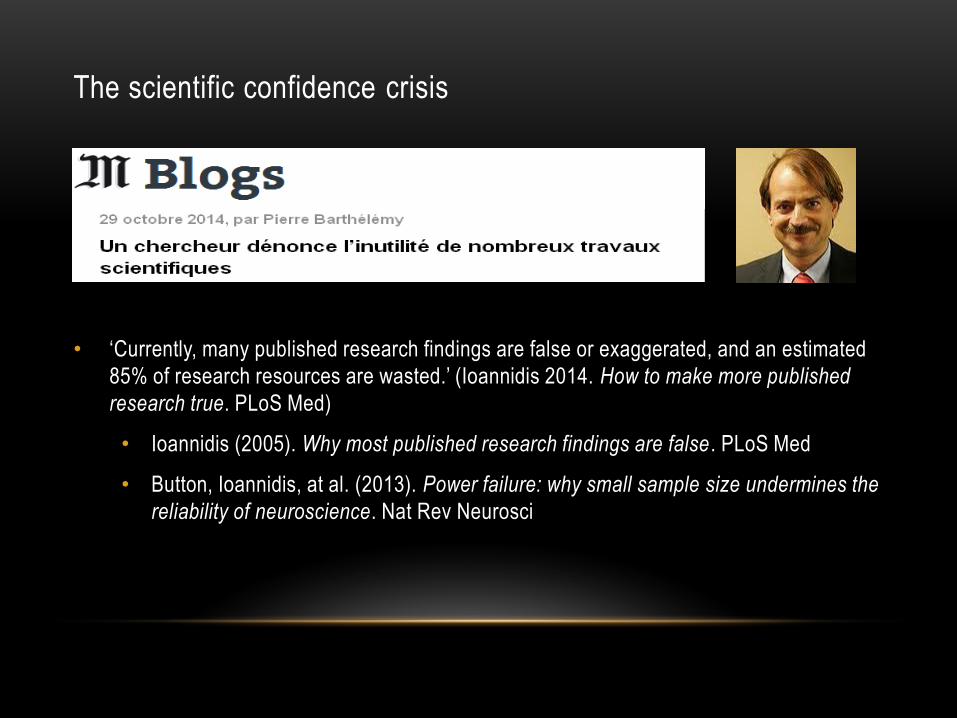
The scientific confidence crisis
• ‘Currently, many published research findings are false or exaggerated, and an estimated
85% of research resources are wasted.’ (Ioannidis 2014. How to make more published
research true. PLoS Med)
• Ioannidis (2005). Why most published research findings are false. PLoS Med
• Button, Ioannidis, at al. (2013). Power failure: why small sample size undermines the
reliability of neuroscience. Nat Rev Neurosci

• Thirty-six percent of replications had significant
results.
• The mean effect size (r) of the replication effects (Mr
= 0.197, SD = 0.257) was half the magnitude of the
mean effect size of the original effects (Mr = 0.403,
SD = 0.188)
Proven lack of reproducibility
Open Science Collaboration (2015) Estimating the reproducibility of psychological science. Science
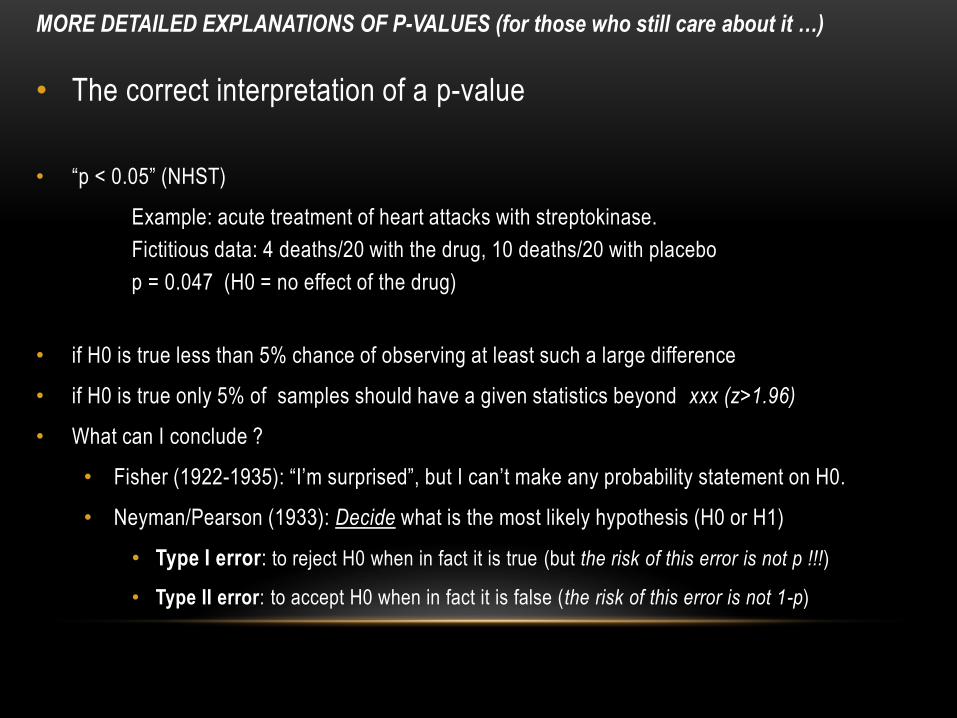
• The correct interpretation of a p-value
• “p < 0.05” (NHST)
Example: acute treatment of heart attacks with streptokinase.
Fictitious data: 4 deaths/20 with the drug, 10 deaths/20 with placebo
p = 0.047 (H0 = no effect of the drug)
• if H0 is true less than 5% chance of observing at least such a large difference
• if H0 is true only 5% of samples should have a given statistics beyond xxx (z>1.96)
• What can I conclude ?
• Fisher (1922-1935): “I’m surprised”, but I can’t make any probability statement on H0.
• Neyman/Pearson (1933): Decide what is the most likely hypothesis (H0 or H1)
• Type I error: to reject H0 when in fact it is true (but the risk of this error is not p !!!)
• Type II error: to accept H0 when in fact it is false (the risk of this error is not 1-p)
MORE DETAILED EXPLANATIONS OF P-VALUES (for those who still care about it …)

Kline (2004). Beyond Significance Testing: Reforming Data Analysis Methods in Behavioral Research. Washington, D.C.: APA Books.
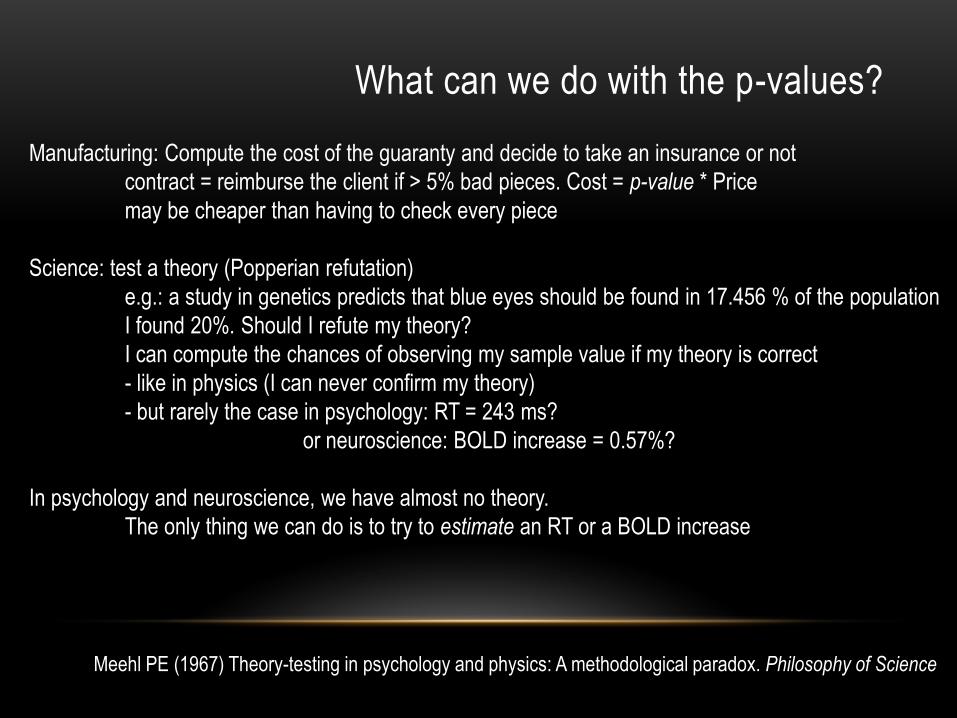
What can we do with the p-values?
Manufacturing: Compute the cost of the guaranty and decide to take an insurance or not
contract = reimburse the client if > 5% bad pieces. Cost = p-value * Price
may be cheaper than having to check every piece
Science: test a theory (Popperian refutation)
e.g.: a study in genetics predicts that blue eyes should be found in 17.456 % of the population
I found 20%. Should I refute my theory?
I can compute the chances of observing my sample value if my theory is correct
- like in physics (I can never confirm my theory)
- but rarely the case in psychology: RT = 243 ms?
or neuroscience: BOLD increase = 0.57%?
In psychology and neuroscience, we have almost no theory.
The only thing we can do is to try to estimate an RT or a BOLD increase
Meehl PE (1967) Theory-testing in psychology and physics: A methodological paradox. Philosophy of Science
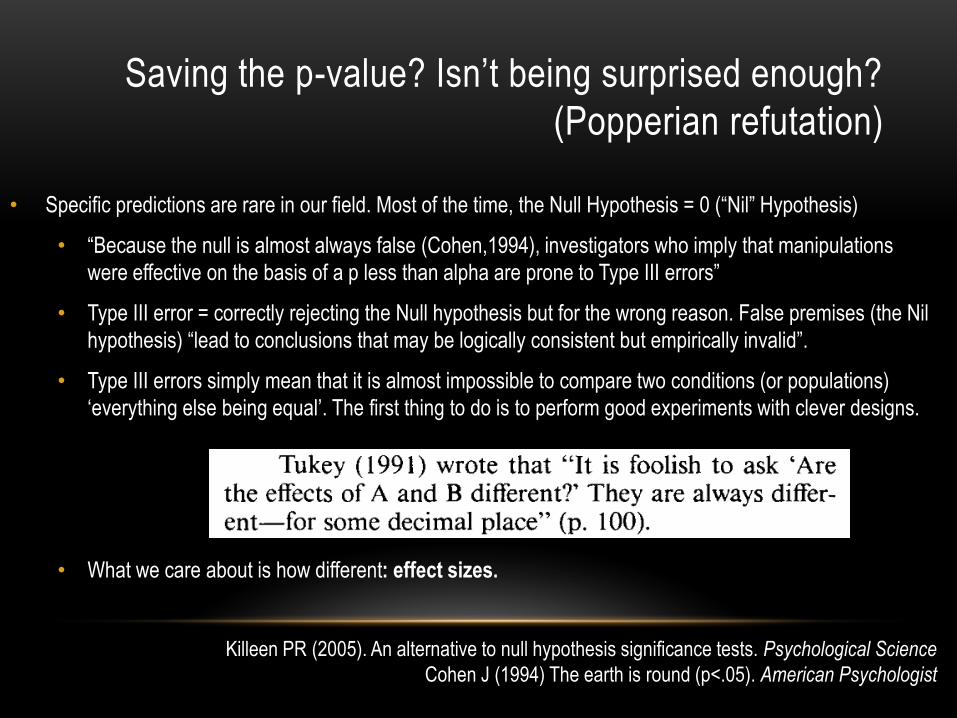
Saving the p-value? Isn’t being surprised enough?
(Popperian refutation)
• Specific predictions are rare in our field. Most of the time, the Null Hypothesis = 0 (“Nil” Hypothesis)
• “Because the null is almost always false (Cohen,1994), investigators who imply that manipulations
were effective on the basis of a p less than alpha are prone to Type III errors”
• Type III error = correctly rejecting the Null hypothesis but for the wrong reason. False premises (the Nil
hypothesis) “lead to conclusions that may be logically consistent but empirically invalid”.
• Type III errors simply mean that it is almost impossible to compare two conditions (or populations)
‘everything else being equal’. The first thing to do is to perform good experiments with clever designs.
• What we care about is how different: effect sizes.
Killeen PR (2005). An alternative to null hypothesis significance tests. Psychological Science
Cohen J (1994) The earth is round (p<.05). American Psychologist

• H0 is always false, so effect sizes are never Null (d > 0)
• Cohen’s d = (m1-m2)/s
• Student t-test = (m1-m2)/(s/sqrt(n))
• t = d * sqrt(n)
• with enough measures, any weak effect may be “significant”. Weak effects are not reproducible, whatever
the p-value
Cohen J (1994) The earth is round (p<.05). American Psychologist
Saving the p-value? Isn’t being surprised enough?
(Popperian refutation)
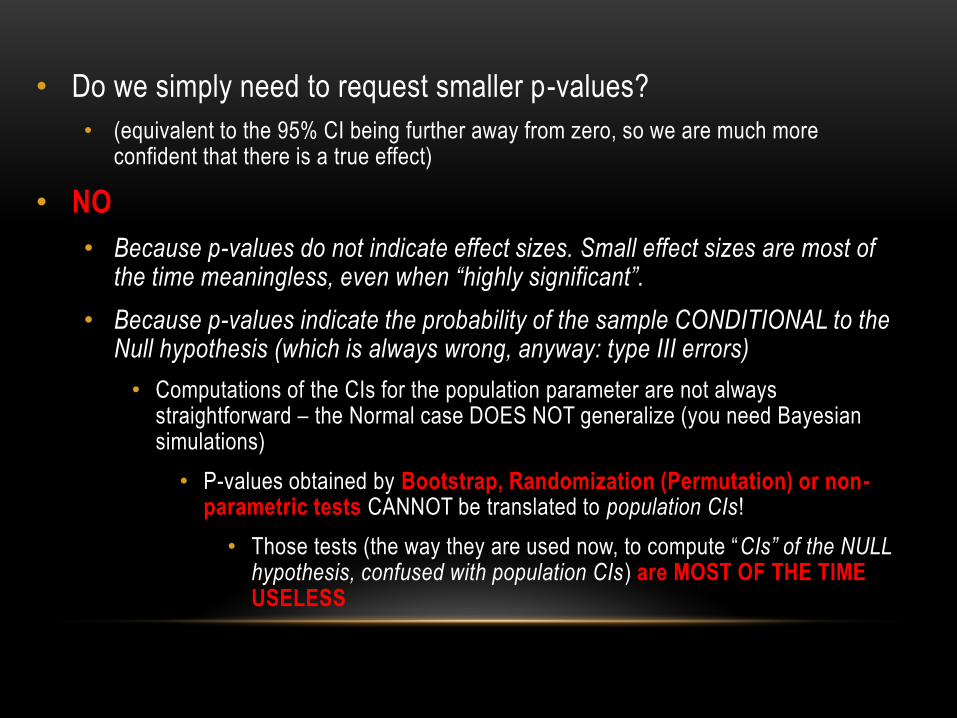
• Do we simply need to request smaller p-values?
• (equivalent to the 95% CI being further away from zero, so we are much more confident that there is a true effect)
• NO
• Because p-values do not indicate effect sizes. Small effect sizes are most of the time meaningless, even when “highly significant”.
• Because p-values indicate the probability of the sample CONDITIONAL to the Null hypothesis (which is always wrong, anyway: type III errors)
• Computations of the CIs for the population parameter are not always straightforward – the Normal case DOES NOT generalize (you need Bayesian simulations)
• P-values obtained by Bootstrap, Randomization (Permutation) or non-parametric tests CANNOT be translated to population CIs!
• Those tests (the way they are used now, to compute “CIs” of the NULL hypothesis, confused with population CIs) are MOST OF THE TIME USELESS

• NHST do not allow us to reach any scientific conclusion
• On the one hand, ‘‘a test of significance contains no criterion for ‘accepting’ a hypothesis’’ (Fisher,
1959, p. 42), and on the other, we cannot safely reject a hypothesis without knowing the priors.
• You may only be “surprised” by the value observed in your sample.
• Is p < 0.05 a reason sufficient enough for being surprised? No, because H0 is always false!
• at least when H0 = 0. If H0 is a specific value predicted by your theory, you may be
surprised indeed. Useful to refute a theory, but certainly not to validate a theory.
• CIs do not allow any decision: 95% of your samples will include the true value within the 95% CI.
• ‘Don’t look for a magic alternative to NHST, some other objective mechanical ritual to replace it. It does not exist’. (Cohen, 1994) (Beware: Bayes factor is an example of such a magic alternative).
• We need to repeat experiments, wait for meta-analyses before risking making up stories. ‘There is no free lunch in good research’ (Ioannidis)
• Small CI (PRECISION) are more informative
• Publication of CI more difficult? Yes, at p ~= 0.05, CIs are “embarrassingly large” (Cohen, 1994)
• But CIs do not make any difference between “null” and “positive” results.
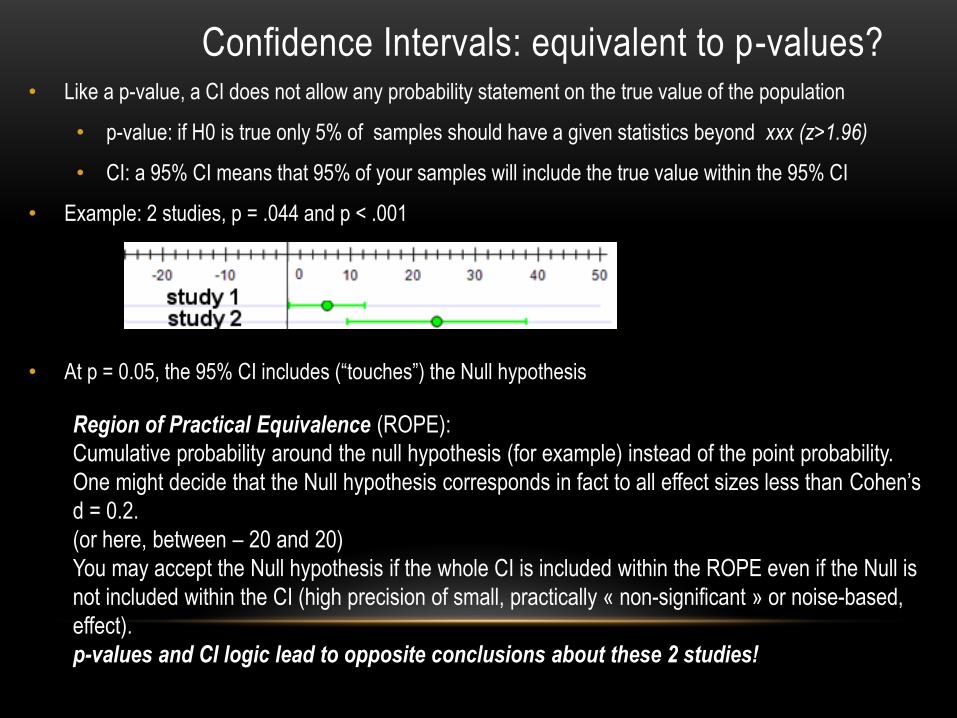
Region of Practical Equivalence (ROPE):
Cumulative probability around the null hypothesis (for example) instead of the point probability.
One might decide that the Null hypothesis corresponds in fact to all effect sizes less than Cohen’s
d = 0.2.
(or here, between – 20 and 20)
You may accept the Null hypothesis if the whole CI is included within the ROPE even if the Null is
not included within the CI (high precision of small, practically « non-significant » or noise-based,
effect).
p-values and CI logic lead to opposite conclusions about these 2 studies!
Confidence Intervals: equivalent to p-values?• Like a p-value, a CI does not allow any probability statement on the true value of the population
• p-value: if H0 is true only 5% of samples should have a given statistics beyond xxx (z>1.96)
• CI: a 95% CI means that 95% of your samples will include the true value within the 95% CI
• Example: 2 studies, p = .044 and p < .001
• At p = 0.05, the 95% CI includes (“touches”) the Null hypothesis

Summary• You want an estimation of your effect size. The statistical summary of a study should be a CI of an effect size
• “Error bars” : SEM or 95% CI? CI = 1.96 * SEM !! (for the normal distribution)
• Need to show the CI of the difference even for between group comparisons
• The smaller the CI (precision), the more informative is your study, because you are narrowing the range
of hypotheses compatible with your data.
• A small CI including 0 is more informative than a large CI not including zero (even if p < 0.001).
• Reports of CI allow the publication of “Null” results and should avoid publication biases, selective
reporting, file drawers problems and fraud.
• What are the conditions of validity we should care about?
• For the estimation of the mean, the central limit theorem guaranties that when n is large enough, the mean of
the sample converges to the mean of the population, whatever its shape, because what matters is only that
the distribution of sample means is normal.
• Some stat teachers conclude that when n > 30, you don’t even need to look at your distribution (correct
statistical conclusion but totally stupid if you think about your model).
• To build a CI, the most important information is the width, which depends on the estimation of the SD. The
SD is critically dependent on asymmetry and outliers. No equivalent of the “central” limit theorem for SD
(or is there?).
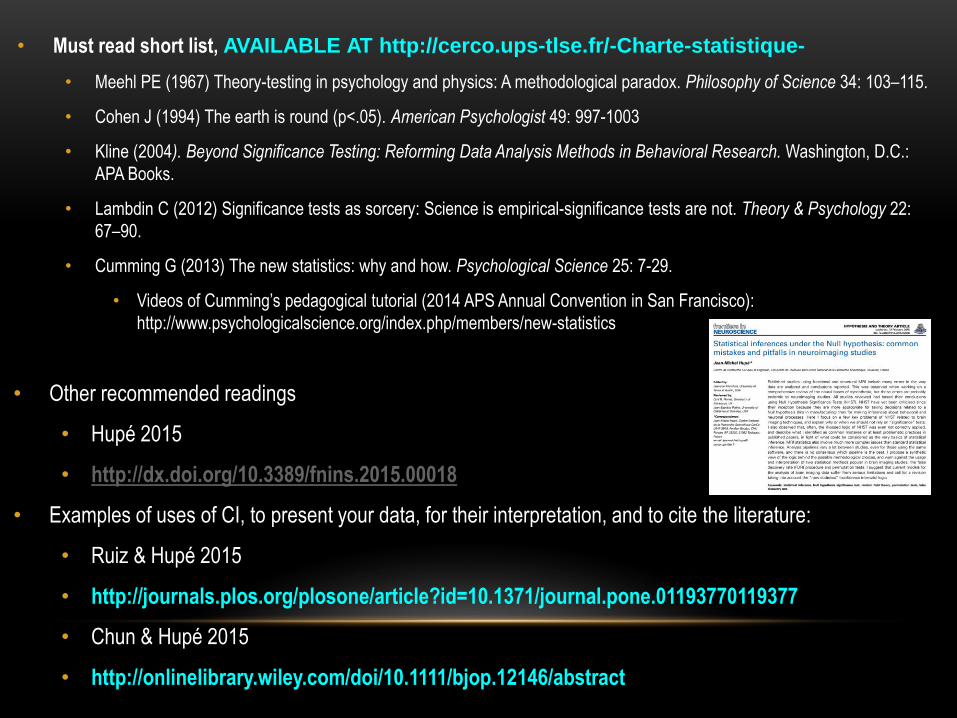
• Must read short list, AVAILABLE AT http://cerco.ups-tlse.fr/-Charte-statistique-
• Meehl PE (1967) Theory-testing in psychology and physics: A methodological paradox. Philosophy of Science 34: 103–115.
• Cohen J (1994) The earth is round (p<.05). American Psychologist 49: 997-1003
• Kline (2004). Beyond Significance Testing: Reforming Data Analysis Methods in Behavioral Research. Washington, D.C.:
APA Books.
• Lambdin C (2012) Significance tests as sorcery: Science is empirical-significance tests are not. Theory & Psychology 22:
67–90.
• Cumming G (2013) The new statistics: why and how. Psychological Science 25: 7-29.
• Videos of Cumming’s pedagogical tutorial (2014 APS Annual Convention in San Francisco):
http://www.psychologicalscience.org/index.php/members/new-statistics
• Other recommended readings
• Hupé 2015
• http://dx.doi.org/10.3389/fnins.2015.00018
• Examples of uses of CI, to present your data, for their interpretation, and to cite the literature:
• Ruiz & Hupé 2015
• http://journals.plos.org/plosone/article?id=10.1371/journal.pone.01193770119377
• Chun & Hupé 2015
• http://onlinelibrary.wiley.com/doi/10.1111/bjop.12146/abstract