concord river watershed smart … river watershed . smart monitoring program 2011-2013 . technical...
TRANSCRIPT
CONCORD RIVER WATERSHED SMART MONITORING PROGRAM 2011-2013
TECHNICAL MEMORANDUM CN 418.0
Sudbury River, Framingham
Prepared By:
Therese Beaudoin January 2016
Commonwealth of Massachusetts
Executive Office of Energy and Environmental Affairs Matthew Beaton, Secretary
Massachusetts Department of Environmental Protection Martin Suuberg, Commissioner Bureau of Water Resources
Douglas Fine, Assistant Commissioner Division of Watershed Management
Rebecca Weidman, Director Watershed Planning Program
Kim Groff, Director

Concord River Watershed SMART Monitoring Program 2011-2013 Technical Memorandum CN 418.0 2 1/21/2016
TABLE OF CONTENTS TABLE OF CONTENTS ............................................................................................................................................. 2 LIST OF TABLES ....................................................................................................................................................... 2 LIST OF FIGURES ..................................................................................................................................................... 3 LIST OF LATIN NAMES ............................................................................................................................................. 3 LIST OF ACRONYMS ................................................................................................................................................ 4 INTRODUCTION ........................................................................................................................................................ 5
Overview of Monitoring Plan ................................................................................................................................... 5 Hydrology ................................................................................................................................................................ 5 Quality Assurance/Quality Control .......................................................................................................................... 7
PROJECT OBJECTIVES ........................................................................................................................................... 8 METHODS .................................................................................................................................................................. 8 STATION OBSERVATIONS .................................................................................................................................... 10
Station AS04 – Assabet River at School Street, Northborough, MA (river mile 27.803) ...................................... 10 Station AS18 – Assabet River at Waltham Street, Maynard, MA (river mile 7.594) ............................................. 12 Station NA01 – Nashoba Brook off Wheeler Lane, Acton, MA (river mile 4.305) ................................................ 14 Station SU07 – Sudbury River at Danforth Street, Framingham, MA (river mile 16.320) .................................... 16 Station CO7A – Concord River at Rogers Street, Lowell, MA (river mile 0.843) ................................................. 18
SURVEY CONDITIONS ........................................................................................................................................... 25 RESULTS AND QUALITY ASSURANCE/QUALITY CONTROL ............................................................................. 30 REFERENCES ......................................................................................................................................................... 41
LIST OF TABLES Table 1 SuAsCo Basin SMART Sampling Summary – 2011 through 2013 .............................................................. 5 Table 2 MassDEP SMART 2011 - 2013. Station AS04. Summary of Observations. ............................................ 20 Table 3 MassDEP SMART 2011 - 2013. Station AS18. Summary of Observations. ............................................ 21 Table 4 MassDEP SMART 2011 - 2013. Station NA01. Summary of Observations. ........................................... 22 Table 5 MassDEP SMART 2011 - 2013. Station SU07. Summary of Observations. ............................................ 23 Table 6 MassDEP SMART 2011 - 2013. Station CO7A. Summary of Observations. ........................................... 24 Table 7 Climate Conditions at Reading, MA from January 14-19, 2011 .................................................................. 25 Table 8 Climate Conditions at Reading, MA from March 10-15, 2011..................................................................... 26 Table 9 Climate Conditions at Reading, MA from February 17-22, 2012 ................................................................ 26 Table 10 Climate Conditions at Reading, MA from January 23-28, 2013 ................................................................ 27 Table 11 Climate Conditions at Reading, MA from March 15-20, 2013................................................................... 27 Table 12 SuAsCo Basin Precipitation Data Summary 2011-2013 ........................................................................... 29 Table 13 Discharge at the Concord River below River Meadow Brook, Lowell, MA 2011-2013 ............................ 29 Table 14 MassDEP SMART 2011-2013. Station AS04. In Situ Multiprobe Data. .................................................. 31 Table 15 MassDEP SMART 2011-2013. Station AS18. In Situ Multiprobe Data. .................................................. 32 Table 16 MassDEP SMART 2011-2013. Station NA01. In Situ Multiprobe Data. .................................................. 33 Table 17 MassDEP SMART 2011-2013. Station SU07. In Situ Multiprobe Data. .................................................. 34 Table 18 MassDEP SMART 2011-2013. Station CO7A. In Situ Multiprobe Data. ................................................. 35 Table 19 MassDEP SMART 2011-2013. Station AS04. Chemistry Data. .............................................................. 36 Table 20 MassDEP SMART 2011-2013. Station AS18. Chemistry Data. .............................................................. 37 Table 21 MassDEP SMART 2011-2013. Station NA01. Chemistry Data. .............................................................. 38 Table 22 MassDEP SMART 2011-2013. Station SU07. Chemistry Data. .............................................................. 39 Table 23 MassDEP SMART 2011-2013. Station CO7A. Chemistry Data. ............................................................. 40
Cover photo by Therese Beaudoin, MassDEP. September 25, 2013. All photos in document taken by Therese Beaudoin. MassDEP. CERO. SMART monitoring logo designed by Robert Kimball and Barbara Kimball.

Concord River Watershed SMART Monitoring Program 2011-2013 Technical Memorandum CN 418.0 3 1/21/2016
LIST OF FIGURES
Figure 1 MassDEP SMART Concord River Watershed Water Quality Station Locations ......................................... 6 Figure 2 Google Earth view of Station AS04 area ................................................................................................... 10 Figure 3 Station AS04 upstream (9/25/2013) ........................................................................................................... 10 Figure 4 Google Earth view of Station AS18 ............................................................................................................ 12 Figure 5 Station AS18 upstream (5/20/2013) ........................................................................................................... 12 Figure 6 Google Earth view of NA01 area ............................................................................................................... 14 Figure 7 Station NA01 upstream (6/20/2012) .......................................................................................................... 14 Figure 8 Google Earth view of Station SU07 area ................................................................................................... 16 Figure 9 Station SU07 upstream (6/20/2012) .......................................................................................................... 16 Figure 10 Google Earth view of Station CO7A area ................................................................................................ 18 Figure 11 Station CO7A upstream (9/25/2013) ........................................................................................................ 18
LIST OF LATIN NAMES Latin Name Common name Latin Name Common name Agelaius phoeniceus redwinged blackbird Lobelia canadensis cardinal flower Anas platyrhynchos mallard duck Myriophyllum sp. milfoil Anatidae family duck Peltandra virginica arrow arum Ardea herodias great blue heron Pontedaria cordata pickerelweed Branta canadensis Canada goose Potamogeton sp. pondweed
Cambaridae family true crayfishes Potamogeton epihydrus ribbonleaf pondweed Ceratophyllum demersum coontail/hornwort Sagittaria sp. arrowhead Culicidae family mosquitoes Scirpus sp. sedges Elodea sp. waterweed Unionidae family freshwater mussels Gramineae family true grasses Vallisneria sp. eelgrass, tape grass or wild celery Lemna sp. duckweed Wolffia sp. watermeal Lithobates clamitans green frog
Concord River Watershed SMART Monitoring Program 2011-2013 Technical Memorandum CN 418.0 4 1/21/2016
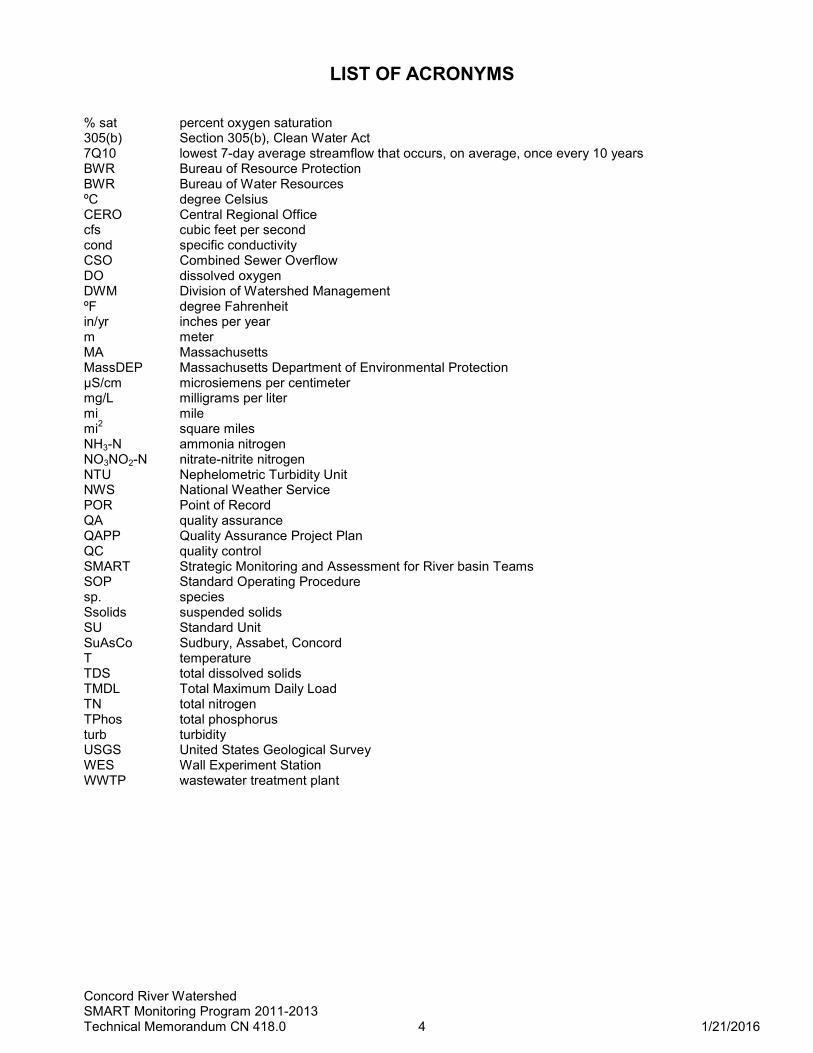
LIST OF ACRONYMS % sat percent oxygen saturation 305(b) Section 305(b), Clean Water Act 7Q10 lowest 7-day average streamflow that occurs, on average, once every 10 years BWR Bureau of Resource Protection BWR Bureau of Water Resources ºC degree Celsius CERO Central Regional Office cfs cubic feet per second cond specific conductivity CSO Combined Sewer Overflow DO dissolved oxygen DWM Division of Watershed Management ºF degree Fahrenheit in/yr inches per year m meter MA Massachusetts MassDEP Massachusetts Department of Environmental Protection μS/cm microsiemens per centimeter mg/L milligrams per liter mi mile mi2 square miles NH3-N ammonia nitrogen NO3NO2-N nitrate-nitrite nitrogen NTU Nephelometric Turbidity Unit NWS National Weather Service POR Point of Record QA quality assurance QAPP Quality Assurance Project Plan QC quality control SMART Strategic Monitoring and Assessment for River basin Teams SOP Standard Operating Procedure sp. species Ssolids suspended solids SU Standard Unit SuAsCo Sudbury, Assabet, Concord T temperature TDS total dissolved solids TMDL Total Maximum Daily Load TN total nitrogen TPhos total phosphorus turb turbidity USGS United States Geological Survey WES Wall Experiment Station WWTP wastewater treatment plant

Concord River Watershed SMART Monitoring Program 2011-2013 Technical Memorandum CN 418.0 5 1/21/2016
INTRODUCTION
The purpose of this technical memo is to present observations and data collected in the Strategic Monitoring and Assessment for River basin Teams (SMART) program in the SuAsCo River watershed from 2011 through 2013, highlighting how the program supports and augments programs of the Massachusetts Department of Environmental Protection (MassDEP) Bureau of Resource Protection (BRP, now the Bureau of Water Resources, BWR) Central Regional Office (CERO) and the Division of Watershed Management (DWM). Overview of Monitoring Plan Bimonthly water quality monitoring in the Concord Watershed began in March 2000. The sampling plan matrix for the 2011-2013 SMART monitoring program is presented in Table 1. The location of sampling stations is presented in Figure 1. Sampling components at all stations included:
in situ measurements: dissolved oxygen (DO), percent oxygen saturation, pH, specific conductivity, temperature (T), depth and total dissolved solids (TDS);
physical/chemical constituents: total alkalinity, chlorides, hardness, total suspended solids (TSS), turbidity; nutrients: ammonia-nitrogen (NH3-N), nitrate-nitrite-nitrogen (NO3—NO2-N), total nitrogen (TN), and total
phosphorus (TP); flow measurements (at existing USGS flow gaging stations); and general field observations.
Table 1 SuAsCo Basin SMART Sampling Summary – 2011 through 2013
Location and Segment Numbers Station Name
Station Type Dates Sampled1
Assabet River @ School Street, Northborough MA82B-02 AS04 Impact
2011: 1/19/11, 3/15/11, 5/17/11, 7/20/11, 9/21/11, 11/16/11 2012: , 2/22/12, 4/11/12, 6/20/12, 8/22/12, 10/24/12 2013: 1/28/13, 3/20/13, 5/20/13, 8/28/13, 9/25/13
Assabet River @ USGS flow gaging station, State Roads 27/62, Maynard MA82B-05 AS18 Impact
Nashoba Brook @ USGS flow gaging station, Wheeler Road, Acton MA82B-14 NA01 Impact
Sudbury River @ USGS flow gaging station, Danforth Road, Framingham MA82A-03 SU07 Reference
Concord River SW of Rogers Street, Lowell MA82A-08 (from 1/19/11 – 9/25/13) CO7A Boundary
Hydrology The Concord River Watershed has a total drainage area of 400 square miles (mi2), entirely within the Commonwealth of Massachusetts (MA). It is comprised mainly of two subwatersheds, the Assabet and Sudbury, which is the basis of the basin’s other name, the SuAsCo (Sudbury, Assabet, Concord). See SuAsCo Watershed Water Quality Assessment Report 2001 for further information (O’Brien-Clayton 2005). The Assabet River, with a drainage area of 131 mi2, begins at the outlet of the Assabet River Reservoir, or the “A1” site, in Westborough. From there, the river meanders approximately 31 miles (mi) through many dammed reaches until it joins the Sudbury River at Egg Rock in Concord, MA. The lower 4.4 mi were designated as Wild and Scenic by the U.S. Congress in 1999 (for further information on the Act of Congress that designated these areas, see Designation Of Sudbury, Assabet, And Concord Scenic And Recreational Rivers (USGPO 1999). Due to its highly impounded nature and the nutrient input from four major wastewater treatment plant (WWTP) discharges, the Assabet River exhibits problems associated with eutrophication.

Concord River Watershed SMART Monitoring Program 2011-2013 Technical Memorandum CN 418.0 6 1/21/2016
Figure 1 MassDEP SMART Concord River Watershed Water Quality Station Locations

Concord River Watershed SMART Monitoring Program 2011-2013 Technical Memorandum CN 418.0 7 1/21/2016
The Sudbury River, with a drainage area of 162 mi2, flows approximately 28 mi from its headwaters at the outlet of Cedar Swamp Pond, Westborough to the Assabet River confluence. The upper watershed includes numerous large water supply reservoirs in Hopkinton, Southborough, Ashland and Framingham, which serve as emergency drinking water supplies. The river then flows through a large urbanized area in Framingham. North of the Danforth Street Bridge, the final 14.9 miles of the Sudbury have been designated as Wild and Scenic. The Concord River drains an additional 107 mi2 and flows approximately 15 mi to its junction with the Merrimack River in the City of Lowell. The upper 8 miles are federally designated Wild and Scenic. This part of the watershed is moderately to densely developed, with large areas of impervious surfaces throughout. Quality Assurance/Quality Control The quality assurance (QA) quality control (QC) project plan (QAPP) for the SMART program is presented in CN 012.1: Strategic Monitoring and Assessment for River basin Teams Quality Assurance Project Plan (Beaudoin 2008). The QAPP presents data quality objectives, quality assurance procedures, and other program-specific information. This technical memorandum will report deviations from the procedures described in the QAPP.
Aerial photos were obtained from Google Earth (2013a, 2013b, 2013c, 2013d, 2013e) at a height of approximately 4,000 feet (ft).
Concord River Watershed SMART Monitoring Program 2011-2013 Technical Memorandum CN 418.0 8 1/21/2016
PROJECT OBJECTIVES
The primary water quality objectives of the SMART monitoring program are:
Document baseline water quality by: providing information on low flow/event flow variation, seasonal variation and frequency of selected constituents; and establishing reference distributions of key constituents for ecoregion delineation and “clean water” sites;
Estimate loads of detected water constituents at key locations by: quantifying nitrogen loadings to coastal waters; and calculating phosphorous loads upstream/downstream of representative land use areas;
Define long term trends in water quality by: documenting improvements associated with major abatement projects; and identifying trends at least-impacted stations (that may result from factors such as acid precipitation and climate change);
Assess attainment of water quality uses by: comparing existing water quality with water quality standards; and by assessing use support for the fishable/swimmable goal;
Provide support for other programs by: determining reference distributions for ecoregion stations; conducting trend analysis for the 305(b) reports1 and basin plans; quantifying nutrient loadings for load allocations (total maximum daily loads, or TMDLs); obtaining data on nonpoint source loadings for more intensive Year 2 sampling; providing guidance for volunteer monitoring; collecting data for development of statistically-based water quality standards and for improvement of Combined Sewer Overflow (CSO) and Stormwater policies; and developing a long-term database on conditions at key locations for the development of new programs and basic research.
As stated in the Introduction, this document presents observations and data collected in the SuAsCo Watershed under the SMART program from 2011-2013. An assessment of the data will be presented in future reports.
METHODS Water quality sampling procedures are included in Grab Collection Techniques for DWM Water Quality Sampling, Standard Operating Procedure (MassDEP 1999b). Use of the in situ monitoring equipment followed procedures set forth in CN 4.0 Water Quality Multi-probe Instrument Use, Standard Operating Procedure (MassDEP 1999a). Physical/chemical and nutrient samples were analyzed at the Wall Experiment Station (WES), the MassDEP analytical laboratory located in Lawrence, Massachusetts. All samples were collected, transported, analyzed, and discarded according to chain-of-custody procedures.
In addition to the measurements and analytes noted above, field observations were recorded at each station on standardized field sheets, field notebooks, and photographs. Field observations included date/time, location, crewmembers, snow cover (when relevant), canopy cover, water odors, colors, sheens, foams, estimated river height and velocity, weather conditions, observed uses (e.g., boating), wildlife, aquatic algae and macrophytes, potential pollution sources, and unusual conditions. The number and type of samples were recorded, as well as the last set of in situ data collected. An aerial view and a photo depicting the upstream environs accompany each station description; see Figure 3 through Figure 11. A summary of field observations by station collected during this sampling period are presented in Table 2 through Table 6 following the station descriptions.
Each station selected for the SMART Monitoring program is described according to key characteristics associated with water quality at that location, as follows:
Reference: a reference station is located in a stream segment that is minimally influenced by anthropogenic activities;
Impact: an impact (or trend) station is located where several sources of pollution come together and can be used to calibrate a mass balance model, or where critical reactions take place such as at an oxygen sag point; and
1 The 305(b) reports are the biannual reports to the U. S. Congress on water quality that are required under Section 305(b) of the Clean Water Act.
Concord River Watershed SMART Monitoring Program 2011-2013 Technical Memorandum CN 418.0 9 1/21/2016
Boundary: a boundary station is located at a pour point i.e., where water leaves a designated river basin, or at a state line.
Field sheets, raw data files, chain of custody forms, lab reports, and other metadata used in this report are managed and maintained by the MassDEP DWM in the Water Quality Access Database in Worcester, MA. The validation of the water quality data included data entry into DWM databases, data entry quality control checks, analysis for outliers, blank contamination, duplicates, precision, and holding time violations, followed by project level review (MassDEP 2005). The project coordinator, as identified in the QAPP for the SMART program (CN 012.2), reviews the data for reasonableness, completeness and acceptability (Beaudoin 2008).
Concord River Watershed SMART Monitoring Program 2011-2013 Technical Memorandum CN 418.0 10 1/21/2016
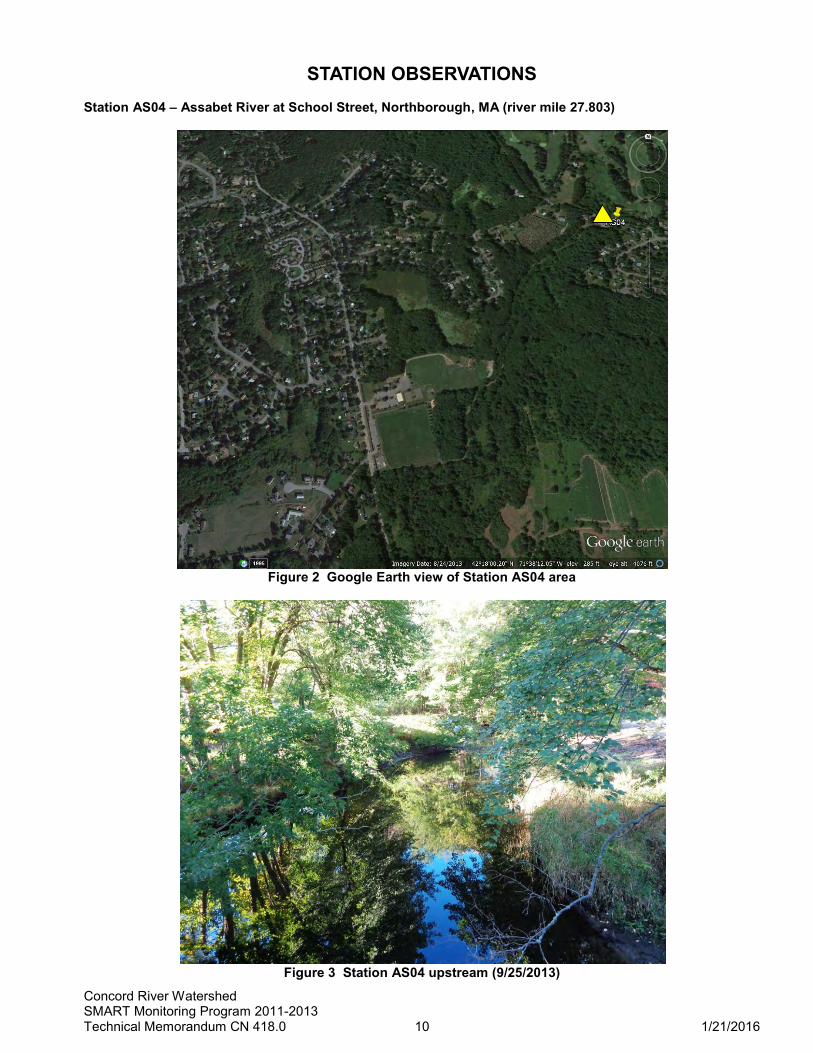
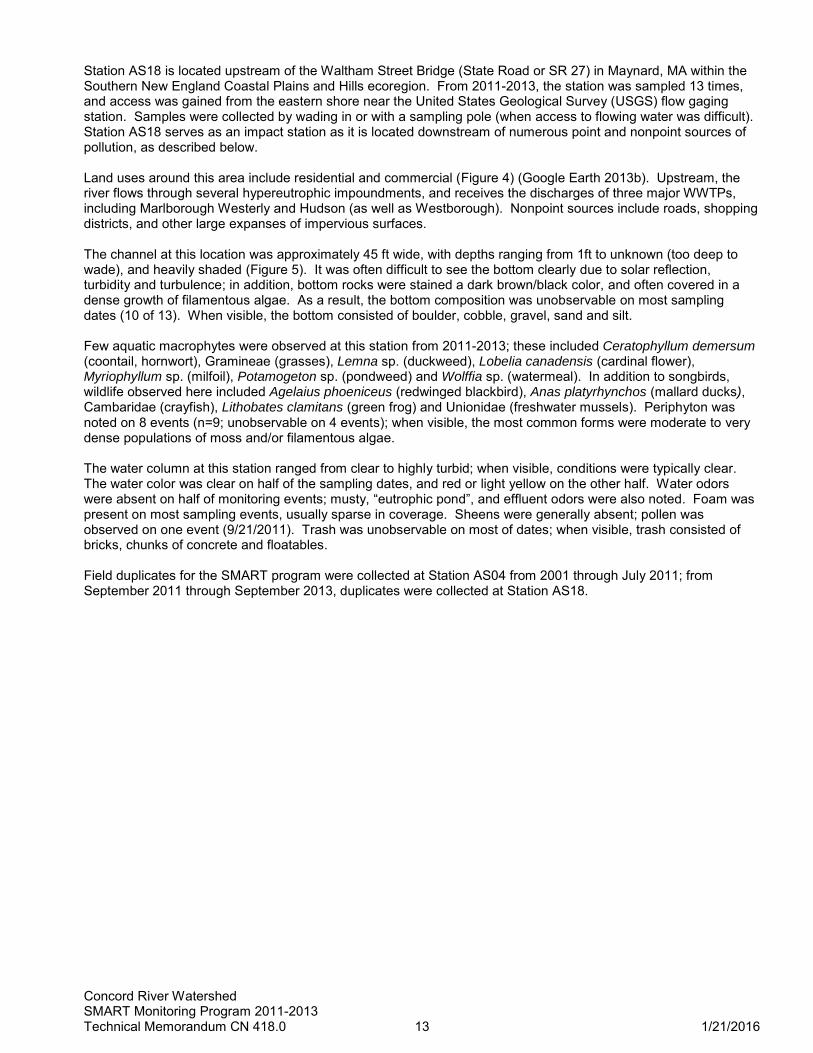
STATION OBSERVATIONS Station AS04 – Assabet River at School Street, Northborough, MA (river mile 27.803)
Figure 2 Google Earth view of Station AS04 area
Figure 3 Station AS04 upstream (9/25/2013)

Concord River Watershed SMART Monitoring Program 2011-2013 Technical Memorandum CN 418.0 11 1/21/2016
Station AS04 is located on the Assabet River near the School Street Bridge in Northborough, MA within the Southern New England Coastal Plains and Hills ecoregion. From 2011-2013, this station was sampled 13 times, and access was gained from the bridge or from the shore upstream. When the abundance of poison ivy on the banks in this location prevented shoreline access, samples were collected from the bridge, center stream, with a sampling pole. When poison ivy was not an issue, sampling was conducted from a point upstream of the bridge, by wading in from the left bank. Both locations are representative of water quality conditions in this reach. Station AS04 serves as an impact station as it is located downstream of numerous point and nonpoint sources of pollution, as described below. Land uses proximal to this station consist of residential and forested, including a Christmas tree farm (Figure 2) (Google Earth 2013a). The Westborough WWTP discharge is located 2.25 mi upstream. Nonpoint sources include roads, shopping districts, and other large expanses of impervious surfaces. The river was approximately 30 ft wide at this site, typically less than 3 ft deep and roughly uniform across the channel throughout the year (Figure 3). Deciduous trees provided canopy cover over much of the streambed upstream of the bridge. The bottom consisted mainly of sand, with cobble and gravel, silt and mud. During the growing season (approximately June through September), the channel was colonized with sparse to dense populations of emergent macrophytes, including Elodea sp. (waterweed), Gramineae family (grasses), Peltandra virginica (arrow arum), Pontedaria cordata (pickerelweed), Potamogeton sp. (pondweed), P. epihydrus (ribbonleaf pondweed), Sagittaria sp. (arrowhead), Scirpus sp. (sedges), Vallisneria sp. (eelgrass, tape grass, wild celery) and Wolffia sp. (watermeal). Periphyton was not present on 9 of the 13 dates sampled; when present, periphytic growth was most commonly composed of dense to very dense filamentous algae. In addition to songbirds, the only wildlife observed in this stretch of river during SMART monitoring from 2011-2013 was Branta canadensis (Canada goose). Fishing line and bobbers were caught in shoreline tree branches, indicating that recreational fishing occurs in this area. In September 2011, a small platform was built on the eastern shore, upstream of the bridge, with a tether for a small boat. In general, the water column at this station lacked trash, odor, foam, sheens and turbidity. Water color was typically clear or light yellow. Field duplicates for the SMART program were collected at Station AS04 from 2001 through July 2011; from September 2011 through September 2013, duplicates were collected at Station AS18.

Concord River Watershed SMART Monitoring Program 2011-2013 Technical Memorandum CN 418.0 12 1/21/2016
Station AS18 – Assabet River at Waltham Street, Maynard, MA (river mile 7.594)
Figure 4 Google Earth view of Station AS18
Figure 5 Station AS18 upstream (5/20/2013)
Concord River Watershed SMART Monitoring Program 2011-2013 Technical Memorandum CN 418.0 13 1/21/2016
Station AS18 is located upstream of the Waltham Street Bridge (State Road or SR 27) in Maynard, MA within the Southern New England Coastal Plains and Hills ecoregion. From 2011-2013, the station was sampled 13 times, and access was gained from the eastern shore near the United States Geological Survey (USGS) flow gaging station. Samples were collected by wading in or with a sampling pole (when access to flowing water was difficult). Station AS18 serves as an impact station as it is located downstream of numerous point and nonpoint sources of pollution, as described below. Land uses around this area include residential and commercial (Figure 4) (Google Earth 2013b). Upstream, the river flows through several hypereutrophic impoundments, and receives the discharges of three major WWTPs, including Marlborough Westerly and Hudson (as well as Westborough). Nonpoint sources include roads, shopping districts, and other large expanses of impervious surfaces. The channel at this location was approximately 45 ft wide, with depths ranging from 1ft to unknown (too deep to wade), and heavily shaded (Figure 5). It was often difficult to see the bottom clearly due to solar reflection, turbidity and turbulence; in addition, bottom rocks were stained a dark brown/black color, and often covered in a dense growth of filamentous algae. As a result, the bottom composition was unobservable on most sampling dates (10 of 13). When visible, the bottom consisted of boulder, cobble, gravel, sand and silt. Few aquatic macrophytes were observed at this station from 2011-2013; these included Ceratophyllum demersum (coontail, hornwort), Gramineae (grasses), Lemna sp. (duckweed), Lobelia canadensis (cardinal flower), Myriophyllum sp. (milfoil), Potamogeton sp. (pondweed) and Wolffia sp. (watermeal). In addition to songbirds, wildlife observed here included Agelaius phoeniceus (redwinged blackbird), Anas platyrhynchos (mallard ducks), Cambaridae (crayfish), Lithobates clamitans (green frog) and Unionidae (freshwater mussels). Periphyton was noted on 8 events (n=9; unobservable on 4 events); when visible, the most common forms were moderate to very dense populations of moss and/or filamentous algae. The water column at this station ranged from clear to highly turbid; when visible, conditions were typically clear. The water color was clear on half of the sampling dates, and red or light yellow on the other half. Water odors were absent on half of monitoring events; musty, “eutrophic pond”, and effluent odors were also noted. Foam was present on most sampling events, usually sparse in coverage. Sheens were generally absent; pollen was observed on one event (9/21/2011). Trash was unobservable on most of dates; when visible, trash consisted of bricks, chunks of concrete and floatables. Field duplicates for the SMART program were collected at Station AS04 from 2001 through July 2011; from September 2011 through September 2013, duplicates were collected at Station AS18.

Concord River Watershed SMART Monitoring Program 2011-2013 Technical Memorandum CN 418.0 14 1/21/2016
Station NA01 – Nashoba Brook off Wheeler Lane, Acton, MA (river mile 4.305)
Figure 6 Google Earth view of NA01 area
Figure 7 Station NA01 upstream (6/20/2012)

Concord River Watershed SMART Monitoring Program 2011-2013 Technical Memorandum CN 418.0 15 1/21/2016
Station NA01 is located on Nashoba Brook in Acton, MA within the Southern New England Coastal Plains and Hills ecoregion. From 2011-2013, the station was sampled 13 times, and access was gained from the eastern shore at the USGS flow gaging station near a footbridge in the Nashoba Brook Conservation Area. Samples were collected from center stream by wading in or with a sampling pole. Station NA01 was expected to represent reference conditions for the Concord watershed; however, water quality data have shown that it is an impact station, influenced by numerous point and nonpoint sources of pollution, as described below. The station is located in the upper area of the Nashoba Brook watershed, and upstream land uses include light residential and industrial/commercial development and forest (Figure 6) (Google Earth 2013c). Robbins Mill Pond is located approximately 0.1 miles about Station NA01. Although there are no surface water municipal discharges upstream, there are numerous groundwater discharges of sewage. The closest is the Acton Retirement Community (approximately 350 ft from Nashoba Brook, and 2,400 ft upstream of the station). The river channel was approximately 15 ft wide in this reach and heavily shaded (Figure 7). Although it was often difficult to determine the bottom composition due to solar reflection, the deep tannic color of the water column and bottom staining, the bottom (when visible) consisted mainly of cobble, gravel and sand. For the same reasons, it was often difficult to determine the presence or absence of periphyton; when visible, periphyton mainly consisted of moss. Trash was absent on all dates when the bottom was visible. Aquatic macrophytes were largely absent from this stream segment; Lobelia cardinalis (cardinal flower) was observed on a single event (8/28/2013). Other than songbirds, wildlife was not observed in this area during this time period. The water column was clear on most sampling events; when visible, turbidity was sparse to moderate. The water color was red on most sampling events. The water column typically lacked odor; although a petroleum odor was noted on 5 sampling events, the source appeared to be the sediments when disturbed by the sampling staff. Foam was absent on two-thirds of monitoring dates, and sparse on most other site visits. A pollen layer was observed on 6/20/2012; sheens were absent on all other dates.

Concord River Watershed SMART Monitoring Program 2011-2013 Technical Memorandum CN 418.0 16 1/21/2016
Station SU07 – Sudbury River at Danforth Street, Framingham, MA (river mile 16.320)
Figure 8 Google Earth view of Station SU07 area
Figure 9 Station SU07 upstream (6/20/2012)

Concord River Watershed SMART Monitoring Program 2011-2013 Technical Memorandum CN 418.0 17 1/21/2016
Station SU07 is located on the Sudbury River in the village of Saxonville, Framingham, MA within the Boston Basin ecoregion. From 2011-2013, the station was sampled 13 times, and access was gained from the western shore downstream of the historic Old Danforth Street Bridge (pedestrian traffic only) near the (modern) Danforth Street Bridge. Samples were collected from center stream by wading in or with a sampling pole. Both sites are considered to represent water quality in this reach. Station SU07 serves as a reference station, minimally influenced by anthropogenic activities. The upper Sudbury watershed includes pristine riverine areas and large impoundments managed as emergency water supplies (Figure 8) (Google Earth 2011d). The river flows through the urbanized towns of Framingham and Natick, with dense residential and industrial/commercial development, roadways and a flood control project constructed by the U.S. Army Corps of Engineers in 1979 to alleviate flooding in the village of Saxonville. Upstream of the Old Danforth Street Bridge, the river channel is approximately 75 ft wide, with depths ranging from approximately 0.5 ft to unknown (too deep to wade). The channel is open to the sky, except in the footprint of the two bridges (Figure 9). Downstream of the historic bridge, the channel is approximately 50 ft wide, 0.5 to 3 ft deep, with nearly complete canopy cover. The bottom consisted largely of cobble, gravel and sand. Periphyton was present on half of the sampling events; moss was the most common form observed (n=4), and moderate dark green filamentous algae and a sparse clear film were observed once. Aquatic macrophytes were sparse; those present included Potamogeton sp. (pondweed), P. epihydrus (ribbonleaf pondweed) and an unknown submergent. Waterfowl and other water-related birds included Agelaius phoeniceus (redwinged blackbird), Anatidae (duck family) and Branta canadensis (Canada goose). Mussels (Unionidae) and Culicidae (mosquitoes) were also noted. On most sampling events, the water column was clear (without visible turbidity) and lacked odor, foam and sheens. Water color was typically clear or light yellow. Trash was present on all sampling dates, in both the riparian zone and the stream channel; items observed included broken glass, bricks, storm drain grate, catch basin cover, metals, floatables and miscellaneous unidentifiable objects.

Concord River Watershed SMART Monitoring Program 2011-2013 Technical Memorandum CN 418.0 18 1/21/2016
Station CO7A – Concord River at Rogers Street, Lowell, MA (river mile 0.843)
Figure 10 Google Earth view of Station CO7A area
Figure 11 Station CO7A upstream (9/25/2013)
Concord River Watershed SMART Monitoring Program 2011-2013 Technical Memorandum CN 418.0 19 1/21/2016
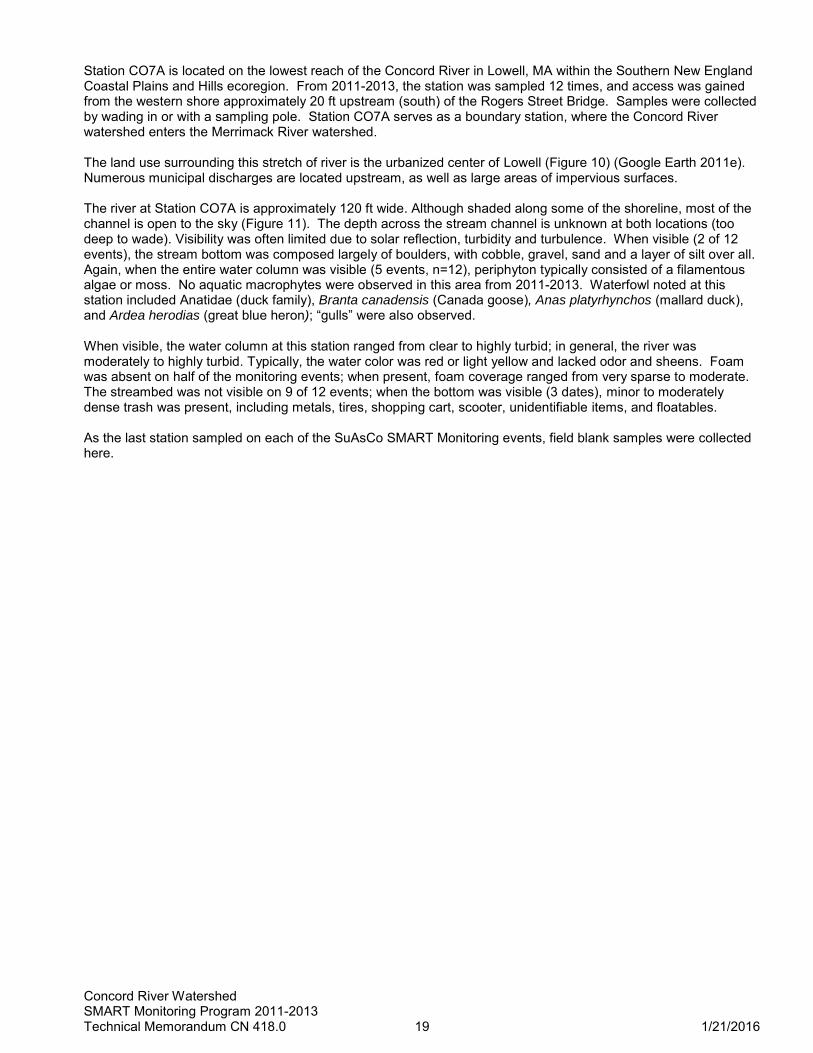
Station CO7A is located on the lowest reach of the Concord River in Lowell, MA within the Southern New England Coastal Plains and Hills ecoregion. From 2011-2013, the station was sampled 12 times, and access was gained from the western shore approximately 20 ft upstream (south) of the Rogers Street Bridge. Samples were collected by wading in or with a sampling pole. Station CO7A serves as a boundary station, where the Concord River watershed enters the Merrimack River watershed. The land use surrounding this stretch of river is the urbanized center of Lowell (Figure 10) (Google Earth 2011e). Numerous municipal discharges are located upstream, as well as large areas of impervious surfaces. The river at Station CO7A is approximately 120 ft wide. Although shaded along some of the shoreline, most of the channel is open to the sky (Figure 11). The depth across the stream channel is unknown at both locations (too deep to wade). Visibility was often limited due to solar reflection, turbidity and turbulence. When visible (2 of 12 events), the stream bottom was composed largely of boulders, with cobble, gravel, sand and a layer of silt over all. Again, when the entire water column was visible (5 events, n=12), periphyton typically consisted of a filamentous algae or moss. No aquatic macrophytes were observed in this area from 2011-2013. Waterfowl noted at this station included Anatidae (duck family), Branta canadensis (Canada goose), Anas platyrhynchos (mallard duck), and Ardea herodias (great blue heron); “gulls” were also observed. When visible, the water column at this station ranged from clear to highly turbid; in general, the river was moderately to highly turbid. Typically, the water color was red or light yellow and lacked odor and sheens. Foam was absent on half of the monitoring events; when present, foam coverage ranged from very sparse to moderate. The streambed was not visible on 9 of 12 events; when the bottom was visible (3 dates), minor to moderately dense trash was present, including metals, tires, shopping cart, scooter, unidentifiable items, and floatables. As the last station sampled on each of the SuAsCo SMART Monitoring events, field blank samples were collected here.

Concord River Watershed SMART Monitoring Program 2011-2013 Technical Memorandum CN 418.0 20 1/21/2016
Table 2 MassDEP SMART 2011 - 2013. Station AS04. Summary of Observations. Survey Dates Substrate Trash Periphyton Color Odor Foam Sheen Turbidity
Wet/Dry Conditions
1/19/2011 Sand None None Clear None None None Clear Wet
3/15/2011 Sand None None Light yellow None None None Clear Dry
5/17/2011 Cobble/sand None None Red, slight None None None Clear Wet
7/20/2011 Sand/silt None None Light yellow None None None Clear Dry
9/21/2011 Cobble/gravel/sand/silt None Moderate: moss Light yellow None None None Clear Dry
11/16/2011 Sand None None Clear None Very sparse None Clear Dry
2/22/2012 Sand/Mud None Dense: brown filamentous Light yellow None None None Clear Dry
4/11/2012 Unobservable None Dense: silt-covered filamentous Clear Effluent None None Clear Dry
6/20/2012 Cobble/gravel/sand/silt None None Light yellow Musty, slight None None Moderate Dry
8/22/2012 Cobble/gravel/sand/silt Minor: beer can None Clear Musty, slight None None Clear Dry
10/24/2012 Sand None
Very dense: dark green filamentous; moderate brown film Clear None None None Clear Dry
1/28/2013 Sand None None Clear None None None Clear Dry
3/20/2013 Sand None None Clear None None None Clear Wet
5/20/2013 Unobservable Unobservable Unobservable; dense clear film on rocks where visible Light yellow Musty, slight None None Clear Dry
8/28/2013 Boulder/sand/silt None Moderate: moss Clear None None None Clear Dry
9/25/2013 Boulder/cobble/gravel/sand/silt None Sparse: moss Clear Musty, slight None None Clear Wet
-- : Not noted

Concord River Watershed SMART Monitoring Program 2011-2013 Technical Memorandum CN 418.0 21 1/21/2016
Table 3 MassDEP SMART 2011 - 2013. Station AS18. Summary of Observations.
Survey Dates Substrate Trash Periphyton Color Odor Foam Sheen Turbidity Wet/Dry Conditions
1/19/2011 Unobservable Unobservable Unobservable Clear Effluent, strong Sparse None Clear Wet
3/15/2011 Unobservable Unobservable
Unobservable; dark green filamentous on plants where visible Clear None Sparse None Unobservable Dry
5/17/2011 Unobservable Unobservable Unobservable Unobservable None Moderate None Unobservable Wet
7/20/2011 Unobservable Trash Dense: moss Light yellow Eutrophic pond, strong Very sparse None Unobservable Dry
9/21/2011 Boulder/cobble/gravel/sand/silt Chunks of concrete, bricks Sparse: moss Red, slight Musty Sparse Pollen Moderate Dry
11/16/2011 Unobservable Unobservable; chunks of cement (where visible) Unobservable Red Musty Sparse None Clear Dry
2/22/2012 Unobservable; dense periphyton Unobservable; luxuriant filamentous algae
Very dense; bright green filamentous, "luxuriant" Light yellow None Sparse None Clear Dry
4/11/2012 Boulder/cobble/gravel/silt Unobservable; chunks of cement (where visible)
Very dense: silt-covered filamentous, luxuriant Light yellow Eutrophic pond None None Slight Dry
6/20/2012 Boulder/cobble/gravel/sand/silt Minor: cement chunks Moderate: moss Red Musty, strong Sparse None Moderate Dry
8/22/2012 Unobservable; turbulence Unobservable Very dense: dark green filamentous Clear Eutrophic pond, strong None None Unobservable Dry
10/24/2012 Unobservable; bottom stained dark brown Unobservable Very dense: clear film Clear None None None Clear Dry
1/28/2013 Unobservable (solar reflection) Unobservable None Clear None Sparse None Clear Dry
3/20/2013 Unobservable Minor: floatables, cement chunks Moderate: bright green filamentous Clear None Sparse None Clear Wet
5/20/2013 Boulder/cobble/gravel/sand/silt Chunks of concrete
Sparse green filamentous; dense moss Unobservable None Moderate None Unobservable Dry
8/28/2013 Boulder/cobble/gravel/sand/silt; stained Chunks of concrete Dense: moss Clear Eutrophic pond None None Clear Dry
9/25/2013 Boulder/cobble/gravel/sand/silt Minor: cement chunks
Sparse: dark green filamentous; sparse moss Clear None None None Clear Wet
-- : Not noted

Concord River Watershed SMART Monitoring Program 2011-2013 Technical Memorandum CN 418.0 22 1/21/2016
Table 4 MassDEP SMART 2011 - 2013. Station NA01. Summary of Observations.
Survey Dates Substrate Trash Periphyton Color Odor Foam Sheen Turbidity Wet/Dry Conditions
1/19/2011 Unobservable None None Clear None None None Clear Wet
3/15/2011 Cobble/sand None Dense, moss Red Petroleum Very sparse None Clear Dry
5/17/2011 Unobservable Unobservable Unobservable Red None Sparse None Unobservable Wet
7/20/2011 Boulder/cobble/gravel/sand/silt None Moderate: moss Red Petroleum None None Slight Dry
9/21/2011 Unobservable None Sparse: moss Red, deep Petroleum (sediment release) None None Slight Dry
11/16/2011 Unobservable; bottom stained black None Sparse: moss Red None None None Clear Dry
2/22/2012 Cobble/gravel/sand None None Red None None None Clear Dry
4/11/2012 Boulder/cobble/gravel/sand/silt None None Red None Sparse None Clear Dry
6/20/2012 Unobservable Unobservable Unobservable Red, deep Petroleum, strong None Pollen Moderate Dry
8/22/2012 Unobservable Unobservable Unobservable Red, deep Musty, slight Sparse None Unobservable Dry
10/24/2012 Unobservable; bottom stained None None Red Petroleum (sediment release) None None Clear Dry
1/28/2013 Unobservable Unobservable Unobservable Red None None None Clear Dry
3/20/2013 Boulder/cobble/gravel/sand/silt None Moderate: moss Red None Sparse None Clear Wet
5/20/2013 Unobservable None Sparse: moss Red Musty, slight None Pollen, slight Clear Dry
8/28/2013 Unobservable Unobservable Unobservable Red Musty, slight None None Slight Dry
9/25/2013 Unobservable Unobservable Unobservable Red None None None Clear Wet
-- : Not noted

Concord River Watershed SMART Monitoring Program 2011-2013 Technical Memorandum CN 418.0 23 1/21/2016
Table 5 MassDEP SMART 2011 - 2013. Station SU07. Summary of Observations.
Survey Dates Substrate Trash Periphyton Color Odor Foam Sheen Turbidity Wet/Dry Conditions
1/19/2011 Cobble/grand/sand Moderate: metals, broken glass None Clear None None None Clear Wet
3/15/2011 Cobble/gravel/sand Moderate None Light yellow None Sparse None Clear Dry
5/17/2011 Unobservable Moderate: broken "junk" None Brown Musty None None Moderate Wet
7/20/2011 Cobble/gravel/sand/silt Moderate: miscellaneous unidentifiable items, catch basin grate None Light yellow None Sparse None Clear Dry
9/21/2011 Cobble/gravel/sand Moderate: broken glass, metals, miscellaneous, bricks None Light yellow Musty None None Slight Dry
11/16/2011 Cobble/gravel/sand Minor: floatables, metals, miscellaneous unidentifiable objects None Red, slight None None None Clear Dry
2/22/2012 Unobservable Unobservable; broken glass, storm drain grate where visible Unobservable Light yellow None None None Unobservable Dry
4/11/2012 Boulder/cobble/gravel/sand/silt Moderate: broken glass, metals, floatables, unknown Very dense: moss Clear Fishy - intermittent None None Clear Dry
6/20/2012 Cobble/gravel/sand Moderate: broken glass, metals, miscellaneous unidentifiable objects Sparse: moss
Red, slight/light yellow, slight None None None Slight Dry
8/22/2012 Boulder/cobble/gravel/sand/silt; embedded
Moderate: broken glass, metals, miscellaneous Sparse: moss Clear Musty Sparse None Clear Dry
10/24/2012 Cobble/gravel/sand Moderate: broken metals, miscellaneous, bricks
Moderate: dark green filamentous; sparse clear film Light yellow None None None Clear Dry
1/28/2013 Cobble/gravel/sand/silt Moderate: metals, miscellaneous None Clear None None None Clear Dry
3/20/2013 Unobservable
Unobservable; moderate miscellaneous broken unidentifiable items where visible
Unobservable; none where visible Clear None None None Clear Wet
5/20/2013 Boulder/cobble/gravel/sand/silt Moderate: miscellaneous pieces Dense: green filamentous Clear None None None Clear Dry
8/28/2013 Boulder/cobble/gravel/sand Minor: trash, most high and dry Very dense: brown filamentous Clear None None None Clear Dry
9/25/2013 Boulder/cobble/gravel/sand/silt Moderate: miscellaneous unidentifiable objects - most on banks
Sparse: green filamentous Clear None None None Clear Wet
-- : Not noted
Concord River Watershed SMART Monitoring Program 2011-2013 Technical Memorandum CN 418.0 24 1/21/2016
Table 6 MassDEP SMART 2011 - 2013. Station CO7A. Summary of Observations.
Survey Dates Substrate Trash Periphyton Color Odor Foam Sheen Turbidity Wet/Dry Conditions
1/19/2011 (CO7A) Station not sampled; access/time issues
3/15/2011 Unobservable Unobservable Unobservable Light yellow None Moderate None Unobservable Dry
5/17/2011 Unobservable Unobservable Unobservable Light yellow None Sparse None Unobservable Wet
7/20/2011 Boulder/cobble/gravel/sand/silt Moderate: tires, shopping cart, unidentifiable "stuff", floatables
Moderate: moss, covered in silt Red/light yellow Eutrophic pond, strong Moderate None Moderate Dry
9/21/2011 Unobservable Minor: unidentifiable items Sparse: moss Red Musty Moderate None Slight Dry
11/16/2011 Unobservable Unobservable Unobservable Red None Very sparse None Unobservable Dry
2/22/2012 Unobservable Unobservable
Unobservable; dense brown filamentous where visible Light yellow None None None Unobservable Dry
4/11/2012 Unobservable Unobservable Very dense olive green filamentous Red, slight Eutrophic pond None None Moderate Dry
6/20/2012 Unobservable Unobservable Unobservable Brown/red None None None Highly murky Dry
8/22/2012 Unobservable Unobservable Unobservable Rusty Fishy, eutrophic pond None None Highly murky Dry
10/24/2012 Unobservable (solar reflection) Unobservable; broken pieces of "unidentifiable stuff" where visible None Light yellow None None None Clear Dry
1/28/2013 Boulder/cobble/gravel/sand/silt Moderate: floatables, metals, scooter, miscellaneous
Moderate: tan filamentous Clear None None None Clear Dry
3/20/2013 Unobservable Unobservable Unobservable Unobservable None Sparse None Unobservable Wet
5/20/2013 Unobservable Unobservable; scooter where visible Unobservable Light yellow None None Pollen Moderate Dry
8/28/2013 Boulder/coble/gravel/sand/silt Moderate; covered in silt Dense: brown filamentous Red Musty, slight None Pollen Slight Dry
9/25/2013 Unobservable Moderate: miscellaneous unidentifiable objects
Very dense: brown filamentous Brown Musty, slight
Very sparse None Moderate Wet
-- : Not noted
Concord River Watershed SMART Monitoring Program 2011-2013 Technical Memorandum CN 418.0 25 1/21/2016
SURVEY CONDITIONS Stream discharge and precipitation data are used to determine hydrologic conditions and, consequently, if water quality surveys should be described as dry or wet weather events. Precipitation data were obtained from the National Oceanic and Atmospheric Administration (NOAA). The presence/absence of precipitation during the five days prior to each sampling event was based on the National Weather Service (NWS) data located on their website NOAA Climatological Data Publications (NOAA 2015). The weather stations closest to the Concord watershed are in Lowell, Reading and Worcester. Reading has the save average annual precipitation as most of the basin, while Worcester receives a greater volume and Lowell a smaller volume. Therefore, climatological data collected at Reading were utilized in this report. Overall, precipitation varies little across the watershed, which receives an average of 44 to 46 inches/year (in/yr) (Ostiguy et al 2010). The northern area, including Chelmsford, Lowell, and the northern sections of Westford and Billerica, receives 42 to 44 in/yr, while the southwest area, including portions of the towns of Bolton, Berlin, Northborough and Westborough, receives 46 to 48 in/yr. During dry weather, trace amounts of precipitation may fall, but there is no measurable change in stream flow. The USGS operates five real time stream gaging stations in the Concord River Watershed near SMART stations:
Assabet River at Maynard, MA (7/11/1941 to current)(USGS 2015a); Nashoba Brook near Acton, MA (7/26/1963 to current)(USGS 2015b); Sudbury River at Saxonville, MA (11/1/1979 to current) (USGS 2015c); and Concord River below River Meadow Brook at Lowell, MA (12/16/1936 to current)(USGS 2015d).
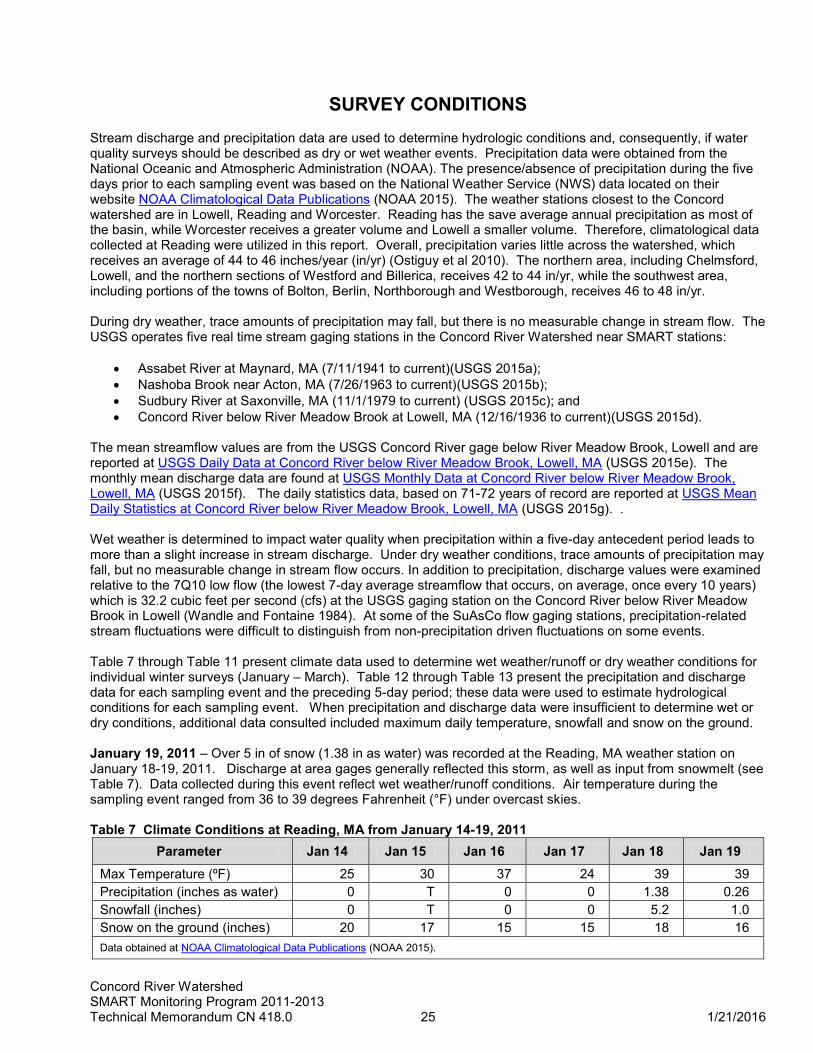
The mean streamflow values are from the USGS Concord River gage below River Meadow Brook, Lowell and are reported at USGS Daily Data at Concord River below River Meadow Brook, Lowell, MA (USGS 2015e). The monthly mean discharge data are found at USGS Monthly Data at Concord River below River Meadow Brook, Lowell, MA (USGS 2015f). The daily statistics data, based on 71-72 years of record are reported at USGS Mean Daily Statistics at Concord River below River Meadow Brook, Lowell, MA (USGS 2015g). . Wet weather is determined to impact water quality when precipitation within a five-day antecedent period leads to more than a slight increase in stream discharge. Under dry weather conditions, trace amounts of precipitation may fall, but no measurable change in stream flow occurs. In addition to precipitation, discharge values were examined relative to the 7Q10 low flow (the lowest 7-day average streamflow that occurs, on average, once every 10 years) which is 32.2 cubic feet per second (cfs) at the USGS gaging station on the Concord River below River Meadow Brook in Lowell (Wandle and Fontaine 1984). At some of the SuAsCo flow gaging stations, precipitation-related stream fluctuations were difficult to distinguish from non-precipitation driven fluctuations on some events. Table 7 through Table 11 present climate data used to determine wet weather/runoff or dry weather conditions for individual winter surveys (January – March). Table 12 through Table 13 present the precipitation and discharge data for each sampling event and the preceding 5-day period; these data were used to estimate hydrological conditions for each sampling event. When precipitation and discharge data were insufficient to determine wet or dry conditions, additional data consulted included maximum daily temperature, snowfall and snow on the ground. January 19, 2011 – Over 5 in of snow (1.38 in as water) was recorded at the Reading, MA weather station on January 18-19, 2011. Discharge at area gages generally reflected this storm, as well as input from snowmelt (see Table 7). Data collected during this event reflect wet weather/runoff conditions. Air temperature during the sampling event ranged from 36 to 39 degrees Fahrenheit (°F) under overcast skies. Table 7 Climate Conditions at Reading, MA from January 14-19, 2011
Parameter Jan 14 Jan 15 Jan 16 Jan 17 Jan 18 Jan 19 Max Temperature (ºF) 25 30 37 24 39 39 Precipitation (inches as water) 0 T 0 0 1.38 0.26 Snowfall (inches) 0 T 0 0 5.2 1.0 Snow on the ground (inches) 20 17 15 15 18 16 Data obtained at NOAA Climatological Data Publications (NOAA 2015).
Concord River Watershed SMART Monitoring Program 2011-2013 Technical Memorandum CN 418.0 26 1/21/2016
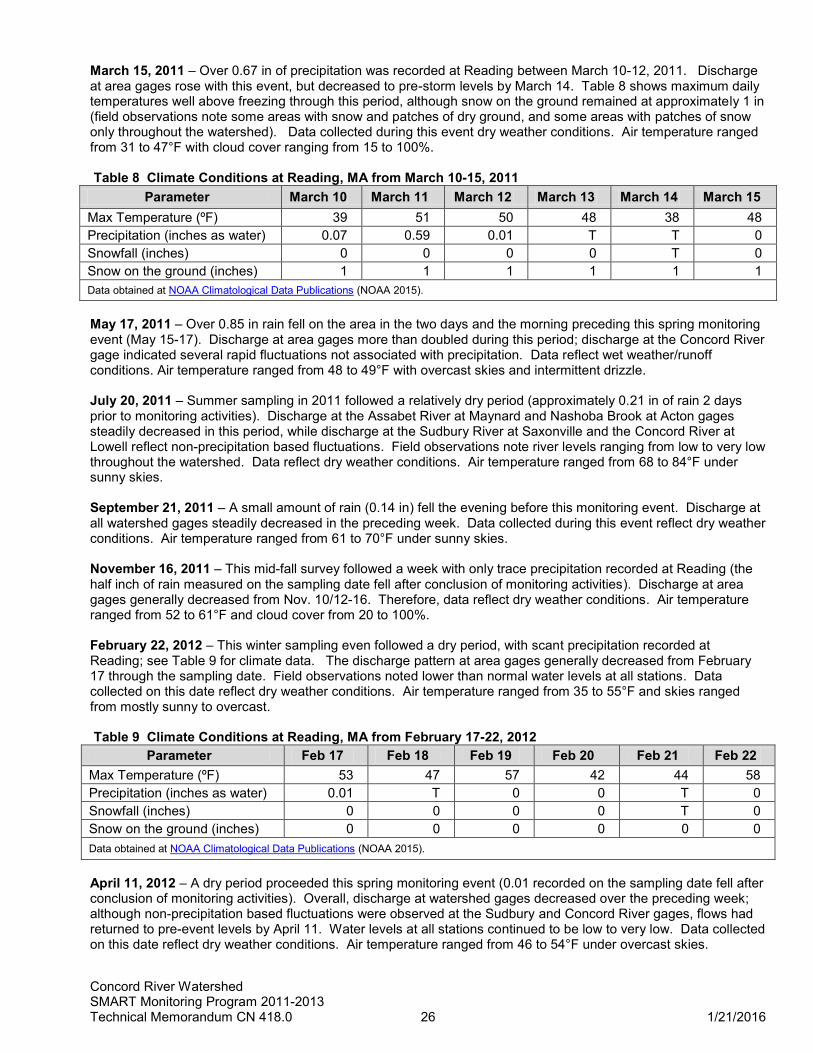
March 15, 2011 – Over 0.67 in of precipitation was recorded at Reading between March 10-12, 2011. Discharge at area gages rose with this event, but decreased to pre-storm levels by March 14. Table 8 shows maximum daily temperatures well above freezing through this period, although snow on the ground remained at approximately 1 in (field observations note some areas with snow and patches of dry ground, and some areas with patches of snow only throughout the watershed). Data collected during this event dry weather conditions. Air temperature ranged from 31 to 47°F with cloud cover ranging from 15 to 100%. Table 8 Climate Conditions at Reading, MA from March 10-15, 2011
Parameter March 10 March 11 March 12 March 13 March 14 March 15 Max Temperature (ºF) 39 51 50 48 38 48 Precipitation (inches as water) 0.07 0.59 0.01 T T 0 Snowfall (inches) 0 0 0 0 T 0 Snow on the ground (inches) 1 1 1 1 1 1 Data obtained at NOAA Climatological Data Publications (NOAA 2015).
May 17, 2011 – Over 0.85 in rain fell on the area in the two days and the morning preceding this spring monitoring event (May 15-17). Discharge at area gages more than doubled during this period; discharge at the Concord River gage indicated several rapid fluctuations not associated with precipitation. Data reflect wet weather/runoff conditions. Air temperature ranged from 48 to 49°F with overcast skies and intermittent drizzle. July 20, 2011 – Summer sampling in 2011 followed a relatively dry period (approximately 0.21 in of rain 2 days prior to monitoring activities). Discharge at the Assabet River at Maynard and Nashoba Brook at Acton gages steadily decreased in this period, while discharge at the Sudbury River at Saxonville and the Concord River at Lowell reflect non-precipitation based fluctuations. Field observations note river levels ranging from low to very low throughout the watershed. Data reflect dry weather conditions. Air temperature ranged from 68 to 84°F under sunny skies. September 21, 2011 – A small amount of rain (0.14 in) fell the evening before this monitoring event. Discharge at all watershed gages steadily decreased in the preceding week. Data collected during this event reflect dry weather conditions. Air temperature ranged from 61 to 70°F under sunny skies. November 16, 2011 – This mid-fall survey followed a week with only trace precipitation recorded at Reading (the half inch of rain measured on the sampling date fell after conclusion of monitoring activities). Discharge at area gages generally decreased from Nov. 10/12-16. Therefore, data reflect dry weather conditions. Air temperature ranged from 52 to 61°F and cloud cover from 20 to 100%. February 22, 2012 – This winter sampling even followed a dry period, with scant precipitation recorded at Reading; see Table 9 for climate data. The discharge pattern at area gages generally decreased from February 17 through the sampling date. Field observations noted lower than normal water levels at all stations. Data collected on this date reflect dry weather conditions. Air temperature ranged from 35 to 55°F and skies ranged from mostly sunny to overcast. Table 9 Climate Conditions at Reading, MA from February 17-22, 2012
Parameter Feb 17 Feb 18 Feb 19 Feb 20 Feb 21 Feb 22 Max Temperature (ºF) 53 47 57 42 44 58 Precipitation (inches as water) 0.01 T 0 0 T 0 Snowfall (inches) 0 0 0 0 T 0 Snow on the ground (inches) 0 0 0 0 0 0 Data obtained at NOAA Climatological Data Publications (NOAA 2015).
April 11, 2012 – A dry period proceeded this spring monitoring event (0.01 recorded on the sampling date fell after conclusion of monitoring activities). Overall, discharge at watershed gages decreased over the preceding week; although non-precipitation based fluctuations were observed at the Sudbury and Concord River gages, flows had returned to pre-event levels by April 11. Water levels at all stations continued to be low to very low. Data collected on this date reflect dry weather conditions. Air temperature ranged from 46 to 54°F under overcast skies.

Concord River Watershed SMART Monitoring Program 2011-2013 Technical Memorandum CN 418.0 27 1/21/2016
June 20, 2012 – This late spring monitoring event followed a dry period, with no precipitation recorded at Reading in the preceding five days. Overall, discharge at area gages rose decreased steadily from June 14-20. Water levels at all stations continued to be lower than normal. Data collected during this event reflect dry weather conditions. Air temperature ranged from 74 to 90°F under clear skies. August 22, 2012 –A storm brought 0.26 in to the area on August 17-18, followed by 4 days without measurable precipitation at Reading. Discharge at area gages generally reflected the precipitation pattern. Low to very low water levels were observed at all stations. Data reflect dry weather conditions. Air temperature ranged from 63 to 78°F under sunny skies. October 24, 2012 – Over an inch of rain fell on the area on October 19-20, 2012 with no precipitation recorded at Reading from October 21-24. In general, discharge at area gages peaked on October 20-21, then decreased through monitoring activities to pre-storm levels. Data reflect dry weather conditions. Air temperature ranged from 52 to 57°F under overcast skies. January 28, 2013 – Little precipitation was noted in the area in the five days preceding this winter monitoring event (1.2 in snow recorded on the sampling date fell after monitoring activities had concluded) (see Table 10). Discharge at area gages generally decreased throughout the week preceding this monitoring event. At stations throughout the watershed, water levels were lower than normal. Bare ground with patches of snow was noted throughout the watershed. Data collected during this event reflect dry weather conditions. Air temperature ranged from 25 to 30°F under overcast skies. Table 10 Climate Conditions at Reading, MA from January 23-28, 2013
Parameter Jan 23 Jan 24 Jan 25 Jan 26 Jan 27 Jan 28 Max Temperature (ºF) 17 19 24 25 30 30 Precipitation (inches as water) 0 0 T 0.01 0 0.15 Snowfall (inches) 0 0 T 0.1 0 1.2 Snow on the ground (inches) T 0 T 0 0 1 Data obtained at NOAA Climatological Data Publications (NOAA 2015).
March 20, 2013 – A late winter storm brought 13 inches of snow to the area from March 18-19, 2013 (2.01 in as water); see Table 11 for climate data from March 15-20, 2015. The discharge pattern varied at area gages. At the Assabet River, Maynard, flow decreased steadily from March 14-18, then remained at that level through March 20. At the Nashoba Brook, Acton and the Sudbury River, Saxonville, flow also decreased through March 18, then increased through March 20. Mean daily discharge at the Concord River gage varied little over the week prior this sampling event. Table 8 shows maximum daily temperatures above freezing through this period, and snow on the ground decreased 3 in from March 19-20. Field observations note that water levels at area stations were normal to high, up from low in January. Data collected during this event wet weather/runoff conditions. Air temperature ranged from 30 to 42°F and cloud cover from 0 to 70%. Table 11 Climate Conditions at Reading, MA from March 15-20, 2013
Parameter March 15 March 16 March 17 March 18 March 19 March 20 Max Temperature (ºF) 39 39 39 38 34 37 Precipitation (inches as water) 0 0 0 0.08 1.33 0 Snowfall (inches) 0 0 0 0.8 12.2 0 Snow on the ground (inches) T T 0 1 9 6 Data obtained at NOAA Climatological Data Publications (NOAA 2015). May 20, 2013 – A small storm brought 0.17 in rain to the area from May 19-20, 2013; however, discharge did not rise with precipitation. The water level at all stations had returned to lower than normal. Data collected on this date reflect dry weather conditions. Air temperature ranged from 60 to 70°F and skies from 10 to 100% cloud cover. August 28, 2013 – Minimal precipitation fell in the area in the 5-day preceding this summer monitoring event (0.01 in). The discharge pattern varied between watershed gages from August 23-28. Discharge at the Assabet River gages (Hudson, Maynard) rose from August 27-28; fell at the Nashoba Brook (Acton) and Concord River (Lowell);

Concord River Watershed SMART Monitoring Program 2011-2013 Technical Memorandum CN 418.0 28 1/21/2016
and varied little at the Sudbury River (Saxonville). Water levels at all stations remained at lower than normal. Based on precipitation, discharge at Nashoba Brook and the Concord River, and consistently low water levels throughout the watershed, data collected on this date reflect dry weather conditions. Air temperature ranged from 68 to 82°F under sunny to mostly sunny skies. September 25, 2013 – A storm brought 0.74 in rain to the area 3 days before this early fall monitoring event (9/22/2013). Discharge at most watershed gages rose with the precipitation input, then decreased but not to pre-storm levels before the survey. Data collected during this event reflect wet weather/runoff conditions. Air temperature ranged from 50 to 60°F under sunny to mostly sunny skies.

Concord River Watershed SMART Monitoring Program 2011-2013 Technical Memorandum CN 418.0 29 1/21/2016
Table 12 SuAsCo Basin Precipitation Data Summary 2011-2013
Survey Dates 5 Days Prior *
4 Days Prior
3 Days Prior
2 Days Prior
1 Day Prior**
Sample Date
Wet/Dry Conditions***
1/19/2011 0 T 0 0 1.38 0.26 Wet 3/15/2011 0.07 0.59 0.01 T T 0 Dry 5/17/2011 0 0 T 0.55 0.21 0.09 Wet 7/20/2011 0 0 0 0.21 0 0 Dry 9/21/2011 0.04 0 0 0 0 0.14 Dry
11/16/2011 T 0 0 0 T 0.51 Dry
2/22/2012 0.01 T 0 0 T 0 Dry 4/11/2012 0 0 T 0 0 0.01 Dry 6/20/2012 0 0 0 0 0 0 Dry 8/22/2012 0.12 0.14 0 0 T 0 Dry
10/24/2012 0.14 0.97 0 0 0 0 Dry
1/28/2013 0 0 T 0.01 0 0.15 Dry 3/20/2013 0 0 0 0.08 1.33 0 Wet 5/20/2013 T 0 0 0 0.14 0.03 Dry 8/28/2013 0 0 0 0.01 T 0 Dry 9/25/2013 0 0 0.74 0 0 0 Wet
*Unofficial data from the National Weather Service station in Reading, MA and reported at NOAA Climatological Data Publications (NOAA 2015); all data in inches of water. **T= trace amount *** Based on precipitation, streamflow and other relevant data.
Table 13 Discharge at the Concord River below River Meadow Brook, Lowell, MA 2011-2013
Survey Dates 5 Days Prior 4 Days Prior
3 Days Prior
2 Days Prior
1 Day Prior
Sample Date
Monthly Mean
POR*** Mean
1/19/2011 374 412 394 359 339 374 421.6 683 3/15/2011 2,830 3,000 3,110 3,120 3,090 3,000 2,229 1,180 5/17/2011 706 678 646 652 700 773 859.7 858 7/20/2011 190 176 155 144 113 163 283.1 221 9/21/2011 1,300 1,170 1,060 957 878 806 1,150 265
11/16/2011 1,120 1,130 1,120 1,090 1,040 1,000 1,196 556 2/22/2012 587 585 587 589 585 577 758.0 859 4/11/2012 363 349 341 335 329 299 499.0 1,450 6/20/2012 517 487 450 385 340 300 454.4 513 8/22/2012 416 475 452 419 399 334 208.9 267
10/24/2012 207 325 377 370 336 297 264.4 402 1/28/2013 546 506 423 380 333 310 613.7 895 3/20/2013 1,980 2,000 1,970 1,920 1,880 1,850 1,665 1,340 5/20/2013 421 394 352 327 287 266 396.7 831 8/28/2013 99 95 89 87 81 80 240.3 225 9/25/2013 137 120 136 134 137 128 156.4 293
*Gage # 01099500 data found at Daily Data for the Concord River below River Meadow Brook, Lowell, MA; all data approved for publication (USGS 2015e). **Daily statistics based on mean values of the point of record from 10/1/1936 – 9/30/2008 (USGS 2015g). 7Q10 = 32.2 cfs @ USGS gaging station, Concord River below River Meadow Brook at Lowell, MA (Wandle and Fontaine 1984).

Concord River Watershed SMART Monitoring Program 2011-2013 Technical Memorandum CN 418.0 30 1/21/2016
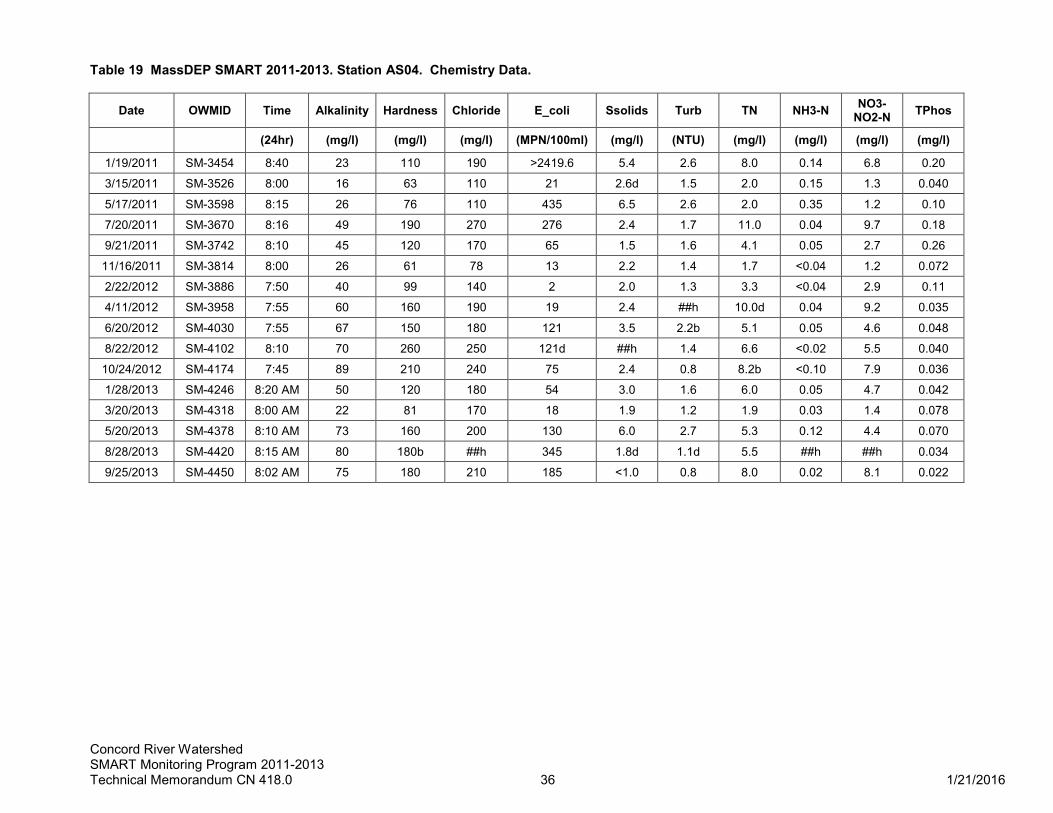
RESULTS AND QUALITY ASSURANCE/QUALITY CONTROL The results of SMART monitoring conducted in the SuAsCo watershed from 2011 through 2013 are included below. Table 14 through Table 18 present in-situ multiprobe readings, including temperature, pH, dissolved oxygen, percent oxygen saturation, depth, specific conductivity, and total dissolved solids. Table 19 through Table 23 contain nutrient (ammonia-nitrogen, nitrate-nitrite nitrogen, total nitrogen and total phosphorus), chlorides, hardness, total alkalinity, total suspended solids and turbidity data. Most results are expressed as milligrams per liter (mg/L). Exceptions include: depth in meters (m); temperature in degrees Celsius (ºC); pH in Standard Units (SU); conductivity in microsiemens per centimeter (μS/cm); dissolved oxygen saturation in percent (%); and turbidity, in Nephelometric Turbidity Units (NTU). Field sheets, field notebooks, chain of custody forms, raw and electronic data files, lab reports and other metadata are maintained by DWM. Detailed information regarding the data validation process is explained in the separate document, CN 56.2. Standard Operating Procedure. Data Validation and Usability (MassDEP 2005). Specific validation criteria used for 2011-2013 data include, but are not limited to conformance to the SMART Monitoring Quality Assurance Project Plan (Beaudoin 2008) and with DWM standard operating procedures (SOPs), precision, accuracy, representativeness, holding times, sample preservation, frequency of field QC samples, contamination of field blanks, stability of multiprobe readings and documentation. The following data qualifiers were applied as needed: Multiprobe data qualifiers: ** = Missing data. -- = No data. ## = Censored data (data that have been discarded for some reason). c = Greater than calibration standard used for pre-calibration, or outside the acceptable range about the calibration
standard. i = Inaccurate readings from multiprobe likely. m = Method not followed; one or more protocols contained in the DWM Multi-probe SOP not followed. r = Data not representative of actual field conditions. s = Field sheet recorded data were used to accept data, not data electronically recorded in the Multi-probe surveyor
unit, due to operator error or equipment failure. u = Unstable readings. Laboratory sample data qualifiers: ** = Missing data. -- = No data. ## = Censored data (data that have been discarded for some reason). [ ] = A result reported inside brackets has been censored, but is shown for informational purposes. b = Blank contamination in lab reagent blanks and/or field blank samples. d = Precision of field duplicates (as RPD) did not meet project data quality objectives identified for program or in QAPP. e = Not theoretically possible. Specifically, used for bacteria data where colonies per unit volume for E. coli bacteria is
greater than fecal coliform bacteria. h = Holding time violation (usually indicating possible bias low). j = ‘Estimated’ value; used for lab-related issues where certain lab QC criteria are not met and re-testing is not
possible (as identified by the WES lab only). Also used to report sample data where the sample concentration is less than the reporting detection limit (RDL) and greater than the method detection limit (MDL) (RDL > x > MDL). Also used to note where values have been reported at levels less than the MDL.
m = Method SOP not followed, only partially implemented or not implemented at all, due to complications with sample matrix (e.g. sediment in sample, floc formation), lab error (e.g. cross-contamination between samples), additional steps taken by the lab to deal with matrix complications, lost/unanalyzed samples, and missing data.

Concord River Watershed SMART Monitoring Program 2011-2013 Technical Memorandum CN 418.0 31 1/21/2016
Table 14 MassDEP SMART 2011-2013. Station AS04. In Situ Multiprobe Data.
Date OWMID Time Depth Temp pH Cond@ 25C TDS DO SAT
(24hr) (m) (C) (SU) (us/cm) (mg/l) (mg/l) (%)
1/19/2011 SM-3456 8:50 AM 0.3 3.1 6.6 777 505 11.9 89
3/15/2011 SM-3528 8:14 AM 0.7 3.1 6.5 458 298 12.1 90
5/17/2011 SM-3600 8:26 AM 0.3 12.6 6.7 436 283 ##i ##i
7/20/2011 SM-3672 8:27 AM 0.2 21.4 7.0 1110 721 6.1 69
9/21/2011 SM-3743 8:15 AM 0.4 15.9 7.0 679 441 7.8 79
11/16/2011 SM-3815 8:07 AM 0.7 10.7 6.9 370 240 10.0 90
2/22/2012 SM-3887 8:12 AM 0.6 4.7 7.0 606 394 11.0 86
4/11/2012 SM-3959 8:04 AM ##i 10.8 7.0 894 581 8.7i 79i
6/20/2012 SM-4031 8:02 AM ##i 19.0 7.0 810 527 6.5 70
8/22/2012 SM-4103 8:22 AM ##i 20.5 7.1 1246 810 5.6i 63i
10/24/2012 SM-4175 7:58 AM ##i 14.5 7.1 1050 682 5.9 58
1/28/2013 SM-4248 8:43 AM 0.0i 2.1 6.9 795 517 11.3i 82i
3/20/2013 SM-4319 8:11 AM 0.0i 1.9 6.8 655 426 12.8i 92i
5/20/2013 SM-4379 8:10 AM ##i 16.1 7.3 902 586 8.1 82
8/28/2013 SM-4421 8:22 AM 0.0i 20.8 7.3 1047 681 6.8 76
9/25/2013 SM-4451 8:11 AM 0.0i 15.0 7.1 999 649 8.0 80

Concord River Watershed SMART Monitoring Program 2011-2013 Technical Memorandum CN 418.0 32 1/21/2016
Table 15 MassDEP SMART 2011-2013. Station AS18. In Situ Multiprobe Data.
Date OWMID Time Depth Temp pH Cond@ 25C TDS DO SAT
(24hr) (m) (C) (SU) (us/cm) (mg/l) (mg/l) (%)
1/19/2011 SM-3460 10:51 AM 0.3 0.3 6.9 675 439 14.9 103
3/15/2011 SM-3532 10:21 AM 0.6 3.2 6.6 367 239 14.1 106
5/17/2011 SM-3604 10:45 AM 0.3 13.1 6.9 426 277 ##i ##i
7/20/2011 SM-3676 10:13 AM 0.2 25.6 7.6 641 417 7.4 91
9/21/2011 SM-3748 10:04 AM 0.3 16.4 7.2 438 285 9.7 100
11/16/2011 SM-3820 10:03 AM 0.5 10.6 7.1 332u 215u 11.6 104
2/22/2012 SM-3892 10:15 AM 0.3 4.3 7.6 409 266 14.1 108
4/11/2012 SM-3964 10:01 AM ##i 11.1 8.0 495 322 12.7i 116i
6/20/2012 SM-4036 9:46 AM ##i 22.3 7.5 423 275 8.6 99
8/22/2012 SM-4108 10:10 AM ##i 23.6 7.5 452 293 8.0i 95i
10/24/2012 SM-4180 9:52 AM ##i 12.9 7.4 605 393 9.9 93
1/28/2013 SM-4252 10:29 AM 0.0i 0.6 7.3 579 376 14.7i 103i
3/20/2013 SM-4324 10:21 AM 0.0i 1.4 7.0 463 301 14.1i 100i
5/20/2013 SM-4384 10:02 AM ##i 18.8 7.5 547 355 9.7 104
8/28/2013 SM-4426 10:12 AM ##i 23.5 7.9 671 436 8.0 95
9/25/2013 SM-4456 9:58 AM 0.0i 16.5 7.5 673 438 9.5 97

Concord River Watershed SMART Monitoring Program 2011-2013 Technical Memorandum CN 418.0 33 1/21/2016
Table 16 MassDEP SMART 2011-2013. Station NA01. In Situ Multiprobe Data.
Date OWMID Time Depth Temp pH Cond@ 25C TDS DO SAT
(24hr) (m) (C) (SU) (us/cm) (mg/l) (mg/l) (%)
1/19/2011 SM-3462 11:33 AM 0.3 0.1 6.4 507 330 12.1 83
3/15/2011 SM-3534 10:56 AM 0.8 1.2 6.4 383 249 14.1 100
5/17/2011 SM-3606 11:26 AM 0.5 11.0 6.5 426 277 ##i ##i
7/20/2011 SM-3678 10:50 AM 0.4 22.7 6.8 536 349 6.0 70
9/21/2011 SM-3750 10:38 AM 0.5 13.8 6.7 487 317 8.5 83
11/16/2011 SM-3822 10:44 AM 0.6 10.9 6.7 383 249 9.7 88
2/22/2012 SM-3894 11:08 AM 0.4 2.8 6.9 413 269 12.5 93
4/11/2012 SM-3966 10:40 AM ##i 10.0 7.0 425 276 11.7i 104i
6/20/2012 SM-4038 10:23 AM ##i 19.6 6.8 416 271 7.4 81
8/22/2012 SM-4110 11:00 AM ##i 20.7 6.8 537 349 6.6i 74i
10/24/2012 SM-4182 10:26 AM ##i 11.2 6.6 528 343 8.6 79
1/28/2013 SM-4254 11:18 AM 0.0i 0.3 6.6 613 399 12.2i 84i
3/20/2013 SM-4326 11:10 AM 0.0i 0.4 6.6 516 335 13.1i 91i
5/20/2013 SM-4386 10:40 AM 0.0i 16.5 6.8 577 375 8.6 88
8/28/2013 SM-4428 10:54 AM ##i 21.0 6.9 387 251 7.3 82
9/25/2013 SM-4458 10:34 AM 0.0i 13.2 6.7 531 345 9.0 86

Concord River Watershed SMART Monitoring Program 2011-2013 Technical Memorandum CN 418.0 34 1/21/2016
Table 17 MassDEP SMART 2011-2013. Station SU07. In Situ Multiprobe Data.
Date OWMID Time Depth Temp pH Cond@ 25C TDS DO SAT
(24hr) (m) (C) (SU) (us/cm) (mg/l) (mg/l) (%)
1/19/2011 SM-3458 10:01 AM 0.2 0.6 7.1 684u 444u 14.7 103
3/15/2011 SM-3530 9:41 AM 1.1 3.3 6.8 472 307 14.8 111
5/17/2011 SM-3602 9:48 AM 0.3 13.7 6.9 465 302 ##i ##i
7/20/2011 SM-3674 9:26 AM 0.5 25.6 7.2 458 298 7.9 97
9/21/2011 SM-3745 9:25 AM 0.4 17.8 7.2 382 248 9.6 101
11/16/2011 SM-3817 9:18 AM 0.3 10.6 7.1 381 248 11.9 107
2/22/2012 SM-3889 9:19 AM 0.4 4.0 7.3 387 251 13.4 102
4/11/2012 SM-3961 9:11 AM ##i 11.1 7.3 443 288 11.7i 106ii
6/20/2012 SM-4033 9:00 AM ##i 21.0 7.2 473 308 8.4 95
8/22/2012 SM-4105 9:22 AM ##i 22.6 7.2 442 287 8.2i 95i
10/24/2012 SM-4177 9:05 AM ##i 13.2 7.2 433 282 10.2 97
1/28/2013 SM-4250 9:48 AM 0.0i 0.8 7.2 508 330 14.1i 99i
3/20/2013 SM-4321 9:29 AM 0.0i 2.0 7.1 698 454 14.1i 102i
5/20/2013 SM-4381 9:17 AM ##i 18.2 7.2 610 396 9.7 103
8/28/2013 SM-4423 9:26 AM ##i 21.7 7.3 595 387 8.1 92
9/25/2013 SM-4453 9:14 AM 0.0i 15.4 7.0 596 388 9.3 93

Concord River Watershed SMART Monitoring Program 2011-2013 Technical Memorandum CN 418.0 35 1/21/2016
Table 18 MassDEP SMART 2011-2013. Station CO7A. In Situ Multiprobe Data.
Date OWMID Time Depth Temp pH Cond@ 25C TDS DO SAT
(24hr) (m) (C) (SU) (us/cm) (mg/l) (mg/l) (%)
1/19/2011 SM-3465 12:30 PM ** ** ** ** ** ** **
3/15/2011 SM-3537 11:48 AM 0.8 2.7 6.5 382 248 14.3 106
5/17/2011 SM-3609 12:26 PM 0.3 13.7 6.8 470 305 ##i ##i
7/20/2011 SM-3681 11:47 AM 0.3 26.8 7.4 613 399 7.7 96
9/21/2011 SM-3753 11:22 AM 0.6 17.0 6.7 397 258 8.3 85
11/16/2011 SM-3825 11:30 AM 0.7 10.1 6.9 383 249 11.7 104
2/22/2012 SM-3897 12:00 PM 0.4 4.4 7.2 431 280 13.6 105
4/11/2012 SM-3969 11:20 AM ##i 11.0 7.4 480 312 12.6i 114i
6/20/2012 SM-4041 11:11 AM ##i ##m,u ##i,m,u ##i,m,u ##i,m,u ##i,m,u ##i,m,u
8/22/2012 SM-4113 12:08 PM ##i 25.1 8.4 425 276 9.6i 116i
10/24/2012 SM-4185 11:10 AM ##i 13.6 7.1 490 318 9.6 92
1/28/2013 SM-4257 11:58 AM 0.0i 0.3 7.0 564 367 14.4i 100i
3/20/2013 SM-4329 12:35 PM 0.0i 2.5 7.0 587 382 13.7i 101i
5/20/2013 SM-4389 11:25 AM 0.0i 18.6 7.2 567 368 9.5 102
8/28/2013 SM-4431 11:37 AM ##i 25.0 7.4 576 375 8.2 99
9/25/2013 SM-4461 11:30 AM 0.0i 17.6 7.5 522u 339u 9.9 103
Concord River Watershed SMART Monitoring Program 2011-2013 Technical Memorandum CN 418.0 36 1/21/2016
Table 19 MassDEP SMART 2011-2013. Station AS04. Chemistry Data.
Date OWMID Time Alkalinity Hardness Chloride E_coli Ssolids Turb TN NH3-N NO3-NO2-N TPhos
(24hr) (mg/l) (mg/l) (mg/l) (MPN/100ml) (mg/l) (NTU) (mg/l) (mg/l) (mg/l) (mg/l)
1/19/2011 SM-3454 8:40 23 110 190 >2419.6 5.4 2.6 8.0 0.14 6.8 0.20
3/15/2011 SM-3526 8:00 16 63 110 21 2.6d 1.5 2.0 0.15 1.3 0.040
5/17/2011 SM-3598 8:15 26 76 110 435 6.5 2.6 2.0 0.35 1.2 0.10
7/20/2011 SM-3670 8:16 49 190 270 276 2.4 1.7 11.0 0.04 9.7 0.18
9/21/2011 SM-3742 8:10 45 120 170 65 1.5 1.6 4.1 0.05 2.7 0.26
11/16/2011 SM-3814 8:00 26 61 78 13 2.2 1.4 1.7 <0.04 1.2 0.072
2/22/2012 SM-3886 7:50 40 99 140 2 2.0 1.3 3.3 <0.04 2.9 0.11
4/11/2012 SM-3958 7:55 60 160 190 19 2.4 ##h 10.0d 0.04 9.2 0.035
6/20/2012 SM-4030 7:55 67 150 180 121 3.5 2.2b 5.1 0.05 4.6 0.048
8/22/2012 SM-4102 8:10 70 260 250 121d ##h 1.4 6.6 <0.02 5.5 0.040
10/24/2012 SM-4174 7:45 89 210 240 75 2.4 0.8 8.2b <0.10 7.9 0.036
1/28/2013 SM-4246 8:20 AM 50 120 180 54 3.0 1.6 6.0 0.05 4.7 0.042
3/20/2013 SM-4318 8:00 AM 22 81 170 18 1.9 1.2 1.9 0.03 1.4 0.078
5/20/2013 SM-4378 8:10 AM 73 160 200 130 6.0 2.7 5.3 0.12 4.4 0.070
8/28/2013 SM-4420 8:15 AM 80 180b ##h 345 1.8d 1.1d 5.5 ##h ##h 0.034
9/25/2013 SM-4450 8:02 AM 75 180 210 185 <1.0 0.8 8.0 0.02 8.1 0.022

Concord River Watershed SMART Monitoring Program 2011-2013 Technical Memorandum CN 418.0 37 1/21/2016
Table 20 MassDEP SMART 2011-2013. Station AS18. Chemistry Data.
Date OWMID Time Alkalinity Hardness Chloride E_coli Ssolids Turb TN NH3-N NO3-NO2-N TPhos
(24hr) (mg/l) (mg/l) (mg/l) (MPN/100ml) (mg/l) (NTU) (mg/l) (mg/l) (mg/l) (mg/l)
1/19/2011 SM-3459 10:42 20 74 160 108 2.6 2.3 3.7 0.32 3.2 0.055
3/15/2011 SM-3531 10:10 9 41 90 291 1.9 1.3 1.1 0.09 0.74 0.029
5/17/2011 SM-3603 10:35 22 61 100 613 11 3.0 1.5 0.09 0.93 0.076
7/20/2011 SM-3675 10:00 41 83 160 613 6.7 3.6 1.5 0.07 0.79 0.082
9/21/2011 SM-3746 9:58 17d 60 110 178 3.1 2.0 1.6 0.04 1.1 0.062
11/16/2011 SM-3818 9:56 19 50 84 105 16 8.6d 1.3 0.02d 0.93 0.051
2/22/2012 SM-3890 10:00 22 57 94 49 1.7 1.5 1.7 <0.02 1.4 0.032
4/11/2012 SM-3962 9:44 30 67 110 488 5.7 ##h ##d 0.02 1.9 0.028d
6/20/2012 SM-4034 12:04 31 57 99 687 5.2 3.2b 1.5 0.04 0.95 0.071
8/22/2012 SM-4106 10:05 33 63 93 ##d ##h 1.6 1.2 <0.02 0.73 0.063
10/24/2012 SM-4178 9:39 48 90 140 548 1.4 1.1 2.5b 0.06 2.5 0.031
1/28/2013 SM-4251 10:20 AM 29 77 130 75 1.5 1.7 2.7 48 2.0 0.030
3/20/2013 SM-4322 10:12 AM 10d 51 120 36 1.1d 1.1 1.1 0.02 0.89 0.025
5/20/2013 SM-4382 9:57 AM 30 72 120 48 3.4d 1.8 1.8 <0.02 1.2 0.051
8/28/2013 SM-4424 10:06 AM 47 89b ##h 435 ##d ##d 1.2 0.05h ##h 0.041
9/25/2013 SM-4454 9:48 AM 48 96 160 387 <1.0 5.0 2.2 ## 1.8 0.048d

Concord River Watershed SMART Monitoring Program 2011-2013 Technical Memorandum CN 418.0 38 1/21/2016
Table 21 MassDEP SMART 2011-2013. Station NA01. Chemistry Data.
Date OWMID Time Alkalinity Hardness Chloride E_coli Ssolids Turb TN NH3-N NO3-NO2-N TPhos
(24hr) (mg/l) (mg/l) (mg/l) (MPN/100ml) (mg/l) (NTU) (mg/l) (mg/l) (mg/l) (mg/l)
1/19/2011 SM-3461 11:23 22 75 110 15 <1.0 1.6 1.9 0.80j 0.84 0.020
3/15/2011 SM-3533 10:45 8 44 94 17 <1.0 0.6 1.1 0.17 0.68 0.017
5/17/2011 SM-3605 11:18 16 54 100 461 3.2 1.9 0.94 0.13 0.22 0.044
7/20/2011 SM-3677 10:42 30 75 130 29 4.3 1.8 0.82 0.02 0.42 0.038
9/21/2011 SM-3749 10:32 25 71 130 55 2.4 1.5 1.5 0.06 0.95 0.032
11/16/2011 SM-3821 10:40 18 50 94 21 2.6 1.3 1.1 0.16 0.49 0.027
2/22/2012 SM-3893 10:50 20 56 98 9 2.0 1.7 1.4 0.47 0.73 0.021
4/11/2012 SM-3965 10:33 23 62 100 12 2.5 ##h 1.1d 0.14 0.64 0.025
6/20/2012 SM-4037 10:12 25 59 100 64 5.0 4.0b 1.4 0.10 0.76 0.065
8/22/2012 SM-4109 10:50 25 81 140 62d ##h 2.8 0.80 0.04 0.18 0.058
10/24/2012 SM-4181 10:17 20 76 140 23 2.0 1.4 0.78b 0.05 0.19 0.034
1/28/2013 SM-4253 11:15 AM 50 87 120 11 <1.0 1.7 2.0 0.63 1.1 0.021
3/20/2013 SM-4325 11:05 AM 13 57 140 5 <1.0 0.8 1.1 0.18 0.66 0.013
5/20/2013 SM-4385 10:35 AM 25 75 140 58 8.7 3.8 1.3 0.25 0.52 0.068
8/28/2013 SM-4427 10:47 AM 28 75b ##h 89 13d 4.5d 1.9 ##h ##h 0.22
9/25/2013 SM-4457 10:26 AM 21 79 130 44 24 4.0 1.4 0.04 0.57 0.13

Concord River Watershed SMART Monitoring Program 2011-2013 Technical Memorandum CN 418.0 39 1/21/2016
Table 22 MassDEP SMART 2011-2013. Station SU07. Chemistry Data.
Date OWMID Time Alkalinity Hardness Chloride E_coli Ssolids Turb TN NH3-N NO3-NO2-N TPhos
(24hr) (mg/l) (mg/l) (mg/l) (MPN/100ml) (mg/l) (NTU) (mg/l) (mg/l) (mg/l) (mg/l)
1/19/2011 SM-3457 9:54 19 61 170 91 2.0 2.0 0.75 0.06 0.44 0.016
3/15/2011 SM-3529 9:30 11 44 120 29 1.5 1.2 0.76 0.04 0.49 0.014
5/17/2011 SM-3601 9:35 17 50 120 199 18 1.9 0.67 0.07 0.26 0.027
7/20/2011 SM-3673 9:17 18 47 110 365 2.3 1.6 0.43 0.02 0.07 0.026
9/21/2011 SM-3744 9:17 16 45 110 54 2.2 1.4 0.57 0.03 0.20 0.024
11/16/2011 SM-3816 9:14 15 41 97 38 1.6 1.9 0.63 0.03 0.29 0.021
2/22/2012 SM-3888 9:05 17 45 98 4 2.8 1.4 0.70 <0.02 0.44 0.019
4/11/2012 SM-3960 9:00 19 50 110 4 2.0 ##h 0.58d 0.03 0.28 0.013
6/20/2012 SM-4032 8:52 25 53 120 45 1.9 2.0b 0.65 0.05 0.26 0.028
8/22/2012 SM-4104 9:13 24 49 110 16d ##h 1.3 0.48 0.03 0.13 0.019
10/24/2012 SM-4176 8:55 25 50 110 13 1.8 1.2 0.49b 0.02 0.14 0.018
1/28/2013 SM-4249 9:44 AM 25 61 120 30 1.5 1.6 0.86 <0.02 0.57 0.013
3/20/2013 SM-4320 9:22 AM 20 47 200 30 2.8 1.6 0.69 0.02 0.45 0.014
5/20/2013 SM-4380 9:15 AM 23 63 150 20 2.3 1.4 0.65 0.06 0.24 0.021
8/28/2013 SM-4422 9:22 AM 31 71b ** 72 4.3d 1.4d ** ** ** **
9/25/2013 SM-4452 9:05 AM 30 73 160 27 1.6 1.3 0.49 <0.02 0.21 0.013

Concord River Watershed SMART Monitoring Program 2011-2013 Technical Memorandum CN 418.0 40 1/21/2016
Table 23 MassDEP SMART 2011-2013. Station CO7A. Chemistry Data.
Date OWMID Time Alkalinity Hardness Chloride E_coli Ssolids Turb TN NH3-N NO3-NO2-N TPhos
(24hr) (mg/l) (mg/l) (mg/l) (MPN/100ml) (mg/l) (NTU) (mg/l) (mg/l) (mg/l) (mg/l)
1/19/2011 SM-3463 ** ** ** ** ** ** ** ** ** ** **
3/15/2011 SM-3535 11:37 8 39 94 45 3.5 1.6 1.0 0.06 0.67 0.028
5/17/2011 SM-3607 12:16 23 58 110 308 8.3 2.1 1.1 0.06 0.57 0.054
7/20/2011 SM-3679 11:32 33 77 140 980 11 5.1 1.6 0.04 0.93 0.076
9/21/2011 SM-3751 11:15 24 52 100 308 5.8 2.4 0.95 0.04 0.41 0.058
11/16/2011 SM-3823 11:25 20 49 92 86 3.8 1.8 0.89 0.02 0.50 0.034
2/22/2012 SM-3895 11:48 21 54 100 38 1.8 1.5 1.3 <0.02 0.99 0.029
4/11/2012 SM-3967 11:15 27 61 110 25 7.2 ##h 1.5d 0.02 1.0 0.041
6/20/2012 SM-4039 11:02 29 57 110 105 9.0 4.8b 1.3 0.04 0.64 0.072
8/22/2012 SM-4111 11:59 30 57 92 148d ##h 4.6 1.0 <0.02 0.35 0.070
10/24/2012 SM-4183 11:00 32 68 120 142 7.5 3.2 1.4b 0.03 0.99 0.044
1/28/2013 SM-4255 11:52 AM 27 71 130 57 1.2 1.4 1.7 0.03 1.3 0.034
3/20/2013 SM-4327 12:28 PM 15 50 160 20 2.3 1.4 0.82 0.04 0.52 0.021
5/20/2013 SM-4387 11:18 AM 30 71 130 99 7.3 1.7 1.4 0.09 0.78 0.056
8/28/2013 SM-4429 11:34 AM 32 71b ##h 613 4.4d 2.4d 1.4 ##h ##h 0.039
9/25/2013 SM-4459 11:25 AM 33 75 130 115 18 6.6 1.7 0.05 1.1 0.065

Concord River Watershed SMART Monitoring Program 2011-2013 Technical Memorandum CN 418.0 41 1/21/2016
REFERENCES Beaudoin, T. 2008 (unpublished). CN 012.1: Strategic Monitoring and Assessment for River basin Teams Quality Assurance Project Plan. 2008-2012. Massachusetts Department of Environmental Protection. Central Regional Office. Worcester, MA. Google Earth. 2013a. “AS04”. 42º18’00.20”N and 71º38’12.05”W. Imagery August 24, 2013. Retrieved August 21, 2014. Google Earth. 2013b. “AS18”. 42º25’47.98”N and 71º27’20.35”W. Imagery August 24, 2013. Retrieved August 21, 2014. Google Earth. 2013c. “NA01”. 42º31’04.03”N and 71º24’12.37”W. Imagery August 24, 2013. Retrieved August 21, 2014. Google Earth. 2013d. “SU07”. 42º19’22.85”N and 71º24’16.02”W. Imagery August 24, 2013. Retrieved August 21, 2014. Google Earth. 2013e. “CO7A”. 42º38’10.77”N and 71º18’08.17”W. Imagery August 24, 2013. Retrieved August 21, 2014. MassDEP. 2005. CN 56.2. Standard Operating Procedure. Data Validation and Usability. Massachusetts Department of Environmental Protection, Division of Watershed Management. Worcester, MA. MassDEP. 1999a. CN 4.0 Water Quality Multi-probe Instrument Use, Standard Operating Procedure. Massachusetts Department of Environmental Protection, Division of Watershed Management. Worcester, MA. MassDEP. 1999b. Grab Collection Techniques for DWM Water Quality Sampling, Standard Operating Procedure. Massachusetts Department of Environmental Protection, Division of Watershed Management. Worcester, MA. NOAA. 2015 [online]. Climatological Data Publications. Massachusetts. NOAA Satellite and Information Service. National Climatic Data Center. Image and Publications System. Retrieved September 2, 2015. Available at http://www.ncdc.noaa.gov/IPS/cd/cd.html;jsessionid=1CB121D95499F2E6677D736184136915?_page=0&jsessionid=1CB121D95499F2E6677D736184136915&state=MA&_target1=Next+%3E O’Brien-Clayton, Katie A. 2005 [online]. CN 92.0: SuAsCo Watershed 2001 Water Quality Assessment Report. 2001. Report 82-AC-1. August 2005. Massachusetts Department of Environmental Protection. Division of Watershed Management. Retrieved September 2, 2015. Available at http://www.mass.gov/eea/docs/dep/water/resources/71wqar09/82wqar1.pdf. Ostiguy, Lance J., Weiskel, Peter K. and Stacey A. Archfield. 2010 [Online]. Average Annual Precipitation, in Inches, for Massachusetts as Computed over the Period 1971-2000 Using the Parameter-Elevation Regressions on Independent Slopes (PRISM) Model. Appendix 1, Figure 1-2. Retrieved September 2, 2015. Available at http://pubs.usgs.gov/sir/2009/5227/pdf/Appendix/sir2009-5227_appendix1_fig2.pdf USGPO. 9 April, 1999. Public Law 106–20. Sudbury, Assabet and Concord Wild and Scenic River Act. 106th Congress. United States Government Printing Office. Washington, DC. Retrieved September 2, 2015. Available at http://www.gpo.gov/fdsys/pkg/PLAW-106publ20/pdf/PLAW-106publ20.pdf. USGS. 2015a [online]. National Water Interface System: Web Interface. USGS 01097000 Assabet River at Maynard, MA. Provisional data subject to revision. Period of record July 11, 1941 to current. United States Geological Survey. Retrieved September 2, 2015. Available at http://waterdata.usgs.gov/ma/nwis/dv/?site_no=01097000&PARAmeter_cd=00060,00065. USGS. 2015b [online]. National Water Interface System: Web Interface. USGS 01097300 Nashoba Brook Near Acton, MA. Provisional data subject to revision. Period of record July 26, 1963 to current. United States Geological Survey. Retrieved September 2, 2015. Available at http://waterdata.usgs.gov/ma/nwis/dv/?site_no=01097300&PARAmeter_cd=00060,00065. USGS. 2015c [online]. National Water Interface System: Web Interface. USGS 01098530 Sudbury River at Saxonville, MA. Provisional data subject to revision. Period of record November 1, 1979 to current. United States Geological Survey. Retrieved September 2, 2015. Available at http://waterdata.usgs.gov/ma/nwis/dv/?site_no=01098530&PARAmeter_cd=00060,00065.

Concord River Watershed SMART Monitoring Program 2011-2013 Technical Memorandum CN 418.0 42 1/21/2016
USGS. 2015d [online]. National Water Interface System: Web Interface. USGS 01099500 Concord River below River Meadow Brook at Lowell, MA. Provisional data subject to revision. Period of record December 16, 1936 to current. United States Geological Survey. Retrieved September 2, 2015. Available at http://waterdata.usgs.gov/ma/nwis/uv/?site_no=01099500&agency_cd=USGS. USGS. 2015e [online]. Daily data at the USGS Concord River gage below River Meadow Brook, Lowell (USGS station number 01099500). Retrieved February 18, 2015. Available at http://waterdata.usgs.gov/nwis/dv/?site_no=01099500&agency_cd=USGS&referred_module=sw USGS. 2015f [online]. Monthly data at the USGS Concord River gage below River Meadow Brook, Lowell (USGS station number 01099500). Retrieved September 2, 2015. Available at http://waterdata.usgs.gov/nwis/monthly/?referred_module=sw&site_no=01099500&por_01099500_1=1267274,00060,1,1936-12,2014-12&format=html_table&date_format=YYYY-MM-DD&rdb_compression=file&submitted_form=parameter_selection_list USGS. 2015f[online]. Mean streamflow values based on 71-72 years of record at the USGS Concord River gage below River Meadow Brook, Lowell (USGS station number 01099500). Point of record daily statistics based on data collected from 10/1/1936 – 9/30/2008. Retrieved September 2, 2015. Available at http://waterdata.usgs.gov/nwis/dvstat/?referred_module=sw&site_no=01099500&por_01099500_1=1267274,00060,1,1936-12-16,2008-03-17&start_dt=1936-12-16&end_dt=2007-12-31&format=html_table&stat_cds=mean_va&date_format=YYYY-MM-DD&rdb_compression=file&submitted_form=parameter_selection_list Wandle, S. W. and Fontaine, R.A.. 1984 [Online]. Gazetteer of Hydrologic Characteristics of Streams in Massachusetts-Coastal River Basins of the North Shore and Massachusetts Bay. Water-Resources Investigations Report 84-4284. United States Geological Survey. Retrieved September 2, 2015. Available at http://pubs.er.usgs.gov/publication/wri844284.