conception, elaboration and characterization of silica ... · conception, elaboration and...
TRANSCRIPT

Conception, elaboration and characterization of silica-zirconia based nanostructured optical fibres obtained by the sol-gel
process
BRASSE Gurvan, RESTOIN Christine, AUGUSTE Jean-Louis, ROY Philippe, LEPARMENTIER Stéphanie, BLONDY Jean-Marc
Photonics departement Xlim Research Institute UMR CNRS n°6172
123 Avenue A. Thomas, 87060 Limoges FRANCE
[email protected] [email protected]
Abstract: This paper presents an original nanostructured optical fibre obtained by the sol-gel process. The studied fibre is composed with zirconia nanocrystals dispersed inside an amorphous silica matrix as core surrounded by a pure silica cladding. The conception and the elaboration of the fibre are described, as well as its structural and optical characterization. A preliminary study of the rheological properties of the initial silica-zirconia sol has been realized to determine the evolution of the sol behaviour as a function of the time .The introduction of ytterbium ions in the core composition is also investigated and the luminescence properties of the fibre are exposed and discussed.
Key-words: Optical fibre, Nanostructure, Sol-Gel, Nanocrystals, Rare-earth ions, Silica-zirconia gel, Luminescence
1 Introduction The optical fibres have been widely studied during the last decades, especially the photonic crystal fibres composed of an arrangement of silica and air holes and fabricated by drawing preforms realized by the stack and draw method. The incorporation of new kinds of materials inside these structures can open new perspectives for the elaboration of light source at original wavelengths, multi-cores laser fibre, highly non-linear optical fibre, sensors… The intense developments which have occurred in the elaboration of nanostructured materials [1][2][3] can offer number of interesting applications to the optical fibre field, especially the incorporation of nanoparticles doped with rare-earth ions or the incorporation of semiconductor nanoparticles, the so called quantum dots.
The sol-gel process [4], which is based on the conversion of a liquid sol into a solid gel phase by a series of hydrolysis and condensation reactions of the precursors, appears as an excellent “bottom-up” method to synthesize this kind of nanostructured material. This chemical method has also been extensively developed during the last years, particularly the synthesis of silica glass doped with rare earth ions or transition metals. During the heat treatment necessary for the gel-
glass conversion, species such as rare-earth ions tend to form clusters, even if their concentration is low like a few percent, which induce a quenching of the luminescence. The introduction of a co-dopant cation such as Zr4+ avoids the cluster formation of Er3+ or Yb3+ in silica and consequently exacerbates the luminescence [5]. In addition, previous studies have demonstrated the existence of a liquid miscibility gap in the ZrO2-SiO2 phase diagram; an extension of this liquid miscibility gap in solid state has been suggested and confirmed by simulation of thermodynamics of mixing in the ZrO2-SiO2 liquid [6]. After an appropriate heat treatment, a phase separation occurs and ZrO2(t) nanocrystals dispersed inside an amorphous silica matrix appear [7].
One of the most important non radiative process that every material shows is the multi-phonon relaxation by the vibration band of the host system: when the frequency of this vibration band increases, the non-radiative decay rate increases, that consequently reduces the quantum efficiency. ZrO2 presents a wide band gap (5eV) and a low phonon energy (470 cm-1), which increases the probability of radiative transition in rare-earth doped zirconia host nanocrystals; this frequency is very small compared to the phonon cut-off energy of silica (1100 cm-1) [7]. Moreover, thanks to an interesting optical transparency, a
WSEAS TRANSACTIONS on ADVANCES in ENGINEERING EDUCATION
Brasse Gurvan, Restoin Christine, Auguste Jean-Louis, Roy Philippe, Leparmentier Stephanie, Blondy Jean-Marc
ISSN: 1790-1979 45 Issue 2, Volume 6, February 2009

photothermal stability, a chemical stability and a high refractive index (n=2.15 at 633 nm), ZrO2 appears as an interesting material for optical applications. Furthermore, zirconia can be introduced in the silica core of the fibre, as its boiling temperature is higher than the drawing temperatures of silica fibres, thus there is a conservation of the nanostructure of the material.
The first part of this paper is devoted to the study of the silica-zirconia material: its microstructural properties are presented, as well as its thermal behaviour. The optical behaviour of such a nanostructured optical fibre has been simulated, thanks to the commercial software by the finite element method (FEM). The elaboration of the nanostructured optical fibre by the sol-gel process is then presented and the waveguiding properties of the fibre are studied. Finally, the luminescence properties of an Yb-doped silica-zirconia fibre are exposed and discussed.
2 Experimental The silica and the zirconia sols are synthesized from tetraethylorthosilicate (Fisher) and zirconium n-propoxyde (Alfa Aesar) as metal precursor, hydrochloric acid (Alfa Aesar), water, propanol (Fisher) and erbium chloride (III) (Alfa-Aesar) as lanthanide precursor. Due to the high reactivity of the zirconium precursor with the humidity, the sols are prepared in a glove box under argon atmosphere; acetylacetone (ACAC) (Alfa Aesar) is also added to the sol as a chelating agent, to control the hydrolysis rate of zirconium
n-propoxyde with the ratio: 17.0)(
)(
2
=ZrOn
ACACn.
The sol 30 mol% ZrO2 – 70 mol% SiO2 is then achieved by mixing the ZrO2 sol into the SiO2 sol without any caution. Concerning the synthesis of ytterbium-doped silica-zirconia sol, the ytterbium isopropoxyde is first dissolved in propanol and then mixed with the zirconia precursor and the chelating agent. The mixture is then aged and sucked up inside a silica tube before being drained: a sol layer is deposited on the inner wall of the preform. The deposited layer is then dried at 70 °C and annealed at 1000 °C to allow the combustion of the organics radicals, the gel-glass conversion and the zirconia crystallization. This process is then repeated until the desired number of layer is achieved and then the preform is collapsed and drawn into a 125 µm outer diameter fibre at higher temperature.
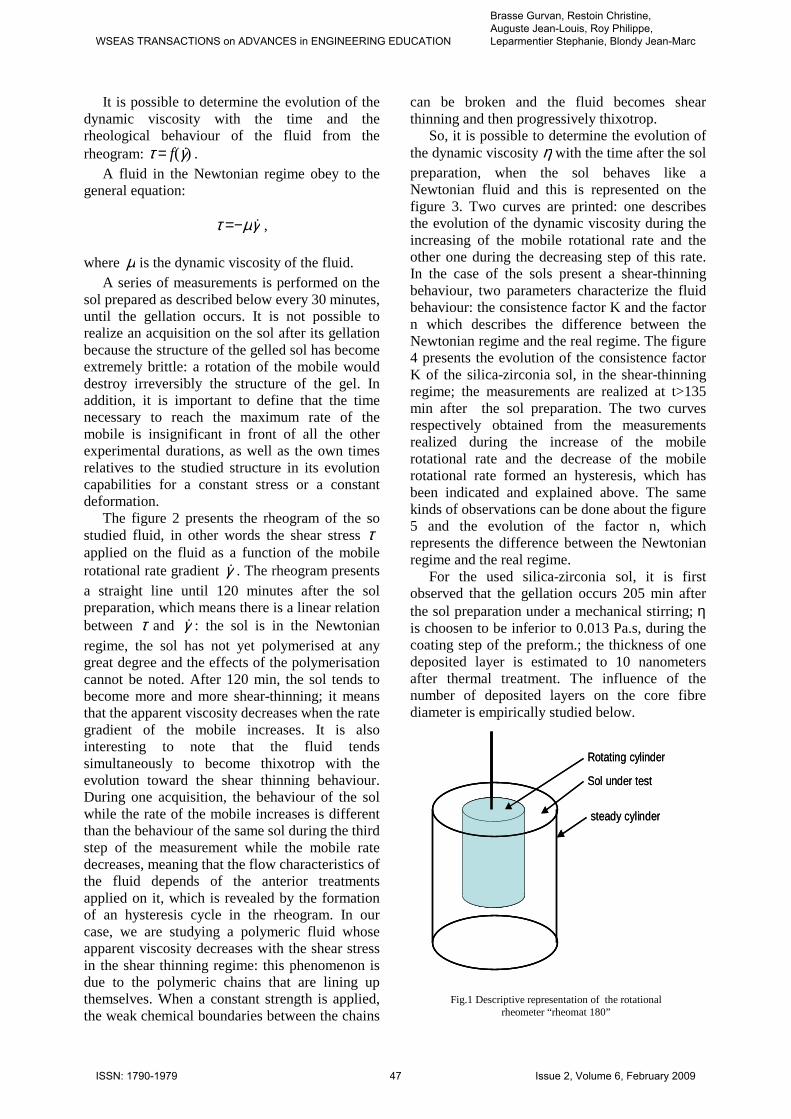
3 Result and discussion 3.1 Evolution of the sol viscosity with the gellation time The study of the dynamic viscosity η as a function of the time has been achieved using a rotational rheometer “Rheomat RM 180”. The principle of the measurement consists to place the studied fluid between the both coaxial cylinders as it is described on the figure 1. The laminar shear movement of the fluid is obtained by moving the inner cylinder with a rotational motion, at an angular rate equal to ω0, while the second one is kept stationary. The fluid can be decomposed in a multitude of coaxial cylindrical layers, which have various angular rates varying continuously from 0 for the layer in touch with the external cylinder to ω0 for the layer in touch with the mobile. Following the relative motion of each layer, there is always a shear rate:
dtdγγ =&.
and a shear stress τ everywhere in the fluid. For symmetric reasons, the shear stress and the shear rate are constants over the surface of a layer but depends on the radial position; so γ& and τ are functions of the radius r from the central axe of the rheometer. The measurement is decomposed in three steps: during the first step [0; 60s], the angular rate of the inner cylinder and thus the shear rate applied on the fluid increase for 60s; then during the step 2 [60s;80s], the rate is kept constant for 20s and finally during the third step[80s;140s], there is a decrease of the shear rate applied on the fluid. The whole duration of the measurement is 140s and each measurement is realized on the sol at regular time interval until its gellation point occurs.
The viscosity is indeed one of the most important parameter as it influences the thickness of the deposited layers, the uniformity of the coating and then the core diameter of the fibre. The uniformity of the coatings that will constitute the core of the fiber is essential to achieve an optical fiber, which present good waveguiding properties. Hence, to coat the inner wall of the preform with a uniform sol layer it is more advisable that the fluid presents a Newtonian behaviour, to avoid a dependence of the sol viscosity with the shear rate along the wall of the substrat during the coating step.
WSEAS TRANSACTIONS on ADVANCES in ENGINEERING EDUCATION
Brasse Gurvan, Restoin Christine, Auguste Jean-Louis, Roy Philippe, Leparmentier Stephanie, Blondy Jean-Marc
ISSN: 1790-1979 46 Issue 2, Volume 6, February 2009
It is possible to determine the evolution of the dynamic viscosity with the time and the rheological behaviour of the fluid from the rheogram: )(γτ &f= .
A fluid in the Newtonian regime obey to the general equation:
γµτ &−= ,
where µ is the dynamic viscosity of the fluid.
A series of measurements is performed on the sol prepared as described below every 30 minutes, until the gellation occurs. It is not possible to realize an acquisition on the sol after its gellation because the structure of the gelled sol has become extremely brittle: a rotation of the mobile would destroy irreversibly the structure of the gel. In addition, it is important to define that the time necessary to reach the maximum rate of the mobile is insignificant in front of all the other experimental durations, as well as the own times relatives to the studied structure in its evolution capabilities for a constant stress or a constant deformation.
The figure 2 presents the rheogram of the so studied fluid, in other words the shear stress τ applied on the fluid as a function of the mobile rotational rate gradient γ& . The rheogram presents a straight line until 120 minutes after the sol preparation, which means there is a linear relation between τ and γ& : the sol is in the Newtonian regime, the sol has not yet polymerised at any great degree and the effects of the polymerisation cannot be noted. After 120 min, the sol tends to become more and more shear-thinning; it means that the apparent viscosity decreases when the rate gradient of the mobile increases. It is also interesting to note that the fluid tends simultaneously to become thixotrop with the evolution toward the shear thinning behaviour. During one acquisition, the behaviour of the sol while the rate of the mobile increases is different than the behaviour of the same sol during the third step of the measurement while the mobile rate decreases, meaning that the flow characteristics of the fluid depends of the anterior treatments applied on it, which is revealed by the formation of an hysteresis cycle in the rheogram. In our case, we are studying a polymeric fluid whose apparent viscosity decreases with the shear stress in the shear thinning regime: this phenomenon is due to the polymeric chains that are lining up themselves. When a constant strength is applied, the weak chemical boundaries between the chains
can be broken and the fluid becomes shear thinning and then progressively thixotrop.
So, it is possible to determine the evolution of the dynamic viscosity η with the time after the sol preparation, when the sol behaves like a Newtonian fluid and this is represented on the figure 3. Two curves are printed: one describes the evolution of the dynamic viscosity during the increasing of the mobile rotational rate and the other one during the decreasing step of this rate. In the case of the sols present a shear-thinning behaviour, two parameters characterize the fluid behaviour: the consistence factor K and the factor n which describes the difference between the Newtonian regime and the real regime. The figure 4 presents the evolution of the consistence factor K of the silica-zirconia sol, in the shear-thinning regime; the measurements are realized at t>135 min after the sol preparation. The two curves respectively obtained from the measurements realized during the increase of the mobile rotational rate and the decrease of the mobile rotational rate formed an hysteresis, which has been indicated and explained above. The same kinds of observations can be done about the figure 5 and the evolution of the factor n, which represents the difference between the Newtonian regime and the real regime.
For the used silica-zirconia sol, it is first observed that the gellation occurs 205 min after the sol preparation under a mechanical stirring; η is choosen to be inferior to 0.013 Pa.s, during the coating step of the preform.; the thickness of one deposited layer is estimated to 10 nanometers after thermal treatment. The influence of the number of deposited layers on the core fibre diameter is empirically studied below.
Rotating cylinder
steady cylinder
Sol under test
Rotating cylinder
steady cylinder
Sol under test
Fig.1 Descriptive representation of the rotational rheometer “rheomat 180”
WSEAS TRANSACTIONS on ADVANCES in ENGINEERING EDUCATION
Brasse Gurvan, Restoin Christine, Auguste Jean-Louis, Roy Philippe, Leparmentier Stephanie, Blondy Jean-Marc
ISSN: 1790-1979 47 Issue 2, Volume 6, February 2009

3.2 Thermal behaviour of the silica-zirconia xerogel The DTA and TGA analysis of the silica-zirconia xerogels are realized with a SETARAM SETSYS thermo-analyser and a rate of 10°C/min is set under a dry atmosphere. The measurements are represented on figure 6. The DTA curve shows two endothermic peaks: one peak appears at a temperature of 140°C and another one at 250°C. Both of them correspond to a weight loss on the TGA curve. The peak at 140°C can be attributed to the departure of residual water and the peak at 250°C can be attributed to the desorption of physically adsorbed water on the gel. The wide exothermic peak between 300°C and 600°C, which corresponds to a weight loss on the TGA curve, is correlated to the pyrolysis of the residual organics compounds trapped in the structure of the gel. At 950°C, the DTA curve presents a significant exothermic peak, which does not match with any weight loss on the TGA curve; it means, that a crystallisation process of ZrO2 occurs at this temperature, in the binary system studied.
A microstructural analysis by XRD and TEM presented below confirms the presence of a crystalline phase in the structure and permit to determine its nature as well as the observation of its microstructure. Hence, this study explains the necessity to anneal the preform at 1000°C to evacuate all the organics and to allow the nanocrystallization of the material making the core.
Fig.2 Rheogram of the silica-zirconia sol realized at t=120 min after the sol
0
5
10
15
20
25
30
35
40
0 500 1000 1500 2000 2500 3000 3500
Rate gradient (s -1)
She
ar s
tres
s (a
.u)
Measurement during the increaseof the mobile rate
Measurement during the decreaseof the mobile rate
0.003
0.005
0.007
0.009
0.011
0.013
0 20 40 60 80 100 120Time (min)
Dyn
amic
vis
cosi
ty ηη ηη (
Pa.
s)
measurement during the increase of themobile ratemeasurement during the decrease of themobile rate
Fig.3 Evolution of the dynamic viscosity of the studied silica-zirconia sol in the Newtonian regime for t<120 min
0
0.5
1
1.5
2
2.5
135 155 175 195 215Time (min)
Con
sist
ance
fact
or K
(a.
u)
Consistance factor measured during the decrease of theshear rateConsistance factor measured during the increase of theshear rate
Fig.4 Evolution of the consistence factor of the silica-zirconia sol in the shear-thinning regime realized at t>135 min after
the sol preparation
0.4
0.5
0.6
0.7
0.8
0.9
1
135 155 175 195 215
Time (min)
Inde
x n
(a.u
)
measurements of the difference between the newtonianbehaviour and the real behaviour during the decrease of theshear ratemeasurements of the difference between the newtonianbehaviour and the real behaviour during the increase of the shearrate
Fig.5 Evolution of the factor n of the silica-zirconia sol in the shear-thinning regime realized at t>135 min after the sol
preparation
WSEAS TRANSACTIONS on ADVANCES in ENGINEERING EDUCATION
Brasse Gurvan, Restoin Christine, Auguste Jean-Louis, Roy Philippe, Leparmentier Stephanie, Blondy Jean-Marc
ISSN: 1790-1979 48 Issue 2, Volume 6, February 2009
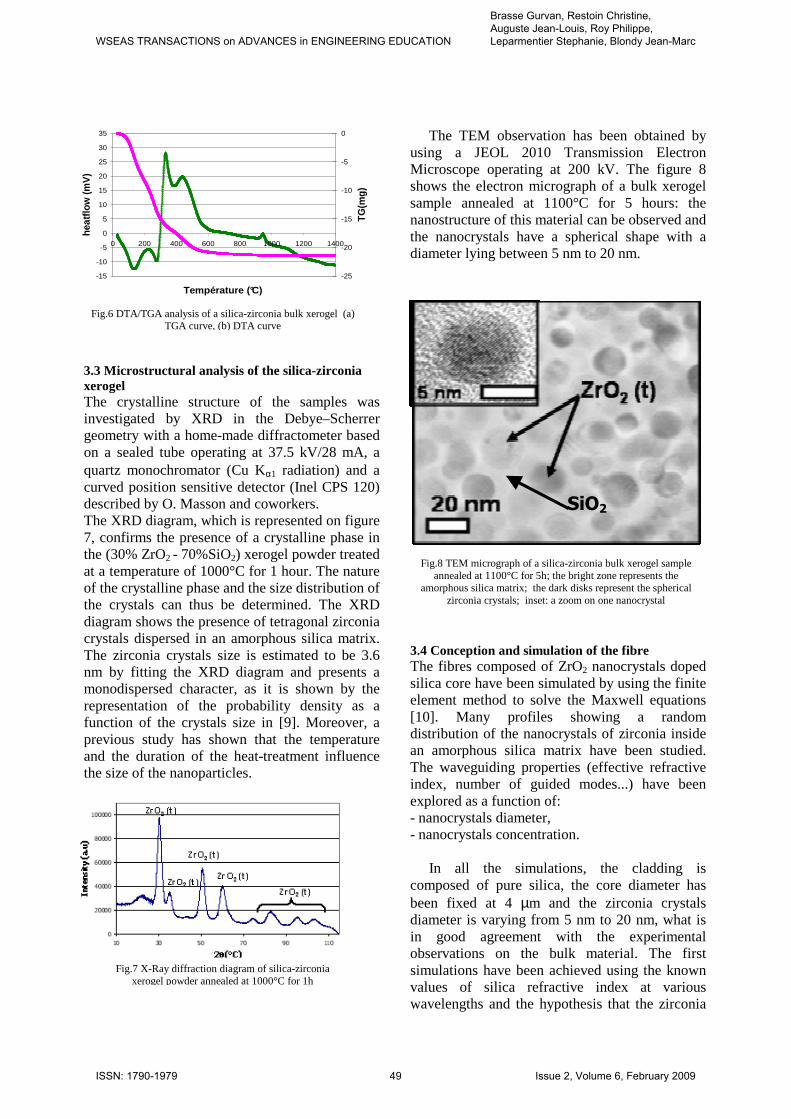
3.3 Microstructural analysis of the silica-zirconia xerogel The crystalline structure of the samples was investigated by XRD in the Debye–Scherrer geometry with a home-made diffractometer based on a sealed tube operating at 37.5 kV/28 mA, a quartz monochromator (Cu Kα1 radiation) and a curved position sensitive detector (Inel CPS 120) described by O. Masson and coworkers. The XRD diagram, which is represented on figure 7, confirms the presence of a crystalline phase in the (30% ZrO2 - 70%SiO2) xerogel powder treated at a temperature of 1000°C for 1 hour. The nature of the crystalline phase and the size distribution of the crystals can thus be determined. The XRD diagram shows the presence of tetragonal zirconia crystals dispersed in an amorphous silica matrix. The zirconia crystals size is estimated to be 3.6 nm by fitting the XRD diagram and presents a monodispersed character, as it is shown by the representation of the probability density as a function of the crystals size in [9]. Moreover, a previous study has shown that the temperature and the duration of the heat-treatment influence the size of the nanoparticles.
The TEM observation has been obtained by using a JEOL 2010 Transmission Electron Microscope operating at 200 kV. The figure 8 shows the electron micrograph of a bulk xerogel sample annealed at 1100°C for 5 hours: the nanostructure of this material can be observed and the nanocrystals have a spherical shape with a diameter lying between 5 nm to 20 nm.
3.4 Conception and simulation of the fibre The fibres composed of ZrO2 nanocrystals doped silica core have been simulated by using the finite element method to solve the Maxwell equations [10]. Many profiles showing a random distribution of the nanocrystals of zirconia inside an amorphous silica matrix have been studied. The waveguiding properties (effective refractive index, number of guided modes...) have been explored as a function of: - nanocrystals diameter, - nanocrystals concentration.
In all the simulations, the cladding is composed of pure silica, the core diameter has been fixed at 4 µm and the zirconia crystals diameter is varying from 5 nm to 20 nm, what is in good agreement with the experimental observations on the bulk material. The first simulations have been achieved using the known values of silica refractive index at various wavelengths and the hypothesis that the zirconia
-15
-10
-5
0
5
10
15
20
25
30
35
0 200 400 600 800 1000 1200 1400
Température (°C)
heat
flow
(mV
)
-25
-20
-15
-10
-5
0
TG(m
g)
Fig.6 DTA/TGA analysis of a silica-zirconia bulk xerogel (a) TGA curve, (b) DTA curve
Fig.7 X-Ray diffraction diagram of silica-zirconia xerogel powder annealed at 1000°C for 1h
Fig.8 TEM micrograph of a silica-zirconia bulk xerogel sample annealed at 1100°C for 5h; the bright zone represents the
amorphous silica matrix; the dark disks represent the spherical zirconia crystals; inset: a zoom on one nanocrystal
SiO2
WSEAS TRANSACTIONS on ADVANCES in ENGINEERING EDUCATION
Brasse Gurvan, Restoin Christine, Auguste Jean-Louis, Roy Philippe, Leparmentier Stephanie, Blondy Jean-Marc
ISSN: 1790-1979 49 Issue 2, Volume 6, February 2009
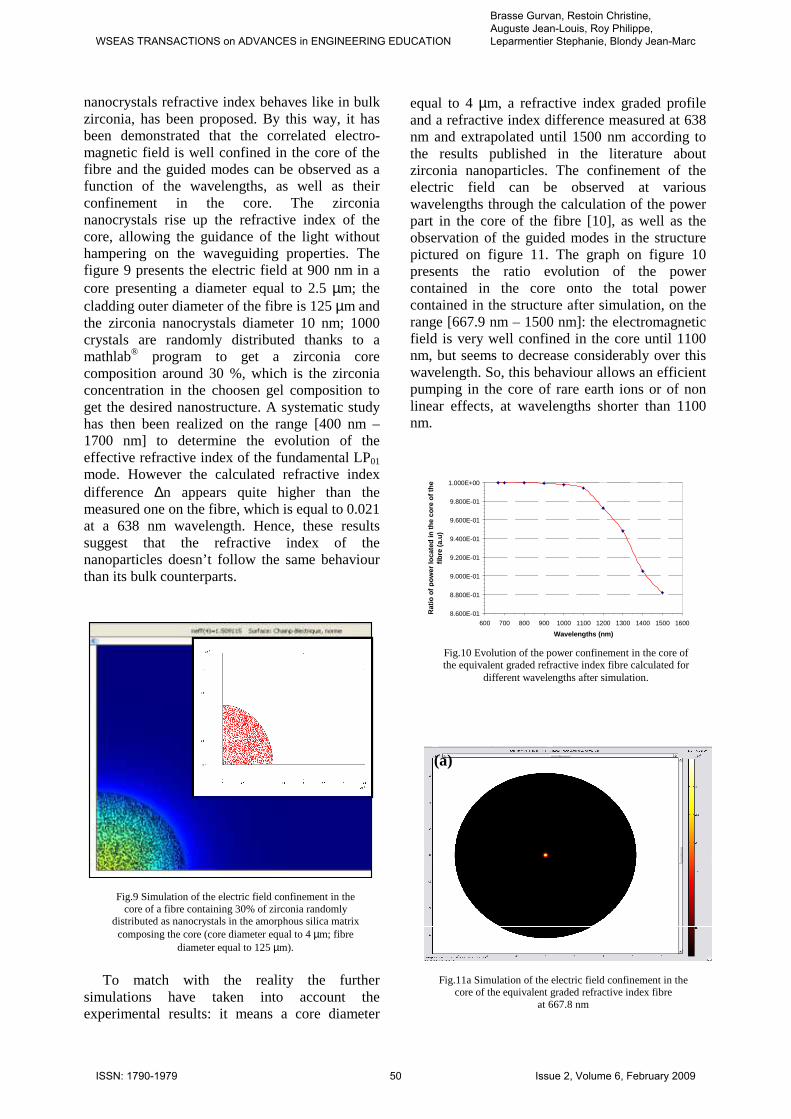
nanocrystals refractive index behaves like in bulk zirconia, has been proposed. By this way, it has been demonstrated that the correlated electro-magnetic field is well confined in the core of the fibre and the guided modes can be observed as a function of the wavelengths, as well as their confinement in the core. The zirconia nanocrystals rise up the refractive index of the core, allowing the guidance of the light without hampering on the waveguiding properties. The figure 9 presents the electric field at 900 nm in a core presenting a diameter equal to 2.5 µm; the cladding outer diameter of the fibre is 125 µm and the zirconia nanocrystals diameter 10 nm; 1000 crystals are randomly distributed thanks to a mathlab® program to get a zirconia core composition around 30 %, which is the zirconia concentration in the choosen gel composition to get the desired nanostructure. A systematic study has then been realized on the range [400 nm – 1700 nm] to determine the evolution of the effective refractive index of the fundamental LP01 mode. However the calculated refractive index difference ∆n appears quite higher than the measured one on the fibre, which is equal to 0.021 at a 638 nm wavelength. Hence, these results suggest that the refractive index of the nanoparticles doesn’t follow the same behaviour than its bulk counterparts.
To match with the reality the further
simulations have taken into account the experimental results: it means a core diameter
equal to 4 µm, a refractive index graded profile and a refractive index difference measured at 638 nm and extrapolated until 1500 nm according to the results published in the literature about zirconia nanoparticles. The confinement of the electric field can be observed at various wavelengths through the calculation of the power part in the core of the fibre [10], as well as the observation of the guided modes in the structure pictured on figure 11. The graph on figure 10 presents the ratio evolution of the power contained in the core onto the total power contained in the structure after simulation, on the range [667.9 nm – 1500 nm]: the electromagnetic field is very well confined in the core until 1100 nm, but seems to decrease considerably over this wavelength. So, this behaviour allows an efficient pumping in the core of rare earth ions or of non linear effects, at wavelengths shorter than 1100 nm.
Fig.9 Simulation of the electric field confinement in the core of a fibre containing 30% of zirconia randomly
distributed as nanocrystals in the amorphous silica matrix composing the core (core diameter equal to 4 µm; fibre
diameter equal to 125 µm).
Fig.10 Evolution of the power confinement in the core of the equivalent graded refractive index fibre calculated for
different wavelengths after simulation.
8.600E-01
8.800E-01
9.000E-01
9.200E-01
9.400E-01
9.600E-01
9.800E-01
1.000E+00
600 700 800 900 1000 1100 1200 1300 1400 1500 1600
Wavelengths (nm)
Rat
io o
f pow
er lo
cate
d in
the
core
of t
he
fibre
(a.
u)
(a)
Fig.11a Simulation of the electric field confinement in the core of the equivalent graded refractive index fibre
at 667.8 nm
WSEAS TRANSACTIONS on ADVANCES in ENGINEERING EDUCATION
Brasse Gurvan, Restoin Christine, Auguste Jean-Louis, Roy Philippe, Leparmentier Stephanie, Blondy Jean-Marc
ISSN: 1790-1979 50 Issue 2, Volume 6, February 2009

3.5 Characterization of the undoped fibre In a first time, the influence of the number of deposited layers on the diameter of the core fibre is empirically studied. In this way, one layer has been deposited on the inner wall of the preform: the diameter of the core fibre is estimated about 500 nm. After eight layers deposited on the inner wall of the preform following the experimental process described above, a 4 µm core diameter is measured for a 125 µm outer diameter fibre.
A scanning electron microscope Philips XL 20 is used to observe the core and its geometry. Figure 12 shows that the core is homogeneous and presents a circular shape with a 4 µm diameter; the formation of aggregates has been avoided. Moreover, no defect is observed at the interface between the core and the silica cladding.
The influence of the temperature and the annealing time on the microstructural properties of SiO2-ZrO2 xerogels have been studied by Gaudon et al, especially the size of the crystallites. It has been demonstrated that the crystallite sizes can be tuned from 4 nm to 23 nm for different annealing times and temperatures. During the drawing process the preform and thus the fibre just stay a few minutes at the drawing temperature; the used induction kiln presents a very high graded temperature profile and the cooling rate of the material is very high. Moreover the melting temperature of ZrO2 crystals is over 2200°C. X-Ray diffraction was realized on an arrangement of fibres fixed on a silicium wafer substrate. The X-Ray diagrams confirm the presence of zirconia crystalline phase, in spite of the high background noise of the measurements due to the important proportion of amorphous silica in the whole volume analyzed. It
is thus possible to formulate the hypothesis that during the drawing step, the viscosity of the amorphous silica phase in the core decreases and consequently there is a relaxation of the stresses applied on the zirconia nanocrystals by the silica matrix, which allows the transformation of the metastable tetragonal phase into the stable monoclinic phase. It is so legitimate to consider that after being drawn at 1800°C, the fibre presents ZrO2 nanocrystals dispersed in the silica core, which do not exceed few tens nanometers.
Figure 13 shows the refractive index profile of
the fibre; the measurement is carried out with an optical fibre analyser EXFO NR 9200. The refractive index difference ∆n between the core and the cladding is 0.021 and the calculated cutoff wavelength λc is equal to 714 nm. In addition, the core fibre refractive index profile presents a graded form. The core diameter measured from the SEM micrograph corresponds to the half height width of the refractive index profile; the ∆n seems to be risen up on a width of 8 µm around the center of the core fibre. This graded form and this perturbation of the ∆n in the cladding can be explained by a diffusion of Zr from the composite sol-gel silica-zirconia core to the silica cladding during the fibre drawing step. Thus, the penetration depth of Zr in the cladding is estimated to be 2 µm.
Figure 14 shows the transmitted spectrum of the fibre illuminated by a supercontinuum source [350–1750 nm] and the transmitted spectrum of the supercontinuum source; the spectra obtained by using a spectra analyzer Ando AQ6315 shows that the light is guided by total internal reflection over the entire range studied and that no
Fig.11b Simulation of the electric field confinement in the core of the equivalent graded refractive index fibre
at 1500 nm
(b)
Fig.12 SEM micrograph of a fibre with a core obtained after 8 silica-zirconia sol layers deposition; external diameter of
the fibre: 125 µm, core diameter: 4 µm.
WSEAS TRANSACTIONS on ADVANCES in ENGINEERING EDUCATION
Brasse Gurvan, Restoin Christine, Auguste Jean-Louis, Roy Philippe, Leparmentier Stephanie, Blondy Jean-Marc
ISSN: 1790-1979 51 Issue 2, Volume 6, February 2009
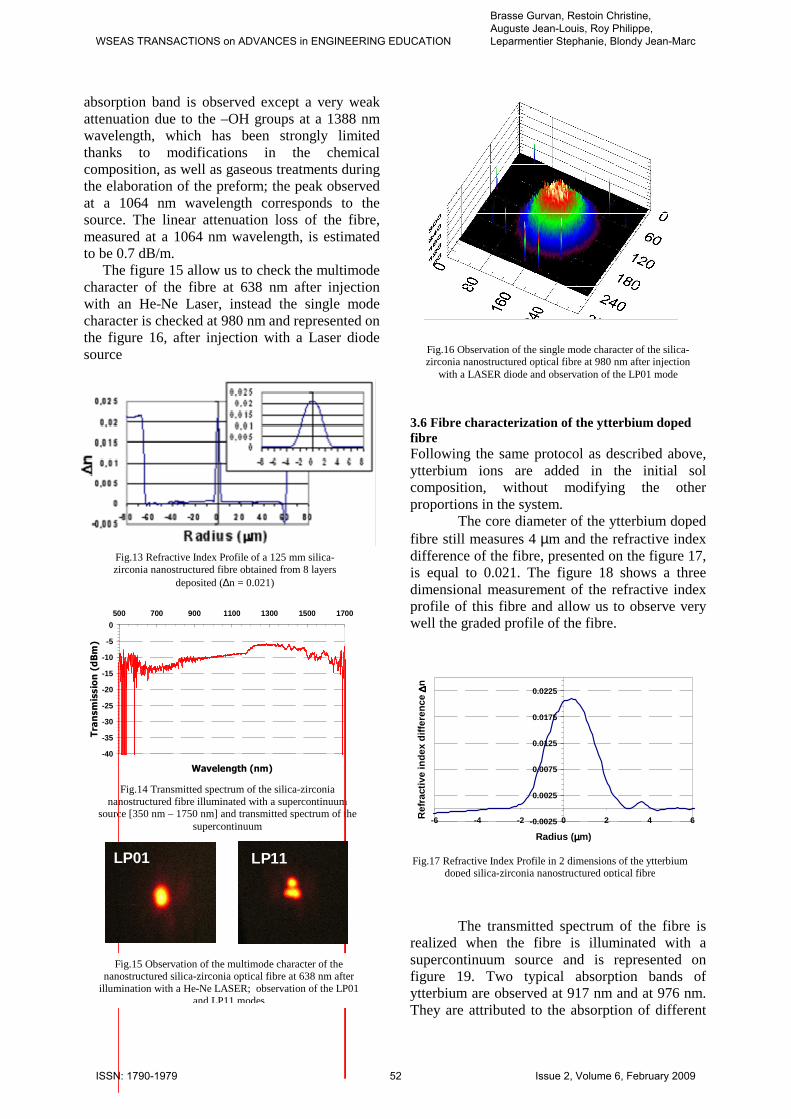
absorption band is observed except a very weak attenuation due to the –OH groups at a 1388 nm wavelength, which has been strongly limited thanks to modifications in the chemical composition, as well as gaseous treatments during the elaboration of the preform; the peak observed at a 1064 nm wavelength corresponds to the source. The linear attenuation loss of the fibre, measured at a 1064 nm wavelength, is estimated to be 0.7 dB/m.
The figure 15 allow us to check the multimode character of the fibre at 638 nm after injection with an He-Ne Laser, instead the single mode character is checked at 980 nm and represented on the figure 16, after injection with a Laser diode source
3.6 Fibre characterization of the ytterbium doped fibre Following the same protocol as described above, ytterbium ions are added in the initial sol composition, without modifying the other proportions in the system.
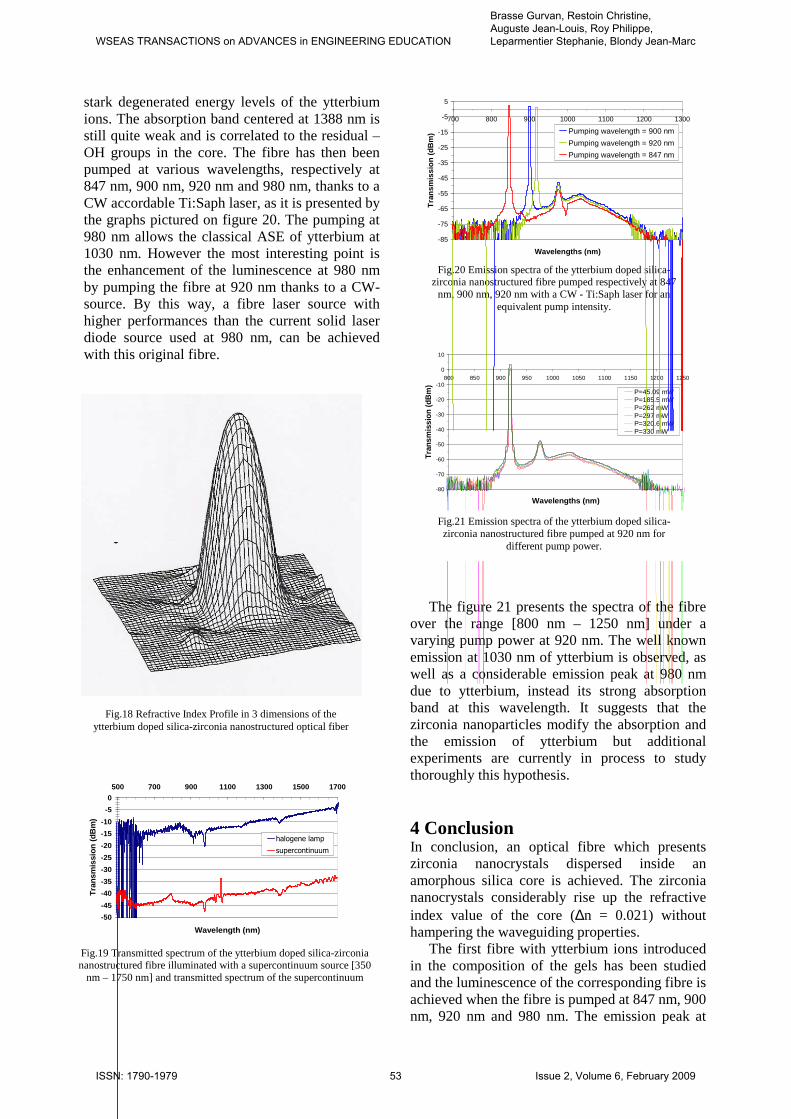
The core diameter of the ytterbium doped fibre still measures 4 µm and the refractive index difference of the fibre, presented on the figure 17, is equal to 0.021. The figure 18 shows a three dimensional measurement of the refractive index profile of this fibre and allow us to observe very well the graded profile of the fibre.
The transmitted spectrum of the fibre is
realized when the fibre is illuminated with a supercontinuum source and is represented on figure 19. Two typical absorption bands of ytterbium are observed at 917 nm and at 976 nm. They are attributed to the absorption of different
Fig.13 Refractive Index Profile of a 125 mm silica-zirconia nanostructured fibre obtained from 8 layers
deposited (∆n = 0.021)
Fig.14 Transmitted spectrum of the silica-zirconia nanostructured fibre illuminated with a supercontinuum
source [350 nm – 1750 nm] and transmitted spectrum of the supercontinuum
-40
-35
-30
-25
-20
-15
-10
-5
0
500 700 900 1100 1300 1500 1700
Wavelength (nm)
Transmission (dBm)
LP01LP01 LP11LP11
Fig.15 Observation of the multimode character of the nanostructured silica-zirconia optical fibre at 638 nm after
illumination with a He-Ne LASER; observation of the LP01and LP11 modes
Fig.16 Observation of the single mode character of the silica-zirconia nanostructured optical fibre at 980 nm after injection
with a LASER diode and observation of the LP01 mode
-0.0025
0.0025
0.0075
0.0125
0.0175
0.0225
-6 -4 -2 0 2 4 6
Radius ( µµµµm)
Ref
ract
ive
inde
x di
ffere
nce
∆∆ ∆∆n
Fig.17 Refractive Index Profile in 2 dimensions of the ytterbium doped silica-zirconia nanostructured optical fibre
WSEAS TRANSACTIONS on ADVANCES in ENGINEERING EDUCATION
Brasse Gurvan, Restoin Christine, Auguste Jean-Louis, Roy Philippe, Leparmentier Stephanie, Blondy Jean-Marc
ISSN: 1790-1979 52 Issue 2, Volume 6, February 2009
stark degenerated energy levels of the ytterbium ions. The absorption band centered at 1388 nm is still quite weak and is correlated to the residual –OH groups in the core. The fibre has then been pumped at various wavelengths, respectively at 847 nm, 900 nm, 920 nm and 980 nm, thanks to a CW accordable Ti:Saph laser, as it is presented by the graphs pictured on figure 20. The pumping at 980 nm allows the classical ASE of ytterbium at 1030 nm. However the most interesting point is the enhancement of the luminescence at 980 nm by pumping the fibre at 920 nm thanks to a CW-source. By this way, a fibre laser source with higher performances than the current solid laser diode source used at 980 nm, can be achieved with this original fibre.
The figure 21 presents the spectra of the fibre over the range [800 nm – 1250 nm] under a varying pump power at 920 nm. The well known emission at 1030 nm of ytterbium is observed, as well as a considerable emission peak at 980 nm due to ytterbium, instead its strong absorption band at this wavelength. It suggests that the zirconia nanoparticles modify the absorption and the emission of ytterbium but additional experiments are currently in process to study thoroughly this hypothesis.
4 Conclusion In conclusion, an optical fibre which presents zirconia nanocrystals dispersed inside an amorphous silica core is achieved. The zirconia nanocrystals considerably rise up the refractive index value of the core (∆n = 0.021) without hampering the waveguiding properties.
The first fibre with ytterbium ions introduced in the composition of the gels has been studied and the luminescence of the corresponding fibre is achieved when the fibre is pumped at 847 nm, 900 nm, 920 nm and 980 nm. The emission peak at
-80
-70
-60
-50
-40
-30
-20
-10
0
10
800 850 900 950 1000 1050 1100 1150 1200 1250
Wavelengths (nm)
Tran
smis
sion
(dB
m) P=45.09 mW
P=185.5 mWP=262 mWP=297 mWP=320.6 mWP=330 mW
Fig.21 Emission spectra of the ytterbium doped silica-zirconia nanostructured fibre pumped at 920 nm for
different pump power.
Fig.20 Emission spectra of the ytterbium doped silica-zirconia nanostructured fibre pumped respectively at 847
nm, 900 nm, 920 nm with a CW - Ti:Saph laser for an equivalent pump intensity.
-85
-75
-65
-55
-45
-35
-25
-15
-5
5
700 800 900 1000 1100 1200 1300
Wavelengths (nm)
Tra
nsm
issi
on (
dBm
)
Pumping wavelength = 900 nm
Pumping wavelength = 920 nm
Pumping wavelength = 847 nm
Fig.19 Transmitted spectrum of the ytterbium doped silica-zirconia nanostructured fibre illuminated with a supercontinuum source [350
nm – 1750 nm] and transmitted spectrum of the supercontinuum
-50
-45
-40
-35
-30
-25
-20
-15
-10
-5
0
500 700 900 1100 1300 1500 1700
Wavelength (nm)
Tra
nsm
issi
on (
dBm
)
halogene lamp
supercontinuum
Fig.18 Refractive Index Profile in 3 dimensions of the ytterbium doped silica-zirconia nanostructured optical fiber
WSEAS TRANSACTIONS on ADVANCES in ENGINEERING EDUCATION
Brasse Gurvan, Restoin Christine, Auguste Jean-Louis, Roy Philippe, Leparmentier Stephanie, Blondy Jean-Marc
ISSN: 1790-1979 53 Issue 2, Volume 6, February 2009

980 nm when the fibre is pumped at 920 opens the perspective to set up of a laser cavity, to get a laser fibre at 980 nm.
On another hand, the radiative deexcitation of the zirconia nanocrystals, under a pumping in the UV domain, is worth studying.
References: [1] T.Abdel-Fattah, “Synthesis and applications of some nanostructured materials”, WSEAS Conferences Nanotechnology - Cambridge (2009) [2] A.Lando, “Tuning the light by nanostructures”, WSEAS Conferences Nanotechnology - Cambridge (2009) [3]E.A.Anagnostakis, “Quantum mechanical designing of the optoelectronic yield for intersubband Laser nanoheterostructures”, WSEAS Conferences Nanotechnology - Cambridge (2009) [4] C.J. Brinker, the Physics and Chemistry of Sol–Gel Processing, vol. 14, Academic, New
York, 1990. [5] V.C. Costa, “Fluorescence line narrowing study of Eu3+ -doped sol-gel silica”, Chem. Mater. 8 (1996) 783. [6] H. Kim, “spinodal decomposition in amorphous metal-silicate thin films”, Journal of. Applied Physics, 92 (2002) 5094.
[7] A. Gaudon, “From amorphous phase separations to nanostructured materials”, Journal of NonCrystalline Solids 352 (2006) 2152. [8] A.J. Kenyon, “Recent developments in rare earth doped materials for optoelectronics”, Progress in. Quantum. Electronics.26 (2002) 225. [9] G. Brasse, “Nanoscaled optical fibre obtained by the sol–gel process in the SiO2–ZrO2 system doped with rare earth ions”, Opt. Mat, (2008) [10] A.Kovetz, “the principles of electromagnetics theory”, Cambridge University Press, (1990)
WSEAS TRANSACTIONS on ADVANCES in ENGINEERING EDUCATION
Brasse Gurvan, Restoin Christine, Auguste Jean-Louis, Roy Philippe, Leparmentier Stephanie, Blondy Jean-Marc
ISSN: 1790-1979 54 Issue 2, Volume 6, February 2009