concentrations of heavy metals mammals of northern waters...
TRANSCRIPT

Concentrations of Heavy Metalsand Organochlorines in MarineMammals of Northern Waters:Overview and Evaluation
R. Wagemann and D.C.G. Muir
Western RegionDepartment of Fisheries and Oceans .Winnipeg, Manitoba R3T 2N6
July 1984
Canadian Technical Report ofFisheries and Aquatic SciencesNo. 1279
1+ Fisheriesand Oceans
Pecheset Oceans Canada

Canadian Technical Report ofHydrography and Ocean Sciences
Technical reports contain scientific and technical information that contributes toexisting knowledge but which is not normally appropriate for primary literature. Thesu bject matter is related generally to programs and interests of the Ocean Science andSurveys (OSS) sector of the Department of Fisheries and Oceans.
Technical reports may be cited as full pu blications. The correct citation appearsabove the abstract of each report. Each report is abstracted in Aquatic Sciences andFisheries Abstracts and indexed in the Department's annual index to scientific andtechnical pu blications.
Technical reports are produced regionally but are numbered nationally. Requestsfor individual reports will be filled by the issuing establishment listed on the front coverand title page. Out of stock reports will be supplied for a fee by commercial agents.
Regional and headquarters establishments of Ocean Science and Surveys ceasedpublication of their various report series as of December 1981. A complete listing ofthese publications is published in the Canadian Journal of Fisheries and AquaticSciences, Volume 39: Index to Publications 1982.The current series, which begins withreport number I, was initiated in January 1982.
Rapport technique canadien surI'hydrographie et les sciences oceaniques
Les rapports techniques contiennent des renseignements scientifiques ettechniques qui constituent une contribution aux connaissances actuelles, mais qui nesont pas normalement appropries pour la publication dans un journal scientifique. Lesujet est generalernent lie aux programmes et interets du service des Sciences et levesoceaniques (SLO) du ministere des Peches et des Oceans.
Les rapports techniques peuvent etre cites comme des publications completes. Letitre exact parait au-dessus du resume de chaque rapport. Les rapports techniques sontresumes dans la revue Resumes des sciences aquatiques et halieutiques, et ils sontclasses dans l'index annuel des publications scientifiques et techniques du Ministere,
Les rapports techniques sont produits a l'echelon regional, mais numerotes al'echelon national. Les demandes de rapports seront satisfaites par l'etablissernentauteur dont Ie nom figure sur la couverture et la page du titre. Les rapports epuisesseront fournis contre retribution par des agents commerciaux.
Les etablissernents des Sciences et leves oceaniques dans les regions et al'adrninistration centrale ont cesse de pu blier leurs diverses series de rapports en decernbre 1981.Une liste complete de ces publications figure dans Ievolume 39, Index des publications1982 du Journal canadien des sciences halieutiques et aquatiques. La serie actuelle acommence avec la publication du rapport nurnero I en janvier 1982.
,

Canadian Technical Report of
Fisheries and Aquatic Sciences 1279
July 1984
,
...
"
CONCENTRATIONS OF HEAVY METALS AND ORGANOCHLORINES
IN MARINE MAMMALS OF NORTHERN WATERS:
OVERVIEW AND EVALUATION
by
R. Wagemann and D.C.G. Muir
Western Region
Department of Fisheries and Oceans
Winnipeg, Manitoba R3T 2N6
This is the 169th Technical Report
from the Western Region, Winnipeg

i i
© Minister of Supply and Services Canada 1984
..
..
Cat. no. Fs 97-6/1279E
Correct citation for this publication is:
ISSN 0706-6457
Wagemann, R., and D.C.G. Muir. 1984. Concentrations of heavy metals andorganochlorines in marine mammals of northern waters: overview andevaluation. Can. Tech. Rep. Fish. Aquat. Sci. 1279: v + 97 p.

iii
TABLE OF CONTENTS
· . . . . .
· . . .· . . . .
· . . . . .
i v11123446788
97
· .· . . .
· . . .
· . . .
· . . .
· . . .
· . .· . .
· . . .
· . . .· . . .
· . .
· . . . .
· . .
· . .· . . . . .
ABSTRACT/RESUME •••••••••••••INTRODUCTION ••••••••••••••••••••••••RESULTS AND DISCUSSION ••••••••
Mercury in Cetaceans •••••••••••••Other metals in Cetaceans •••••Mercury in Pinnipeds • •• • •••••••Other metals in Pinnipeds ••••••••••••••••Chlorinated hydrocarbons in Cetaceans •••••Chlorinated hydrocarbons in Pinnipeds ••••
CONCLUDING REMARKS •••ACKNOWLEDGMENTS • • • • • • • • •REFERENCES ••••••••••••••••APPENDIX: Statistical treatment
LIST OF TABLESTable Page
1 Concentration of Hg in Cetaceans · · · · · · · · · · · · · 132 Concentration of Zn, Cu, Pb in Cetaceans · · · · · · · · · 193 Concent rat ion of Cd in Cetaceans · · · · 224 Concentration of Se in Cetaceans · · · · • · · · · · · · · · · 245 Concentration of Hg in Pinnipeds · · · · · · · · · · · · 266 Concentration of Zn in Pinnipeds · · · · · · · · · · · · • · · · · 387 Concentration of Cu in Pinnipeds · · · · · · · · · • · · 418 Concentration. of Pb in Pinnipeds · · · · · · · · · · · · 449 Concentration of Cd in Pinnipeds · · · · · · · • · · · · · · · · 47
10 Concentration of Se in Pinnipeds · · · · · · · · · · · · · · · 5211 Concentration of DDT in Cetaceans · · · · · · · · · · · · · · 5512 Concentration of PCB in Cetaceans · · · · · · · 6113 Concentration of DDT in Pinnipeds · • · · · · · · · · · 6714 Concentration of PCB in Pinnipeds · · · · · · · · • · · · 78
LIST OF FIGURESFigure
1 Hg in 1i ver of Cetaceans · · · · · · · · · · · · · · · · · · · ·2 Hg in muscle of Cetaceans · • · · · · · · · · · · ·3 Hg in kidney of Cetaceans · · · ·4 Hg in 1i ver of seals · · · · · · · · · · · · · · · · · · ·5 Hg in muscle of seals · · · · · · · · · · · · · · · · · · · · · ·6 Hg in kidney of seals · · · · · · · · · · · · · · · · ·7 PCBs in Cetacean blubber · · · · · · ·8 DDT in Cetacean blubber · · · · · · · · · · · · · · · · · · ·9 DDT in seal blubber · · · · · · · · · · · ·10 PCBs in seal blubber · · · · · · · · · · ·
Page
87888990919293949596

ABSTRACT
Wagemann, R., and D.C.G. Muir. 1984. Concen-trations of heavy metals and organochlorines in marine mammals of northern waters:overview and eval uation. Can. Tech. Rep.Fi she Aquat. Sci. 1279: v + 97 p,
Published data on heavy metal and organochlorine concentrations in tissues of cetaceansand pinnipeds, mainly from northern waters, werecompiled. The data were subjected to multiplecomparison by Scheffe's method, and assessed forsignificant differences.
Most cetaceans had mercury concentrations(wet weight basis) of 0.02-1.6 ~g/g in muscletissue, 1-2 ~g/g in renal tissue, and 3-20 ~g/g
in the liver. Of all cetaceans some dolphins,pilot whales, and short-finned pilot whales hadthe highest recorded mercury levels in theirtissues. Systematic differences in mercury1evel s among different species of animal s werenot apparent.
Most mean mercury concentrations (89% ofthe compiled data) in the 1i ver of seals werebelow 65 ~g/g, and below 3.4 ~g/g and 0.94 ~g/g
in renal and muscle tissue, respectively. .Amongseals there was no differentiation of mercuryconcentration according to species of animals,but age seemed to be one of the factors determining the level of mercury in tissues. A limited number of other metals data (Zn, Cu, Pb, Se)are also given and discussed.
Mean cadmi um concentrati ons in renal ti ssue of whales 28-64 ~g/g were higher than in thesame tissue of most seals and porpoises. Cadmium concentrations in kidneys of striped dolphins (25 ~g/g on average) were comparable tothe concentrations in whales. In both cetaceansand seals cadmium was consistently higher inrenal tissue than in hepatic tissue by a factorof 2-5.
Statistical comparison of total DOT (rOOT)concentrat ions in cetaceans revealed four di stinct groups. Dolphins from the Californiacoast had higher rOOT levels than dolphins fromthe Medi terranean coast of France or porpoi sesfrom the Bay of Fundy. The 1atter group hadsignificantly higher rOOT than all other groups.PCB levels followed a similar trend, but onlytwo groups (coast of France and all other data)could be discerned.
Levels of rOOT and PCB in narwhal blubber(Pond In1et , N. W. T., Canada) averaged 3.51 and10.09 ~g/g, respectively, with males havingsignificantly higher levels than females.Results were not correl ated with 1ength of theanimals. The residue levels in narwhals couldnot be distinguished statistically from otherorganochlorine data for cetaceans from Greenlandor the North Atlantic.
Compari son of concentrations of PCBs inpinnipeds (blubber) revealed four distinctgroups. Seal s from the Bal tic and the North Seacoast of the Netherlands had significantlyhigher PCB levels than all other animals.Levels of PCBs in seals from Canadian waters
iv
were significantly lower than those from theBaltic except for harbour seals in the Bay ofFundy. Five di st i nct groups of pi nni peds cou1dbe delineated for ZOOT residues, with sea lionsfrom the California coast having the highestlevels, and seals from the Canadian Arctic thelowest.
Key words: marine mammals; heavy metals; chlorinated hydrocarbons; PCB; DOT; literature reviews; northern waters;cetaceans; pinnipeds; mercury; cadmium.
RESUME
Wagemann, R., and O.C.G. Muir. 1984. Concen-trations of heavy metals and organochlorines in marine mammals of northern waters:overview and eval uation. Can. Tech. Rep.Fishe Aquat. Sci. 1279: v + 97 p,
Un ensemble de donnees disponibles sur lesconcentrations de metaux lourds et d'agentsorganochlores trouvees dans des tissus de cetaces et de pinnt pedes des eaux septentrionalesont ete rassemblees et une etude comparee de cesdonnees d'apres la methode de Scheffe a eteentreprise.
La plupart des cetaces avaient des niveauxde mercure (poids humide) de 0.02 a 1.6 ~g/g
dans leur tissu musculaire, de 1 a 2 ~g/g dansle tissu renal, et de 3 a 20 ~g/g dans le tissuhepatique. Les tissus de certains dauphins,ainsi que ceux des globicephales noirs del'Atlantique et de ql obtcepha l es a nageoirescourtes, contenaient du mercure aux niveaux lesplus eleves enr eqt str-es a ce jour. Les differences de ni veaux entre ces animaux ne peuventetre attribuees a leur appartenance a une especeplut6t qu'a une autre.
La pl upart des niveaux moyens de mercure(soit 89% des donnees) etaient inferieurs a 65~g/g dans 1e ti ssu hepati que, a 3. 4 ~g/g dans1es ti ssus renaux et a O. 94 ~g/g dans 1e ti ssumusculaire. En comparant les especes de phoquesune a une, on n'a trouve aucune difference dansles niveaux de mercure de leurs t i ssus , Cependent, on a constate que l'age semblait etre undes facteurs determinants de la concentration demercure. Les resultats d'analyses suppl ementa i res sur un certa in nombre de metaux, tel quele Zn, le Cu, le Pb et le Se, sont aussi presentes dens: cet article.
Les concentrations moyen~s en cadmium destissus renaux de baleines variaient entre 28 et64I-1g/g. Cependant elles etaient plus eleveeschez la plupart des phoques et des marsouins.Les concentrations en cadmium du foie du dauphinbleu (Stenella coeruleoalba) etaient comparablesa celles des baleines (25 ~g/g en moyenne).Chez 1es cetaces et 1es pinni pedes etud i es, 1edegre de concentration en cadmium etait systematiquement plus eleve dans le tissu renal quedans le tissu hepatique, dans un rapport de 2 a5.
La comparai son stati sti que des concentrations totales en DOT (rOOT) constatees dans le

pannicu1e des cetaces, a reve1e 1'existence dequatre groupes distincts. Le pannicu1e desdauphins provenant des cotes Ca1iforniennes contenaient des concentrations de EDDT plus e1eveesque ce11es provenant des dauphins des cotesmediterraneennes de France ou de 1a baie deFundy tandi s qu ' un quatri eme groupe heterogenecontenait 1es niveaux 1es plus faib1es. Lesconcentrati ons de PCB sui vant 1a meme tendance,avec deux groupes distincts cependant (un provenant des cotes de France, l ' autre du restantdes donnees).
Les niveaux de EDDT et PCB dans 1e pannicu1e des narvals (Pond Inlet, LN.-O.) atteignaient en moyenne 3.51 et 10.09 ~g/g, respectivement, 1e niveau des males etant sensib1ementplus el eve que ce1ui des feme 11 es. Les resu 1tats n'indiquaient pas de correspondance ent re1a teneur en DDT et 1a longueur tota1e des animaux. On n I a trouve aucune difference si gnifi cati ve entre 1es ni veaux d I agents organoch1oresobtenus chez 1e narva1 et 1es ni veaux obtenuschez 1es cetaces du Groen1 and ou de l' At1anti queNord.
La comparaison des concentrations d'agentsorganoch1ores entres les divers pinnipedes (pannicu1e) a revel e que 1es phoques des cotes desPays-Bas baignees par 1a mer du Nord ont uneteneur en PCB nettement plus elevee que tous lesautres ani maux etudi es. Les niveaux de PCB desphoques habitant les eaux c~nadiennes etaientsensiblement moins eleves que ceux de la merBaltique, sauf les phoques communs de la baie deFundy. On a pu distinguer cinq groupes de pinnipedes sur la base de leurs concentrations respectives en EDDT, 1es otaries de Californieayant les concentrations les plus elevees et lesphoques de 1 'Arctique, 1es concentrations lesplus basses.
Mots-c1es: mammiferes marins; metaux lourds;carbohydrates chlorines; BPC; DDT;recherches bib1iographiques; eaux dunord; cetaces; plnnt pedes ; mercure;cadmium.
v

t

INTRODUCTI ON
A large body of data on mercury and chlorinated aromatic hydrocarbons in pinnipeds hasbeen published over the past ten years. Reviewsand qualitative comparisons of residue levels invarious pinniped species from different geographic locations have been made (Holden 1978a,1975). There is nevertheless a need for furtherupdating of the existing data base and review ofthe literature. The published data on pollutantburdens in tissues of cetaceans is less extensive than for pinnipeds. An asssessment of someof this data has been made (Gaskin 1982). Wehave attempted a systematic documentation of thedata base for pi nni peds and cetaceans innorthern waters (up to mid 1983) and compared,statistically, heavy metal and organochlorineconcentrations in various tissues largely fromnorthern waters. The objective was to provide areadily accessible overview of most existingheavy meta1sand organoch 1ori ne data for mari nemammals from northern waters, and to assessthese data for any s i gnifi cant differences orsimilarities from whic~ conclusions about hotspots of pollution might be drawn. A multiplemeans comparison of the data usi ng Scheff~ 'smethod (Scheff~ 1959) has been emp 1oyed in thehope of obtai ni ng a better perspecti ve on thedegree of hazard to marine mammals in Canadianwaters, as well as other areas, from cont i nuedaccumulation of heavy metals and chlorinatedaromatic hydrocarbons ; A further reason fordoing such an analysis was simply to avoid thetendency of attributing significance, throughvisual inspection of data plots, to differenceswhere there might be none.
This method of analysis (Scheff~ 1959) waschosen because it is app1i cab1e to unequal sample sizes which was the situation faced here andbecause it is the most conservative such test.It was assumed that the populations were normally di s t ri buted. However, departu res from normality have been reported for fish (Giesy andWiener 1977), and this is probably also true forsome mammalian tissues. It was, of course, notpossible to test the data post publication fornormality. The postulated significance levelsmust therefore be viewed with this in mind.
We recognized the possibility that theavailable data was not of uniform quality. Itis well known that at the trace level, measurements are subject to considerable interlaboratory variability (Morrison 1976; Holden 1981;Holden et al. 1983). Since the data base considered here spans more than a decade, duringwhich time methodologies and instrumentation mayhave changed, variability in the quality of datawould also be expected from this source. Ameaningful assessment of the data in this regardwas impossible, and the available data weresimply taken at face value. Concentrationsreported here are all expressed on a wet tissuebasis.
RESULTS AND DISCUSSION
MERCURY IN CETACEANS
A reasonably large number of mercury con-
1
centrations in t i ssues of cetaceans fromnorthern waters has been published to date(Table 1). We made a statistical comparison ofthe concentration means (wherever standarddeviations were available) using the Scheff~
multiple comparison method (see Appendix) on thevarious groups of animals. In a few instanceswhere the range but not the standa rd devi at ionwas given, we estimated the latter from therange in the usua1 way (Beyer 1966). Meansderi ved from fewer than three samples were notused in the analysis. The results of thisanalysis are shown in Fig. 1, 2 and 3 for mercury in liver, muscle and kidney, respectively.The bars in these figures are not error bars inthe usual sense; they only indicate the outcomeof the Scheffa test. The means were compared inall cases at the a = 0.10 level of significance. Wherever the bars overlap, the corresponding means do not differ significantly, andonly those groups differ significantly from eachother whose bars do not overlap.
The average mercury concentrations in theliver of cetaceans (i.e. not individuals) rangedfrom 3-205 ~g/gJ but only the short-finned pilotwhales, and striped dolphins (not shown in Fig.1, off scale) having the highest mercury concentration, differed significantly from all othergroups which did not differ amongst themselvesdespite the wide range of thei r means (3-20~g/g) (Fig. 1). There is no distinct segregation (at €I= 0.10) between porpoises, narwhalsand belugas, for example, as far as mercury inliver is concerned. Since most of the data inthis order are for harbour porpoi ses from theeast coast of the U.S.A. (ME) and Canada (N.S.),a global, regional comparison of Hg-levels wasnot possible. However, one harbour porpoisefrom the North Sea (index no. 32, Table 1) had amercury level in the liver comparable to thehighest levels in porpoises from the Atlanticcoast in North America. Mercury levels in theliver of cetaceans and seals apparently aredetermi ned to a 1arge extent by the age of theanimal (Gaskin et ale 1979; Sergeant 1980), butthis did not become overly apparent from theavailable data base. The fact that most groupsconsisted of only a few individuals also tendedto make the analysis less discriminating.
There is undoubtedly a limit to the concentration of mercury (or any toxic metal) thatan animal can tolerate in its tissues notwithstanding the beneficial effect that selenium mayexert in this regard. For mercury in mammalianhepatic tissues this limit appears to be withinthe range of 100-400 ~g/ g, wet weight, (MARC1980). Dead or ill seals and sea lions found inthe wild with mercury levels in their liverswithin this range (Reijnders 1980; van de Ven etale 1979; Buhler and Mate 1973; Henriksson andKarppanen 1969) would seem to be a manifestationof these critical limits. The mean concentration in the liver of the 1979-group of narwhals(index no. 13, Table 1) is approximately 6 ~g/g,and the highest concentration in any individualof thi s group was 13 ~g/ g. Some short fi nnedpilot whales have 100-360 ~g/g of mercury (indexno. 6, IS, 16, Table 1) and a group of stripeddolphins from the east coast of Japan had up to485 ~g/g (205 ~g/g on average, index no. 98,Table 1), a seemingly critically high concentration of mercury in liver.

Mercury levels in muscle tissue of cetaceans were segregated by Scheff~'s procedureinto three distinct groups (Fig. 2). The bluewhite and striped dolphins (index no. 48, 98,Table 1) having the highest mercury concentration (6.73 and 7.02 I-Ig/g, not shown in Fig. 2)were significantly different from all othergroups. Most groups had mercury levels inmuscle tissue in the range of 0.02-1.6 I-Ig/g(Fig. 2). Pilot whales (index no. 8, 6, Table1), wi th the second hi ghest concent rat ion (4I-Ig/g) are significantly different from dolphinsand a11 other groups whi ch do not di ffersignificantly among themselves in their mercurylevels (Fig. 2). It;s noteworthy that baleenwhales (sei, fin, minke) have the lowest concentration of mercury in their tissues. This maybe a consequence of their diet as has beenpointed out by Sergeant and Armstrong (1973),and a possible source of variable mercury levelsamong certain seal species. For cetaceans theavailable data are too few to show that neither1ocat i on of catch nor speci es di fferences correlated with concentration of Hg in any tissues.
Mercu ry in renal tissue of cetaceans ishighest (8.65 I-Ig/g, Fig. 3) for short-finnedpilot whales and striped dolphins (8.71 I-Ig/g,not shown in Fig. 3, index no. 6, 98, Table 1)and next highest (3.56 I-Ig/g) for some harbourporpoises from the coast of New Brunswick,Canada (i ndex no. 27, Table 1). These groupsdi ffer si gnifi cant ly from each other and fromall other groups (Fig. 3). Aside from thesegroups, cetaceans have mercury concentrations inrenal tissue in the range of 1-2 I-Ig/g. Quiteconsistently the pilot whales, short-finnedpilot whales, and dolphins have the highest mercury levels in liver, muscle and kidney. Theavailable data are not extensive enough to discriminate between various localities.
Hepatic tissue of cetaceans has consistently higher mercury levels than muscle orrenal tissue by approximately a factor of five,while renal and muscle tissues have comparablemercury levels.
OTHER METALS IN CETACEANS
Concentrations of In, Cu, and Pb in cetaceans have been measured to date only in narwhals, harbour porpoises and the striped dolphinas far as we know (Table 2), but these data arei nsuffi ci ent for an extensi ve group-compari sonby the Scheffa method. Concentrations of Cd andSe have been determined also in other cetaceans(Tab1es 2 and 3). The 1979-samp1e of narwhalshas, of all the marine mammals recorded here,the highest average cadmium concentration inrenal tissue (63.5 I-Ig/g, Table 3) except oneseal which had a slightly higher concentration(65.9 I-Ig/g, index no. 126, Table 9). These narwhals were all caught in the same general areanear Pond Inlet on Baffin Island. The 1979group of narwhals do not differ significantlyfrom the 1977 group of narwhals at 30.5 I-Ig/g ofCd in their renal tissue (index no. 12, Table 3)at the Cl = 0.10 level of significance, mainlybecause the concentration of cadmium in the tissues of narwhal varied more greatly from animalto animal than for any other metal. The onlyother whales in which cadmium concentrations
2
have been measured are the short-finned pilotwhale and the minke whale (a single animal ineach case) with 42 I-Ig/g and 28 I-Ig/g of cadmiumin their renal tissues, respectively (Table 3).Striped dolphins from the eastern coast of Japan(index no. 98) had similarly high cadmium concentrations in renal tissue (25 I-Ig/g, average),apparently a consequence of the very hi gh cadmium concentration in the squid which these dolphins ate (Honda et al • 1983). Why cadmiumlevels in renal tissue of whales should be ashigh as they are is an open question. It isknown that the half-life of cadmium in the mammalian kidney varies greatly with species (e.g.three years for mice and ten years for man;Matsubara-Khan 1974; MARC 1980). Possibly thehalf-life of cadmium in whales is extremelylong, which would mean that these animals areessentially incapable of eliminating this metal.Consistently the concentration of cadmium ishigher in the kidney than in the liver by afactor of 2-4.
Selenium concentrations do not differsignificantly among narwhals in any of the tissues examined (index no. 12, 13, Table 4). Someconcentrations of Se in the liver are availablefor short-finned pilot whales (index no. 15, 16,Table 4), and these are significantly higherthan in narwhals. As noted before, these animals also have much higher mercury concentrations in their tissues than narwhals.
The 1979-narwha1 data had been subjectedto regression analysis (Wagemann et ale 1983),
-which revealed that the length of narwhals correlated positively very strongly with the mercury concentration in kidney, muscle and blubber, and with cadmium also positively (althoughsomewhat less strongly) in muscle and kidney.The corre1at ions between 1ength and the concentration of other metals were generally negativefor at least one sex, which would imply (to theextent that 1ength of an ani ma 1 and its age arere 1ated) that concent rat ions of Cu, In, and Pbare diminishing with time in the respective tissues, while Hg is accumulating in kidney, muscle, and blubber, and Cd is accumulating in kidney and muscle.
Mercury correlated strongly, positivelywith selenium in liver and kidney, and in liveralso with cadmium. linc correlated positivelywith cadmium in the liver and kidney (Wagemannet ale 1983). Which particular metals are associated with each other clearly depends on thetype of tissue; however one pair of elementsnamely, mercury and selenium, consistently correlated positively in liver and kidney. This isan interesting association since the latter element is reported to have an ameliorating influence on the toxicity of mercury in fish (Gantheret ale 1972), and also appears to govern theaccumulation and affect the toxicity of mercuryin mammalian tissues (Parizek et al , 1971; ElBergearmi et ale 1973; Potter and Matrone 1974;Chen et al . 1975; Hansen and Kristensen 1979).The atomic concentration ratio Hg/Se is claimedto be most frequently near I, for hepatic tissue. This ratio has been reported to range from1-9 for hepatic tissue in seals (Koeman et al •1975, 1973). In narwhals (1979-group), thisratio was found to be in the range of: 0.22-1.70for liver, 0.066-0.56 for renal tissue, 0.039-
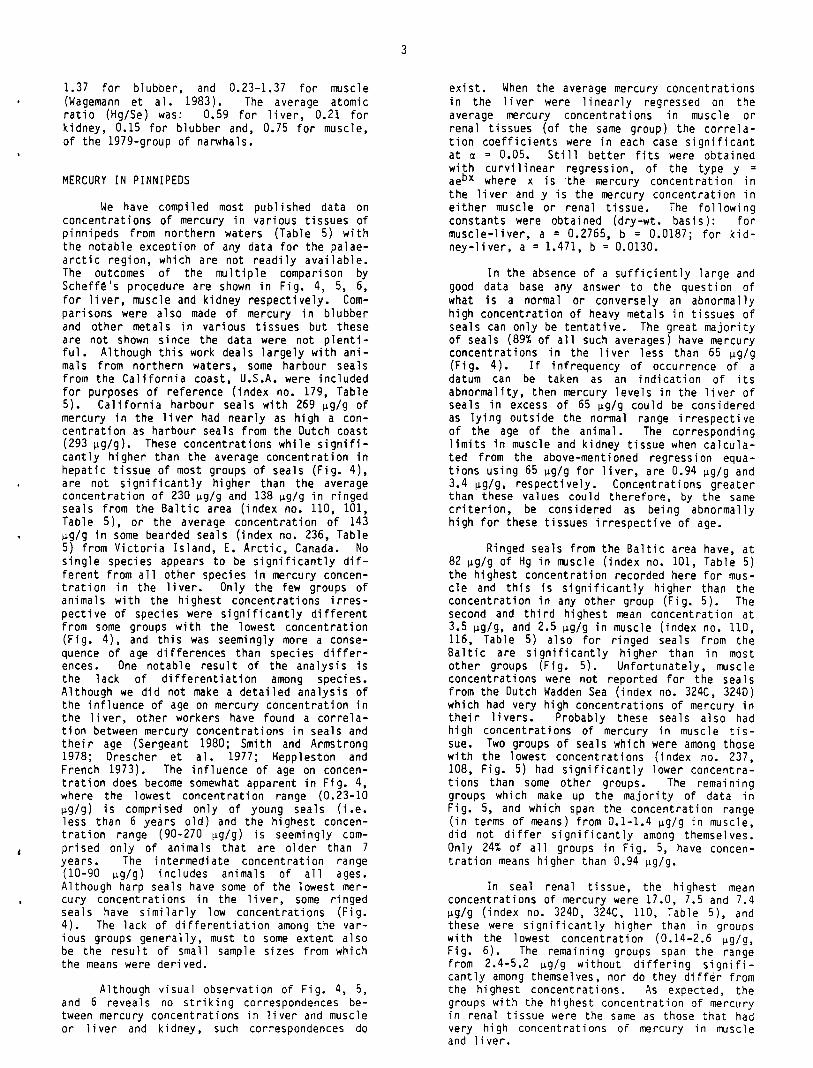
1.37 for blubber, and 0.23-1.37 for muscle(Wagemann et al. 1983). The average atomicratio (Hg/Se) was: 0.59 for liver, 0.21 forkidney, 0.15 for blubber and, 0.75 for muscle,of the 1979-group of narwhals.
MERCURY IN PINNIPEDS
We have compiled most published data onconcentrations of mercury in various tissues ofpinnipeds from northern waters (Table 5) withthe notable exception of any data for the palaearctic region, which are not readily available.The outcomes of the multiple comparison byScheff~'s procedure are shown in Fig. 4, 5, 6,for liver, muscle and kidney respectively. Comparisons were also made of mercury in blubberand other metals in various tissues but theseare not shown since the data were not p1ent iful. Although this work deals largely with animals from northern waters, some harbour sealsfrom the California coast, U.S.A. were includedfor purposes of reference (index no. 179, Table5). California harbour seals with 269 ~g/g ofmercury in the liver had nearly as high a concentration as harbour seals from the Dutch coast(293 ~g/g). These concentrations while significant ly hi gher than the average concent rat ion inhepatic tissue of most groups of seals (Fig. 4),are not significantly higher than the averageconcentration of 230 ~g/g and 138 ~g/g in ringedseals from the Baltic area (index no. 110, 101,Table 5), or the average concentration of 143~g/g in some bearded seals (index no. 236, Table5) from Victoria Island, E. Arctic, Canada. Nosingle species appears to be significantly different from all other species in mercury concentration in the liver. Only the few groups ofanimals with the highest concentrations irrespective of species were significantly differentfrom some groups with the lowest concentrat i on(Fig. 4), and this was seemingly more a consequence of age differences than species differences. One notable result of the analysis isthe lack of differentiation among species.Although we did not make a detailed analysis ofthe influence of age on mercury concentration inthe liver, other workers have found a correlation between mercury concentrations in seals andthei r age (Sergeant 1980; Smith and Armstrong1978; Drescher et a l , 1977; Heppleston andFrench 1973). The i nfl uence of age on concentration does become somewhat apparent in Fig. 4,where the lowest concentration range (0.23-10~g/g) is comprised only of young seals (i .e.less than 6 years old) and the highest concentration range (90-270 ~g/g) is seemingly comprised only of animals that are older than 7years. The intermediate concentration range(10-90 ~g/g) includes animals of all ages.Although harp seals have some of the lowest mercury concentrations in the liver, some ringedseals have similarly low concentrations (Fig.4). The lack of differentiation among the various groups generally, must to some extent alsobe the result of small sample sizes from whichthe means were derived.
Although visual observation of Fig. 4, 5,and 6 reveals no striking correspondences between mercury concentrations in liver and muscleor 1i ver and kidney, such correspondences do
3
exist. When the average mercury concentrationsin the liver were linearly regressed on theaverage mercury concentrations in muscle orrena 1 tissues (of the same group) the corre1at i on coeffi ci ents were in each case sign ifi cantat IX = 0.05. Still better fits were obtainedwith curvilinear regression, of the type y =aebx where x is the mercury concentration inthe liver and y is the mercury concentration ineither muscle or renal tissue. The followingconstants were obtained (dry-wt , basis): formuscle-liver, a = 0.2765, b = 0.0187; for kidney-liver, a = 1.471, b = 0.0130.
In the absence of a sufficiently large andgood data base any answer to the questi on ofwhat is a normal or conversely an abnorma llyhigh concentration of heavy metals in tissues ofseals can only be tentative. The great majorityof seals (89% of all such averages) have mercuryconcentrations in the liver less than 65 ~g/g
(Fi g. 4). If infrequency of occu rrence of adatum can be taken as an indication of itsabnormality, then mercury levels in the liver ofseals in excess of 65 ~g/g could be consideredas lying outside the normal range i rrespecti veof the age of the ani ma 1. The correspondi nglimits in muscle and kidney tissue when calculated from the above-mentioned regression equations using 65 ~g/g for liver, are 0.94 ~g/g and3.4 ~g/g, respectively. Concentrations greaterthan these values could therefore, by the samecriterion, be considered as being abnormallyhigh for these tissues irrespective of age.
Ringed seals from the Baltic area have, at82 ~g/g of Hg in muscle (index no. 101, Table 5)the highest concentration recorded here for muscle and this is significantly higher than theconcentration in any other group (Fig. 5). Thesecond and thi rd hi ghes t mean concent rat i on at3.5 ~g/g, and 2.5 ~g/g in muscle (index no. 110,116, Table 5) also for ringed seals from theBaltic are significantly higher than in mostother groups (Fig. 5). Unfortunately, muscleconcent rat ions were not reported for the sea 1sfrom the Dutch Wadden Sea (index no. 324C, 324D)which had very high concentrations of mercury intheir livers. Probably these seals also hadhigh concentrations of mercury in muscle tissue. Two groups of seals which were among thosewith the lowest concentrations (index no. 237,108, Fig. 5) had significantly lower concentrat ions than some other groups. The rema i ni nggroups which make up the majority of data inFig. 5, and which span the concentration range(in terms of means) from 0.1-1.4 ~g/g in muscle,did not differ significantly among themselves.Only 24% of all groups in Fi g. 5, have concentration means higher than 0.94 ~g/g.
In seal renal tissue, the highest meanconcentrations of mercury were 17.0, 7.5 and 7.4~g/g (index no. 324D, 324C, 110, Table 5), andthese were significantly higher than in groupswith the lowest concentration (0.14-2.6 ~g/g,
Fig. 6). The remaining groups span the rangefrom 2.4-5.2 ~g/g without differing significantly among themselves, nor do they differ fromthe hi ghest concent rat ions. As expected, thegroups with the highest concentration of mercuryin renal tissue were the same as those that hadvery high concentrations of mercury in muscleand liver.

OTHER METALS IN PINNIPEDS
The mean concentration of zinc in theliver of all seals ranged from 34-81 ~g/g. Thehighest concentration differed significantlyfrom all others except the second and thirdhighest namely, 59 and 57 ~g/g (index no. 203,205, Table 6). All remaining groups had concentration means in the range from 34-56 ~g/g, andthese di d not differ s i gnifi cant ly among themselves. The highest zinc concentration in liverwas 109 ~g/g in a Weddell seal from the Antarctic (index no. 249). As would be expected, thesame animal had also a high concentration ofzinc in nusc le (84 ~g/g). The mean concentrations of zinc in muscle tissue ranged from 20-34~g/g (index no. 127, 208, Table 6), and in renaltissue from 19-46 ~g/g (index no. 198, 128,Table 6). Concentrations of some individuals(rather than group means) do fall outside thisrange. No group differs from any other significantly in concentration neither in muscle nor inkidney.
A single leopard seal fetus from the Antarctic (index no 148) had at 53 ~g/g copper inthe liver the highest concentration. A group ofleopard seals of unknown age (but probablyyoung) from the Antarctic (index no. 246, Table7) had nearly as hi gh a concentrati on of copperin the liver (44.6 ~g/g). Some grey seals fromthe North Sea (index no. 163, Table 7) had thethird highest concentration (28 ug/g). Onlythese two groups differed significantly fromother groups. All other groups had copper concentrations in the liver in the range of 5.7-15~g/g, and these did not differ among themselves. Young animals seem to have higher concentrations than old ones, Table 7. Only fourconcentration means of copper in muscle and kidney were available for comparison. These rangefrom 0.65-3.2 ~g/g in muscle, and 2.5-10.6 ~g/g
in the kidney. In the latter organ only thehighest mean (index no. 129, Table 7) wassignificantly different from others, and in muscle the highest and lowest means were each different from the rest.
In the 1i ver the majority of 1ead concentration means were in the range of 0.15-0.60I-Lg/g (Table 8) with no significant differencesamong groups within that range regardless ofspecies •. The three highest concentration means(2.3, 5, 10 ~g/g, Table 8) were each significantly different from all other means. For I1lJS
cle only three lead concentration means wereavailable two of which (0.04, 1.2 ~g/g; Table 8)differed significantly from each other. In kidney tissue the concentrations (means) rangedfrom 0.32-1.17 I-Lg/g (Table 8) with some significant differences occurring among groups, but thetota 1 number of groups avail ab1e for compa ri sonwas only fi vee
Some ringed seals from Greenland (indexno. 130, Table 9) with a mean of 17.0 I-Lg/g ofcadmi um in the 1i ver had a si gnifi cant ly hi gherconcentrations than any other group. All othergroups had mean concentrations of cadmium in theliver in the range of 0.018-7.32 I-Lg/g (Table 9),and none of them differed si gnifi cant ly amongthemselves. In muscle tissue the cadmium meanconcentrations span the range from 0.029-0.15
4
~g/g (Table 9), but only the highest mean differed from some others. In renal tissue, despite the wide range of cadmium concentrations(0.10-37.4 ~g/g, Table 9) there was no significant difference between any of the means. Thisseems to be again mainly a consequence of thelarge variation in cadmium levels among individual animals (large standard deviations), seemingly peculiar to this metal. The cadmium concentration is consistently higher, by a factorof 2 to 5, in renal tissue than in hepatic tissue. It appears that on the whole cadmium inrenal and hepatic tissues of seals is lower thanin the corresponding tissues of some whales.
Only one concentration mean of selenium inmuscle tissue (0.57 ~g/g, Table 10) was reportedin the literature (index no. 246). In the liverall but three groups have concentration means inthe range of 1.80-36.0 ~g/g (Table 10), andthese groups do not differ si gnificantly amongthemselves. A group of ringed seals from theBaltic area (index no. 110, Table 10) at 81~g/g, and two other groups of harbour seals fromthe Dani sh and Dutch coasts (i ndex no. 324C,324D), at 112 and 109 ~g/g respectively, had thehighest selenium concentration in the liver, andthese were s i gnifi cant ly hi gher than the meansof most other groups. As pointed out previ ously, these same groups of seals also had thehighest levels of mercury.
CHLORINATED HYDROCARBONS IN CETACEANS
There are a growing number of reports inthe literature on levels of polychlorinatedbiphenyls (PCBs), 1,1-bis(4-chlorophenyl)2,2,2-trichloro-ethane (DDT) and its dechlorinated metabolites (rDDT) and other organochlorinepesticide residues in cetaceans. Gaskin (1982)has revi ewed many of these reports and compa redlevels of these contaminants in animals fromdifferent geographical areas. Tables 11 and 12list published results for PCBs and rDDT wheretwo or more specimens were reported and includesresults from the analysis of narwhal blubbersamp 1es from our 1aboratory (i ndex No. 13A and13B). Stat i st i ca1 comparisons of the mean concentrations of PCBs and rOOT in-cetacean blubberwere made using Scheff~'s test (at the a=0.10level of significance) for all results consisting of 5 or more animals. In some casesresults of male and female specimens which werereported separately by the authors (e.g. indexno. 59, 60, 54, 55, Tables 11 and 12) werepoo1ed to increase the size of the group andhence the sensitivity of the comparison.
Cetaceans are differentiated into fourdistinct groups on the basis of rDDT levels inblubber using Scheff~'s test (Fig. 7). Dolphinsfrom the coast of California (1968-76) have thehi ghest levels of rDDT reported for cetaceans(index no. 85, 87), significantly higher thanall other reports. Dolphins from the coast ofFrance (index no. 79) and porpoises from the Bayof Fundy (sampled in 1969-70) had significantlyhigher LDDT levels than all remaining specimens(Fig. 7) which included baleen whales and allArctic species. Fewer results were availablefor compa ri s i on of PCB than DDT concent rat ionsby use of Scheff~'s test but a similar trend was

evident (Fig. 8) although only two distinctgroups are apparent. Dolphins from the coast ofFrance (index no. 79) had significantly higherPCB 1eve 1s than cetaceans from Green1and andfrom several locations in the North Pacificocean. Two bott 1enose do1phi n sped mens notincluded in the statistical comparison (indexno. 85) had PCB levels averaging 435 \.1g/g inblubber which are among the highest reported1eve 1s for thi s contami nant in cetaceans.Levels of PCBs (but not EOOT) in porpoises fromthe North Sea (index no. 76, 23) and the Bay ofFundy were relatively high (79-114 \.1g/g blubber)but could not be distinguished statisticallyfrom all other results. The high levels of PCBsand DDT in dolphins reported by A1zieu and Ouguy(1979) pertain primarily to animals from theMediterranean coast of France. These authorsobserved mean concentrations of 47.7 \.1g/g PCBsin dolphin (Stenella caeru1eoa1ba) fat (lyophilized) from the Atlantic coast (one specimen)and 122-259 \.1g/g in the same speci es from theMediterranean. The results in Fig. 7 and 8 arefrom a combi ned samp 1e reported by the authors(index no. 78, 79, 80, Tables 11 and 12).
The results of PCB and EOOT residues incetaceans, although fewer than reports on thesame contaminants in pinnipeds, provide interesting information on the geographic distributionof these residues (Gaskin 1982). EOOT levelswere ext reme1y hi gh in cetaceans froll) the coastof Ca 1i forni a and Bay of Fundy samp 1ed in thelate 1960's and early 1970's presumably reflecting large scale agricultural and forestry usesas we 11 as manufactu ri ng (i n Ca1iforni a). BothEOOT and PCB 1eve1s are hi gh in cetaceans fromthe French coast while animals from the NorthSea (The Netherlands coast and the U.K.; inblubber, index no. 86, 23, 51) had 2-fo1d higherPCB than EOOT levels. Narwhals from the BaffinIsland area also have about 2-fo1d greater PCBthan EOOT levels (index no. 13). Belugas in theMackenzie River Delta had similar EOOT levels inblubber to those in the Eastern Arct i c but farlower PCB levels (i .e. a detection limit of 0.5\.1g/g was not exceeded, Addison and Brodie(1973)) (index no. 54) indicating that foodchain contamination by PCBs is much greater inthe North Atlantic than in the Beaufort Sea.Cetaceans in Japanese waters had similar PCB andEOOT levels and could not be distinguishedstatistically from Arctic-dwelling species(Fig. 7 and 8).
Levels of PCBs and EOOT in baleen whales(index no. 14, 57, 58A, 59, 60, 67, Tables 11and 12) are lower than those of other speciesinhabiting roughly the same geographic loca-tion. This reflects the diet of Ba1aenopterawhich consists primarily of crustaceans.Euphausiid, squid and fish-eating cetaceans canbe roughly ranked according to increasing chlorinated hydrocarbon levels corresponding to theirpositions on the food chain (Gaskin 1982).
Comparison of EOOT levels in animals sampled over a 5-10 year period may not reflectdecreasing levels of this contaminant followingbanning of this insecticide in the early1970's. Decreases in EOOT concent rat ions inblubber over a five year period from the late1960's to the mid-1970's have been observed in
5
seals from the Farne Islands (Holden 1978b), butno significant decrease in EOOT levels in perpoi ses samp 1ed in the Bay of Fundy between 1968and 1977 has been observed. In fact mean levelsactually increased slightly between 1975 and1977 (Gaskin 1982). Unfortunately there are, asof this writing, no other reports of continuousmonitoring of cetacean populations for chlorinated hydroca rbons. Gi ven the cont i nued use ofDDT in many deve1opi ng count ri es , and its persistence in the environment it appears valid tocompare rOOT levels of various populations without taking into account the date of sampling.
PCB and EOOT concentrations in liver, kidney and muscle of cetaceans are also reported inTable 11 and 12 but there were insufficient numbers to make statistical comparison worthwhile.The importance.of blubber as an indicator tissuein cetaceans is illustrated by Tanabe et a l •(1981) who determined whole body burdens of PCB,EOOT, HCB and hexachlorocyclohexane isomers(HCH) in 5 striped dolphins ranging in age from3 mo. to 36.5 yr. Greater than 93% of thechlorinated hydrocarbon residues were present inblubber regardless of age or sex. Muscle contained <7% of the residues although it comprised55% of body weight while all other tissues contained <1% of the body burden.
Correlation of EOOT and PCB levels withage of pinnipeds has been frequently attemptedbut few correlations have been made with cetaceans because of 1ack of age data. Gask i n etal , (1983) reported a significant positive correlation of PCB levels in male harbour porpoiseblubber with age. A negative correlation (notsignificant at P=O.OI) of age with PCB levels infemale blubber was observed. Taruski et al.(1975) found higher organochlorine levels in"mature" compared to "immature" animals. Gaskinet a1. (1971) reported lower 1eve 1s of EOOT insuckling male porpoises than mature males. However, pregnant and lactating females hadsignificantly lower concentrations of EOOT inblubber and' 1i ver than rna 1es or i mmatu refemales. Concentrations of EOOT and PCB in narwhal blubber (index no. 13A, 13B) were not correlated with length of the animals, but stepwiseregression analysis of log EOOT and log PCB concentrations on sex (0 = males; 1 = females) andlength (em) indicated correlations with gender(r=-0.65 and -0.54 for log EOOT and log PCB respectively). Correlations were not improvedusing the cross-product (sex)x(length). EOOTconcentrations could be expressed by the regressi9n equation log EOOT=-0.606(sex) + 0.647(R =0.42) while PCB concentrations could beex~ressed as log PCB = -0.247(sex) + 1.054(R =0.30). Gaskin et a l . (1983) reported asignificant correlation of PCB levels in porpoise blubber with length for males only. Bodysize is unlikely to correlate well with organochlorine concentration except perhaps in younganimals because it increases asymptotically withtime, however, it is frequently the only datafor cetaceans. Higher EOOT and PCB levels aregenerally observed in male than in female cetaceans and th is difference has been thor-oughlydocumented in pinnipeds (Helle et al. 1976b).The differences in organochlorine concentrationswith sex are readily explained by excretion ofthese compounds via lactation, as demonstratedin seals (Addison and Brodie 1977).

Other chlorinated hydrocarbon residuesfrequently reported in cetaceans include HCB,HCH isomers, chlordane, oxych10rdane, transnonachl or , dieldrin and o,p-OOT isomers. Ingeneral, these compounds are present at levels100 to 1000-fo1d lower than PCB or LOOT mak i ngassessment of their effects difficu1t.Recentreports of re 1at i ve1y hi gh toxaphene and ch1ordane residues (10 - 11 I-1g/g blubber) in greyseal s from the Baltic Sea (Jansson et al • 1979)and chlordane in Canadian polar bears (Norstrom,Canadian Wildlife Service, Ottawa, personal communication) suggest that these pesticides may beincreasing in concentration in wildlife. O'Sheaet a1. (1980) reported toxaphene residues averaging 0.13 I-1g/g in dolphins and porpoises fromCalifornia and Japan.
There is little information on what concentrations of PCB or LOOT in cetaceans may present a health risk to the animals or may lead toreproductive failure (Holden 1978a; Gaskin1982). A1zieu and Ouguy (1979) have suggestedon the basis of dolphin results that concentrations of PCBs in liver of 20 mg/kg (lyophilizedtissue) may present a health risk to the animals. This would correspond to a level of 50 200 I-1g/g (wet weight) in blubber based on theirresults. Concentrations of PCBs in ringed sealsin the 50-100 I-1g/g range have been linked to thelow reproductive rate of grey, harbour andringed seals in the Baltic (Helle et al , 1976a;Jensen et al. 1979). Premature parturition inCalifornia sea lions has been linked to LOOTlevels in the 626-1039 I-1g/g range and PCB levelsin the 85-145 I-1g/g range (Delong et a l , 1973).Porpoises in the North Sea (index no. 76, 23),the Mediterranean coast of France (i ndex no.79), the Bay of Fundy (index no. 92A) and theCalifornia coast have PCB levels in the 50-200I-1g/ grange whi ch may put these popu 1at ions atrisk.
CHLORINATED HYDROCARBONS IN PINNIPEOS
A 1arge body of 1iteratu re exi sts on concentrations of chlorinated hydrocarbons in pinnipeds. Holden (1972, 1975, 1978a) has reviewedthe literature and compared results reported forpinnipeds in various geographical areas. Tables13 and 14 1i st most of the pub1i shed reports ofLOOT and PCBs, respectively, for pinnipeds innorthern waters up to mid 1983. Reports on singl e ani ma 1s and those in southerly waters wereomitted. Mean concent rat ions of LOOT and PCBsin blubber were compared at the <1=0.10 level ofs i gnifi cance, by use of Schef f e ' s test as descri bed for cetaceans. Means deri ved from fewerthan seven animals were omitted in order toimprove the comparison. Exceptionally high PCBlevels in five harbour seals from the North Sea(index no. 288) were included in the PCB comparison and in several cases results from thesame species in the same locale, that werereported sepa rate ly by the authors (e q, adultmales and females) were pooled to increase sample size (index no. 106, 310, 214, 216).
Five distinct groups could be delineatedby Scheff~'s test on LOOT levels in pinnipedblubber (Fig. 9). Sea lions from the Californiacoast, sampled in the early 1970's, had signifi-
6
cantly higher LOOT levels than all other pinnipeds (index no. 325, 326A). Two groups of sealsfrom the Baltic Sea and Gulf of Bothnia (indexno. 281, 280, 252) had significantly higher LOOTthan all pinnipeds except California sea lions.Harbour seals from the North Sea (index no. 212,296) had LOOT levels that were not significantlydifferent from those of harp, grey and ringedseals in the Gulf of St. lawrence (index no.313, 310, 226), Sable island (index no. 282,283), Greenland (index no. 106, 214,322) orScotland (index no. 212, 296, 286A). A fifthgroup consisted of female ringed seals from theBaltic area (index no. 251, 253-255) and harbourseals from the Gulf of Maine (index no. 165)which differed significantly from the high andlow groups with LOOT concentrations in the SOlID I-1g/g range (Fig. 9).
Average PCB concentrations in pinnipedblubber that were compared statistically rangedfrom 0.96-1470 I-1g/g (generally reported on a wetweight basis) (Fig. 10). Four distinct groupsemerge from the statistical comparison. Harbourseals from the North Sea coast of the Netherlands and Germany sampled in 1970-71 (index no.288) and again in 1975-76 (index no. 324B) hadthe highest average PCB levels reported for anymarine mammals. The 1970-71 samples weresignificantly higher than all other resultswhile the 1975-76 results could not be distinguished statistically from grey, harbour, andringed seals from the Baltic (index no. 252255). One factor not taken into account in thestatistical comparison was the date of samplecollection. Most samples used in the comparisonwere collected between 1968 and 1977. Use ofDDT was curtailed in Europe and North America bythe early 1970's. Consistent decreases in EOOTlevels in blubber (from 20 I-1g/g to 6 I-1g/g) havebeen noted in grey seals from the Farne Islandssamp 1ed between 1968 and 1975 (Holden 1978b).Harp seals from the Gulf of St. lawrence sampledin 1973 were found to have lower levels of LOOTand PCB than those samp 1ed in 1971 (Jones etal. 1976). Other reports suggest that PCBlevels in seals did not decrease during the1970's. Holden (1978b) reported virtually identical PCB levels in grey seals from the FarneIslands between 1968 and 1975. Sergeant (1980)reported PCB levels in harp seals (index no.324, Table 14) sampled in 1979 that were verysimilar to those reported by Addison et al ,(1973) for samples collected in 1971 (index no.310, 311).
As noted with organoch 1ori ne res i dues incetaceans, the PCB and LOOT res i dues in pi nni peds can provi de i nformati on on the geographi cdistribution of these contaminants. Sea lionsfrom the California coast (sampled in 1970) hadextraordinarily high LOOT levels (index no. 325,326A) but they had PCB levels that were about10-fo1d lower and similar to those in seals fromthe Baltic Sea (Fig. 10). The high LOOT levelsin sea lions and dolphins from the Californiacoast reflect high contamination with DDT inthis region. PCB levels were up to 4-foldhigher in dolphins than in sea lions. Harbourseals from the North Sea coast of the Netherlands had high PCB levels but their LOOT concentrations could not be distinguished statistically from ringed and grey seals in the Baltic or

harbour seals from the Bay of Fundy (Fig. 9).rOOT levels were also higher than PCB in sealsfrom the Gulf of Bothnia and Bothnian Bay (indexno. 215-255). Pinnipeds in the Canadian Arcticand Green1and had PCB and rOOT 1eve1s genera llyless than 10 I-1g/g in blubber (Fig. 9 and 10)which suggests these contaminants are widelydispersed, but no consistent trends in PCB/rOOTratios were apparent. Seals and walrus fromGreenland had 4 to 7-fo1d greater PCB levelsthan rOOT (C 1ausen 1978; Born et a1. 1981) asdid ringed seals from Holman Island (Addison andSmith 1974). However, other seal samples fromthe Canadian Arctic and Greenland (mainly ringedseals, index. no. 256, 257, 106, 107) had similar or sl i qht ly higher (up to 2-fo1d) levels ofrOOT than PCB (Bowes and Jonke 1 1975; Johansenet a1. 1980).
The age range of the animals is includedin Fi g. 9 and 10, as stated by the authors,since there have been several reports correlating age of male pinnipeds with organochlorineresidue levels (Addison and Smith 1974; Helleet a1. 1976b; Born et a1. 1981). Mature malesgenerally have the highest organochlorine levelswithin a pinniped population. Female pinnipedshave generally lower PCB and rOOT levels presumably due to mobilization and excretion of organochlorines during lactation and their residuelevels do not correlate with age. Parturitionis not thought to be a major pathway of loss oforganoch 1ori nes since the foetus in both pi nnipeds and cetaceans contains less than 1% of theresidue present in maternal blubber (Oonkin eta1. 1981; Tanabe et a1. 1981). Addison andBrodie (l977) demonstrated that during 1actat ion. grey sea 1s may excrete an amount, of rOOTand PCBs similar to that which they would likelyingest from a fish diet.
Other organochlorine residues frequentlyreported in pinniped tissues include HCB, HCHisomers and dieldrin. Like the DDT residues,dieldrin has been found to be decreasing inblubber of grey seals from Scotland sampledbetween 1965 and 1974 (Holden 1978a). Improvements in analysis of chlorinated hydrocarbons byuse of capi11iary columns and gas chromatography-mass spectrometry have brought aboutidentification of other chlorinated compoundsincluding chlordane isomers (Kerkhoff and DeBoer 1982), mirex (Ten Noever de Brauw et ale1973), toxaphene (Jansson et ale 1979) and polychlorinated terpheny1s (PCT) (Renberg et al ,1978). Toxaphene and rcnl ordane residues inBaltic grey seal blubber were similar (l0-1lIJ.g/g) but were only 1-2% of the DDT and PCBlevels in the same sample. PCT levels in blubber of three Baltic grey seals ranged from 0.51.0 I-1g/g or 0.5-1.4% of PCB levels. The highPCB levels in seal blubber have led to attemptsto identify polychlorinated dibenzofurans(PCOFs) which are contaminants in PCB fluids andare formed during pyrolysis or incomplete combust i on of PCBs (Bowes et a1. 1973; Rappe andBuser 1980). Rappe et ale (1981) confi rmed thepresence of a series of PCOFs totalling 40 pg/gin Baltic grey seal blubber. The major components identified were penta- and hepta- COFsas well as the toxic 2,3,7,8-COF isomer(1 pg/g). The PCDF components were present atabout 2.5xl06 - fold less than PCB levels in the
7
blubber. Individual PCB isomers have generallynot been monitored in pinniped blubber to dateand authors have reported residues based on comparison with commercial formulations such asArochlor 1254/1260 or Phenochlor OP-6. Donk i net ale (1981) used a microwave plasma detectorto monitor chlorinated hydrocarbons in seal tissues and identified PCB isomers based on C1/Crat i os • They reported that hexa- and hept achlorobipheny1s were the major PCB isomers present (actual congeners were not identified)represent i ng about 87% of tota 1 PCB res i dues ingrey seal blubber. Oonkin et ale (1981) alsodetermined total organohalogens in seal blubberextracts by microcou10metry and found that totalresidue measured by GLC (as PCB, rOOT and dieldrin) averaged 66.9% of that the organo-halogenspresent. 'A major portion of the remainingorganochlorine residue in blubber was likely inthe form of metabolites of PCBs and DDT. Jensenand Jansson (1976) reported that methyl sulfonemetabolites of PCB and DOE were present at about20 I-1g/g in the Baltic seal blubber which contained 150 IJ.g/g PCB and 138 I-1g/g DOE. Phenolicmetabolites of PCBs and DOE have also been identified in field-collected seal excreta (Janssonet ale 1975; Sundstrom et a1. 1975).
High levels of PCBs (>100 I-1g/g in blubber)have been linked to premature parturition in sealions (DeLong et ale 1973) and reproductivefailure in seals from the Baltic (Helle et a1.1976b) and the Dutch Wadden Sea (Ouinker et ale1979) but the cause and effect relationships arenot well established. Helle et ale (1976b)analysed 109 female seals (mainly ringed seals)of reproductive age from the Baltic area andfound a hi gh frequency of patho1ogi ca1 changesin the uterus which explained the low rate ofreproduction. They also found that rOOT and PCBconcentrations were significantly higher in thegroup showing pathological changes than in thosewhich di d not show such changes. On revi ewingthe results of Helle et a1. (1976b) (index no.251), Holden (1978a) noted that the differencesin residue levels between non-pregnant and pregnant females seemed insufficient to explain theobserved failure to reproduce. Nonpregnantfema1es can be expected to have hi gher organochlorine levels since loss of residues via lactat i on does not occur , The fi ndi ng of PCDFsinBaltic seal blubber including the toxic TCOFisomer and further monitoring in other sealpopulations may help explain the connectionbetween organoch 1ori ne 1eve1s and rep roduct i vefailure. PCDFs and PC ODs are known to have adepressive effect on reproductive capacity inmamma 1s , and on the vi abil ity of offspri ng ofexposed mothers (McConne 11 1980). A su rvey ofPCOFs and PCODs in sea 1 popu1at ions wou 1d beuseful to determine ratios of these micro contami nants with PCBs and to i dent ify popu1at ionshaving high PCDF and PCDD exposure.
CONCLUDING REMARKS
We have attempted to extract some concentrat i on norms for toxi cant burdens in ma ri nemammals from the existing data base. Only formercury and chlorinated hydrocarbons in pinnipeds were the data numerous enough to approach
this goal. But even there, the available datawere sufficiently unsystematic from a geographicand chrono 1ogi ca 1 poi nt of vi ew to prec 1ude thecertain delineation of the various factorsseparately, i.e. geographic location, date ofsampling, and age of animals. Statistically,the size of samples (consisting frequently ofonly 1-5 animals) was more often than not toosmall, and this should be remedied in futuredata gatherings. Vital information such as thesex and age of animals, as well as the standarddeviation of the set of data comprising the sample, was frequently lacking. Such data do notlend themselves well to statistical treatment.The aging of whales, particularly narwhals andbelugas, is a problem that should be addressedin view of the connection between age and toxicant burden. The data base for toxicant burdensin cetaceans is presently too small to allow theextraction of concentration norms for these animals. In view of the rapidly increasingdevelopment of hitherto pristine areas, and theanticipated banning in the future of the killingof a number of wha 1e speci es , the gatheri ng ofsuch data is pressing.
Aside from the difficulties mentioned,there is a further 1imitation imposed by thenatu re of the data; namely, that "tota1" heavymetal concentrations are by themselves insufficient to assess either the health status of theanimals, or the effective toxicity of the toxicant in question. Yet, these "total substance"concentrations are important and necessary asthey are the only direct indicator of the actualburden that an animal carries. Without such"tota1" concent rat ions any other meta1 speci esconcentration datum is by itself incomplete andinsufficient. Total concentrations can providea much needed benchmark for what is to be regarded as a "norma1" or an "abnorma1" heavy metalburden for animals in the wild. The interpretation of such burdens in terms of the well-beingof the animal must, of course, be sought throughother types of data.
The available data base for marine mammalsis almost devoid of any reference to antagonistic or synergistic effects of metals other thanmercury and selenium. Only in two studies todate (Honda et a l , 1983; Wagemann et al , 1983)have elements other than these two a1so beenmeasured, and interrelationships shown toexist. Whether these relationships are of suchgeneral ity as to be found in all cetaceans isstill an open question.
The data base for organoch 1ori ne res i duesconsists mainly of rOOT and PCB results. DDTuse has been 1arge ly eli mi nated and many pastuses of PCB's curtailed during the 1970's inmany regions adjacent to marine mammal habitatsin northern waters. Futu re ana lys is wi11 hopefully focus on other organochlorines in wide useunt il recent ly, such as ch1ordane, HCH, toxaphene as well as PCDD's and PCDF's. Furtherwork on the phenolic and methylsulfone metabolites of PCB's, DDT and other chlorinated aromatics would also be useful since this may providean ins i ght into rates of eli mi nat i on of thesecontami nant s , and es t i mates of tota 1 body burdens of each compound.
8
ACKNOWLEDGMENTS
We sincerely thank the persons who helpedin preparing this manuscript: Messrs. A. Lutz,J. Solomon, R. Hunt, and K.C. Tam for analyticalwork; Ms. S. Ell i ott and Mr. J. Man i ar for computer work and calculations; Miss R. Blosmanisfor initial tabulations of data and Mr. K.E.Marshall for computer searches of data bases;Mrs. G. Decterow and Mi ss M. Zipri ck for typi ngthe manuscript and Mrs. L. Fletcher for finalproducti on by word-processor; Mr. A. Blouw forgraphical work.
We also wish to thank our colleaguesMessrs. B. Fallis, A. Lutz, and F.A.J. Armstrongfor providing some unpublished metal concentration data, Dr. T.G. Smith for providing us withsome seal samples from the Antarctic, and Mr.P. Richard for assistance with the translationof the Abstract.
REFERENCES
ADDISON, R.F., and P.F. BRODIE. 1977. Organo-chlorine residues in maternal blubber,milk and pup blubber from grey seals(Halichoerus grypus~ from Sable Island,Nova Scotla. J. F1S • Res. Board Can. 34:937-941.
ADDISON, R.F., and P.F. BRODIE. 1973. Occur-rence of DDT residues in beluga whales6Delphinapterus leucas) from the Mackenzieelta, N.W.T. J. Fish. Res. Board Can.
30: 1733-1736.
ADDISON, R.F., S.R. KERR, J. DALE, and D.E. SERGEANT. 1973. Variation of organochlorineresidue 1evel s with age in Gul f of St.Lawrence harp seal s (Pagophil us groenl an~6o~S). J. Fish. Res. Board Can. 30: 595-
ADDISON, R.F., and ToG. SMITH. 1974. Organo-chlorine residue levels in Arctic ringedsea 1s: vari ati on with age and sex. Oi kos25: 335-337.
ADDISON, R.F., M.E. ZINCK, and R.G. ACKMAN.1972. Residues of organochlorine pesticides and polychlorinated biphenyls insome commercially produced Canadian marineoil s, J. Fi sh, Res. Board Can. 29: 349355.
ALZIEU, C1., and R. DUGUY. 1979. Teneurs encomposes organochlores des cetaces et pinni pedes frequentant 1es cates fr-ancai ses.1979. Oceanol. Acta 2: 107-120.
ANAS, R.E. 1974a. DDT plus PCB's in blubber ofharbour seals. Pestic. Monit. J. 8: 12-14.
ANAS, R.E. 1974b. Heavy metals in the northernfur seal (Callorhinus ursinus) and harbourseal (Phoca vitullna richardi). U.S. NatlMar. F~erv. F1Sh. Bull. 72: 133-137.
einerNordZool.
,
ANAS, R.E., and A.J. WILSON Jr. 1970a. Organo-chlorine pesticides in fur seals. Pestic.Monit. J. 3: 198-200.
ANAS, R.E., and A.J. WILSON Jr. 1970b.Organochlorine pesticides in nursing furseal pups. Pestic. Manit. J. 4: 114-116.
ANAS, R.E., and D.O. WORLUND. 1975. Comparisonbetween two methods of subsampling blubberof northern fur sea 1s for tota1 DDT plusPCB's. Pestic. Monit. J. 8: 261-262.
ANDERSEN, S.H., and A. REBSDORFF. 1976. Poly-chlorinated hydrocarbons and heavy metalsin harbour porpoise (Phocoena phocoena)and whitebeaked dolphln (Lagenorh*nchusa1bi rost ri s) from Dani sh waters. quat.Mamm. 4: 14-20.
AR IMA, S., and K. NAGAKURA. 1979. Mercury andselenium content of Odontoceti. Bull.Jon, Soc. Sci. Fish. 45: 623-626.
BEYER, W.H. (ed.) 1966. Handbook of tabl es forprobability and statistics. Chemical Rub-ber Company, Cleveland, OH. 502 p,
BLI GH. E. G. , and F. A. J. ARMSTRONG. 1971.Marine mercury poll ution in Canada. Int.Counc. Exp lor. Sea ICES C.M. 1971/E34.
BORN, LW., I. KRAUL, and T. KRISTENSEN. 1981.Mercury, DDT and PCB in the Atlantic walrus (Odobenus rosmarus rosmarus) from theThule district, North Greenland. Arctic34: 255-260.
BOTTA, J. R. , E. ARSENAULT, and H. A. RYAN.1983. Total mercury content of meat and1i ver from inshore Newfoundl and-caughtharp seal (Phoca groenlandica). Bull.Environ. Cont~oxlcol. 30: 28-32.
BOWES, G.W., and C.J. JONKEL. 1975. Presenceand distribution of polychlorinated biphenyls (PCB) in Arctic and subarcticmarine food chains. J. Fish. Res. BoardCan. 32: 2111-2123.
BOWES, G.W., B.R. SIMONEIT, A. L. BURLINGARRE,B.W. DE LAPPE, and R.W. RISEBOROUGH.1973. The search for chlorinated dibenzofurans and chlorinated dibenzodioxins inwildlife populations showing elevatedlevels of embryonic death. Environ.Health Perspect. 5: 191-198.
BUHLER, D.R., and B.R. MATE. 1973. Mercurylevels in California sea lions, p, 97101. In D.R. Buhler (ed.). Proceedingsof the WOrkshop on mercury in the westernenvironment. OSU Continuing EducationPublications, Corvallis, OR.
CAINES, L.A. 1978. Heavy metal residues ingrey sea 1s (Ha 1i choerus grypus) from theFarne Isl ands. Int. Counc. Explor. SeaICES C.M. 1978/E: 40.
CHEN, R.W., V.L. LACY, and P.O. WHANGER. 1975.The effect of sel eni urn on methylmercurybinding to subcellular and soluble pro-
9
teins in rat tissues. Res. Commun. Chern.Pathol. Pharmacol. 12: 297.
CLAUSEN, J. 1978. The content of polychlorina-ted hyd roc arbons in Arct i c ecosystems, p.222-226. In Environment and qual ity of1i fe, fi naf"reports of research sponsoredunder the first environmental researchprogram. Commi ssi on of European Communities, Brussels.
CLAUSEN, J., L. BRAESTRUP, and O. BERG. 1974.The content of polychlorinated hydrocarbons in arctic mammals. Bull. Environ.Contam. Tox i co1. 12: 529-534.
DELONG, R.L., W.G. GILMARTIN, and J.G. SIMPSON.1973. Premature bi rths in Cal ifornia sealions: association with high organo-chlorine pollutant residues levels.Science (Wash. DC) 181: 1168-1170.
DONKIN, P., S. V. MANN, and E. I. HAMILTON.1981. Polychlorinated biphenyl, DDT anddieldrin residues in grey seal (Halichoerus ~) males, females and motherfoetus palrs sampled at the Farne Islands,Engl and, duri ng the breedi ng season.Sci. Total Envi ron. 19: 121-142.
DRESCHER, H. E. 1978. Uber den FundRi ngel robbe, Phoca hi spi da , an derseekuste von-xnTeswlg-Aolstein.Anz. 200: 141-144.
DRESCHER, H.E., U. HARMS, and E. HUSCHENBETH.1977. Organochlorines and heavy metals inthe harbour seal, Phoca vitulina, from theGerman North Sea--coast. Ma r , Bi 01 •(Berl.) 41: 99-106.
DUINKER, J. C., M. Th. J. HILLEBRAND, and R.F.NOLTING. 1979. Organochl ori nes andmetals in harbour seals (Dutch Waddensea). Mar. Pollut. Bull. 10: 360-364.
EL-BERGEARMI, M.M., C. GOUDIE, H.E. GANTHER, andM.L. SUNDE. 1973. Attempts to quantitatethe protective effect of selenium againstmercury toxicity using Japanese quail.Fed. Proc. 32: 886A.
FALCONER, C.R.. I.M. DAVIES, and G. TOPPING.1983. Trace metal s in the common porpoise, Phocoena phocoena. Mar. Environ.Res. 8: 119-127.
FORRESTER, D. J., D. K. ODELL, N. P. THOMPSON, andJ.R. WHITE. 1980. Morphometrics, parasites and chlorinated hydrocarbon residuesof pygmy killer whales from Florida. J.Mammal. 61: 356-360.
FRANK, R., K. RONALD, and H. E. BRAUN. 1973.Organochl ori ne res i dues in harp sea 1s(Pagophilus groenlandicus) caught ineastern Canadian waters. J. Fish. Res.Board Can. 30: 1053-1063.
FREEMAN, H.C., and D.A. HORNE. 1973. i~ercury
in Canadian seals. Bull. Environ. Contam,Tox t col , 10: 172-180.

FREEMAN, H.C., G. SANGALANG, J.F. UTHE, and K.RONALD. 1975. Steroidogenesis in vitroin the harp seal (Pagophilus groenrari"="dicus) without and with methyl mercurytreatment in vivo. Environ. Physiol. Biochem. 5: 428-~
GALSTER, W.R., and J. BURNS. 1972. Accumula-tion of pesticides in Alaskan marine mam-mals. Proc. Alaska Sci. Conf. 23: 50.
GANTHER, H.E., G. GOUDIE, M.L. SUNDE, M.J.KOPECKY, P. WAGNER, S.H. OH, and W.G.HOEKSTRA. 1972. Selenium: relation todecreased toxicity of methyl mercury addedto diets containing tuna. Science (Wash.DC) 175: 1122-1124.
GASKIN, D.E. 1982. Environmental contaminantsand trace el ements: thei r occurrence andpossi b1e si gnifi cance in Cetacea, p, 393433. In D.E. Gaskin. The ecology ofwhales and dolphins. Heinemann Educational Books, London.
GASKIN, D.L. R. FRANK. and M. HOLDRINET.1983. Polychlorinated biphenyls in harbour porpoises. Phocoena ghocoena (L.).from the Bay of Fundy. Cana a and adjacentwaters. with some information on chlordaneand hexachlorobenzene levels. Arch.Environ. Contam. Toxicol. 12: 211-219.
GASKIN. D.E•• R. FRANK. M. HOLDRINET. K. ISHIDA.C.J. WALTON. and M. SMITH. 1973. Mercury, DDT and PCB in harbour seals (Phocavitulina) from the Bay of Fundy andGUlTof Maine. J. Fish. Res. Board Can. 30:471-475.
GASKIN. D.E •• M. HOLDRINET. and R. FRANK.1971. Organochlorine pesticide residuesin harbour porpoises from the Bay of Fundyregion. Nature (Lond, ) 233: 499-500.
GASKIN. D. E•• K. ISHIDA. and R. FRANK. 1972.Mercury in Harbour Porpoises (Phocoenaphocoena) from the Bay of Fundy region.J. Fl sh. Res. Board Can. 29: 1644-1646.
GASKIN, D.E., D.J.D. SMITH. P.W. ARNOLD, M.V.LOUISY, R. FRANK. M. HOLDRINET. and J.W.McWADE. 1974. Mercury, DDT. dieldrin andPCB in two species of Odontoceti (Cetacea)from St. Lucia. Lesser Antilles. J.Fish, Res. Board Can. 31: 1235-1239.
GASKIN. D.E., K.I. STONEFIELD, P. SUDA, and R.FRANK. 1979. Changes in mercury 1evel sin harbour porpoises from the Bay ofFundy, Canada and adj acent waters duri ng1969-1977. Arch. Environ. Contam. Toxicol. 8: 733-762.
GIESY, J.P. Jr, and J.G. WIENER. 1977. Fre-quency di stributions of trace metal concentrations in five freshwater fishes.Trans. Am. Fi sh, Soc. 106: 393.
HAMANAKA, 1., 1. ITOO, and S. MISHIMA. 1982.Age-related change and distribution ofcadmium and zinc concentrations in theStell er sea 1ion (Eumetopias jubata) from
10
the coast of Hokkaido, Japan. Mar.Po 11 ut , Bu 11. 13: 57-61.
HAMANAKA, 1.. H. KATO, and T. TGUJITA. 1977.Cadmium and zinc in Ribbon seal. HistriothOCa fasciata, in the Okhotsk Sea. Res.nst • N. Pac Fisn, Spec. Vol. 547-561.
HANSEN, J.C., and P. KRISTENSEN. 1979. Inter-action between inorganic mercury and seleni urn. p, 156-159. In Management and control of heavy metals in the envi ronment.Proceedi ngs from an Internat i ona1 Conference held in London, September 1979.CEP Consultants Ltd•• Edinburgh. UK.
HARMS. U., H. E. DRESCHER, and E. HUSCHENBETH.1978. Further data on heavy metal sandorganochlorines in marine mammals fromGerman coastal waters. Meeresforschung26: 153-16l.
HELLE. E•• M. OLSSON. and S. JENSEN. 1976a.DDT and PCB 1eve1sand reproduct ion inringed seal from the Bothnian Bay. Ambio5: 181-189.
HELLE. E•• M. OLSSON. and S. JENSEN. 1976b.PCB levels correlated with pathologicalchanges in seal uteri. Ambio 5: 261-263.
HENRIKSSON. K., and E. KARPPANEN. 1969. Kvick-silverhalter Hos Insj d-och Havssalar, p,54-59. In Nordiskt Symposium Kring Kvick-sil verprQl)l ematiken. 10-11 oktober 1968.
HEPPLESTON. P.B•• and M.C. FRENCH. 1973. Mer-cury and other metals in British seals.Nature (Lond.) 243: 302-304.
HEPPLESTON. P.B. 1973. Organochlorines in Bri-ti sh grey seal s , Mar. Poll ut , Bull. 4:44-45.
HOLDEN. A. V. 1972. Monitori ng organoch 1ori necontamination of the marine environment bythe analysis of residues in seals. p.262-272. In M. Ruivo (ed.) Marine pollut i on and sea 1ife. Fishi ng News Books.London.
HOLDEN. A.V. 1975. The accumulation of oceaniccontaminants in marine mammals. Rapp.P. V. Reun. Cons. Int. Explor. Mer 169:353-361.
HOLDEN, A. V. 1978a. Poll utants and seal s - areview. Mammal Rev. 8: 53-66.
HOLDEN. A.V. 1978b. Organochlorine residues inblubber of grey sea 1s Ha 1i choerus g?pus)from the Farne Isl ands. Int. ounc.Explor. sea ICES C.M. 1978/E-41.
HOLDEN, A. V. 1981. Organochlorines - an over-vi ew. Mar. Po11 ut , Bu 11. 12: 110-115.
HOLDEN. A. V., and K. MARSDEN. 1967. Organo-chlorine pesticides in seals and porpoises. Nature (Lond.) 216: 1274-1276.
HOLDEN, A.V., G. TOPPING, and J.F. UTHE. 1983.Use and relevance of analytical intercom-

1980.marineCounc.
parison exercises in monitoring the marineenvi ronment. Can. J. Fi she Aquat. Sci.40(Supp1. 2): 100-110.
HONDA, K., R. TATSUKAWA, K. ITANO, N. MIYAZAKI,and T. FUJIYAMA. 1983. Heavy metal concentrations in muscle, liver, and kidneytissue of striped dolphin, Stene11a coeru1eoa1ba, and their variations wlttiDOciYlength, weight, age and sex. Agric.Bio1. Chem. 47(6): 1219-1228.
HUSCHENBETH, E. 1977. Ergebni sse Uber Schwer-meta11- und Organoha10genuntersuchungen anverse hi edenen Zahnwa 1en von der Ost - undNordseekuste Schleswig-Holsteins. Inf.Fi schwi rtsch. 24: 162-164.
IMPERIAL OIL LIMITED. 1978. Heavy metal s Pro-ject Mackenzie Delta and Estuary. Areport by Beak Consultants, Calgary,Alberta, Canada.
JANSSON, B., S. JENSEN, M. OLSSON, L. RENBURG,G. SUNDSTROM, and R. VAZ. 1975. Identifi cation by GC-MS of phenol ic metabo1itesof PCB and p,p'-DDE isolated from Balticguillemot and seal. Ambio 4: 93-97.
JANSSON, B., R. VAZ, G. BLOMKVIST, S. JENSEN,and M. OLSSON. 1979. Chlorinated terpenes and chlordane components found infish, guillemot and seal from Swedishwaters. Chemosphere 4: 181-190.
JENSEN, S., A. G. JOHNELS, M. OLSSON, and G.OTTERLIND. 1969. DDT and PCB in marineanimal s from Swedi sh waters. Nature(Lond.) 224: 247-250.
JENSEN, S. and B. JANSSON. 1976. Methyl sul-fone metabolites of PCB and DDE. Ambio 5:257-260.
JENSEN, S., B. JANSSON, and M. OLSSON. 1979.Number and identify of anthropogenic substances known to be present in Balticseals and their possible effects on reproduction, p, 436-448. In W.J. Nicholsonand J. A. Moore (ed. ) Rea lth effects ofhalogenated aromatic hydrocarbons. NewYork Academy of Sciences, NY.
JOHANSEN, P., F.O. KAPEL, and 1. KRAUL.Heavy metals and organochlorines inmammal s from Green1 and. Int.Exp l or , Sea ICES C.M. 1980/E:32.
JONES, D., K. RONALD, D.M. LAVIGNE, R. FRANK,M. HOLDRINET, and J.F. UTHE. 1976.Organochlorine and mercury residues in theharp seal (Pagophilus groen1andicus).Sci. Total EnVl ron. 5: 181-195.
KAR I, T., and P. KAURANEN. 1978. Mercury andselenium contents of seals from fresh andbrackish waters in Finland. Bull.Environ. Contam. Toxicol. 19: 273-280.
KERKHOFF, M., and J. DE BOER. 1982. Identifi-cation of chlordane compounds in harbourseal s from the coastal waters of theNetherlands. Chemosphere 11: 841-845.
11
KOEMAN, J. H., and H. VAN GENDEREN. 1966. Somepre1 iminary notes on residues of chlorinated hydrocarbon insecticides in birds andmammals in the Netherlands. J. Appl.Eco1. 3(Suppl): 99-106.
KOEMAN, J.H., W.H.M. PEETERS, C.H.M. KOUDSTAALHOI, P.S. TJIOE, and J.J.M. GOEIJ. 1973.Mercury-selenium correlations in marinemammal S. Nature (Lond.) 245: 385-386.
KOEMAN, J.H., W.H.M. PETERS, C.J. SMIT, P.S.TJIOE, and J.J.M. DE GOEIJ. 1972. Per-sistent chemicals in marine mammals. TNONi euws 27: 570-578.
KOEMAN, J.H., W.S.M. VAN DE VEN, J.J.M. DEGOEIJ, P.S. TIJOE, and J.L. VAN HAAFTEN.1975. Mercury and selenium in marine mammal sand bi rds. Sci. Total Environ. 3:279-287.
KURTZ, D.A., and K.C. KIM. 1976. Chlorinatedhydrocarbon and PCB residues in tissuesand lice of northern fur seals, 1972.Pestic. Monit. J. 10: 79-83.
LE BOEUF, B.J., and M. L. BONNELL. 1971. DDT inCalifornia sea lions. Nature (Lond.) 234:108-109.
MARC REPORT 1980. Environmental hazards ofheavy metals: summary evaluation of lead,cadmium, and mercury. MARC Report 20.Monitoring and Assessment Research Center,Chelsea College, University of London,London. 43 p,
MATSUBARA-KHAN, J. 1974. Compartmentalanalysis for the evaluation of biologicalhalf-lives of cadmium and mercury in mouseorgans. Environ. Res. 7: 54-67.
McCONNELL, E. E'. 1980. Acute and chroni c tax i-city, carcinogenesis, reproduction, teratogenesi sand metagenesi s in animal s , p,109-150. In R.D. Kimbrough (ed.) Halogenated bi phenyl s , terpheny1 s , naphthal enes,dibenzodioxins and related products.Elsevier/North Holland Biomedical Press,Amsterdam.
McKIE, J.C., I.M. DAVIES, and G. TOPPING. 1980.Heavy metals in grey seals (Halichoerus~s) from the east coast of Scotl and.Trit":"'Counc. Exp1or. Sea ICES.
MORRISON, G.H. 1976. Interpretation of accur-acy of trace element results in biologicalsamples, p, 65-77. In P.O. Lafleur(ed.). Accuracy in trace analysis: sampling, sample handling, analysis. U.S.Nat1 Bur. Stand. Spec. Publ. 422, Vol. 1.
NAGAKURA, K., A. SATOSHI, M. KURIHARA, T. KOGA,and T. FUJITA. 1974. Mercury content inwhales. Bull. Tokai Reg. Fish. Res. Lab.78: 41-46.
OLSSON, M., A.G. JOHNELS, and R. VAZ. 1975.DDT and PCB levels in seas from Swedishwaters. The occurrence of aborted sealpups, p, 43-65. In Proceedings from the

symposium on the seal in the Baltic.Statens naturvardsverk. Rep. SNV PM 591.
O'SHEA, T.J., R.L. BROWNELL Jr, D.R. CLARK Jr,W.A. WALKER, M.L. GAY, and T.G. LAMONT.1980. Organochlorine pollutants in smallcetaceans from the Pacifi c and southAtlantic oceans, November 1968 - June1976. Pestic. Monit. J. 14: 35-46.
PARIZEK, J., 1. OSTADALOVA, J. KALOUSKOVA, A.BABICKY, and J. BENES. 1971. Chapter 6.In W. Mertz and E.W. Cornatner (ed.) Newertrace elements in nutrition. MarcelDekker, New York.
POTTER, S., and G. MATRONE. 1974. Effect ofselenite on the toxicity of dietarymethylmercury and mercuric chloride in therat. J. Nutr. 104: 638-647.
RAPPE, C. and H. R. BUSER. 1980. Chemical properties and analytical methods, p, 47-76.In R.D. Kimbrough (ed.) Halogenated bipnenyl 5, terphenyl s , naphtha 1enes, di benzodioxins and rel ated compounds.Elsevier/North Holland Biomedical Press,.Amsterdam.
RAPPE, C., H.R.E. BUSER, D.L. STALLING, L.M.SMITH, and R.C. DOUGHERTY. 1981. Identification of polychlorinatd dibenzofuransin environmental samples. Nature (Lond.)292: 524-526.
REIJNDERS, P.J.H. 1980. Organochlorine andheavy metal residues in Harbour seal s fromthe Wadden Sea and their possible effectson reproduction. Neth. J. Sea Res. 14:130-65.
RENBERG, L., G. SUNDSTROM, and L. REUTERGARDH.1978. Polych1orianted terphenyls (PCT) inSwedish white-tailed eagles and in greysea1s, A pre1i mi nary study. Chemosphere6: 477-482.
ROBERTS, T.M., P.B. HEPPLESTON, and R.D.ROBERTS. 1976. Di stri but i on of heavymetals in tissues of the common seal.Mar. Pollute Bull. 7: 194-196.
ROSEWELL, K.T., D.C.G. MUIR, and B.E. BAKER.1979. Organochlorine residues in harpseal (Pagophi1us roen1andicus tissues,Gulf of St. Lawrence, 19 I, 9 • Pestic.Monit. J. 12: 189-191.
SASCHENBRECKER, P. W. 1973. Level s of DDT andPCB compounds in North Atlantic fin-backwhales. Can. J. Compo Med. 37: 203-206.
12
SMITH, T.G., and F.A.J. ARMSTRONG. 1975. Mercury in seals, terrestrial carnivores andprincipal food items of the Inuit, fromHolman, N.W.T. J. Fish. Res. Board Can.32: 795-801.
SMITH, T. G., and F.A.J. ARMSTRONG. 1978. Mercury and selenium in ringed and beardedseal tissues from Arctic Canada. Arctic31: 75-84.
STONEBURNER, D. L. 1978. Heavy metal s in ti s-sues of stranded short-finned pilotwhales. Sci. Total Environ. 9: 293-297.
SUNDSTROM, G., B. JANSSON, and S. JENSEN.1975. Structure of phenol i c metabo1i tesof p,p'-DDE in rat, wild seal and guillemot. Nature (Lond.) 255: 627-628.
TANABE, S., R. TATSUKAWA, H. TANAKA, K.MARUYAMA, N. MIYAZAKI, and T. FUJIYAMA.1981. Di stri but i on and total burdens ofchlorinated hydrocarbons in bodies ofstriped dolphins (Stenella coeruleoalba).Agric. Bio1. Chern. 45: 2569-2578;
TARUSKI, A.G., C.E. OLNEY, and H.E. WINN.1975. Chlorinated hydrocarbons in ceta-ceans. J. Fish. Res. Board Can. 32:2205-2209.
TEN NOEVER DE BRAUW, M.C., C. VAN INGEN, andJ.H. KOEMAN. 1973. Mirex in seals.Sci. Total Envi ron. 2: 196-198.
VAN DE VEN, W.S.M., J.H. KOEMAN, and A. SVENSON.1979. Mercury and selenium in wild andexperimental seal s , Chemosphere 8: 539555.
WOLMAN, A.A., and A.J. WILSON Jr. 1970.Occurrence of pesticides in whales.Pestic. Monit. J. 4: 8-10.
WAGEMANN, R., N.B. SNOW, A. LUTZ, and D.P.SCOTT. 1983. Heavy metals in tissues andorgans of the narwhal (Monodon monoceros).Can. J. Fish. Aquat. SC1. 40(Suppl. 2):206-214.
SCHEFFE, H. 1959.Wi 1ey, New York.
Analysis of variance.477 p,
SERGEANT, D. E. 1980. Level s of mercury andorganochl ori ne resi dues inti ssues of seamammals from the St. Lawrence estuary.Int. Counc. Explor. Sea ICES C.M. 1980/E: 55.
SERGEANT, D.E., and F.A.J. ARMSTRONG. 1973.Mercury in seal s from eastern Canada. J.Fi she Res. Board Can. 30: 843-846.

Table 1. Reference concentrations of Hg (wet weight basis) in different tissues of Cetaceans.
Index Year No. of Mean I Hg \Jg/gNo.* Species Location Taken Tissue Animals Sex Length / Age mean ! S.D. Range Source
(m) (yrs)
Sei Whale South Pacific 1972 Musc1e+ 9 M&F 14.3 0.03 ± 0.02 0.02 - 0.07 Nagakura et al .(Balaenoptera borealisJ (1974)
2 Sperm I~ha1e North Pacific 1972 Musc1e+ 7 M&F 11.4 1.31 ± 0.17 1.08 - 1. 56 Nagakura et a1.(Physeter catodonJ (1974)
3 Sperm Whale Antarctic Ocean 1972 Musc1e+ 6 M&F 12.0 1.33 ± 0.20 0.93 - 1.48 Nagakura et a1.(Physeter catodonJ (1974)
4 Fin Whale South Pacific 1948 Musc1e+ 8 M&F 20.2 0.02 ± 0.01 0.01 0.03 Nagakura et a1.(Balaenoptera physalusJ (1974)
6 Short Finned St. Lucia. 1972 Liver + 4 F 4.3 105.6 ± 65.2 19.2 - 157.0 Gaskin et al.Pilot Whale West Indies Muscle 4 F 4.3 3.99 ± 1.07 2.76 - 5.36 (1974) .......(GlobiaephaLa macrorhynahaJ Kidney 3 F 4.3 8.65 ± 2.50 6.0 - 11.0 w
7 Short Finned St. Lucia. 1972 Liver + M 4.2 21.40 Gaskin et al.Pilot Whale West Indies Muscle M 4.2 4.0 (1974)
(GlobicephaLa macrorhynchaJ Kidney M 4.2 14.0
15 Short Finned Cumberland Island 1977 Liver FA 3.7 145.0 ± 10.5c StoneburnerPilot Whale Georgia. USA Kidney FA 3.7 13.02 ± 2.02c (1978)
(GlobicephaLa macrorhynchaJ
16 Short Finned Cumberland Island 1977 Liver 2 FB 3.7 361.0 ± 131.5 268 - 454 StoneburnerPilot Whale Georgia. USA Kidney 2 FB 3.7 39.75 ± 22.56 23.8 - 55.7 (1978)
(Globicephala macrorhynchaJ
17 Short Finned Cumberland Island 1977 Liver M 3.9 56.90 ± 3.75 StoneburnerPilot Whale Georgia. USA Kidney M 3.9 4.79 ± 0.98 (1978)
(Globicephala macrorhynchaJ

Table 1. Continued
Index Year No. of Mean I Hg pg/gr~o. * Species Location Taken Tissue Animals Sex 1enJth / age mean S.D. Range Source
(m (yrs)
8 Pilot Whale L~akayama, 1975 Musc1e+ 12 3.4 / - 4.16 ± 0.72 3.01 5.18 Arima and(GZobiaephaZa meZaena) Japan Nagakura
(1979)
5 Beluga Whale Hudson Bay, 1969 Liver + 8.87 Bligh and(DeZphinaptepu8 Zeuaa8) Canada Muscle 0.97 Annstrong
Kidney 2.44 (1971 )
9 Beluga Whale Hudson Bay, 1971 Musc1e+ 43 0.53 Bligh and(DeZphinaptepus Zeuaas) Canada Annstrong (1971 )
11 Beluga Whale Mackenzie Delta 1972 Liver + 7 M&F 3.6 / - 6.26 ± 3.71 2.45 - 12.1 Lutz and ......(DeZphinaptepus Zeuaas) Kugma1it Bay, Muscle 7 M&F 3.6 / - 0.71 ± 0.14 0.60 - 1.0 Annstrong +:>
W. Arctic Canada (unpublished)
20 Beluga Whale Mackenz ie Delta 1977 Liver + 8 M&F 30.62 ± 20.53 8.48 - 56.3 Imperial Oil(DeZphinaptepus Zeuaas) and Estuary, Muscle 11 M&F 2.12 ± 1.15 0.14 - 4.33 (1978)
W. Arctic Canada Blubber 11 M&F 0.08 ± 0.09 <0.01 0.28
22 Be1uga I~ha 1e Baltic Sea 1977 Liver + 2.7 / - 4.4 Huschenbeth(DeZphinaptepus Zeuaas) Muscle 2.7 / - 1.6 (1977)
10 Narwhal Eastern Arctic 1971 Muscle+ 2 0.64 Bligh and(Monodon monoaepos) (Annstrong (1971 )
12 Narwhal Pond Inlet 1977 Liver + 6 5.98 ± 3.13 2.05 - 8.87 Fallis(Monodon monoaepos) Baffin Island, Muscle 6 0.84 ± 0.32 0.45 - 1.26 (unpublished)
Canada Kidney 6 1.18 ± 0.57 0.63 - 2.1Blubber 6 <0.01 <0.01
13 Narwhal Pond Inlet 1979 Liver + 37 M&F 3.7 / - 6.10 ± 3.13 0.57 - 13.1 Wagemann et al.(Monodon monoaepos) Baffin Island, Muscle 58 M&F 4.3 / - 0.85 ± 0.04 0.22 - 1. 59 (1983)
CaJldUa Kidney 54 M."..F 3.8 / - 1. 71 ± 0.14 0.37 - 5.69Blubber 44 rl&F 4.2 / - 0.03 ± 0.01 <0.005 - 0.06

Table 1. Continued
Index Year No. of Mean Hg \.Ig/gflo. * Species Location Taken Tissue Animals Sex 1enqth / age mean ! S.D. Range Source
(m) (yrs)
14 Minke Whale Umanak, 1972 Liver + 4 0.15 ± 0.08t 0.09 - 0.25 Johansen et al.(Balaenopte~a acutoroatrata) W. Greenland Muscle 9 0.11 ± 0.05 t 0.06 - 0.21 (1980)
18 Minke Whale Disko Bay, 1978 Liver + 6 0.18 ± 0.13 t 0.07 - 0.41 Johansen et al.(Balaenoptera acutoroatrata) W. Greenland Muscle 6 0.15 ± 0.06 t 0.09 - 0.25 (1980)
23 Bottlenose Whale North Sea 1977 Liver + 5.7 / 0.38 Huschenbeth(Hypoeroodon ampul latus) Muscle 5.7 / 0.33 (1977)
24 Harbour Porpoise St. Johns 1973 Muscle+ F 0.95 / 0.5 0.25 Gaskin et al.(Phocoena phocoena) Newfoundland, (1979)
E. Canada
25 Harbour Porpoise Deer Island 1969 Liver + 10 M 1.3 / 4.1 7.26 ± 8.67 Gaskin et al. ......(Phoaoena phocoena) New Brunswick, Muscle 24 M 1.3 / 4.1 0.59 ± 0.40 (1979) tTl
E. Canada Kidney 11 M 1.3 / 4.1 1.30 ± 0.86
26 Harbour Porpoise Deer Island 1972 Liver + 10 M 3.7 / 1.3 3.91 ± 3.73 Gaskin et al.(Phocoena phocoena) New Brunswick, 1974 Muscle 15 M 3.7 / 1.3 0.75 ± 0.43 (1979)
E. Canada Kidney 6 M 3.7 / 1.3 1.04 ± 0.23
27 Harbour Porpoise Deer Island 1975 Liver + 21 M 4.3 / 1.4 16.48 ± 11.07 Gaskin et a1.(Phocoena phocoena) New Brunswick, 1976 Muscle 21 M 4.3 / 1.4 1.26 ± 0.57 (1979)
E. Canada Kidney 6 M 4.3 / 1.4 3.56 ± 1.02
28 Harbour Porpoise Deer Island 1969 Liver + 16 F 2.5 / 1.3 17.91 ± 38.16 Gaskin et al.(Phocoena phocoena) New Brunswick, 1973 Muscle 35 F 2.5 / 1.3 0.88 ± 0.57 (1979)
E. Canada Kidney 13 F 2.5 / 1.3 1.56 ± 1.30
29 Harbour Porpoise Deer Island 1974 Liver + 5 F 2.8 / 1.4 10.96 Gaskin et a1.(Phocoena phocoena) New Brunswick, 1977 Muscle 7 F 2.8 / 1.4 1.24 ± 0.52 (1979)
E. Canada Kidney 5 F 2.8 / 1.4 2.92

Table 1. Continued
Index Year No. of Mean I Hg lJg/gUo.* Species Location Taken Tissue Animals Sex length / age mean ! S.D. Range Source
(m) (yrs)
30 Harbour Porpoise Baltic Sea 1977 Liver + 0.80/ 0.70 Huschenbeth(Phocoena phocoenaJ Muscle 0.80 / 0.15 (1977)
31 Harbour Porpoise Baltic Sea 1977 Liver + 1.3 / 2.5 Huschenbeth(Phocoena phocoenaJ Muscle 1.3 / - 0.92 (1977)
32 Harbour Porpoise North Sea 1977 Liver + 1.5 / - 28.0 Huschenbeth(Phocoena phocoenaJ Muscle 1.5 / - 3.3 (1977)
33 Harbour Porpoise Bay of Fundy, 1969 Liver + M 0.89 - 18.3 Gaskin et a1.(Phocoena phocoenaJ E. Canada 1971 Muscle M 0.75 0.21 1.92 (1972)
34 Harbour Porpoise Bay of Fundy, 1969 Liver + F 0.55 - 91.3 Gaskin et a1.(Phocoena phocoenaJ E. Canada 1971 Muscle F 1.02 0.26 - 2.58 (1972) I--'
en35 Harbour Porpoise Grand Manan Isle 1971 Liver + 4 M 1.3 / 3.1 3.29 ± 3.30 Gaskin et al.
(Phocoena phocoenaJ New Brunswick, Muscle 8 M 1.3 / 3.1 0.66 ± 0.25 (1979)E. Canada Kidney 4 M 1.3 / 3.1 1. 14 ± 0.36
36 Harbour Porpoise Grand Manan Isle 1972 Liver + 3 F 1.6 / 5.0 11. 3 ± 9.18 Gaskin et al.(Phocoena phocoenaJ New Brunswi ck, Muscle 3 F 1.6 / 5.0 1.56 ± 0.86 (1979)
E. Canada Kidney 1 F 1.6 / 5.0 2.40
37 Harbour Porpoise Digby, Nova Scotia 1970 Liver + 8 H 1.3 / 3.9 3.96 ± 4.58 Gaskin et al.(Phocoena phocoenaJ E. Canada Muscle 11 H 1.3 / 3.9 0.86 ± 0.56 (1979)
Kidney 7 M 1.3 / 3.9 1.27 ± 0.90
38 Harbour Porpoise Digby, Nova Scotia 1970 Liver + 4 F 1.5 / 5.2 30.7 ± 26.2 Gaskin et a1.(Phocoena phocoenaJ E. Canada Muscle 9 F 1.5 / 5.2 1.48 ± 0.69 (1979)
Kidney 2 F 1.5 / 5.2 1.81 ± 0.97
39 Harbour Porpoise Atlantic Coast of 1970 Liver + 5 M&F 1.5 / 4.6 19.6 ± 1.99 Gaskin et a1.(Phocoena phocoenaJ Nova Scotia Muscle 5 M1.F 1.5 / 4.6 0.99 ± 0.47 (1979)
Canada Kidney 4 M&F 1.5 / 4.6 1.49 ± 0.66

Table 1. Continued
Index Year No. of Mean Hg 119/9flo. * Species Location Taken Tissue Animals Sex length / age mean + S.D. Range Source
(m) (yrs)
40 Harbour Porpoise Boothbay Harbour Liver F 1.0 / 1. 13 Gaskin et al.(Phoeoena phoeoenaJ Maine, USA Kidney F 1.0 / 0.68 (1979)
41 Harbour Porpoise Naragansett Bay 1971 Liver + 1 F 1.2 / 2.54 Gaskin et al.(Phoeoena phoeoenaJ Rhode Island, 1972 Muscle 2 F 1.2 / 0.71 ± 0.60 (1979)
USA Kidney 1 F 1.2 / 2.74
42 Harbour Porpoise Prince Edward Muscle+ M 1.5 / 5 1. 12 Gaskin et al.(Phoeoena phoeoenaJ Island, E. Canada (1979)
95 Harbour Porpoise Coast of Denmark 1972- Liver 4 M&F / 1-3 22 1.5 - 69 Andersen and(Phoeoena phoeoenaJ 1973 Muscle 4 M&F / 1-3 1.9 0.8 3.2 Robsdorff (1976)
96 Harbour Porpoise E. Coast of 1974 Liver 17 M 3.42 ± 3.32 0.29 - 10.6 Falconer et a1. ......(Phoeoena phoeoenaJ Scotland Kidney 17 M 1.23 ± 0.66 0.47 - 2.82 (1983) ""'-J
97 Harbour Porpoise E. Coast of 1974 Liver 6 F 6.03 ± 5.89 0.28 - 15.9 Falconer et a1.(Phoeoena phocoenaJ Scotland Kidney 6 F 1.02 ± 0.63 0.23 - 1. 79 (1983)
43 Finless Black Porpoise Kanagawa, Japan 1973 Muscle+ 0.72 / fetus 0.16 Arima and(Neophocaena Nagakura
phocaenoide8J (1979)
44 Long Snouted Dolphin St. Lucia, 1972 Li ver + F 1.8 / - 6.0 Gaskin et a1.(SteneZZa Zongi~o8tri8) Lesser Antilles Muscle F 1.8 / 1.33 (1974)
Kidney F 1.8 / - 2.28
45 Long Snouted Dolphin St. Lucia, 1972 Liver + M 1.9 / - 13.0 Gaskin et el ,(SteneZZa Zongi~o8tri8) Lesser Antilles Muscle M 1.9 / 0.87 (1974)
Kidney M 1.9 / 2.68
46 White Dotted Dolphin Wakayama, Japan 1972 Musc1e+ 1.7 / 4-5 1.66 Arima and(SteneZZa attenuata) Nagakura
(1979)

Table 1. Continued
Index Year No. of Mean I Hg \.Ig/gNo.· Species Location Taken Tissue Anima 1s Sex Len~th / Age mean ! S.D. Range Source
(m (yrs)
47 White Dotted Dolphin Wakayama, 1973 Musc1e+ 0.86 / fetus 0.61 Arima and(Stenetta attenuataJ Japan Nagakura (1979)
48 Blue-White Dolphin T Shizouka, 1974 Musc1e+ 10 2.2 / '\,15 6.73 ± 4.51 2.28 - 9.43 Arima and(Stenetta caeruteoatbaJ Japan Nagakura (1979)
49 Blue-White Dolphin T Shizouka, 1973 Musc1e+ 0.94 / fetus 0.95 Arima and(Stenetta caeruteoatbaJ Japan Nagakura (1979)
50 Pacific Bottlenose Shizouka, 1973 Musc1e+ 3.1 / '\,22 51.8 Arima and I--'
Dolphin Japan Nagakura (1979) 00
(Ture iope giUiJ
98 Striped Dolphin T E. Coast of 1977- Liver 45 M&F 2.05 ± 1.38 1.70 - 4.85 Honda et a1.(Stenetta caeruteoatbaJ Japan, 1980 Muscle 51 M&F 7.02 ± 4.06 0.46 - 15.7 (1983)
Izu Peninsula Kidney 20 M&F 8.71 ± 6.07 0.91 - 17.6
• - Different tissues belong to the same animal or groups of animals which have the same Index No.+ - Dorsal meatt S.D. estimated from the rangeA - GravidB - Non-gravidc - S.D. from repeated analysis of the same sample'\, - Approximately
T - Blue-White and Striped Dolphins are used interchangeably, depending on the name used in the original literature.

Table 2. Reference concentrations of Zn, Cu, Pb (wet weight basis) in different tissues of Cetaceans.-
Index Year No. of Mean Zn \.Ig/gflo.* Species Location Taken Tissue Animals Sex len~th / age mean ! S.D. Range Source
(m (yrs)
12 Narwhal Pond Inlet 1977 Liver + 6 26.47 ± 4.35 21.2 31.1 Fallis(Monodon monoaepos) Baffi n Is 1and, Muscle 6 21.65 ± 8.15 15.6 - 29.6 (unpublished)
Canada Kidney 6 33.90 ± 7.97 24.8 - 44.8Blubber 6 0.58 ± 0.13 0.37 - 0.75
13 Narwhal Pond Inlet 1979 Liver + 37 M&F 3.7 / - 38.8 ± 9.85 23.98 - 63.61 l~agemann et al.(Nonodon monoaepos) Baffin Island, Muscle 58 M&F 3.8 / - 17.8 ± 3.06 12.43 - 28.41 (1983)
Canada Kidney 54 M&F 3.8 / - 41.1 ± 9.11 3.83 - 85.80Blubber 44 M&F 3.8 / - 1. 12 ± 0.65 0.25 - 2.58
19 Narwha 1 Admi ra lty In1e t , 1975 Liver 26 38.37 ± 14.03 15.5 - 87.9 Fall is(Monodon monoaepos) E. Arctic Canada Muscle 27 21.22 ± 6.16 13.8 - 40.4 (unpublished)
Blubber 11 3.93 ± 3.91 0.58 - 11.80
30 Harbour Porpoise Baltic Sea 1977 Liver F 0.80 / - 50.0 Harms et al.(Phoaoena phoaoena) Muscle F 21.0 (1978)
.......31 Harbour Porpoise Baltic Sea 1977 Liver M 1.26 / - 34.0 Harms et a1. ~
(Phoaoena phoaoena) Muscle M 12.4 (1978)Kidney M 20.0
32 Harbour Porpoise North Sea 1977 Liver F 1.53 / - 49.0 Harms et a1.(Phoaoena phoaoena) Muscle F 14.4 (1978)
Kidney 24.4
95 Harbour Porpoise Coast of Denmark 1972 Liver 4 M&F / 1-3 59 45 72 Andersen and(Phoaoena phoaoena) 1973 Muscle 4 M&F / 1-3 19 18 - 21 Robsdorff (1976)
96 Harbour Porpoise E. Coast of 1974 Liver 17 M 43.2 ± 12.2 18.4 - 67.6 Falconer et a1.(Phoooena phoooena) Scotland Kidney 17 M 23.8 ± 2.96 19.5 - 33.1 (1983)
97 Harbour Porpoise E. Coast of 1974 Liver 6 F 43.7 ± 5.68 36.7 - 51.9 Falconer et al.(Phoooena phoooena) Scotland Kidney 6 F 23.1 ± 2.01 20.3 - 25.3 (1983)
98 Striped Dolphin(Stenella oaeruleoalba)
E. Coast ofJapanIzu Peninsula
19771980
LiverMuscleKidney
575930
M&FM&FM&F
44.5 ±
11.4 ±30.1 ±
13.22.454.67
26.5 - 1096.86- 20.4
22.8 - 41.2
Honda et a1.(1983)

Table 2. Continued
Index Year No. of Mean I Cu ~g/g
No.· Species Location Taken Ti ssue Animals Sex length/age mean ± S.D. Range Source(m) (yrs)
13 Narwhal Pond Inlet 1979 Liver + 37 M.P,F 3.7 / 5.27 ± 2.20 1.98 - 20.31 Wagemann et al.{Monodon monooe~oBJ Baffi n Is 1and. Muscle 58 M&F 4.3 / 0.66 ± 0.15 0.45 - 1. 15 (1983)Canada Kidney 54 M&F 3.8 / 2.34 ± 0.43 1.81 - 3.49Blubber 44 M&F 3.8 / 0.08 ± 0.07 <0.01 - 0.38
30 Harbour Porpoise Baltic Sea 1977 Liver F 0.80/ 15.0 Harms et al.{Phoooena phoooenaJ Muscle F 2.7 (1978)31 Harbour Porpoise Baltic Sea 1977 Liver M 1.26/ 4.0 Harms et al.{Phoooena phoooenaJ Muscle M 1.8 (1978)
Kidney M 3.1Na32 Harbour Porpoise North Sea 1977 Liver F 1.53/ 6.0 Harms et a1.(Phocoena phocoena) Muscle F 2.1 (1978)
Kidney F 3.2
95 Harbour Porpoise Coast of Denmark 1972- Liver 4 M&F / 1-3 4.5 2.6 - 8.3 Andersen and{Phoooena phoooenaJ 1973 Muscle 4 M&F - / 1-3 Robsdorff (1976)96 Harbour Porpoise E. Coast of 1974 Liver 17 M 7.29 ± 2.94 2.74 - 12.80 Falconer et al.{Phoooena phoooenaJ Scotland Kidney 17 M 3.83 ± 0.52 2.64 - 4.77 (1983)97 Harbour Porpoise E. Coast of 1974 Liver 6 F 7.21 ± 2.64 2.65 - 10.30 Falconer et al.{Phoooena phoooenaJ Scotland Kidney 6 F 3.59 ± 0.26 3.16 - 3.88 (1983 )98 Striped Dolphin E. Coast of 1977- Liver 57 M&F 8.09 ± 1.87 3.57 - 15.2 Honda et a1.{SteneZla Japan 1980 Muscle 59 M&F 2.04 ± 0.36 1.78 - 3.37 (1983 )oaepuZeoaZbaJ Izu Peninsula Kidney 30 M&F 3.13 ± 1.25 1.46 - 6.05

Table 2. Continued
Index Year No. of Mean I Pb I-Ig/gIlo.* Species Location Taken Tissue Animals Sex lenjth / age mean ! S.D. Range Source
(m (yrs)
12 Narwhal Pond Inlet 1977 Liver + 6 0.17 ± 0.13 <0.05 0.32 Fa11 is(Monodon monocepos) Baffin Island, Muscle 6 0.11 ± 0.06 0.08 - 0.32 (unpublished)
Canada Kidney 6 0.21 ± 0.27 0.07 - 0.76Blubber 6 0.31 ± 0.34 <0.05 - 0.75
13 Narwhal Pond Inlet 1979 Liver + 37 M&F 3.7 / - 0.03 ± 0.01 0.01 0.06 Wagemann et a1.(Monodon monocepos) Baffin Island, Muscle 58 M&F 4.3 / - 0.01 ± 0.01 0.003 - 0.037 (1983)Canada Kidney 54 M&F 3.8 / - 0.02 ± 0.01 0.006 - 0.079
Blubber 44 M&F 3.8 / 0.02 ± 0.01 <0.01 0.09
19 Narwha 1 Admiralty Inlet, 1975 Liver + 26 0.11 ± 0.13 <0.04 0.57 Fa11 is(Monodon monocepos) E. Arctic Canada Muscle 27 0.05 ± 0.07 <0.04 - 0.34 (unpublished)
Blubber 11 0.27 ± 0.78 <0.04 - 2.62
30 Harbour Porpoise Baltic Sea 1977 Liver F 0.80 / - 0.17 Hanns et al. N(Phocoena phocoena) Muscle F 0.03 (1978) ......
31 Harbour Porpoise Baltic Sea 1977 Liver M 1.26 / - 0.43 Hanns et a1.(Phocoena phocoena) Muscle M 0.07 (1978)
Kidney M 0.15
32 Harbour Porpoise North Sea 1977 Liver F 1. 53 / - 0.35 Hanns et al.(Phoaoena phoaoena) Muscle F 0.05 (1978)
Kidney F 0.17
95 Harbour Porpoise Coast 'of Denmark 1972- Liver 4 M&F / 1-3 3.5 1.9 5.3 Andersen and(Phoaoena phocoena) 1973 Muscle 4 M&F / 1-3 3.3 1.6 4.7 Robsdorff (1976)
98 Striped Dolphin E. Coast of Japan 1977- Liver 57 M&F 0.22 ± 0.14 0.03 - 0.64 Honda et al.(Btenel l.a Izu Peninsula 1980 Muscle 59 M&F 0.18 ± 0.072 0.04 - 0.26 (1983)
caepuZeoaZba) Kidney 30 M&F 0.17 ± 0.17 0.01 0.71
* - Different tissues belong to the same animal or groups of animals which have the same Index No.
+ - Dorsal meat

Table 3. Reference concentrations of Cd (wet weight basis) in different tissues of Cetaceans.
Index Year No. of Mean I Cd ~g/g
flo.* Species Location Taken Tissue Animals Sex Len~th mean t S.D. Range Source(m
12 Narwhal Pond Inlet 1977 Liver + 6 7.76 ± 6.63 1.82 - 19.3 Fa 11 i s(Monodon monooer08) Baffin Island, Muscle 6 0.11 ± 0.11 0.03 - 0.32 (unpublished)
Canada Kidney 6 30.51 ± 21.41 4.86 - 50.50Blubber 6 0.02 ± 0.02 0.02 - 0.05
13 Narwhal Pond Inlet 1979 Liver + 37 M&F 3.7 32.02 ± 33.2 1.28 - 130.8 Wagemann et al.(Monodon monooeros) Baffin Island, Muscle 58 M&F 4.3 0.19 ± 0.22 0.01 1. 12 (1983)
Canada Kidney 54 M&F 3.8 63.5 ± 41.0 1.0 - 205.4Blubber 44 M&F 3.8 0.05 ± 0.05 0.01 0.25
19 Narwhal Admiralty Inlet, 1975 Liver + 26 30.41 ± 25.67 0.59 - 95.5 Fall is(Monodon monooero8) E. Arctic Canada Muscle 27 0.24 ± 0.24 <0.01 0.94 (unpublished)
Blubber 11 0.04 ± 0.03 <0.01 0.10
Liver FA 12.70 c N15 Short Finned Cumberland Island, 1977 3.7 ± 1.36c Stoneburner NPilot Whale Georgia, USA Kidney FA 3.7 41.80 ± 4.29 c (1978)
(Globioephala maororhynoha) Blubber FA 3.7 0.48 ± 0.04
16 Short Finned Cumberland Island, 1977 Liver 2 FB 3.7 15.80 ± 5.66 11.80 - 19.80 StoneburnerPilot Whale Georgia, USA Kidney 2 FB 3.7 27.95 ± 1.20 27.1 - 28.8 (1978)
(Globioephala maororhynoha) Blubber 2 FB 3.7 0.67 ± 0.11 0.59 - 0.75
17 Minke Whale Disko Bay, 1978 Liver M 3.9 11.30 c Stoneburner± 0.14 c(Bal.aenop tiera W. Greenland Kidney M 3.9 27.8 ± 1.74c (1978)aoutoro8trata) Blubber M 3.9 0.34 ± 0.02
30 Harbour Porpoise Baltic Sea 1977 Liver F 0.80 0.023 Harms et a1.(Phoooena phoooena) Muscle F 0.002 (1978)
31 Harbour Porpoise Baltic 1977 Liver M 1.26 0.025 Harms et a1.(Phoooena phoooena) Muscle M 0.002 (1978)
Kidney M 0.077

Table 3. Continued
Index Year No. of Mean I Cd ~g/g
flo.· Species Location Taken Tissue Animals Sex length mean .!. S.D. Range Source(m)
32 Harbour Porpoise North Sea 1977 Liver F 1.53 0.19 Hanns et a1.(Phocoena phocoenaJ Muscle F 0.006 (1978)
Kidney F 0.95
96 Harbour Porpoise E. Coast of 1974 Liver 17 M 0.15 ± 0.13 <0.05 - 0.94 Falconer et a1.(Phocoena phocoenaJ Scotland Kidney 17 M 1.11 ± 0.80 0.17 - 2.91 (1983)
97 Harbour Porpoise E. Coast of 1974 Liver 6 F 0.27 ± 0.34 <0.05 - 0.94 Falconer et al.(Phocoena phocoenaJ Scotland Kidney 6 F 2.68 ± 2.83 0.24 - 7.42 (1983) N
w98 Striped Dolphin E. Coast of 1977- Liver 57 M&F 6.26 ± 2.32 0.04 - 11. 1 Honda et a1.
(Stenella Japan, 1980 Muscle 59 M&F 0.10 ± 0.064 0.01 0.25 (1983)caeI'UleoalbaJ Izu Peninsula Kidney 30 M&F 24.8 ± 16.2 0.06 - 69.6
* - Different tissues belong to the same animal or groups of animals which have the same Index No.
+ - Dorsal meat
A - Gravid
U - Non-gravid
c - S.D. from 3 analyses of the same specimen.

Table 4. Reference concentrations of Se (wet weight basis) in different tissues of Cetaceans.
Index Year No. of l-lean I Se lJg/gNo.* Species Location Taken Tissue Animals Sex Lenqth / Age mean ± S.D. Range Source
(m) (yrs)
8 Pilot Whale l~akayama • 1975 Muscle+ 12 0.88 ± 0.23 0.61 - 1.30 Arima and(GZobicephaZa maZaena) Japan Nagakura (1979)
12 Narwhal Pond Inlet 1977 Liver + 6 5.54 ± 4.65 2.33 - 14.8 Fa 11 i s(Monodon monocero8) Baffin Island. Muscle 6 0.37 ± 0.09 0.25 - 0.51 (unpublished)
Canada Kidney 6 2.59 ± 0.49 1.99 - 3.42Blubber 6 0.03 ± 0.04 < 0.02 - 0.11
13 Narwha1 Pond Inlet 1979 Liver + 37 M&F 3.7 / 4.06 ± 1.84 0.62 - 7.98 Wagemann et al.(Monodon monoce1'08) Baffin Island. Muscle 58 M&F 4.3 / - 0.44 ± 0.10 0.31 - 0.85 (1983)
Canada Kidney 54 M&F 3.8 / 3.15 ± 0.85 1. 73 - 4.87Blubber 44 M&F 3.8 / 0.07 ± 0.06 <0.01 - 0.28
15 Short Finned Cumberland Island 1977 Liver 1 FA 3.7 / 61.60 ± 1. 58c StoneburnerPilot Whale Georgia. USA Kidney 1 FA 3.7 / - 10.01 ± 1. 28c (1978)
(Glob ioepha La N+::>
m:w1'o1'hyncha)
16 Short Finned Cumberland Island 1977 Liver 2 FB 3.7 / 46.15 ± 18.74 32.90 - 59.40 StoneburnerPilot Whale Georgia. USA Kidney 2 FB 3.7 / 7.82 ± 2.45 6.09 - 9.55 (1978)
(GZobicephaZamac1'o1'hyncha)
17 Short Finned Cumberland Island 1977 Liver 1 M 3.9 / 22.80' ± 0.54c StoneburnerPilot Whale Georgia. USA (1978)
(GZobicephaZamac1'o1'hyncha)
43 Finless Black Kanagawa. 1973 Muscle+ 0.72 / fetus 0.21 Arima andPorpoi se Japan Nagakura (1979)
(Neophocaenaphocaenoide8)
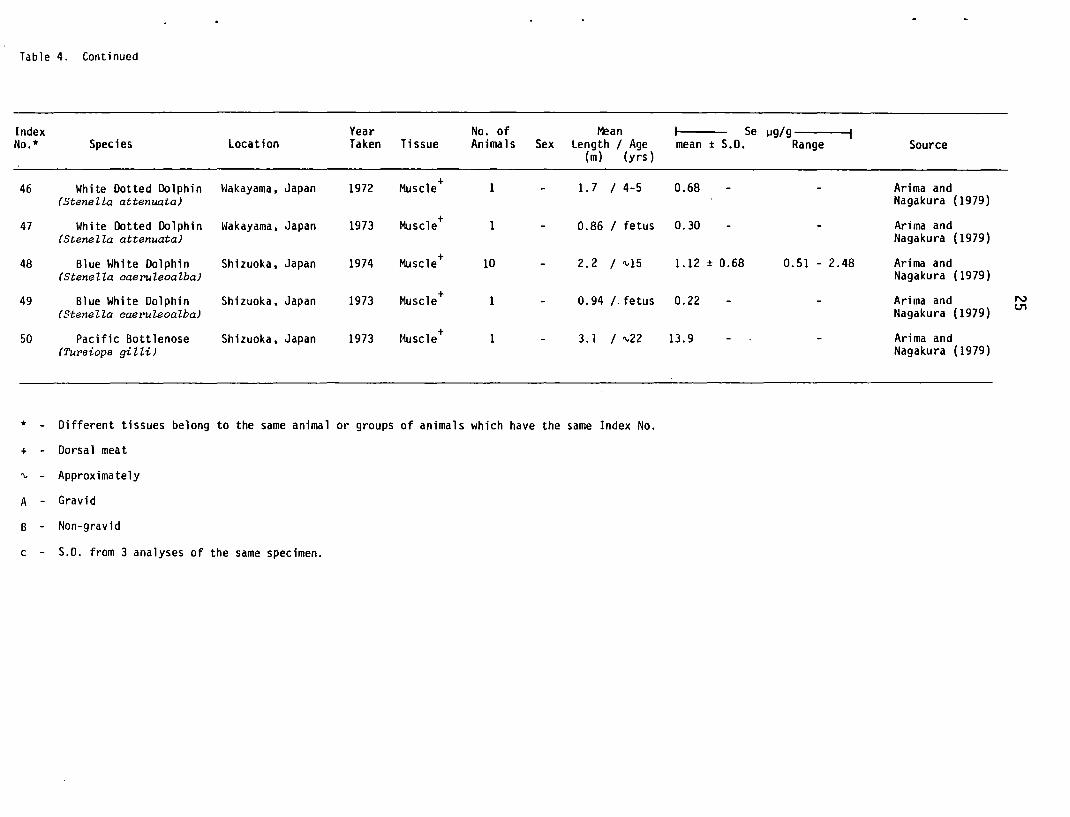
Table 4. Continued
Index Year No. of />'ean I Se lJg/gNo.* Species location Taken Tissue Animals Sex length / Age mean ± S.D. Range Source
(m) (yrs)
46 White Dotted Dolphin ~lakayama, Japan 1972 Muscle+ 1 1.7 / 4-5 0.68 Arima and(SteneILa attenuata) Nagakura (1979)
47 White Dotted Dolphin l~akayama , Japan 1973 ttlscle+ 1 0.86 / fetus 0.30 Arima and(SteneILa attenuata) Nagakura (1979)
48 Blue White Dolphin Shizuoka, Japan 1974 Muscle+ 10 2.2 / 'VIS 1.12 ± 0.68 0.51 - 2.48 Arima and(SteneIIa caeruIeoalba) Nagakura (1979)
49 Blue White Dolphin Shizuoka. Japan 1973 Muscle+ 1 0.94 /. fetus 0.22 Arima and N
(Stenella caeruIeoalba) Nagaku ra (1979)()"l
50 Pacific Bottlenose Shizuoka, Japan 1973 t1uscle+ 1 3.1 / 'V22 13.9 Arima and(Turei.op« gi IIi) Nagakura (1979)
* - Different tissues belong to the same animal or groups of animals which have the same Index No.
+ - Dorsal meat
'V - Approximately
A - Gravid
B - Non-gravid
c - S.D. from 3 analyses of the same specimen.

Table 5. Reference concentrations of Hg (wet weiQht basis) in different tissues of Pinnipeds.
Index Year No. of Mean I Hg ~g/g
flo.· Species Location Taken Tissue Animals Sex aQe / weight mean ± S.D. Range Source(yrs) (kg)
101 Ringed Seal Baltic Area 1967 Liver + 3 M adult / 46.7 137.8 ± 68.26 74.0 - 210 Henri ksson and(Phoca hispidaJ Muscle 3 M adult / 46.7 81.5 ± 101.0 14.2 - 196.9 Karppanen
(1969)
102 Ringed Seal North Sea 1975 Liver F 0.64 Harms et al.(Phoca hispida J (1978)
104 Ringed Seal Northern Baffin 1975 Liver 5 3.27 ± 0.75 1.41 - 5.18 Fall is(Phoca hispidaJ Island, (unpublished)
E. Arctic Canada
105 Ringed Seal Upernavik. 1973 Liver + 10 2.40 ± 1.49t 0.32 - 4.90 Johansen et al.(Phoca hispidaJ W. Greenland Muscle 10 0.23 ± 0.16 t <0.05 - 0.51 (1980)
N106 RinQed Seal Upernavik. 1974 Liver + 7 0.34 ± o.set <0.05 - 1.20 Johansen et al. Q)
(Phoca hispidaJ W. Greenland Muscle 7 0.09 ± 0.04t <0.05 - 0.12 (1980)
107 RinQed Seal Daneborg, 1974 Liver + 7 2.9 ± 2.5 "t 1.4 - 8.1 Johansen et al.(Phoca hispidaJ E. Greenland Muscle 7 0.42 ± 0.06t 0.25 - 0.42 (1980)
108 Rinned Seal Upernavtk , 1976 Liver + 31 2.1 ± 4.1 0.14 - 11.9 Johansen et al.(Phoca hispidaJ W. Greenland Muscle 31 0.18 ± 0.18 t 0.02 - 0.55 (1980)
109 Ringed Seal Bothnian Bay. 1974 Liver + 12 91.0 ± 88.7 t 14 - 300 Kari and(Phoca hispidaJ W. Finland Muscle 8 1.10 ± 0.22 t 0.47 - 1.60 Kauranen
Kidney 2 4.0 ± 2.1t 2.8 - 5.2 (1978)
110 Ringed Seal Saimaa, 1974 Liver + 3 230 ± 259 t 72 - 510 Kari and(Phoca hispidaJ S. E. Fin1and 1975 Muscle 3 3.5 ± 2.8t 1.3 - 6.1 Kauranen
Kidney 3 7.4 ± 6.e- 1.9 - 13 (1978)Blubber 2 0.30 ± 0.23 t 0.14 - 0.46

Table 5. Continued
Index Year No. of Mean I Hg I-Ig/gflo.* Species Location Taken Tissue Animals Sex age 1 weight mean ! S.D. Range Source
(yrs) (kg)
112 Ringed Seal Finnish Bay; 1968 Liver + 9 F adult 1 12.47 ± 8.83 2.5 - 27.6 Henriksson and(Phaca hispidaJ Between Kotka Muscle 9 F adult 1 0.91 ± 0.56 0.4 - 2.3 Karpannen
and Hogland Kidney 9 F adult 1 2.36 ± 1.40 1.1 4.B (1969)
113 Ringed Seal Finnish Bay; 1968 Liver + 7 M adult 1 10.96 ± 6.30 5.7 - 23.3 Henriksson and(Phoca hispidaJ Between Kotka Muscle 7 M adult / 0.99 ± 0.69 <0.1 2.3 Karpannen
and Hogland Kidney 7 M adult / 5.20 ± 1.59 1.6 - 6.4 (1969)
114 Ringed Seal Ba lt ic Area. 1968 Liver + F juvenilel 11.2 1.3 Henriksson and(Phoca hispidaJ Vaistonse1ka Muscle F juvenilel 11. 2 0.3 Karpannen
Kidney F juvenile/ 11.2 2.1 (1969)
115 Ringed Seal Baltic Area. 1968 Liver + Mjuvenilel 22.6 3.3 Henriksson and{Phoca hispidaJ Seurasaari Muscle Mjuvenile/ 22.6 0.2 Karpannen NKidney Mjuvenilel 22.6 2.7 (1969) '-J
116 Ringed Seal Baltic Area 1967 Li ver + 3 F juvenile/ 29.2 9.83 ± 11.93 2.4 - 23.6 Henriksson an-d(Phoca hispidaJ Muscle 3 F juvenile/ 29.2 2.53 ± 1. 65 0.7 - 3.9 Karpannen
Kidney 1 F juvenilel 28 5.7 (1969)
117 Ringed Seal Aston Bay 1975 Liver + 88 19.33 ± 18.44 Smith and(Phoca hispidaJ Somerset Island. Muscle 89 0.44 ± 0.16 Armstrong
E. Arctic Canada (1978)
118 Ringed Seal Barrow Stra it. 1976 Liver + 27 10.2 / 16.14 ± 13.84 Smith and(Phoca hispida J E. Arctic Canada Muscle 27 10.2 1 0.91 ± 0.38 Armstrong
(1978)
119 Ringed Seal Arctic Bay 1976 Liver + 36 0.3 1 0.32 ± 0.08 Smith and{Phoca hispidaJ N.E. Baffin ISland Muscle 37 0.3 / 0.08 ± 0.07 Armstrong
E. Arctic Canada (1978)

Table 5. Continued
Index Year No. of Mean I Hg \.Ig/g/lo.* Species Location Taken Tissue Animals Sex alle / weillht mean ± S.D. Range Source
(yrs) (kq )
120 Ringed Seal S.E. Beaufort Sea 1972 Liver + 13 1.3/ 1.0 ± 1.16 Smith and(Phoca hisp ida ) W. Arctic Canada Muscle 13 1.3/ 0.23 ± 0.11 Armstrong
(1978)
121 Ringed Seal W.Victoria Island 1972 Liver + 83 12.8 / 27.5 ± 30.1 Smith and(Phaca hispida) W. Arctic Canada Muscle 83 12.8 / 0.72 ± 0.33 Armstrong
(1978)
122 Ringed Seal Pond Inlet 1976 Liver + 33 5.2 / 3.76 ± 3.42 Smith and(Phoca hiepi-da) N.E. Baffin Island, Muscle 33 5.2 / 0.31 ± 0.17 Armstrong
E. Arctic Canada (1978)
124 Ringed Seal W.Victoria Island 1977 Liver 112 8.1 / 25.54 ± 15.0 Smith and(Phoca hispida) W. Arctic Canada Armstrong N
(1978) ex>
127 Ringed Seal Northern Baffin 1977 Musc1e+ 7 0.33 ± 0.06 0.16 - 0.57 Fall is(Phoca hiep ida ) Island, Kidney 1 2.32 (unpub1 ished)
E. Arctic Canada
132 Grey Seal East Coast of 1975 Liver 9 M&F 0-3 / 54 11.45 ± 6.25 1.0 - 25.0 McKie et a1.(Halichoerus grypus) Scotland Kidney 10 M&F 0-3 / 59 1.95 ± 0.66 1. 10 - 3.30 (1980)
133 Grey Seal East Coast of 1975 Liver 8 M&F 4-6 / 92 21.39 ± 16.22 4.10 - 54.0 McKie et a1.(Halichoerus grypus) Scotland Kidney 7 t1&F 4-6 / 92 2.43 ± 0.71 1.37 - 3.38 (1980)
134 Grey Seal East Coast of 1975 Liver 3 M 7-9 / 163 36.77 ± 10.81 24.4 - 44.4 McKie et a1.(Halichoerus grypus) Scotland Kidney 3 M 7-9 / 163 2.96 ± 0.56 2.33 - 3.70 (1980)
135 Grey Seal East Coast of 1976 Liver 11 M&F 0-3 / 67 24.4 ± 27.45 3.14 - 89.3 McKie et a1.(Halichoerus grypus) Scotland Kidney 11 M&F 0-3 / 67 2.45 ± 1. 18 0.84 - 4.56 (1980)

Table 5. Continued
Index Year No. of Mean I Hg \.Ig/gflo. * Species Location Taken J i ssue Animals Sex age / weight mean S.D. Range Source
(yrs) (kg)
136 Grey Seal East Coast of 1976 Liver 7 M&F 4-6 / 98 31.8 ± 24.2 2.64 - 77.3 McKie et al.(Halichoerus grypus) Scotland Kidney 7 M&F 4-6 / 98 2.38 ± 0.66 1.48 - 3.32 (1980)
137 Grey Seal East Coast of 1976 Liver 5 M 7-9 / 142 36.6 ± 17.6 11.7 - 48.1 McKi e et a1.(Halichoerus grypus) Scotland Kidney 5 M 7-9 / 142 3.72 ± 1.16 2.55 - 5.64 (1980)
138 Grey Seal East Coast of 1977 Liver 4 M&F 0-3 / 63 20.3 ± 12.1 11.5 - 37.9 McKie et al.(Halichoerus grypus) Scotland Kidney 4 M&F 0-3 / 63 3.81 ± 1.77 1.72 - 6.0 (1980)
139 Grey Seal East Coast of 1977 Liver 9 M&F 4-6 / 91 21.18 ± 14.87 0.26 - 48.6 McKie et al.(Halichoerus grypus) Scotland Kidney 9 M&F 4-6 / 91 2.44 ± 1. 12 0.88 - 3.69 (1980)
140 Grey Seal East Coast of 1977 Liver 3 M&F 7-9 / 129 49.1 ± 65.8 0.23 - 123.9 McKie et al.(Halichoerus grypus) Scotland Kidney 3 M&F 7-9 / 129 4.39 ± 2.06 1. 71 - 6.73 (1980) N
co141 Grey Seal East Coast of 1978 Liver 2 M 0-3 / 91 50.3 ± 40.8 9.55 - 9.11 McKie et al.
(Halichoerus grypus) Scotland Kidney 2 M 0-3 / 91 3.17 ± 0.90 2.27 - 4.06 (1980)
142 Grey Seal East Coast of 1978 Liver 6 M&F 4-6 / 103 39.17 ± 21.72 12.3 - 74.7 McKie et al.(Halichoerus grypus) Scotland Kidney 5 M&F 4-6 / 103 2.55 ± 1.30 1.41 - 4.42 (1980)
143 Grey Seal East Coast of 1978 Liver 5 M&F 7-9 / - 61.80 ± 44.76 37.0 - 125.9 McKie et al.(Halichoerus grypus) Scotland Kidney 4 M&F 7-9 / - 3.20 ± 0.96 2.33 - 4.31 (1980)
144 Grey Seal Sable Island, 1973 Liver 6 M&F 10.7 / - 94.45 ± 50.36 24.4 - 170.0 Sergeant and(Halichoerus grypus) Eastern Canada Kidney 6 M&F 10.7 / - 1.20 ± 0.45 0.72 - 1.80 Armstrong
(1973)
145 Grey Seal Sable Island, 1973 Liver + / - 14.3 Sergeant and(Halichoerus grypus) Eastern Canada Muscle / - 1.80 Armstrong
(1973)
146 Grey Seal Sable Island 1973 Liver + M 25 / - 387 Sergeant and(Ha l:i.choevue grypus) Eastern Canada Muscle M 25 / - 2.35 Armstrong (1973)

Table 5. Continued
Index Year No. of Mean I Hg ~g/g
lJo. * Species Location Taken Tissue Animals Sex aqe / mean ± S.D. Range Source(yrs)
147 Grey Seal Sable Island 1973 Liver + 3 M&F pups 0.74 ± 0.39 0.46 - 1.18 Sergeant and(Halichoerus grypus) Eastern Canada Muscle 3 M&F pups 0.35 ± 0.17 0.17 - 0.50 Armstrong
(1973)(.oJ148 Grey Seal Farne Islands Liver 24 M 43.0 Caines a
(Halichoerus grypus) N.E. England Kidney 27 M 4.12 (1978)
149 Grey Seal Farne Islands Liver 38 F 141.5 Caines(Halichoerus grypus) N.E. England Kidney 37 F 4.32 (1978)
150 Grey Seal East Anglia, Liver 2 adult & 120 ± 78 65 - 175 Holden(Halichoerus grypus) EnlJland
Muscle+sub-adult (1975)
2 adult & 4.0 ± 2.69 2.1 5.9sub-adult
Kidney 2 adult & 37.9 ± 42.6 7.8 - 68sub-adult
Blubber 2 adult & 0.75 ± 0.92 0.1 1.4sub-adult

Table 5. Continued
Index Year No. of Mean I Hg \.Ig/gUo.* Species Location Taken Tissue Animals Sex age 1 1enqth mean :!: S.D. Range Source
(yrs) (m)
151 Grey Sea1 East Anq1 ia Liver + 1 6 Holden(Halichoerus g~ypus) England Muscle 1 1.7 (1975)
Kidney 1 4.3Blubber 1 0.2
152 Grey Seal Fourchu Bay 1972 Liver + M pup 1 1. 32 4.1 Freeman(Ha l.ichoe ruB g~ypus) Nova Scotia, Muscle M pup 1 1. 32 0.77 and Horne
E. Canada Kidney M pup 1 1.32 1.5 (1973)Blubber M pup 1 1.32 0.062
153 Grey Seal North Sea 1975 Liver M 2 1 19.5 Hanns et a1.(Halichoerus g~YPUB) (1978)
155 Grey Seal Fourchu Bay 1972 Liver + F pup 1 1.22 2.8 Freeman(Halichoe~us g~ypus) Nova Scotia, Muscle F pup 1 1.22 0.58 and Horne
E. Canada Kidney F pup 1 1.22 1.5 (1973)Blubber F pup 1 1.22 0.036
w156 Grey Seal Fourchu Bay 1972 Liver + 2 M&F 1 1.54 10.5 ± 0.71 10 11 Freeman ~-
(Halichoe~uB g~ypus) Nova Scotia, Muscle 2 M&F - 1 1.54 0.86 ± 0.01 0.85 - . 0.86 and HorneE. Canada Kidney 2 M&F - 1 1.54 2.9 ± 0.14 2.8 - 3.0 (1973)
Blubber 2 M&F - 1 1.54 0.078 ± 0.032 0.055- 0.10
157 Grey Seal Fourchu Bay 1972 Liver + 2 M&F - 1 2.04 28.0 ± 2.83 26 - 30 Freeman(Halichoerus g~ypus) Nova Scotia, Muscle 2 M&F - I. 2.04 1.6 ± 0.0 1.6 - 1.6 and Horne
E. Canada Kidney 2 M&F - 1 2.04 5.35 ± 0.49 5.0 - 5.7 (1973)Blubber 2 MPtF - 1 2.04 0.098 ± 0.017 0.086- 0.11
158 Grey Seal Great Britain 1977 Liver 2 M 276 ± 17 15 - 39 van de Ven et al.(Halichoerus g~pUB) (1979)
159 Grey Seal I]reat Brita in 1977 Liver 6 F 7.2 1 53.76± 42.8 17 - 127 van de Ven et al.(Halichoerue g~ypus) (1979)
160 I1rey Sea 1 lireat Britain 1977 Liver 2 F 78.06 ± 9.9 71 - 85 van de Ven et al.(Halichoerue g~ypus) (1979)
161 Grey Seal Great Britain 1977 Liver 5 pups 1 1.07 ± 0.78 0.55 - 2.30 van de Ven et al.(Halichoerus g~ypus)(1979)

Table 5.
Index Year No. of Mean I Hg ~g/g
No.* Species Location Taken Tissue Animals Sex length/weight mean ± S.D. Range Source(m) (kg)
165 Harbour Seal Boothbay Harbour 1971 Liver + 2 M 0.90 / 27.9 4.70 ± 4.53 1.50 - 7.90 Gaskin et al.(Phoaa uitulina) Maine, USA Muscle 2 M 0.90 / 27.9 0.70 ± 0.48 0.36 - 1.04 (1973)
Kidney 2 M 0.90 / 27.9 0.03 ± 0.01 0.027- 0.037
166 Ha rbour Sea1 Boothbay Harbour 1971 Liver + 2 F 0.88 / 1.21 ± 0.98 0.52 - 1. 91 Gaskin et a1.(Phoaa uitulina) Maine, USA Muscle 2 F 0.88 / 0.49 ± 0.39 0.21 - 0.76 (1973)
Blubber 2 F O.flB / 0.033 ± 0.007 0.028- 0.038
167 Harbour Seal Boothbay Harbour 1971 Liver + 2 M&F 1.24 / 64.2 3.40 ± 0.59 2.98 - 3.82 Gaskin et al.(Phoca uitulina) Maine, USA Muscle 2 M&F 1.24 / 64.2 1.04 ± 0.70 0.55 - 1. 54 (1973)
Blubber 2 M&F 1.24 / 64.2 0.076 ± 0.016 0.064- 0.087
168 Ha rbour Sea1 New Brunswick, 1971 Liver + M '\.{I. 3 / '\,20 1.72 Gaskin et a1.(Phoca uitulina) E. Canada Muscle M '\.{I.03 / '\,20 0.35 (1973)
Blubber M '\.{I.03 / '\,20 0.061
169 Harbour Seal New Brunswick, 1971 Liver F '\,1.25 / '\,55 50.9 Gaskin et al.(Phoca uitulina) E. Canada Muscle F '\,1.25/'\,55 Q.16 (1973) wBlubber F '\,1.25 / '\.55 0.036 N
191 Harbour Seal New Brunswick 1971 +"Muscle 2 M '\.87.5/ '\,25 0.46 ± 0.12 0.38 - 0.55 Gaskin et a1.(Phoca uitulina) E. Canada Blubber 2 M '\.87.5/ '\,25 0.08 ± 0.03 0.06 - 0.11 (1973)
Age / Len~th(yrs) (m
173 Harbour Seal Wadden Sea, 1974 Liver + M 0.3 / 8 van de Ven et a1.0.658(Phoca uituZina) Netherlands 1976 Muscle M 0.3 / 0.098 (1979)
Kidney M 0.3 / 0.68
174 Harbour Seal Wadden Sea, 1974 Liver + F 0.5 / 85.8 8 van de Ven et a1.(Phoca uituZina) Netherlands 1976 Muscle F 0.5 / 0.55 8 (1979)Kidney F 0.5 / 3.2 8Blubber F 0.5 / 0.03175 Ha rbour Sea1 ~/adden Sea, 1974 Liver + M / 368
(Phoca uitulina) Netherlands 1976 Muscle M / 8 van de Ven et a1.1.6
8 (1979)Kidney M / 2.3 8Blubber M / 0.11

Table 5. Continued
Index Year No. of Mean I Hg ~g/g
flo. * Species Location Taken Tissue Animals Sex age I len)th mean t. S.D. Range Source(yrs) (m
176 Ha rbour Sea1 Wadden Sea, 1974 Liver 2 F I - 55.5: ± 6.36 51 - 60 van de Ven et al.(Phoca vituZina) Netherlanc1s 1976 Kidney 1 F I - 4.9 a (1979)
Blubber 1 F I - 0.08
177 Harbour Sea1 Netherlands 1974 Liver M 24 I - 5513 van de Ven et a1.(Phoca vituZina) 1976 Kidney M 24 I 8 (1979)- 6.3 a
Blubber M 24 I - 0.07
178 Harbour Seal Netherlands 1974 Liver F adult I - 25013 van de Ven et al.(Phoca vituZina) 1976 Kidney F adult I - 1413 (1979)
Blubber F adult I - 0.25 13
179 Harbour Seal San Miquel Isle, 1971 Liver 4 M&F - I 1.6? 269 ± 290 81 - 700 Anas(Phoca vituZina) California, USA (I974b)
180 Ha rbour Sea1 Columbia River 1971 Liver 3 M&F - I 1.19 24.5 ± 37.7 0.3 - 68.0 Anas(Phoca vituZina) Oregon, USA (I974b) w
w184 Ha rbour Sea1 Pribilof Island, 1971 Liver 3 M&F - 4.23 ± 4.25 0.6 - 8.9 Anas(Phoca vitulina) Alaska, USA (I974b)
185 Harbour Seal West Scotland 1969 Liver 6 0.05 - 1.13- Roberts et al.(Phoca vituZina) 1970 Kidney 6 0.04 - 3.5- (1976)
186 Harbour Seal East Anqlia 1969 Liver 7 1.5 - 106<X Roberts et al.(Phoca vitulina) (Scroby Sands 1970 Kidney 9 0.2 - 4.7- (1976)
and the Wash)
187 Harbour Seal Sable Island, 1971 Liver + 4 M&F I - 2.91 ± 0.57 2.14 - 3.49 Sergeant and(Phoca vitulina) Eastern Canada Muscle' 4 M&F I - 0.71 ±. 0.04 0.67 - 0.75 Armstrong
Blubber .4 M&F I - 0.04 ± 0.04 0.02 - 0.09 (1973)
188 Harbour Sea1 Sable Island, 1971 Liver + 4 M&F 5.2 I - 13.45 ± 6.97 6.91 - 21. 7 Sergeant and(Phoca vitulina) Eastern Canada Muscle 4 M&F 5.2 I - 0.44 ± 0.10 0.31 - 0.55 Armstrong
Blubber 4 M&F 5.2 I - 0.33 ± 0.01 0.02 - 0.03 (1973)
189 Ha rbour Sea 1 East Anglia, Liver 2 I - 60 Holden(Phoca vitulina) England Muscle 2 I - 2.6 (1975)
Kidney 2 I - 5.3Blubber 2 I - 0.06

Table 5. Continued
Index Year No. of Mean I Hg lJg/gIlo.* Species Location Taken Tissue Animals Sex age /weight mean ! S.D. Range Source
(yrs) (kg)
209 Hooded Seal Magdalen Island, 1971 Liver + 3 M 10 / 37.2 ± 9.2 27.2 - 45.2 Sergeant and(CyBtophora ariBtata) Gulf of St. Lawrence Muscle 3 M 10 / - 1.28 ± 0.66 0.62 - 1.93 Armstrong
E. Canada Blubber 1 M 8 / - 0.08 ± (1973)
210 Hooded Seal Upernavik, 1974 Liver + 4 6.5 ± 4.5 t 1.9 - 11.2 Johansen et al.(Cystophora ariBtata) W. Greenland Muscle 4 0.20 ± 0.04 t 0.16 - 0.24 (1980)
211 Hooded Seal Upernavik, 1976 Liver + 10 16.7 ± 13.5 t 2.8 - 44.4 Johansen et al.(CyBtophora ariBtata) W. Greenland Muscle 10 0.33 ± 0.08 t 0.21 - 0.47 (1980)
207 Harp Seal E. Canada 1980 Liver 6 M&F 0.5 / - 0.50 ± 0.27 0.24 - 0.89 Botta et a1.(PagophiluB groenlandiauB) Newfoundland (1983)
213 Harp Seal Eastern Canada Liver 10 pups / - 0.46 ± 0.05 0.18 - 0.83 Freeman(PagophiluB gnoenlandiauB) (various locations) 10 pups / - 0.22 ± 0.0 and Horne
(1973)
214 Harp Seal Umanak, 1972 Liver + 7 1.2 ± 1.3 t 0.21 - 3.6 Johansen et al. w(PagophiluB groenlandiauB) W. Greenland Muscle 12 0.20 ± 0.05 t 0.11 - 0.26 (1980) ~
215 Harp Seal Upernavik, 1973 Liver + 11 2.3 ± 1.71 t 0.37 - 5.8 Johansen et a1.(PagophiluB groenlandiauB) W. Greenland Muscle 11 0.24 ± 0.12 t 0.11 - 0.48 (1980)
216 Harp Seal Upernavik, 1976 Liver + 4 0.86 ± 0.37 0.54 - 1.3 Johansen et al.(PagophiluB gnoenlandicuB) W. Greenland Muscle 4 0.20 ± 0.05 t 0.16 - 0.26 (1980)
217 Harp Seal Gulf of 1973 Liver 2 F pupsY/ - 0.33 ± 0.15 0.22 - 0.43 Jones et a1.(PagophiluB groenlandiaus) St. Lawrence, (1976)
E. Canada
218 Harp Seal Gulf of 1973 Liver + 2 F 12.3 / 7.10 ± 0.99 6.4 - 7.8 Jones et a1.(PagophiluB groenlandicus) St. Lawrence Muscle 2 F 12.3 / - 0.27 ± 0.06 0.23 - 0.31 (1976)
E. Canada
219 Harp Seal Gulf of 1973 Liver + 2 M&F pups / 0.16 ± 0.07 0.12 - 0.21 Jones et a1.(Pagophilus groenlandiaus) St. Lawrence Muscle 3 M&F pups / 0.09 ± 0.02 0.07 - 0.12 (1976)E. Canada Blubber 1 F pup / 0.09220 Harp Seal Ma!jdalen Islands 1970 Liver + F 11 / 172 25.8 Freeman et al.(PagophiluB groenlandiauB) Gulf of St. Lawrence Muscle F 11 / 172 0.78 (1975)E. Canada Kidney F 11 / 172 5.98

Table 5. Continued
Index Year No. of Mean I Hg pg/gflo. * Species Location Taken Tissue Animals Sex age /weight mean ± S.D. Range Source
(yrs) (kq)
221 Harp Seal Escoumins.Quebec 1971 Liver + 2 M&F / 1.29 ± 0.64 0.84 - 1. 74 Sergeant and(PagaphiluB groenlandicuBJ E. Canada Muscle 2 M&F / 0.24 ± 0.11 0.16 - 0.32 Armstrong
Blubber 2 M&F / 0.025 ± 0.007 0.02 - 0.03 (1973)
222 Harp Seal Escoumins.Quebec 1971 Liver 14 M&F 4.2/ 3.28 ± 1.55 1.46 - 7.74 Sergeant and(PagophiluB groenlandicusJ E. Canada Armstrong
(1973)
223 Harp Sea1 Escoumins.Quebec 1971 Liver + 4 M 13.8/ 6.35 ± 2.86 3.72 - 10.0 Sergeant and(PagophiluB groenlandicusJ E. Canada Muscle 4 M 13.8/ 0.38 ± 0.09 0.29 - 0.50 Armstrong
Blubber 4 M 13.8/ 0.033 ± 0.015 0.02 - 0.05 (1973)
224 Harp Seal Eastern Canada 1973 Liver + 10 F 4.60 ± 0.89 1.90 - 9.40 Freeman and(PagophiluB groenlandicusJ (various locations) Muscle 10 F 0.46 ± 0.04 0.28 - 0.70 Horne (1973) w
Blubber 5 F 0.14 ± 0.0 U1
225 Harp Sea1 Gulf of 1973 Liver 10 M pups / 0.27 ± 0.12 0.116- 0.478 Jones et al.(PagophiluB groenlandicuBJ St. Lawrence. Kidney 8 M pups / 1.89 ± 0.16 0.04 - 0.48 (1976)
E. Canada
226 Harp Sea1 Gulf of 1973 Liver + 6 F pups / 0.23 ± 0.13 0.094- 0.45 Jones et a1.(PagophiluB groenlandicuBJ St. Lawrence. Muscle 6 F pups / 0.14 ± 0.10 1.07 - 0.34 (1976)
E. Canada
227 Harp Sea1 E. Canada 1980 Liver 6 M&F / 1.67 ± 0.81 0.72 - 2.71 Botta et al.(PagophiluB groenlandicuBJ Newfoundland (1983)
229 Harp Seal E. Canada 1980 Liver 6 M&F 2 / 2.42 ± 1.48 0.86 - 2.78 Botta et a1.(PagophiluB groenlandicusJ (1983)
230 Harp Sea1 E. Canada 1980 Liver 6 M&F 3 / 3.96 ± 1.32 1.88 - 5.87 Botta et a1.(PagophiluB groenlandicuBJ (1983)
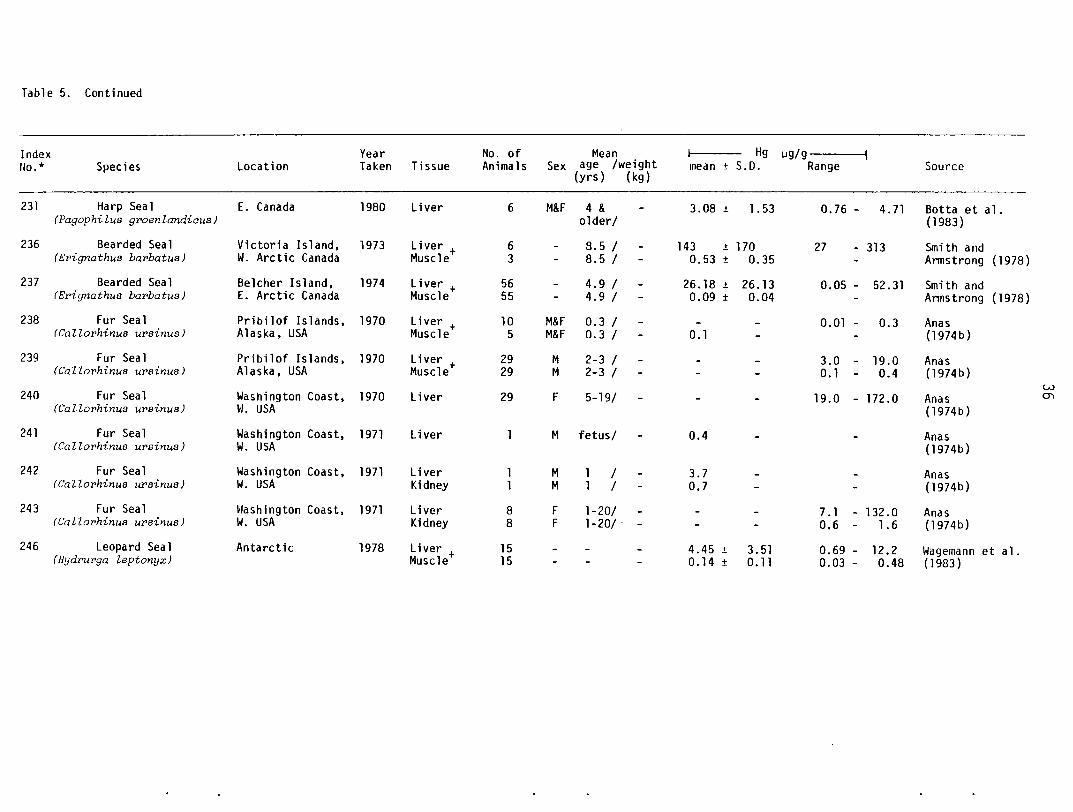
Table 5. Continued
Index Year No. of Mean Hg vs/sflo.* Species location Taken Tissue Anima 1s Sex age Iweight mean ! S.D. Range Source
(yrs) (kg)
231 Harp Seal E. Canada 1980 liver 6 M&F 4 & 3.08 ± 1.53 0.76 - 4.71 Botta et al .(PagophiZuB groenZandicus) olderl (1983)
236 Bea rded Sea1 Victoria Island, 1973 liver + 6 8.5 1 143 ± 170 27 - 313 Smi th and(ErignathuB barbatuB) W. Arctic Canada Muscle 3 8.5 1 0.53 ± 0.35 Annstrong (1978)
237 Bea rded Sea1 Belcher Island, 1974 liver + 56 4.9 1 26.18 ± 26.13 0.05 - 52.31 Smith and(ErignathuB barbatuB) E. Arcti c Canada Muscle 55 4.9 1 0.09 ± 0.04 Anns trong (1978)
238 Fur Seal Pribilof Islands, 1970 liver + 10 M&F 0.3 1 0.01 - 0.3 Anas(Cal.l.orhinue urBinuB) Alaska, USA Muscle 5 M&F 0.3 1 0.1 (1974b)
239 Fur Seal Pribi10f Islands, 1970 liver + 29 M 2-3 / 3.0 - 19.0 Anas(CaZZorhinuB urBinuB) Alaska, USA Muscle 29 M 2-3 1 0.1 0.4 (1974b)
w240 Fur Seal Washington Coast, 1970 liver 29 F 5-191 19.0 - 172.0 Anas en
(CaZZorhinuB urBinuB) H. USA (1974b)
241 Fur Seal Washington Coast, 1971 liver M fetusl 0.4 Anas(CaZZorhinuB urBinuB) W. USA (1974b)
242 Fur Seal Washington Coast, 1971 liver M 1 3.7 Anas(CaZZorhinuB urBinuB) W. USA Kidney M 1 0.7 (1974b)
243 Fur Seal Hashington Coast, 1971 liver 8 F 1-201 7.1 - 132.0 Anas(CaZZorhinuB urBinuB) W. USA Kidney 8 F 1-201 . - 0.6 - 1.6 (1974b)
246 leopard Seal Antarctic 1978 liver + 15 4.45 ± 3.51 0.69 - 12.2 Wagemann et a1.(Hydrurga Zeptonyx) Muscle 15 0.14 ± 0.11 0.03 - 0.48 (1983)

H9 U9/9-----imean! S.D. Range
Table 5. Continued
Index Year No. of Meanflo. * Species Location Taken Tissue Animals Sex a!1e /weight
(yrs) (kg)
247 Leopard Seal Antarctic 1978 Liver FAadult / -(Hy~ga leptonyx)
Musc1e+ FAadult /
248 Leopard Seal Antarctic 1978 Liver + - fetus / -(Hydru~ga leptonyx) Muscle fetus /
249 Weddell Seal Antarctic 1978 Liver +(Leptonychotes weddelli) Muscle
328 At1anti c ~Ia1rus North Greenland 1975- Liver 46 M&F 10.9 / -(Odobenus ~smarus) (Thule) 1977 Muscle 58 M&F 10.9 / -
* - Different tissues belong to the same animal or groups of animals which have the same Index No.+ Dorsal meat--r _ S.D. estimated from the range
~ - Approximately
• - Concentrations are age correlated; significant at 1.0%
a _ Concentrations are aqe correlated; significant at 0.1%
B _ Arithmetic mean of three determinations per sample
Y - Kept in captivity for one year
A - Gravid
3.98
0.16
0.171.11
0.710.20
1. 78 ± 1.540.08 ± 0.05
0.12- 7.30.03 - 0.13
Source
14agemann(Unpublished)
Wagemann(Unpublished)
Wagemann(Unpublished)
Bornetal.(1981)

Table 6. Reference concentrations of Zn (wet weight basis) in different tissues of Pinnipeds.
Index Year No. of Mean I Zn ~g/g
No.· Species Location Taken Tissue Animals Sex Age / Length mean ± S.D. Range Source(yrs) (m)
102 Ringed Seal North Sea 1975 Liver F / 0.84 40.0 Harms et al.(Phoca hiapidaJ (1978)
104 Rinqed Seal Northern Baffin 1975 Liver + 6 41.0 ± 5.1 33.9 - 48.6 Fa 11 i s(Phoca hiapidaJ Island, Muscle 6 26.2 ± 5.8 18.8 - 29.9 (unpublished)
E. Arctic Canada Blubber 6 1.27 ± 0.39 0.79 - 1.94
126 Ringed Seal Northern Baffin 1976 Liver + 1 43.2 Fall is(Phoaa hiapida J Island, Muscle 1 19.6 (unpublished)
E. Arctic Canada Kidney 1 39.6Blubber 1 5.4
127 Ringed Seal Northern Baffin 1977 Liver + 5 44.0 ± 3.4 36.6 - 52.1 Fallis(Phoca hiapidaJ Island Muscle 7 20.1 ± 1.4 14.8 - 23.7 (unpublished) w
E. Arctic Canada Kidney 1 41. 1 co
128 Ringed Seal Northern Baffin 1974 Liver + 17 34.3 ± 13.1 9.4 - 52.1 Fall is(Phooa hiapidaJ Island, Muscle 18 21. 7 ± 5.9 12.8 - 34.5 (unpublished)
E. Arctic Canada
129 Ringed Seal Umanak, 1979 Liver + 29 46.0 ± 9.0t 30.7 - 67.3 Johansen et al.(Phoaa hiapidaJ W. Greenland Muscle 29 22.2 ± 6.22t 14.2 - 39.5 (1980)
Kidney 29 46.2 ± 12.3t 27.9 - 78.0Blubber 29 0.84 ± 0.12 t 0.66 - 1.16
130 Ringed Seal Upernavik, 1974 Liver + 12 37.0 ± 8.6t 18 - 46 Johansen et al.(Phoaa hiapidaJ W. Greenland + Muscle 7 55.0 ± 17.4 t 37 - 84 (1980)
1976 Blubber 7 1.4 ± 0.81 t 0.1 - 2.3
153 Grey Seal North Sea 1975 Liver M 2 / - 61.0 Hanns et al.(Halichoerua grypus) (1978)
163 Grey Seal East Scotland Liver 9 81 ± 8.8 68 - 94 Holden(Halichoeruo grypuoJ (1975)

Table 6. Continued
Index Year No. of Mean I Zn ~g/g
110.* Species Location Taken Tissue Animals Sex Aqe 1 Length mean ± S.D. Range Source(yrs) (m)
193 Ha rbour Sea1 German North 1974- Liver 27 - 0.0-0.5 1 - 39.4 ± 7.3 t 27.0 - 56.0 Drescher et a1.(Phoca vi tiuZina) Sea Coast 1976 (1977)
194 Ha rbour Sea1 German North 1974- Liver 10 0.58-1. 01 - 39.6 ± 7.5 t 27.5 - 50.5 Drescher et a1.(Phoca vituZina) Sea Coast 1976 Kidney 9 - 0.58-1.01 22.2 ± 2.59 t 18.8 - 26.5 (1977)
195 Ha rbour Sea1 c'erman North 1974- Liver 11 1.1-1.51 42.2 ± 4.7t 34.0 - 49.0 Drescher et al.(Phoca vituZina) Sea Coast 1976 (1977)
196 Ha rbour Sea1 German North 1974- Liver 4 1.6-2.0 1 - 37.3 ± 10.2t 29.0 - 50.0 Drescher et al.(Phoca ui tul.ina) Sea Coast 1976 Kidney 4 1.6-2.0 1 26.5 ± 4.37 t 23.3 - 32.5 (1977)
198 Ha rbour Sea1 German North 1974- Liver 4 6-8 1 - 36.0 ± 5.8 t 29.0 - 41.0 Drescher et al.(Phoca vituZina) Sea Coast 1976 Kidney 3 6-8 1 - 18.8 ± 2.19 t 16.3 - 20.0 (1977)
200 Ha rbour Sea1 Wadden Sea Liver fetus 1 - 89 Duinker et al.(Phoca vituZina) Netherlands (1979)
w201 Ha rbour Sea1 Okhotsk Sea 1975 Muscle+ F 8 1 1.5 22.2 Hamanaka et a1. l.O
(Phoca vituZina) Blubber F 8 1 1.5 1.5 (1977)
202 Ha rbour Sea1 Okhotsk Sea 1975 Muscle+ M pup 1 0.98 19.4 Hamanaka et al ,(Phoca vituZina) (1977)
203 Harbour Seal East Scotland Liver 4 59 ± 19.9 t 43 - 84 Holden(Phoca vituZina) (1975)
204 Ha rbour Sea1 Scroby Liver 2 48 ± 8.9 t 43 - 53 Holden(Phoca vituZina) East Anglia (1975)
205 Harbour Seal Wash. Liver 3 57 ± 3.6 t 55 - 61 Holden(Phoca vituZina) East An~lia (1975)
208 Harbour Seal East Coast of Liver + 5 54 ± 17.6 t 43 - 84 Holden(Phoca vi t u Zina) England. Muscle 5 34 ± 0.86 t 33 - 35 (1975)
212 Harbour Seal Wadden Sea Liver 8(Phoca vituZina) Netherlands Kidney 16 64 Duinker et al.2 15 25 (1979)Blubber 3 1-24 3 14

Table 6. Continued
Index Year No. of Mean I Zn vs/sNo.· Species Location Taken Tissue Animals Sex Age I Length mean 1: S.D. Range Source
(yrs) (m)
246 Leopa rd Sea1 Antarctic 1978 Liver + 15 53.9 ± 13.8 32.2 - 82.8 Wagemann(Hydl~~ga Zeptonyx) Muscle 15 23.4 ± 10.5 14.8 - 49.3 (Unpublished)
247 Leopa rd Sea1 Antarctic 1978 Liver + FA adultl 60.9 Wagemann(Hydrw'ga Leptiorujx) Muscle FA adultl 26.8 (Unpublished)
248 Leopard Seal Antarctic 1978 Liver + fetusl 86.1 Wagemann(Hydrurga Zeptonyx) Muscle fetusl 32.8 (Unpublished)
249 Wedde11 Sea1 Antarctic 1978 Liver + 109.2 Wagemann(Leptonychotea weddeZZi) Muscle 84.3 (Unpublished) +:>
0206 A Steller Sea Lion Japan 1977 Liver F 0.7 I 62 Hamanaka et al.
(Eumetopiaa jubata) (Hokkaido) Muscle F 18 (1982 )Kidney F 20
206 B Steller Sea Lion Japan 1976- Liver 5 M&F 1.7 43 37 - 51 Hamanaka et al.(Eumetopiaa jubata) (Hokkaido) 1977 Muscle 5 M&F 21 19 - 26 (1982)
Kidney 8 M&F 24 20 - 28
206 C Steller Sea Lion Japan 1976- Liver 9 M&F 2.7-4.81 - 50 30 - 69 Hamanaka et al.(Eumetopiaa jubata) (Hokkaido) 1977 Muscle 7 M&F 19 16 - 26 (1982 )
Kidney 10 M&F 28 23 - 40
206 D Steller Sea Lion Japan 1976- Liver 2 M&F 7.7-8.81 _ 38 28 - 48 Hamanaka et al.(Eumetopiaa jubata) (Hokkaido) 1977 Muscle 2 M&F 20 20 - 22 (1982 )
Kidney 2 M&F 32 30 - 33
* - Different tissues belong to the same animal or groups of animals which have the same Index No.+ - Dorsal meatt - S.D. estimated from the rangeA - Gravid
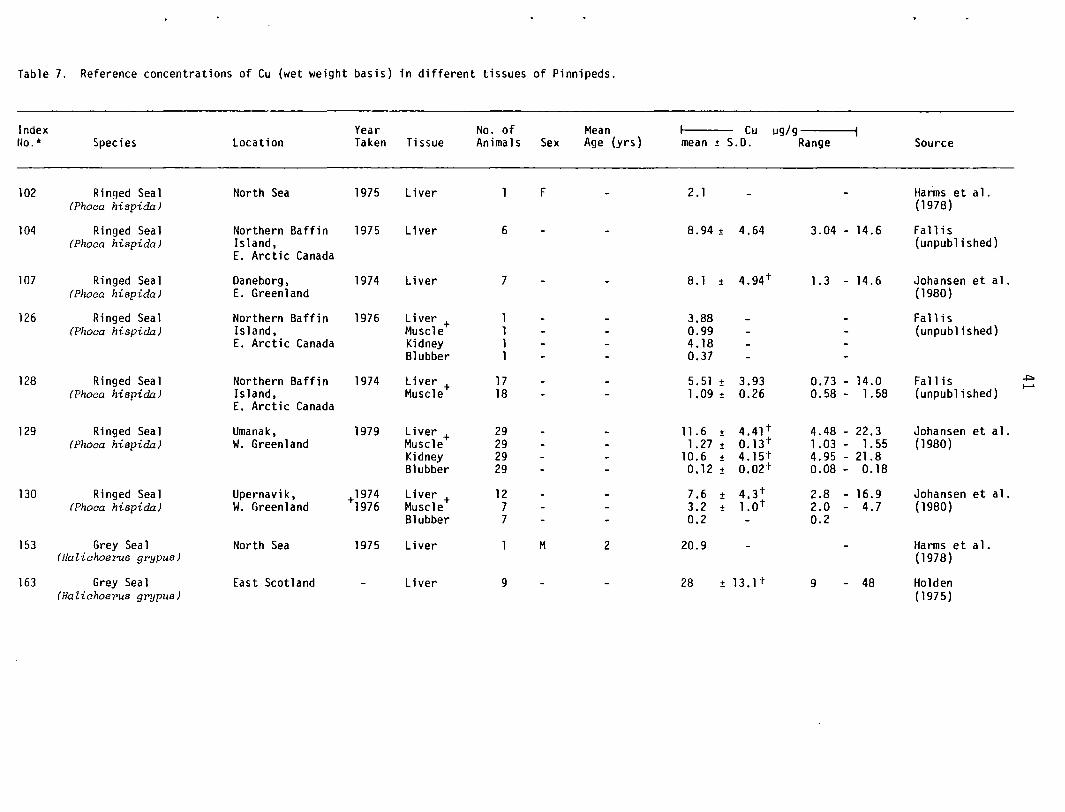
Table 7. Reference concentrations of Cu (wet weight basis) in different tissues of Pinnipeds.
Index Year No. of Mean Cu \.Ig/gNo.· Species Location Taken Tissue Animals Sex Age (yrs) mean ! S.D. Range Source
102 Ringed Seal North Sea 1975 Liver F 2.1 Harms et a1.{Phoca hispidaJ (1978)
104 Ringed Seal Northern Baffin 1975 Liver 6 8.94 ± 4.64 3.04 - 14.6 Fallis{Phoca hispidaJ Island, (unpublished)
E. Arctic Canada
107 Ringed Seal Daneborg, 1974 Liver 7 8.1 ± 4.94 t 1.3 - 14.6 Johansen et al.(Phoca hispidaJ E. Greenland (19BO)
126 Ringed Seal Northern Baffin 1976 Liver + 3.88 Fa11 is{Phoca hispidaJ Island, Muscle 0.99 (unpublished)
E. Arctic Canada Kidney 4.18Blubber 0.37
128 Ringed Sea1 Northern Ba ffi n 1974 Liver + 17 5.51 ± 3.93 0.73 - 14.0 Fall is ,f::>.......
(Phoca hispidaJ Island, Muscle 18 1.09 ± 0.26 0.58 - 1. 58 (unpublished)E. Arctic Canada
129 Ringed Seal Umanak, 1979 Liver + 29 11.6 ± 4.41 t 4.48 - 22.3 Johansen et a1.(Phoca hispidaJ W. Greenland Muscle 29 1.27 ± O.13t 1.03 - 1.55 (1980)
Kidney 29 10.6 ± 4.15t 4.95 - 21.8Blubber 29 0.12 ± 0.02 t 0.08 - 0.18
130 Ringed Seal Upernavik, +1974 Liver + 12 7.6 ± 4.3 t 2.8 - 16.9 Johansen et al.{Phoca hispidaJ W. Greenland 1976 Muscle 7 3.2 ± LOt 2.0 - 4.7 (1980)
Blubber 7 0.2 0.2
153 Grey Seal North Sea 1975 Liver H 2 20.9 Harms et al.{Halichoerus g~ypusJ (1978)
163 Grey Seal East Scotland Liver 9 28 ± 13.1 t 9 - 48 Holden(Halichoe~us g~ypusJ (1975)

Table 7. Continued.
Index Year No. of Mean I Cu ~g/g
No.* Species Location Taken Tissue Anima 1s Sex age (yrs) mean ! S.D. Range Source
193 Harbour Seal German North 1974- Liver 27 0 - 0.5 6.1 ± 2.7 t 2.8 - 13.5 Drescher et a1.(Phoca vituZina) Sea Coast 1976 (1977)
194 Harbour Seal lierman North 1974- Liver 11 0.58 - 1.0 7.0 ± 2.3 t 3.3 - 10.5 Drescher et a1.(Phoca vituZina) Sea Coast 1976 Kidney 9 0.58 - 1.0 3.3 ± 0.34t 3.0 - 4.0 (1977)
195 Harbour Seal German North 1974- Liver 11 1.1 - 1.50 5.7 ± 2.6t 2.6 - 10.8 Drescher et al.(Phoca vituZina) Sea Coast 1976 (1977)
196 Harbour Seal German North 1974- Liver 4 1.6 - 2.0 10.6 ± 5.4t 6.0 - 17.0 Drescher et al.(Phoca vituZina) Sea Coast 1976 Kidney 4 1.6 - 2.0 3.2 ± 0.63 t 2.5 3.8 (1977)
198 Harbour Seal German North 1974- Liver 4 6 - 8 10.7 ± 3.1 t 8.5 - 14.8 Drescher et al.(Phoca vituZina) Sea Coast 1976 Kidney 3 6 - 8 2.5 ± 0.30t 2.3 - 2.8 (1977)
-+::>200 Harbour Seal Hadden Sea Liver fetus 49 Duinker et al. N
(Phoca vituZina) Netherlands (1979)
203 Harbour Seal East Scotland Liver 4 15 ± 5.35 t 10 - 21 Holden(Phoca vituZina) (1975)
204 Harbour Seal Scroby, Liver 2 9 Holden(Phoca vituZina) E. England (1975)
205 Harbour Seal Wash, Liver 3 15 ± 7.09 t 11 - 23 Holden(Phoca vituZina) E. England (1975)
212 Harbour Seal Hadden Sea Liver 8 2.0 - 20.0 Duinker et a1.(Phoca vituZina) Netherlands Kidney 2 4.8 - 5.1 (1979)
Blubber 3 0.9 - 3.0

Table 7. Continued
IndexNo.* Species location
YearTaken Tissue
No. of MeanAnimals Sex Age (yrs)
I Cu \Jg/g----imean! S.D. Range Source
246 leopard Seal Antarctic 1978 liver + 15 44.64 ± 19.97 16.5 - 68.2 I~agemann(Hydrurga leptonyx) Muscle 15 0.65 ± 0.26 0.35 - 1. 15 (Unpublished)
247 leopard Seal Antarctic 1978 liver + FA adult 30.7 Wagemann +::>(Hydrurga leptonyx) Muscle FA adult 0.43 (Unpublished) w
248 Leopard Sea1 Antarctic 1978 liver + fetus 53.1 Wagemann(HydPurga leptonyx) Muscle fetus 1.88 (Unpublished)
249 Weddell Seal Antarctic 1978 Liver + 18.6 Wagemann(Leptonychotes weddelli) Muscle 0.53 (Unpublished)
* - Different tissues belong to the same animal or groups of animals which have the same Index No.
+ - Dorsal meat
t - S.D. estimated from the range
A - Gravid

Table 8. Reference concentrations of Pb (wet weight basis) in different tissues of Pinnipeds.
IndexNo.· Species Location
YearTaken T1 ssue
No. ofAnimals Sex
MeanAge (yrs)
I Pb \.19/9---mean ± S.D. Range Source
102 Ringed Seal North Sea 1975 Liver F 0.24 Hanns et al.(Phoca hi8pida) (1978 )
104 Ri nged Sea1 Northern Baffin 1975 Li ver + 6 <0.04 < 0.04 - Fa11i s(Phoca hiepi.da) Is 1and. Muscle 6 <0.04 < 0.04 - (unpublished)
E. Arctic Canada
107 Ri nged Sea1 Daneborg. 1974 Liver 7 < 0.03 < 0.03 - 0.04 Fa11i s(Phoca hi8pida) E. Greenland (unpublished)
111 Ri nged Sea1 North Sea. Coast 1975 Liver 1 F 0.24 Drescher (l977)(Phoca hi8pida) of W. Germany
126 Ri nged Sea1 Northern Baffin 1976 Liver + 1 < 0.03 Fa11is(Phoca biepida) Island. Muscle 1 <0.03 (unpublished)
E. Arct i c Canada Kidney 1 < 0.02 .f:::>.f:::>
127 Ri nged Sea1 Northern Baffin 1977 Li ver + 5 <0.05 Fallis(Phoca hi8pida) Is 1and. Muscle 7 < 0.05 - (unpublished)
E. Arct i c Canada Kidney 1 < 0.04
128 Ri nged Sea1 Northern Baffin 1974 Liver + 15 0.06 - 1.27 Fa11i s(Phooa hi8pida) Island. Muscle 16 < 0.06 -99.2 (unpublished)
E. Arctic Canada
129 Ringed Seal Umanak. 1979 Liver + 29 0.01 13< 0.01 - 0.03 Johansen et al.
(Phoaa hiapida) W. Greenland Muscle 29 0.04~± 0.02 t 0.02 - 0.10 (1980)Kidney 29 0.05 - < 0.004- 0.48Blubber 29 0.12CL < 0.05 - 2.38
130 Ri nged Sea1 upernavtk , +1974 Liver + 12 <0.03 < 0.03 - 0.06 Johansen et al.(Phooa hiapida) W. Greenland 1976 Muscle 7 0.16 <.0.05 - 0.35 (1980)
153 Grey Seal North Sea 1975 Liver M 2 0.31 Hanns et al.(Holichoeru8 grypus) (1978 )

Table 8. Cont i nued
Index Year No. of Mean I Pb lJg/gNo.* Species Location Taken Tissue Animals Sex Age (yrs) mean ± S.D. Range Source
163 Grey Seal East Scotland Liver 9 7 < 3 ·17 . Holden (1975)(Hal.i choerus grypus)
164 Grey Seal Scroby, Liver 1 8 Holden (1975)(Hal.i choerue gl'ypus) Engl and
192 Ha rbou r Sea 1 West Scotland and 1969. Liver 2 1.4 Roberts et al.(Phoca vi tul.ina) East Anglia, 1970 Kidney 17 1.17 ± 0.5 (1976 )
E. England
193 Harbour Seal Ge rman North 1974- Liver 27 o - 0.5 0.23 ± 0.12 t 0.10 - 0.57 Orescher et al.(Phoca vitulina) Sea Coast 1976 (1977)
194 Ha rbour Sea 1 Ge rman North 1974· Liver 11 0.58 - 1.0 0.23 ± 0.14t 0.11 - 0.55 Drescher et al.(Phoca vi tul.ina) Sea Coast 1976 Kidney 9 0.58 - 1.0 0.32 ± O.lOt 0.18 - 0.48 (1977)
+::>
195 Ha rbou r Sea 1 German North 1974- Liver 11 1.1 - 1.5 0.17 ± 0.06 t 0.10 - 0.28 Drescher et al.U1.
(Phoca vitulina) Sea Coast 1976 (1977)
196 Harbour Seal German North 1974- Li ver 4 1.6 - 2.0 0.23 ± 0.08 t· 0.14 - 0.30 Drescher et al.(Phoca vitulina) Sea Coast 1976 Kidney 4 1.6 - 2.0 0.38 ± 0.20 t 0.14 - 0.55 (1977)
197 Harbour Seal German North 1974- Liver 3 - 5 0.25 Drescher et al.(Phoca vitulina) Sea Coast 1976 (1977)
198 Harbour Seal Ge rman North 1974- Liver 4 6 - 8 0.45 ± 0.07 t 0.39 - 0.53 Drescher et al.(Phoca vitulina) Sea Coast 1976 (1977 )
199 Harbour Sea 1 West Scotland 1969- Li ver + 15 2.31 ± 1.27 Roberts et al.(Phoca vi tul/ina) and East Anglia 1970 Muscle 12 1.2 ± 0.3 (1976)
200 Harbour Seal Hadden Sea Liver 1 fetus <0.05 Duinker et al.(Phoca vitulina) Netherlands (1979)

Table 8. Continued
Index Year No. of Mean I Pb IIg/g110.* Species Location Taken Tissue Animals Sex age (yrs) mean !: S.D. Range Source
203 Ha rbour Sea1 East Scotland Liver 4 5.0 ± 1.9 t 3.0 - 7.0 Holden(Phoca vi tu Lina) (1975)
204 Ha rbour Sea1 Scroby, Liver 2 10 Holden(Phoca vitulina) East AnQlia (1975)
205 Harbour Seal Wash, Liver 3 10 ± 2.4t 8 12 Holden(Phoca vitulina) East Anglia (1975)
206 Harbour Seal West Scotland 1969- Liver 2 F (mother) 2.4 Roberts et a1.(Phoca vitulina) and East Angl ia 1970 Kidney 2 F (mother) 1. 19 (1976)
207 Harbour Sea 1 West Scotland 1969- Kidney 2 fetus 1.31 Roberts et al.(Phoca vitulina) and East Anglia 1970 (1976)
212 Harbour Seal Wadden Sea Liver 8 <0.05 - 2.3 Duinker et al.(Phoca vitulina) Netherlands Kidney 2 0.16 - 0.23 (1979) +::-
Blubber 3 <0.05 - 1.0(j)
241 Fur Seal Washington Coas t , 1971 Liver M fetus 0.8 Anas(Cal:lorhinue ul'BinuB) USA Kidney M fetus 0.3 (1974b)
242 Fur Seal Washington Coast, 1971 Liver M 0.2 Anas(Ca l.lorhinue UI'BinuB) USA Kidney M 0.3 (1974b)
243 Fur Seal WashinQton Coast, 1971 Liver 8 F 10 0.59 ± 0.12 0.4 - 0.8 Anas(Cal lorhi.nue ul'BinuB) USA Kidney 8 F 10 0.90 ± 0.14 0.8 - 1.0 (1974b)
* - Different tissues belong to the same animal or groups of animals which have the same Index No.
+ -
t -
a -
B -
<P -
Dorsal meat
S.D. estimated from the range
26 out of 29 values were below the detection limit (0.05 ppm)
15 values were below the detection limit (0.02 ppm)
12 values were below the detection limit (0.02 ppm)

Table 9. Reference concentrations of Cd (wet weight basis) in different tissues of Pinnipeds.
Index Year No. of Mean I Cd \.Ig/grio. • Species Location Taken Tissue Animals Sex Age / Height mean ! S.D. Range Source
(yrs) (kg)
102 Ri need Sea1 North Sea 1975 Liver F 0.31 Hanns et a1.(Phoca hispidaJ (1978)
104 Ringed Seal Northern Ba Hi n 1975 Liver + 6 4.2 ± 3.3 0.65 - 8.07 Fallis(Phoca hispidaJ Island, Muscle 6 0.029 ± 0.019 0.011 - 0.058 (unpublished)
E:. Arctic Canada Blubber 6 0.017 ± 0.013 <0.01 0.038
107 Ringed Seal Daneborg, 1974 Liver 7 6.6 ± 6.1 t 1.8 - 18.2 Johansen et al ,(Phoca hispidaJ E. Greenland (1980)
126 Ringed Seal Northern Baffin Liver + 1 15.6 Fa 11 i s(Phoca hispidaJ Island, Muscle . 1 0.31 (unpublished)
E. Arctic Canada Kidney 1 65.9Blubber 1 0.43
~--...127 Ringed Seal Northern Baffi n 1977 Liver + 5 5.5 ± 0.8 2.8 10.0 Fall is(Phooa hispida J Island, Muscle 7 0.05 ± 0.01 0.03 - 0.07 (unpublished)
E. Arctic Canada Kidney 1 27.9
128 Ringed Seal Northern Baffin 1974 Liver + 15 5.8 ± 4.0 <0.07 - 12.3 Fallis(Phoca hispidaJ Island, Muscle 3 0.16 ± 0.08 <0.03 - 0.23 (unpublished)
E. Arctic Canada
129 Ringed Seal Umanak, 1979 Liver + 29 7.32 + 3.0 t 2.71 14.9 Johansen et a1.(Phoca hispidaJ W. Greenland Muscle 29 0.07 ; o.lf 0.02 - 0.42 (1980)
Kidney 29 37.4 ± 33.7 9.01 - 146.2Blubber 29 <0.02 <0.02 - .0.03
130 Ringed Seal Upernavik, 1974- Liver + 12 17 .0 t 2.3 31.6 Johansen et a1.± 9.0 t(Phoca hispidaJ W. Greenland 1976 Muscle 7 0.15 ± 0.06 0.09 - 0.24 (1980)
B1 ubber 7 <0.02 <0.02 - 0.04
132 Grey Sea1 East Coast 1975 Liver 9 M&F 0-3 / 59 0.61 ! 0.75 0.09 - 2.21 McKie et al.(Halichoerus g~ypusJ of Scotland Kidney 10 M&F 0-3 / 59 1. 38 ± 1. 36 0.10 - 4.21 (1980)

Table 9. Continued.
Index Year No. of Mean I Cd lJg/gNo.* Species location Taken Tissue Anima1s Sex Age / ~Jei ght mean ± S.D. Range Source
(yrs ) (kg)
133 Grey Seal East Coast 1975 li ver 8 M&F 4-6 / 92 2.39 ± 2.70 0.23 - 8.49 NcKie et al.(Halichoerus grypus) of Scotland Kidney 8 N&F 4-6 / 92 5.81 ± 4.68 1. 15 -15.1 ( 1980)
134 Grey Seal East Coast 1975 liver 3 M 7-9 /163 0.49 ± 0.10 0.32 - 0.61 McKie et al.(Halichoeruo grypus) of Scotland Kidney 3 M 7-9 /163 1. 76 ± 0.37 1.47 - 2.18 (1980)
135 Grey Seal East Coast 1976 Li ver 9 ~1 0-3 / 67 0.49 ± 0.50 0.07 - 1. 53 McKie et al.(Hal.iohoerus grypus) of Scotland Kidney 11 I~&F 0-3 / 67 1.28 ± 1. 30 0.17 - 3.82 (1980)
136 Grey Seal East Coast 1976 li ver 7 M&F 4-6 / 98 0.84 ± 0.96 0.17 - 2.95 McKie et al.(Hal.ichoerue grypus) of Scotl and Kidney 7 I~&F 4-6 / 98 2.73 ± 2.40 1. 36 - 8.08 (1980)
137 Grey Seal East Coast 1976 liver 4 M 7-9 /143 0.54 ± 0.50 0.17 - 1.26 McKie et al.(Hal-ichoerus grypus) of Scotland Kidney 5 M 7-9 /175 1. 38 ± 0.68 0.83 - 2.50 (1980)
138 Grey Seal East Coast 1977 liver 3 M&F 0-3 / 63 0.76 ± 0.81· 0.05 - 1.64 r~cKi e et al. +::>(Halichoerus grypus) of Scotland Kidney 4 M&F 0-3 / 63 1. 80 ± 1. 89 0.28 - 4.77 (1980) co
139 Grey Seal East Coast 1977 Li ver 9 M&F 4-6 / 91 0.37 ± 0.31 0.05 - 0.80 McKie et al.(Halichoerua grypus) of Scotl and Kidney 9 M&F 4-6 / 91 1. 21 ± 0.77 0.19 2.12 ( 1980)
140 Grey Seal East Coast 1977 liver 3 M&F 7-9 /129 0.23 ± 0.09 0.15 - 0.32 McKie et al.(Ha l.i ohoerue grypus) of Scotland Kidney 3 M&F 7-9 /129 0.56 ± 0.19 0.40 - 0.77 (1980)
141 Grey Seal East Coast 1978 liver 2 M 0-3 / 91 0.48 ± 0.24 0.31 - 0.65 McKie et al.(Ha l.iohoerue grypus) of Scotland Ki dney 2 ~1 0-3 / 91 1. 29 ± 0.15 1.81 - 1.39 (1980)
142 Grey Seal East Coast 1978 Li ver 6 H&F 4-6 /103 0.51 ± 0.28 0.24 - 0.85 McKie et al.(Halichoerus grypus) of Scotland Kidney 5 M&F 4-6 /103 1.43 ± 0.59 0.50 - 2.0 (1980)
143 Grey Seal East Coast 1978 Li ver 4 M&F 7-9 / - 0.97 ± 0.33 0.53 - 1.23 McKie et al.(Halichoerus grypus) of Scotland Kidney 5 M&F 7-9 / - 2.84 ± 0.88 1.95 - 4.24 (1980)
153 Grey Seal North Sea 1975 liver M 2 / - 0.021 Harms et al.(Halichoerus grypus) (1978)

Table 9. Continued
Index Year No. of Mean I Cd \Jg/gIlo.* Species Lociltion Taken Tissue Animals Sex Age / Weight mean t S.D. Range Source
(yrs) (kg)
163 Grey Seal East Scotland Liver 9 1.6 ± 0.4 t 1.1 2.3 Holden(Halichoerus grypus) (1975)
164 Grey Seal Scroby , Liver 1.2 Holden(Halichoerus grypus) England (1975)
185 Harbour Seal West Scotland 1969- Liver 6 0.2 1.1- ROber~s et al .(Phoca vitulina) 1970 Kidney 8 0.1 1.9 - (1976
186 Harbour Seal East Ang1ia. 1969- Liver 7 0.2 0.8- Roberts et a1.(Phoca vitulina) E. England 1970 Kidney 9 0.1 0.6 (1976)
192 Harbour Seal West Scotland 1969- Muscle+ 12 0.13 ± 0.06 Roberts et al.(Phoca vitulina) and East Anglia. 1970 (1976)
E. England
193 Harbour Seal German North 1974- Liver 27 - 0.0 -0.5/ - 0.018 ± o.mt 0.01 0.042 Drescher et a1.(Phoca vitulina) Sea Coast 1976 (1977) .j::>,
co
194 Harbour Seal German North 1974- Liver 11 - 0.58-1.0/ - 0.024 ± 0.004 t 0.018 - 0.03 Drescher et al.(Phoca vitulina) Sea Coast 1976 Kidney 9 - 0.58-1.0/ - 0.10 ± 0.03 t 0.06 - 0.15 (1977)
195 Ha rbour Sea1 German North 1974- Liver 11 1.1 -1. 5/ - 0.028 ± O.Ol7t 0.01 0.063 Drescher et al.(Phoca vitulina) Sea Coast 1976 (1977)
196 Ha rbour Sea1 German North 1974- Liver 4 - 1.6 -2.0/ - 0.032 ± 0.006 t 0.025 - 0.038 Drescher et a1.(Phoca vitulina) Sea Coast 1976 Kidney 4 - 1.6 -2.0/ - 0.22 ± 0.05 t 0.19 - 0.29 (1977)
198 Harbour Seal German North 1974- Liver 4 6-8 / - 0.135 ± 0.015t 0.05 - 0.02 Drescher et al.(Phoca vitulina) Sea Coast 1976 Kidney 3 6-8 / - 0.31 ± 0.07 t 0.26 - 0.38 (1977)
200 l1arbour Seal lJadden Sea. liver fetus / - <0.24 Duinker et al.(Phoca vitulina) Netherlands (1979)
201 Ha rbour Sea1(Phoca vitulina)
Okhotsk Sea 1975 liver +MuscleBlubber
FFF
588
/ 1.57/ 1.47/ 1.47
0.48 ± 0.170.10 ± 0.010.19
Hamana ka et a1.(1977)

Table 9. Continued
Index Year No. of Mean Cd pg/gNo.· Species Location Taken Tissue Anima 1s Sex Age / length mean :t S.D. Range Source
(yrs) (m)
202 Harbour Seal Okhotsk Sea 1975 Musc1e+ M pup / 0.98 0.18 Hamanaka et a1.(Phoca vituZina) (1977)
203 Harbour Seal East Scotland Liver 4 1.3 ± 0.291- 1.1 1.7 Holden(Phoca vituZina) (1975)
204 Ha rbour Sea1 Scroby, Liver 2 1.0 Holden(Phoca vituZina) E. England (1975)
205 Harbour Seal Wash, Liver 3 1.2 ± 0.3 t 0.9 1.4 Holden(Phoca vituZina) E. England (1975)
212 Harbour Seal l/adden Sea, Liver 8 0.03 - 0.21 Duinker et a1.(Phoca vituZina) Netherlands Kidney 2 0.15 - 0.17 (1979)
Blubber 3 <0.01 0.02U1- 0
241 Fur Seal Washington Coast, 1971 Liver M fetus / - 0.5 Anas(CaZZorhinu8 ur8inu8) W. USA Kidney M fetus / - 0.1 (1974b)
242 Fur Seal Washington Coast, 1971 Liver M / 0.6 Anas(CaZlorhinu8 ursinus) W. USA Kidney M / - 1.7 (1974b)
243 Fur Seal Washington Coast, 1971 Liver 8 F 10 / - 2.66 ± 2.12 0.9 - 4.6 Anas(CalZorhinus ur8inu8) W. USA Kidney 8 F 10 / - 6.33 ± 4.89 0.2 - 15.6 (l974b)
244 Ribbon Seal Okhotsk Sea 1975 Liver + 1 M 3-5 / - 3.05 ± 0.25 Hamanaka et a1.(Histriophoca fasciata) Muscle 9 M 2-9 / 1.4-1.6 0.19 ± 0.06 0.11 - 0.31 (1977)
B1 ubber 1 M 0.14
245 Ribbon Seal Okhotsk Sea 1975 Liver + 1 F 3 / 1.4 2.07 ± 0.83 Hamanaka et a1.(Hi8triophoca fa8ciata) Muscle 7 F 1-16 / 1.2-1.6 0.15 ± 0.04 0.09 - 0.20 (1977)

Table 9. Continued
No. of Mean I Cd \l9/9Index YearNo.· Species Location Taken Tissue Animals Sex age / length mean ± S.D. Range Source
(yrs) (m)
246 Leopa rd Sea1 Antarctic 1978 Liver + 15 / 5.11 ± 7.37 0.8 - 29 Wagemann(HydPUl'ga ZeptonyxJ Muscle 15 <0.01 (Unpublished)247 Leopard Seal Antarctic 1978 Liver FA adult / 6.7 Wagemann(HydPUl'ga ZeptonyxJ
Muscle+ FA (Unpublished)adult / <0.01
248 Leopard Seal Antarctic 1978 Liver + fetus / <0.1 Wagemann(HydPUl'ga ZeptonyxJ Muscle fetus / <0.01 (Unpublished)249 Weddell Seal Antarctic 1978 Liver + . 1 1.6 Wagemann(Leptonyahotea wedaeZZiJ Muscle 1 <0.01 (Unpublished)
U1......206 A Steller Sea Lion Japan 1977 Liver F 0.7 / 0.24 Hamanaka et a1.(Eumetopiaa jubataJ (Hokkaido) Muscle F 0.05 (1982)Kidney F 1.97
206 B Steller Sea Lion Japan 1976- Liver 7 M&F 1.7 0.58 0.15 - 0.82 Hamanaka et al.(Eumetopiaa jubataJ (Hokkaido) 1977 Muscle 4 M&F 0.07 0.05 - 0.12 (1982)Kidney 8 M&F 2.36 0.77 - 3.1
206 C Steller Sea Lion Japan 1976- Liver 10 M&F 2.7-4.8/ 0.86 0.28 - 1.3 Hamanaka et al.(Eumetopiaa jubataJ (Hokkaido) 1977 Muscle 8 M&F 0.04 0.02 - 0.10 (1982)Kidney 10 M&F 4.82 1.9 7.2
206 0 Steller Sea Lion Japan 1976- Liver 1 M 8.8 / 1.28 Hamanaka et al.(Eumetopiaa jubataJ (Hokkaido) 1977 Muscle 2 M&F 7.7-8.8/ 0.08 0.05 - 0.11 (1982)Kidney 2 M&F 7.7-8.8/ 8.96 7.9 - 10.0
* - Different tissues belong to the same animal or groups of animals which have the same Index No.
+ - Dorsal meat
t - S.D. estimated from the range
.. - Concentrations are age correlated; significant at 1.0%.
A - Gravid

Table 10. Reference concentrations of Se (wet weiqht basis) in different tissues of Pinnipeds.
Index Year No. of Mean Se I-Ig/gflo.* Species Location Taken Tissue Animals Sex AQe (yrs) mean ,_ S.D. Range Source
109 Ringed Seal Bothnian Bay, 1974 Liver 12 35 ± 31.9 t 6.1 - 110 Kari and Kauranen(Phoca hiapida) W. Finland (1978)
110 Ri nged Sea 1 Saimaa, 1974- Liver 3 81 ± 142.4 t 29 - 270 Kari and Kauranen(Phoca hispida) S.E. Finland 1975 (1978)
117 Ringed Seal Somerset Island, 1975 Liver 12 16.35 ± 7.83 Smith and(Phoca hiapida) E. Arctic Canada Armstrong (1978)
118 Ringed Seal Barrow Strait, 1976 Liver 10 10.2 9.44 ± 6.66 Smith and(Phoca hispida) E. Arctic Canada Armstrong (1978)
119 Ri nged Sea 1 N.E.Baffin Island 1976 Liver 8 5.2 4.13 ± 2.67 Smith and(Phoca hispida) E. Arctic Canada Armstrong (1978)
121 Ri nged Sea 1 Victoria Island, 1972- Liver 42 12.8 15.24 ± 7.75 Smith and(Phooa hiapida) IL Arctic Canada Armstrong (1978)
en124 Ringed Seal Holman 1977 Liver 112 8.1 14.96 ± 6.42 Smith and N
(Phoca hiapida) W.Victoria Island Armstrong (1978)W. Arctic Canada
158 Grey Seal Great Britain 1977 Liver 2 M 13.308± 6.65 8.6 - 18 van de Yen et al.(Halichoeru8 grYPu8) (1979)
159 Grey Seal Great Britain 1977 Liver 6 F 7.2 36.08 ± 27.9 18 - 88 van de Yen et al.(Halichoeru8 grYPu8) (1979)
160 Grey Seal Great Britain 1977 Liver 2 68.5 8 ± 20.5 54 - 83 van de Yen et al.(Haliohoeru8 grypu8) (1979)
161 Grey Seal Great Britain 1977 Liver 5 pups 1.808± 0.29 1.4 - 2.1 van de Yen et al.(Halichoeru8 grypu8) (1979)
162 GreLSeal ~Iadden Sea 1974- Liver + MY 6.2 8(Halic eru8 grYPu8) Netherlands 1975 Muscle MY 2.5 8 van de Yen et al.
(1979)

Table 10. Continued
Index Year No. of Mean I Se pg/gUo.* Species Location Taken Tissue Animals Sex Aqe (yrs) mean S.D. Range Source
173 Harbour Seal Wadden Sea 1974- Liver + M 0.3 6 van de Ven et al.2.06{Phoca vituZina} Netherlands 1976 Muscle M n.3 1.0 (1979)
174 Harbour Seal Hadden Sea 1974- Liver + F 0.5 6 van de Ven et al.4.06(Phoca vituZina) Netherlands 1976 Muscle F 0.5 1.9 (1979)
175 Ha rbour Sea1 Wadden Sea 1974- Liver + M 1.3 van de Venetal.(Phoca vituZina) Netherl ands 1976 Muscle M 1.3 (1979)
Kidney M 1.9
176 Harbour Seal Wadden Sea 1974- Liver 2 F 23.0g ± 8.5 17 - 29 van de Ven et al.(Phoca vituZina) ~etherlands 1976 Kidney 1 F 2.1 (1979)
177 Ha rbour Sea1 Netherlands 1974- Liver M 24 226 van de Ven et al.{Phoca vituZina} 1976 (1979) U"1
w
178 Harbour Sea1 Netherlands 1974- Liver + F adult 1306 van de Ven et al.1976 F adult 6 (1979)(Phoca vituZina) Muscle 1.2
6Kidney F adult 7.1
324 A Harbour Seal Schleswig-Holstein 1975- Liver 6-8 - juveniles & 2.6 0 0.8 Reijnders{Phoca vituZina} (Denmark) 1976 Kidney 6-8 sub-adults 0.6 0 1.3 (1980)
324 B Ha rbour Sea1 Wadden Sea 1975- Liver 5-6 - juveniles & 2.8 0.7 - 6.5 Reijnders(Phoca vituZina) fletherl ands 1976 Kidney 5 - sub-adults 1.2 0.6 - 1.6 (1980)
324 C Ha rbour Sea1 Schleswig-Holstein 1975- Liver 5 adult 112 9.2 - 409 Reijnders(Phoca vituZina) (Denmark) 1976 Kidney 4 adult 3.5 1.9 - 7.3 (1980)
324 D Harbour Seal Hadden Sea 1975- Liver 8 adult 109 3.9 - 350 Reijnders(Phoca vituZina) :Ietherlands 1976 Kidney 4 adult 7.1 2.3 - 10.0 (1980)

Table 10. Continued
Index Year No. of Mean Se ~g/g
110.* Species location Taken Tissue Animals Sex Age (yrs) mean c'. S.D. Range Source
236 Bearded Seal Holman liver 6 8.5 34.42 ± 33.23 Smith and(ErignathuB ba~batuB) W.Victoria Island Armstrong
W. Arctic Canada (1978)
237 Bearded Seal Belcher Island, 1974 liver 10 4.9 20.83 ± 13.47 Smith and(E~ignathuB ba~batuB) E. Arctic Canada Armstrong (1978)
246 l eopard Sea1 Antarctic 1978 liver + 15 3.32 ± 0.81 2.57 - 4.92 Wagemann(Hydrurga Zeptonyx) Muscle 15 0.57 ± 0.09 0.44 - 0.71 (Unpublished)
247 leopard Seal Antarctic 1978 liver + FA adult 2.83 Wagemann (.Jl
FA .p.(HydruPga Zeptonyx) Muscle adult 0.60 (Unpublished)
248 leopard Seal Antarctic 1978 li ver + fetus 0.72 Wagemann(Hydrurga Zeptonyx) Muscle fetus 0.43 (Unpublished)
249 Weddell Seal Antarctic 1978 liver + 1.01 Wagemann(LeptonyahoteB weddeZZi) Muscl e 0.30 (Un pub1i shed)
* - Different tissues belong to the same animal or groups of animals which have the same Index No.
+ - Dorsal meat
t _ S.D. estimated from the range
a _ Arithmetic mean of three determinations per sampley Kept in captivity for one year
A - Gravid

Table 11. Reference concentrations of rOOT (wet weight basis) in different tissues of Cetaceans.
Index Year No. of Mean roOT ~g/g
flo.* Species Location Taken Tissue Animals Sex Length/ age mean ! S.D. Range Source(m) (yrs)
51 Pilot Whale Southwest "'1975 Blubber 2 42.7 Holden(Globicephala melaena) England (1975)
52 Pilot Hhale R.I. & Maine, 1971- Blubber 2 M&F /adults 149.2 30.3 - 268 Taruski et a1.(Globicephala melaena) E. USA 1975 (1975)
53 Pilot Whale French Coast "'1979 Blubber 7 94.2 ± 139.6 Alzieu and(Globicephala melaena) (Atlantic and Duguy
Mediterranean) (1979)
90 Pilot Whale Japan 1968- Blubber 6 M&F 3.01 / - 4.7 ± 3.3 0.9 - 8.8 O'Shea et al.(Globicephala melaena) 1976 (1980)
54 Be1uqa \oIha 1e Sha11 ow Bay, 1972 Liver + 7 /adults 0.78 ± 0.23 Addison and(Delphinaptepu8 leucu8) Mackenzie River Muscle 7 /adults 0.91 ± 0.26 Brodie Ul
Del ta Blubber 7 /adults 3.90 ± 0.89 (1973) Ul
55 Bel uga lolha 1e Kugma 11 et Bay, 1972 Blubber 7 /adults 2.56 ± 1.46 Addison and(Delphinaptepu8 leucu8) Mackenzie River Brodie
Del ta (1973)
13A Narwha 1 Pond Inlet 1979 Blubber 9 F 3.79 / - 1.88 ± 2.01 Wagemann et al.(Monodon monocer08) Baffin Island, (1983)
Arctic Canada
13 B Narwha 1 Pond Inlet 1979 Blubber 11 M 3.92 / 4.84 ± 2.13 Wagemann et al.(Monodon monocer08) Baffin Island, (1983)
Arctic Canada
14 Minke Whale Umanak, 1972 Blubber 6 1.4 ± 0.94 t 0.21 - 2.6 Johansen et al.(Bal-aenop tera W. Greenland (1980)
acutOl'08trata)
56 Minke, Fin, and St. Lawrence 1979 Blubber 3 10.6 ± 14.91 SergeantWhite Whales River, (1980)
(B. acutoro8trata, E. CanadaB. physalus)

Table 11. Continued
Index Year No. of Mean I LOOT \1g/gflo. * Species Location Taken Tissue Animals Sex Lenqthl age mean :!: S.D. Range Source
(m) (yrs)
57 Fin Hha 1e S. E. Greenland 1975 Blubber 3 2.83 Holden(BaZaenopte~a phyBaZuB) (1975)
58 Fin Hhale N. Atlantic 1967- Blubber 5 26.4 ± 4.5 22.3 - 32.3 Addison et a1.(BaZaenopte~a phYBaluB) 1970 (oil ) (1972)
58 A Fin Hhale France,Brittany 1976 Blubber 2 M&F 14.3 1 - 14.8 Alzieu and(BaZaenopte~a phyBalus) and Mediterranean Duguy
Coast (1979)
59 Fin Hha le Nova Scotia, 1970- Blubber 9 M - ladult 1. 38 ± 0.43 0.67 - 2.09 Saschenbrecker(BaZaenopte~a phyBaZuB) Canada, 1971 (1973)
NW Atlantic
60 Fin Whale Nova Scotia, 1970- Blubber 3 M - ladult 2.05 ± 0.45 1.78 - 2.58 Saschenbrecker(BaZaenopte~a phyBaluB) Canada, 1971 (1973)
NW AtlanticUl
61 Humpback Whale Nova Scotia, 1971- Blubber 2 M&F - ladult 15.4 7.6 - 23.1 Taruski et al. O't
(Megapte~a novaeangZiae) Canada; 1975 (1975)New Jersey, USA,NW Atlantic
63 Humpback Whale Antigua, 1971- Blubber 2 M - Ijuvenile 1. 75 1.4 - 2.1 Taruski et a1.(Megapte~a novaeangZiae) St. Kitts 1975 (1975)
West Indies
62 Dense-beaked Whale New Jersey and 1971- Blubber 2 M /juvenile 51. 7 38.2 - 65.1 Taruski et al.(MeBopZodon denBi~oBt~B) North Carol ina 1975 and adult (1977)
USA, NW Atlantic
64 Sperm Whale Anegada Passage, 1971- Blubber 2 M&F - ladults 8.4 1.1 15.5 Taruski et al.(Physete~ catodon) West Indies 1975 (1975)
65 Sperm Whale Antarctic 1962- Blubber 3 21.2 0.07 - 34.98 Addison et a1.(PhYBete~ catodon) 1966 (oil ) (1972)
66 Sperm Whale California 1968 Liver 6 0.34 0.28 - 0.49 Wolman and(PhyBete p catodon) Blubber 6 M&F 11. 71 1 5.8 ± 2.5 1.82 - 9.43 Wil son (1970)

Table 11. Continued
Index Year No. of Mean l:DOT IIg/g110.* Species Location Taken Tissue Animals Sex Len)th/ age mean ! S.D. Range Source
(m (yrs)
67 Gray Whale Near San Francisco 1968- Liver 23 M&F 11.91 / - 0.01 Wolman and(Balaenoptera musculus) CalHornia 1969 Blubber 23 M&F 11.91 / - 0.071 ± 0.174 Wilson
SW USA (1970)
94 Pygmy Killer Whale Florida 1975 Blubber 2 M 1.97 / - 25.0 23.1 - 26.9 Forrester et a1.(Pereea attenuata) (1980)
23 Harbour Porpoise Baltic Sea 1976 Liver 2 1.09 0.37 - 1.8 Huschenbeth(Phocoena phocoena) Blubber 2 37.6 29.3 - 45.9 (1977)
68 Harbour Porpoise E. Scotland 1965- Blubber 3 /adults 42.8 ± 10.3 t 27.9 - 45.3 Holden and(Phocoena phocoena) 1967 Marsden (1967)
69 Harbour Porpoise E. Scotland 1968 Blubber 2 /adu1ts 12.4 Holden(Phocoena phocoena) (1975)
70 Harbour Porpoise E. Scotland 1970 Blubber 3 37.4 Holden(Phocoena phocoena) (1975) U1
""-J
71 Harbour Porpoise E. Scotland 1971 Blubber 4 18.4 Holden(Phocoena phocoena) (1975)
72 Harbour Porpoise New Brunswick & 1969- Liver 3 M /adults 2.69 ± 0.80 1.97 - 3.32 Gaskin et a1.(Phocoena phocoena) Nova Scotia 1970 Blubber 12 M /adu1ts 306.7 ± 113.3 t 150.8 - 520.0 (1971 )
Bay of Fundy.E. Canada
73 Harbour Porpoise New Brunswi ck & 1969- Liver 8 F /adu1ts 1.36 ± 1.03 t 0.61 - 3.57 Gaskin et a1.(Phocoena phocoena) Nova Scotia 1970 Blubber 15 F /adults 214.27 ± 96.9 t 111 .6 - 447.9 (1971 )
E. Canada
74 Harbour Porpoise New Brunswick & 1969- Liver 2 F /adu1ts 0.43 ± 0.04 0.46 0.50 Gaskin et a1.(Phocoena phocoena) Nova Scotia 1970 Blubber 6 F /adu1ts 69.0 ± 32.4t 40.0 122.0 (1971 ).75 Harbour Porpoise W. Greenland 1972 Blubber 2 0.29 ±(Phocoena phocoena) 0.18 Clausen et a1.
(1974)76 Harbour Porpoise North Sea 1972 Blubber 7 41. 2 33.6 t(Phocoena phocoena) ± 11. 1 - 102 Koeman et a1.
(1972)

Table 11. Continued
Index Year No. of Mean I LODT \Ig/gIto.· Species Location Taken Tissue Animals Sex Lenrhl age mean .. S.D. Range Source
(m (yrs )----------
93 A Harbour Porpoise Bay of Fundy 1975- Liver _0 M 0.79 0.21 - 2.03 Gaskin(Phocoena phocoena) 1977 Kidney M 0.22 0.12 - 0.47 (1982)
Muscle M 0.52 0.11 - 1.47Blubber M 103.42 22.83 - 227.00
93 B Harbour Porpoise Bay of Fundy 1975- Liver _0 F 0.21 0.10 - 0.30 Gaskin(Phocoena phocoena) 1977 Kidney F 0.13 0.12 - 0.15 (1982)
Muscle F 0.38 0.08 - 1.53Blubber F 39.35 21.48 - 55.69
95 Harbour Porpoise Danish Coast 1972- Liver 4 M&F 1 1~3 0.55 0.04 - 1.1 Anderson &
(Phocoena phocoena) 1973 Blubber 4 M&F 1 1~3 18 3.9 - 27 Rebsdorff(1976)
77 Common Dolphin North Sea (3) '\..1972 Blubber 4 85 ± 84 4.27 - 177 Koeman et al.(Delphinus delphia) & New Zealand (1) (1972)
Dusky Dolphin U10::>
(Lagenophynchua obscuPUa)
78 Common Dolphin French Coast '\..1979 Liver + 17 10.9 Alzieu and(Delphinus delphia) (Atlantic & Muscle 25 5.6 Duguy
Mediterranean) Kidney 18 6.4 (1979)Blubber 12 73.5 ± 64.2
87 Common Dolphin CalHornia 1968- Muscle 13 M&F 2.06 1 - 13.0 ± 9.1 4.6 - 39.9 O'Shea et al.(Delphinus delphia) 1976 Blubber 13 M&F 2.06 1 - 926.8 ± 416.4 405 -1767 (1980)
79 Blue-White Dolphin T French Coast '\..1979 Liver + 24 109.8 A1zieu and(Stenella caepuleoalba) (Atlantic & Muscle 10 13.3 Duguy
Mediterranean) Kidney 26 28.1 (1979)Blubber 8 344.2 ± 302.9
80 Risso's Dolphin French Coast 1979 Liver + 4 21.4 A1zieu and(Globicephala gPiseua) (Atlantic & Muscle 3 4.2 DU9uy
Mediterranean) Kidney 4 24.2 (1979)Blubber 3 70.0 ± 33.6

Table 11. Continued
Index Year No. of Mean I LOOT \Ig/g110.* Species Locat i on Taken Tissue Animals Sex Len)th/ age mean . S.D. Range Source
(m (yrs)
81 Striped Dolphin T Maryland and 1971- Blubber 2 M&F - /adults 150.9 70.7 - 231.0 Taruski et al .(Stenella aaeruleoalbaJ Rhode Island, 1975 (1975)
E. USA
86 Striped Dolphin T E. Tropical 1968- Muscle 13 M&F 1. 77/ - 0.4 ± 0.5 <0.01 - 1.65 O'Shea et al.(Stenella aaeruleoalbaJ Pacific 1976 Blubber 14 M&F 1.77/ - 41. 9 ± 58.0 0.62 - 166.4 (1980)
89 Striped Dolphin T Japan 1968- Muscle 5 M&F 2.22/ - 0.6 ± 0.7 <0.01 - 1.8 O'Shea et al.(Stenella aaeruleoalbaJ 1976 Blubber 5 M&F 2.22/ - 10.0 ± 5.4 <2.0 - 17.1 (1980)
82 Corrmon Dolphin Rhode Island, 1971- Blubber 2 M&F - /adults 55.8 40.7 - 70.9 Taruski et al.&Atlantic White- E. USA and 1975 (1975) U1
Sided Dolphin Nova Scotia, co
(Delphinus delphis and E. CanadaLagenorhynahus aautusJ
83 Gray Dolphin St. Lucia, 1972 liver + 5 M&F 4.3 / - 0.04 ± 0.04 0.01 - 0.10 Gaskin et al.(Globiaephala maarorhynahaJ Lesser Antilles Muscle 5 M&F 4.3 / - 0.19 ± 0.24 0.01 - 0.59 (1974)
Kidney 4 M&F 4.3 / - 0.21 ± 0.15 0.04 - 0.39Blubber 5 M&F 4.3 / - 1.62 ± 0.42 1.25 - 2.28
84 Long-snouted Dolphin S1. Lucia, 1972 Liver + 2 M&F 1.8 / - 0.10 0.06 - 0.134 Gaskin et a1.(Stenella longirostrisJ Lesser Antilles Muscle 2 M&F 1.8 / 0.05 0.04 - 0.064 (1974)
Kidney 2 M&F 1.8 / 0.10 0.065- 0.145Blubber 2 M&F 1.8 / - 4.41 1.44 - 7.38
85 Bottlenose Dolphin California 1968- Muscle 2 F 2.33/ - 2215 1746 -2684 O'Shea et al.(Tursiops trunaatusJ 1976 Blubber 2 F 2.33/ - 35.8 18.7 - 52.8 (1980)

Table 11. Continued
Index Year No. of Mean I LOOT llg/gtjo. * Species Location Taken Tissue Animals Sex Length/ age mean • S.D. Range Source
(m) (yrs)._--~- ---
88 Rouqh-toothed Hawaii 1968- Muscle 7 M&F 2.17 / 0.1 ± 0.1 <0.01 - 0.3 O'Shea et al. m- 0Dolphin 1976 Blubber 7 M&F 2.17 / - 8.9 ± 9.9 <0.01 - 27.1 (1980)
(Steno bredanenBiB)
91 Finless Porpoise Japan 1968- Muscle 5 M&F 1.53 / - 0.3 ± 0.2 <0.01 - 0.7 O'Shea et al.(Neophoaaena phoaoenoideB) 1976 Blubber 6 M&F 1.47 / - 66.0 ± 46.8 8.6 - 107 (1980)
* - Different tissues belong to the same animal or groups of animals which contain the same Index No.
+ - Dorsal meat
of - S.D. estimated from the range
® - No. of animals not given. See Gaskin et al. (1983). Index No. 92A and B.
'" - Approximate sampling date or several years previously.
T - Blue-White and Striped Dolphins are used interchangeably, depending on the name used in the original literature.

Table 12. Reference concentrations of PCB's (wet weight basis) in different tissues of Cetaceans.
Index Year No. of Mean I PCB lIg/gflo.* Species location Taken Tissue Animals Sex lengthl age mean S.D. Range Source
(m)
51 Pilot Whale Southwest "'1975 Blubber 2 98 Holden(Globicephala melaena) England (1975)
52 Pilot Whale R.1. & Maine 1971- Blubber 2 M&F - ladults 78 42 - 114 Taruski et a1.(Globicephala melaena) E. USA 1975 (1975)
53 Pilot Hha1e France, Atlantic "'1979 Blubber 7 189.0 ± 298.0 A1zieu and(Globicephala melaena) & Mediterranean Duguy
(1979)
90 Pilot Whale Japan 1968- Muscle 6 M&F 3.011 - 8.03 ± 12.0 0.4 - 32 O'Shea et a1.(Globicephala melaena) 1976 (1980)
O"l......54 Be1uga Wha 1e Shallow Bay 1972 liver + 7 - /adults <0.5 Addison et a1.(Delphinapterus leucas) Mackenzie River Muscle 7 - /adu1ts <0.5 (1973)
Delta, Blubber 7 - ladu1ts <0.5W. Arctic Canada
55 Beluga Whale Kugma1it Bay 1972 Blubber 7 - ladults <0.5 Addison et a1.(Delphinapterus leucas) Mackenzie River (1973)
Delta,W. Arctic Canada
13 A Narwha 1 Pond Inlet 1979 Blubber 9 F 3.8 1 - 6.73 ± 2.22 l~agemann et a1.(Monodon monocepos) Baffin Island, (1983)
E. Arctic Canada
13 B Narwhal Pond Inlet 1979 Blubber 11 M .3.9 1 - 12.85 ± 6.88 Wagemann et a1.(Monodon monocepos) Baffin Island, (1983)
E. Arctic Canada

Table 12. Continued
Index Year No. of Mean I PCB \Jg/gtjo.* Species Location Taken Tissue Animals Sex Lenrhl age mean + S.D. Rdnge Source
(m
14 Minke Whale Umanak, 1972 Blubber 6 0.61 ± 0.379 0.14 - 1.1 Johansen et a1.(Balaenoptera aeutOrDstrataJ W. Greenland (1980)
56 Minke, Fin, and St. Lawrence 1979 Blubber 3 71.6 ± 91.72 SergeantWhite Whales River, (1980)
(B. aautoroet raba , E. CanadaB. physalusJ
57 Fin Wha le S.E. Greenland 1975 Blubber 6 3.6 Holden(Balaenoptera physalusJ (1975)
58 Fin Whale N. Atlantic 1967- Blubber 5 4.1 ± 3.3 <0.01 - 7.0 Addison et a1.(Balaenoptera physalusJ 1970 (oil) (1972)
58 A Fin Whale France, Brittany 1976 Blubber 2 M&F 14.3 I - 4.96 Alzieu and O'l
(Balaenoptera physalusJ & Mediterranean Duguy N
Coasts (1979)
59 Fin Hhale Nova Scotia 1970- Blubber 9 F ladult 0.04 ± 0.04 0.01 - 0.05 Saschenbrecker(Balaenoptera physalusJ E. Canada, & 1971 (1973)
N.W. Atlantic
60 Fin Whale Nova Scotia 1970. Blubber 3 M ladu1t 0.09 ± 0.08 0.04 - 0.19 Saschenbrecker(Balaenoptera physalusJ E. Canada, & (1973)
N.W. Atlantic
61 Humpback Whale Nova Scotia, 1971- Blubber 2 M&F ladult 5.7 5.4 - 6.0 Taruski et al.(Megaptera novaeangliaeJ Canada & 1975 (1975)
New Jersey, USAN.W. Atlantic
63 Humpback Whale Antigua, 1971- Blubber 2 M Ijuvenile 1.4 1.3 - 1.5 Taruski et al.(Megaptera novaeangliaeJ St. Kitts 1975 s adult (1975)
West Indies
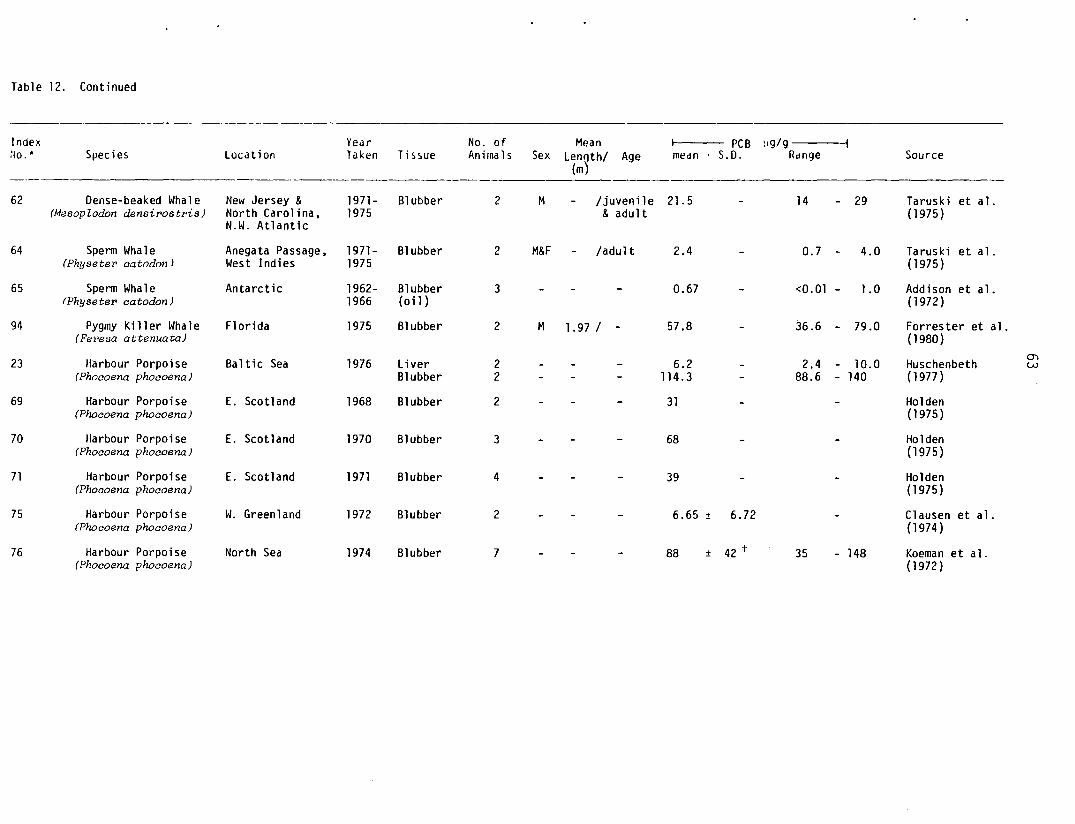
Table 12. Continued
Index Year No. of Mean PCB 1'9/9~jo. • Species Location Taken Tissue Anima 1s Sex Lenuth/ Age medn S.D. Range Source
(m)-------------
62 Dense-beaked Whale New Jersey & 1971- Blubber 2 M /juvenile 21. 5 14 - 29 Taruski et a1.(Mesoplodon densipostris) North Carolina, 1975 & adult (1975)
N.W. Atlantic
64 Spenn Whale Anegata Passage. 1971- Blubber 2 M&F /adult 2.4 0.7 - 4.0 Ta rusk i et al.(Physetep aatndnnJ West Indies 1975 (1975)
65 Spenn Whale Antarcti c 1962- Blubber 3 0.67 <0.01 - 1.0 Addison et al.(Physetep aatodon) 1966 (oil) (1972)
94 Pygmy Killer Whale Florida 1975 Blubber 2 M 1.97 / - 57.8 36.6 - 79.0 Forrester et a1.(Eereea attenuata) (1980)
23 Harbour Porpoise Baltic Sea 1976 Liver 2 6.2 2.4 10.0 Huschenbeth0)
- w(Phoaoena phoaoena) Blubber 2 114.3 88.6 - 140 (1977)
69 Harbour Porpoise E. Scotland 1968 Blubber 2 31 Holden(Phoaoena phoaoena) (1975)
70 Harbour Porpoise E. Scotland 1970 Blubber 3 68 Holden(Phoaoena phoaoena) (1975)
71 Harbour Porpoise E. Scotland 1971 Blubber 4 39 Holden(Phoaoena phoaoena) (1975)
75 Harbour Porpoise W. Greenland 1972 Blubber 2 6.65 ± 6.72 Clausen et a1.(Phoaoena phoaoena) (1974)
76 Harbour Porpoise North Sea 1974 Blubber 7 88 ± 42 t 35 - 148 Koeman et a1.(Phoaoena phoaoena) (1972)

Table 12. Continued
------
Index Year No. of Mean PCB \Jg/gtlo. • Species Location Taken Tissue Animals Sex Length/ Age mean . S.D. Range Source
(m)
92 A Harbour Porpoise gay of Fundy 1971- Liver 45 M 1.39/ 3.96 1.20 ± 0.73 Gaskin et a1.(Phoaoena phoaoena) 1977 Kidney 33 M 1.36/ 4.08 0.63 ± 0.44 (1983)
Muscle 61 M 1.35/ 3. 96 1.02 ± 0.69Blubber 62 M 1. 35/ 3.96 78.7 ± 58.6
92 B Harbour Porpoi se Bay of Fundy 1971- Liver 21 F 1.33/ 2.73 0.66 ± 0.41 Gaskin et al.(Phoaoena phoaoena) 1977 Kidney 18 F 1.29/ 2.35 0.39 ± 0.30 (1983)
Muscle 39 F 1.33/2.73 0.73 ± 0.67Blubber 40 F 1.33/ 2.73 46.6 ± 27.0
95 Harbour Porpoise Danish Coast 1972- Liver 4 M&F / 1-3 5.4 0.7 - 11 Andersen &(Phocoena phocoena) 1973 Blubber 4 M&F / 1-3 78 28 - 125 Rebsdorff
O"l(1976) +::>
91 Finless Porpoise Japan 1968- Muscle 5 M&F 1.53/ 0.81 ± 0.33 0.43 - 1.1 O'Shea et al.(Neophoaoena phocoenoidea) 1976 Blubber 6 M&F 1.47/ 65 ± 28 18 - 96 (1980)
77 Common Dolphin North Sea (3) '\.1972 Blubber 4 <0.75 ± <0.48 Koeman et a1.(Delphinus delphia) and (1972)
Dusky Dolphin New Zealand (1)(Lagenorhynahua obacurua)
78 Common Dolphin French Coast 1979 Liver + 17 28.2 ± 66.7 Alzieu and(Delphinus delphia) (Atlantic & Muscle 25 10.6 ± 15.5 Duguy
Med i terranean) Kidney 18 13.5 ± 15.9 (1979)Blubber 12 122.9 ± 91.1
87 Common Dolphin California 1968- Muscle 13 M&F 2.06/ 1.24 ± 0.94 <0.01 - 3.3 O'Shea et a1.(Delphinus delphia) 1976 Blubber 13 M&F 2.06/ 130.0 ± 59.2 80 - 300 (1980)

Table 12. Continued
Index Year No. of Mean i PCB 119/gflo. • Species Locatiull Taken Tissue Animals Sex Lengthl Age mean S.D. Range Source
(m)
79 Blue-White Dolphin T French Coast 1979 Liver + 24 101.8 ± 136.9 Alzieu and{Stenella caeruleoalba} (Atlantic & Muscle 10 12.3 ± 1'9.1 Duguy
Mediterranean) Kidney 26 36.2 ± 36.9 (1979)Blubber 8 266.9 ± 250.7
80 Risso's Dolphin French Coast 1979 Liver + 4 49.0 ± 51.0 Alzieu and{Globicephala gPiseus} (Atlantic & Muscle 3 3.9 ± 2.2 Duguy
Mediterranean) Kidney 4 35.8 ± 53.0 (1979)Blubber 3 68.1 ± 23.1
m Striped Dolphin T Maryland & R.I., '\,1971· Blubber 2 M&F ladults 54 39 - 69 Taruski et al.{Stenella caeruleoalba} E. USA 1975 (1975) O'l
U1
86 Striped Dolphin T E. Tropical 1968- Muscle 13 M&F 1.77 1 - <0.01 O'Shea et a1.{Stenella caeruleoalba} Pacific 1976 Blubber 14 M&F 1.77 1 - 4.0 ± 4.0 <0.01 - 5.2 (1980)
89 Striped Dolphin T Japan 1968- Muscle 5 M&F 2.22 1 - 0.62 ± 0.67 <0.01 - 0.85 O'Shea et al.{Stenella caeruleoalba} 1976 Blubber 5 M&F 2.22 1 - 3.36 ± 1. 75 1.2 - 5.0 (1980)
82 Corrrnon Dolphin & Rhode Island, '\,1971- Blubber 2 M&F ladults 53 37 - 69 Taruski et al.Atlantic I-Jhite- E. USA; 1975 (1975)Sided Dolphin Nova Scotia,
{Delphinus delphis and E. CanadaLagenorhynchus acutus}
83 Gray Dolphin St. Lucia 1972 Liver + 5 M&F 4.3 1 - 0.31 ± 0.34 0.07 - 0.85 Gaskin et al.(Globioepha La Lesser Antilles Muscle 5 M&F 4.3 1 - 0.20 ± 0.21 0.05 - 0.54 (1974)
m:wrophyncha } Kidney 4 M&F 4.3 1 - 0.19 ± 0.11 0.06 - 0.33Blubber 5 M&F 4.3 1 - 1.13 ± 0.40 0.69 - 1.60

Table 12. Continued
Index Year No. of Mean I PCB lJg/gflo. * Species Location Taken Tissue Animals Sex Length/ Age mean . S.D. Range Source
(m)
84 Long-snouted St. Lucia, 1972 Liver + 2 M&F 1,8 / - D.20 0.15 - 0.24 Gaskin et a1.Dolphin Lesser Antill es Muscle 2 M&F 1.8 / - 0.07 0.03 - 0.10 (1974)
(SteneZZa Zongirostris) Kidney 2 M&F 1.8 / - 0.22 0.17 - 0.26 0"\0"\
Blubber 2 M&F 1.8 / - 3.50 2.00 - 5.00
85 Bottlenose Dolphin California 1968- Muscle 2 F 2.33 / - 435 420 - 450 O'Shea et a1.(Ture iope trwlCatus) 1976 Blubber 2 F 2.33 / - 10.3 5 15 (1980)
88 Rough-toothed Hawaii 1968- Muscle 7 M&F 2.17 / - 0.19 ± 0.20 <0.01 - 0.45 O'Shea et al.Dolphin 1976 Blubber 7 M&F 2.17 / - 13.17 ± 14.15 <0.01 - 38 (1980)
(Steno bredanensis)
* - Different tissues belong to the same animal or groups of animals which have the same Index No.
+ - Dorsal meat
t - Standard deviation calculated from the range
~ - Approximate sampling date or several years previously.
T - Blue-White and Striped Dolphins are used interchangeably, depending on the name used in the original literature.

Table 13. Reference concentrations of [DDT (wet weiqht basis) in different tissues of Pinnipeds.
Index Year No. of Mean I EDDT I1g/gIlo.* Species Location Taken Tissue Animals Sex Length/ Age mean , S.D. Range Source
(m) (yrs)
106 Ringed Seal Upernavik, 1974- Blubber 57 1.02 1 0.97 Johansen et al.(Phoca hispidaJ W. Greenland 1976 (1980)
107 Ringed Seal Daneborg, 1974 Blubber 7 3.1 1 2.1 t Johansen et al.(Phoca hispidaJ W. Greenland (1980)
250 Ringed Seal Gulf of Bothnia, 196B Blubber 2 63 58 - 6B Jensen et a1.(Phoca hispidaJ W. Finland (1969)
251 Ringed Seal Bothnian Bay, 1973 Blubber 40 F /adults 110 1 63 Helle et al.(Phoca hispidaJ W. Finland (1976a) O"l
'-J
252 Ri nqed Seal Gulf of Bothnia, 1973 Blubber 33 /adults 200 1 161 Helle et al.(Phoca hispidaJ H. Finland (1976a)
253 Ringed Seal Simo,Bothnian Bay, 1975 Blubber 37 FB /adults 115 1 76 Helle et al.(Phoca hispidaJ W. Finland (1976b)
254 Rinlled Seal Simo,Bothnian Bay, 1975 Blubber 24 FA /adults 88 ± 47.5 Helle et al.(Phoca hispidaJ W. Finland (1976b)
255 Ringed Seal Simo,Bothnian Bay, 1975 Blubber 24 M /adults 130 ± 88 Helle et al.(Phoca hispidaJ W. Finland (1976b)
256 Ringed Seal Sacks Harbour 1972 Liver + 3 M&F 0.0221 0.013 Bowes and(Phoca hispidaJ Hudson Bay, Muscle 3 M&F 0.0161 0.009 Jonkel
N. Canada Blubber 5 M&F 1.5381 0.876 (1975)
257 Ringed Seal Lancaster Sound, '\.1972 Liver 3 F 0.078± 0.089 Bowes and(Phoca hispidaJ Canadian Arctic Blubber 2 M&F 0.367± 0.266 Jonkel
(1975)

Table 13. Continued
Index Year No. of Mean I mOT ~g/g
r~o. • Species Location Taken Tissue Anima1s Sex Len}th/ Age mean ! S.D. Range Source(m (yrs)
258 Ringed Seal ~1. Greenland 1972 Blubber 5 0.15 ± 0.10 Clausen et al.(Phoca hispida) (1974)
260 Ringed Seal Arctic Canada "'1970 Blubber 3 /adults 2.7 ± 1.5t 1.3 - 3.9 Holden(Phoca hispida) (1972)
261 Ringed Seal Arctic Norway "'1970 Muscle+ 2 /adults 2.44 1.8 - 2.9 Holden(Phoca hi.ep ida ) (1972)
262 Ringed Seal Victoria Island, 1972 Blubber 13 F / 10.9 0.61 ± 0.27 0.17 - 1.08 Addison and(Phoca hiep i da) W. Arctic Canada Smith
(1974)
263 Ringed Seal Victoria Island, 1970- Blubber 15 M / 14.5 1. 31 ± 0.31 0.39 - 1.45 Addison and(J)
OJ(Phoca hi.epi da ) W. Arctic Canada 1972 Smith(1974)
264 Grey Seal Archipelago of 1968 Blubber 3 36 35 - 36 Jensen et a1.(Halichoerus grypus) Stockholm (1969)
265 Grey Seal Gulf of 1968 Blubber 2 /pups 25 24 - 26 Jensen et a1.(Halichoerus grypus) Finland (1969)
266 Grey Seal Wales, "'1970 Blubber 3 /adults 17.5 ± 3.9 t 14.3 - 20.9 Holden(Halichoerus grypus) W. England (1972)
267 Grey Seal Cornwall. "'1970 Blubber 3 /pups 11. 1 ± 5.7 t 5.2 - 14.8 Holden(Halichoerus grypus) S. England (1972)
268 Grey Seal Orkney, "'1970 Blubber 8 /adults 13.0 ± 7.7 t 2.9 - 24.9 Holden(Halichoerus grypus) N. Scotland (1972)

Table 13. Continued
Index Year No. of Mean J LOOT I-Ig/gtlo.* Species Location Taken Tissue Animals Sex Len1th/ Age mean ± S.D. Range Source
(m (yrs)
269 Grey Seal Hebrides, "'1970 Blubber 3 adults 15.1 ± 7.8t 10.0 - 23.2 Holden(Ha 1i.ohoerue gr>YPUB) W. Scotland (1972)
270 Grey Seal Summer Island, "'1970 Blubber 4 adults 9.8 ± 6.8t 4.1 18.1 Holden(HalichoeI'UB gr>ypus) W. Scotland (1972)
271 Grey Seal Aberdeen-Montrose,"'1970 Blubber 16 adults 20.1 ± 7.9t 8.5 - 36.3 Holden(Hal.ichoerue gr>YPUB) E. Scotland (1972)
272 Grey Seal Farne Islands, "'1970 Blubber 5 pups 13.1 ± 5.5t 6.4 - 19.1 Holden(HalichoeI'UB gr>YPUB) N.E. England (1972)
273 Grey Seal Scroby "'1970 Blubber 2 adults 39.7 26.1 52.1 Holden(HalichoeI'UB gr>YPUB) E. England (1972) (J")
I.D
274 Grey Seal Sable Island, "'1970 Blubber 5 adults 45.4 ± 30.3 14.9 - 85.3 Holden(HalichoeI'UB gr>YPUB) Nova Scotia (1972)
E. Canada
275 Grey Seal Basque, Gulf of Blubber 2 adults 49.9 ± 24.4 36.1 - 63.6 Holden(HalichoeI'UB gr>YPUB) St. Lawrence, (1972)
E. Canada
276 Grey Seal Outer Hebrides, 1972 Blubber 6 adults 7.40 ± 4.07 Heppleston(HalichoeI'UB gr>YPUB) N. Scotland (1973)
277 Grey Seal Shetland, 1972 Blubber 8 adults 8.90 ± 5.08 Heppleston(HalichoeI'UB grypus) N. Scotland (1973)
273 Grey Seal Farne Islands, 1972 Blubber 7 adults 10.71 ± 3.21 Heppleston(HalichoeI'Us gr>ypus) ~.E. En!)land (1973)

Table 13. Continued
Index Year No. of Mean I l: DDT vs/sUo.* Species Location Taken Tissue Animals Sex Length/ Al:je mean S.D. Range Source
(m) (yrs)
279 Grey Seal E. Angl ia, 1972 Blubber 4 /adults 15.53 ± 8.31 Heppleston(Halichoerus grypus) E. England (1973)
280 Grey Seal Gulf of Bothnia 1973 Blubber 15 /adults 210 ± 108.4t Olsson et al.(Halichoerus grypus) W. Finland (1975)
281 Grey Seal Baltic Sea 1973 Blubber 18 /adults 420 ± 225 01 sson et al.(Halichoerus grypus) (1975)
282 Grey Seal Sable Island, 1974- Blubber 11 /pups 15.45 ± 5.94 Addison and(Halichoerus grypus) Nova Scotia, 1976 Brodie
E. Canada (1977)
283 Grey Seal Sable Island 1974- Blubber 11 F / adults 27.1 ± 15.2 Addison and(Halichoerus grypus) Nova Scotia, 1976 Brodie
E. Canada (1977) '-.J0
284 Grey Seal E. Anqlia, '\.1975 Liver + .3 2.08 ± 0.51 1.49 - 2.40 Holden(Halichoerus grypus) E. England Muscle 3 0.42 ± 0.21 0.25 - 0.66 (1978a)
Kidney 3 0.66 ± 0.13 0.53 - 0.78Blubber 3 18.5 ± 7.0 13.8 - 26.6
285 Grey Seal Orkney, '\.1978 Blubber 7 8.3 Holden(Halichoerus grypus) N. Scotland (1978a)
286 Grey Seal Shetland, '\.1978 Blubber 8 8.4 Holden(Halichoerus grypus) W. Scotland (1978a)
286 A Grey Seal Farne Islands, 1975 Blubber 26 M / 3-27 8.97 3.48 - 16.88 Holden(Halichoerus grypus) N.E. England Blubber 33 F / 1-36 4.26 2.04 - 11.84 (l978b)
323 Grey Seal Farne Islands, 1972 Blubber 8 M 1.88 /12.9 26.8 ± 6.3 16.9 - 33.6 Donkin et al.(Halichoerus grypus) N.E. England Blubber 9 F 1.82 /19.4 10.1 ± 4.2 4.3 - 19.3 (1981)

Table 13. Continued
Index Year No. of Mean roor 1-19/9flo. * Species Location Taken Tissue Animals Sex Length/ Age mean ! S.D. Range Source
(m) (yrs)
165 Harbour Seal Booth Bay Harbour 1971 Liver + 3 M / adults 1.42 ± 0.63 t 0.87 1. 93 Gaskin et al.(Phoca vituZina) Gulf of Maine, Muscle 2 M / adults 0.17 ± o.Of 0.12 0.22 (1973)
E. USA Blubber 3 M / adults 84.9 ± 60.4 37.0 - 139.2
166 Harbour Sea1 Booth Bay Harbour 1971 Liver + 3 F / adults 0.37 ± 0.33 t 0.09 - 0.65 Gaskin et al.(Phoca vituZina) Gulf of Maine, Muscle 3 F / adults 0.08 ± 0.04 t 0.04 - 0.11 (1973)
E. USA· Blubber 3 F / adults 45.91 ± 23.80 t 25.26 - 65.54
168 Harbour Seal Grand Manan and 1971 Liver + 4 t1 / adults 0.68 ± 0.82 t 0.35 - 2.26 Gaskin et al.(Phoca vituZina) Deer Island Muscle 4 M / adults 0.91 ± 1.09 t 0.22 - 2.77 (1973)
New Brunswick, Blubber 3 M / adults 38.41 ± 13.6 29.13 - 52.10E. Canada
180 Harbour Seal Columbia River 1971 Blubber 3 / 2-4 72.7 27.7 - 109.9 Anas(Phoca vituZina) Oregon, USA (1974a) ......,
183 Harbour Seal Puget Sound 1971 Blubber 2 / 1039.7 £ 459.4 -1620 Anas.......
(Phoca vituZina) Washington, (1974a)W. USA
212 Harbour Seal Wadden Sea, "'1974 Blubber 3 M / 1-24 10.4 ± 6.7 Ouinker et a1.(Phoca vituZina) Netherlands (1979)
287 Harbour Seal Wadden Sea. 1965 Blubber 2 18.5 9.6 - 27.4 Koeman and(Phoca vituZina) Netherlands van Genderen
(1966)
288 Harbour Seal Netherlands "'1972 Blubber 5 / 14-25 9.5 ± 4.6 6.5 - 17.3 Koeman et al.(Phoca vituZina) (1972)
289 Harbour Seal Nether1ands 1972 Blubber 3 / juvenile 2.0 ± 2.8 t 0.33 - 5.1 Koeman et a1.(Phoca vituZina) <2 (1972)

Table 13. Continued
Index Year No. of Mean I LOOT ~g/g
tlo.* Species Location Taken Tissue Animals Sex Length/ Age mean ! S.D. Range Source(m) (yrs)
290 Harbour Seal Scroby, "'1970 Blubber 3 / adults 23.9 ± 11.1 t 15.6 - 34.4 Holden(Phoaa vitulina) E. England (1972)
291 Harbour Seal Shetland, 1970 Blubber 4 / pups 2.6 ± 0.97 1.6 - 3.6 Holden{Phoaa vitulina} N. Scotland (1972)
292 Harbour Seal Sununer, 1970 Blubber 17 / adults 5.3 ± 1.7 2.5 - 8.6 Holden(Phoca vi tul.ina) W. Scotland (1972)
293 Harbour Seal Wash, 1970 Blubber 12 - / pups 6.5 ± 2.2 2.5 - 9.73 Holden(Phoaa vitulina) E. England (1972)
294 Harbour Seal Pribilof Island 1971 Blubber 3 13.9 E: 6.8 27.8 Anas-(Phoaa vitulina) Alaska, USA (1974)
295 Harbour Seal Wadden Sea, "'1979 Liver 5 M&F / 1-24 0.55 ± 0.49 Duinker et a1. ........(Phoaa vitulina) Netherlands Kidney 2 F / 1 0.41 0.05 - 0.76 (1979) N-
Blubber 4 F - / 1-23 11.2 ± 10.3
296 Harbour Seal North German 1974- Liver 5 - / 0-8 0.14 ± 0.10 Drescher et al.{Phoaa vitulina} Coast 1976 Kidney 4 - / 0-8 0.15 ± 0.14 (1977)
Blubber 56 - / 0-8 7.28 ± 2.07
297 Harbour Seal W. Scotland "'1978 Blubber 8 22.3 Holden(Phoaa vitulina) (1978)
324 A Harbour Seal Schleswig- 1975- Blubber 8 !Juveniles 16.9 4.0 - 47.1 Reijnders(Phoaa vitulina) Holstein 1976 Blubber 6 / adults 8.5 3.7 - 15.2 (1980)
324 B Ha rbour Sea1 Wadden Sea, 1975- Blubber 6 /juveniles 29.8 3.3 - 127.0 Reijnders(Phoca vi.tul.ina) Netherlands 1976 Blubber 8 / adults 47.3 6.6 - 178 (1980)

Table 13. Continued
Index Year No. of Mean I LOOT ~g/g
110.* Species Location Taken Tissue Animals Sex Len~th/ Age mean S.D. Range Source(m (yrs)
298 Harbour and E. Anqlta , 1972 L1ver + 9 adults 1.42 ± 1.38 Hepp1estonGrey Seals E. England Muscle 9 adults 0.34 ± 0.19 (1973)
(Phoca vitulina and Kidney 9 adults 0.38 ± 0.24HalichoeruB g~YPUB) Blubber 9 adults 12.55 ± 6.23
299 Harbour and Baltic Sea 1968 Blubber 2 66 58 - 74 Jensen et a1.Grey Seals (1969)
(Phoca vitulina andHalichoeruB g~YPUB)
300 Harbour and E. Scotland 1965 Blubber 18 adults 15.1 2.8 - 37 Holden andGrey Seal s 1966 Marsden
(Phoca vitulina and . (1967)Halichoeru8 g~YPU8)
301 Harbour and N. and W 1965 Blubber 6 adults 7.6 3.1 15.5 Holden and'-J
- wGrey Seal s Scotland 1966 Marsden
(Phoca vitulina and (1967)Halichoeru8 g~YPU8)
302 Harbour and N. and l~. 1965 Blubber 9 pups 5.12 2.23 - 8.29 Holden andGrey Seals Scotland Marsden
(Phoca vitulina and (1967)Halichoeru8 g~YPUB)
210 Hooded Seal Upernav1k and 1974 Blubber 4 3.5 ± 1.5 t 2.1 6.5 Johansen et al.(CY8tophom cr-istiatia) D1sko Bay. (1980)
W. Greenland
305 Hooded Seal W. Greenland 1972 Blubber 5 0.29 ± 0.10 s Clausen et al.(Cy8tophoro cr-ietata) (1974)

Table 13. Continued
Index Year No. of Mean LOOT pg/gflo. * Species Location Taken Ti ssue Animals Sex Lenjth/ Age mean . S.D. Range Source
(m (yrs)
214 Harp Seal Upernavik and 1972 Blubber 8 4.9 ± 5.6 t 0.82 - 17.2 Johansen et a1.(Paqophi Lue Oisko Bay. (1980)
gr'oenlandicuB} W. Greenland
215 Harp Sea1 Upernavik and 1974 Blubber 3 1.5 ± 0.6i" 0.92 - 2.6 Johansen et al.(PagophiluB Oisko Bay. (l980)
gr'oenlandicus} W. Greenland
216 Harp Seal Upernavik and 1976 Blubber 3 2.8 ± 1.4 2.1 6.5 Johansen et a1.(Pagophi lUB Oisko Bay, (l980)
gr'Oenlandicus) W. Greenland
218 Harp Seal Gulf of 1973 Liver + 4 F - / adults 0.03 ± 0.01 Jones et a1.(Paqophi.l ue St. Lawrence. Muscle 4 F - (lactating) 0.01 ± 0.000 (l976 )
gr'oenlandicus} E. Canada Blubber 4 F - / II 4.40 ± 1.27-.....J+::> .
225 Harp Seal Gulf of 1973 Liver 10 M - / 8-14 days 0.129 ± 0.179 0.003- 0.61 Jones et a1.(Paqophi.Lus St. Lawrence, Kidney 7 M - / 8-11 days 0.546 ± 1.02 0.007- 3.04 (1976)
qroen landicue ) E. Canada Blubber 10 M - / 8-14 days 1.34 ± 0.49 0.66 - 2.08
226 Harp Seal Gulf of 1973 Liver 6 F - / 3-14 days 0.126 ± 0.175 0.02 - 0.48 Jones et al.(Pagophi lUB St. Lawrence Kidney 6 F - / 3-14 days 0.49 ± 0.54 0.09 - 1.5 (1976)
gl'oen Landi cue } E. Canada Blubber 5 F - / 10-14 days 1. 36 ± 0.87 0.69 - 2.30
306 Harp Seal East of 1970 Liver 9 - / . pups & 0.48 Frank et a1.(Paqoplii.Lue Newfoundland
Muscle+juveniles (1973)
qroen l andicue r 9 - / <3 wks 0.43Blubber 9 - / <3 wks 3.46
307 Harp Seal East of 1970 Liver + 3 F - / adults 0.18 Frank et a1.(PagophiluB Newfoundland Muscle 3 F - / adults 0.11 (1973)
qroen Landicue ) Blubber 5 F - / adults 8.84
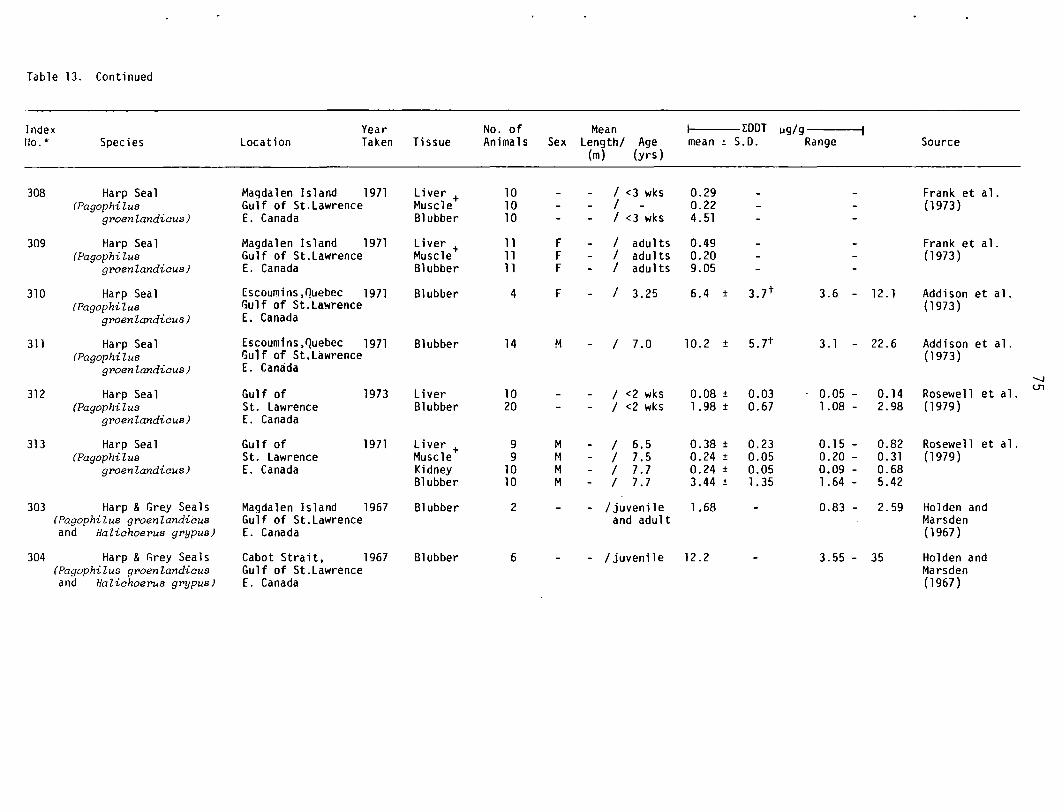
Table 13. Continued
Index Year No. of Mean I EDDT \Jg/gtlo. * Species Location Taken Tissue Animals Sex length/ Age mean ! S.D. Range Source
(m) (yrs)
308 Harp Seal Magdalen Island 1971 liver + 10 / <3 wks 0.29 Frank et a1.(Paqophi.l.ue Gulf of St. lawrence Muscle 10 / 0.22 (1973)
gpoenZandicus) E. Canada Blubber 10 / <3 wks 4.51
309 Harp Seal Ma9dalen Island 1971 liver + 11 F / adults 0.49 Frank et al.(PagophiZus Gulf of St.lawrence Muscle 11 F / adults 0.20 (1973)
groenZandicus) E. Canada Blubber 11 F / adults 9.05
310 Harp Seal Escoumins,~uebec 1971 Blubber 4 F / 3.25 6.4 ± 3.7 t 3.6 - 12.1 Addison et al.(Pagophi Lue ~ulf of St.la~rence (1973)
groen l.andicue ) E. Canada
311 Harp Seal Escoumfns,Quebec 1971 Blubber 14 M / 7.0 10.2 ± 5.7 t 3.1 - 22.6 Addison et al.(Pagophi l.ue Gulf of St. lawrence (1973)
gpoenZandicus) E. Canada-.....J
312 Harp Seal Gulf of 1973 liver 10 / <2 wks 0.08 ± 0.03 0.05 - 0.14 Rosewell et al. tTl
(Pagophi l.us St. Lawrence Blubber 20 / <2 wks 1.98 ± 0.67 1.08 - 2.98 (1979)gpoenZandicus) E. Canada
313 Harp Seal Gulf of 1971 liver + 9 M / 6.5 0.38 ± 0.23 0.15 - 0.82 Rosewell et al.(PagophiZus St. lawrence Muscle 9 M / 7.5 0.24 ± 0.05 0.20 - 0.31 (1979)
gpoenZandicus) E. Canada Kidney 10 M / 7.7 0.24 ± 0.05 0.09 - 0.68Bl ubber 10 M / 7.7 3.44 ± 1.35 1.64 - 5.42
303 Harp &Grey Seals Magdalen Island 1967 Blubber 2 - / juvenile 1.68 0.83 - 2.59 Holden and(PagophiZus groenZandicus Gulf of St.lawrence and adult Marsdenand HaZichoel"Us gPypUB) E. Canada (1967)
304 Harp &Grey Seals Cabot Stra it, 1967 Blubber 6 - /juvenile 12.2 3.55 - 35 Holden and(PagophiZus gpoenZandicus Gulf of St.lawrence Marsdenand HaZichoel"UB gPypUB) E. Canada (1967)

Table 13. Continued
Index Year No. of Mean I LOOT IJg/gflo. * Species location Taken Tissue Animals Sex Lengthl Age mean ! S.D. Range Source
(m) (yrs)
314 Bearded Sea1 W. Greenland 1972 Blubber 5 0.47 ± 0.26 <5 Clausen et al.(Erignathu8 ba~batu8) (1974)
315 Fur Sea 1 Pribilof Island 1969 Liver + 5 I pups 2.21 0.20 - 6.75 Anas and(Cal.l.orhi.nue ~8inu8) Alaska, USA Muscle 5 I pups 2.18 0.09 - 8.77 Wil son
Blubber 5 I pups 15.91 0.64 - 47.9 (1970b)
316 Fur Seal Pribilof Island 1968 Liver 13 M I 2.8 0.8/J 0.08 - 5.95 Anas and(Cal.loi-hinue U~8inu8) Alaska, and 1969 Wilson
Washington State (l970a)Coast, W. USA
317 Fur Seal Prlbilof Island 1968 Liver 10 FB / 3.0 0.98 0.19 - 3.27 Anas and(Cal.l orhi.nue U~8inu8) Alaska, and 1969 Wilson
I~ash1nqton State (l970a) .......,Coast, ~1. USA Q')
318 Fur Sea1 Pribilof Island 1968 Liver 7 FA / 8.0 0.46 0.16 - 0.81 Anas and(Oal.lorhinue ureinue ) Alaska, and Wil son
Washington State (l970a)Coast, W. USA
319 Fur Seal Pribilof Island 1968 Liver 7 / fetus 0.01 0.01 - 0.10 Anas and(Oal lorhi.nue u~8inu8) Alaska, and Wilson
Washington State (1970a)Coast, W. USA
320 Fur Seal St. Paul Island 1972 Blubber 5 I pups 39.9 ± 48.2 Kurtz and Kim(Cal lor-ni.nue ~8inu8) Alaska, USA (1976)
321 Fur Sea1 St. Paul Island 1972 Blubber 2 F I adults 5.2 ± 2.6 Kurtz and Kim(Ca l.l orhi.nue urosinu8) Alaska, USA (1976)

Table 13. Continued
Index Year No. of Mean I mer \.Ig/gflo. * Species Location Taken Tissue Animals Sex Length/ Age mean ! S.D. Range
(m) (yrs)
322 Species W. Greenland ",1978 Blubber 20 0.70 ± 0.50(Bearded, Hooded. Ringed)
325 Sea LiQn Ca1iforni a 1970 Blubber 25 21M/ - /adults 911 ± 582 41 -2678(Zalophu8 cal~fornianu8) 4F
326 A Sea Lion Cal ifornia 1970 Liver 3 F / 8 25.2 ± 4.1 22 - 30(Zalophu8 californianus) Blubber 6 F / 8 824.4 ± 167.8 626 -1039
326 B Sea Lion Cal Hornia 1970 Liver 4 F /12 6.7 ± 5.1 2.4 - 13.6(Zalophus caZifornianu8) Blubber 4 F /12 103.2 ± 69.7 51 - 203
327 Walrus Alaska 1970 Blubber 4 0.08(Odobenus 1'08maru8 1'08marus)
328 Walrus Thule, 1975- Blubber 8 M /0-19 0.09 ± 0.13 0.03 - 0.40(Odobenu8 1'08maru8 1'08marus) Greenland 1977 Blubber 20 F /0-19 0.05 ± 0.05 0.01 - 0.26
* - Different tissues belong to the same animal or groups of animals which have the same Index No.+ - Dorsal meatt - Standard deviation calculated from the range.'" - Approximate sampling date or several years previously.£ - Total DDT + PCB6 _ as ODE
A - GravidB - Non-gravid
Source
Clausen(1978)
Le Boeuf &Bonnell(1971)
Delon~ et al.(1973 )
Delon~ et al.(1973)
Galster &Burns(1972)
Born et al.(1981 )

Table 14. Reference concentration of PCB's (wet weight basis) in different tissues of Pinnipeds.
Index Year No. of Mean I PCB l-Ig/gHo.* Species Location Taken Tissue Animals Sex Len~th/ Age mean r S.D. Range Source
(m (yrs)
106 Ringed Seal Upernavik, 1974- Blubber 57 0.96 ± 0.71 Johansen et al.(Phoca hi.epida ) W. Greenland 1976 (1980)
107 Ringed Seal Daneborg, 1974 Blubber 7 3.2 ± 1.3t Johansen et al.{Phoca hi.epida J E. Greenland (1980)
250 Ringed Seal Gulf of Bothnia, 1968 Blubber 2 6.8 5.0 - 8.5 Jensen et al.{Phoca hiBpidaJ W. Finland (1969)
251 Ringed Seal Bothnian Bay, 1973 Blubber 40 F / adults 69 ± 25.3 Helle et al.{Phoca hiBpidaJ W. Finland (1976a)
252 Ringed Seal Gulf of Bothnia, 1973 Rlubber 33 / adults 110 ± 86 Helle et al.(Phoca hi.epi.da ) W. Finland (1976a)
253 Rinqed Seal Simo, Bothnian 1975 Blubber 37 FB / adults 100 57 Helle et al.-....J
± co(Phoca hi.epi.da ) Bay, W. Finland (1976b)
254 Rinqed Seal Simo, Bothnian 1975 Blubber 24 FA / adults 73 ± 32 Helle et al.(Phoca hiep ida ) Bay, W. Finland (1976b)
255 Ringed Seal Simo, Bothnian 1975 Blubber 24 M / adults 100 ± 64 Helle et al.(Phoca hiBpidaJ Bay, W. Finland (1976b)
256 Ringed Seal Sachs Harbour 1972 Liver + 3 M&F 0.041 ± 0.062 Bowes and(Phoca hiBpidaJ Hudson Bay, Muscle 3 M&F 0.011 ± 0.006 Jonkel
N. Canada Blubber 5 M&F 0.92 ± 0.77 (1975)
257 Ringed Seal Lancaster Sound "'1972 Liver 3 F 0.042 ± 0.041 Bowes and(Phoca hi.epi.da ) Arctic Canada Blubber 2 M&F 0.50 ± 0.49 Jonkel
(1975)

Table 14. Continued
Index Year No. of Mean I PCB ~g/g
flo.* Species Location Taken Tissue Animals Sex Length/ Age mean ! S.D. Range Source(m) (yrs)
258 Ringed Seal Greenland, 1972 Blubber 5 0.90 ± 0.27 Clausen et al.(Phoca hi.epida ) West Coast (1974)
260 Ringed Seal Arctic Canada ",1970 Blubber 3 3 ± 1.2 CY 2 4 Holden(Phoca hispida) (1972)
261 Ringed Seal Arctic Norway "'1970 Blubber 2 1.5 2 Holden(Phoaa hispida) (1972)
262 Ringed Seal Victoria Island, 1970- Blubber 13 F 10.9 / - 2.0 ± 0.90 4 Addison and(Phoaa hispida) W. Arctic Canada 1972 Smith
(1974 )
263 Ringed Seal Victoria Island, 1970 Blubber 15 M 14.5 / - 4.1 ± 1.44 6 Addison and(Phoca hispida) Smith
'-J(1974) co
264 Grey Seal Archipelago 1968 Blubber 3 6.1 5.7 6.4 Jensen et al.(Halichoerus grypus) of Stockholm (1969)
265 Grey Seal Gulf of Finland 1968 Blubber 2 /pups 3.9 3.4 - 4.4 Jensen et al ,(Halichoerus grypus) (1969)
266 Grey Seal Wa 1es , "'1970 Blubber 3 /adu1ts 212 ± 2lt 200 - 235 Holden(Halichoerus grypus) W. England (1972)
267 Grey Seal Cornwall, "'1970 Blubber 3 /pups 160 ± 41 t 118 187 Holden(HaZichoerus grypus) S. England (1972)
268 Grey Seal Orkney, "'1970 Blubber 8 /adults 18 ± 9.5 t 3 - 30 Holden(Halichoerus grypus) N. Scotland (1972)

Table 14. Continued
Index Year No. of Mean I PCB ~g/g
No.· Species Location Taken Tissue Animals Sex Length/ Age mean :t: S.D. Range Source(m) (yrs)
269 Grey Seal Hebrides, "'1970 Blubber 3 - / adults 30 ± 12t 19 - 40 Holden(Ha l.ichoerue grypus) W. Scotland (1972)
270 Grey Seal Summer Island, ",1970 Blubber 4 - / adults 16 ± 4t 11 19 Holden(Ha l iohoerue grypus) l~. Scotland (1972)
271 Grey Seal Aberdeen-Montrose''''1970 Blubber 16 - / adults 38 ± 22t 12 - 88 Holden(Halichoerus grypus) E. Scotland (1972)
272 Grey Seal Farne Islands, ",1970 Blubber 5 - / pups 40 ± llt 25 50 Holden(Ha Li.choevue grypus) ~I. E. Eng1 and (1972)
273 Grey Seal Scroby, ",1970 Blubber 2 - / adults 123 -t 100 - 146 Holden(Halichoe1'Us grypus) E. England (1972)
274 Grey Seal Sable Island ",1970 Blubber 5 - / adults 27 ± 23t 12 - 65 Holden 00a(Halichoerus grypus) Nova Scotia, (1972)
E. Canada
275 Grey Seal Basque Island, "'1970 Blubber 2 - / adults 32 ± 26 17 - 46 Holden(Halichoerus grypus) Gulf of St.Lawrence (1972)
E. Canada
276 Grey Seal Outer Hebrides, 1972 Blubber 6 - / adults 14.4 ± 14.7 Heppleston(Halichoerus grypus) N. Scotland (1973)
277 Grey Seal Shetland, 1972 Blubber 8 - / adults 11. 1 ± 6.9 Heppleston(Halichoerus grypus) l~. Scotland (1973)
278 Grey Seal Farne Island, 1972 Blubber 7 - / adults 31.0 ± 13.1 Heppleston(Halichoerus grypus) N.E. England (1973)

Table 14. Continued
Index Year No. of Mean I PCB ~g/g
tJo.* Species Location Taken Tissue Animals Sex t.enqth/ Age mean ! S.D. Range Source(m) (yrs)
279 Grey Seal E. flngl i a , 1972 Blubber 4 1 adults 152.0 ± 164.2 Heppleston(Halichoerus grypus) E. England (1973)
280 Grey Seal Gulf of Bothnia, 1973 Blubber 15 1 adults 100 ± 70 Olsson et al.(Ha Liohoerus grypus) W. Finland (1975)
281 Grey Seal Baltic Sea 1973 Blubber 18 1 adults 140 ± 72 Olsson et al.(Halichoerus grypus) (1975)
232 Grey Seal Sable Island 1974- Blubber 11 - 1 pups 2.3 ± 0.9 Addison and(Halichoerus grypus) Nova Scotia, Brodie
E. Canada (1977)
283 Grey Seal Sable Island 1974- Blubber 11 F - 1 adults 14.5 ± 6.1 Addison and(Halichoerus grypus) Nova Scotia, Brodie
E. Canada (1977) 00.......
284 Grey Seal E. Angl fa, -v1975 Liver + 3 14.0 ± 0.3 9.7 - 10.3 Holden(Halichoerus grypus) E. England Muscle 3 3.0 ± 1.8 1.6 - 5.0 (1975)
Kidney 3 4.7 ± 1. 70 3.3 - 6.6Blubber 3 195 ± 170 77 - 390
285 Grey Seal Orkney, '\,1978 Blubber 7 26.6 Holden(Halichoerus grypus) N. Scotland (1978a)
286 Grey Seal Shetland, '\,1978 Blubber 8 11.1 Holden(Halichoerus grypus) N. Scotland (1978a)
286 A Grey Seal Farne Islands 1975 Blubber 26 M / 3-27 48.7 23.5 - 90.5 Holden(Halichoerus grypus) N,E. England Blubber 33 F 1 1-36 35.4 17.0 - 103.0 (1978b)
323 Grey Sea1 Farne Islands 1972 Blubber 10 M 1.84 /12.6 44.7 ± 21.4 13.8 - 89.1 Donkin et a1.(IIa Lichoerue grypus) N.E. England Blubber 9 F 1. 82 119.4 19.1 ± 9.9 4.1 - 37.6 (1931 )

Table 14. Continued
Index Year No. of Mean I PCB vs/sNo.* Species Location Taken Tissue Animals Sex Lenqthl Age mean ! S.D. Range Source
(m) (yrs)
165 Harbour Seal Boothbay Harbour 1971 Liver + 3 M - 1 adults 3.16 ± 2.96 t 1.00 - 6.00 Gaskin et a1.(Phooa vituZina) Gulf of Maine, Muscle 2 M - 1 adults 0.39 ± O.13t 0.28 - 0.50 (1973)
Eo USA Blubber 3 M - 1 adults 131.8 ± 121.2 35.1 - 240.2
166 Harbour Seal Boothbay Harbour 1971 Liver + 3 F - 1 adults 0.39 ± 0.34 t 0.10 - 0.68 Gaskin et al.(Phooa vituZina) Gulf of Maine, Muscle 3 F - 1 adults 0.18 ± 0.06 t 0.1 0.25 (1973)
Eo USA Blubber 3 F - 1 adults 43.57 ± 42.5 t 27.93 - 99.78
168 Harbour Seal Grand Manan & 1971 Liver + 4 M - 1 adults 2.03 ± 2.48 t 0.30 - 4.50 Gaskin et al.(Phooa vituZina) Deer Island, Muscle 4 M - 1 adults 1. 58 ± 2.06 t 0.30 - 5.10 (1973)
New Brunswick, Blubber 3 M - 1 adults 52.33 ± 1l.80 t 43.0 - 63.0E. Canada
212 Harbour Seal Wadden Sea, ",1979 Liver 5 M&F 1 1-24 16.98 ± 15.29 Duinker et al. co(Phooa vituZina) Netherlands Blubber 3 M 1 1-24 151.7 ± 96.7 (1979) N
288 Ha rbour Sea1 Netherlands 1972 81ubber 5 114-25 1470 ± 922t 385 -2530 Koeman et a1.(Phooa vituZina) (1972)
289 Harbour Seal Netherlands 1972 Blubber 3 -I juveniles 240 ± 326t 47 - 600 Koeman et al.(Phoca vi.t.ul.ina) (1972)
290 Harbour Seal Scroby, ",1970 Blubber 3 - 1 adults 131 ± 54t 93 185 Holden(Phooa vituZina) Eo England (1972)
291 Ha rbour Sea1 Shetland, ",1970 Blubber 4 - 1 pups 4 ± 1.9 2 6 Holden(Phooa vituZina) N. Scotland (1972)
292 Harbour Seal Summer Island, ",1970 Blubber 17 - 1 adults 12 ± 4.2 5 - 20 Holden(Phooa vituZina) W. Scotland (1972)
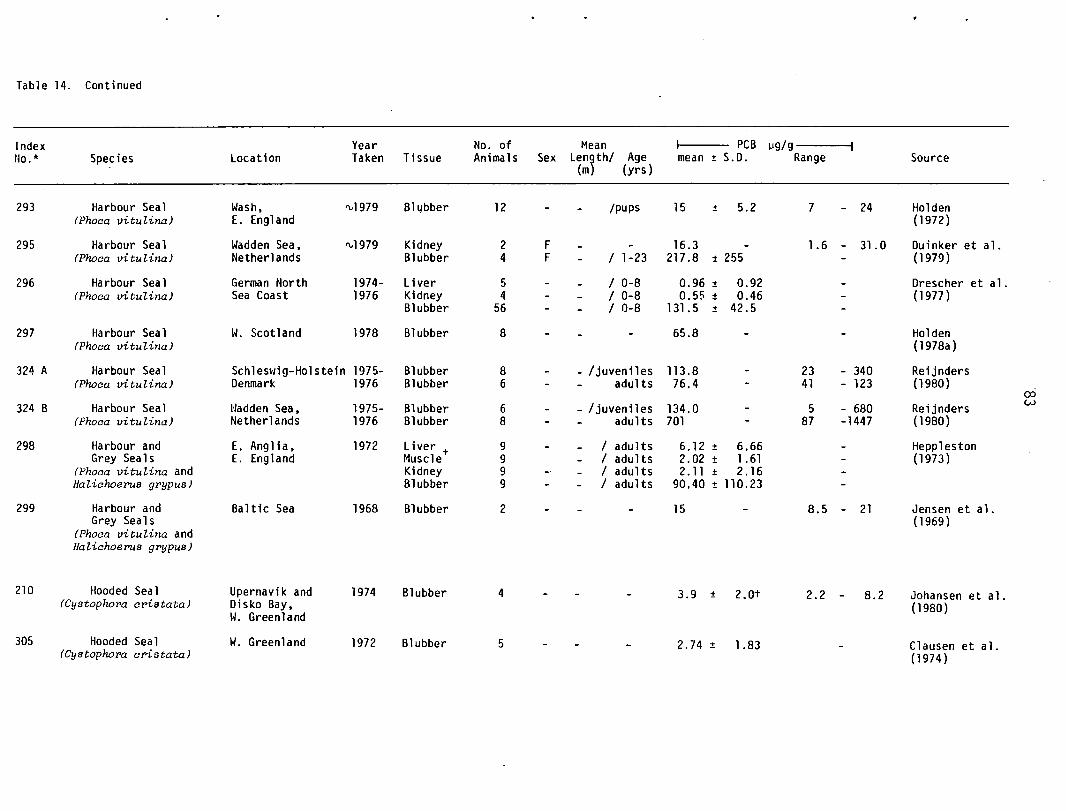
Table 14. Continued
Index Year No. of Mean I PCB \.Ig/gflo.* Species Location Taken Tissue Anima 1s Sex Len1thl Age mean :!: S.D. Range Source
(m (yrs)
293 Harbour Seal Wash. '\.1979 Bll,lbber 12 Ipups 15 ± 5.2 7 - 24 Holden(Phoca vitulinaJ E. Engl and (1972)
295 Ha rbour Sea1 Wadden Sea. '\.1979 Kidney 2 F 16.3 1.6 - 31.0 Duinker et al.(Phoca vitulinaJ Netherlands Blubber 4 F 1 1-23 217 .8 ± 255 (1979)
296 Ha rbour Sea1 German North 1974- Liver 5 / 0-8 0.96 ± 0.92 Drescher et al.(Phoca vitulinaJ Sea Coast 1976 Kidney 4 / 0-8 0.5!' ± 0.46 (1977)
Blubber 56 1 0-8 131.5 ± 42.5
297 Harbour Seal W. Scotland 1978 Blubber 8 65.8 Holden(Phoca vitulinaJ (1978a)
324 A Ha rbour Sea1 Schleswig-Holstein 1975- Blubber 8 - 1juveniles 113.8 23 - 340 Reijnders(Phoca vitulinaJ Denmark 1976 Blubber 6 adults 76.4 41 - 123 (1980)
co324 B Harbour Seal Hadden Sea. 1975- Blubber 6 - / juveniles 134.0 5 - 680 Reijnders w
(Phoca vitulinaJ Netherlands 1976 Blubber 8 adults 701 87 -1447 (1980)
298 Harbour and E. Angl ia. 1972 Liver + 9 1 adults 6.12 ± 6.66 HepplestonGrey Seals E. England Muscle 9 1 adults 2.02 ± 1.61 (1973)
(Phoca vitulina and Kidney 9 / adults 2.11 ± 2.16Hal.iohoer-ue grypus J Blubber 9 1 adults 90.40 ± 110.23
299 Harbour and Baltic Sea 1968 Blubber 2 15 8.5 - 21 Jensen et al.Grey Seals (1969)
(Phoca vitulina andlIa l.ichoe pus grypus J
210 Hooded Seal Upernavik and 1974 Blubber 4 3.9 ± 2.0t 2.2 - 8.2 Johansen et al.(Cystophora cPistataJ Disko Bay. (1980)
W. Greenland
305 Hooded Seal W. Greenland 1972 Blubber 5 2.74 ± 1.83 Clausen et al.(Cystophora cr-ietata) (1974)

Table 14. Continued
Index Year No. of Mean I PCB \.Ig/gflo.· Species Location Taken Tissue Animals Sex Length/ Age mean :!: S.D. Range Source
(m) (yrs)
214 Harp Seal Upernavik and 1972 Blubber 8 19 ± 1.1 0.74 - 4.0 Johansen et a1.(Pagophi lUB Disko Bay, (1980)
gJ'OenlandicuB) W. Greenland
215 Harp Seal Upernavik and 1974 Blubber 3 1.7 ± 0.5 1.2 - 2.8 Johansen et a1.(PagophiluB Oisko Bay, (1980)
gl'oenlandicuB) W. Greenland
216 Harp Seal Upernavik and 1976 Blubber 3 1.6 ± 0.7 0.74 - 2.7 Johansen et a1.(PagophiluB Oisko Bay, (l980)
groenlandicus) \~. Green1and
218 Harp Seal Gu lf of 1973 Liver 4 F adult 0,07 ± 0.01 Jones et a1.(Pagophi lUB St. Lawrence,
Musc1e+(lactating) (1976)
cogJ'OenlandicuB) E. Canada 4 F adult 0.45 ± 0.01~
(1 acta t ing)Blubber 4 F adult 6.05 ± 2.05
(lactating)
225 Harp Seal Gulf of 1971 Liver 10 M + 0.33 ± 0.60 0.07 - 0.45 Jones et a1.- 8-14 days(PagophiluB St. Lawrence, Kidney 7 M - 8-11+ days 0.49 ± 0.53 0.15 - 1.3 (1976)
gl'oenlandicus) E. Canada Blubber 10 M - 8-14 days 1.26 ± 0.42 0.6 - 1.7
226 Harp Seal Gulf of 1973 Liver 6 F - 3-14 days 0.18 ± 0.21 0.05 - 0.60 Jones et a1.(Paqophi.Lue St. Lawrence Kidney 6 F - 3-14 days 0.36 ± 0.37 0.04 - 1.00 (1976)
groenlandicuB) E. Canada Blubber 5 F - 10-i 4 days 0.71 ± 0.64 0.3 - 1.8
306 Harp Seal East of 1970 Liver 9 pups & 0.17 Frank et a1.(Pagophi lUB Newfoundland
Musc1e+juveniles (l973 )
gl'oenlandicus) 9 <3 wks 0.21Blubber 9 <3 wks 1.8

Table 14. Continued
Index Year No. of Mean I PCB \.Ig/gflo. * . Species location Taken Tissue Animals Sex lenqth/ Age mean ! S.D. Range Source
(m) (yrs)
307 Harp Seal East of 1970 liver + 3 F adults 0.08 Frank et al.(PagophiluB Newfoundland Muscle 3 F adults 0.05 (1973)
gl'oenlandicuB) Blubber 5 F adults 4.50
308 Harp Seal Magdalen Island 1971 liver + 10 < 3 wks 0.17 Frank et al.(PagophiluB Gulf of St. lawrence Muscle 10 < 3 wks 0.14 (1973)
gl'OenlandicuB) E. Canada Blubber 10 < 3 wks 2.60
309 Harp Seal Magdalen Island 1971 liver + 11 F adults 0.30 Frank et al.(PagophiluB Gulf of St. lawrence Muscle 11 F adults 0.14 (1973)
qroen Landious ) E. Canada Blubber 11 F adults 5.3
310 Harp Seal Escoumi ns ,r!uebec 1971 Blubber 4 F 3.25 6.8 ± 5.2 33 15 Addison et al.(PagophiluB Gulf of St. lawrence (1973) co
gl'oenlandicuB) E. Canada U1
311 Harp Seal Escoumins.Quebec 1971 Blubber 14 M 7.0 8.6 ± 5.9 t 2 - 22 Addison et al.(PagophiluB Gulf of St.lawrence (1973)
gl'oen l.andieue ) E. Canada
312 Harp Seal Gulf of 1973 liver 10 < 2 wks 0.09 ± 0.04 0.04 - 0.15 Rosewell et al.(PagophiluB St. lawrence Blubber 20 < 2 wks 2.26 ± 1.06 1.15 2.91 (1979)
gl'OenlandicuB) E. Canada
313 Harp Seal Gulf of 1971 liver + 9 M 6.5 0.59 ± 0.39 0.11 1.45 Rosewell et al.(PagophiluB St. lawrence Muscle 9 M 7.5 0.34 ± 0.22 0.06 0.77 (1979)
gl'OenlandicuB) E. Canada Kidney 10 M 7.7 0.34 ± 0.24 0.04 ;0.86Blubber 10 M 7.7 3.51 ± 3.52 1. 53 13.30
329 Harp Sea1 Gulf of St. lawrence Blubber 4 10.63 ± 10.86 Sergeant(Pagophilus E. Canada (1980)
gl'Oenlandicus)

Table 14. Continued
No. of MeanAnimals Sex Lengthl Age
(m) (yrs)
5
5
2 F
Source
Clausen et al.(1974)
Kurtz and Kim(1976)
Kurtz and Kim(1976)
Anas and Worland(1975)
ex>
Clausen 0"\
(1978)
DeLon} et a1.(1973
DeLon} et a1.(1973
Galster andBurns(1972)
Born et a1.(1981)
5.3 - 95.7
0.16 - 1.10.06 - 0.53
3.4 - 9.785 - 145
0.5 - 2.212 - 25
1.8 ± 0.99
I PCB \Jg/g---~
mean ± S.D. Range
pups 21.9 ± 33.5
adults 5.8 ± 1.5
adults 28.64£
5.1 ± 5.2
1 8 5.7 ± 3.51 8 112.4 ± 24.4
112 1.3 ± 0.8/12 17.1 ± 6.1
1.8
1 0-19 0.36 ± 0.311 0-19 0.18 ± 0.12
FF
FF
M
MF
36
44
4
20
820
12
lnde~ YearNo.· Species Location Taken Tissue
314 Bea rded Sea1 W. Greenland 1972 Blubber(ErignathuB barbatus)
320 Fur Seal St. Paul Island 1972 Blubber(Cal Lorh inue urBinus) Alaska, USA
321 Fur Seal St. Paul Island 1972 Blubber(CaZLorhi.nue urBinus) Alaska, USA
330 Fur Seal Washington State 1972 Blubber(CaZLorhinue ursinuB) Coast, W. USA
322 Seal Species W. Greenland '1,,1978 Blubber(Bearded, Hooded, Ringed)
326 A Sea Lion California 1970 Liver(ZaZophuB caZifornianus) Blubber
326 B Sea Lion California 1970 Liver(ZaZophuB caZifornianuB) Blubber
327 Walrus Alaska 1970 Blubber(Odobenus l'OBmapus
rOBmaPUB)
328 Walrus Thule, 1975- Blubber(Odobenue l'OBmapus Greenland 1976 Blubber
l'Osmapus)
• - Different tissues belong to the same animal or groups of animals which have the same Index No.
+ . - Dorsal meat
t - S.D. estimated from the range.
'V - Approximate sampling time or several years previously.
£ - Total DDT + PCB
A - Gravid
B - Non-gravid

10535302515 20ug/ g, Hg
10
3
2
3
I
I
2
I
3
2
48
8
6
36- ! • (5D) !
38 "!
3
• (5.2) I
2
27 I • (4.3)
29-
I
9 I • (4.6)
~6
I
I • (2.5) I
7 ~3.9) !
3 --2 --'c 3.71...... I
I~ __ -{3.1)oJ
I
5 - 1.3)-- I
ISHORT FINNED...
4
AND PILOT
• PORPOISES
• NARWHAL
0 BELUGA
-(AVERAGE AGE IN YEARS)-
0 5I I
ozxwoz
Figure 1. Mercury in liver of cetaceans.

coCO
76543 ug/g,Hg2o
8 I Q-{~151
I ... !
! • ,
6 - -{5.01 ,~
8 - 5.21 ,-"7
7 • '4.31 !
9 _ "2.8) ,
-, ) I~-,4.6
~ - 2.51,
v -7 "_ 3.91 I
3 ---6 ___ '3.71 I
I v 0 DOLPHINS
- 3.1 1 , SHORT FINNED- .... AND PILOT- 1.31 !-I • PORPOISES
\l SPERM
• NARWHAL
0 BEWGA
c: BALEEN WHALES
-{AVERAGE AGE IN YEARS}-
T • 1
4
4
8
6
3
3
3
2
2
2
39
2oz 3
x Iwo 12z
2
I
35
25
Figure 2. Mercury in muscle of cetaceans.

48
8
6 " ..3
38
3
227 • (4.3)-------J
2
3 • (4.6~
28 e--i2.5 )------'o
37 • (3.9)-------JZ
X 13 •w0 12 • OJZ co
2 • (3.7)---'
II
35 • (3.1 )---'
25 • (1.3)-----1 • NARWHAL
I SHORT FINNED
4... AND PILOT
• PORPOISES
--{AVERAGE AGE IN YEARS}-
ug/g. Hg
Figure 3. Mercury in kidney of cetaceans.

\.0C>
'----------,8
o RINGED
• GREY
c: HARBOUR
.... HOODED
o HARP
_ BEARDED
<> LEOPARD
-(AVERAGE AGE IN YEARS}-
/I
, i I I I I I140 230 240 250 260 270
I130120
'. .90 100 110
ug/g. Hg
80I
70
(7.0-90)-)--------------'
I6050
.4030
I
2010
179110 '----------------40r.------------'101 L-.-----------------------~0l---------------'23..,. '---------------------1_._ (B.5))--------------'14~ • 110.7)10?" L..'-----------------.0r.-.:.......-------------J
143 ' •159 - 12 )-)-------------'140 - ""7.0-901}-)------------'14r '4.o~0}-)----------------'20 - ,.IOO}-)---------------"'134 ~ 7-0-9.0)-)----------------'137 _, 1.0-9.0)-)---------------'136 ~ ~ 4.0-6.0)121 ~12.Bl-)---------'237 J'!Lj~.9l-)---------'124 'k-' .B.Il-)----------'1801+--------I:.~--------------------"'135 ;..:.. 0-3.0}-) -J'
:~~ :' ilg:~~\l--------- .....138 ~: 0-3.0»).---------------------'117 0211+----.......:.......--------------'
o 118 ~.l0.2»)------------'z 188 . 5.2)~-----------.....
112 .r.L..-ioduIIlr--------------'X 132 ~ ~O-30))_------------'W 113 ~ 'adult~I--------------'o 116 . Y;juvenilel-l ---'Z 210 +-----,j..~~-=---' _____'
22,~ H;!~----------------'240- .184 .122 ~5.2)-)-------------'222 H;j--{4.2»)-------------'104 .
\~~ ~1.0)1051-0)-------------------'215 ..:...190 h5=--< 1.0)1081i;T-214 .1-------------------'161 ~pupaJ--)-------------120 .)--H3)_)----------'216-f.l..-------------------'147 t-{pups.})--------------------------'213 I--(pups,)~-----------------'106 )----------------------'119 ~10.3)22::j pupal-)----------------'226 pups)J------------------....J
I
Figure 4. Mercury in liver of seals.

/I
N YEARS~
i I3.4 81.4 81.63.0 3.22.82.4 2.62.0 2.21.81.61.41.21.00.80.2 0.4 0.6
79-
br!
", - 8.5) I
44 - - 10.7) ,on ~
~~~~ '10.0) ,
~i36-
~~ '---0--' (12.8)
24eo3533
~:17 I 0 I
II -18- I 0-{10.2)--18n '5.2) I
12 0-{adult) ,32
~adult)13 I
16 I 0-<Juvenile) I
I~ -~684-
5.2l--------'222204-
1.0) o RINGED87 I
07':' 0
~ • GREY1-;: '7>90 6. HARBOUR
~08~ & HOODED
I61
~1.3)0 HARP
2 I
16 • BEARDED47
L.Jpups) I
13 I----r:l -Q{ puP8) I <> LEOPARDOF;.19 f-6 0.3) I -(AVERAGE AGE I25-26-
- 4.9.....,3719~pupS)
,46 '"V27-
bI3.8)2,
92 I 6 I
I I I I I I I I
1I121II1II2I1II2II1IIII2IIIIII2221I2IIII2II2II2I21I22222I2I
ozxwoz
ug/g .Hq
Figure 5. Mercury in muscle of seals.

'---------~-----10}------------'
coN
o RINGED
• GREY
c: HARBOUR
o HARP
8.0
-{AVERAGE AGE IN YEARS~
7.06.04.0 5.0ug/g. Hg
'----------4I.~(1.0-S.0))_--...J
3.0
PUPII)-)------------'
2.0
'----------------4I.t-1{7.0-S.o)r---------
'------------l0-{odult)f-------'+-------------(0-3.0)\---------.....
L-..--------0-(odult)f--------J
L...----------4I~0-3.0))_-------'1+-------------il~4.0-6.o)-) -----J
L...------~.---1(4.o-6.ol-)-------'L-..---------tet--1(0-3.o\-)---------'
-1---------------4It------i4.0-6'Ol-)---------------'
• (7.0-S.0~.-....c7.0-9.0))--------'6+-----------....,-.-.;4.0-6.0\-) ...J
'O+---------i::!-f 1.0)\---------------'
1791101012314101415914142213137I~
121237121801313313
d 138
Z 117211
x 118W 1880 112Z 132
113116212221812222a10418710710521519108214161120216147213106119225226 pupa)
1.0
Figure 6. Mercury in kidney of seals.
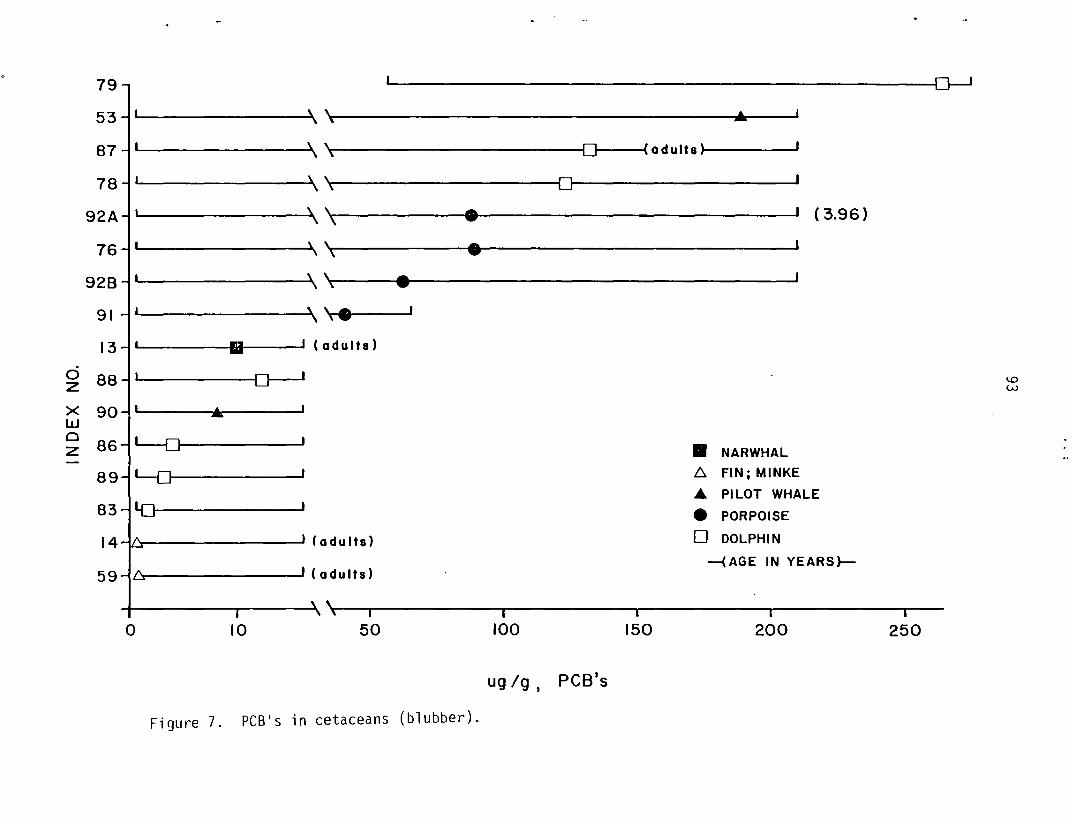
\.0W
(3.96 )
• NARWHALc: FIN i MINKE
• PILOT WHALE
• PORPOISE
o DOLPHIN
-(AGE IN YEARS)-
••
•
'---------------------------D--J
iii '(adults)
-------~I( a du Its)
~-------~, ,.- \ ,
L-- ~, ,\---------tlt-------------------I\ \
L-- ~, ''----------1.....-----------------J\ \
'-------------.)" '\---------------1DL---------------J\ \ ,....
, ,'---------~\ T-,---...----------------------J
L------o-----J
'---------~\'\-,------------~DI----C(adults )-)----.......
'---------~\ ''r\--------------------_~----J
-tf-''r---------....... (a d u Its)
79
53
87
78
92A
76
928
91
13
o 88zx 90w0
86 ~z89 YJ
83 Lo
14
59 6:
o 10 50I
100 150 200 250
ug /g I PCB's
Figure 7. PCB's in cetaceans (blubber).

l--__[]-; adul h)-oJ
• NARWHAL
t:>. FIN; MINKE
'V SPERM: GREY
0 BELUGA
.& PILOT
• PORPOISE
0 DOLPHIN
(AGE IN YEARS I
"I I I' < 1250 300 350 900 950
L-.. [}----I
'\------------<.~(adult..-....J
B7
79
72 ~'<
93A •53 ...7B Q----J
91 •74 • ' (adult')
B6 0
938 •76 •
o B9~z
~(adult')66XW BB L--....Q----I0z 13 .. ' (adults)
90 ... I (adulh)
54 L...{) I (adulh)
59 "- (adults)
14 "-
67 ~ (adulh)
, , ,I I ' \ I I , , I
0 10 20 40 100 200
ug/g, LOOT
Figure 8. EOOT in cetaceans (blubber).

I ,\
1 ,\
I ,,I \,I I::. \,
1 \
I 6 1"(1-24)
I • (adulls~
I • I (a dulls. 16.11
I • I (o dutts)
! 6 I (adults/juveniles)
I • I (adulh)
I • I
I fr-( pups)
I • (adults}---J
~(adultsl
I • ( adultsl-------J
I D--H - 18>-------JI • I
0 I
L....Q----{ I - 18 )--l
'-0 I
()---( 0 - 27 )---l
~(0-8)
t..o------l pups~
l-[J I
l..Q----{pups J------l
-o I
iii I
,
\---6--{adults~
l--O-----l (adults)
L-.-~(adults) ~
~ (adults. 8))------'
\.DU1
I900
I \ '....,-..., ------"""T""-400 800
,300
'-----~(adults) •
o RINGED• GREY• WALRUSt::" HARBOURo HARP.A. SEA LiON
---{AGE IN YEARS)-
I200
I100
,\50
.\
40302010o
325
326
281
252
280
255
253
165
254
324B
251
212
271
323
276
324A
268
282
293
283
292
277
310
286A
322
313
107
262
296
312
214
226
106
328
Figure 9.
ug/g. LOOT
[DDT in pinnipeds (blubber).

.... SEA LION
o RINGED
• WALRUS• GREY
t;,. HARBOUR
o HARP--{ AGE IN YEARS)--
L- ~( adults,14-251----6.~-----'
L- -->,\~ adults )1---_-'
L.----------------I.6. I ( 1- 24)
\
-----------i.t-~( adults )-)-------'
-----------,lr----(O-8))---------'
6. ( adults ))- -J
'<------O------(adults)-----------'
~(adults)
7)
ls)
I
I
I ,\
I ,\
I I ,I ,,I \
I ,,, ,
\,\
I ,\
,\
I • '13-2
I • I (adul
I • (adultsl--J
I • (adulls,16l---J
I • I (adulls)
I L'r-------l (pups)
I • I (adulls)
I 6. I (adults)
I • I (adults)
~(1-18)
l-..-..Q-----JL-Q------( I- 18}----J
l--() I
~O-27~
~ pu ps l----------J
L..[]---{ pups l----------J
I.Q I
IQ---------(pup sI I
.~
• I
288
3248
212
281
296
3248
252
326A
280
255
253
165
254
251
286A
271
276
323
d 268
Z 293
X 283W0 292Z
277
310
322
313
167
262
282
312
214
226
106
328
o 10 20 30 40 100 150 200 700 750 1450 1500
ug/9. PCB
Figure 10. PCB in pinnipeds (blubber).

97
APPENDIX
Statistical Treatment
Scheff~'s multiple comparison of means method is based on the formula:
(Vi -"Vi +x) = ±S[MSE (l/ni + 11ni+x)]1 12
where "i II is the runni ng index for the k groups (means) bei ng compared, and x
is an incremental integer from·1 - k-1.
S = [(k - 1) Fk-1,n k, 1 _ 0;]1/2 , and
k ni 2 k - 2E E y.. - E ni(Yi)lJ
MSE = i =1 j =1 i =1
(n - k )
where "j II is the runni ng index wi thi n a group,
observation. When the interval (1st eq , ) does
hypothesis Ho: ui = ui+x is rejected.
and "y.. " is an individual1 J
not contain zero, the null
Individual observations "Y i j" were not available. However, MSE can beexpressed in terms of the k estimates of individual variances st, sL S~
namely,
MSE =[(n1-1)Sf + (n2-1)S~ + ••• + (nk-1)S~]
(n1 + n2 + n3 + ••••• + nk-k)
which was the formula used to obtain MSE from the given standard deviations.
If the standard deviations were not given but the range (w) and number of sam
ples (n ) were, the standard deviation was estimated from f(w), where "f" is a
multiplication factor appropriate for the given number of samples, and obtain
able from statistical handbooks, e.g. Beyer (1966) p. 271.

Prtnted in Canada bySupply and Services CanadaPrint f ng Off1cefor exclusive distribution byFisheries and OceansFreshwater InstituteWinnipeg. ManitobaCanada
