concentration of ammonium from dilute aqueous solutions ... · concentration of ammonium from...
TRANSCRIPT

Concentration of Ammonium from Dilute Aqueous Solutions using
Commercially Available Reverse Osmosis Membranes
by
Tolulope David Awobusuyi
A thesis submitted to the Faculty of Graduate and Post-Doctoral Studies in partial
fulfillment of the requirements for the degree of
Master of Applied Science, Chemical Engineering
Department of Chemical and Biological Engineering
Faculty of Engineering
University of Ottawa
February 2016
©Tolulope David Awobusuyi, Ottawa, Canada, 2016
ii
Abstract Several commercially available reverse osmosis (RO) membranes were
characterized with aqueous solutions of ammonium sulfate, potassium triphosphate, and
mixtures of these two salts at different feed concentrations, compositions and pressures.
The objective of this study was to investigate the rejection of these solutes, in particular
the ammonium ion (NH4+), by different RO membranes. The aqueous solutions were
assumed to come from an anaerobic digester via a process, currently under investigation
by CHFour Biogas Inc., to maintain low concentrations of ammonia in the digester in
order to maximize the biogas production. The ammonium ions present in the liquid
produced from the process are then concentrated using membrane separation. The
concentrated ammonium solution would be a valuable fertilizer that could be used by
agriculture.
The membranes were characterized with three models: the solution-diffusion
model, the Kedem-Katchalsky model, also known as the irreversible thermodynamics
model, and the Donnan Steric Pore Model (DSPM). The solution-diffusion and
irreversible thermodynamics models were found to be inadequate for proper membrane
characterization and the use of the DSPM model yielded membrane properties in good
agreement with those found in already existing literature. The pore radius of investigated
membranes ranged from 0.39 to 0.51 nm. The effect of pH on membrane surface charge
was also studied, with the conclusion that increases in pH led to increasingly negative
surface charges. This affected the transport of individual ions through the membrane due
to preferential passage of the counter-ions. The effects of applied pressure on the
stoichiometric nature of salt rejections were also studied.
The minimal observed rejection from the range of experiments carried out using
ammonium sulfate was 93%Non-stoichiometric rejections of ions were also observed in
the experiments with single and multiple solutes. Furthermore, the rejection of
ammonium ions in the presence of other ions (K+, SO42-, PO4
3-) increased as feed
concentration increased, which was a result of the synergistic effects of feed pH and ionic
interactions. The minimum NH4+ rejection in the presence of other ions was 95.4%,
which suitability using RO membranes for concentration of ammonium from dilute
aqueous solutions.
iii
Résumé Plusieurs membranes d’osmose inverse disponibles commercialement ont été
caractérisées en utilisant des solutions aqueuses de sulfate d’ammonium, triphosphate de
potassium, ainsi que des mélanges de ces deux composés à différentes compositions,
concentrations et pressions. L’objectif de ce projet était de déterminer et quantifier la
rejection de ces sels, en particulier l’ion ammonium (NH4+), par les membranes d’osmose
inverse testées. Il a été supposé que les solutions aqueuses provenaient d’un digesteur
anaérobique par un procédé, qui est présentement en développement chez CHFour Biogas
Inc., afin de maintenir des concentrations d’ammoniac basses dans le digesteur avec le
but de maximiser la production de biogaz. Les ions ammonium qui sont présents dans le
liquide produit par le procédé sont par la suite concentrés en utilisant des méthodes de
séparation membranaire. Le résultat est une solution concentré d’ammonium qui pourrait
être un engrais de grande valeur dans l’industrie agroalimentaire.
Les membranes ont été caractérisées en utilisant trois modèles : le modèle solution-
diffusion, le modèle Kedem-Katchalsky (aussi connu comme le modèle de la
thermodynamique irréversible), et le Donnan Steric Pore Model (DSPM). Il a été conclu
que les modèles solution-diffusion et de la thermodynamique irréversible sont inadéquats
pour la caractérisation des membranes. Cependant, les propriétés de membrane obtenue
avec le modèle DSPM étaient en bon accord avec ceux trouvés dans la littérature
existante. La taille moyenne des pores de la membrane a été déterminé comme étant 0.39
a 0.51 nm. L’effet du pH sur la charge à la surface de la membrane a aussi été étudié. Il a
été déterminé qu’en augmentant le pH, la charge dominante à la surface devenait de plus
en plus négative. Cela a affecté le transport des ions à travers la membrane en raison du
passage préférentiel des contre-ions. L’effet de la pression sur la nature stoichiométrique
de la rejection de sel a aussi été étudié.
La rejection minimale obtenue par les expériences performé avec du sulfate d’ammonium
était de 93 pourcent, ce qui indique que le procédé proposé est en effet faisable. Rejets
non stoechiométriques d' ions ont également été observées , ce qui était une raison
majeure pour discréditer le modèle solution -diffusion et de la thermodynamique
irreversible. De plus, la rejection d’ions ammonium en présence des autres ions qui sont
retrouvés dans le digestat anaérobie (K+, SO42-, PO4
3-) était supérieure à des
iv
concentrations d’alimentation plus élevées. Ceci était un résultat des effets synergiques
du pH de l’alimentation et des interactions ioniques. La rejection minimale de NH4+ en
présence des autres ions était de 95.4 pourcent.
v
Thesis Acknowledgement
It takes a village to raise a child, so the African saying goes. This thesis is my child, and
the following people were instrumental to both bringing it to its full term and my growth
as an individual and researcher during this period.
1. Dr. Boguslaw Kruczek and Dr. F. Handan Tezel, for the invaluable knowledge,
direction and perseverance; the gift of confidence; the love of research; and role
models by whose lives a man can measure himself.
2. CHFour Biogas and NSERC, for funding and patience with the progress of this
thesis.
3. My parents and family. Obviously.
4. Sid Ypma, Kirstin Johnson, and the Linlathen Board, for the gift of wisdom and
the encouragement to seek for meaning in all I do. Down the rabbit hole I tumble,
and let the cards fall where they may.
5. Dr. Nimal DeSilva and the researchers at the Geochemistry Laboratory, ARC, for
helping with the most important measurements regardless of the demanding
nature of the request.
6. David Carter, for starting the project and serving as a minor supervisor and a
second set of more experienced eyes.
7. Haoyu Wu, for being the ultimate encouragement and an inspiration beyond the
pale.
8. The lab technicians of the Department of Chemical Engineering: Franco Ziroldo,
Lou Tremblay, and Gerard Nina. Without their technical expertise this work
would not have been completed.
9. The graduate students in Office D218: Thank you for being good sounding boards
and effective foils to my more harebrained ideas.
10. Music: Jazz, black music, neo-soul, folk. Without these, days in the lab wore the
soul down to a nub.
vi
Statement of contributions of collaborators I hereby declare that I, Tolulope David Awobusuyi, am the sole author of this
thesis and that no part of the work presented in this document has been submitted or
accepted for any other degree.
Dr. Boguslaw Kruczek and Dr. F. Handan Tezel supervised this thesis. Both
provided continued guidance during the course of the work carried out and editorial
comments to the final version of this thesis. David Carter and Lauren Rose co-authored
the paper on characterization of RO membranes using ammonium sulfate and the basic
solution-diffusion model. The role of the author of this thesis was to carry out
experiments in the laboratory, to determine the correct way of calculating osmotic
pressures for all experiments, and to edit several versions of the paper before publication.
An M.Eng. report was also submitted by the author of this thesis from the work done.
The responsibilities designated and carried out by the author, Tolulope
Awobusuyi, in completion of this thesis were:
1. Carry out experiments studies to determine the feasibility of using reverse osmosis
and low pressure reverse osmosis membranes to concentrate ammonia as found in
anaerobic digestate,
2. Characterize the membranes using phenomenological (solution-diffusion and Kedem-
Katchalsky) and mechanistic (Donnan steric pore model) models,
3. Characterize the membranes using pure water, ammonium sulphate, and tripotassium
phosphate,
4. Determine the stoichiometric nature or otherwise of the rejection of ions comprising a
solute and the effect of pH on the stoichiometric nature, and
5. Prepare a written thesis in partial fulfillment of the requirements for obtaining a
M.A.Sc. degree in Chemical Engineering.
vii
Table of Contents
Abstract.......................................................................................................................................ii
Résumé........................................................................................................................................iii
Thesis Acknowledgement.........................................................................................................v
Statement of contributions of collaborators.......................................................................vi
List of Figures.............................................................................................................................x
List of Tables...........................................................................................................................xiii
Chapter 1: Introduction...........................................................................................................11.1 Overview.........................................................................................................................................11.2 Objectives.......................................................................................................................................21.3 References......................................................................................................................................3
Chapter 2: Literature review..................................................................................................4
2.1 Overview.........................................................................................................................................42.2 Membranes: Types, Characterization models, and Commercial uses..............................5
2.2.1 Membrane types......................................................................................................................................52.2.2 Characterization models......................................................................................................................52.2.3 Commercial uses....................................................................................................................................8
2.3 Conclusions.................................................................................................................................112.4 References...................................................................................................................................12
Chapter 3: Characterization and Optimization of a Membrane Separation Process
for the Concentration of Ammonium from Anaerobic Digesters as Ammonium
Sulfate to be used as Fertilizer and Enhance Biogas Production.................................19
Abstract..............................................................................................................................................203.1 Introduction................................................................................................................................223.2 Experimental..............................................................................................................................24
3.2.1 Setup & Equipment.............................................................................................................................243.2.2 Deionized water permeation experiments...................................................................................263.2.3 Deionized water and ammonium sulfate permeation experiments.....................................26
3.3 Results and Discussion.............................................................................................................28
viii
3.3.1 Deionized water permeation experiment results......................................................................283.3.2 Fluxes for various concentrations of (NH4)2SO4 at manufacturer specified applied
pressure.............................................................................................................................................................303.3.3 Permeate compositions for various concentrations of (NH4)2SO4 at manufacturer
specified applied pressure...........................................................................................................................343.3.4 Effect of pressures exceeding the manufacturer specified pressure for membrane GE
AG.......................................................................................................................................................................383.4 Conclusions.................................................................................................................................433.5 Acknowledgements....................................................................................................................433.6 References...................................................................................................................................44
Chapter 4: Concentration of ammonium ion from mixed salt aqueous solutions
using commercial LPRO membranes.................................................................................47
Abstract..............................................................................................................................................484.1 Introduction............................................................................................................................494.2 Theoretical Background.......................................................................................................504.3 Experimental...........................................................................................................................52
4.3.1 Permeation and separation experiments.................................................................................524.3.2 Investigated membranes and experimental design..............................................................54
4.4. Results and Discussion.........................................................................................................554.4.1 Deionized water permeation tests.............................................................................................554.4.2 Single salt separation experiments...........................................................................................574.4.3 Mixed-salt experiments................................................................................................................68
4.5 Conclusions............................................................................................................................774.6 Acknowledgements...............................................................................................................784.7 References...............................................................................................................................79
Chapter 5: Characterization of Low Pressure RO membranes for Removal and
Concentration of Ammonia from Anaerobic Digestate using Donnan Steric Pore
Model.........................................................................................................................................84
Abstract..............................................................................................................................................855.1 Introduction...........................................................................................................................865.2 Theoretical background......................................................................................................885.3 Experimental...........................................................................................................................92

ix
5.4 Results.....................................................................................................................................945.4.1 Effect of feed pressure and pH on membrane performance: Non-stoichiometric
rejections...........................................................................................................................................................945.4.2 Effect of ionic properties on rejection..........................................................................................985.4.3 Membrane characterization using DSPM model.....................................................................99
5.5 Conclusions..........................................................................................................................1015.6 Acknowledgements.............................................................................................................1025.7 References..............................................................................................................................104
6.0 Conclusions and Recommendations..........................................................................109
x
List of Figures
Figure 3.1 A schematic of the lab scale setup for reverse osmosis
experiments.
25
Figure 3.2 The deionized water flux for the membranes as function of the
applied pressures.
28
Figure 3.3 The deionized water permeance for the membranes investigated
as a function of the applied pressure. The manufacturer’s given
fluxes are shown for comparison.
29
Figure 3.4 The flux for membranes investigated at the manufacturer
specified applied pressures, under multiple feed
concentrations of (NH4)2SO4.
31
Figure 3.5 The solvent permeance for membranes investigated at the
manufacturer specified applied pressures, under multiple feed
concentrations of (NH4)2SO4.
33
Figure 3.6 The permeate composition and the solute rejection for the
membranes investigated at the manufacturer specified
applied pressures, under multiple feed concentrations of
(NH4)2SO4.
34
Figure 3.7 The solute permeance for the membranes investigated at
the manufacturer specified applied pressures, under
multiple feed concentrations of (NH4)2SO4.
37
Figure 3.8 The flux for experiments conducted under multiple feed
concentrations of (NH4)2SO4 using GE AG membranes at
three different pressures.
39
Figure 3.9 The solvent permeance for experiments conducted under
multiple feed concentrations of (NH4)2SO4 using GE AG
membranes at three different pressures.
40
Figure 3.10 The permeate composition and the solute rejection for 41
xi
experiments conducted under multiple feed concentrations of
(NH4)2SO4 using GE AG membranes at three different
pressures.
Figure 3.11 The solute permeance for experiments conducted under
multiple feed concentrations of (NH4)2SO4 using GE AG
membranes at three different pressures.
42
Figure 4.1 Schematic of the laboratory experimental setup for the
concentration of ammonium sulfate using reverse osmosis
53
Figure 4.2 Plot of permeate fluxes versus pressure differential for the
membranes using deionized water as feed
56
Figure 4.3 Solute rejections as a function of increasing (NH4)2SO4
concentrations in feed
58
Figure 4.4 Solute rejections as a function of increasing pressure
differentials for K3PO4 permeation experiments at 2.5 g.l-1
(dilute), 20 g.l-1 (concentrated), and 40 g.l-1 (very concentrated)
feed concentration
59
Figure 4.5 Permeate fluxes as a function of the osmotic pressure gradients. 60
Figure 4.6 Experimental permeate fluxes as a function of increasing
pressure differentials for K3PO4 permeation experiments at 2.5
g.l-1 (dilute) and 20 g.l-1 (concentrated) feed concentrations..
62
Figure 4.7 Solvent permeances as a function of increasing feed
concentrations using Kedem-Katchalsky model.
63
Figure 4.8 Solvent permeances as a function of increasing pressure
differentials for K3PO4 permeation experiments at 2.5 g.l-1
(dilute) and 20 g.l-1 (concentrated) feed concentrations.
64
Figure 4.9 Solute permeances as a function of increasing feed
concentration using Kedem-Katchalsky model.
65
Figure 4.10 Solute permeances as a function of increasing pressure
differentials for K3PO4 permeation experiments at 2.5 g.l-1
(dilute) and 20 g.l-1 (concentrated) feed concentrations.
67
Figure 4.11 Permeate fluxes as a function of increasing total feed 69
xii
concentrations at a constant NH4+: K+ molar ratio of 3.3:1
found in anaerobic digestate.
Figure 4.12 Permeate fluxes as a function of the mass percentage
contribution of (NH4)2SO4 in a 20 g.l-1 feed solution
71
Figure 4.13 NH4+ rejections as a function of increasing total feed
concentrations following the NH4+: K+ ratio found in anaerobic
digestate
75
Figure 4.14 NH4+ rejections as a function of the mass percentage
contribution of (NH4)2SO4 to a 20 g.l-1 feed solution.
76
Figure 5.1 Schematic of the membrane detailing the locations of the bulk
concentrations, Donnan potentials, and concentrations inside
the membrane, as used in the Donnan steric pore model.
91
Figure 5.2 K+ and PO43- concentrations in permeate as a function of
applied pressure differential.
95
Figure 5.3 NH4+ and SO4
2- concentrations in permeate as a function of
applied pressure differential.
96
xiii
List of Tables
Table 3.1 Selected properties of interest for the membranes used in this
study when tested using 2 g·l-1 NaCl.
25
Table 3.2 Osmotic coefficients reported by Guendouzi et al. for (NH4)2SO4
at 298.15 K.
27
Table 4.1 Properties of LPRO membranes used in this study. 54
Table 4.2 Experimental plan for determining the feasibility of using LPRO
membranes to concentrate ammonium ions in anaerobic
digestate.
55
Table 4.3 Selected characterization properties for three commercially
available membranes used in ammonium rejection experiments.
61
Table 4.4 Diffusivities at infinite dilution, solute radii, and molecular
weights of ions used in mixed-salt experiments.
69
Table 4.5 The ionic feed and permeate concentrations from mixed-salt
permeation experiments at total salt concentrations in feed of 3.3,
6.6, 13.2, and 26.4 g.l-1. The (NH4)2SO4:K3PO4 mass
concentration ratio in the feed was kept constant at 3.12:1.
72
Table 4.6 The ionic feed and permeate concentrations from mixed-salt
permeation experiments at a varying (NH4)2SO4:K3PO4 ratios of
1:3, 1:1, and 3:1 for a total feed concentration of 20 g.l-1.
73
Table 5.1 Diffusivities at infinite dilution, solute radii, feed pH, and
molecular weights of ions and salts used in the experiments in
this study.
93
Table 5.2 Properties of LPRO membranes used in this study. 94
Table 5.3 Membrane parameters determined by the DSPM model using
K3PO4 salt at the specified pressures.
99
Table 5.4 Membrane parameters predicted by the DSPM model using
(NH4)2SO4 solution at the specified pressures.
100
xiv
Table 5.5 Average membrane properties as predicted by the DSPM model
using K3PO4 and (NH4)2SO4 salts
101
1
Chapter 1: Introduction
1.1 Overview Anaerobic digestion is a method used in the treatment of waste products from
farms and municipalities. The process converts organic matter to methane [1] and also
produces biomass, which is a good plant fertilizer. Ammonia (NH3) and ammonium
(NH4)+ are also produced in the digester by the degradation of nitrogen-containing
substances. But the presence of high concentrations of free ammonia is considered toxic
to the digestion process [2]. Ammonia is also required in the production of N-type
fertilizers, which encourages the removal of ammonia from the system. The ammonia
produced can be removed by denitrifying the gas mixtures from the digester and can
either be used in the production of fertilizer [1] or liquefied and reformed to hydrogen gas
[3]. Ammonia can also be continuously removed from the digester by scrubbing the gas
from the digester [4]. After the gas mixture is scrubbed and the ammonia has dissolved in
water, the ammonia-containing solution is acidified by the addition of sulfuric acid to
produce ammonium sulfate. Ammonium is removed by feeding the effluent to a
membrane process. To reject high amounts of NH4+ ions in the retentate, which would be
used as fertilizer, membranes with high solute rejections must be used.
A number of membrane processes can be used to concentrate NH4+ ions in the
retentate: reverse osmosis (RO), low-pressure reverse osmosis (LPRO), nanofiltration
(NF), ultrafiltration (UF), and microfiltration (MF). Of the processes mentioned above,
reverse osmosis and nanofiltration are the most commonly used as they have high solute
rejections [5], [6]. Intensive research in this field has led to the design of reverse osmosis
membranes with greater chemical and mechanical stabilities [5], increased water fluxes
[5], and high solute rejections, which reduce operating costs [5], [6]. LPRO/NF
membranes are also widely used as they provide high fluxes at lower pressures when
compared to RO membranes [7], but these occur at lower solute rejections than observed
for commercial RO membranes [7], [8].
Understanding membrane performance is crucial to improving the effectiveness of
membranes used for separation. This is usually done using transport models for
membrane characterization [9], and these models are classified into two broad groups.
2
Phenomenological models describe the membrane performance in terms of
experimentally measureable parameters such as permeate fluxes and solute rejections and
neglect transport mechanisms within the membrane, while mechanistic models relate the
membrane structure and polymer properties to its performance, providing information on
physical (pore radius and effective membrane thickness) and chemical (membrane
surface charge generated by the nature of the feed and feed pH) properties observed for
the membranes.
1.2 Objectives This thesis aims to study the effectiveness of using reverse osmosis (RO) and low-
pressure reverse osmosis (LPRO) membranes in the removal of ammonium from
anaerobic digester effluent as a method of producing N-type fertilizers with the rejected
portion of the effluent. Three LPRO and two RO membranes were characterized using
aqueous solutions of ammonium sulfate, but testing with other solutions (tripotassium
phosphate and a mixture of tripotassium phosphate and ammonium sulfate) was carried
out using only LPRO membranes. The membranes were also characterized using both
phenomenological and mechanistic models with the experimental results of the salts
tested, and from these the membrane properties (pore radius, effective membrane
thickness and solute and solvent permeances) were determined. The influence of feed
pressure and pH on ionic rejections for ions comprising ammonium sulfate and
tripotassium phosphate was also observed.
This thesis is divided into six chapters. Chapter 1 is an introduction, which gives a
summary of the thesis objectives and the work carried out. Chapter 2 is a literature review
on membrane technology. Chapters 3 to 5 comprise the work carried out for this thesis in
paper format. Chapter 3 focuses on the use of RO membranes in the rejection of
ammonium sulfate. Chapter 4 focuses on the comparison of phenomenological models
and the observation of non-stoichiometric transport through the membranes. Chapter 5
focuses on the use of the Donnan steric pore model to determine the membrane properties
using acidic and alkaline pH salts. A general conclusion based on the limitations and
challenges faced during the course of the thesis is provided in Chapter 6.
3
1.3 References [1] D. M. Babson, K. Bellman, S. Prakash, and D. E. Fennell, “Anaerobic digestion
for methane generation and ammonia reforming for hydrogen production:
Athermodynamic energy balance of a model system to demonstrate net energy
feasibility,” Biomass and Bioenergy, vol. 56, pp. 493–505, 2013.
[2] L. Appels, J. Baeyens, J. Degrève, and R. Dewil, “Principles and potential of the
anaerobic digestion of waste-activated sludge,” Prog. Energy Combust. Sci., vol.
34, no. 6, pp. 755–781, 2008.
[3] J. H. Kim, D. H. Um, and O. C. Kwon, “Hydrogen production from burning and
reforming of ammonia in a microreforming system,” Energy Convers. Manag.,
vol. 56, pp. 184–191, 2012.
[4] S. H. Byeon, B. K. Lee, and B. Raj Mohan, “Removal of ammonia and particulate
matter using a modified turbulent wet scrubbing system,” Sep. Purif. Technol., vol.
98, pp. 221–229, 2012.
[5] K. P. Lee, T. C. Arnot, and D. Mattia, “A review of reverse osmosis membrane
materials for desalination-Development to date and future potential,” J. Memb.
Sci., vol. 370, no. 1–2, pp. 1–22, 2011.
[6] B. Peñate and L. García-Rodríguez, “Current trends and future prospects in the
design of seawater reverse osmosis desalination technology,” Desalination, vol.
284, pp. 1–8, 2012.
[7] N. Hilal, H. Al-Zoubi, N. a. Darwish, a. W. Mohammad, and M. Abu Arabi, “A
comprehensive review of nanofiltration membranes: Treatment, pretreatment,
modelling, and atomic force microscopy,” Desalination, vol. 170, no. 3, pp. 281–
308, 2004.
[8] B. Van der Bruggen, M. Mänttäri, and M. Nyström, “Drawbacks of applying
nanofiltration and how to avoid them: A review,” Sep. Purif. Technol., vol. 63, no.
2, pp. 251–263, 2008.
[9] J. Wang, D. S. Dlamini, A. K. Mishra, M. T. M. Pendergast, M. C. Y. Wong, B. B.
Mamba, V. Freger, A. R. D. Verliefde, and E. M. V Hoek, “A critical review of
transport through osmotic membranes,” J. Memb. Sci., vol. 454, pp. 516–537,
2014.
4
Chapter 2: Literature review
2.1 Overview Anaerobic digestion is a commonly used waste treatment process that
simultaneously produces methane and biomass, both alternative energy sources [1], [2].
The production of methane is a result of bacterial activity on organic matter in the
digestate feed, which contains food products, manure, dead plants, and other carbon-
containing compounds. The particulars of the process are influenced by the pH of the
digestate, the temperature at which anaerobic digestion is taking place, and the digester
retention time. In the presence of nitrogen-containing matter the initial degradation stage
produces ammonia gas and ammonium ions, and increased production of these
compounds results in a decrease in methanogenic activity of the bacteria. Ammonia, as an
inhibitor to methane production via methanogenesis and the digestion process [2]–[4], is
an undesired product and can be removed by reacting the anaerobic digestate with
sulfuric acid. This creates ammonium sulfate in solution, which can be concentrated
using membranes. The concentrate can be used as fertilizer for plants, which is important
to the maintenance of sustainable farms.
The most common methods of ammonia removal from anaerobic digestate are
ion-exchange [5] and membrane contacting [4]. Existing literature proves that ammonium
sulfate can be produced by contacting ammonia found in aqueous solutions with sulfuric
acid in a membrane contactor with high rates of ammonia removal [4], [6]. Literature also
shows increased methane yield for anaerobic digesters equipped with a membrane
contactor for high organic loading rates and increased hydrogen sulfide content [3]. These
results, along with the reduced operating costs of membrane reactors, make membrane
contacting and stripping with sulfuric acid an economically attractive proposition when
compared to existing forms of ammonia removal.
Solids content in anaerobic digestate is a major inhibitor to membrane
performance as fouling leads to decline in permeate fluxes across the membranes [7], [8].
A lot of the solids in anaerobic digestate being larger than 100 µm [9], both coarse and
fine filtration steps are necessary to prepare the anaerobic digestate for use with
membranes. An existing study reported significant flux reductions for reverse osmosis

5
experiments conducted with digestate filtered to 100-µm particle size as compared to
experiments using deionized water [10]. In the paper, these reductions in flux were
caused by fouling and were more pronounced at lower ionic concentrations. Masse et al.,
in their review article, write that manure for reverse osmosis treatment has to undergo
multiple pretreatment steps, and it is the usual practice to filter manure down to 10-µm
particles before contacting it with reverse osmosis (RO) or low pressure reverse osmosis
(LPRO) membranes [8].
2.2 Membranes: Types, Characterization models, and Commercial uses
2.2.1 Membrane types
Membrane classification is based on certain properties intrinsic to the membranes:
the materials used in the membrane fabrication, the pore sizes of the membranes, and the
membrane structure. Materials used in membrane fabrication are ceramics, polymers,
glass, and metal alloys [11], [12]. The materials used depend on the desired application,
and in the case of RO/LPRO separations the overwhelming majority of the membranes
are polymeric in nature [11]–[13]. Common polymers include: polysulfones [11], [12],
[14], [15], polyamides, polyfuranes [12], [16]–[18], and cellulose acetate[19]–[24].
Another common classification method is the pore size method. This is based on
the understanding that solute rejection is primarily a result of size exclusion. In this
classification the membranes are either porous (ultrafiltration and microfiltration) or
dense (reverse osmosis and nanofiltration). The distinctions are not clear-cut, leading to
more specific classifications such as low-pressure reverse osmosis (LPRO), which falls
between reverse osmosis and nanofiltration. The pore sizes also determine the rejection
performance of the membranes.
2.2.2 Characterization models
Currently available models for characterizing RO/LPRO membranes do not
always provide adequate descriptions for the membrane properties. Solute rejections
usually depend on the combined interactions of sieving, electrical and dielectric effects
[25]–[27], and the interrelationship among these three effects is not always understood.
These limitations, along with the complexities involved in understanding the electrical
6
transport mechanisms, require complex modeling before ionic transport through
membranes can be properly interpreted.
Models can be grouped according to the following criteria: membrane porosity
and model dependence on transport mechanisms across the membrane. Dense membranes
are classified as non-porous, and according to Wang: “separation is a result of differences
in solubility and diffusivity of permeates.” [13]. The most common models used in
characterizing these membranes are the solution-diffusion and the irreversible
thermodynamics model. The pore flow model is the most common model used in
describing transport through a porous membrane [13].
Model classification according to dependence on transport mechanisms result in
two classes of models: mechanistic and phenomenological models. The mechanistic
models account for ion transport through the membrane. According to Ahmed (2013),
these models “integrate the physical and chemical factors of both the membrane and the
solution to deliver a complete picture of the interactions between the filtering solution
and the membrane” [27]. These are used especially with NF/LPRO membranes, as
literature on the subject agrees that sieving, electrical and dielectric effects govern the
rejection abilities of liquid separation membranes in addition to size exclusion [27]–[29],
and any model used in characterization must take these into consideration. Ionic transport
as a function of electrostatic interaction on the membrane surface is accounted for by the
presence of fixed charge groups on the membrane surface, which interact with charged
solutes in the feed [30]. The extended Nernst-Planck equation takes these effects into
account [27], [28], and is used in combination with a number of models: the space charge
pore model and the Teorell-Meyer-Sievers (TMS) model being two examples [28], [31].
The TMS model assumes a uniformity in the ionic concentration and electrical potential
across the pore, it being primarily concerned with ionic transportation in an axial
direction, through the membrane [27], [30]. It is also regarded as a simpler model than
the space-charge model [30]. The extended Nernst-Planck equation has also been
combined with a concentration polarization model to determine the rejection
characteristics of organic and inorganic compounds, with the conclusion that for charged
inorganic compounds the contributions of the diffusive, convective, and electric field
gradient transport mechanisms are important parameters [28], [32]. It was also concluded

7
that uncharged organic compounds were primarily transported by the diffusive and
convective mechanisms [32].
The ubiquity of the extended Nernst-Planck equation in mechanistic modeling can
be attributed to two characteristics: its ability to describe the various ionic transport
mechanisms present in membrane separation and the ease with which it can be combined
with other models. Most recently it has been combined with the Donnan-steric pore
model (DSPM) to account for hindered transport and the effects of the combined
presence of electrical and size exclusion (sieving/steric) mechanisms [27], [33]. Notable
findings include a variable membrane charge density that was dependent on the salt type,
ionic concentration, and ion adsorption [27], [34], and the influence of valence charges
on ionic rejections [34]. Of singular importance is the correlation between the
mechanistic and phenomenological models with respect to describing transport through
the membrane. Cuartas-Uribe reported that the rejections predicted by the DSPM and the
irreversible thermodynamics models corroborated experimental findings using single and
mixed electrolytes in a NF setup [27], [35].
The phenomenological models can be described as “mechanism-independent”
[27], and do not describe ionic transport through the membrane [33]. The membrane is
assumed to be a black box and near to equilibrium during solvent transport [13], [33].
Two of the most commonly used models in the characterization of RO/LPRO
membranes, the solution-diffusion model and the Kedem-Katchalsky model, are
phenomenological in nature. The solution-diffusion model, while being the most common
model used in the characterization of polymeric membranes, has been shown to have
limitations with respect to characterizing RO and LPRO membranes as it does not
account for convective transport through the membranes [36], [37]. This problem is
rectified by the use of the Kedem-Katchalsky model or modifications to this model, such
as the Spiegler-Kedem-Katchalsky model or a combination of the Spiegler-Kedem
combination with liquid film theory [13], [27]. The use of phenomenological models has
been shown to successfully predict separation performance of RO/LPRO/NF membranes,
which is a reason for their enduring use [33].
8
2.2.3 Commercial uses
RO/LPRO has seen extensive use in industrial processes requiring separation or
concentration with a high degree of efficiency. Notable applications of RO/LPRO/NF
include desalination [12], [16], [38]; the purification of ground water, wastewater [39]–
[41], and industrial effluents; pharmaceutical separations requiring high rejections of
specific ions or compounds [37], [42], [43]; ammonia removal from animal waste
products on farms [44], [45]. The focus of this thesis is the investigation of ammonia
removal from animal wastes using RO and LPRO membranes as a commercially feasible
application. Considering the objectives of the work done in this thesis, only the
applications of membranes in the wastewater treatment and ion removal from waste will
be discussed further.
Ground water, wastewater, and industrial effluents
Strict laws regarding the ionic content of water disposed into the world’s oceans
demand that wastewater fed to the water bodies are in compliance with environmental
regulations provided by national or international laws. To this end, industries have to
ensure that wastewater produced from facilities are routinely treated, and there is ongoing
research into the most effective methods of treatment available.
The application of membrane separation processes to the removal of organics and
particulate matter present in groundwater, wastewater, and industrial effluents has been
extensively studied and documented [27], [46]. High multivalent ion rejections of Ca2+,
Mg2+, and SO42-, equal to or greater than 80 percent, have been routinely observed for
RO/NF membranes in studies detailing the rejections of these ions in industrial processes
[46]–[48]. In pulp and paper industries, membrane separation processes are routinely
used to remove contaminants such as COD and multivalent ions like Ca2 in the process
effluents [46], [47], [49]. In wastewater treatment, where the removal of contaminants is
prioritized, membrane technology has been proven to yield water removal rates greater
than 95% [27], [50]. Membrane separation processes are also applied for their abilities to
produce high-purity permeates, as they are able to effectively reject most of the ions,
bacteria, and viruses present in wastewater [11], [30], [46], [51].

9
RO/LPRO/NF processes have also been used in the purification of dye-containing
effluents [40], [41], [52]. Rejections above 90 percent have been observed for color
removal for processes using NF [27], [41], [53], and dye rejections using RO/LPRO/NF
processes are usually in the 99th percentile [39]–[41], [54]. COD removal using
RO/LPRO membranes is also excellent, with a 98 % average COD removal recorded for
RO/LPRO processes [41]. A comparison of the physicochemical processes used for dye
and COD removals indicates that membrane separation processes outperform other
techniques, with Chitosan adsorption being the only process yielding similar results [41],
[55].
Ammonia removal from animal waste
Anaerobic digestate, which comprises manure, farm wastes, and occasionally
municipal wastes, is high in ammonia content, and this poses substantial problems to
methane production in the digesters and environmental compliance during and after
digestate disposal. Ammonia in anaerobic digesters is a product of converted organic
nitrogen [56], and in the form of ammonia gas is known as a major inhibitor to methane
production [1], [57], [58]. Ammonia inhibition is such an important factor in anaerobic
digestion that uncontrolled ammonia activity is known to cause digestate failure [44],
[58], and because of this valuable effort has been expended on ammonia removal
processes from anaerobic digesters. Added to this are ammonia’s negative effects on the
environment: nitrogen-containing matter produces 1.5 to 2.6 tons of CO2 per ton of
nitrogen [45]; and ammonia in nature is directly responsible for eutrophication [44].
Some of the most common technologies proposed for ammonia removal are ion
exchange [5], [58], electrochemistry [58], gas stripping using air or steam, membrane
contacting [4], fuel cells [58], and membrane technology [44], [45]. Membrane
technology promises rejections as high as the other methods used while operating at
reduced costs. Membrane technology is also an attractive alternative because of its
environmentally benign nature: as it requires no external chemicals for operation it
produces no new waste of its own. The compactness of membrane modules is an added
attractiveness to the process: with the use of spiral wound modules large effective surface

10
areas can be packed into compact modules, leading to optimization in equipment area and
reduced capital costs.
RO and LPRO membranes are used in the rejection of ammonium ions in
anaerobic digestate and aqueous solutions because they have been shown to reject as
much as 97% of the ammonium content present in the feed [19], [44]. RO and LPRO
membranes generally have higher rejection rates than NF membranes. Some NF
membranes, for example, have shown 30% ammonium rejections and other NF
membranes have shown ammonium rejections as high as 82% [44], [45]. This large
variation in ammonium rejections is arguably due to the differences in pH, membrane
morphology, ion-ion interaction, and ion-membrane interaction across the available
membranes. A series of tests using NF270 shows that the ammonium rejection increases
with an increase in pH [45]. This was attributed to the combined effects of the surface
charge of the membrane in relation to the NH4+ ion, the presence of phosphorus-
containing ions in the dairy manure, and the changes in the membrane morphology with
increasing pH [45].
Desalination
Perhaps the most common application of RO/LPRO membranes today,
desalination involves the purification of seawater by membrane separation processes to
provide potable water for communities [59]. It is an increasingly common method for
providing potable water to large communities in arid regions of the world, where water
scarcity is chronic and increasingly severe due to population explosions. It is estimated
that at least 300 million people worldwide depend on desalination for their daily water
intake, solely or in part [60]. The usefulness of desalination is most appreciated in Israel,
where it provides a quarter of the nation’s water supply [61]. In 2009, there were more
than 15,000 desalination plants in operation worldwide, and the total production capacity
of these plants was 37 million m3 of water per day [16]. In 2015 that number is
approximately 66 million m3/day with over 17,000 plants in 150 countries [60], [61].
Desalination processes are widely applied for many reasons. RO processes are
popular because the rejection abilities of RO membranes are high for many of the ions
11
found in seawater and brackish water. The processes also require no chemical additives
for the processes [62], leading to the production of environmentally benign wastes.
As membrane separation processes separate solutes from the solvent by the
preferential permeation of solvent through the membrane, the retentate portion is more
concentrated than the incoming feed. Desalination plants are no exception to this
behavior [63], and solute concentration in the retentate is considered to be a major
environmental issue as it could disturb the ecological balance of the water body the
retentate is introduced to [63], [64]. Other environmental issues are the dangers of
impingement and entrainment of aquatic organisms in the vicinities of the desalination
plants [18], [64]; noise pollution [63]; and the presence of pretreatment residuals, such as
antiscalants and coagulants [18], [64]. These issues are addressed in the WHO
Desalination for Safe Water Supply, Guidance for the Health and Environmental Aspects
Applicable to Desalination report, published in 2007 [18], and include such solutions as:
careful site selection away from oil and gas plants and further offshore [18], [64];
improved dispersion techniques for the retentate stream [63]; and continued monitoring
of the impact of desalination on marine waters [18].
2.3 Conclusions The influence of membrane separation processes on modern society is far-
reaching: from the desalination plants of the Arabian Gulf to the manufacture of fertilizer
from anaerobic digestate in Europe and North America, and the astonishing success of
the process can be attributed to its ability to deliver high ionic rejections for applications
requiring a high degree of purity. The application of membrane to the removal of
ammonia from animal wastes is especially promising for this thesis, as high rejections
have been observed. Being a relatively new field, however, the mechanisms involved in
solute and solvent transport are not completely understood, and the gaps in knowledge
are most revealing in models used in membrane characterization. Modeling is challenging
because the parameters affecting membrane performance are not always adequately
defined, leading to a plentitude of models available to the researcher or engineer seeking
to use RO/NF technology for a given purpose. Another limitation is the considerable
12
overlap between the characteristics that determine the class any given membrane belongs
to, which makes any attempt at a limpid classification of the membranes difficult.
Despite the gaps in knowledge, membrane separation processes have showed
consistently better performances in separation applications than a lot of currently
available technology. A simplified design schematic, lower energy requirements,
compact packing via the tubular configuration, and reduced recurring costs are the
advantages of the processes, and the resulting predominance of RO/LPRO/NF
membranes in desalination is an indicator of the potential inherent in membrane studies
as a major process in chemical engineering.
2.4 References [1] Y. Chen, J. J. Cheng, and K. S. Creamer, “Inhibition of anaerobic digestion
process: A review,” Bioresour. Technol., vol. 99, no. 10, pp. 4044–4064, 2008.
[2] O. Yenigün and B. Demirel, “Ammonia inhibition in anaerobic digestion: A
review,” Process Biochem., vol. 48, no. 5–6, pp. 901–911, 2013.
[3] B. Lauterböck, M. Nikolausz, Z. Lv, M. Baumgartner, G. Liebhard, and W. Fuchs,
“Improvement of anaerobic digestion performance by continuous nitrogen removal
with a membrane contactor treating a substrate rich in ammonia and sulfide,”
Bioresour. Technol., vol. 158, pp. 209–216, 2014.
[4] B. Lauterböck, M. Ortner, R. Haider, and W. Fuchs, “Counteracting ammonia
inhibition in anaerobic digestion by removal with a hollow fiber membrane
contactor,” Water Res., vol. 46, no. 15, pp. 4861–4869, 2012.
[5] T. Wirthensohn, F. Waeger, L. Jelinek, and W. Fuchs, “Ammonium removal from
anaerobic digester effluent by ion exchange,” Water Sci. Technol., vol. 60, no. 1,
pp. 201–210, 2009.
[6] S. N. Ashrafizadeh and Z. Khorasani, “Ammonia removal from aqueous solutions
using hollow-fiber membrane contactors,” Chem. Eng. J., vol. 162, no. 1, pp. 242–
249, 2010.
[7] J. E. Kilduff, S. Mattaraj, and G. Belfort, “Flux decline during nanofiltration of
naturally-occurring dissolved organic matter: Effects of osmotic pressure,
13
membrane permeability, and cake formation,” J. Memb. Sci., vol. 239, no. 1, pp.
39–53, 2004.
[8] L. Masse, D. I. Massé, and Y. Pellerin, “The use of membranes for the treatment of
manure: a critical literature review,” Biosyst. Eng., vol. 98, no. 4, pp. 371–380,
2007.
[9] K. Koirala, P. M. Ndegwa, H. S. Joo, C. Frear, C. O. Stockle, J. H. Harrison, and
V. Velsen, “Impact of Anaerobic Digestion of Liquid Dairy Manure on Ammonia
Volatilization Process,” Trans. ASABE, vol. 56, no. 5, pp. 1959–1966, 2013.
[10] L. Thörneby, K. Persson, and G. Trägårdh, “Treatment of Liquid Effluents from
Dairy Cattle and Pigs using Reverse Osmosis,” J. Agric. Eng. Res., vol. 73, no. 2,
pp. 159–170, 1999.
[11] A. Westgate, “Evaluation Of Novel Polyethersulfone Membranes Incorporating
Charged Surface Modifying Macromolecules For The Removal Of
Pharmaceuticals And Endocrine Disrupting Compounds From Drinking Water,”
University of Ottawa, 2008.
[12] K. P. Lee, T. C. Arnot, and D. Mattia, “A review of reverse osmosis membrane
materials for desalination-Development to date and future potential,” J. Memb.
Sci., vol. 370, no. 1–2, pp. 1–22, 2011.
[13] J. Wang, D. S. Dlamini, A. K. Mishra, M. T. M. Pendergast, M. C. Y. Wong, B. B.
Mamba, V. Freger, A. R. D. Verliefde, and E. M. V Hoek, “A critical review of
transport through osmotic membranes,” J. Memb. Sci., vol. 454, pp. 516–537,
2014.
[14] D. Libotean, J. Giralt, R. Rallo, Y. Cohen, F. Giralt, H. F. Ridgway, G. Rodriguez,
and D. Phipps, “Organic compounds passage through RO membranes,” J. Memb.
Sci., vol. 313, no. 1–2, pp. 23–43, 2008.
[15] M. E. Williams, “A Brief Review of Reverse Osmosis Membrane Technology,” in
Engineering, 2003, pp. 1–29.
[16] L. F. Greenlee, D. F. Lawler, B. D. Freeman, B. Marrot, and P. Moulin, “Reverse
osmosis desalination: Water sources, technology, and today’s challenges,” Water
Res., vol. 43, no. 9, pp. 2317–2348, 2009.
[17] R. W. Baker, Membrane Technology and Applications, 2nd Editio. West Sussex:
14
John Wiley & Sons, Ltd, 2004.
[18] WHO, “Desalination for Safe Water Supply- Guidance for the Health and
Environmental Aspects Applicable to Desalination,” Public Heal. Environ. World
Heal. Organ. Geneva 2007 World Heal., p. 173, 2007.
[19] A. Bódalo, J. L. Gómez, E. Gómez, G. León, and M. Tejera, “Ammonium removal
from aqueous solutions by reverse osmosis using cellulose acetate membranes,”
Desalination, vol. 184, no. 1–3, pp. 149–155, 2005.
[20] S. Basu, A. L. Khan, A. Cano-Odena, C. Liu, and I. F. J. Vankelecom,
“Membrane-based technologies for biogas separations.,” R. Soc. Chem., vol. 39,
no. 2, pp. 750–768, 2010.
[21] N. G. Voros, Z. B. Maroulis, and D. Marinos-Kouris, “Salt and water permeability
in reverse osmosis membranes,” Desalination, vol. 104, no. 3, pp. 141–154, 1996.
[22] D. Carter, L. Rose, T. Awobusuyi, M. Gauthier, F. H. Tezel, and B. Kruczek,
“Characterization of commercial RO membranes for the concentration of ammonia
converted to ammonium sulfate from anaerobic digesters,” Desalination, vol. 368,
pp. 127–134, 2015.
[23] Y. Zhao and J. S. Taylor, “Incorporation of osmotic pressure in an integrated
incremental model for predicting RO or NF permeate concentration,”
Desalination, vol. 174, no. 2, pp. 145–159, 2005.
[24] D. R. Paul, “Reformulation of the solution-diffusion theory of reverse osmosis,” J.
Memb. Sci., vol. 241, no. 2, pp. 371–386, 2004.
[25] A. E. Yaroshchuk, “The role of imperfections in the solute transfer in
nanofiltration,” J. Memb. Sci., vol. 239, no. 1, pp. 9–15, 2004.
[26] C. Bellona, J. E. Drewes, P. Xu, and G. Amy, “Factors affecting the rejection of
organic solutes during NF/RO treatment - A literature review,” Water Res., vol. 38,
no. 12, pp. 2795–2809, 2004.
[27] F. N. Ahmed, “Modified Spiegler-Kedem Model to Predict the Rejection and Flux
of Nanofiltration Processes at High NaCl Concentrations,” University of Ottawa,
2013.
[28] W. R. Bowen, a. W. Mohammad, and N. Hilal, “Characterisation of nanofiltration
membranes for predictive purposes - Use of salts, uncharged solutes and atomic
15
force microscopy,” J. Memb. Sci., vol. 126, no. 1, pp. 91–105, 1997.
[29] D. X. Wang, L. Wu, Z. D. Liao, X. L. Wang, Y. Tomi, M. Ando, and T. Shintani,
“Modeling the separation performance of nanofiltration membranes for the mixed
salts solution with Mg2+ and Ca2+,” J. Memb. Sci., vol. 284, no. 1–2, pp. 384–
392, 2006.
[30] L. D. Nghiem, “Removal of emerging trace organic contaminants by nanofiltration
and reverse osmosis,” University of Wollongong, 2005.
[31] X.-L. Wang, W.-J. Shang, D.-X. Wang, L. Wu, and C.-H. Tu, “Characterization
and applications of nanofiltration membranes: State of the art,” Desalination, vol.
236, no. 1–3, pp. 316–326, 2009.
[32] Y. Yoon and R. M. Lueptow, “Removal of organic contaminants by RO and NF
membranes,” J. Memb. Sci., vol. 261, no. 1–2, pp. 76–86, 2005.
[33] W. R. Bowen and J. S. Welfoot, “Modelling the performance of membrane
nanofiltration-critical assessment and model development,” Chem. Eng. Sci., vol.
57, no. 7, pp. 1121–1137, 2002.
[34] J. Schaep, C. Vandecasteele, a. W. Mohammad, and W. R. Bowen, “Analysis of
the Salt Retention of Nanofiltration Membranes Using the Donnan–Steric
Partitioning Pore Model,” Sep. Sci. Technol., vol. 34, no. 15, pp. 3009–3030, 1999.
[35] B. Cuartas-Uribe, M. C. Vincent-Vela, S. Álvarez-Blanco, M. I. Alcaina-Miranda,
and E. Soriano-Costa, “Prediction of solute rejection in nanofiltration processes
using different mathematical models,” Desalination, vol. 200, no. 1–3, pp. 144–
145, 2006.
[36] B. Van der Bruggen, M. Mänttäri, and M. Nyström, “Drawbacks of applying
nanofiltration and how to avoid them: A review,” Sep. Purif. Technol., vol. 63, no.
2, pp. 251–263, 2008.
[37] a. M. Hidalgo, G. León, M. Gómez, M. D. Murcia, D. S. Barbosa, and P. Blanco,
“Application of the solution-diffusion model for the removal of atrazine using a
nanofiltration membrane,” Desalin. Water Treat., vol. 51, no. 10–12, pp. 2244–
2252, 2013.
[38] C. Fritzmann, J. Löwenberg, T. Wintgens, and T. Melin, “State-of-the-art of
reverse osmosis desalination,” Desalination, vol. 216, no. 1–3, pp. 1–76, 2007.
16
[39] S. K. Nataraj, K. M. Hosamani, and T. M. Aminabhavi, “Distillery wastewater
treatment by the membrane-based nanofiltration and reverse osmosis processes,”
Water Res., vol. 40, no. 12, pp. 2349–2356, 2006.
[40] N. Al-Bastaki, “Removal of methyl orange dye and Na2so4 salt from synthetic
waste water using reverse osmosis,” Chem. Eng. Process. Process Intensif., vol.
43, no. 12, pp. 1561–1567, 2004.
[41] S. Mohana, B. K. Acharya, and D. Madamwar, “Distillery spent wash: Treatment
technologies and potential applications,” J. Hazard. Mater., vol. 163, no. 1, pp.
12–25, 2009.
[42] A. M. Comerton, R. C. Andrews, D. M. Bagley, and C. Hao, “The rejection of
endocrine disrupting and pharmaceutically active compounds by NF and RO
membranes as a function of compound and water matrix properties,” J. Memb.
Sci., vol. 313, no. 1–2, pp. 323–335, 2008.
[43] L. D. Nghiem and S. Hawkes, “Effects of membrane fouling on the nanofiltration
of pharmaceutically active compounds (PhACs): Mechanisms and role of
membrane pore size,” Sep. Purif. Technol., vol. 57, no. 1, pp. 176–184, 2007.
[44] D. . Nurdan Doruk, “A Novel Solution for Biogas Applications in Poultry
Industry: CLAMBS approach,” J. Bioprocess. Biotech., vol. 05, no. 02, 2015.
[45] M. L. Gerardo, N. H. M. Aljohani, D. L. Oatley-Radcliffe, and R. W. Lovitt,
“Moving towards sustainable resources: recovery and fractionation of nutrients
from dairy manure digestate using membranes,” Water Res., vol. 80, pp. 80–89,
2015.
[46] N. Hilal, H. Al-Zoubi, N. a. Darwish, a. W. Mohammad, and M. Abu Arabi, “A
comprehensive review of nanofiltration membranes: Treatment, pretreatment,
modelling, and atomic force microscopy,” Desalination, vol. 170, no. 3, pp. 281–
308, 2004.
[47] Y. Kaya, Z. B. Gönder, I. Vergili, and H. Barlas, “The effect of transmembrane
pressure and pH on treatment of paper machine process waters by using a two-step
nanofiltration process: Flux decline analysis,” Desalination, vol. 250, no. 1, pp.
150–157, 2010.
[48] C. Bartels, R. Franks, S. Rybar, M. Schierach, and M. Wilf, “The effect of feed
17
ionic strength on salt passage through reverse osmosis membranes,” Desalination,
vol. 184, no. 1–3, pp. 185–195, 2005.
[49] M. Mänttäri, M. Kallioinen, a. Pihlajamäki, and M. Nyström, “Industrial
membrane processes in the treatment of process waters and liquors,” Water Sci.
Technol., vol. 62, no. 7, p. 1653, 2010.
[50] R. Rautenbach, T. Linn, and L. Eilers, “Treatment of severely contaminated waste
water by a combination of RO, high-pressure RO and NF - Potential and limits of
the process,” J. Memb. Sci., vol. 174, no. 2, pp. 231–241, 2000.
[51] T. Wintgens, M. Gallenkemper, and T. Melin, “Endocrine disrupter removal from
wastewater using membrane bioreactor and nanofiltration technology,”
Desalination, vol. 146, no. 1–3, pp. 387–391, 2002.
[52] C. S. Slater, R. C. Ahlert, and C. G. Uchrin, “Applications of reverse osmosis to
complex industrial wastewater treatment,” Desalination, vol. 48, no. 2, pp. 171–
187, 1983.
[53] Z. Ji, Y. He, and G. Zhang, “Treatment of wastewater during the production of
reactive dyestuff using a spiral nanofiltration membrane system,” Desalination,
vol. 201, pp. 255–266, 2006.
[54] M. G. Buonomenna, L. C. Lopez, P. Favia, R. d’Agostino, a. Gordano, and E.
Drioli, “New PVDF membranes: The effect of plasma surface modification on
retention in nanofiltration of aqueous solution containing organic compounds,”
Water Res., vol. 41, no. 19, pp. 4309–4316, 2007.
[55] I. G. Lalov, I. I. Guerginov, M. A. Krysteva, and K. Fartsov, “Treatment of waste
water from distilleries with chitosan,” Water Res., vol. 34, no. 5, pp. 1503–1506,
2000.
[56] D. M. Babson, K. Bellman, S. Prakash, and D. E. Fennell, “Anaerobic digestion
for methane generation and ammonia reforming for hydrogen production:
Athermodynamic energy balance of a model system to demonstrate net energy
feasibility,” Biomass and Bioenergy, vol. 56, pp. 493–505, 2013.
[57] L. Appels, J. Baeyens, J. Degrève, and R. Dewil, “Principles and potential of the
anaerobic digestion of waste-activated sludge,” Prog. Energy Combust. Sci., vol.
34, no. 6, pp. 755–781, 2008.
18
[58] J. Desloover, A. Abate Woldeyohannis, W. Verstraete, N. Boon, and K. Rabaey,
“Electrochemical resource recovery from digestate to prevent ammonia toxicity
during anaerobic digestion,” Environ. Sci. Technol., vol. 46, no. 21, pp. 12209–
12216, 2012.
[59] B. Peñate and L. García-Rodríguez, “Current trends and future prospects in the
design of seawater reverse osmosis desalination technology,” Desalination, vol.
284, pp. 1–8, 2012.
[60] I. D. Association, “Desalination by the Numbers | IDA,” Desalination 101, 2014.
[Online]. Available: http://idadesal.org/desalination-101/desalination-by-the-
numbers/. [Accessed: 13-Oct-2015].
[61] A. Little, “Can Desalination Counter California’s Drought? - The New Yorker,”
New Yorker, 2015. [Online]. Available:
http://www.newyorker.com/tech/elements/can-desalination-counter-the-drought.
[Accessed: 13-Oct-2015].
[62] I. Koyuncu, D. Topacik, M. Turan, M. S. Celik, and H. Z. Sarikaya, “Application
of the membrane technology to control ammonia in surface water,” Water Sci.
Technol. Water Supply, vol. 1, no. 1, pp. 117–124, 2001.
[63] R. Einav, K. Harussi, and D. Perry, “The footprint of the desalination processes on
the environment,” Desalination, vol. 152, no. 1–3, pp. 141–154, 2003.
[64] S. Lattemann and T. Höpner, “Environmental impact and impact assessment of
seawater desalination,” Desalination, vol. 220, no. 1–3, pp. 1–15, 2008.

19
Chapter 3: Characterization and Optimization of a Membrane
Separation Process for the Concentration of Ammonium from
Anaerobic Digesters as Ammonium Sulfate to be used as
Fertilizer and Enhance Biogas Production.
D. Carter, L. Rose, T. Awobusuyi, M. Gauthier, F.H. Tezel, B. Kruczek*
Department of Chemical and Biological Engineering University of Ottawa
161 Louis Pasteur, Ottawa, Ontario K1N 6N5, Canada
+ Published in Desalination, April 2015. DOI: 10.1016/j.desal.2015.03.040
* To whom correspondence should be addressed.
Tel: + 613 562-5800 ext. 2047 Fax: +1 613 562-5172 E-mail: [email protected]
20
Abstract
Commercially available thin film composite (TFC) polyamide membrane (GE AG) and
asymmetric cellulose acetate membrane (GE CE) have been characterized using different
concentrations of ammonium sulfate, up to 40 g·l−1, in order to determine their suitability
for the concentration of ammonium as ammonium sulfate from anaerobic digester
digestate. At the manufacturer specified pressures of 1550 kPa and 2900 kPa, the solvent
permeances for the GE AG and the GE CE membranes were found to be 2.1 × 10⁻⁵ and
7.4 × 10⁻⁶ l·m−2·h−1·Pa−1, respectively. These permeances were practically independent
of feed concentration. At the same time, both membranes showed excellent solute
rejections, which decreased slightly with feed concentration, but were generally greater
than 0.99. Consequently, the lower pressure GE AG membranes were considered to be
more suitable for the separation of ammonium sulfate, and they were further tested at
pressures exceeding the manufacturer specified value. These experiments revealed a
slight decrease in solvent permeance for up to 17%, as well as a slight decrease in solute
rejection, which was 0.97 or greater. Given these results, both membranes studied in this
research are suitable for future investigations; first using multi- ion aqueous solutions and
then pre-treated anaerobic digester digestate.
Keywords: Reverse osmosis, anaerobic digester, ammonium sulfate, polyamide
membrane, cellulose acetate membrane.
21
Highlights
• Removal of ammonium sulfate from anaerobic digestate using RO membranes.
• Rejection of ammonium sulfate in excess of 0.99 by GE AG and GE CE
membranes.
• Inadequacy of basic solution-diffusion model to explain permeances and
rejections.
22
3.1 Introduction Background
The implementation of a diverse range of sustainable energy producing
technologies is required in order to mitigate the effects of global warming [1,2], and
satisfy the energy needs of a growing world population. In this study, the application of a
membrane separation process to further improve the economic feasibility of one type of
sustainable energy technology, the anaerobic digestion of organic material to produce
biogas, is investigated. Anaerobic digestion of biomass has been successfully utilized for
many decades as away to produce methane, which can be used to generate heat, and/or
electricity. In this process, organic materials such as plant waste, manure, and restaurant
leftovers are degraded by microbial organisms including methanogens, which in the
absence of oxygenconvert these substrates to microbial biomass, carbon dioxide (CO2)
and methane (CH4) [3]. When a significant amount of nitrogen is present in the organic
feed sources, as is the case for animal manure, this nitrogen is converted to ammonium
(NH4+), which is dissolved in the liquid inside the anaerobic digester. This liquid contains
other components, including sodium, magnesium, potassium and phosphate, as well as
some suspended solids, and is known as the digestate. The ammonium content of the
digestate is of particular interest for two reasons. Firstly, free ammonia (NH3), and
ammonium (NH4+), exist in equilibrium, and have been shown to be responsible for
inhibiting methanogenesis [4–6]. Secondly, ammonia and ammonium are a source of
nitrogen that is easily absorbed by plants, and consequently could be used as fertilizers.
In order to minimize the inhibitory effect of ammonium on the production of
biogas, its concentration in digestate is usually kept below 3.9 g·l−1 [7]. However,
concentrations as high as 7.2 g·l−1 have also been reported [8]. According to Chen et al.
[3], a 50% decrease in methane production may be caused, depending on the origin of
digestate, bythe total amount of ammonia and ammonium nitrogen (TAN) ranging from
1.7 to 14 g·l−1. It is therefore necessary to reduce the concentration of TAN in the
digestate to maximize biogas production. The simplest way to maintain a low
concentration of TAN in digestate is routine purging. However, due to its toxicity to
marine life, the discharge of ammonia is strictly regulated in most countries. For
example, in Canada the maximum concentration of ammonia in a discharged stream
23
cannot exceed 1.25 mg·l−1 at 15 °C [9]. Alternatively, discharged streams containing
ammonia could be used as fertilizers. However, if ammonia is not converted into a stable
form and sufficiently concentrated, the costs for storage and transport to neighboring
farms, where it can be used as a liquid fertilizer, become significant and economically
unfavorable. Therefore, to realize the potential of ammonia present in digestate, its
concentration must be in- creased as much as possible once it has been removed from the
digestate. To this end, several methods of removing and concentrating TAN from
digestate have been investigated. These include, the application of hollow fiber
membranes [10], vibrating reverse osmosis membranes [11], absorption [12], and steam
stripping [13]. Alternatively, TAN present in digestate could be transformed into a stable
form, and then separated. This can be achieved by acidifying digestate with sulfuric acid
to convert TAN into a stable ammonium sulfate solution. In this form, the ammonium
sulfate separated from digestate can be used as a fertilizer, and is a product that can be
readily sold. In 2013 alone, Canada imported 116,000 metric tonnes of ammonium
sulfate, up from 82,000 metric tonnes in 2009 [14]. In this paper, two commercially
available membranes that are designed to be used for desalination are characterized using
aqueous feed solutions of ammonium sulfate that represents the ideal form of acidified
digestate. While the separation of ammonium sulfate from aqueous solution using reverse
osmosis membranes is not expected to be challenging, the information on this separation
is very limited. On the other hand, the separation of ammonium sulfate from aqueous
solutions may potentially become another important application of membranes used in
desalination processes. In this study, the effects of feed concentration and feed pressure
on solvent and solute permeances are investigated. The results of these characterization
experiments can then be used to model the performance of a full scale process consisting
of spiral wound membrane elements, and the economic feasibility of a particular
membrane.
24
3.2 Experimental
3.2.1 Setup & Equipment
Experiments were conducted using the setup whose process flow diagram (PFD)
is shown in Fig. 3.1. The pressure gauges have a maximum pressure rating of 10,500 kPa,
and the valves and fittings are made of 316 stainless steel, and are of Swagelok make.
The pump (P-101) is a Hydracell F-20 single piston diaphragm pump with metallic heads.
It has a maximum rated pressure and flow rate of 7000 kPa and 3.63 l per minute at 1750
rpm. The pump is connected to a JRP 0.5 hp motor. The feed tank is made of high density
polyethylene (HDPE) and has a maximum capacity of 19 l. Feed solutions were made
using 99.997% ammonium sulfate purchased from Sigma Aldrich and deionized water.
The feed solution is cooled inside the tank using a 316 stain- less steel cooling element,
containing ethylene glycol and water as a refrigerant. The external motor cooling fan is a
4 foot high pedestal fan. The static cells are made of 316 stainless steel, and were
manufactured in house at University of Ottawa. The conductivity meter used to measure
the concentration of ammonium sulfate is a CON 6+conductivity meter that was
purchased from Oakton instruments. The rotameters are acrylic, and are able to measure
permeate and retentate flow rates of 0.1–1.0 LPM and 0.4–4.0 LPM, respectively. To
measure lower permeate flow rates, a measured mass of permeate was collected in a pre-
defined period of time. Three static membrane cells were connected in parallel in order to
eliminate any performance biases that may arise from defects in a single membrane, and
to ensure that the feed stream composition entering each membrane was constant. The
two membranes investigated in this study were General Electric (GE) thin film composite
(TFC) polyamide membrane and GE asymmetric cellulose acetate membrane. The
membranes were purchased from Sterlitech (Kent, USA) as flat sheet circular membranes
with diameter of 47mm. The two membranes were chosen such that different material
types, operating pressures, and expected fluxes could be compared. Spiral wound
modules were not experimentally investigated in this study, but are expected to be used
for the full scale process, and therefore their identification codes have been used. The
polyamide membrane will be referred to as GE AG, and the cellulose acetate membrane
will be referred to as GE CE. A summary of the membrane properties is shown in Table
3.1.
25
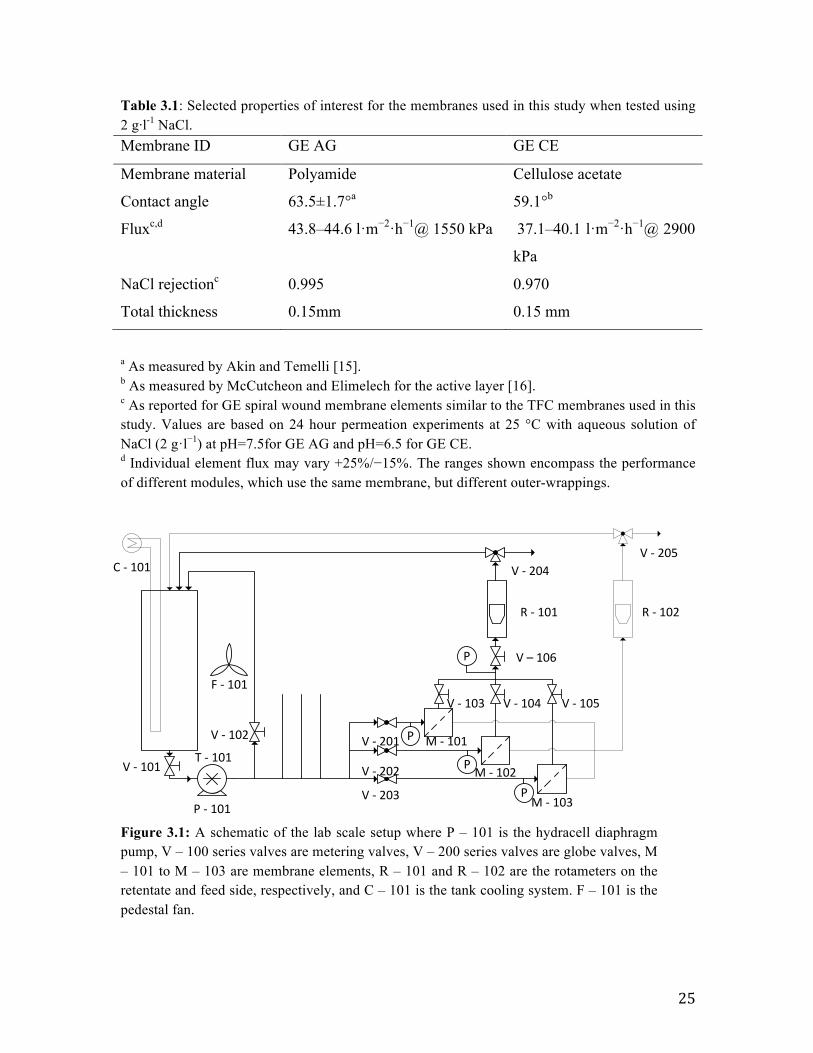
Table 3.1: Selected properties of interest for the membranes used in this study when tested using 2 g·l-1 NaCl. Membrane ID GE AG GE CE
Membrane material Polyamide Cellulose acetate
Contact angle 63.5±1.7°a 59.1°b
Fluxc,d 43.8–44.6 l·m−2·h−1@ 1550 kPa 37.1–40.1 l·m−2·h−1@ 2900
kPa
NaCl rejectionc 0.995 0.970
Total thickness 0.15mm 0.15 mm
a As measured by Akin and Temelli [15]. b As measured by McCutcheon and Elimelech for the active layer [16]. c As reported for GE spiral wound membrane elements similar to the TFC membranes used in this study. Values are based on 24 hour permeation experiments at 25 °C with aqueous solution of NaCl (2 g·l−1) at pH=7.5for GE AG and pH=6.5 for GE CE. d Individual element flux may vary +25%/−15%. The ranges shown encompass the performance of different modules, which use the same membrane, but different outer-wrappings.
Figure 3.1: A schematic of the lab scale setup where P – 101 is the hydracell diaphragm pump, V – 100 series valves are metering valves, V – 200 series valves are globe valves, M – 101 to M – 103 are membrane elements, R – 101 and R – 102 are the rotameters on the retentate and feed side, respectively, and C – 101 is the tank cooling system. F – 101 is the pedestal fan.
T-101
P-101
V-102
V-203
V-202
V-201 M-101
M-102
M-103
V-103 V-104 V-105
V-204V-205
V–106
R-101 R-102
P
P
P
P
C-101
V-101
F-101
26
3.2.2 Deionized water permeation experiments
The relationship between the flux and the applied pressure for each membrane
was determined using deionized water in order to compare the flat sheet membranes used
in this investigation to the manufacturer's specifications for spiral wound membrane
modules. This was achieved by operating the pump at its maximum setting and closing
the metering valve, V-106, as required to achieve the desired applied pressures. The exact
permeate flow rate was then measured until steady state was achieved by collecting a
volume of permeate in a predefined period of time and measuring its mass. The flux JV
[l·m−2·h−1] at each applied pressure was then calculated from:
mAVJ = (1)
where V [l·h−1] is the experimentally determined permeate flow rate and Am [m2] is the
membrane area. The total membrane area, applied pressure, and stream flow rates were
all subject to experimental noise. In order to calculate their influence on the overall
uncertainty standard error equations were used.
3.2.3 Deionized water and ammonium sulfate permeation experiments
The membranes used in this study have been characterized by their manufacturer using
NaCl. To the best knowledge of the authors, characterization data for aqueous ammonium
sulfate containing solutions for the selected membranes have not been reported in the
literature. Assuming the applicability of the solution-diffusion model, the rate equations
for the transport of water JV [l·m−2·h−1] and solute ji [g·m−2·h−1] are described by:
JV = PH2O ΔP −Δπ( ) (2)
ji = P NH4( )2SO4 Cf −Cp( ) (3)
where OHP 2 [l·m-2·h-1·Pa-1] is the permeance of water across the membrane, ( ) 424 SONHP
[l·m-2·h-1] is the permeance of solute across the membrane, ΔP [Pa] is the pressure
differential across the membrane; feed side pressure – permeate side pressure, and Δπ
[Pa] is the osmotic pressure differential across the membrane; feed side – permeate side.
Cf and Cp [g·l-1] are the solute concentrations on the feed and permeate sides of the
membrane, respectively.
27
In order to calculate the osmotic pressure as required for Eq. (2), the modified Van Hoff’t
equation was used:
CRTiφπ = (6)
where i [-] is the number of ions produced during dissociation, C [mol·m-3] is the
concentration of (NH4)2SO4, R [J·mol-1·K-1] is the universal gas constant, T [K] is the
temperature, and φ [-] is the osmotic coefficient, which is tabulated for various pressures
and temperatures by El Guendouzi et al. [17]. This equation shows that at a solute
concentration of 40 g·l-1, the osmotic pressure is approximately 1600 kPa at room
temperature. The osmotic coefficients reported by El Guendozi et al. [17] at 298.15 K
are reproduced in Table 3.2.
The solute rejection Rs [-], which is used to quantify the separation of each membrane
regardless of physical properties, is calculated using the following equation:
1 ps
f
CR
C= − (7)
where Cp and Cf [g·l-1] are the concentration of (NH4)2SO4 in the permeate and feed,
respectively.
Table 3.2: Osmotic coefficients reported by Guendouzi et al. [17] for (NH4)2SO4 at 298.15 K.
(NH4)2SO4 concentration Calculated osmotic coefficients Osmotic pressure
[mol·kg−1] [g·kg−1] ϕ [−] [kPa]
[0.1] [13.2] 0.773 575
[0.2] [26.4] 0.729 1084
[0.3] [39.6] 0.708 1580
[0.4] [52.9] 0.689 2049
Experiments were conducted for multiple feed concentrations of (NH4)2SO4, and at
multiple applied pressures. Each experiment was conducted over a period of 8 h, which
was sufficient to reach steady state conditions. The latter was confirmed by a constant
permeation rate and constant concentration of each stream with respect to time. As there
were no other solutes present in the system, the concentration of (NH4)2SO4 in feed and
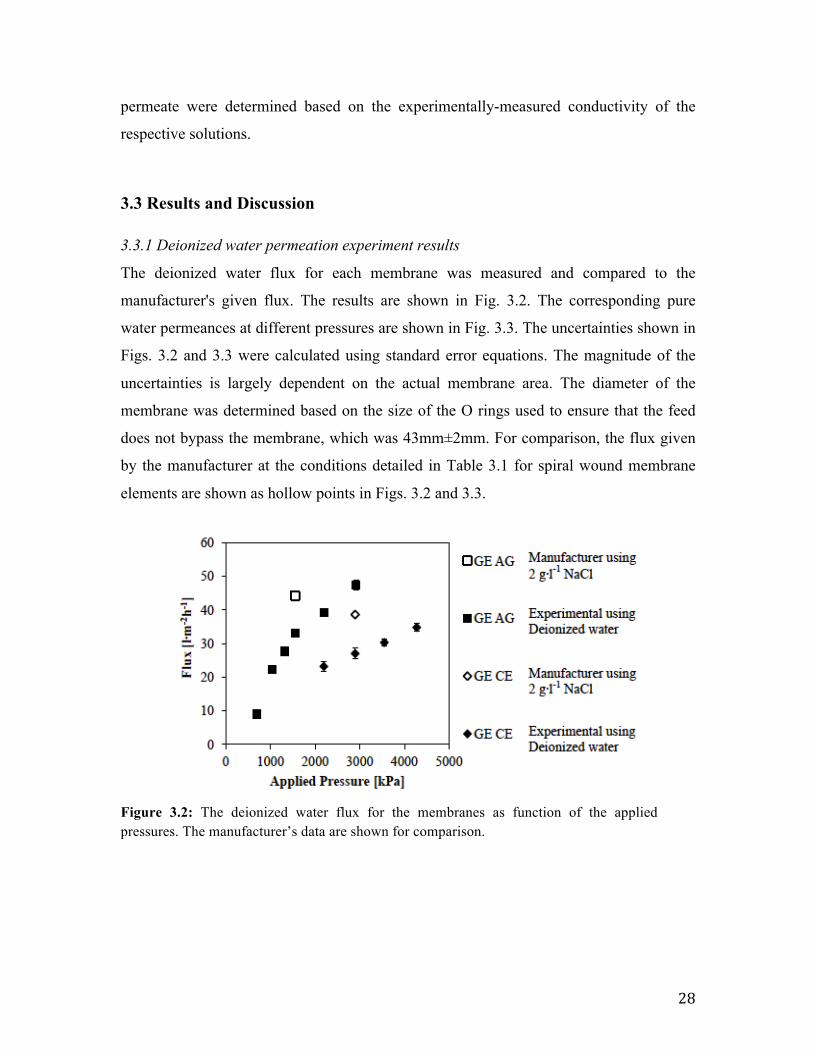
28
permeate were determined based on the experimentally-measured conductivity of the
respective solutions.
3.3 Results and Discussion
3.3.1 Deionized water permeation experiment results
The deionized water flux for each membrane was measured and compared to the
manufacturer's given flux. The results are shown in Fig. 3.2. The corresponding pure
water permeances at different pressures are shown in Fig. 3.3. The uncertainties shown in
Figs. 3.2 and 3.3 were calculated using standard error equations. The magnitude of the
uncertainties is largely dependent on the actual membrane area. The diameter of the
membrane was determined based on the size of the O rings used to ensure that the feed
does not bypass the membrane, which was 43mm±2mm. For comparison, the flux given
by the manufacturer at the conditions detailed in Table 3.1 for spiral wound membrane
elements are shown as hollow points in Figs. 3.2 and 3.3.
Figure 3.2: The deionized water flux for the membranes as function of the applied pressures. The manufacturer’s data are shown for comparison.
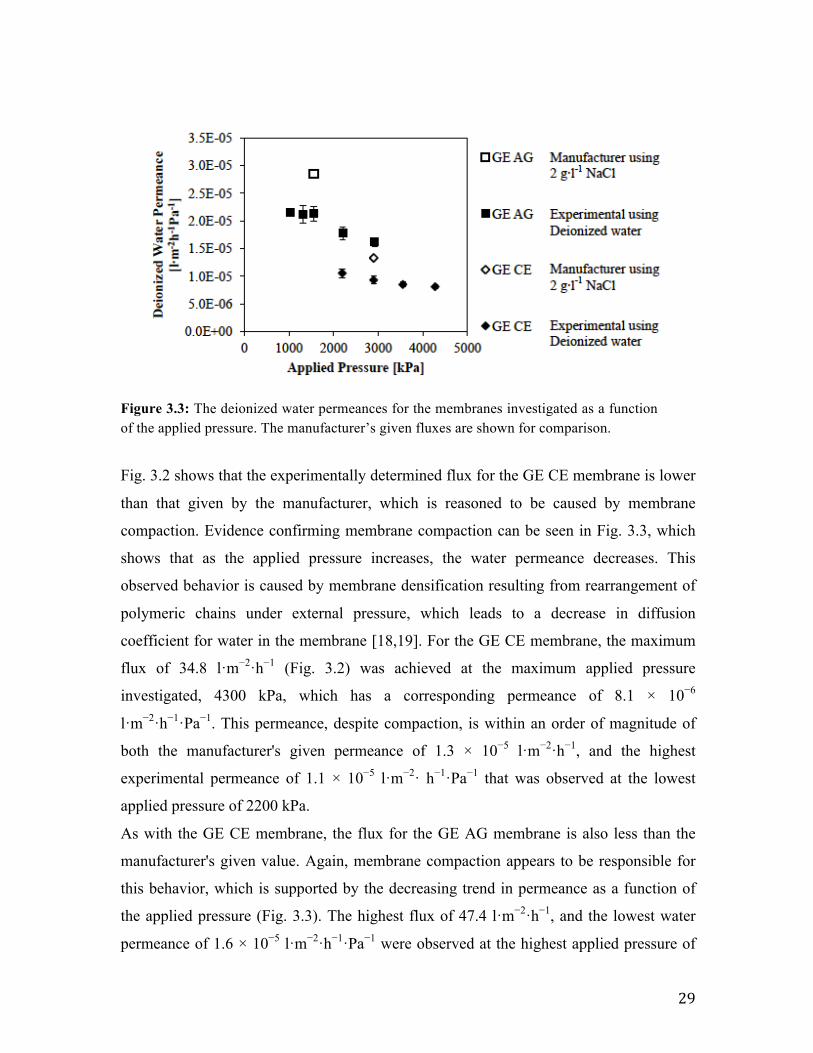
29
Figure 3.3: The deionized water permeances for the membranes investigated as a function of the applied pressure. The manufacturer’s given fluxes are shown for comparison.
Fig. 3.2 shows that the experimentally determined flux for the GE CE membrane is lower
than that given by the manufacturer, which is reasoned to be caused by membrane
compaction. Evidence confirming membrane compaction can be seen in Fig. 3.3, which
shows that as the applied pressure increases, the water permeance decreases. This
observed behavior is caused by membrane densification resulting from rearrangement of
polymeric chains under external pressure, which leads to a decrease in diffusion
coefficient for water in the membrane [18,19]. For the GE CE membrane, the maximum
flux of 34.8 l·m−2·h−1 (Fig. 3.2) was achieved at the maximum applied pressure
investigated, 4300 kPa, which has a corresponding permeance of 8.1 × 10⁻⁶
l·m−2·h−1·Pa−1. This permeance, despite compaction, is within an order of magnitude of
both the manufacturer's given permeance of 1.3 × 10⁻⁵ l·m−2·h−1, and the highest
experimental permeance of 1.1 × 10⁻⁵ l·m−2· h−1·Pa−1 that was observed at the lowest
applied pressure of 2200 kPa.
As with the GE CE membrane, the flux for the GE AG membrane is also less than the
manufacturer's given value. Again, membrane compaction appears to be responsible for
this behavior, which is supported by the decreasing trend in permeance as a function of
the applied pressure (Fig. 3.3). The highest flux of 47.4 l·m−2·h−1, and the lowest water
permeance of 1.6 × 10⁻⁵ l·m−2·h−1·Pa−1 were observed at the highest applied pressure of
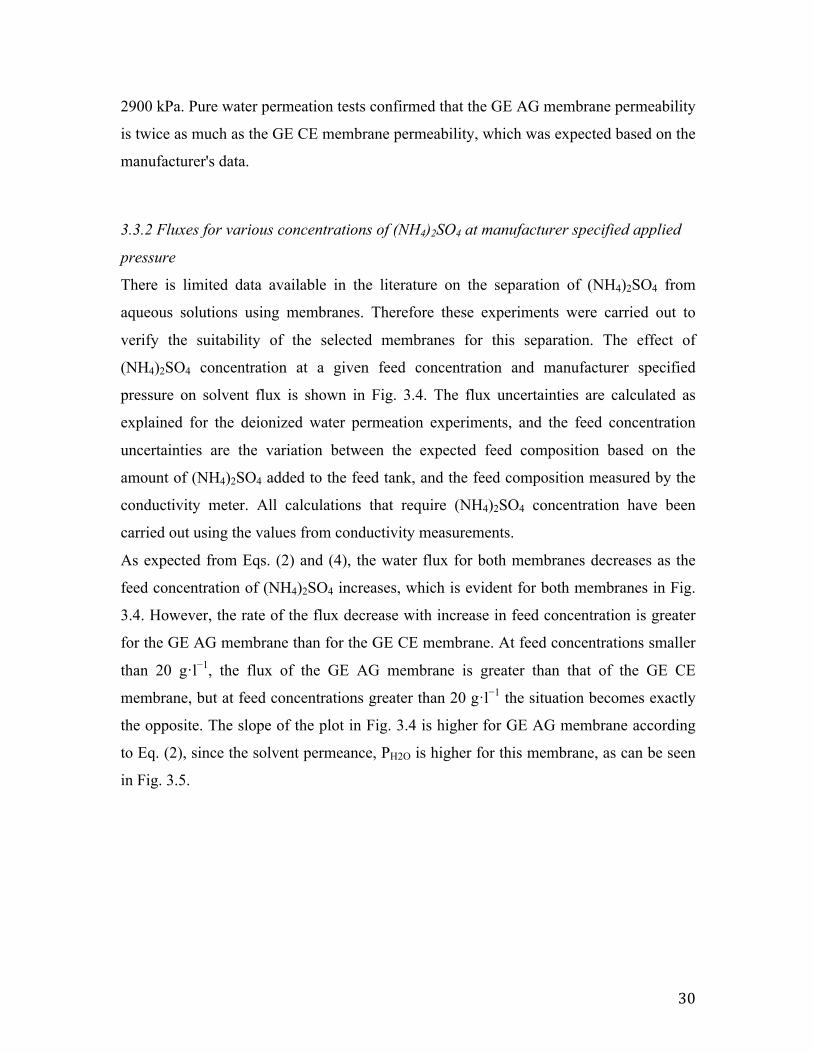
30
2900 kPa. Pure water permeation tests confirmed that the GE AG membrane permeability
is twice as much as the GE CE membrane permeability, which was expected based on the
manufacturer's data.
3.3.2 Fluxes for various concentrations of (NH4)2SO4 at manufacturer specified applied
pressure
There is limited data available in the literature on the separation of (NH4)2SO4 from
aqueous solutions using membranes. Therefore these experiments were carried out to
verify the suitability of the selected membranes for this separation. The effect of
(NH4)2SO4 concentration at a given feed concentration and manufacturer specified
pressure on solvent flux is shown in Fig. 3.4. The flux uncertainties are calculated as
explained for the deionized water permeation experiments, and the feed concentration
uncertainties are the variation between the expected feed composition based on the
amount of (NH4)2SO4 added to the feed tank, and the feed composition measured by the
conductivity meter. All calculations that require (NH4)2SO4 concentration have been
carried out using the values from conductivity measurements.
As expected from Eqs. (2) and (4), the water flux for both membranes decreases as the
feed concentration of (NH4)2SO4 increases, which is evident for both membranes in Fig.
3.4. However, the rate of the flux decrease with increase in feed concentration is greater
for the GE AG membrane than for the GE CE membrane. At feed concentrations smaller
than 20 g·l−1, the flux of the GE AG membrane is greater than that of the GE CE
membrane, but at feed concentrations greater than 20 g·l−1 the situation becomes exactly
the opposite. The slope of the plot in Fig. 3.4 is higher for GE AG membrane according
to Eq. (2), since the solvent permeance, PH2O is higher for this membrane, as can be seen
in Fig. 3.5.
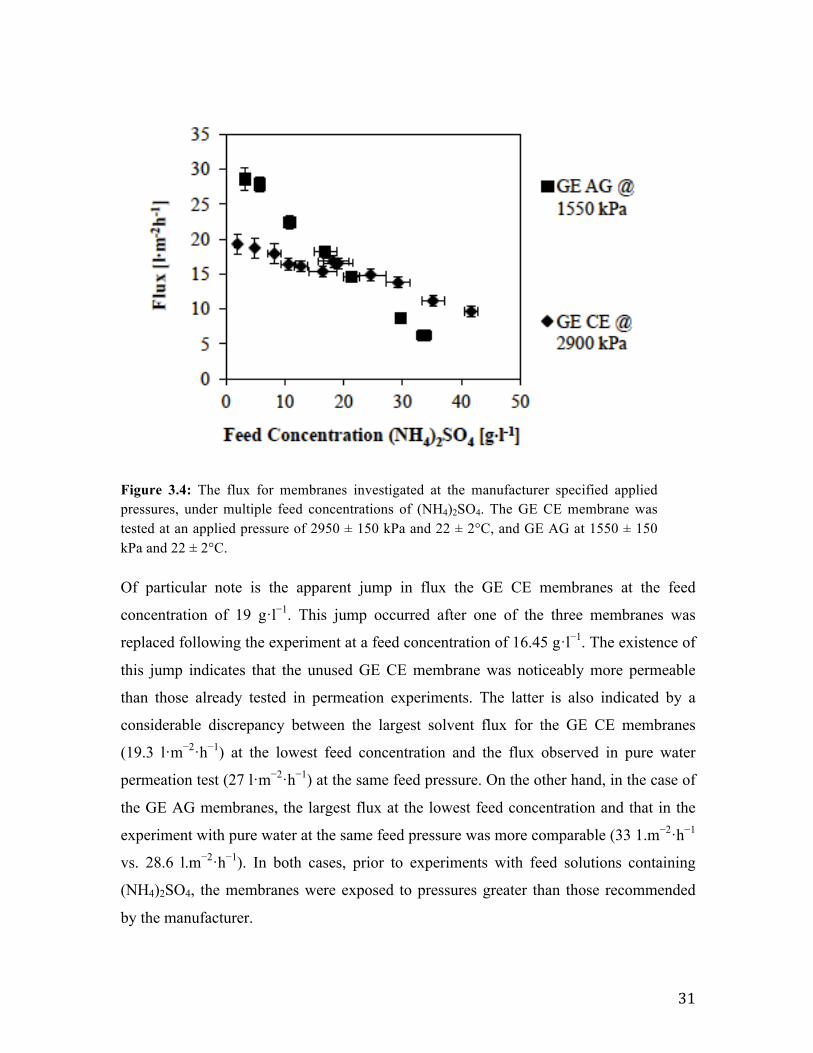
31
Figure 3.4: The flux for membranes investigated at the manufacturer specified applied pressures, under multiple feed concentrations of (NH4)2SO4. The GE CE membrane was tested at an applied pressure of 2950 ± 150 kPa and 22 ± 2°C, and GE AG at 1550 ± 150 kPa and 22 ± 2°C. Of particular note is the apparent jump in flux the GE CE membranes at the feed
concentration of 19 g·l−1. This jump occurred after one of the three membranes was
replaced following the experiment at a feed concentration of 16.45 g·l−1. The existence of
this jump indicates that the unused GE CE membrane was noticeably more permeable
than those already tested in permeation experiments. The latter is also indicated by a
considerable discrepancy between the largest solvent flux for the GE CE membranes
(19.3 l·m−2·h−1) at the lowest feed concentration and the flux observed in pure water
permeation test (27 l·m−2·h−1) at the same feed pressure. On the other hand, in the case of
the GE AG membranes, the largest flux at the lowest feed concentration and that in the
experiment with pure water at the same feed pressure was more comparable (33 1.m−2·h−1
vs. 28.6 l.m−2·h−1). In both cases, prior to experiments with feed solutions containing
(NH4)2SO4, the membranes were exposed to pressures greater than those recommended
by the manufacturer.
32
Solvent fluxes reported in Fig. 3.4 were used to determine the corresponding solvent
permeances from Eq. (2). The osmotic pressure gradient required by Eq. (2) was
calculated from Eq. (4) using the experimental concentrations, and the concentration-
dependent osmotic coefficients listed in Table 3.2. The effect of feed concentration on
solvent permeance for both membranes at their manufacturer recommended pressures is
presented in Fig. 3.5. According to the solution- diffusion model, solvent permeance
should be independent of feed con- centration. This effect is generally seen for the GE
CE membrane at all feed concentrations from 0 to 40 g·l−1, and for the GE AG membrane
at feed concentrations less than 30 g·l−1. At the two largest feed concentrations, the
solvent permeance is up to 50% greater than the value at low feed concentrations for GE
AG membrane. One possible explanation of this unexpected behavior was overestimation
of the osmotic pressure gradient, which would lead to underestimation of the actual
driving force and thus an overestimation of the solvent permeance. On the other hand,
this behavior was not observed for the GE CE membrane. Therefore, this unexpected
behavior is most likely a consequence of the diminished fluxes shown by the GE AG
membranes at high feed concentrations, which is exacerbated as the osmotic pressure
approaches the applied pressure. At these conditions a small error in the experimental
flux may have a great effect on the calculated solvent permeance.
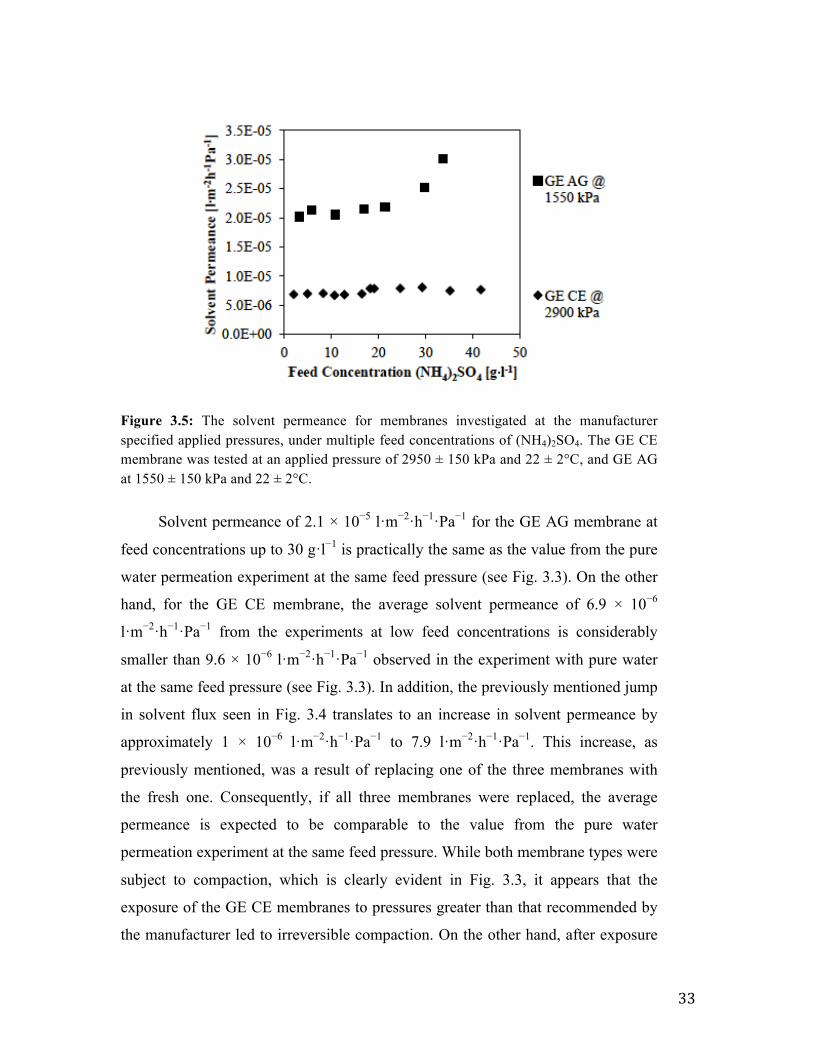
33
Figure 3.5: The solvent permeance for membranes investigated at the manufacturer specified applied pressures, under multiple feed concentrations of (NH4)2SO4. The GE CE membrane was tested at an applied pressure of 2950 ± 150 kPa and 22 ± 2°C, and GE AG at 1550 ± 150 kPa and 22 ± 2°C.
Solvent permeance of 2.1 × 10⁻⁵ l·m−2·h−1·Pa−1 for the GE AG membrane at
feed concentrations up to 30 g·l−1 is practically the same as the value from the pure
water permeation experiment at the same feed pressure (see Fig. 3.3). On the other
hand, for the GE CE membrane, the average solvent permeance of 6.9 × 10⁻⁶
l·m−2·h−1·Pa−1 from the experiments at low feed concentrations is considerably
smaller than 9.6 × 10⁻⁶ l·m−2·h−1·Pa−1 observed in the experiment with pure water
at the same feed pressure (see Fig. 3.3). In addition, the previously mentioned jump
in solvent flux seen in Fig. 3.4 translates to an increase in solvent permeance by
approximately 1 × 10⁻⁶ l·m−2·h−1·Pa−1 to 7.9 l·m−2·h−1·Pa−1. This increase, as
previously mentioned, was a result of replacing one of the three membranes with
the fresh one. Consequently, if all three membranes were replaced, the average
permeance is expected to be comparable to the value from the pure water
permeation experiment at the same feed pressure. While both membrane types were
subject to compaction, which is clearly evident in Fig. 3.3, it appears that the
exposure of the GE CE membranes to pressures greater than that recommended by
the manufacturer led to irreversible compaction. On the other hand, after exposure
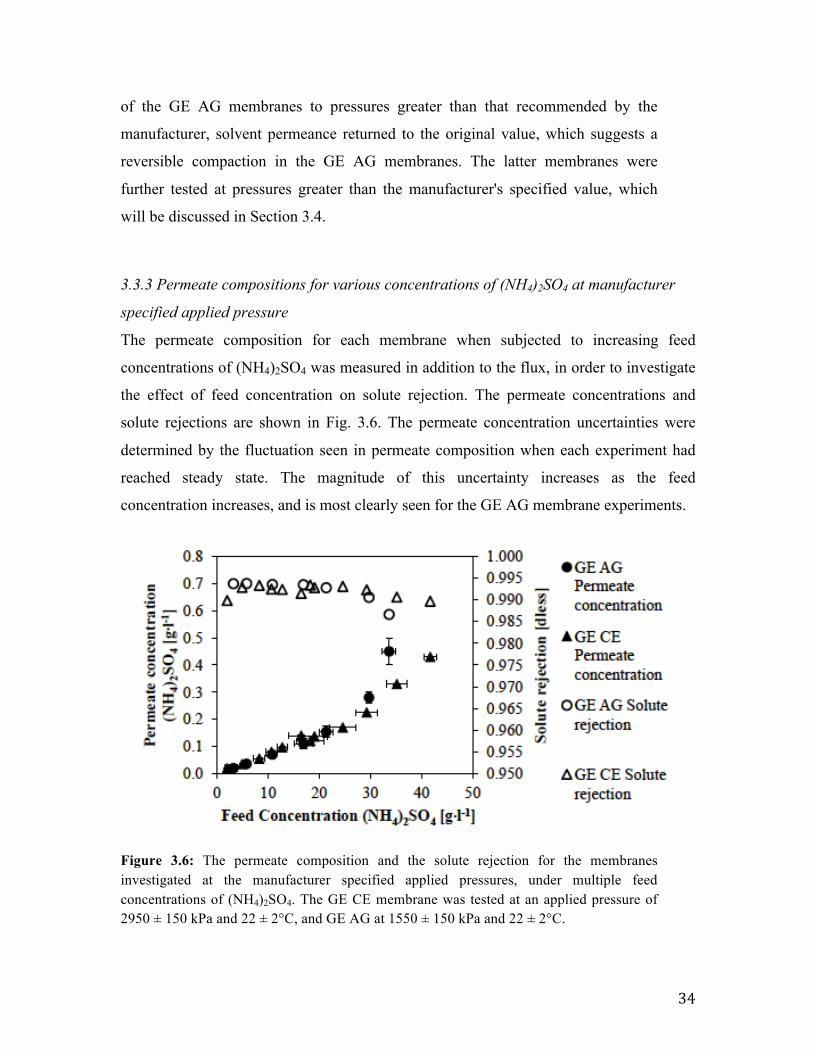
34
of the GE AG membranes to pressures greater than that recommended by the
manufacturer, solvent permeance returned to the original value, which suggests a
reversible compaction in the GE AG membranes. The latter membranes were
further tested at pressures greater than the manufacturer's specified value, which
will be discussed in Section 3.4.
3.3.3 Permeate compositions for various concentrations of (NH4)2SO4 at manufacturer
specified applied pressure
The permeate composition for each membrane when subjected to increasing feed
concentrations of (NH4)2SO4 was measured in addition to the flux, in order to investigate
the effect of feed concentration on solute rejection. The permeate concentrations and
solute rejections are shown in Fig. 3.6. The permeate concentration uncertainties were
determined by the fluctuation seen in permeate composition when each experiment had
reached steady state. The magnitude of this uncertainty increases as the feed
concentration increases, and is most clearly seen for the GE AG membrane experiments.
Figure 3.6: The permeate composition and the solute rejection for the membranes investigated at the manufacturer specified applied pressures, under multiple feed concentrations of (NH4)2SO4. The GE CE membrane was tested at an applied pressure of 2950 ± 150 kPa and 22 ± 2°C, and GE AG at 1550 ± 150 kPa and 22 ± 2°C.

35
According to the solution diffusion model, the transport of solute is driven by the
concentration gradient across the membrane. Therefore, as the concentration of the feed
increases, the rate of the transport of solute increases. At the same time, the rate of the
transport of solvent de- creases, because of an increase in the osmotic pressure gradient,
which diminishes the driving force for the transport of solvent. Consequently, the solute
concentration in permeate was expected to increase with feed concentration with an
upward deviation from linearity. This effect is seen in Fig. 3.6, in particular at higher feed
concentrations. Therefore, considering Eq. (5), the solute rejection was expected to
decrease with increasing feed concentration. According to Fig. 3.6, the solute rejection of
both membranes does indeed slightly decrease with feed concentration. However, the
variation in solute rejection with feed concentration, which is approximately 0.005
(0.5%), is very small. More importantly, for both membranes, the solute rejection,
regardless of the feed concentration is generally 0.99 or greater. This indicates an
excellent potential of the selected membranes for the separation of ammonium sulfate
from aqueous solutions at the manufacturer recommended pressures.
According to the manufacturer, the solute rejections for NaCl with the polyamide
GE AG membrane and cellulose acetate GE CE membrane are 0.995 and 0.97,
respectively. Thus the experimentally observed rejections of (NH4)2SO4 for the GE AG
membrane are comparable, while those for the GE CE membrane are greater than the
value for NaCl provided by the membrane manufacturer. It is important to emphasize that
NaCl dissociates into 2 monovalent ions, while (NH4)2SO4 dissociates into monovalent
and multivalent ions. Traditionally, the need to separate monovalent or multivalent ions
determines whether a nanofiltration (NF) or reverse osmosis (RO) membrane is used, as
NF membranes are able to reject multivalent salts, such as (NH4)2SO4, while RO
membranes are typically necessary to reject monovalent salts such as NaCl. Given this
information, and the fact that the molecular weight of (NH4)2SO4 is greater than that of
NaCl (132.14 g·mol−1 vs. 58.44 g·mol−1), a very good rejection of (NH4)2SO4 by both
membranes was expected. However, it should also be emphasized that the NaCl
rejections provided were for relatively low salt concentration of 2 g.l−1, while the
separation tests presented in Fig. 3.6 were carried out at much greater feed concentrations
(up to 40 g.l−1). This further proves the excellent potential of the selected membranes for
36
the separation and concentration of ammonium sulfate. It has been shown by others that
experimentsconducted using NaCl can be used to predict the performance of the same
membrane to concentrate different ions using empirical correlations at feed
concentrations that are less than 0.1 mol·l−1 [20], and so the results of this study could
also be used to develop similar models for solutions at greater concentrations.
Due to the limited available data in the literature for (NH4)2SO4 containing
solutions, the results of this study have been compared to those undertaken by others
using different ammonium containing feed solutions. In the study conducted by Häyrynen
et al. [21], which used reverse osmosis membranes to separate several contaminants
including ammonium from mining wastewater using DOW SW30HR membranes,
ammonium rejections were found to be between 0.828 and 0.909. Other investigated
membranes gave rejections between 0.861 and 0.945 for the same samples. These
rejections are much lower than those found in the current study; however, in the current
study ammonium sulfatewas the only salt in the feed solution. A separate study was
conducted by Bodalo et al. [22], where cellulose acetate membranes were used to
concentrate ammonium hydroxide from feeds of different concentrations. That study
found rejections between 0.986 and 0.992, which is very close to the results reported
here, but for a different solute. Another study was conducted by Kurama et al. [23] to
remove high concentrations of ammonium as well as other contaminants from potable
water using two stages of nanofiltration followed by two stages of reverse osmosis. In
that study, a rejection of 0.969 was achieved, which is lower than the rejections found
here, but again, their feed was composed of multiple contaminants. The membrane
materials were not specified in that study, although the reverse osmosis membranes were
low- pressure models of GE make.

37
Figure 3.7: The solute permeance for the membranes investigated at the manufacturer specified applied pressures, under multiple feed concentrations of (NH4)2SO4. The GE CE membrane was tested at an applied pressure of 2950 ± 150 kPa and 22 ± 2°C, and GE AG at 1550 ± 150 kPa and 22 ± 2°C.
Fig. 3.7 presents solute permeances as a function of feed concentrations that were
determined from Eq. (3) using the experimental steady state fluxes and concentrations of
feed and permeate in the experiments previously presented in Fig. 3.6. According to the
solution-diffusion model, solute permeance should be constant. However, this is not the
case in Fig. 3.7, in which solute permeance of both membranes decreases with increasing
feed concentration. This effect appears to be more pronounced for the GE AG membrane
than for the GE CE membrane. At the highest feed concentrations, the solute permeances
were 0.10 and 0.08 l·m−2·h−1 for the GE CE and the GE AG membranes, respectively. A
decrease in solute permeance with increasing feed concentration may indicate that solute
is not only transported by concentration- driven diffusion, but also by pressure-driven
flow along with the solvent. It has been mentioned previously that as the feed
concentration in- creases, the increasing osmotic pressure gradient decreases the flux of
solvent across the membrane (Fig. 3.4). Thus, on the one hand, as the feed concentration
increases there is a greater concentration of solute in convectively transported solvent, but
on the other hand, a decrease in solvent flux may lead to the overall decrease of the
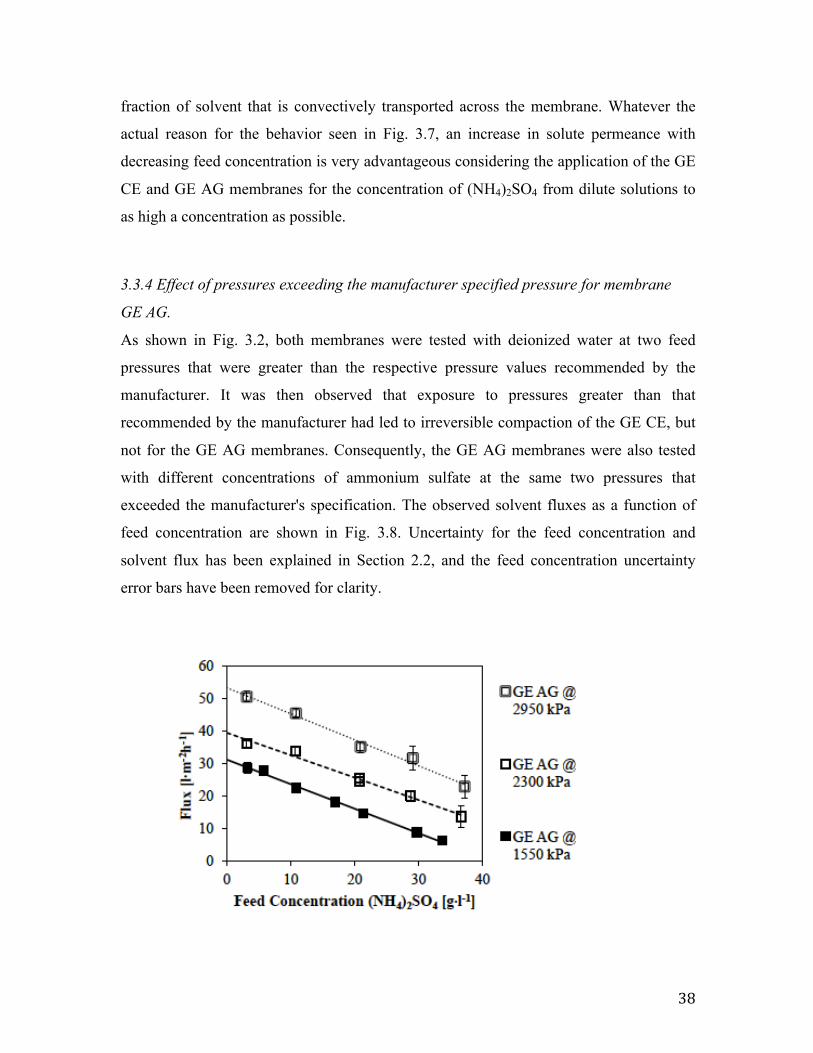
38
fraction of solvent that is convectively transported across the membrane. Whatever the
actual reason for the behavior seen in Fig. 3.7, an increase in solute permeance with
decreasing feed concentration is very advantageous considering the application of the GE
CE and GE AG membranes for the concentration of (NH4)2SO4 from dilute solutions to
as high a concentration as possible.
3.3.4 Effect of pressures exceeding the manufacturer specified pressure for membrane
GE AG.
As shown in Fig. 3.2, both membranes were tested with deionized water at two feed
pressures that were greater than the respective pressure values recommended by the
manufacturer. It was then observed that exposure to pressures greater than that
recommended by the manufacturer had led to irreversible compaction of the GE CE, but
not for the GE AG membranes. Consequently, the GE AG membranes were also tested
with different concentrations of ammonium sulfate at the same two pressures that
exceeded the manufacturer's specification. The observed solvent fluxes as a function of
feed concentration are shown in Fig. 3.8. Uncertainty for the feed concentration and
solvent flux has been explained in Section 2.2, and the feed concentration uncertainty
error bars have been removed for clarity.
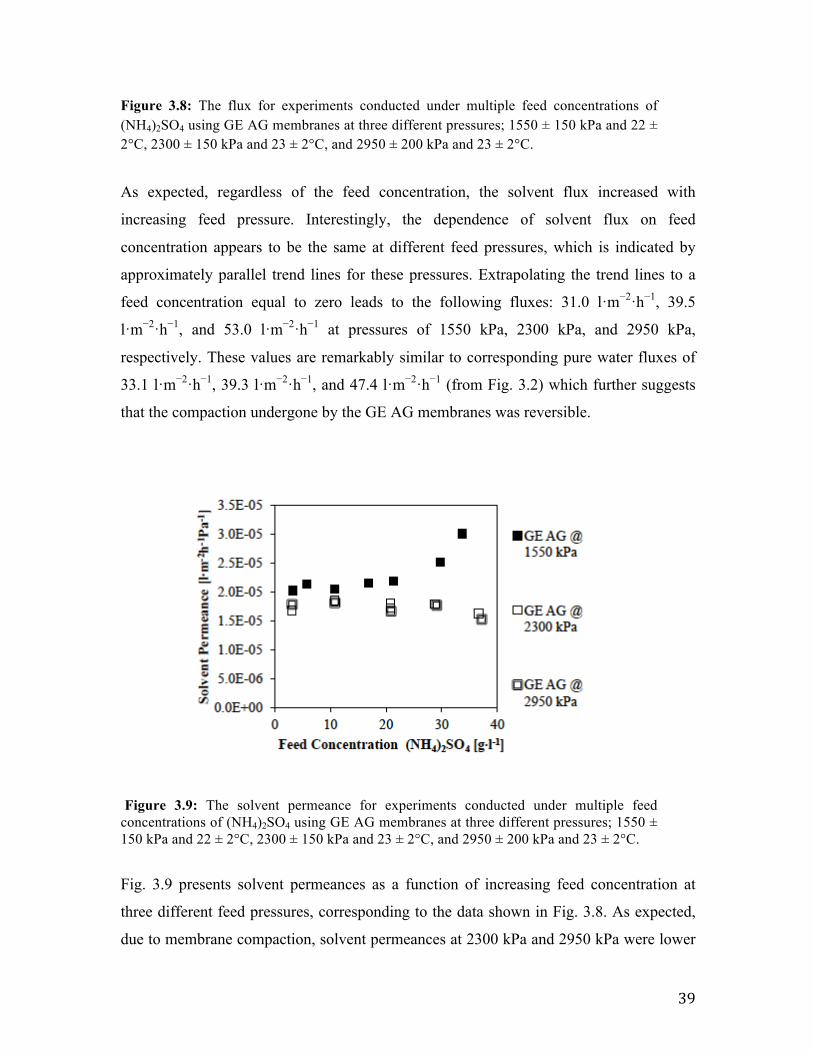
39
Figure 3.8: The flux for experiments conducted under multiple feed concentrations of (NH4)2SO4 using GE AG membranes at three different pressures; 1550 ± 150 kPa and 22 ± 2°C, 2300 ± 150 kPa and 23 ± 2°C, and 2950 ± 200 kPa and 23 ± 2°C.
As expected, regardless of the feed concentration, the solvent flux increased with
increasing feed pressure. Interestingly, the dependence of solvent flux on feed
concentration appears to be the same at different feed pressures, which is indicated by
approximately parallel trend lines for these pressures. Extrapolating the trend lines to a
feed concentration equal to zero leads to the following fluxes: 31.0 l·m−2·h−1, 39.5
l·m−2·h−1, and 53.0 l·m−2·h−1 at pressures of 1550 kPa, 2300 kPa, and 2950 kPa,
respectively. These values are remarkably similar to corresponding pure water fluxes of
33.1 l·m−2·h−1, 39.3 l·m−2·h−1, and 47.4 l·m−2·h−1 (from Fig. 3.2) which further suggests
that the compaction undergone by the GE AG membranes was reversible.
Figure 3.9: The solvent permeance for experiments conducted under multiple feed concentrations of (NH4)2SO4 using GE AG membranes at three different pressures; 1550 ± 150 kPa and 22 ± 2°C, 2300 ± 150 kPa and 23 ± 2°C, and 2950 ± 200 kPa and 23 ± 2°C.
Fig. 3.9 presents solvent permeances as a function of increasing feed concentration at
three different feed pressures, corresponding to the data shown in Fig. 3.8. As expected,
due to membrane compaction, solvent permeances at 2300 kPa and 2950 kPa were lower
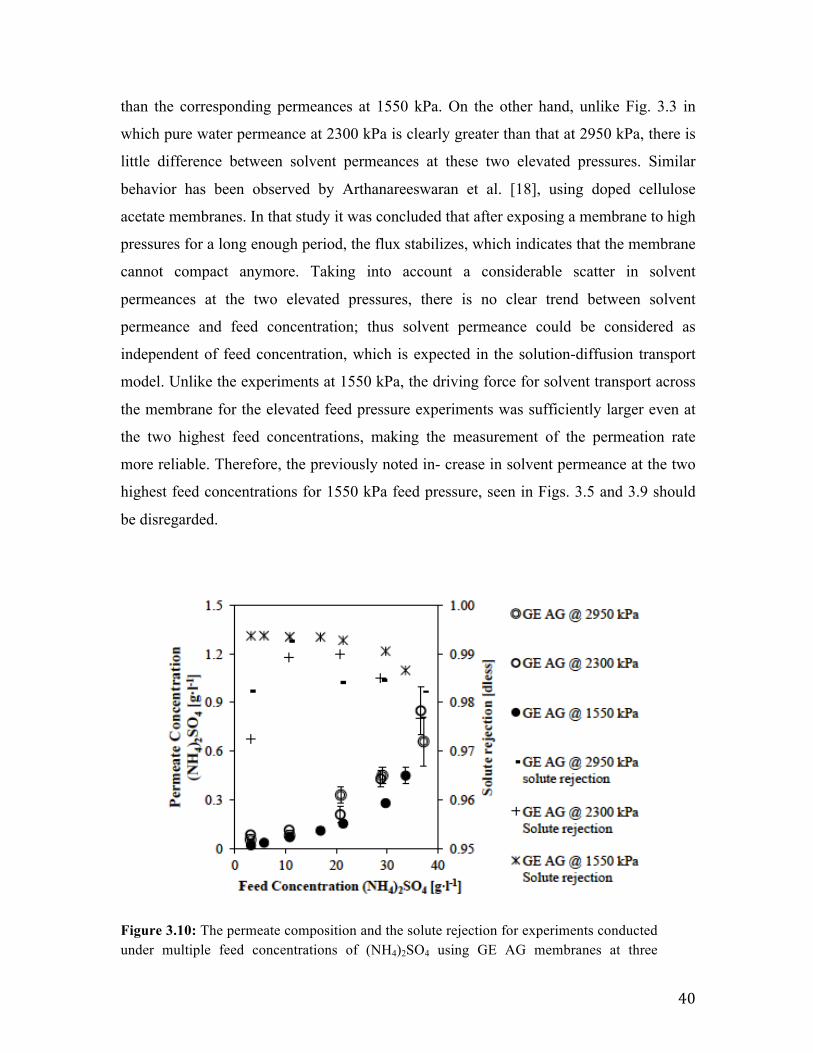
40
than the corresponding permeances at 1550 kPa. On the other hand, unlike Fig. 3.3 in
which pure water permeance at 2300 kPa is clearly greater than that at 2950 kPa, there is
little difference between solvent permeances at these two elevated pressures. Similar
behavior has been observed by Arthanareeswaran et al. [18], using doped cellulose
acetate membranes. In that study it was concluded that after exposing a membrane to high
pressures for a long enough period, the flux stabilizes, which indicates that the membrane
cannot compact anymore. Taking into account a considerable scatter in solvent
permeances at the two elevated pressures, there is no clear trend between solvent
permeance and feed concentration; thus solvent permeance could be considered as
independent of feed concentration, which is expected in the solution-diffusion transport
model. Unlike the experiments at 1550 kPa, the driving force for solvent transport across
the membrane for the elevated feed pressure experiments was sufficiently larger even at
the two highest feed concentrations, making the measurement of the permeation rate
more reliable. Therefore, the previously noted in- crease in solvent permeance at the two
highest feed concentrations for 1550 kPa feed pressure, seen in Figs. 3.5 and 3.9 should
be disregarded.
Figure 3.10: The permeate composition and the solute rejection for experiments conducted under multiple feed concentrations of (NH4)2SO4 using GE AG membranes at three
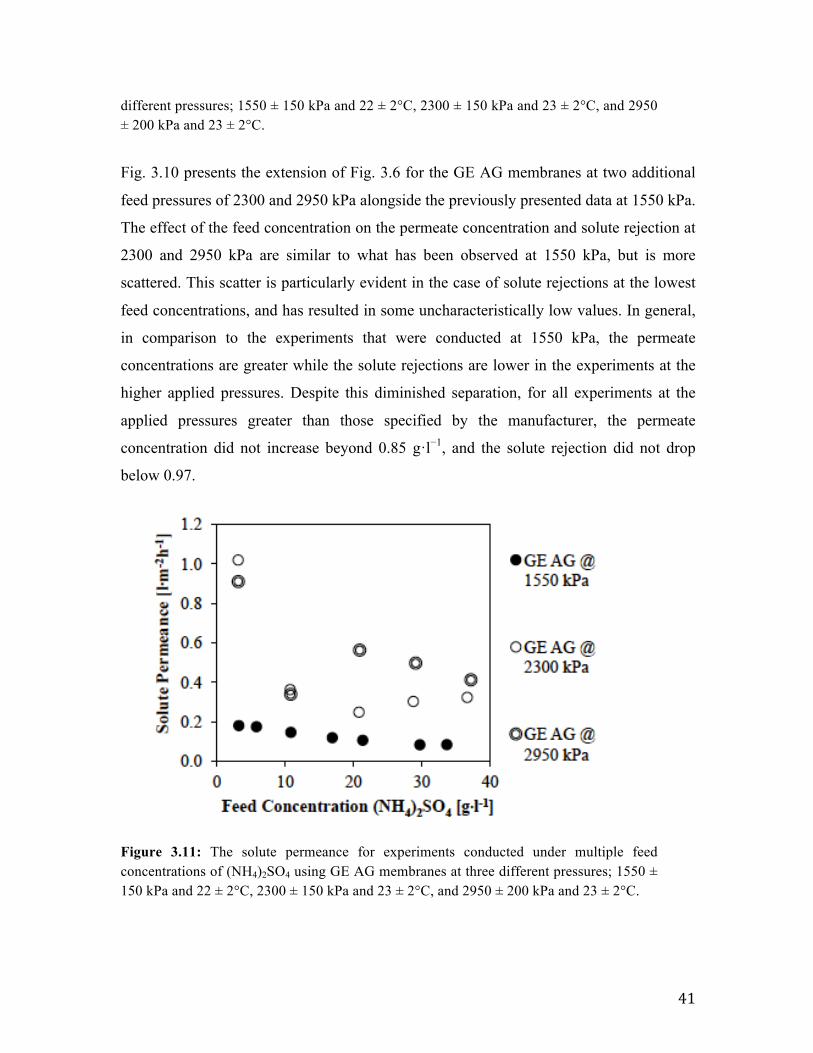
41
different pressures; 1550 ± 150 kPa and 22 ± 2°C, 2300 ± 150 kPa and 23 ± 2°C, and 2950 ± 200 kPa and 23 ± 2°C.
Fig. 3.10 presents the extension of Fig. 3.6 for the GE AG membranes at two additional
feed pressures of 2300 and 2950 kPa alongside the previously presented data at 1550 kPa.
The effect of the feed concentration on the permeate concentration and solute rejection at
2300 and 2950 kPa are similar to what has been observed at 1550 kPa, but is more
scattered. This scatter is particularly evident in the case of solute rejections at the lowest
feed concentrations, and has resulted in some uncharacteristically low values. In general,
in comparison to the experiments that were conducted at 1550 kPa, the permeate
concentrations are greater while the solute rejections are lower in the experiments at the
higher applied pressures. Despite this diminished separation, for all experiments at the
applied pressures greater than those specified by the manufacturer, the permeate
concentration did not increase beyond 0.85 g·l−1, and the solute rejection did not drop
below 0.97.
Figure 3.11: The solute permeance for experiments conducted under multiple feed concentrations of (NH4)2SO4 using GE AG membranes at three different pressures; 1550 ± 150 kPa and 22 ± 2°C, 2300 ± 150 kPa and 23 ± 2°C, and 2950 ± 200 kPa and 23 ± 2°C.
42
Fig. 3.11 presents the solute permeances as a function of increasing feed concentration at
three different feed pressures for the GE AG membranes, corresponding to the data
shown in Fig. 3.10. Similar to the experiments at 1550 kPa, solute permeances at higher
applied pressures can be seen to generally decrease with increasing feed concentration.
Also, the solute permeances at 2300 kPa are lower than those at 2950 kPa for three out of
five feed concentrations. At the other two feed concentrations, solute permeance is
comparable or higher than can be seen at 2950 kPa. Nevertheless, the solute permeance at
the highest feed con- centration is much lower than at the lowest feed concentration, for
all applied pressures. Although there are many inconsistencies between the experiments
carried out at pressures greater than the manufacturer recommended value, it can be
concluded that solute permeances at 2300 kPa and 2950 kPa are considerably greater than
those at 1550 kPa. The observed increase in permeate composition and solute permeance,
as well as the resulting decrease in solute rejection at higher feed pressures is consistent
with the previously noted dual solute transport mechanisms of solution diffusion and
convective flow with solvent [24]. For a given feed concentration, increasing feed
pressure increases the fraction of solute transported convectively. Thus, despite a constant
driving force for concentration-driven diffusion, more solute appears at the permeate side
because of an increase in the driving force for the convective transport of solvent across
the membrane.
Experiments at different feed concentrations and feed pressures greater than the
manufacturer's specified value indicate that despite some membrane compaction, the
compaction effects for the GE AG membranes are not very significant. Consequently,
solvent fluxes greater than the value specified for the NaCl separations are easily
achieved and exceeded. At the same time, despite a decrease in solute rejection at higher
feed pressures, the concentration of ammonium sulfate in permeate remains very low.
This indicates that the GE AG membranes can be effectively operated not only at the
manufacturer's recommended pressure, but also at the elevated feed pressures. Moreover,
specification sheets for spiral wound elements from GE show that membranes of this type
are designed to withstand higher applied pressures.
43
3.4 Conclusions The ultimate goal of the research presented in this paper is to re- move ammonia from
anaerobic digesters in order to enhance biogas production, and at the same time, to
concentrate the removed ammonia, converted into a stable form of ammonium sulfate.
The latter could be used as a liquid fertilizer. In the first phase of this research, the results
of which are presented in this paper, two commercially available RO membranes, GE AG
and GE CE membranes, were tested with aqueous solutions of ammonium sulfate at
different feed concentrations and pressures. For the investigated range of feed
concentrations (up to 40 g·l−1) both membranes showed excellent solute rejections of 0.99
or greater at the manufacturer specified pressures of 1550 kPa and 2900 kPa for the GE
AG and GE CE membranes, respectively. On the other hand, the lower pressure GE AG
membrane was three times more permeable than the higher pressure GE CE membrane
(2.1 × 10⁻⁵ l·m−2·h−1·Pa−1 vs. 7.4 × 10⁻⁶ l·m−2·h−1·Pa−1). While both membranes were
susceptible to compaction at pressures exceeding those specified by the manufacturer, the
compaction effects were reversible for the GE AG membrane, but not for the GE CE
membrane. As a result, the GE AG membrane is recommended for future studies with
multi-ion aqueous solutions. The experimental results obtained in this study were
interpreted in terms of a basic solution-diffusion model, which was found to be not
entirely adequate to explain the observed results. In particular, solute permeance
decreased with feed concentration at a given feed pressure, while solute rejection
decreased with increased feed pressure at a given feed concentration. This suggests that
in addition to concentration-driven diffusion, some solute was also transported
convectively along with the solvent.
3.5 Acknowledgements This research project was conducted in collaboration with CHFour Biogas Ltd, and was
financially supported through the NSERC (Natural Sciences and Engineering Research
Council) Engage program.

44
3.6 References
[1] IPCC, Climate Change 2014:Mitigation of Climate Change, 2014. (Expected
publicationdate:October2014).
[2] D.P. Van Vuuren,M.G. Den Elzen, P.L. Lucas, B. Eickhout, B.J. Strengers, B.
vanRuijven,…, R. vanHoudt, Stabilizing greenhouse gas concentrations at
lowlevels:anassessmentofreductionstrategiesandcosts,Clim.Chang.81
(2)(2007)119–159.
[3] Y.Chen,J.J.Cheng,K.S.Creamer,Inhibitionofanaerobicdigestionprocess:a
review,Bioresour.Technol.99(10)(2008)4044–4064.
[4] R. Nakakubo, H.B.Møller, A.M. Nielsen, J.Matsuda, Ammonia inhibition of
methanogenesis and identification of process indicators during anaerobic
digestion,Environ.Eng.Sci.25(10)(2008)1487–1496.
[5] J.J.Lay,Y.Y.Li,T.Noike,TheinfluenceofpHandammoniaconcentrationon
themethaneproduction inhigh-solidsdigestionprocesses,WaterEnviron.
Res.70(5)(1998)1075–1082.
[6] I.W.Koster,G.Lettinga,Theinfluenceofammonium-nitrogenonthespecific
activityofpelletizedmethanogenicsludge,Agric.Wastes9 (3) (1984)205–
216.
[7] F.Wäger-Baumann,W.Fuchs,Processvariantforthetreatmentofanaerobic
digester effluent with a membrane bioreactor, Environ. Eng. Sci. 28 (9)
(2011)611–617.
[8] T. Wirthensohn, F.Waeger, L. Jelinek,W. Fuchs, Ammonium removal from
anaerobic digester effluent by ion exchange, Water Sci. Technol. 60 (1)
(2009)201–210.
[9] FisheriesAct:WastewaterSystemsEffluentRegulations,Retrievedfromthe
Government of Canada Justice Laws website, http://laws-
lois.justice.gc.ca/eng/regulations/sor-2012-139/index.html2012.
[10] B. Lauterbock,M. Ortner, R. Haider,W. Fuchs, Counteracting ammonia
inhibitioninanaerobicdigestionbyremovalwithahollowfibermembrane
contactor,WaterRes.46(2012)4861–4869.
45
[11] New Logic Research Inc. (n.d.) Biogas Effluent Treatment with VSEP.
Retrieved from http://www.vsep.com/pdf/Membrane-Treatment-of-
Biogas-Effluent-Case-Study.pdf.
[12] A. Jiang, T. Zhang, Q.B. Zhao, X. Li, S. Chen, C.S. Frear, Evaluation of an
integrated ammonia stripping, recovery, and biogas scrubbing system for
usewithanaerobicallydigesteddairymanure,Biosyst.Eng.119(2014)117–
126.
[13] L. Zeng, C.Mangan, X. Li, Ammonia recovery from anaerobically digested
cattlemanure by steam stripping,Water Sci. Technol. 54 (8) (2006) 137–
145.
[14] StatisticsCanada,FertilizerShipments toCanadianAgricultureandExport
Markets, by Product Type and Fertilizer Year, Cumulative Data, Annual
(MetricTonnes),CANSIM(Database)Table001–0068,2014.
[15] O. Akin, F. Temelli, Probing the hydrophobicity of commercial reverse
osmosismembranes produced by interfacial polymerization using contact
angle,XPS,FTIR,FE-SEMandAFM,Desalination278(1)(2011)387–396.
[16] J.R. McCutcheon, M. Elimelech, Influence of membrane support layer
hydrophobicityonwaterfluxinosmoticallydrivenmembraneprocesses,J.
Membr.Sci.318(1)(2008)458–466.
[17] M.E.ElGuendouzi,A.Mounir,A.Dinane,Wateractivity,osmoticandactivity
coefficients of aqueous solutions of Li2SO4,Na2SO4,K2SO4, (NH4)2SO4,
MgSO4, MnSO4, NiSO4, CuSO4,and ZnSO4 at T = 298.15 K, J. Chem.
Thermodyn.35(2)(2003)209–220.
[18] G. Arthanareeswaran, P. Thanikaivelan, K. Srinivasn, D. Mohan, M.
Rajendran, Synthesis, characterization and thermal studies on cellulose
acetatemembraneswithadditive,Eur.Polym.J.40(9)(2004)2153–2159.
[19] M. Sivakumar, D.R. Mohan, R. Rangarajan, Studies on cellulose acetate-
polysulfoneultrafiltrationmembranes:II.Effectofadditiveconcentration,J.
Membr.Sci.268(2)(2006)208–219.
[20] M. Khayet, J.I. Mengual, Effect of salt type on mass transfer in reverse
46
osmosisthinfilmcompositemembranes,Desalination168(2004)383–390.
[21] K.Häyrynen,J.Langwaldt,E.Pongrácz,V.Väisänen,M.Mänttäri,R.L.Keiski,
Separationofnutrientsfromminewaterbyreverseosmosisforsubsequent
biologicaltreatment,Miner.Eng.21(1)(2008)2–9.
[22] A. Bodalo, J.L. Gomez, E. Gomez, G. Leon, M. Tejera, Ammonium removal
from aqueous solutions by reverse osmosis using cellulose acetate
membranes,Desalination184(1)(2005)149–155.
[23] H. Kurama, J. Poetzschke, R. Haseneder, The application of membrane
filtrationfortheremovalofammoniumionsfrompotablewater,WaterRes.
36(11)(2002)2905–2909.
[24] B. Shiyao, F.D.F. Talbot, T.D. Nguyen, T. Matsuura, S. Sourirajan, Surface
force-pore flow model in predicting separation and concentration of
polyhydric alcohols in aqueous solutions using cellulose acetate
membranes,Sep.Sci.Technol.23(1–3)(1988)77–90.
NOMENCLATURE
Am Membrane Area. [m-2] C Concentration of ammonium sulfate used for the calculation of osmotic
pressure. [mol·m-3] Cf Feed concentration of ammonium sulfate. [g·l-1] Cp Permeate stream concentration of ammonium sulfate. [g·l-1] JV Experimentally determined flux of solvent. [l·m-2·h-1] ji Flux of solute, ammonium sulfate. [g·m-2·h-1] R Universal gas constant. [J·mol-1·K-1] Rs Solute rejection. [dimensionless] T Temperature. [K] V Experimentally determined permeate flow rate. [l·h-1]
OHP 2 Permeance of solvent, water. [l·m-2·h-1·Pa-1] ( ) 424 SONHP Permeance of solute, ammonium sulfate. [l·m-2·h-1]
ΔP Pressure differential across the membrane. [Pa] Δπ Osmotic pressure differential across the membrane. [Pa] Φ Number of ions produced during dissociation. [dimensionless]
47
Chapter 4: Concentration of ammonium ion from mixed salt aqueous solutions using commercial LPRO membranes
Tolulope D. Awobusuyi, F. Handan Tezel, Boguslaw Kruczek
Department of Chemical and Biological Engineering, University of Ottawa, 161 Louis
Pasteur, Ottawa, Ontario K1N 6N5, Canada
48
Abstract Membrane technology is the preferred separation method for a wide selection of
industries, including the agriculture and desalination industries, both of which require
purity of the products. This is due to a number of advantages: higher separation
efficiencies at lower costs, environmentally benign processes and materials, and low
capital costs. Removal of ammonia from anaerobic digestate using membranes represents
another potential application of membrane technology.
Our previous study had indicated excellent rejections of ammonium sulfate from
aqueous solutions using commercial reverse osmosis (RO) membranes and suggested the
possibility of using low-pressure reverse osmosis (LPRO) membranes for this
application. In this paper the rejection of ammonium sulfate from single and mixed-salt
[(NH4)2SO4 + K3PO4] aqueous solutions is investigated using three commercial LPRO
membranes. For both salts the rejections at feed concentration of 20 g·l-1 and feed
pressure of 13.8 x 10⁵ Pa were greater than 0.93. The rejections increased with an
increase of feed pressure and a decrease of feed concentration; the highest rejections
exceeded 99%. The analysis of ionic concentration of permeate-streams in mixed-salt
experiments revealed non-stoichiometric transport of ions. In particular, the rejections of
NH4+ ions exceeding 99% were observed even with a high total salt concentration in feed,
which is very advantageous from the point of view of removing and concentration of
ammonia from anaerobic digestate. The observed results are interpreted qualitatively
using extended-Nernst-Plank transport model.
Keywords: low-pressure reverse osmosis, membrane separation, ionic rejections,
solution-diffusion, Kedem-Katchalsky.
49
4.1 Introduction Membrane separation processes are applied in many industries [1] for a variety of
separation processes: desalination[2]–[5], agriculture [2], [6], [7], and healthcare
industries [3], [7], [8]. These industries are generally involved in the production of high-
purity chemical compounds and/or the production of waste considered hazardous to the
environment, and efficient separation processes–as production and treatment steps–are a
necessity [9]–[11]. Membrane separation processes have, over the last half-century,
become a ubiquitous separation method, and perhaps the greatest testament to the
pervasiveness of the technology is its dominance of the desalination industry. Between
2009 and 2015 the water production capacity of active desalination plants has gone from
37 million m3/day [12] to approximately 66 million m3/day [13], [14], and in Israel
desalination plants alone produce a quarter of the national potable water supply [13].
Membrane separation processes are therefore important to contemporary society, and the
importance of an understanding of the workings of the processes cannot be understated.
Anaerobic digestion is a common method used in the treatment of waste products
from farms and municipalities. The process converts organic matter to methane [15] and
also produces biomass. Ammonia is also produced by the degradation of nitrogen-
containing substances, but the production of ammonia inhibits the production of methane
in the digester [16]. Ammonia is generally removed by denitrifying the gas mixtures from
the digester and can either be used in the production of fertilizer [15] or liquefied and
reformed to hydrogen gas [17]. Some of the most common technologies used for
ammonia removal are ion exchange [18], [19], electrochemical cells [19], gas stripping
using air or steam, membrane contactors [20], and fuel cells [19]. While most of these
processes may be efficient, they tend to have high operating costs and may also affect the
environment in adverse ways. On the other hand, membrane separation technology
promises rejections as high as the other methods while operating at reduced costs and
with little effect on the environment [21], [22].
An alternative process design has ammonia continuously removed from the
digester by scrubbing the gas mixture [23]. The next proposed step is the acidification of
the scrubbed ammonia by the addition of sulfuric acid to produce ammonium sulfate.
This is then concentrated by feeding the effluent to a reverse osmosis process using
50
spiral-wound membranes, and the concentrated retentate can be used as an N-type
fertilizer. However, it is possible that by scrubbing gas mixture from the digester, water
droplets containing some other dissolved salts could also be removed along with
ammonia. In this case, the RO process to concentrate ammonium sulfate should also take
into consideration the presence of other inorganic salts that could be found in the
anaerobic digester.
In a previous iteration of this work it was suggested that LPRO membranes should
be tested for the concentration of ammonium sulfate from aqueous solutions, and that the
solution-diffusion model did not adequately describe the transport in the investigated RO
membranes [24], which was attributed to the presence of convective transport through the
membranes. In this study, three LPRO membranes have been characterized using
ammonium sulfate, tripotassium phosphate, and multi-ion aqueous solutions in order to
provide much-needed information on membrane performance in terms of ammonium ion
rejection. Tests using tripotassium phosphate were conducted because the constituent ions
can be found in anaerobic digestate in significant proportions. The multi-ion aqueous
solution used comprised NH4+, K+, SO4
2-, and PO43- in the same concentration ratios as
found in anaerobic digestate.
4.2 Theoretical Background The LPRO membranes selected in this study were characterized with single-salt
(ammonium sulfate and tripotassium phosphate) aqueous solutions. Assuming
stoichiometric transport of ions solvent and solute permeances were determined using the
Kedem-Katchalsky model that accounts for both convective and diffusive transport
through the membrane. The possibility of the convective solute transport was hinted at in
the previous study using RO membranes [24]. It should also be noted that the effects of
concentration polarization have not been factored into the analysis of the experimental
results for reasons given in the experimental section.
The permeate flux across a membrane for a given pressure is given by the
following equation:
JV = PM ,W (∆ P −σ ∆ π ) (1)
51
where JV [kg.m-2.s-1] is the solvent flux across the membrane; [kg.m-2.s-1.Pa-1] is the
solvent permeance; ∆P [Pa] is the applied pressure gradient; ∆π [Pa] is the osmotic
pressure gradient across the membrane and is a function of the feed and permeate
concentrations, and; is the reflection coefficient of the salt for a given pressure across
a particular membrane and accounts for imperfections within the membrane [25]. When σ
= 1 the Kedem-Katchalsky model becomes the solution-diffusion model.
The osmotic pressure, ∆π [Pa], can be determined experimentally or by
calculations using a modified van’t Hoff equation for dilute concentrations. The van’t
Hoff equation is given as:
(2)
where i is the number of ions produced by a given salt during dissociation; is the
osmotic coefficient for a given salt at given molalities and temperature, and can be
experimentally determined or found in literature; cf [mol.m-3] is the feed concentration of
a given salt; cp [mol.m-3] is the solute concentration in the permeate stream; R [J.mol-1.K-
1] is the universal gas constant, and; T [K] is the experimental temperature. The osmotic
coefficients used in this paper are taken from Refs. [26] and [27].
The solute flux is calculated from experimentally determined parameters by the
following equation:
ji = cp × JV (3)
The relationship between the solute flux and the solute permeance is given by the
following equation:
ji = PM ,S (cf − cp )+(1−σ )cavgJV
ρ
⎡
⎣⎢
⎤
⎦⎥ (4)
where ji [mol.m-2.s-1] is the solute flux; [m.s-1] is the solute permeance for a given
salt for a particular membrane; ρ is the density [kg.m-3], and; cavg [mol.m-3] is the average
concentration across the membrane pores, measured as a log-mean concentration
difference.
Experimental variations in permeate fluxes were accounted for by determining the
fractional uncertainty using the standard error equations.
PM ,W
σ
∆ π = iRT (φ f c f −φpcp )
φ
PM ,S
52
4.3 Experimental
4.3.1 Permeation and separation experiments
The experimental setup used for the experiments, shown in Fig. 4.1, was
described in our earlier study [24]. The permeation experiments were conducted using
flat-sheet membranes housed in static cells and feed stored in a 20 l high-density
polyethylene tank. Solutions in the tank were fed to the static cells using a centrifugal
pump. Three membranes, with an active area of 14.5 cm2 each, were tested
simultaneously to obtain average performance for a given type of membrane. The
membrane inlet temperature was measured at the membrane cell inlet points. Constant
temperature during experiments was maintained using a Haake cooling bath. Pressure
readings were taken at the membrane cell inlets and the retentate rotameter inlet. The
permeate sample was collected at atmospheric pressure, so the pressure differential
needed for Eq. (1) is essentially the feed pressure. The feed flow rate was 3 l.min-1 while
the highest permeate flow rate recorded was 6 ml.min-1. Owing to the large differences
between feed and permeate flow rates, zero stage-cut was assumed in each experiment. In
addition, because of a large linear velocity of the feed stream in the membrane cell, the
effects of concentration polarization were considered negligible and have not been
factored into the calculations.
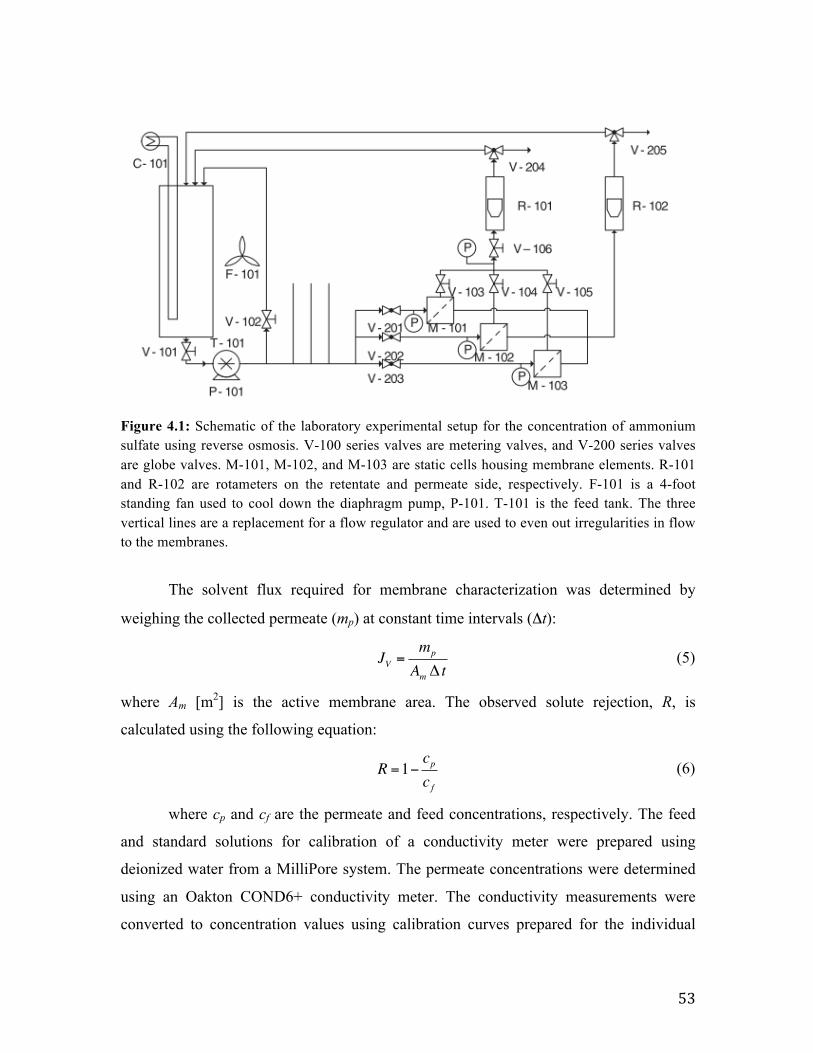
53
Figure 4.1: Schematic of the laboratory experimental setup for the concentration of ammonium sulfate using reverse osmosis. V-100 series valves are metering valves, and V-200 series valves are globe valves. M-101, M-102, and M-103 are static cells housing membrane elements. R-101 and R-102 are rotameters on the retentate and permeate side, respectively. F-101 is a 4-foot standing fan used to cool down the diaphragm pump, P-101. T-101 is the feed tank. The three vertical lines are a replacement for a flow regulator and are used to even out irregularities in flow to the membranes.
The solvent flux required for membrane characterization was determined by
weighing the collected permeate (mp) at constant time intervals (Δt):
JV =mp
Am∆ t (5)
where Am [m2] is the active membrane area. The observed solute rejection, R, is
calculated using the following equation:
(6)
where cp and cf are the permeate and feed concentrations, respectively. The feed
and standard solutions for calibration of a conductivity meter were prepared using
deionized water from a MilliPore system. The permeate concentrations were determined
using an Oakton COND6+ conductivity meter. The conductivity measurements were
converted to concentration values using calibration curves prepared for the individual
R =1−cpcf

54
salts. Ionic concentrations for determining the stoichiometry of ions in the permeate were
determined using inductively coupled plasma mass spectrometry (ICP-MS) for K+, SO42-,
and PO43- ions and a colorimetric method for NH4
+. The chemicals used in the
preparation of the calibration curves were purchased from Sigma-Aldrich and were
analytical-grade unless noted otherwise.
4.3.2 Investigated membranes and experimental design
The membranes used in this study are commercially available membranes,
selected for their abilities to provide high permeate fluxes at low pressures without a
marked decrease in their rejection abilities. Flat sheet coupons were purchased from
Sterlitech, each with an active diameter of 43 mm. The properties of the membranes used
in this study are summarized in Table 4.1.
First, the membranes were tested with deionized water at pressures ranging from
3.5 x 10⁵ Pa to 28 x 105 Pa. The separation experiments carried out were grouped in two
broad classes: single-salt experiments and mixed-salt experiments. The single-salt
experiments were conducted using (NH4)2SO4 and K3PO4 for a feed concentration range
of 2.5 to 40 g.l-1. The experimental feed pressures ranged from 3.5 x 10⁵ Pa to 28 x 105 Pa
The limits of the feed concentrations were dependent on the osmotic pressure of the salt
used.
Table 4.1: Properties of LPRO membranes used in this study. Membrane DOW XLE TriSep ACM4 TriSep X201
Material Polyamide Polyamide Polyamide-Urea
Solvent flux [kg.m-2.s-1] a 0.0138 0.0184 0.0142
Applied pressure [× 105 Pa] a 6.90 15.50 15.50
NaCl rejection [%] at 2 g.l-1 a 98.7 99.2 99.5
pH Range a 2 - 11 2 - 11 2 - 11
Water contact angle 66.3 b 35 c 55.0 ± 1.8 d a As reported by Sterlitech, 2015 for a 2 g.l-1 NaCl feed solution at 25 ºC [28] b As measured by Xu, et al., 2006 [29]
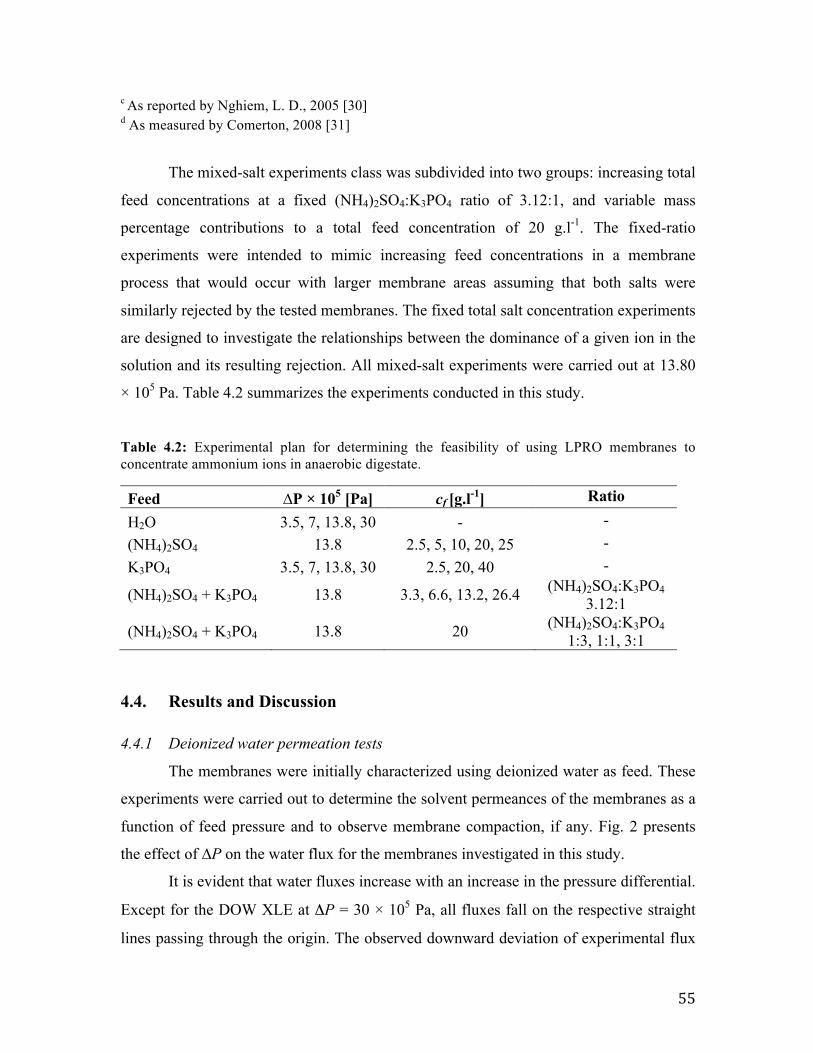
55
c As reported by Nghiem, L. D., 2005 [30] d As measured by Comerton, 2008 [31]
The mixed-salt experiments class was subdivided into two groups: increasing total
feed concentrations at a fixed (NH4)2SO4:K3PO4 ratio of 3.12:1, and variable mass
percentage contributions to a total feed concentration of 20 g.l-1. The fixed-ratio
experiments were intended to mimic increasing feed concentrations in a membrane
process that would occur with larger membrane areas assuming that both salts were
similarly rejected by the tested membranes. The fixed total salt concentration experiments
are designed to investigate the relationships between the dominance of a given ion in the
solution and its resulting rejection. All mixed-salt experiments were carried out at 13.80
× 105 Pa. Table 4.2 summarizes the experiments conducted in this study.
Table 4.2: Experimental plan for determining the feasibility of using LPRO membranes to concentrate ammonium ions in anaerobic digestate.
Feed ∆P × 105 [Pa] cf [g.l-1] Ratio H2O 3.5, 7, 13.8, 30 - - (NH4)2SO4 13.8 2.5, 5, 10, 20, 25 - K3PO4 3.5, 7, 13.8, 30 2.5, 20, 40 -
(NH4)2SO4 + K3PO4 13.8 3.3, 6.6, 13.2, 26.4 (NH4)2SO4:K3PO4 3.12:1
(NH4)2SO4 + K3PO4 13.8 20 (NH4)2SO4:K3PO4 1:3, 1:1, 3:1
4.4. Results and Discussion
4.4.1 Deionized water permeation tests
The membranes were initially characterized using deionized water as feed. These
experiments were carried out to determine the solvent permeances of the membranes as a
function of feed pressure and to observe membrane compaction, if any. Fig. 2 presents
the effect of ∆P on the water flux for the membranes investigated in this study.
It is evident that water fluxes increase with an increase in the pressure differential.
Except for the DOW XLE at ΔP = 30 × 105 Pa, all fluxes fall on the respective straight
lines passing through the origin. The observed downward deviation of experimental flux
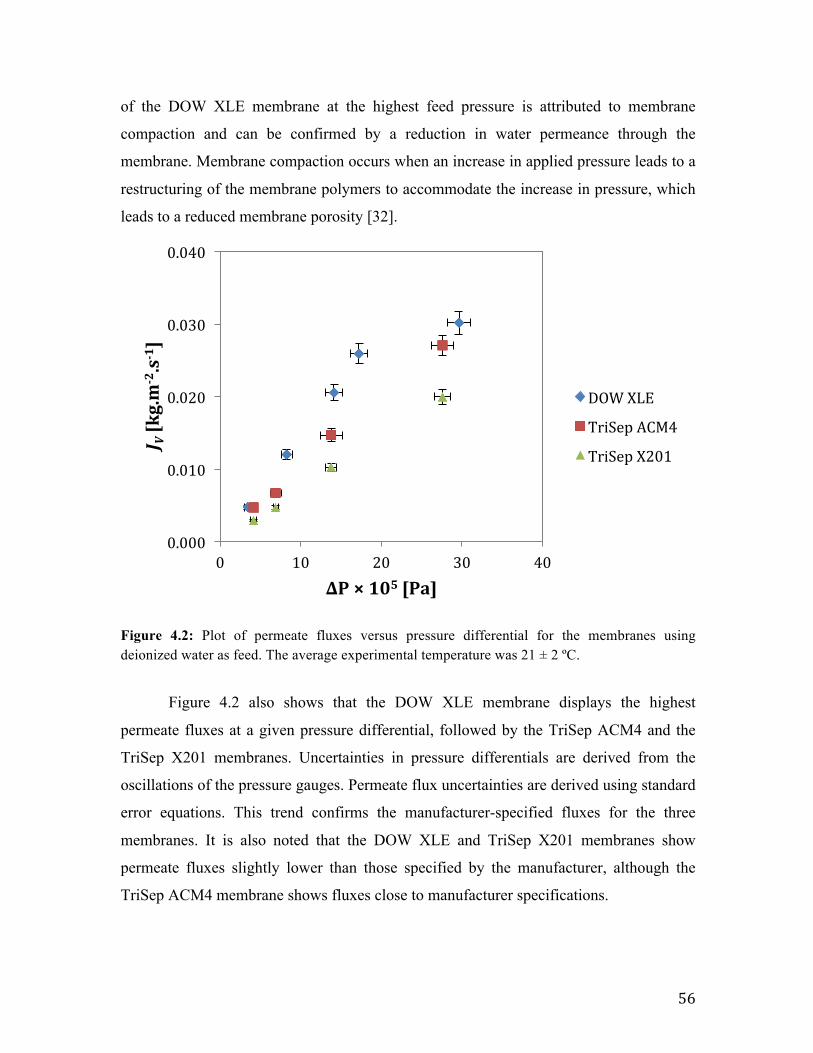
56
of the DOW XLE membrane at the highest feed pressure is attributed to membrane
compaction and can be confirmed by a reduction in water permeance through the
membrane. Membrane compaction occurs when an increase in applied pressure leads to a
restructuring of the membrane polymers to accommodate the increase in pressure, which
leads to a reduced membrane porosity [32].
Figure 4.2: Plot of permeate fluxes versus pressure differential for the membranes using deionized water as feed. The average experimental temperature was 21 ± 2 ºC.
Figure 4.2 also shows that the DOW XLE membrane displays the highest
permeate fluxes at a given pressure differential, followed by the TriSep ACM4 and the
TriSep X201 membranes. Uncertainties in pressure differentials are derived from the
oscillations of the pressure gauges. Permeate flux uncertainties are derived using standard
error equations. This trend confirms the manufacturer-specified fluxes for the three
membranes. It is also noted that the DOW XLE and TriSep X201 membranes show
permeate fluxes slightly lower than those specified by the manufacturer, although the
TriSep ACM4 membrane shows fluxes close to manufacturer specifications.
0.000
0.010
0.020
0.030
0.040
0 10 20 30 40
J V[kg.m
-2.s-1]
∆P×105[Pa]
DOWXLE
TriSepACM4
TriSepX201

57
Using Eq. (1), the pure water permeances for the DOW XLE membrane is 1.45 ×
10-8 kg.m-2.s-1.Pa-1, while the TriSep ACM4 has a permeance of 1.042 × 10⁻⁸ kg.m-2.s-
1.Pa-1 and the TriSep X201 membrane has a permeance of 0.717 × 10⁻⁸ kg.m-2.s-1.Pa-1.
The pure water permeances reported are at pre-compaction pressures, and for the DOW
XLE membrane the compacted permeance is 1.02 × 10⁻⁸ kg.m-2.s-1.Pa-1 at the highest feed
pressure.
4.4.2 Single salt separation experiments
Single-salt separation experiments were carried out with aqueous solutions of
(NH4)2SO4 and K3PO4, respectively. The experiments with (NH4)2SO4 were performed at
a fixed feed pressure of 13.80 × 10⁵ Pa and five different feed concentrations ranging
from 2.5 to 25 g·l-1. On the other hand, the experiments with K3PO4 were performed with
three different feed concentrations of 2.5, 20 and 40 g·l-1 at four different feed pressures
ranging from 3.50 × 10⁵ Pa to 30 × 105 Pa.
Salt rejections
To our best knowledge, the LPRO membranes used in this study have not been
characterized with aqueous solutions of (NH4)2SO4 and K3PO4. The NaCl rejections of
the selected membranes that are provided in Table 4.1 refer to brackish water (2 g.l-1 of
NaCl). On the one hand, the salts investigated in this study are larger than NaCl, which
should help their rejection, but on the other hand, the lowest feed concentration, 2.5 g·l-1,
considered in this study is slightly greater than that of brackish water, which might lower
their rejections in comparison.
Figure 4.3 presents the effect of (NH4)2SO4 concentration in the feed stream on
solute rejection at the feed pressure of 13.80 × 10⁵ Pa. The horizontal reference lines
show the respective rejections of brackish water. As expected, the rejection (NH4)2SO4
decreases with feed concentration. At the lowest feed concentration of 2.5 g·l-1 the
rejections of (NH4)2SO4 are comparable (TriSep ACM 4 and TriSep X201 membranes) or
even greater (DOW XLE membrane) than the respective rejections of brackish water. The
effect of feed concentration on solute rejection is strongest for the TriSep ACM 4
membrane, for which the rejection at 25 g·l-1 drops to 93%. On the other hand, while the
rejections of (NH4)2SO4 by the TriSep X201 and DOW XLE membranes decrease with
58
increase in feed concentration, the lowest experimental rejections are just slightly below
98%. It is important to emphasize that although the rejection of brackish water by the
DOW XLE membrane is smaller than that of the TriSep ACM 4 membrane, the former
appears to be much better for the rejection of (NH4)2SO4 than the latter. This indicates
that while the manufacturer specified NaCl rejections provide a useful guide, they are not
necessarily indicative of the rejections of different solutes. In addition, the TriSep ACM 4
membrane shows the worst solute rejections despite the fact that this membrane was
tested at a slightly greater feed pressure (15.50 × 10⁵ Pa) than the other two membranes
(13.80 × 10⁵ Pa). The effect of feed pressure is further explored with the other solute
considered in this study, which is discussed next.
Figure 4.3: (NH4)2SO4 rejections as a function of increasing (NH4)2SO4 concentrations in feed. All reported values are at an average temperature of 22±1.5 ºC. DOE XLE and TriSep X201 membranes were tested at 13.8 x 10⁵ Pa while TriSep ACM 4 at 15.5 x 10⁵ Pa. The horizontal lines are specified NaCl rejections from the membrane vendor, Sterlitech, and can be found on their website. All manufacturer rejections refer to a 2 g.l-1 NaCl feed concentration at 25 ºC.
Figure 4.4 presents the effect of feed pressure on the rejection of K3PO4 at two
different feed concentrations of 2.5 and 20 g·l-1. In addition, the membranes were also
0.900
0.920
0.940
0.960
0.980
1.000
0 5 10 15 20 25 30
R[-]
cf[g.l-1]
DOWXLE
TriSepACM4
TriSepX201
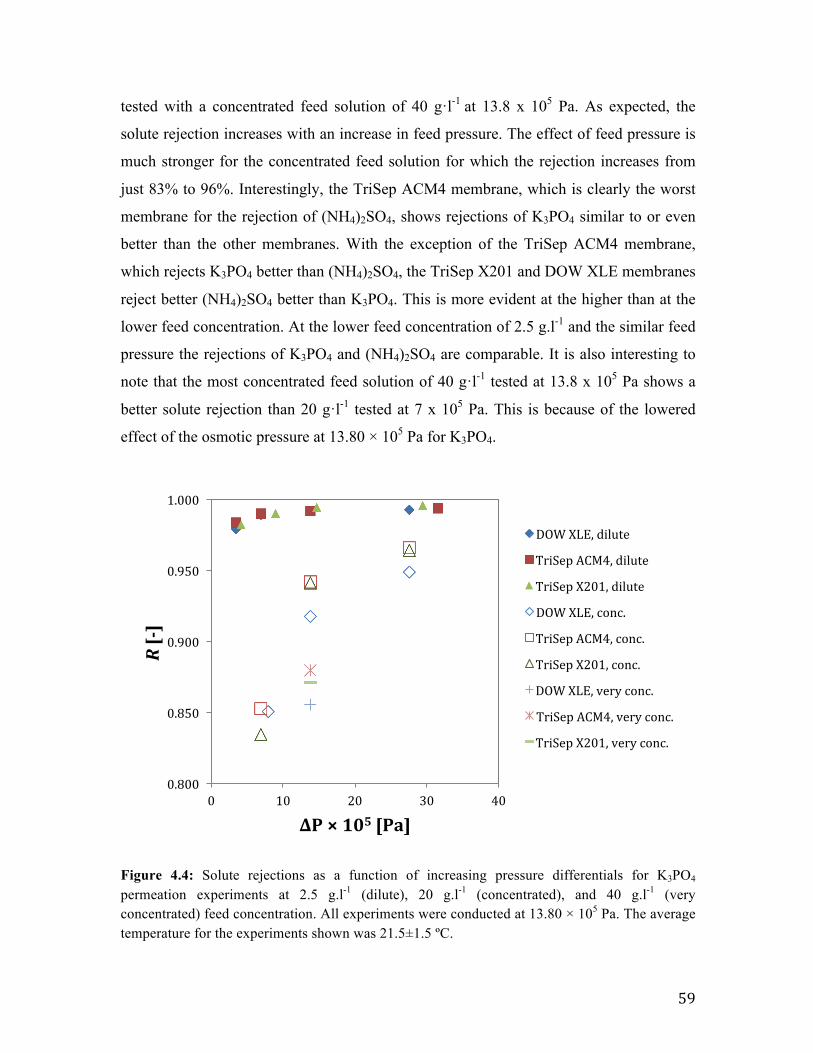
59
tested with a concentrated feed solution of 40 g·l-1 at 13.8 x 10⁵ Pa. As expected, the
solute rejection increases with an increase in feed pressure. The effect of feed pressure is
much stronger for the concentrated feed solution for which the rejection increases from
just 83% to 96%. Interestingly, the TriSep ACM4 membrane, which is clearly the worst
membrane for the rejection of (NH4)2SO4, shows rejections of K3PO4 similar to or even
better than the other membranes. With the exception of the TriSep ACM4 membrane,
which rejects K3PO4 better than (NH4)2SO4, the TriSep X201 and DOW XLE membranes
reject better (NH4)2SO4 better than K3PO4. This is more evident at the higher than at the
lower feed concentration. At the lower feed concentration of 2.5 g.l-1 and the similar feed
pressure the rejections of K3PO4 and (NH4)2SO4 are comparable. It is also interesting to
note that the most concentrated feed solution of 40 g·l-1 tested at 13.8 x 10⁵ Pa shows a
better solute rejection than 20 g·l-1 tested at 7 x 10⁵ Pa. This is because of the lowered
effect of the osmotic pressure at 13.80 × 10⁵ Pa for K3PO4.
Figure 4.4: Solute rejections as a function of increasing pressure differentials for K3PO4 permeation experiments at 2.5 g.l-1 (dilute), 20 g.l-1 (concentrated), and 40 g.l-1 (very concentrated) feed concentration. All experiments were conducted at 13.80 × 10⁵ Pa. The average temperature for the experiments shown was 21.5±1.5 ºC.
0.800
0.850
0.900
0.950
1.000
0 10 20 30 40
R[-]
∆P×105[Pa]
DOWXLE,dilute
TriSepACM4,dilute
TriSepX201,dilute
DOWXLE,conc.
TriSepACM4,conc.
TriSepX201,conc.
DOWXLE,veryconc.
TriSepACM4,veryconc.
TriSepX201,veryconc.
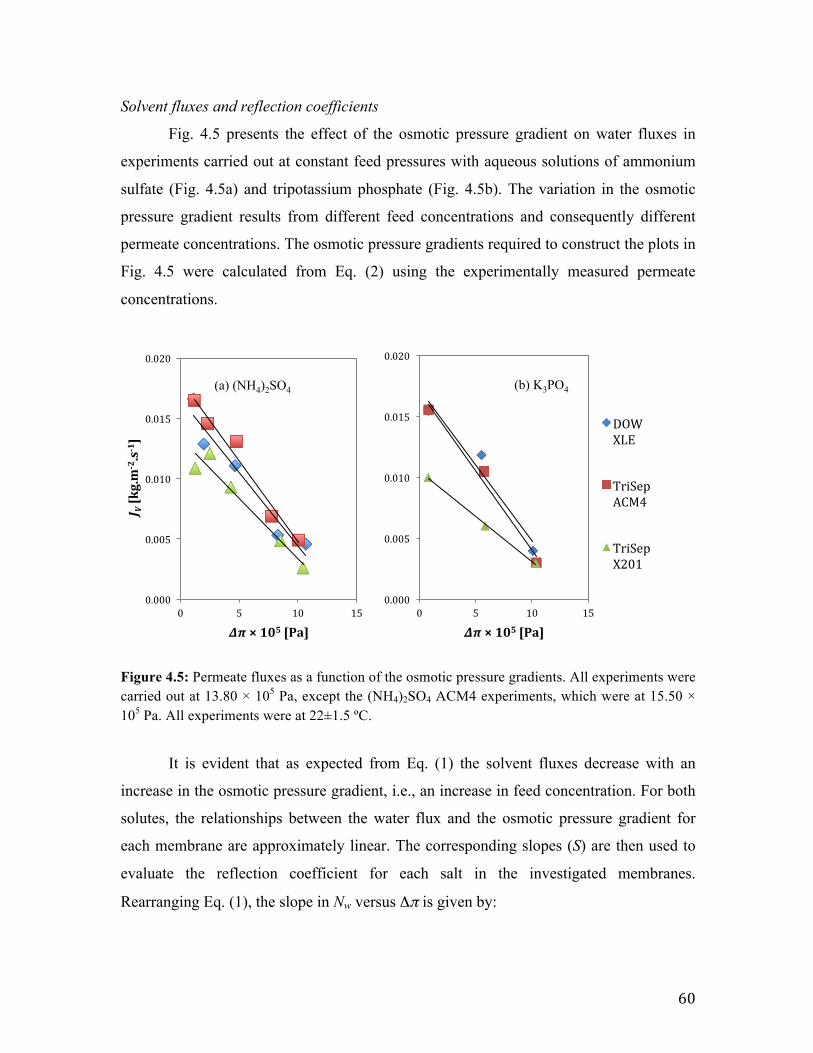
60
Solvent fluxes and reflection coefficients
Fig. 4.5 presents the effect of the osmotic pressure gradient on water fluxes in
experiments carried out at constant feed pressures with aqueous solutions of ammonium
sulfate (Fig. 4.5a) and tripotassium phosphate (Fig. 4.5b). The variation in the osmotic
pressure gradient results from different feed concentrations and consequently different
permeate concentrations. The osmotic pressure gradients required to construct the plots in
Fig. 4.5 were calculated from Eq. (2) using the experimentally measured permeate
concentrations.
Figure 4.5: Permeate fluxes as a function of the osmotic pressure gradients. All experiments were carried out at 13.80 × 10⁵ Pa, except the (NH4)2SO4 ACM4 experiments, which were at 15.50 × 10⁵ Pa. All experiments were at 22±1.5 ºC.
It is evident that as expected from Eq. (1) the solvent fluxes decrease with an
increase in the osmotic pressure gradient, i.e., an increase in feed concentration. For both
solutes, the relationships between the water flux and the osmotic pressure gradient for
each membrane are approximately linear. The corresponding slopes (S) are then used to
evaluate the reflection coefficient for each salt in the investigated membranes.
Rearranging Eq. (1), the slope in Nw versus Δπ is given by:
0.000
0.005
0.010
0.015
0.020
0 5 10 15
J V[kg.m
-2.s-1]
∆π×105[Pa]
(a) (NH4)2SO4
0.000
0.005
0.010
0.015
0.020
0 5 10 15
∆π×105[Pa]
DOWXLE
TriSepACM4
TriSepX201
(b) K3PO4
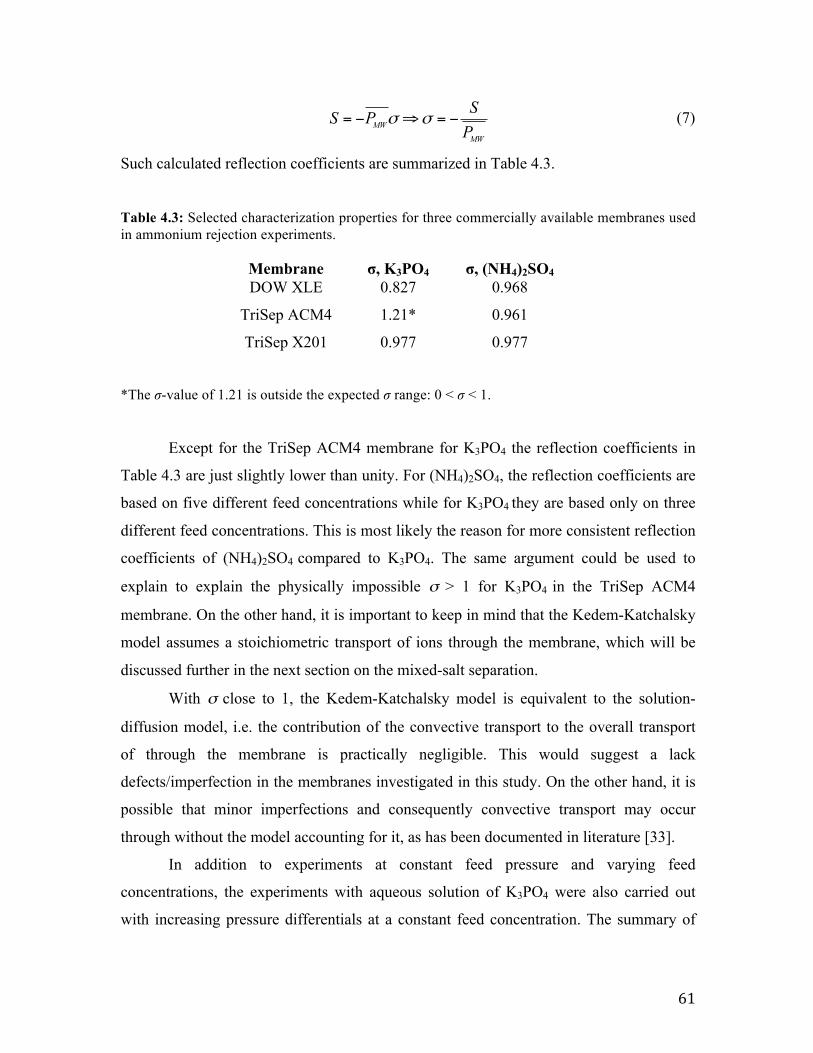
61
(7)
Such calculated reflection coefficients are summarized in Table 4.3.
Table 4.3: Selected characterization properties for three commercially available membranes used in ammonium rejection experiments.
Membrane σ, K3PO4 σ, (NH4)2SO4 DOW XLE 0.827 0.968
TriSep ACM4 1.21* 0.961
TriSep X201 0.977 0.977
*The σ-value of 1.21 is outside the expected σ range: 0 < σ < 1.
Except for the TriSep ACM4 membrane for K3PO4 the reflection coefficients in
Table 4.3 are just slightly lower than unity. For (NH4)2SO4, the reflection coefficients are
based on five different feed concentrations while for K3PO4 they are based only on three
different feed concentrations. This is most likely the reason for more consistent reflection
coefficients of (NH4)2SO4 compared to K3PO4. The same argument could be used to
explain to explain the physically impossible σ > 1 for K3PO4 in the TriSep ACM4
membrane. On the other hand, it is important to keep in mind that the Kedem-Katchalsky
model assumes a stoichiometric transport of ions through the membrane, which will be
discussed further in the next section on the mixed-salt separation.
With σ close to 1, the Kedem-Katchalsky model is equivalent to the solution-
diffusion model, i.e. the contribution of the convective transport to the overall transport
of through the membrane is practically negligible. This would suggest a lack
defects/imperfection in the membranes investigated in this study. On the other hand, it is
possible that minor imperfections and consequently convective transport may occur
through without the model accounting for it, as has been documented in literature [33].
In addition to experiments at constant feed pressure and varying feed
concentrations, the experiments with aqueous solution of K3PO4 were also carried out
with increasing pressure differentials at a constant feed concentration. The summary of
MW
MW
SS PP
σ σ= − ⇒ = −
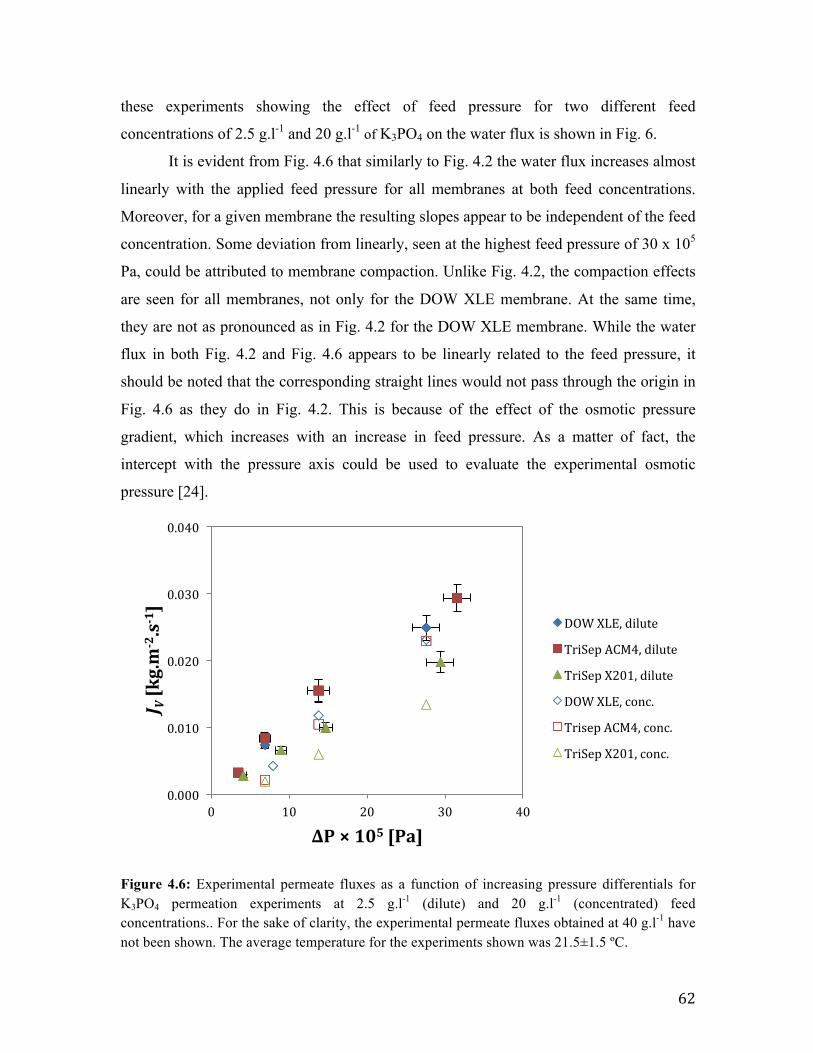
62
these experiments showing the effect of feed pressure for two different feed
concentrations of 2.5 g.l-1 and 20 g.l-1 of K3PO4 on the water flux is shown in Fig. 6.
It is evident from Fig. 4.6 that similarly to Fig. 4.2 the water flux increases almost
linearly with the applied feed pressure for all membranes at both feed concentrations.
Moreover, for a given membrane the resulting slopes appear to be independent of the feed
concentration. Some deviation from linearly, seen at the highest feed pressure of 30 x 105
Pa, could be attributed to membrane compaction. Unlike Fig. 4.2, the compaction effects
are seen for all membranes, not only for the DOW XLE membrane. At the same time,
they are not as pronounced as in Fig. 4.2 for the DOW XLE membrane. While the water
flux in both Fig. 4.2 and Fig. 4.6 appears to be linearly related to the feed pressure, it
should be noted that the corresponding straight lines would not pass through the origin in
Fig. 4.6 as they do in Fig. 4.2. This is because of the effect of the osmotic pressure
gradient, which increases with an increase in feed pressure. As a matter of fact, the
intercept with the pressure axis could be used to evaluate the experimental osmotic
pressure [24].
Figure 4.6: Experimental permeate fluxes as a function of increasing pressure differentials for K3PO4 permeation experiments at 2.5 g.l-1 (dilute) and 20 g.l-1 (concentrated) feed concentrations.. For the sake of clarity, the experimental permeate fluxes obtained at 40 g.l-1 have not been shown. The average temperature for the experiments shown was 21.5±1.5 ºC.
0.000
0.010
0.020
0.030
0.040
0 10 20 30 40
J V[kg.m
-2.s-1]
∆P×105[Pa]
DOWXLE,dilute
TriSepACM4,dilute
TriSepX201,dilute
DOWXLE,conc.
TrisepACM4,conc.
TriSepX201,conc.
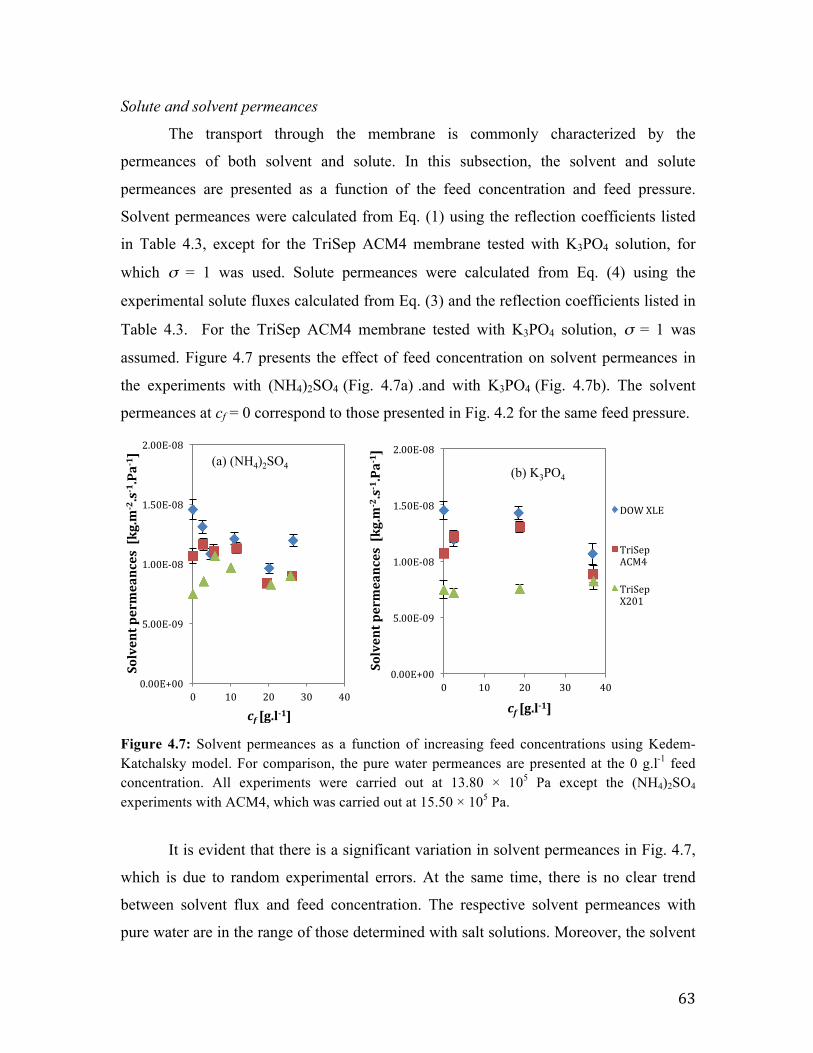
63
Solute and solvent permeances
The transport through the membrane is commonly characterized by the
permeances of both solvent and solute. In this subsection, the solvent and solute
permeances are presented as a function of the feed concentration and feed pressure.
Solvent permeances were calculated from Eq. (1) using the reflection coefficients listed
in Table 4.3, except for the TriSep ACM4 membrane tested with K3PO4 solution, for
which σ = 1 was used. Solute permeances were calculated from Eq. (4) using the
experimental solute fluxes calculated from Eq. (3) and the reflection coefficients listed in
Table 4.3. For the TriSep ACM4 membrane tested with K3PO4 solution, σ = 1 was
assumed. Figure 4.7 presents the effect of feed concentration on solvent permeances in
the experiments with (NH4)2SO4 (Fig. 4.7a) .and with K3PO4 (Fig. 4.7b). The solvent
permeances at cf = 0 correspond to those presented in Fig. 4.2 for the same feed pressure.
Figure 4.7: Solvent permeances as a function of increasing feed concentrations using Kedem-Katchalsky model. For comparison, the pure water permeances are presented at the 0 g.l-1 feed concentration. All experiments were carried out at 13.80 × 10⁵ Pa except the (NH4)2SO4 experiments with ACM4, which was carried out at 15.50 × 10⁵ Pa.
It is evident that there is a significant variation in solvent permeances in Fig. 4.7,
which is due to random experimental errors. At the same time, there is no clear trend
between solvent flux and feed concentration. The respective solvent permeances with
pure water are in the range of those determined with salt solutions. Moreover, the solvent
0.00E+00
5.00E-09
1.00E-08
1.50E-08
2.00E-08
0 10 20 30 40
Solventpermeances[kg.m
-2.s-1.Pa-1 ]
cf[g.l-1]
(a) (NH4)2SO4
0.00E+00
5.00E-09
1.00E-08
1.50E-08
2.00E-08
0 10 20 30 40
Solventpermeances[kg.m
-2.s-1.Pa-1 ]
cf[g.l-1]
DOWXLE
TriSepACM4
TriSepX201
(b) K3PO4
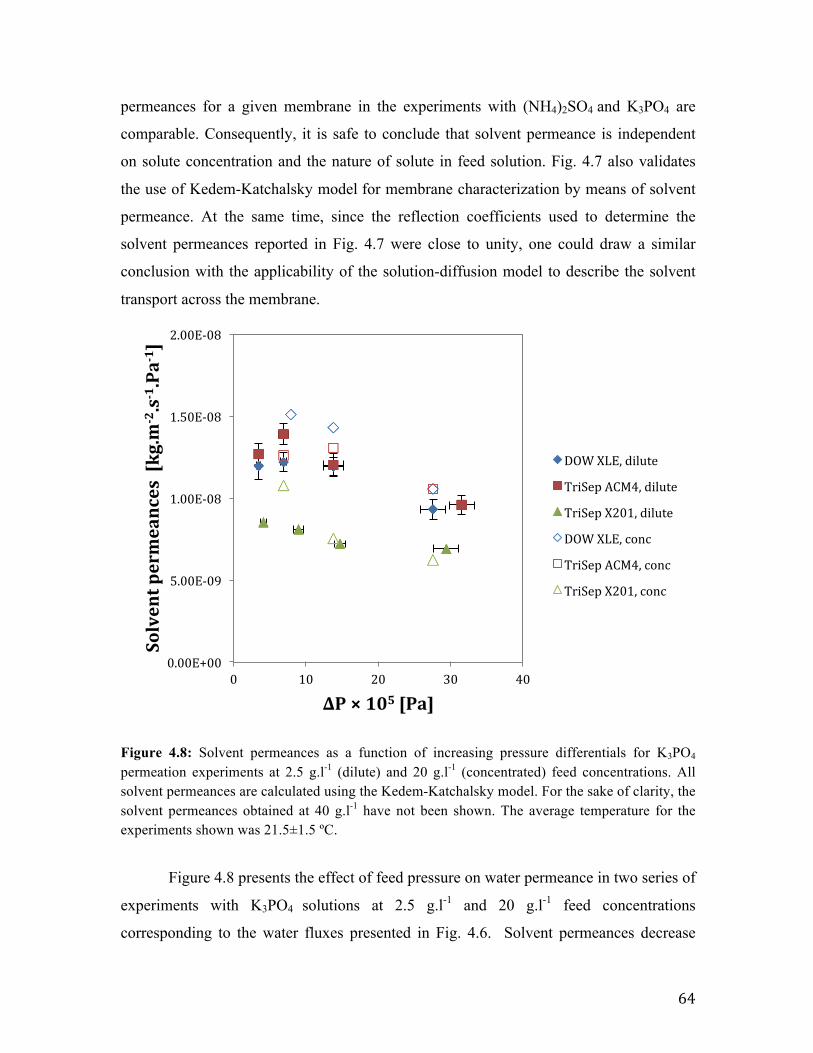
64
permeances for a given membrane in the experiments with (NH4)2SO4 and K3PO4 are
comparable. Consequently, it is safe to conclude that solvent permeance is independent
on solute concentration and the nature of solute in feed solution. Fig. 4.7 also validates
the use of Kedem-Katchalsky model for membrane characterization by means of solvent
permeance. At the same time, since the reflection coefficients used to determine the
solvent permeances reported in Fig. 4.7 were close to unity, one could draw a similar
conclusion with the applicability of the solution-diffusion model to describe the solvent
transport across the membrane.
Figure 4.8: Solvent permeances as a function of increasing pressure differentials for K3PO4 permeation experiments at 2.5 g.l-1 (dilute) and 20 g.l-1 (concentrated) feed concentrations. All solvent permeances are calculated using the Kedem-Katchalsky model. For the sake of clarity, the solvent permeances obtained at 40 g.l-1 have not been shown. The average temperature for the experiments shown was 21.5±1.5 ºC.
Figure 4.8 presents the effect of feed pressure on water permeance in two series of
experiments with K3PO4 solutions at 2.5 g.l-1 and 20 g.l-1 feed concentrations
corresponding to the water fluxes presented in Fig. 4.6. Solvent permeances decrease
0.00E+00
5.00E-09
1.00E-08
1.50E-08
2.00E-08
0 10 20 30 40
Solventpermeances[kg.m
-2.s-1.Pa-1 ]
∆P×105[Pa]
DOWXLE,dilute
TriSepACM4,dilute
TriSepX201,dilute
DOWXLE,conc
TriSepACM4,conc
TriSepX201,conc
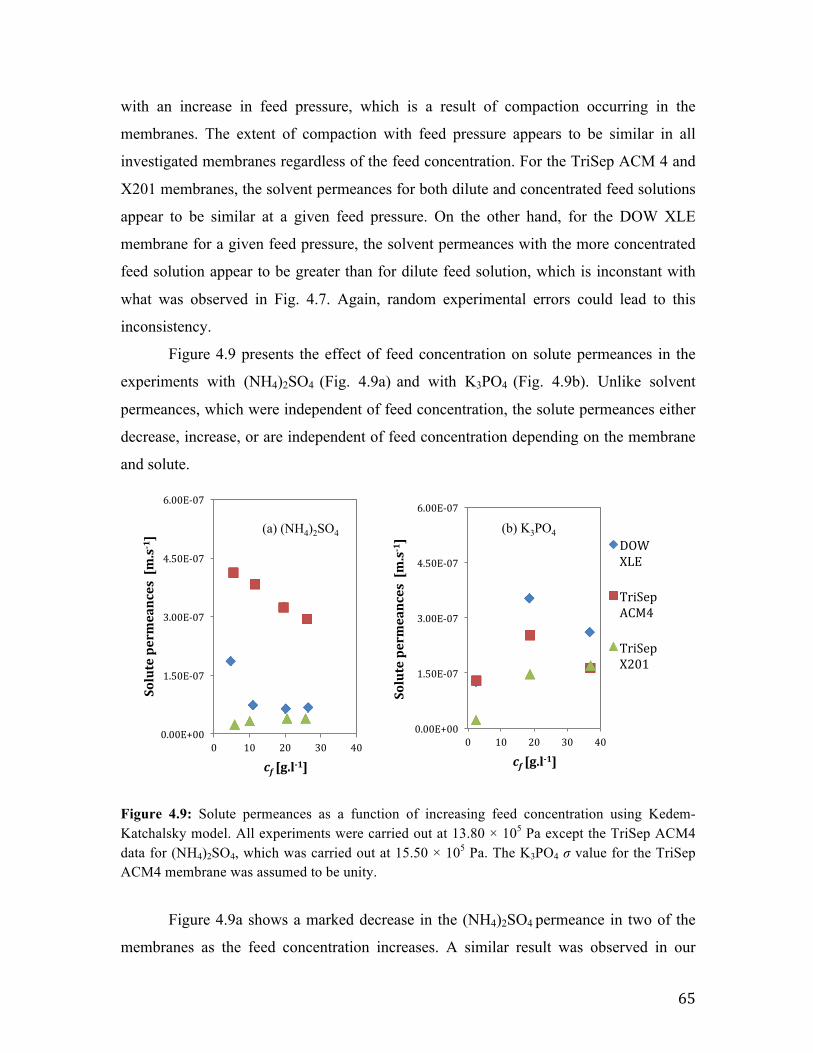
65
with an increase in feed pressure, which is a result of compaction occurring in the
membranes. The extent of compaction with feed pressure appears to be similar in all
investigated membranes regardless of the feed concentration. For the TriSep ACM 4 and
X201 membranes, the solvent permeances for both dilute and concentrated feed solutions
appear to be similar at a given feed pressure. On the other hand, for the DOW XLE
membrane for a given feed pressure, the solvent permeances with the more concentrated
feed solution appear to be greater than for dilute feed solution, which is inconstant with
what was observed in Fig. 4.7. Again, random experimental errors could lead to this
inconsistency.
Figure 4.9 presents the effect of feed concentration on solute permeances in the
experiments with (NH4)2SO4 (Fig. 4.9a) and with K3PO4 (Fig. 4.9b). Unlike solvent
permeances, which were independent of feed concentration, the solute permeances either
decrease, increase, or are independent of feed concentration depending on the membrane
and solute.
Figure 4.9: Solute permeances as a function of increasing feed concentration using Kedem-Katchalsky model. All experiments were carried out at 13.80 × 10⁵ Pa except the TriSep ACM4 data for (NH4)2SO4, which was carried out at 15.50 × 10⁵ Pa. The K3PO4 σ value for the TriSep ACM4 membrane was assumed to be unity.
Figure 4.9a shows a marked decrease in the (NH4)2SO4 permeance in two of the
membranes as the feed concentration increases. A similar result was observed in our
0.00E+00
1.50E-07
3.00E-07
4.50E-07
6.00E-07
0 10 20 30 40
Solutepermeances[m.s-1]
cf[g.l-1]
(a) (NH4)2SO4
0.00E+00
1.50E-07
3.00E-07
4.50E-07
6.00E-07
0 10 20 30 40
Solutepermeances[m.s-1]
cf[g.l-1]
DOWXLE
TriSepACM4
TriSepX201
(b) K3PO4

66
previous study with RO membranes, and the decrease in solute flux at increasing feed
concentrations was attributed to the convective solute transport across the membrane
[24]. It was thought that using the Kedem-Katchalsky model would eliminate the
variation of solute permeance with feed concentration. However, it is clear that except for
the TriSep X201 membrane for which (NH4)2SO4 permeance is independent of feed
concentration, the Kedem-Katchalsky model did not alleviate the dependence of solute
permeance of feed concentration. Interestingly, in the experiments with K3PO4 solution
with the TriSep X201 membrane, permeance of solute increases with an increase in feed
concentration. For the other two membranes, since there are only three experimental
points, it is difficult to conclude about any specific trend. Comparing the rejections of
two solutes in Figs. 4.9a and 4.9b the only clear conclusion can be made with regard to
the TriSep ACM4 membrane, which shows a smaller solute permeance (greater rejection)
of K3PO4 compared to (NH4)2SO4. For the other two membranes, because of variation in
solute permeance with feed concentration, it is difficult to conclude which solute has a
greater permeation in which membrane.

67
Figure 4.10: Solute permeances as a function of increasing pressure differentials for K3PO4 permeation experiments at 2.5 g.l-1 (dilute) and 20 g.l-1 (concentrated) feed concentrations. All solute permeances are calculated using the Kedem-Katchalsky model. For the sake of clarity, the solute permeances obtained at 40 g.l-1 have not been shown. The average temperature for the experiments shown was 21.5±1.5 ºC. The K3PO4 σ value for the TriSep ACM4 membrane was assumed to be unity.
Figure 4.10 presents the effect of feed pressure on the permeance of K3PO4 in two
series of experiments carried at feed concentration of 2.5 and 20 g.l-1. Aside from the
TriSep X201 data at either concentration the solute permeances increase with increasing
pressure differential. The TriSep X201 data indicates its solute permeances are
independent of the pressure differential for that membrane, which would confirm the
suitability of the Kedem-Katchalsky model to describe the transport in that membrane,
especially for the experiments with the dilute feed solution. However, the increase in
solute permeance for the other membranes indicates that this model cannot adequately
account for solute transport, and more rigorous models must be applied to characterize
the membranes.
0.00E+00
1.50E-07
3.00E-07
4.50E-07
6.00E-07
0 10 20 30 40
Solutepermeances[m.s-1]
∆P×105[Pa]
DOWXLE,dilute
TriSepACM4,dilute
TriSepX201,dilute
DOWXLE,conc.
TriSepACM4.conc.
TriSepX201,conc.

68
While the (NH4)2SO4 solute permeances decrease with an increase in
concentration in both Fig. 4.9 and the previous paper [24], the K3PO4 solute permeances
generally increase with an increase in solute concentration. Increasing the pressure
differential increases the solute permeance of both salts. However, solvent permeances
for both salts were shown to be relatively independent on feed concentration and applied
pressure provided no membrane compaction occurred. It can therefore be concluded that
while the Kedem-Katchalsky model (and solution diffusion model) adequately describe
solvent transport through LPRO membranes, they are not suitable to describe the solute
transport through the membrane. This is most likely caused by the non-stoichiometric
nature of the rejections, a phenomenon that is investigated in the next section.
4.4.3 Mixed-salt experiments
Permeation experiments were carried out using a combination of (NH4)2SO4 and
K3PO4 salts to determine NH4+ rejection trends in the presence of other ions found in
anaerobic digestate. In preparing the increasing total salt concentration experiments,
linear changes in ionic concentrations for NH4+ and K+ were assumed and the initial
NH4+:K+ stoichiometric ratio found in anaerobic digestate was provided by a local
company, CHFour Biogas.
All ionic concentrations except NH4+ were measured using ICP-MS, and NH4
+
concentrations were measured using a colorimetric method. The distinct measurement of
individual ions enabled the verification or otherwise of the stoichiometric assumptions for
the phenomenological models. The properties of the ions in the system are given in Table
4.4. The K+ and NH4+ cations have comparable radii (rs) and the diffusivities at infinite
dilution (D∞) despite the fact that the molecular weight (MW) of the former is twice that
of the latter. In turn, although the MW of SO42- and PO4
3- are comparable, the rs of the
former is significantly smaller while D∞ is considerably larger than those of the latter. It
is also important to note, that both monovalent cations are smaller and have greater D∞
than the multivalent anions.
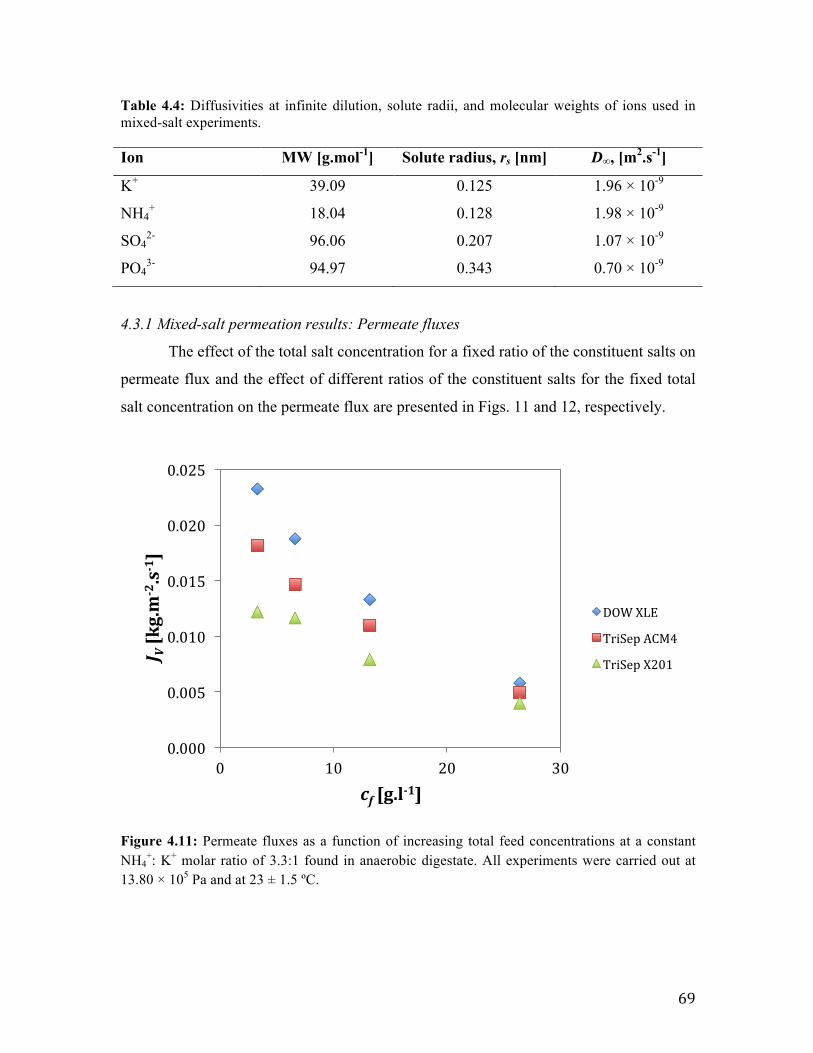
69
Table 4.4: Diffusivities at infinite dilution, solute radii, and molecular weights of ions used in mixed-salt experiments. Ion MW [g.mol-1] Solute radius, rs [nm] D∞, [m2.s-1]
K+ 39.09 0.125 1.96 × 10⁻⁹
NH4+ 18.04 0.128 1.98 × 10⁻⁹
SO42- 96.06 0.207 1.07 × 10⁻⁹
PO43- 94.97 0.343 0.70 × 10⁻⁹
4.3.1 Mixed-salt permeation results: Permeate fluxes
The effect of the total salt concentration for a fixed ratio of the constituent salts on
permeate flux and the effect of different ratios of the constituent salts for the fixed total
salt concentration on the permeate flux are presented in Figs. 11 and 12, respectively.
Figure 4.11: Permeate fluxes as a function of increasing total feed concentrations at a constant NH4
+: K+ molar ratio of 3.3:1 found in anaerobic digestate. All experiments were carried out at 13.80 × 10⁵ Pa and at 23 ± 1.5 ºC.
0.000
0.005
0.010
0.015
0.020
0.025
0 10 20 30
J V[kg.m
-2.s-1]
cf[g.l-1]
DOWXLE
TriSepACM4
TriSepX201
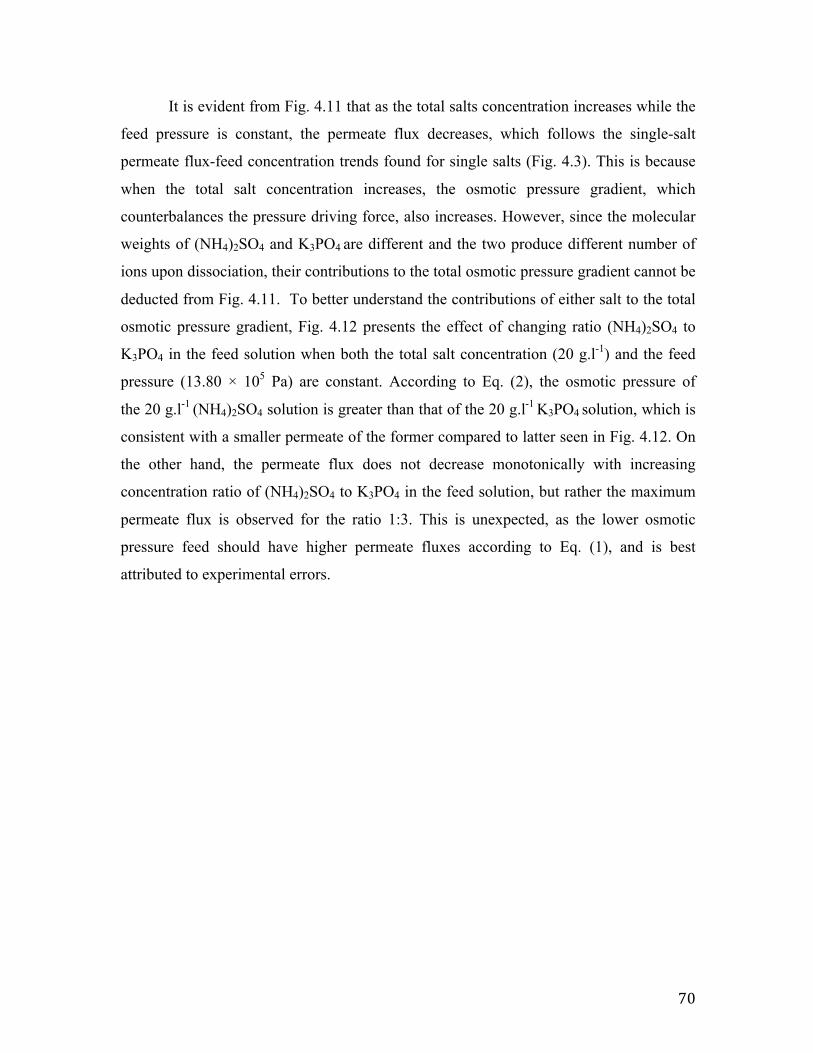
70
It is evident from Fig. 4.11 that as the total salts concentration increases while the
feed pressure is constant, the permeate flux decreases, which follows the single-salt
permeate flux-feed concentration trends found for single salts (Fig. 4.3). This is because
when the total salt concentration increases, the osmotic pressure gradient, which
counterbalances the pressure driving force, also increases. However, since the molecular
weights of (NH4)2SO4 and K3PO4 are different and the two produce different number of
ions upon dissociation, their contributions to the total osmotic pressure gradient cannot be
deducted from Fig. 4.11. To better understand the contributions of either salt to the total
osmotic pressure gradient, Fig. 4.12 presents the effect of changing ratio (NH4)2SO4 to
K3PO4 in the feed solution when both the total salt concentration (20 g.l-1) and the feed
pressure (13.80 × 10⁵ Pa) are constant. According to Eq. (2), the osmotic pressure of
the 20 g.l-1 (NH4)2SO4 solution is greater than that of the 20 g.l-1 K3PO4 solution, which is
consistent with a smaller permeate of the former compared to latter seen in Fig. 4.12. On
the other hand, the permeate flux does not decrease monotonically with increasing
concentration ratio of (NH4)2SO4 to K3PO4 in the feed solution, but rather the maximum
permeate flux is observed for the ratio 1:3. This is unexpected, as the lower osmotic
pressure feed should have higher permeate fluxes according to Eq. (1), and is best
attributed to experimental errors.
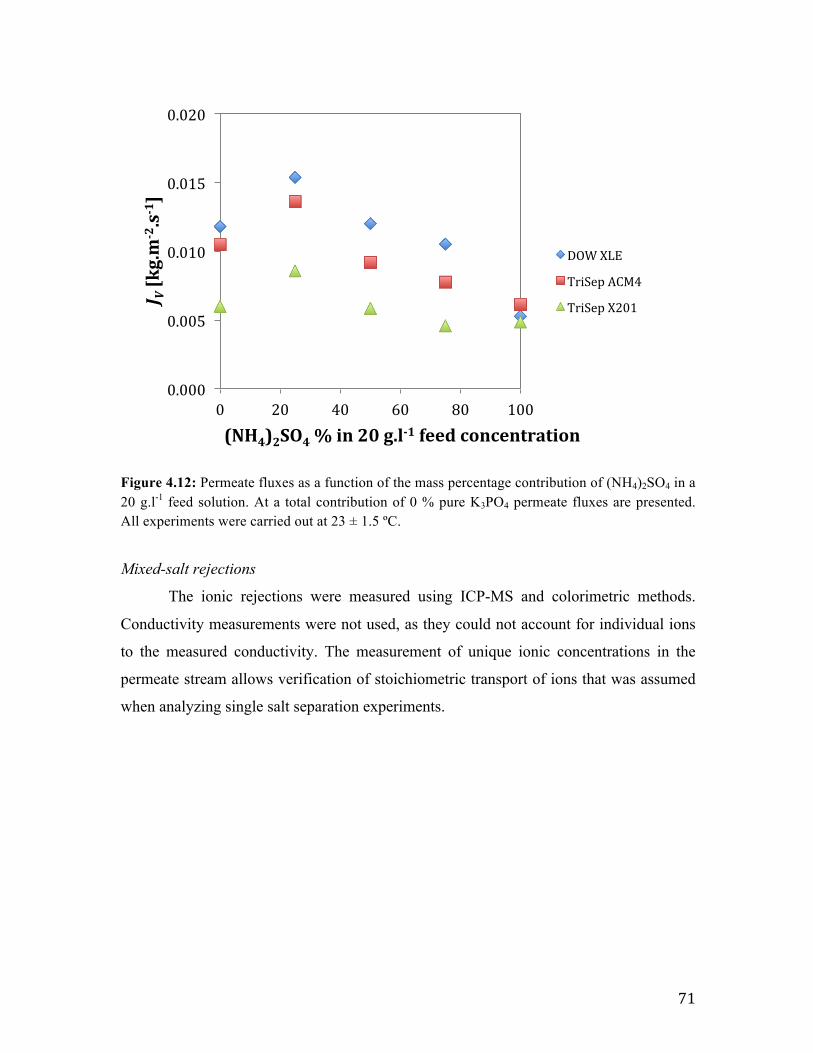
71
Figure 4.12: Permeate fluxes as a function of the mass percentage contribution of (NH4)2SO4 in a 20 g.l-1 feed solution. At a total contribution of 0 % pure K3PO4 permeate fluxes are presented. All experiments were carried out at 23 ± 1.5 ºC.
Mixed-salt rejections
The ionic rejections were measured using ICP-MS and colorimetric methods.
Conductivity measurements were not used, as they could not account for individual ions
to the measured conductivity. The measurement of unique ionic concentrations in the
permeate stream allows verification of stoichiometric transport of ions that was assumed
when analyzing single salt separation experiments.
0.000
0.005
0.010
0.015
0.020
0 20 40 60 80 100
J V[kg.m
-2.s-1]
(NH4)2SO4%in20g.l-1feedconcentration
DOWXLE
TriSepACM4
TriSepX201
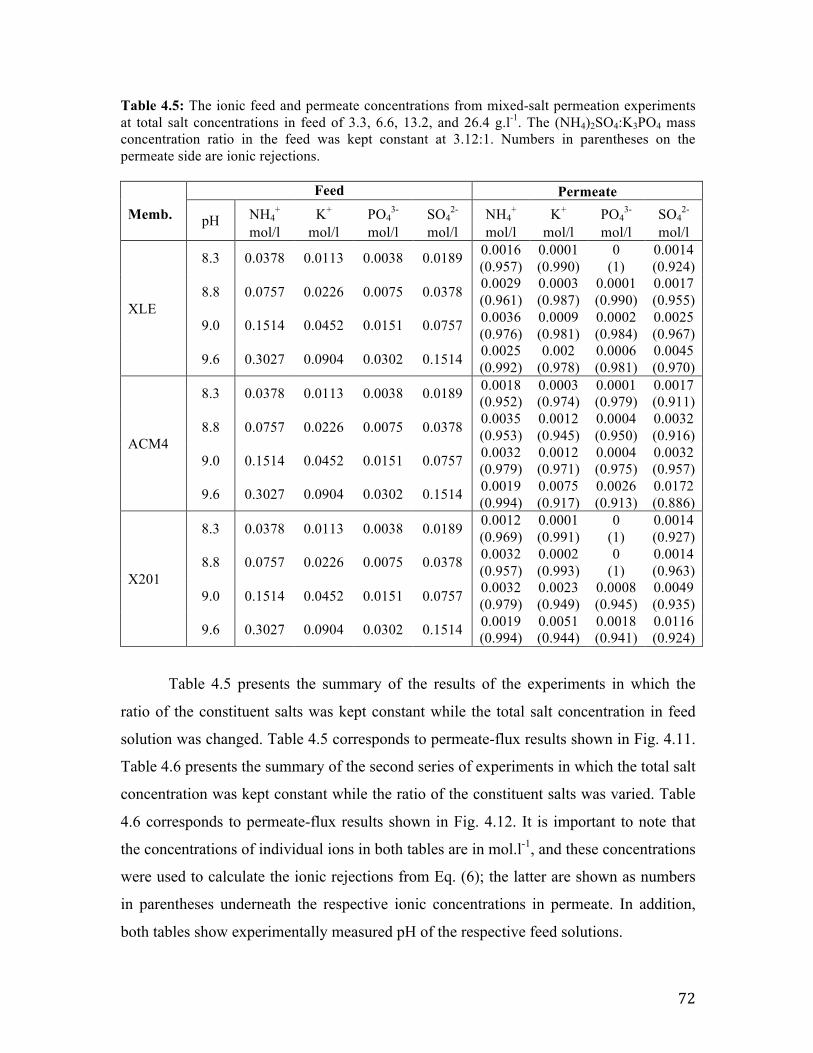
72
Table 4.5: The ionic feed and permeate concentrations from mixed-salt permeation experiments at total salt concentrations in feed of 3.3, 6.6, 13.2, and 26.4 g.l-1. The (NH4)2SO4:K3PO4 mass concentration ratio in the feed was kept constant at 3.12:1. Numbers in parentheses on the permeate side are ionic rejections.
Feed Permeate
Memb. pH NH4+ K+ PO4
3- SO42- NH4
+ K+ PO43- SO4
2-
mol/l mol/l mol/l mol/l mol/l mol/l mol/l mol/l
XLE
8.3 0.0378 0.0113 0.0038 0.0189 0.0016 (0.957)
0.0001 (0.990)
0 (1)
0.0014 (0.924)
8.8 0.0757 0.0226 0.0075 0.0378 0.0029 (0.961)
0.0003 (0.987)
0.0001 (0.990)
0.0017 (0.955)
9.0 0.1514 0.0452 0.0151 0.0757 0.0036 (0.976)
0.0009 (0.981)
0.0002 (0.984)
0.0025 (0.967)
9.6 0.3027 0.0904 0.0302 0.1514 0.0025 (0.992)
0.002 (0.978)
0.0006 (0.981)
0.0045 (0.970)
ACM4
8.3 0.0378 0.0113 0.0038 0.0189 0.0018 (0.952)
0.0003 (0.974)
0.0001 (0.979)
0.0017 (0.911)
8.8 0.0757 0.0226 0.0075 0.0378 0.0035 (0.953)
0.0012 (0.945)
0.0004 (0.950)
0.0032 (0.916)
9.0 0.1514 0.0452 0.0151 0.0757 0.0032 (0.979)
0.0012 (0.971)
0.0004 (0.975)
0.0032 (0.957)
9.6 0.3027 0.0904 0.0302 0.1514 0.0019 (0.994)
0.0075 (0.917)
0.0026 (0.913)
0.0172 (0.886)
X201
8.3 0.0378 0.0113 0.0038 0.0189 0.0012 (0.969)
0.0001 (0.991)
0 (1)
0.0014 (0.927)
8.8 0.0757 0.0226 0.0075 0.0378 0.0032 (0.957)
0.0002 (0.993)
0 (1)
0.0014 (0.963)
9.0 0.1514 0.0452 0.0151 0.0757 0.0032 (0.979)
0.0023 (0.949)
0.0008 (0.945)
0.0049 (0.935)
9.6 0.3027 0.0904 0.0302 0.1514 0.0019 (0.994)
0.0051 (0.944)
0.0018 (0.941)
0.0116 (0.924)
Table 4.5 presents the summary of the results of the experiments in which the
ratio of the constituent salts was kept constant while the total salt concentration in feed
solution was changed. Table 4.5 corresponds to permeate-flux results shown in Fig. 4.11.
Table 4.6 presents the summary of the second series of experiments in which the total salt
concentration was kept constant while the ratio of the constituent salts was varied. Table
4.6 corresponds to permeate-flux results shown in Fig. 4.12. It is important to note that
the concentrations of individual ions in both tables are in mol.l-1, and these concentrations
were used to calculate the ionic rejections from Eq. (6); the latter are shown as numbers
in parentheses underneath the respective ionic concentrations in permeate. In addition,
both tables show experimentally measured pH of the respective feed solutions.
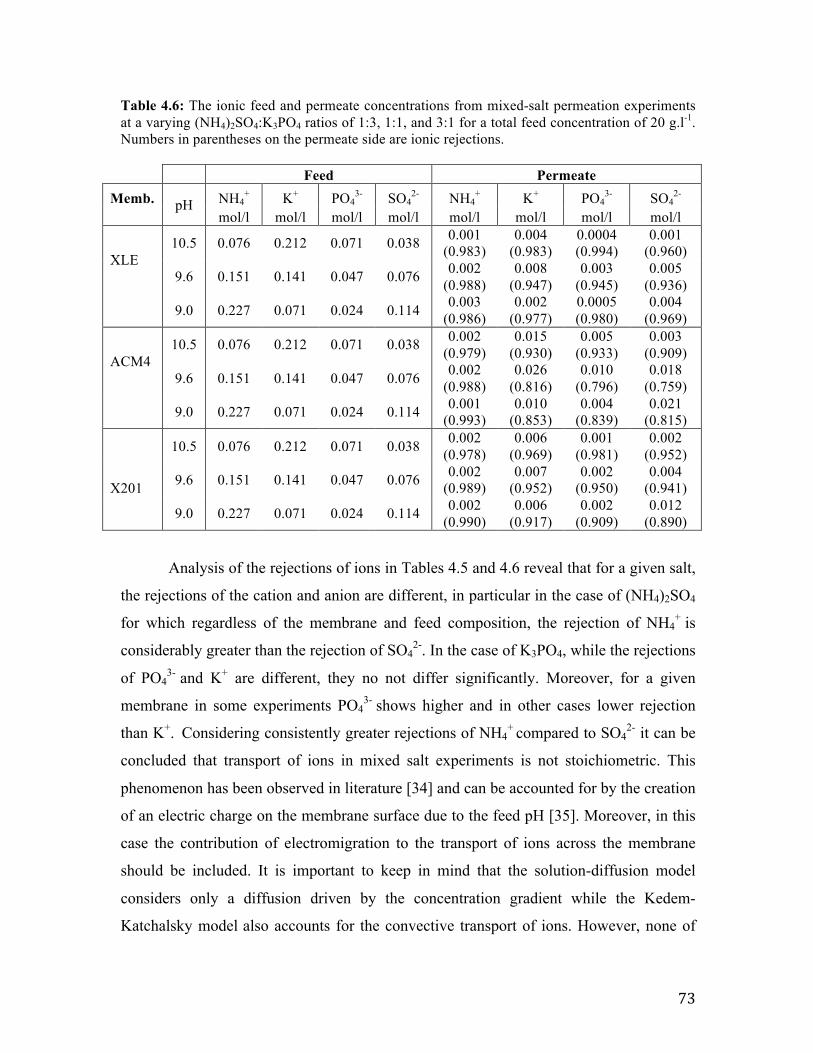
73
Table 4.6: The ionic feed and permeate concentrations from mixed-salt permeation experiments at a varying (NH4)2SO4:K3PO4 ratios of 1:3, 1:1, and 3:1 for a total feed concentration of 20 g.l-1. Numbers in parentheses on the permeate side are ionic rejections.
Feed Permeate
Memb. pH NH4+ K+ PO4
3- SO42- NH4
+ K+ PO43- SO4
2- mol/l mol/l mol/l mol/l mol/l mol/l mol/l mol/l
XLE
10.5 0.076 0.212 0.071 0.038 0.001 (0.983)
0.004 (0.983)
0.0004 (0.994)
0.001 (0.960)
9.6 0.151 0.141 0.047 0.076 0.002 (0.988)
0.008 (0.947)
0.003 (0.945)
0.005 (0.936)
9.0 0.227 0.071 0.024 0.114 0.003 (0.986)
0.002 (0.977)
0.0005 (0.980)
0.004 (0.969)
ACM4
10.5 0.076 0.212 0.071 0.038 0.002 (0.979)
0.015 (0.930)
0.005 (0.933)
0.003 (0.909)
9.6 0.151 0.141 0.047 0.076 0.002 (0.988)
0.026 (0.816)
0.010 (0.796)
0.018 (0.759)
9.0 0.227 0.071 0.024 0.114 0.001 (0.993)
0.010 (0.853)
0.004 (0.839)
0.021 (0.815)
X201
10.5 0.076 0.212 0.071 0.038 0.002 (0.978)
0.006 (0.969)
0.001 (0.981)
0.002 (0.952)
9.6 0.151 0.141 0.047 0.076 0.002 (0.989)
0.007 (0.952)
0.002 (0.950)
0.004 (0.941)
9.0 0.227 0.071 0.024 0.114 0.002 (0.990)
0.006 (0.917)
0.002 (0.909)
0.012 (0.890)
Analysis of the rejections of ions in Tables 4.5 and 4.6 reveal that for a given salt,
the rejections of the cation and anion are different, in particular in the case of (NH4)2SO4
for which regardless of the membrane and feed composition, the rejection of NH4+ is
considerably greater than the rejection of SO42-. In the case of K3PO4, while the rejections
of PO43- and K+ are different, they no not differ significantly. Moreover, for a given
membrane in some experiments PO43- shows higher and in other cases lower rejection
than K+. Considering consistently greater rejections of NH4+ compared to SO4
2- it can be
concluded that transport of ions in mixed salt experiments is not stoichiometric. This
phenomenon has been observed in literature [34] and can be accounted for by the creation
of an electric charge on the membrane surface due to the feed pH [35]. Moreover, in this
case the contribution of electromigration to the transport of ions across the membrane
should be included. It is important to keep in mind that the solution-diffusion model
considers only a diffusion driven by the concentration gradient while the Kedem-
Katchalsky model also accounts for the convective transport of ions. However, none of
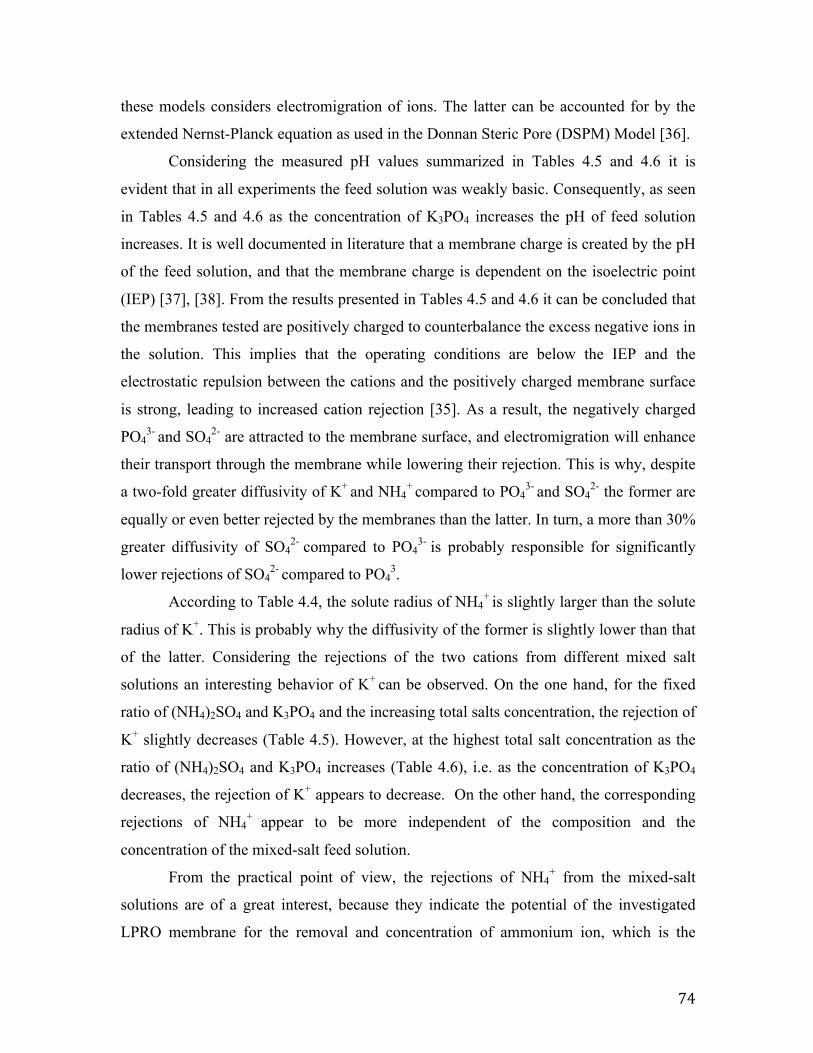
74
these models considers electromigration of ions. The latter can be accounted for by the
extended Nernst-Planck equation as used in the Donnan Steric Pore (DSPM) Model [36].
Considering the measured pH values summarized in Tables 4.5 and 4.6 it is
evident that in all experiments the feed solution was weakly basic. Consequently, as seen
in Tables 4.5 and 4.6 as the concentration of K3PO4 increases the pH of feed solution
increases. It is well documented in literature that a membrane charge is created by the pH
of the feed solution, and that the membrane charge is dependent on the isoelectric point
(IEP) [37], [38]. From the results presented in Tables 4.5 and 4.6 it can be concluded that
the membranes tested are positively charged to counterbalance the excess negative ions in
the solution. This implies that the operating conditions are below the IEP and the
electrostatic repulsion between the cations and the positively charged membrane surface
is strong, leading to increased cation rejection [35]. As a result, the negatively charged
PO43- and SO4
2- are attracted to the membrane surface, and electromigration will enhance
their transport through the membrane while lowering their rejection. This is why, despite
a two-fold greater diffusivity of K+ and NH4+ compared to PO4
3- and SO42- the former are
equally or even better rejected by the membranes than the latter. In turn, a more than 30%
greater diffusivity of SO42- compared to PO4
3- is probably responsible for significantly
lower rejections of SO42- compared to PO4
3.
According to Table 4.4, the solute radius of NH4+ is slightly larger than the solute
radius of K+. This is probably why the diffusivity of the former is slightly lower than that
of the latter. Considering the rejections of the two cations from different mixed salt
solutions an interesting behavior of K+ can be observed. On the one hand, for the fixed
ratio of (NH4)2SO4 and K3PO4 and the increasing total salts concentration, the rejection of
K+ slightly decreases (Table 4.5). However, at the highest total salt concentration as the
ratio of (NH4)2SO4 and K3PO4 increases (Table 4.6), i.e. as the concentration of K3PO4
decreases, the rejection of K+ appears to decrease. On the other hand, the corresponding
rejections of NH4+ appear to be more independent of the composition and the
concentration of the mixed-salt feed solution.
From the practical point of view, the rejections of NH4+ from the mixed-salt
solutions are of a great interest, because they indicate the potential of the investigated
LPRO membrane for the removal and concentration of ammonium ion, which is the
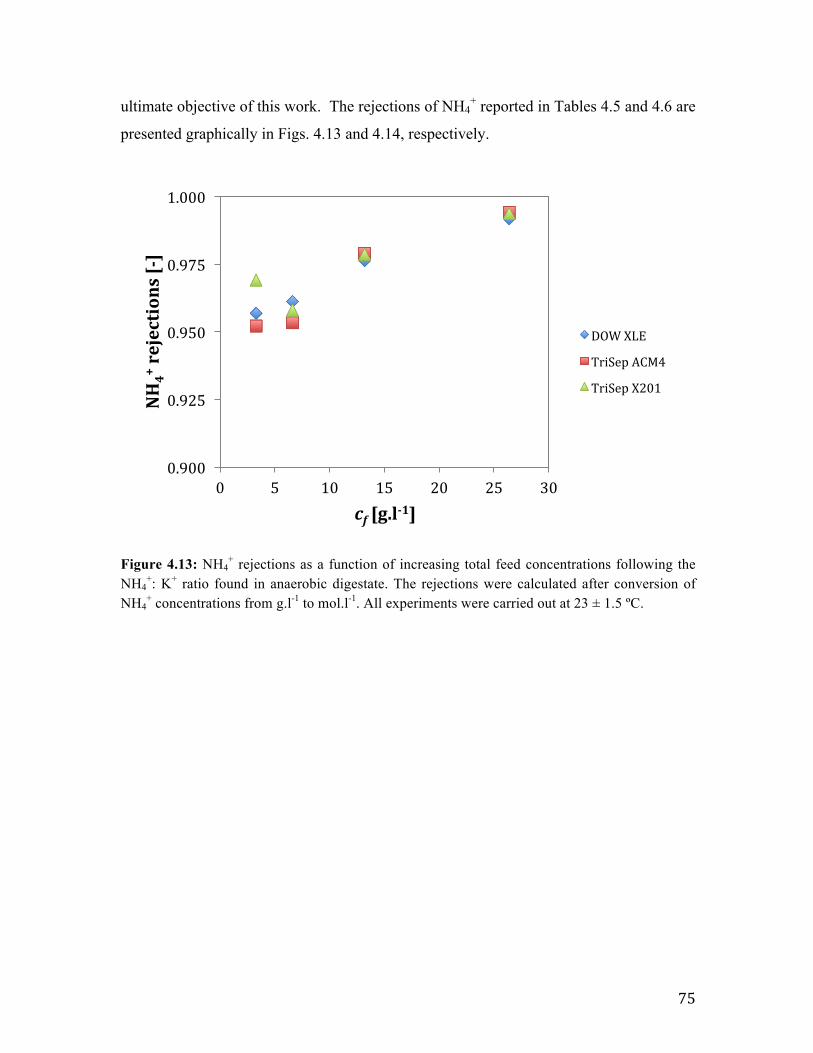
75
ultimate objective of this work. The rejections of NH4+ reported in Tables 4.5 and 4.6 are
presented graphically in Figs. 4.13 and 4.14, respectively.
Figure 4.13: NH4
+ rejections as a function of increasing total feed concentrations following the NH4
+: K+ ratio found in anaerobic digestate. The rejections were calculated after conversion of NH4
+ concentrations from g.l-1 to mol.l-1. All experiments were carried out at 23 ± 1.5 ºC.
0.900
0.925
0.950
0.975
1.000
0 5 10 15 20 25 30
NH4+rejections[-]
cf[g.l-1]
DOWXLE
TriSepACM4
TriSepX201
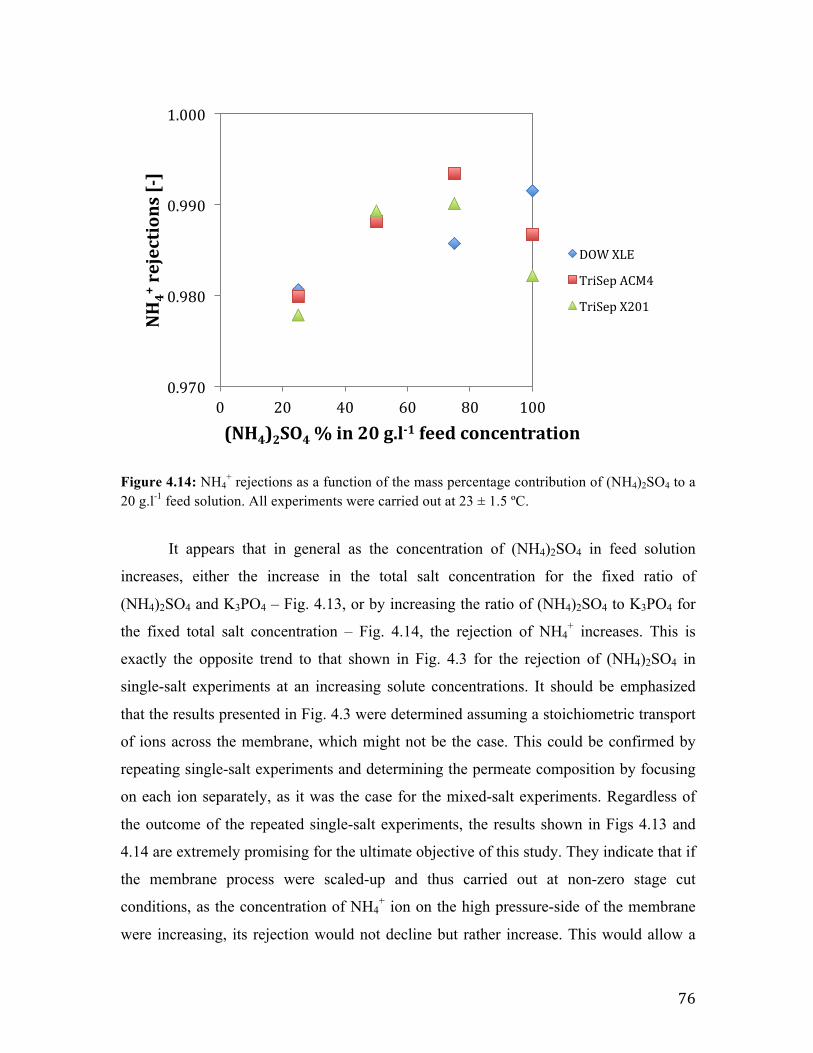
76
Figure 4.14: NH4
+ rejections as a function of the mass percentage contribution of (NH4)2SO4 to a 20 g.l-1 feed solution. All experiments were carried out at 23 ± 1.5 ºC.
It appears that in general as the concentration of (NH4)2SO4 in feed solution
increases, either the increase in the total salt concentration for the fixed ratio of
(NH4)2SO4 and K3PO4 – Fig. 4.13, or by increasing the ratio of (NH4)2SO4 to K3PO4 for
the fixed total salt concentration – Fig. 4.14, the rejection of NH4+ increases. This is
exactly the opposite trend to that shown in Fig. 4.3 for the rejection of (NH4)2SO4 in
single-salt experiments at an increasing solute concentrations. It should be emphasized
that the results presented in Fig. 4.3 were determined assuming a stoichiometric transport
of ions across the membrane, which might not be the case. This could be confirmed by
repeating single-salt experiments and determining the permeate composition by focusing
on each ion separately, as it was the case for the mixed-salt experiments. Regardless of
the outcome of the repeated single-salt experiments, the results shown in Figs 4.13 and
4.14 are extremely promising for the ultimate objective of this study. They indicate that if
the membrane process were scaled-up and thus carried out at non-zero stage cut
conditions, as the concentration of NH4+ ion on the high pressure-side of the membrane
were increasing, its rejection would not decline but rather increase. This would allow a
0.970
0.980
0.990
1.000
0 20 40 60 80 100
NH4+rejections[-]
(NH4)2SO4%in20g.l-1feedconcentration
DOWXLE
TriSepACM4
TriSepX201
77
very efficient concentration of the NH4+ ions in the reject stream, even in relatively low-
stage cut conditions.
Considering the rejection of NH4+ by different membranes in Figs 4.13 and 4.14,
there is no consistent trend with respect to which membrane shows the highest rejection.
It can be seen that although TriSep X201 appears to be the best at the lowest total feed
concentration in Fig. 4.13, it is the worst one for the lowest ratio of (NH4)2SO4 to K3PO4
in Fig. 4.14. It is important to note that although it is difficult to rank the investigated
membranes on the basis of NH4+ rejection, they all show excellent rejections for this
cation. It is easier to rank the investigated membranes on the basis of the permeate flux
(Figs. 4.11 and 4.12), according to which DOW XLE appears to be the best, followed by
TriSep ACM4 and TriSep X201. However, despite some differences in permeate flux all
of these membranes would be suitable for the concentration NH4+ ion from the mixed-salt
solutions containing (NH4)2SO4 and K3PO4.
4.5 Conclusions In this paper the characterization of membranes using the solution-diffusion and
Kedem-Katchalsky models for feed solutions of (NH4)2SO4 and K3PO4 have been carried
out, and it has been concluded that both models are inadequately equipped to explain the
observed results. A previous paper carried out by the team members also found evidence
of solute transport by mechanisms other than diffusion through RO membranes, and it
concluded that the basic solution-diffusion model was inadequately equipped to explain
the observed results. This was attributed to the possibility of non-stoichiometric passage
of ions through the membranes owing to the creation of a membrane surface charge, a
phenomenon caused by the pH of the feed solution. Further investigation using mixed-
salt solutions showed the presence of non-stoichiometric rejections for all experiments,
indicating that models that do not consider the effect of individual ions in the system on
total membrane performance may not be able to fully explain the transport mechanisms.
Advanced mechanistic models are therefore recommended for further characterization
purposes.
The use of membranes in the concentration of ammonium ions in feed solutions
comprising two salts has been shown to be very efficient, with a minimum NH4+ rejection
of 95.7%. The DOW XLE membrane showed high rejections for both (NH4)2SO4 and
78
NH4+ ion and had the highest permeate fluxes for both single salt and mixed salt
experiments, which makes it the best membrane for NH4+ concentration in anaerobic
digestate. The DOW XLE membrane also has the highest average rejections for all the
ions in the mixed-salt system. Further tests using this membrane with mixed-salt
solutions and other single-salt solutions are strongly recommended.
It is recommended that the single salt experiments should be redone with a focus
on ascertaining the stoichiometric nature or otherwise of membrane rejections. This can
be done using two or more salts, and the feed pH of all experiments should be monitored
to better understand the effect of feed pH on membrane surface charge, which affects
membrane performance. If non-stoichiometric rejections are observed, the mixed-salt
experiments should be characterized using mechanistic models based on the extended
Nernst-Planck equation or the Maxwell-Stefan equation.
4.6 Acknowledgements This research project was conducted in collaboration with CHFour Biogas Ltd, and was
financially supported through the NSERC (Natural Sciences and Engineering Research
Council) Engage Plus program.
Nomenclature
Symbol Title Units
σ Reflection coefficient -
ϕ Osmotic coefficient -
∆P Pressure differential Pa
∆π Osmotic pressure differential Pa
πf Osmotic pressure on feed side of membrane Pa
πp Osmotic pressure on permeate side of membrane Pa
ω Solute permeability coefficient mol.m-2.s-1.Pa-1
Am Membrane area m2
cavg Average solute concentration across the membrane mol.m-3
cf Solute concentration in feed mol.m-3
cp Solute concentration in permeate mol.m-3

79
ENP Extended Nernst-Planck
ICP-MS Inductively coupled plasma mass spectrometry
IEP Isoelectric point
ji Solute flux across the membrane mol.m-2.s-1
JV Permeate/solvent flux across the membrane kg.m-2s-1
LPRO Low-pressure reverse osmosis
ρ Density kg.m-3
Solute permeance across the membrane m.s-1
Solvent permeance across the membrane kg.m-2.s-1.Pa-1
R Solute rejection -
RO Reverse osmosis
UF Ultrafiltration
VP Permeation rate through the membrane kg.s-1
4.7 References [1] W. R. Bowen, a. W. Mohammad, and N. Hilal, “Characterisation of nanofiltration
membranes for predictive purposes - Use of salts, uncharged solutes and atomic
force microscopy,” J. Memb. Sci., vol. 126, no. 1, pp. 91–105, 1997.
[2] B. Van der Bruggen, M. Mänttäri, and M. Nyström, “Drawbacks of applying
nanofiltration and how to avoid them: A review,” Sep. Purif. Technol., vol. 63, no.
2, pp. 251–263, 2008.
[3] V. K. Gupta, S.-T. Hwang, W. B. Krantz, and A. R. Greenberg, “Characterization
of nanofiltration and reverse osmosis membrane performance for aqueous salt
solutions using irreversible thermodynamics,” Desalination, vol. 208, no. 1–3, pp.
1–18, 2007.
[4] V. Silva, V. Geraldes, a. M. Brites Alves, L. Palacio, P. Prádanos, and a.
Hernández, “Multi-ionic nanofiltration of highly concentrated salt mixtures in the
PM ,S
PM ,W
80
seawater range,” Desalination, vol. 277, no. 1–3, pp. 29–39, 2011.
[5] X. Jin, X. Huang, and E. M. V Hoek, “Role of specific ion interactions in seawater
RO membrane fouling by alginic acid,” Environ. Sci. Technol., vol. 43, no. 10, pp.
3580–3587, 2009.
[6] a. M. Hidalgo, G. León, M. Gómez, M. D. Murcia, D. S. Barbosa, and P. Blanco,
“Application of the solution-diffusion model for the removal of atrazine using a
nanofiltration membrane,” Desalin. Water Treat., vol. 51, no. 10–12, pp. 2244–
2252, 2013.
[7] F. N. Ahmed, “Modified Spiegler-Kedem Model to Predict the Rejection and Flux
of Nanofiltration Processes at High NaCl Concentrations,” University of Ottawa,
2013.
[8] W. R. Bowen and J. S. Welfoot, “Modelling the performance of membrane
nanofiltration-critical assessment and model development,” Chem. Eng. Sci., vol.
57, no. 7, pp. 1121–1137, 2002.
[9] M. Mondor, L. Masse, D. Ippersiel, F. Lamarche, and D. I. Massé, “Use of
electrodialysis and reverse osmosis for the recovery and concentration of ammonia
from swine manure,” Bioresour. Technol., vol. 99, no. 15, pp. 7363–7368, 2008.
[10] R. Einav, K. Harussi, and D. Perry, “The footprint of the desalination processes on
the environment,” Desalination, vol. 152, no. 1–3, pp. 141–154, 2003.
[11] S. Sridhar, A. Kale, and a. a. Khan, “Reverse osmosis of edible vegetable oil
industry effluent,” J. Memb. Sci., vol. 205, no. 1–2, pp. 83–90, 2002.
[12] L. F. Greenlee, D. F. Lawler, B. D. Freeman, B. Marrot, and P. Moulin, “Reverse
osmosis desalination: Water sources, technology, and today’s challenges,” Water
Res., vol. 43, no. 9, pp. 2317–2348, 2009.
[13] A. Little, “Can Desalination Counter California’s Drought? - The New Yorker,”
New Yorker, 2015. [Online]. Available:
http://www.newyorker.com/tech/elements/can-desalination-counter-the-drought.
[Accessed: 13-Oct-2015].
81
[14] I. D. Association, “Desalination by the Numbers | IDA,” Desalination 101, 2014.
[Online]. Available: http://idadesal.org/desalination-101/desalination-by-the-
numbers/. [Accessed: 13-Oct-2015].
[15] D. M. Babson, K. Bellman, S. Prakash, and D. E. Fennell, “Anaerobic digestion
for methane generation and ammonia reforming for hydrogen production:
Athermodynamic energy balance of a model system to demonstrate net energy
feasibility,” Biomass and Bioenergy, vol. 56, pp. 493–505, 2013.
[16] L. Appels, J. Baeyens, J. Degrève, and R. Dewil, “Principles and potential of the
anaerobic digestion of waste-activated sludge,” Prog. Energy Combust. Sci., vol.
34, no. 6, pp. 755–781, 2008.
[17] J. H. Kim, D. H. Um, and O. C. Kwon, “Hydrogen production from burning and
reforming of ammonia in a microreforming system,” Energy Convers. Manag.,
vol. 56, pp. 184–191, 2012.
[18] T. Wirthensohn, F. Waeger, L. Jelinek, and W. Fuchs, “Ammonium removal from
anaerobic digester effluent by ion exchange,” Water Sci. Technol., vol. 60, no. 1,
pp. 201–210, 2009.
[19] J. Desloover, A. Abate Woldeyohannis, W. Verstraete, N. Boon, and K. Rabaey,
“Electrochemical resource recovery from digestate to prevent ammonia toxicity
during anaerobic digestion,” Environ. Sci. Technol., vol. 46, no. 21, pp. 12209–
12216, 2012.
[20] B. Lauterböck, M. Ortner, R. Haider, and W. Fuchs, “Counteracting ammonia
inhibition in anaerobic digestion by removal with a hollow fiber membrane
contactor,” Water Res., vol. 46, no. 15, pp. 4861–4869, 2012.
[21] M. L. Gerardo, N. H. M. Aljohani, D. L. Oatley-Radcliffe, and R. W. Lovitt,
“Moving towards sustainable resources: recovery and fractionation of nutrients
from dairy manure digestate using membranes,” Water Res., vol. 80, pp. 80–89,
2015.
[22] D. . Nurdan Doruk, “A Novel Solution for Biogas Applications in Poultry
82
Industry: CLAMBS approach,” J. Bioprocess. Biotech., vol. 05, no. 02, 2015.
[23] S. H. Byeon, B. K. Lee, and B. Raj Mohan, “Removal of ammonia and particulate
matter using a modified turbulent wet scrubbing system,” Sep. Purif. Technol., vol.
98, pp. 221–229, 2012.
[24] D. Carter, L. Rose, T. Awobusuyi, M. Gauthier, F. H. Tezel, and B. Kruczek,
“Characterization of commercial RO membranes for the concentration of ammonia
converted to ammonium sulfate from anaerobic digesters,” Desalination, vol. 368,
pp. 127–134, 2015.
[25] K. S. Spiegler and O. Kedem, “Thermodynamics of hyperfiltration (reverse
osmosis): criteria for efficient membranes,” Desalination, vol. 1, no. 4, pp. 311–
326, 1966.
[26] M. El Guendouzi, a. Mounir, and a. Dinane, “Water activity, osmotic and activity
coefficients of aqueous solutions of Li2SO4, Na2SO4, K2SO4, (NH4)2SO4,
MgSO4, MnSO4, NiSO4, CuSO4, and ZnSO4 at T = 298.15 K,” J. Chem.
Thermodyn., vol. 35, no. 2, pp. 209–220, 2003.
[27] M. El Guendouzi and A. Benbiyi, “Thermodynamic properties of binary aqueous
solutions of orthophosphate salts, sodium, potassium and ammonium at
T=298.15K,” Fluid Phase Equilib., vol. 369, pp. 68–85, 2014.
[28] Sterlitech, “Reverse Osmosis Membranes,” 2015. [Online]. Available:
http://www.sterlitech.com/reverse-osmosis-ro-membrane-ymxle3001.html.
[29] P. Xu, J. E. Drewes, T. U. Kim, C. Bellona, and G. Amy, “Effect of membrane
fouling on transport of organic contaminants in NF/RO membrane applications,” J.
Memb. Sci., vol. 279, no. 1–2, pp. 165–175, 2006.
[30] L. D. Nghiem, “Removal of emerging trace organic contaminants by nanofiltration
and reverse osmosis,” University of Wollongong, 2005.
[31] A. M. Comerton, R. C. Andrews, D. M. Bagley, and C. Hao, “The rejection of
endocrine disrupting and pharmaceutically active compounds by NF and RO
membranes as a function of compound and water matrix properties,” J. Memb.
83
Sci., vol. 313, no. 1–2, pp. 323–335, 2008.
[32] K. M. Persson, V. Gekas, and G. Trägårdh, “Study of membrane compaction and
its influence on ultrafiltration water permeability,” J. Memb. Sci., vol. 100, no. 2,
pp. 155–162, 1995.
[33] A. E. Yaroshchuk, “The role of imperfections in the solute transfer in
nanofiltration,” J. Memb. Sci., vol. 239, no. 1, pp. 9–15, 2004.
[34] Y. Zhao, J. T. Ã, and S. Hong, “Combined influence of membrane surface
properties and feed water qualities on RO / NF mass transfer , a pilot study,” vol.
39, pp. 1233–1244, 2005.
[35] J. Luo and Y. Wan, “Effects of pH and salt on nanofiltration-a critical review,” J.
Memb. Sci., vol. 438, no. July 2015, pp. 18–28, 2013.
[36] W. R. R. Bowen and a W. A. W. Mohammad, “Characterization and prediction of
nanofiltration membrane performance-a general assessment,” Chem. Eng. Res.
Des., vol. 76, no. November, pp. 885–893, 1998.
[37] S. Szoke, G. Patzay, and L. Weiser, “Characteristics of thin-film nanofiltration
membranes at various pH-values,” Desalination, vol. 151, pp. 123–129, 2003.
[38] M. R. Teixeira, M. J. Rosa, and M. Nyström, “The role of membrane charge on
nanofiltration performance,” J. Memb. Sci., vol. 265, no. 1–2, pp. 160–166, 2005.
84
Chapter 5: Characterization of Low Pressure RO membranes
for Removal and Concentration of Ammonia from Anaerobic
Digestate using Donnan Steric Pore Model
Tolulope D. Awobusuyi, F. Handan Tezel, Boguslaw Kruczek
Department of Chemical and Biological Engineering, University of Ottawa, 161 Louis
Pasteur, Ottawa, Ontario K1N 6N5, Canada
85
Abstract Membrane technology is the preferred separation method for a wide selection of
industries, including the agriculture and desalination industries. This is due to a number
of advantages: higher separation efficiencies at lower costs, environmentally benign
processes and materials, and low capital costs. However, engineers’ understanding of the
solute and solvent behavior within membranes is an emerging field, and most of the
models available are limited as to the parameters they can adequately describe.
Membrane characterization is also difficult, and inconsistencies in physical properties
across membrane sheets have been observed in literature.
In this paper, three low-pressure reverse osmosis membranes have been
characterized using the Donnan Steric Pore model (DSPM), which accounts for diffusive,
convective, and electromigration contributions to ionic transport through the membranes.
The membranes are to be used for the removal and concentration of ammonium ions in
anaerobic digestate, and have been tested using separate solutions of ammonium sulfate
and tripotassium phosphate salts. The parameters by which the membranes have been
characterized are the pore radius, rp; the effective membrane thickness, L/Ak; and the
membrane surface charge, X. The presence of a membrane surface charge has been
shown and its effects on non-stoichiometric ionic rejections have also been examined.
Keywords: DSPM (Donnan Steric Pore model), Nernst-Planck equation, Membrane
characterization, non-stoichiometric rejections, effects of feed pressure and pH on
membrane performance, removal and concentration of ammonium ions in anaerobic
digestate.
86
5.1 Introduction Membrane separation processes are applied in many industries [1] for a variety of
separation processes: desalination [2]–[5], agriculture [2], [6], [7], and healthcare
industries [3], [7], [8] are some examples. These industries are generally involved in the
production of high-purity chemical compounds and/or the production of waste that are
considered hazardous to the environment. Therefore, efficient separation processes–as
production and treatment steps–are a necessity [9]–[11]. In this paper three low pressure
reverse osmosis (LPRO) membranes have been characterized using ammonium sulfate
and tripotassium phosphate and the Donnan steric pore model. These membranes will be
used in the concentration of ammonium ions in anaerobic digester effluent, which
contains the ions that comprise (NH4)2SO4 and K3PO4.
The models available for characterizing membranes used in solute/solvent
separations do not always provide adequate descriptions of the membrane properties.
Literature written on the subject agree that sieving, electrical and dielectric effects govern
the rejection abilities of reverse osmosis (RO), LPRO and nanofiltration (NF) membranes
[1], [7], and any model used in characterization must take these into consideration. In
general, reverse osmosis membranes display higher solute rejections than nanofiltration
membranes primarily because of size exclusion [12], but the effects of electrostatic
interactions on the overall rejections cannot be ignored in either case. The effects of the
membrane surface charge on ionic rejections, especially in cases of multiple ions being
present in the feed, is also important [13]. The most common method for incorporating
these effects is the extended Nernst-Planck (ENP) equation [1], [7], which is used in
combination with a number of models: the pore model, the space charge model, and the
Teorell-Meyer-Sievers model [1], [14]. The widespread use of the extended Nernst-
Planck equation is due to its provision of ionic species transportation terms for each of
the transportation modes [15]. Ion-ion interaction and ion-membrane interaction also play
an important role in membrane performance and are accounted for using models based on
the extended Nernst-Planck equation.
Models used in general are grouped in two categories: mechanistic and
phenomenological models. In case of membranes, the mechanistic models account for ion
transport through the membrane via the different transportation modes. The
87
phenomenological models can be described as “mechanism-independent” [7], and do not
account for ionic transport, as the membrane is assumed to be near to equilibrium as a
black box during solvent transport [8], [15]. There is the solution-diffusion model which,
while being the most common model used in the characterization of polymeric
membranes, has been shown to have limitations with respect to characterizing
nanofiltration membranes as it does not account for convective transport through the
membranes [2], [6]. This problem is rectified by the use of the Kedem-Katchalsky model
or modifications to this model, such as the Spiegler-Kedem-Katchalsky model or a
combination of the Spiegler-Kedem combination with liquid film theory [7], [15]. Models
with the extended Nernst-Planck equation as a fundamental equation are commonly
referred to as mechanistic models.
The effects of feed pH and applied pressure on membrane rejections cannot be
understated. Changes in pressure affect the significant contributions of diffusion,
convection, and electromigration to overall solute flux, and overall solute rejection.
Effects of the feed pH may include an increase in estimated pore sizes and effective
membrane thickness [16], [17], changes in membrane surface charge from positive to
negative as the pH increases, although this is also affected by the nature of the solution
[18], [19]. These have significant effects on overall membrane performance and should
be taken into consideration when carrying out membrane characterization.
In this paper the results from permeation experiments for the removal and
concentration of ammonia from anaerobic digestate using three low-pressure reverse
osmosis (LPRO) membranes have been characterized using the Donnan Steric Pore
Model (DSPM), which is based on the extended Nernst-Planck equation. The membranes
were tested using separate solutions of ammonium sulfate and tripotassium phosphate
solutions in a reverse osmosis process. The objectives of these tests were to determine the
effects of feed pH and pressure changes on membrane activity and to determine the
stoichiometric nature of the ionic rejections. A previous paper submitted for publication
had shown non-stoichiometric rejections for feed solutions containing two salts and it
was proposed to observe if the same behavior held true for single-salt solutions. The
effect of pH on the stoichiometry of the rejections will provide important information for
88
the final application, which is the concentration of ammonium in anaerobic digester
effluent using membranes.
5.2 Theoretical background Ionic transport through polymeric membranes is dependent on a number of
factors: the pore radius, rp; the nature of the membrane polymer; the concentration of the
feed; and the effective membrane thickness, L/Ak. Phenomenological models do not
account for these in great detail, as it is assumed that the membrane functions as a “black
box” in which the transport observed cannot be adequately explained from our existing
fundamental knowledge [8], [15]. However, innovations in computational analysis [20]–
[22] and greater understanding of the complex interrelationships between ions, polymeric
materials, and solutes has led to the rise of mechanistic models that predict both transport
parameters and the effective contribution of the individual transport mechanisms to the
total solute flux. These models are based on either the Maxwell-Stefan or extended
Nernst-Planck equations, although the extended Nernst-Planck equation is the more
commonly used one of the two.
The extended Nernst-Planck equation describes the contributions of diffusion,
electromigration, and convection, respectively, to the solute flux of a given ion through a
membrane, as follows [1], [23]:
(1)
where ji is the flux of a given ion i, zi is the valence charge, ci is the concentration of an
ion i within the membrane, F is the Faraday’s constant, R is the universal gas constant, T
is the temperature, Jv is the measured solvent flux, and Di.p is the ionic diffusivity of ion i.
Di,p is given as:
Di,p = Ki,d ×Di,∞ (2)
where Di,∞ is the ionic diffusivity at infinite dilution. Diffusive, electromigration, and
convective transport are corrected for hindrances to transport for systems with ionic radii
comparable to pore radii [25]–[27]. These hindrance factors, Ki,d and Ki,c, are dependent
on the solute radius to pore radius ratio, λ [1], and are applied as corrections to the ionic
ji= −Di,p
dcidx
−ziciDi,p
RTF dψdx
+Ki,cciJv
89
diffusivity at infinite dilution and the solute volume carried through the membrane by the
permeate flux, respectively. Bowen et al. [1] provides the formula for calculating the
hindered factors, which are based on previous work done by Deen [28] and Bowen and
Sharif [29] for 0 < λ < 0.8. They have studied these hindrance factors for different ions
and have found that the following equations applied for all the ions they studied:
32
, 224.0154.130.20.1 λλλ ++−=diK (3)
Ki,c =1.0+ 0.054λ − 0.988λ2 + 0.441λ3 (4)
It must be noted that these relationships work on the assumptions of an incompletely-
developed solute velocity and homogeneous transport velocity across the membrane [1],
[30].
The diffusion and electromigration terms in Eq (1) have driving forces of
concentration gradient, dcidx
, and an electric potential difference, dψdx
, respectively. In the
case of uncharged solutes, the electromigration term is taken to be nonexistent [1], [16],
[24].
The use of an electric potential gradient to calculate the electromigration
contribution is facilitated by the assumption of a constant electric field within the
membrane pores and electroneutrality in both the bulk solutions and inside the membrane
[1], [15]. The zero current condition is expressed as:
(5)
The conditions of electroneutrality are expressed as follows:
(6a)
(6b)
where Ci is the bulk concentration of a given ion i, ci is the concentration of ion i inside
the membrane, and X is the membrane surface charge, which is assumed to be constant
throughout the membrane [1].
I = F zi ji = 0i=1
n
∑
ziCi = 0i=1
n
∑
zici = −Xi=1
n
∑
90
For systems operating under a low stage cut (ratio of permeate to the feed), the
solute flux, ji, can also be expressed as:
ji =Ci,p × JV (7)
where Ci,p is the permeate concentration and Jv is the water (solvent) flux through the
membrane. The concentration gradient of an ion i through the membrane is derived by
substituting Eq. (7) into Eq. (1) and by rearranging it, as follows:
(8)
By assuming that the conditions of electroneutrality are applicable to the segments
inside the membrane the electric potential, dψdx
, can be calculated by rearranging
equation (1) for all the ions i in the system. The electric potential gradient is cumulative
for all ions in the system and can thus be derived from Eq. (8):
(9)
Using the boundary conditions and satisfying the conditions of electroneutrality through
the membrane for all ions can solve Equations 8 and 9 and give the concentration and
electric potential gradients. To determine the concentration just inside the membrane at
the membrane-solution interface, ci,1 and ci,n, the following equation is used with the
boundary conditions specified for the feed and permeate sides in Eq. (10) [1]:
ciCi
=ϕ exp −ziFRT
ΔψD⎛
⎝⎜
⎞
⎠⎟ (10)
where Ci is the bulk concentration on the side being considered. The bulk concentration,
Ci, on either side of the membrane is given as:
fii CCx ,;0 == , x = L;Ci =Ci,p (11)
where Ci,f and Ci,p are the feed and permeate ion concentrations at the membrane-solution
interface in the bulk phase, respectively. In Eq. (10), ∆ψD is the Donnan potential at the
interface, F is the Faraday’s constant, and ϕ is the steric partitioning coefficient, given by
the following equation [1]:
dcidx
=JvDi,p
(Ki,cci −Ci,p )−ziciRT
F dψdx
dψdx
=
Σi=1
n ziJvDi,p
(Ki,cci −Ci,p )
FRT
Σi=1
n(zi2ci )
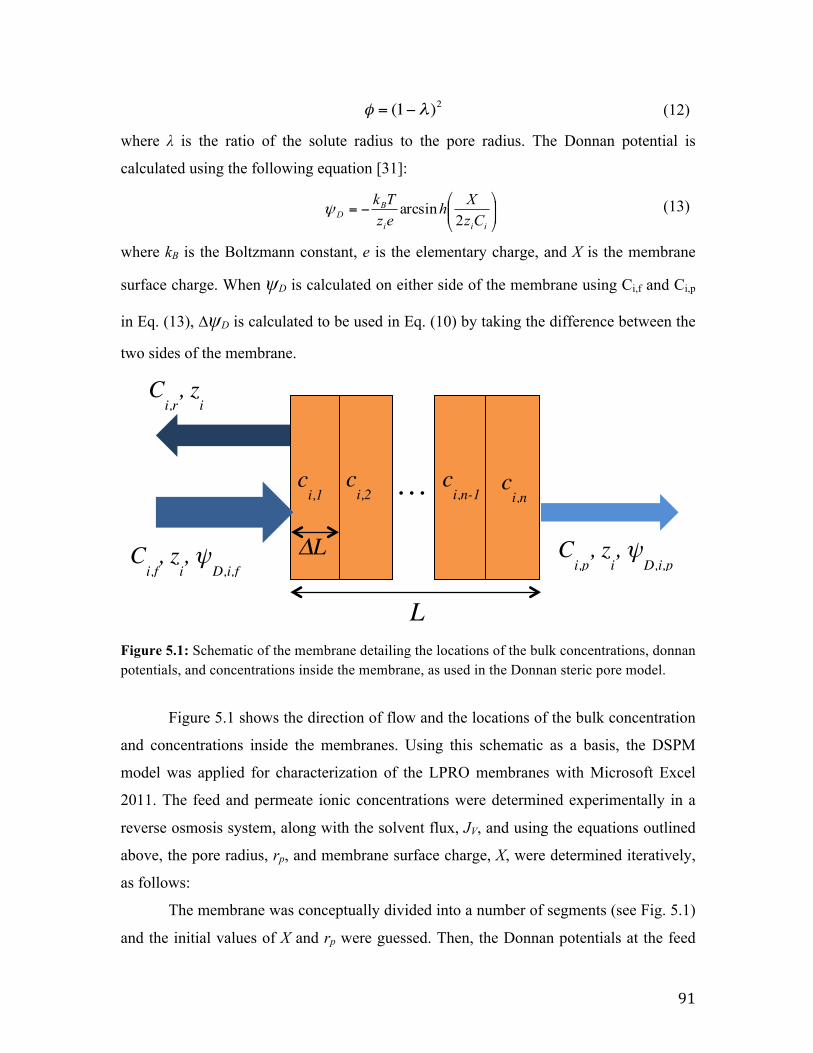
91
φ = (1−λ)2 (12)
where λ is the ratio of the solute radius to the pore radius. The Donnan potential is
calculated using the following equation [31]:
⎟⎟⎠
⎞⎜⎜⎝
⎛−=
iii
BD Cz
XhezTk
2arcsinψ (13)
where kB is the Boltzmann constant, e is the elementary charge, and X is the membrane
surface charge. When ψD is calculated on either side of the membrane using Ci,f and Ci,p
in Eq. (13), ∆ψD is calculated to be used in Eq. (10) by taking the difference between the
two sides of the membrane.
Figure 5.1: Schematic of the membrane detailing the locations of the bulk concentrations, donnan potentials, and concentrations inside the membrane, as used in the Donnan steric pore model.
Figure 5.1 shows the direction of flow and the locations of the bulk concentration
and concentrations inside the membranes. Using this schematic as a basis, the DSPM
model was applied for characterization of the LPRO membranes with Microsoft Excel
2011. The feed and permeate ionic concentrations were determined experimentally in a
reverse osmosis system, along with the solvent flux, JV, and using the equations outlined
above, the pore radius, rp, and membrane surface charge, X, were determined iteratively,
as follows:
The membrane was conceptually divided into a number of segments (see Fig. 5.1)
and the initial values of X and rp were guessed. Then, the Donnan potentials at the feed
…
Ci,f, z
i, ψ
D,i,f C
i,p, z
i, ψ
D,i,p
Ci,r
, zi
ci,1
ci,2
ci,n-1
ci,n
L
∆L
92
and permeate ends of the membrane were determined by using Equation 13 and ∆ψD is
determined. The concentrations inside the membrane segment closest to the membrane-
solution interface, ci, are determined at both the feed and permeate ends using Equation
10 with the guessed value of rp and the value obtained for ∆ψD for the guessed X. The
value of ci at the last segment next to the permeate is determined by using Eq. (10). Then,
ci in each of the subsequent membrane segments was determined using the one-step
central difference method using Equations (8) and (9). Eq. 9 was solved for dψdx
for each
segment using the calculated ci. This value of dψdx
was used in Eq. (8) for each segment
to calculatedxdci . Then, all the calculated parameters with the guessed values of rp and X
are substituted into Eq. (1) and Eq. (6b) to solve for the improved values of rp and X. This
iteration is continued for each segment, until the values of rp and X converge.
The calculated rp and the experimentally determined JV were used to determine
the effective membrane thickness, L/Ak, using the Hagen-Poiseuille equation [23] as
follows:
JV =rp2∆ P
8µ(L Ak)
(14)
5.3 Experimental Three low-pressure reverse osmosis membranes were characterized using two
different solutions of a salt comprising ions found in anaerobic digestate. The salts used
were (NH4)2SO4 and K3PO4, and these were selected on the basis of their comprising ions
found in anaerobic digestate and for their significant contributions to the total osmotic
pressure exerted by the digestate on a membrane. The salts used were analytical-grade
and were purchased from Sigma-Aldrich Canada (Oakville, Ontario). All standard
solutions were prepared using deionized water from a Super-Q Plus Water Purification
system (Etobicoke, Ontario). The permeate concentrations of K+, SO42-, and PO4
3- were
determined using an Agilent 8800 QQQ ICP-MS spectrometer (purchased from Santa
93
Clara, California, USA), and the permeate concentrations for NH4+ were determined
using an indophenol colorimetric method developed at the Advanced Research Complex,
University of Ottawa.
The ionic and salt properties are presented in Table 5.1. The diffusivities at
infinite dilution are given in literature cited in the table caption, and the corresponding
solute radii are calculated using the Stokes-Einstein equation, which is given as [28]:
Di,∞ =kBT6πηrs
(15)
The properties of the LPRO membrane characterized in this study are given in
Table 5.2.
Table 5.1: Diffusivities at infinite dilution, solute radii, feed pH, and molecular weights
of ions and salts used in the experiments in this study. The solute radii for individual ions were determined using the Stokes-Einstein equation and the ionic diffusivities were determined from literature. The feed pH was determined at a 20 g.l-1 for both salts using a handheld pH meter.
MW [g.mol-1] Solute radius, rs [nm] pH Di,∞, [m2.s-1]
K+ 39.09 0.125 - 1.96 × 10⁻⁹[a]
NH4+ 18.04 0.128 - 1.98 × 10⁻⁹[a]
SO42- 96.06 0.207 - 1.07 × 10⁻⁹[a]
PO43- 94.97 0.343 - 7.00 × 10⁻¹⁰[b]
(NH4)2SO4 132.14 - 5.9 -
K3PO4 212.27 - 10.7 -
[a] As determined by Li and Gregory, 1974 [32] [b] As determined by Krom and Berner, 1980 [33]
The acidic pH reported for (NH4)2SO4 is a result of its being the product of a
weak base, NH4OH, and a strong acid, H2SO4. The alkaline pH of K3PO4 is a result of its
being the product salt of a strong base, KOH, and a weak acid, H3PO4.

94
Table 5.2: Properties of LPRO membranes used in this study. Membrane DOW XLE TriSep ACM4 TriSep X201
Material Polyamide Polyamide Polyamide-Urea
Solvent flux [kg.m-2.s-1] a 0.0138 0.0184 0.0142
Applied pressure [× 105 Pa] a 6.90 15.50 15.50
NaCl rejection [%] at 2 g.l-1 a 98.7 99.2 99.5
pH Range a 2 - 11 2 - 11 2 - 11
Water contact angle 66.3 b 35 c 55.0 ± 1.8 d a As reported by Sterlitech, 2015 for a 2 g.l-1 NaCl feed solution at 25 ºC [34] b As measured by Xu, et al., 2006 [35] c As reported by Nghiem, L. D., 2005 [36] d As measured by Comerton, 2008 [37]
5.4 Results Ionic transport through LPRO membranes is dependent on the valence charge of
the ion, the ionic radius, the pH of the feed solution, and the interactions between ions of
the same or different valence charges in the solution surrounding the membrane [1], [21],
[38], [39]. The focal points of this paper are the effects of pH on ionic transportation and
membrane characterization using the DSPM model, both of which have been reported
here. The effects of ionic properties like diffusivity and solute radius on ionic rejections
are also briefly discussed.
5.4.1 Effect of feed pressure and pH on membrane performance: Non-stoichiometric
rejections
Permeation tests were carried out for K3PO4 and (NH4)2SO4 at two pressures (1.38
and 2.76 MPa), and the individual ionic concentrations in the permeate were measured.
These ionic concentrations were plotted for 2 different applied pressures and have been
presented in Figures 5.1 and 5.2 for K3PO4 and (NH4)2SO4, respectively.
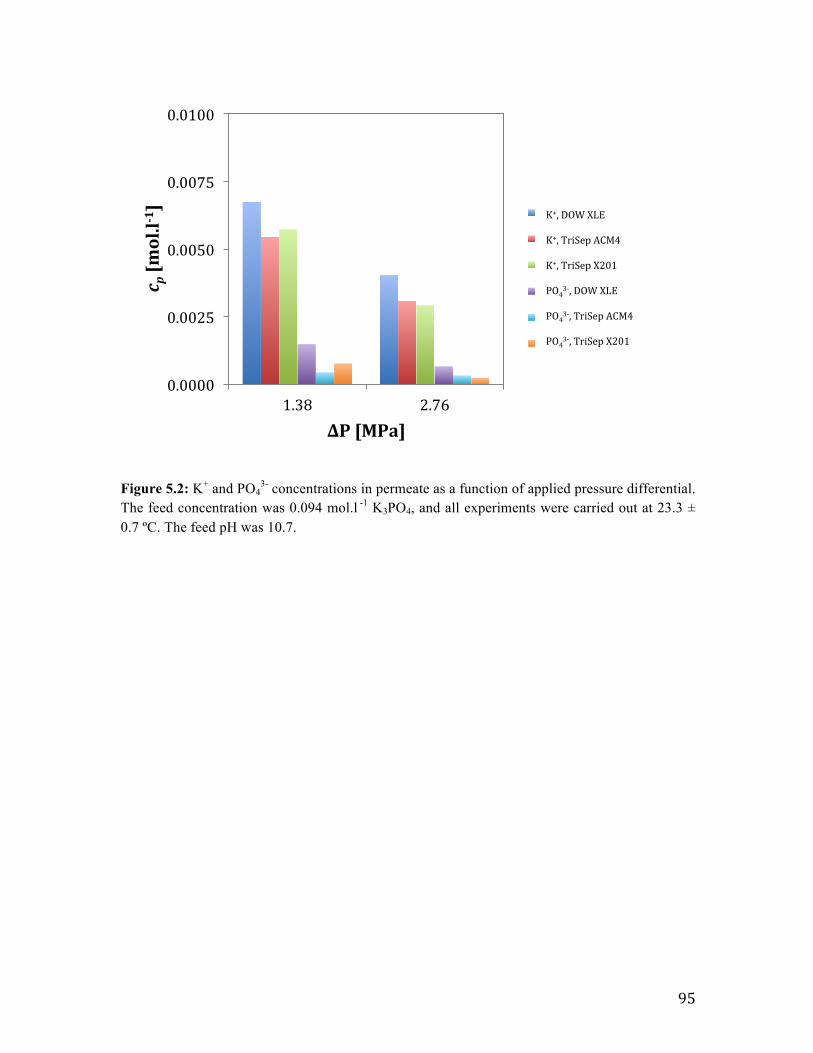
95
Figure 5.2: K+ and PO43- concentrations in permeate as a function of applied pressure differential.
The feed concentration was 0.094 mol.l -1 K3PO4, and all experiments were carried out at 23.3 ± 0.7 ºC. The feed pH was 10.7.
0.0000
0.0025
0.0050
0.0075
0.0100
1.38 2.76
c p[m
ol.l-1 ]
∆P[MPa]
K+,DOWXLE
K+,TriSepACM4
K+,TriSepX201
PO43-,DOWXLE
PO43-,TriSepACM4
PO43-,TriSepX201
K+,DOWXLEK+,TriSepACM4K+,TriSepX201PO43-,DOWXLEPO43-,TriSepACM4PO43-,TriSepX201

96
Figure 5.3: NH4+ and SO4
2- concentrations in permeate as a function of applied pressure differential. The feed concentration was 0.151 mol.l-1 (NH4)2SO4, and all experiments were carried out at 23.3 ± 0.7 ºC. The feed pH was 5.9.
Figure 5.2 shows that ionic concentrations of K+ and PO43- in the permeate do not
follow the stoichiometric ratios of the feed salt, K3PO4, from which the ions were
derived, as the concentrations of K+ in the permeate are much higher than those of PO43-.
For the DOW XLE membrane, the K+ concentration at 1.380 MPa is 0.007 mol.l-1, while
the corresponding PO43- concentration at that pressure is 0.0014 mol.l-1. The
stoichiometric K+:PO43- ratio is 3:1, as 1 mole of K3PO4 gives 3 moles of K+ and 1 mole
of PO43-. The stoichiometric ratio of K+:PO4
3- at 1.380 MPa is 5:3, while at 2.76 MPa the
ratio is 2:1 in favor of K+. This variation in concentration ratios are observed for all
membranes as pressure increases, showing that increases in pressure affect both
concentration and molar ratio of ions present in the permeate stream. In Figure 5.2 the
K+:PO43- ratio is seen to increase with increasing pressure for all membranes.
The non-stoichiometric transport is influenced by the differences in solute sizes
and ionic diffusivities, ion-membrane interaction, feed pH, and direction of ion transport
0.0000
0.0025
0.0050
0.0075
0.0100
1.38 2.76
c p[m
ol.l-1 ]
∆P[MPa]
NH4+,XLE
NH4+,ACM4
NH4+,X201
SO42-,XLE
SO42-,ACM4
SO42-,X201
NH4+,DOWXLENH4+,TriSepACM4NH4+,TriSepX201SO42-,DOWXLESO42-,TriSepACM4SO42-,TriSepX201
97
by electromigration. Size exclusion plays an important role in membrane rejection, and as
K+ ions are almost three times smaller than PO43- ions (See Table 5.1), the rejections for
K+ are lower. The specific ion-membrane interaction between K+ and reverse osmosis
membranes leads to a favorable passage of K+ ions. This has been documented in
literature [40]. The preferential passage of cations through the membranes suggests an
electrostatic attraction between the cations and the membrane surface, indicating a
negatively charged membrane surface. Dielectric effects also play a role in ion rejection,
as the presence of different dielectric charges for both the ions and membrane results in
polarization charges at the solution-membrane interface [27]. This is accounted for in the
electromigration term of the extended Nernst-Planck equation in the DSPM model.
Figure 5.3 also shows non-stoichiometric rejections for NH4+ and SO4
2- for all
experiments. Unlike the results presented in Fig. 5.2, however, anionic passage through
the membrane is higher than cationic passage. The stoichiometric NH4+:SO4
2- ratio is 2:1,
as 1 mole of (NH4)2SO4 gives 2 moles of NH4+ and 1 mole of SO4
2-. For the DOW XLE,
the stoichiometric ratio of NH4+:SO4
2- at 1.380 MPa is 1:2, while at 2.76 MPa the ratio is
1:2 in favor of SO42-. The preferential passage of SO4
2- indicates a positively charged
membrane surface that attracts SO42-, as the solute radius and diffusivities at infinite
dilution (see Table 5.1) favor NH4+ passage through the membrane. The effects of applied
pressure on NH4+ and SO4
2- rejections are also shown in Fig. 5.3, and while rejections
increase for either ion (as can be seen with decreased concentrations in the permeate) at
higher applied pressures, there is no effect on the ionic ratio of the rejections except for
the ACM4 membrane.
From Figs. 5.2 and 5.3 it can be concluded that there is a preferential passage of
ions through the membranes: K+ in Fig. 5.2 and SO42- in Fig. 5.3. It is suspected that this
is due to the effects of feed pH on the membrane surface charge, a phenomenon also
reported in available literature [41]. Permeate fluxes, pore structure, and membrane
charges are also directly affected by pH, and literature on the subject also show that
changes in pH bear directly on the electromigration of ions through the membrane [17],
[42], [43]. More importantly, membrane surface charges are known to change signs as the
pH of the feed solution changes, assuming a negative charge at a higher pH value beyond

98
the isoelectric point [44]. Kaya et al. [41] explain this as “the influence of the pH on the
dissociation of the functional groups of the membranes.” Fig. 5.2 shows a lower valence
cation being passed preferentially when compared to its higher valence anionic
counterpart. The higher diffusivity and the lower solute radius of the cation with respect
to the anion (see Table 5.1) also aids preferential passage of K+ through the membrane.
The reverse behavior is observed in Fig. 5.3, where higher valence anion (SO42-)
preferentially passes through a membrane in the presence of a lower valence cation with a
smaller solute radius and a higher diffusivity. These can be best explained as a change in
membrane surface charge, which preferentially attracts certain ions. The membrane
surface charge is likely a function of the feed pH, and lower feed pH are known to cause
positively charged membrane surfaces and vice versa [17], [45].
The exposure of membranes to alkaline solutions has been shown to increase
average pore size and the membrane thickness/porosity ratio [16], [46]. This corresponds
to a decrease in rejections, and this can be enhanced by an increase in the salt
concentrations [17], [24]. Overall, K3PO4 rejections (Figure 5.2) are lower than
(NH4)2SO4 rejections (Figure 5.3) at a feed concentration of 20 g.l-1. Increases in applied
pressure differentials also increase overall rejections, as seen in Figs. 5.2 and 5.3. The
implications of these results for practical purposes are that ionic rejections can be
influenced by the manipulation of the pH to create a membrane surface charge favorable
to the desired ion. In the concentration of NH4+ ions in anaerobic digester effluent it is
desirable to have a positively charged membrane, as seen in Figure 5.3, which repels
positively charged ions. This can be done by lowering of the overall pH of the anaerobic
digester effluent.
5.4.2 Effect of ionic properties on rejection
Table 5.1 provides the diffusivities and solute radii of the ions comprising the
salts used in this study. Smaller ions have higher diffusivities and this may have an effect
on ionic rejections, as disproportionately paired ions (K+ and PO43-) are seen to show
disproportionate passage through the membranes, with the smaller ion displaying
preferential passage. However, the feed pH determines the membrane surface charge, and
valence charge of the ion determines its attraction or repulsion to the membrane surface.
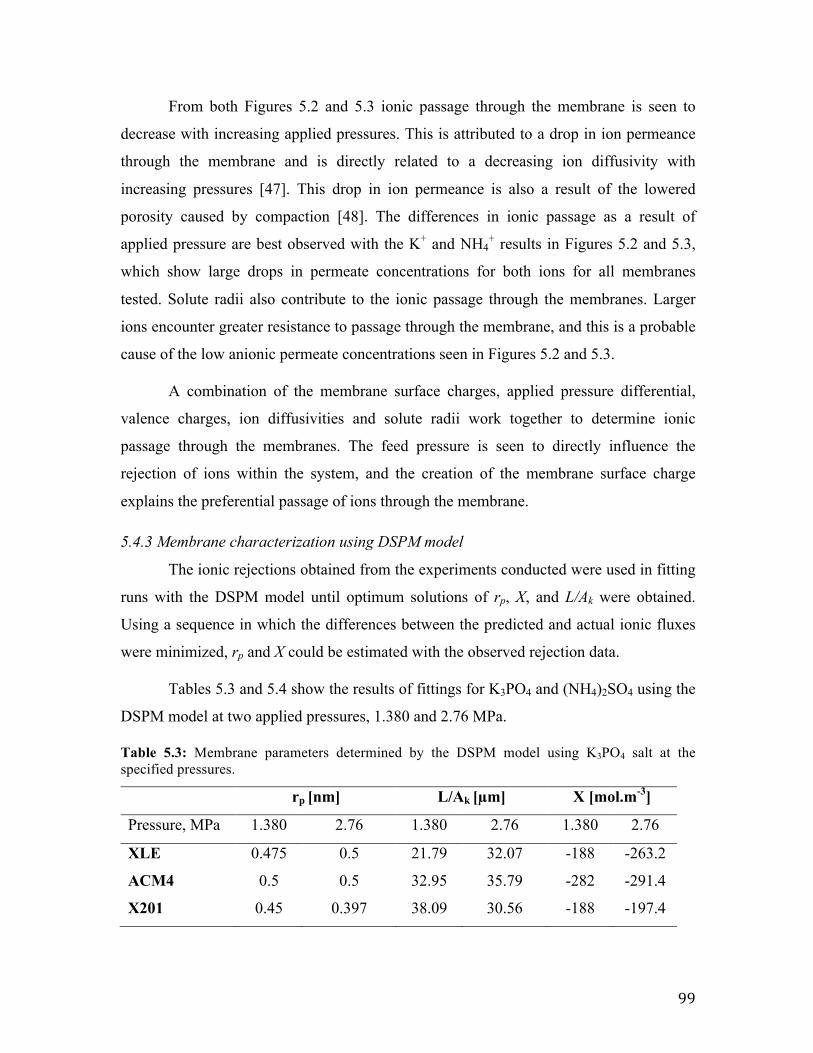
99
From both Figures 5.2 and 5.3 ionic passage through the membrane is seen to
decrease with increasing applied pressures. This is attributed to a drop in ion permeance
through the membrane and is directly related to a decreasing ion diffusivity with
increasing pressures [47]. This drop in ion permeance is also a result of the lowered
porosity caused by compaction [48]. The differences in ionic passage as a result of
applied pressure are best observed with the K+ and NH4+ results in Figures 5.2 and 5.3,
which show large drops in permeate concentrations for both ions for all membranes
tested. Solute radii also contribute to the ionic passage through the membranes. Larger
ions encounter greater resistance to passage through the membrane, and this is a probable
cause of the low anionic permeate concentrations seen in Figures 5.2 and 5.3.
A combination of the membrane surface charges, applied pressure differential,
valence charges, ion diffusivities and solute radii work together to determine ionic
passage through the membranes. The feed pressure is seen to directly influence the
rejection of ions within the system, and the creation of the membrane surface charge
explains the preferential passage of ions through the membrane.
5.4.3 Membrane characterization using DSPM model
The ionic rejections obtained from the experiments conducted were used in fitting
runs with the DSPM model until optimum solutions of rp, X, and L/Ak were obtained.
Using a sequence in which the differences between the predicted and actual ionic fluxes
were minimized, rp and X could be estimated with the observed rejection data.
Tables 5.3 and 5.4 show the results of fittings for K3PO4 and (NH4)2SO4 using the
DSPM model at two applied pressures, 1.380 and 2.76 MPa.
Table 5.3: Membrane parameters determined by the DSPM model using K3PO4 salt at the specified pressures.
rp [nm] L/Ak [µm] X [mol.m-3]
Pressure, MPa 1.380 2.76 1.380 2.76 1.380 2.76
XLE 0.475 0.5 21.79 32.07 -188 -263.2
ACM4 0.5 0.5 32.95 35.79 -282 -291.4
X201 0.45 0.397 38.09 30.56 -188 -197.4
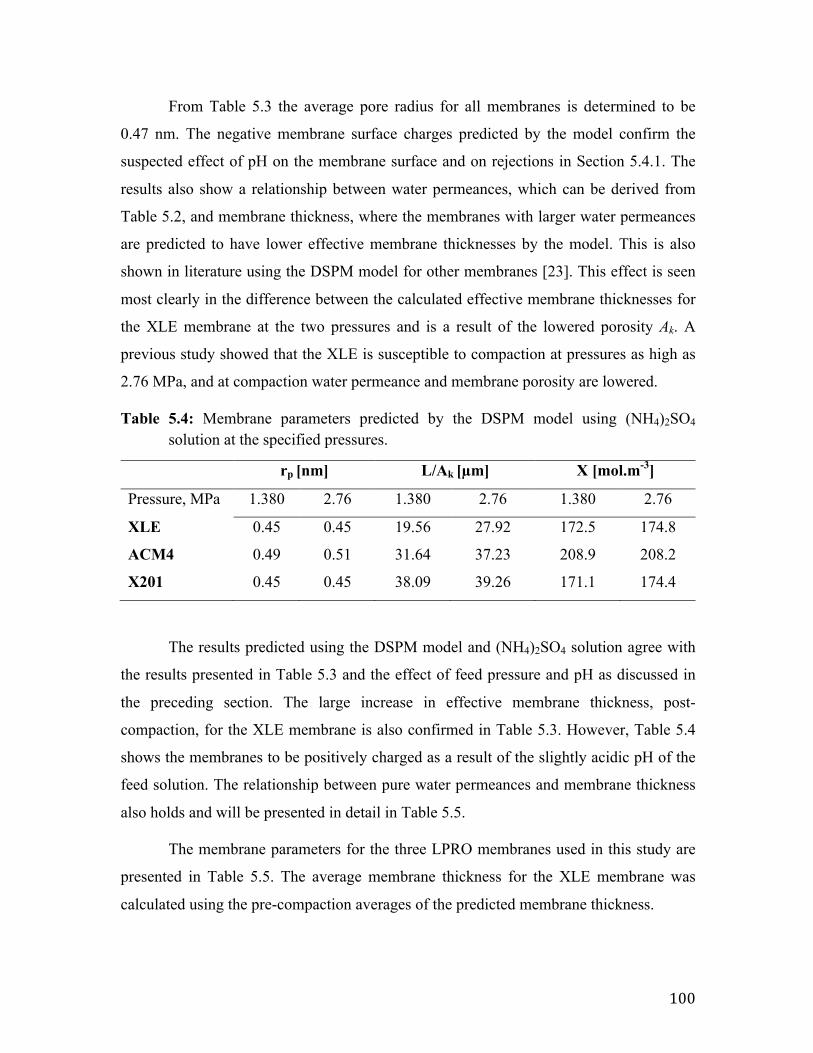
100
From Table 5.3 the average pore radius for all membranes is determined to be
0.47 nm. The negative membrane surface charges predicted by the model confirm the
suspected effect of pH on the membrane surface and on rejections in Section 5.4.1. The
results also show a relationship between water permeances, which can be derived from
Table 5.2, and membrane thickness, where the membranes with larger water permeances
are predicted to have lower effective membrane thicknesses by the model. This is also
shown in literature using the DSPM model for other membranes [23]. This effect is seen
most clearly in the difference between the calculated effective membrane thicknesses for
the XLE membrane at the two pressures and is a result of the lowered porosity Ak. A
previous study showed that the XLE is susceptible to compaction at pressures as high as
2.76 MPa, and at compaction water permeance and membrane porosity are lowered.
Table 5.4: Membrane parameters predicted by the DSPM model using (NH4)2SO4 solution at the specified pressures.
rp [nm] L/Ak [µm] X [mol.m-3]
Pressure, MPa 1.380 2.76 1.380 2.76 1.380 2.76
XLE 0.45 0.45 19.56 27.92 172.5 174.8
ACM4 0.49 0.51 31.64 37.23 208.9 208.2
X201 0.45 0.45 38.09 39.26 171.1 174.4
The results predicted using the DSPM model and (NH4)2SO4 solution agree with
the results presented in Table 5.3 and the effect of feed pressure and pH as discussed in
the preceding section. The large increase in effective membrane thickness, post-
compaction, for the XLE membrane is also confirmed in Table 5.3. However, Table 5.4
shows the membranes to be positively charged as a result of the slightly acidic pH of the
feed solution. The relationship between pure water permeances and membrane thickness
also holds and will be presented in detail in Table 5.5.
The membrane parameters for the three LPRO membranes used in this study are
presented in Table 5.5. The average membrane thickness for the XLE membrane was
calculated using the pre-compaction averages of the predicted membrane thickness.
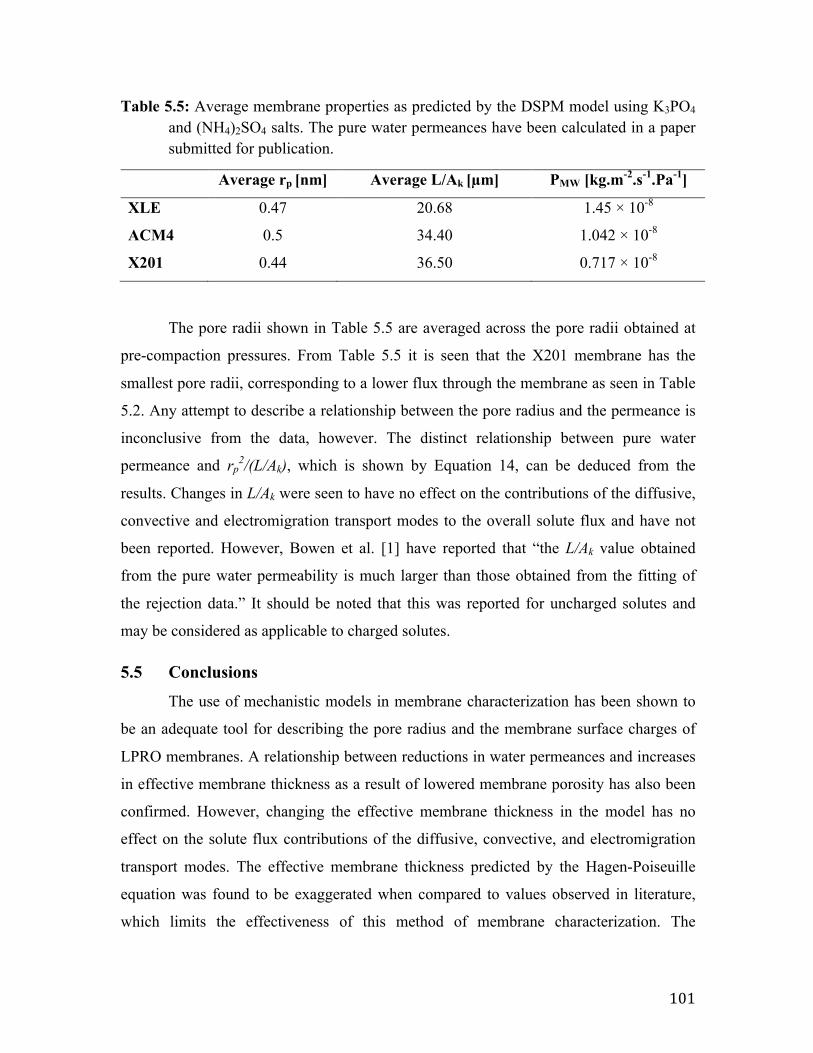
101
Table 5.5: Average membrane properties as predicted by the DSPM model using K3PO4 and (NH4)2SO4 salts. The pure water permeances have been calculated in a paper submitted for publication.
Average rp [nm] Average L/Ak [µm] PMW [kg.m-2.s-1.Pa-1]
XLE 0.47 20.68 1.45 × 10⁻⁸
ACM4 0.5 34.40 1.042 × 10-8
X201 0.44 36.50 0.717 × 10⁻⁸
The pore radii shown in Table 5.5 are averaged across the pore radii obtained at
pre-compaction pressures. From Table 5.5 it is seen that the X201 membrane has the
smallest pore radii, corresponding to a lower flux through the membrane as seen in Table
5.2. Any attempt to describe a relationship between the pore radius and the permeance is
inconclusive from the data, however. The distinct relationship between pure water
permeance and rp2/(L/Ak), which is shown by Equation 14, can be deduced from the
results. Changes in L/Ak were seen to have no effect on the contributions of the diffusive,
convective and electromigration transport modes to the overall solute flux and have not
been reported. However, Bowen et al. [1] have reported that “the L/Ak value obtained
from the pure water permeability is much larger than those obtained from the fitting of
the rejection data.” It should be noted that this was reported for uncharged solutes and
may be considered as applicable to charged solutes.
5.5 Conclusions
The use of mechanistic models in membrane characterization has been shown to
be an adequate tool for describing the pore radius and the membrane surface charges of
LPRO membranes. A relationship between reductions in water permeances and increases
in effective membrane thickness as a result of lowered membrane porosity has also been
confirmed. However, changing the effective membrane thickness in the model has no
effect on the solute flux contributions of the diffusive, convective, and electromigration
transport modes. The effective membrane thickness predicted by the Hagen-Poiseuille
equation was found to be exaggerated when compared to values observed in literature,
which limits the effectiveness of this method of membrane characterization. The
102
characterization of these membranes using uncharged solutes should also be considered
in order to give accurate predictions of the effective membrane thickness.
A relationship between feed pH and membrane surface charge has also been
proven to exist, and a relationship between feed pH and stoichiometry of ions in the
permeate steam has also been shown. The feed solution with slightly acidic pH
(ammonium sulfate) was found to have a positively charged membrane and the alkaline
pH feed solution (tripotassium phosphate) had negatively charged membrane surfaces.
This was observed in the repulsion and attraction of positively charged ions in the feed,
respectively, and is important information for the final application of these membranes,
which is the concentration of ammonium ions in anaerobic digester effluent. Extensive
measurements of the effects of feed pH on pore radius, membrane surface charge, and
effective membrane thickness should also be considered for future work. The
determination of the isoelectric point for all the membranes tested should also be
considered.
The average pore radius of the LPRO membranes predicted by the developed
model is 0.47 ± 0.009 nm. The variation in predicted pore radii across different solutes is
relatively small, and so an average value of rp can be reported with confidence. The
predicted effective membrane thickness ranges from 19 – 39 µm, although the actual
values may be much lower had the membranes been characterized using uncharged
solutes. The increase in effective thickness due to the effect of membrane compaction has
also been shown for the DOW XLE membrane.
5.6 Acknowledgements This research project was conducted in collaboration with CHFour Biogas Ltd, and was
financially supported through the NSERC (Natural Sciences and Engineering Research
Council) Engage Plus program.
Nomenclature
Symbol Title Units
Ak Membrane porosity -
103
Ci Bulk concentration of ion i mol.l-1
ci Concentration inside the membrane mol.l-1
Ci,f Concentration on the feed side of the membrane mol.l-1
Ci,p Concentration on the permeate side of the membrane mol.l-1
dcidx
Concentration gradient mol.l-1.m-1
Di,p Hindered diffusivity of ion m2.s-1
Di,∞ Bulk Diffusivity m2.s-1
e Elementary charge, 1.602 × 10⁻¹⁹ C
F Faraday’s constant, 96500 C.mol-1
I Ionic strength M
ji Solute flux mol.m-2.s-1
JV Solvent flux l.m-2.s-1
kB Boltzmann constant, 1.381 × 10⁻²³ J.K-1
Ki,c Hindrance factor for convection -
Ki,d Hindrance factor for diffusion -
PM,W Pure water permeance kg.m-2.s-1.Pa-1
rp Pore radius m
rs Solute radius m
R Gas constant, 8.314 J.mol-1.K-1
T
x
Temperature
Distance in the membrane
K
m
X Membrane surface charge mol.m-3
zi Valence of ion -
Greek Letters
ξ Ratio of membrane surface charge to bulk concentration -
ϕ Steric partitioning coefficient -
λ Ratio of solute radius to pore radius -
µ Solution viscosity Pa.s
∆P Applied pressure differential Pa
104
dψdx
Electric potential gradient across each segment along the membrane V.m-1
∆ψD Donnan potential V
L Membrane thickness m
List of Abbreviations
DSPM Donnan Steric Pore model
ENP Extended Nernst Planck
LPRO Low pressure reverse osmosis
NF Nanofiltration
RO Reverse osmosis
5.7 References [1] W. R. Bowen, a. W. Mohammad, and N. Hilal, “Characterisation of nanofiltration
membranes for predictive purposes - Use of salts, uncharged solutes and atomic
force microscopy,” J. Memb. Sci., vol. 126, no. 1, pp. 91–105, 1997.
[2] B. Van der Bruggen, M. Mänttäri, and M. Nyström, “Drawbacks of applying
nanofiltration and how to avoid them: A review,” Sep. Purif. Technol., vol. 63, no.
2, pp. 251–263, 2008.
[3] V. K. Gupta, S.-T. Hwang, W. B. Krantz, and A. R. Greenberg, “Characterization
of nanofiltration and reverse osmosis membrane performance for aqueous salt
solutions using irreversible thermodynamics,” Desalination, vol. 208, no. 1–3, pp.
1–18, 2007.
[4] V. Silva, V. Geraldes, a. M. Brites Alves, L. Palacio, P. Prádanos, and a.
Hernández, “Multi-ionic nanofiltration of highly concentrated salt mixtures in the
seawater range,” Desalination, vol. 277, no. 1–3, pp. 29–39, 2011.
[5] X. Jin, X. Huang, and E. M. V Hoek, “Role of specific ion interactions in seawater
RO membrane fouling by alginic acid,” Environ. Sci. Technol., vol. 43, no. 10, pp.
3580–3587, 2009.
[6] a. M. Hidalgo, G. León, M. Gómez, M. D. Murcia, D. S. Barbosa, and P. Blanco,
“Application of the solution-diffusion model for the removal of atrazine using a
105
nanofiltration membrane,” Desalin. Water Treat., vol. 51, no. 10–12, pp. 2244–
2252, 2013.
[7] F. N. Ahmed, “Modified Spiegler-Kedem Model to Predict the Rejection and Flux
of Nanofiltration Processes at High NaCl Concentrations,” University of Ottawa,
2013.
[8] W. R. Bowen and J. S. Welfoot, “Modelling the performance of membrane
nanofiltration-critical assessment and model development,” Chem. Eng. Sci., vol.
57, no. 7, pp. 1121–1137, 2002.
[9] M. Mondor, L. Masse, D. Ippersiel, F. Lamarche, and D. I. Massé, “Use of
electrodialysis and reverse osmosis for the recovery and concentration of ammonia
from swine manure,” Bioresour. Technol., vol. 99, no. 15, pp. 7363–7368, 2008.
[10] R. Einav, K. Harussi, and D. Perry, “The footprint of the desalination processes on
the environment,” Desalination, vol. 152, no. 1–3, pp. 141–154, 2003.
[11] S. Sridhar, A. Kale, and a. a. Khan, “Reverse osmosis of edible vegetable oil
industry effluent,” J. Memb. Sci., vol. 205, no. 1–2, pp. 83–90, 2002.
[12] Y. Yoon and R. M. Lueptow, “Removal of organic contaminants by RO and NF
membranes,” J. Memb. Sci., vol. 261, no. 1–2, pp. 76–86, 2005.
[13] C. Bellona, J. E. Drewes, P. Xu, and G. Amy, “Factors affecting the rejection of
organic solutes during NF/RO treatment - A literature review,” Water Res., vol. 38,
no. 12, pp. 2795–2809, 2004.
[14] X.-L. Wang, W.-J. Shang, D.-X. Wang, L. Wu, and C.-H. Tu, “Characterization
and applications of nanofiltration membranes: State of the art,” Desalination, vol.
236, no. 1–3, pp. 316–326, 2009.
[15] J. Wang, D. S. Dlamini, A. K. Mishra, M. T. M. Pendergast, M. C. Y. Wong, B. B.
Mamba, V. Freger, A. R. D. Verliefde, and E. M. V Hoek, “A critical review of
transport through osmotic membranes,” J. Memb. Sci., vol. 454, pp. 516–537,
2014.
[16] M. Dalwani, N. E. Benes, G. Bargeman, D. Stamatialis, and M. Wessling, “Effect
of pH on the performance of polyamide/polyacrylonitrile based thin film
composite membranes,” J. Memb. Sci., vol. 372, no. 1–2, pp. 228–238, 2011.
[17] J. Luo and Y. Wan, “Effects of pH and salt on nanofiltration-a critical review,” J.
106
Memb. Sci., vol. 438, no. July 2015, pp. 18–28, 2013.
[18] T. Van Gestel, C. Vandecasteele, A. Buekenhoudt, C. Dotremont, J. Luyten, R.
Leysen, B. Van Der Bruggen, and G. Maes, “Salt retention in nanofiltration with
multilayer ceramic TiO2 membranes,” J. Memb. Sci., vol. 209, no. 2, pp. 379–389,
2002.
[19] M. R. Teixeira, M. J. Rosa, and M. Nyström, “The role of membrane charge on
nanofiltration performance,” J. Memb. Sci., vol. 265, no. 1–2, pp. 160–166, 2005.
[20] X. Lefebvre, J. Palmeri, and P. David, “Nanofiltration theory: An analytic
approach for single salts,” J. Phys. Chem. B, vol. 108, no. 43, pp. 16811–16824,
2004.
[21] F. Fadaei, S. Shirazian, and S. N. Ashrafizadeh, “Mass transfer modeling of ion
transport through nanoporous media,” Desalination, vol. 281, pp. 325–333, 2011.
[22] J. Garcia-Aleman, J. Dickson, and a. Mika, “Experimental analysis, modeling, and
theoretical design of McMaster pore-filled nanofiltration membranes,” J. Memb.
Sci., vol. 240, no. 1–2, pp. 237–255, 2004.
[23] W. R. R. Bowen and a W. A. W. Mohammad, “Characterization and prediction of
nanofiltration membrane performance-a general assessment,” Chem. Eng. Res.
Des., vol. 76, no. November, pp. 885–893, 1998.
[24] J. Luo and Y. Wan, “Effect of highly concentrated salt on retention of organic
solutes by nanofiltration polymeric membranes,” J. Memb. Sci., vol. 372, no. 1–2,
pp. 145–153, 2011.
[25] X.-L. Wang, T. Tsuru, M. Togoh, S. Nakao, and S. Kimura, “Evaluation of pore
structure and electrical properties of nanofiltration membranes,” Journal of
Chemical Engineering of Japan, vol. 28, no. 2. pp. 186–191, 1995.
[26] J. Schaep, C. Vandecasteele, a. W. Mohammad, and W. R. Bowen, “Analysis of
the Salt Retention of Nanofiltration Membranes Using the Donnan–Steric
Partitioning Pore Model,” Sep. Sci. Technol., vol. 34, no. 15, pp. 3009–3030, 1999.
[27] S. Bandini and D. Vezzani, “Nanofiltration modeling: The role of dielectric
exclusion in membrane characterization,” Chem. Eng. Sci., vol. 58, no. 15, pp.
3303–3326, 2003.
[28] W. M. Deen, “Hindered Transport of Large Molecules in Liquid-Filled Pores,”

107
AIChE J., vol. 33, no. 9, pp. 1409–1425, 1987.
[29] W. R. Bowen and A. O. Sharif, “Transport through Microfiltration Membranes -
Particle Hydrodynamics and Flux Reduction,” Journal of colloid and interface
science, vol. 168, no. 2. pp. 414–421, 1994.
[30] W. R. Bowen and H. Mukhtar, “Characterisation and prediction of separation
performance of nanofiltration membranes,” J. Memb. Sci., vol. 112, no. 2, pp. 263–
274, 1996.
[31] H. Ohshima and S. Ohki, “Donnan potential and surface potential of a charged
membrane.,” Biophys. J., vol. 47, no. 5, pp. 673–8, 1985.
[32] Y.-H. Li and S. Gregory, “Diffusion of ions in seawater and in deep-sea
sediments,” Geochim. Cosmochim. Acta, vol. 38, pp. 703–714, 1974.
[33] D. Krom and R. A. Berner, “The diffusion coefficients of sulfate , ammonium ,
phosphate ions in anoxic marine sediments ’,” vol. 25, no. 2, pp. 327–337, 1980.
[34] Sterlitech, “Reverse Osmosis Membranes,” 2015. [Online]. Available:
http://www.sterlitech.com/reverse-osmosis-ro-membrane-ymxle3001.html.
[35] P. Xu, J. E. Drewes, T. U. Kim, C. Bellona, and G. Amy, “Effect of membrane
fouling on transport of organic contaminants in NF/RO membrane applications,” J.
Memb. Sci., vol. 279, no. 1–2, pp. 165–175, 2006.
[36] L. D. Nghiem, “Removal of emerging trace organic contaminants by nanofiltration
and reverse osmosis,” University of Wollongong, 2005.
[37] A. M. Comerton, R. C. Andrews, D. M. Bagley, and C. Hao, “The rejection of
endocrine disrupting and pharmaceutically active compounds by NF and RO
membranes as a function of compound and water matrix properties,” J. Memb.
Sci., vol. 313, no. 1–2, pp. 323–335, 2008.
[38] C. Bartels, R. Franks, S. Rybar, M. Schierach, and M. Wilf, “The effect of feed
ionic strength on salt passage through reverse osmosis membranes,” Desalination,
vol. 184, no. 1–3, pp. 185–195, 2005.
[39] Y. Zhao and J. S. Taylor, “Incorporation of osmotic pressure in an integrated
incremental model for predicting RO or NF permeate concentration,”
Desalination, vol. 174, no. 2, pp. 145–159, 2005.
[40] R. W. Baker, Membrane Technology and Applications, 2nd Editio. West Sussex:

108
John Wiley & Sons, Ltd, 2004.
[41] Y. Kaya, Z. B. Gönder, I. Vergili, and H. Barlas, “The effect of transmembrane
pressure and pH on treatment of paper machine process waters by using a two-step
nanofiltration process: Flux decline analysis,” Desalination, vol. 250, no. 1, pp.
150–157, 2010.
[42] K. Kezia, J. Lee, W. Ogieglo, A. Hill, N. E. Benes, and S. E. Kentish, “The
transport of hydronium and hydroxide ions through reverse osmosis membranes,”
J. Memb. Sci., vol. 459, pp. 197–206, 2014.
[43] L. Bruni and S. Bandini, “Studies on the role of site-binding and competitive
adsorption in determining the charge of nanofiltration membranes,” Desalination,
vol. 241, no. 1–3, pp. 315–330, 2009.
[44] A. R. D. Verliefde, E. R. Cornelissen, S. G. J. Heijman, J. Q. J. C. Verberk, G. L.
Amy, B. Van der Bruggen, and J. C. van Dijk, “The role of electrostatic
interactions on the rejection of organic solutes in aqueous solutions with
nanofiltration,” J. Memb. Sci., vol. 322, no. 1, pp. 52–66, 2008.
[45] S. Szoke, G. Patzay, and L. Weiser, “Characteristics of thin-film nanofiltration
membranes at various pH-values,” Desalination, vol. 151, pp. 123–129, 2003.
[46] A. Al-Amoudi, P. Williams, a. S. Al-Hobaib, and R. W. Lovitt, “Cleaning results
of new and fouled nanofiltration membrane characterized by contact angle,
updated DSPM, flux and salts rejection,” Appl. Surf. Sci., vol. 254, no. 13, pp.
3983–3992, 2008.
[47] V. T. Karathanos, G. K. Vagenas, and G. D. Saravacos, “Water diffusivity in
starches at high temperatures and pressures,” Biotechnol. Prog., vol. 7, no. 2, pp.
178–184, 1991.
[48] K. M. Persson, V. Gekas, and G. Trägårdh, “Study of membrane compaction and
its influence on ultrafiltration water permeability,” J. Memb. Sci., vol. 100, no. 2,
pp. 155–162, 1995.
109
6.0 Conclusions and Recommendations The concentration of ammonium ions in synthetic solutions comprising one
((NH4)2SO4 or K3PO4) or two ((NH4)2SO4 + K3PO4) salts was carried out using two RO
membranes and three LPRO membranes. This was done as a group of feasibility studies
for the application of membrane separation processes to the concentration of ammonium
ions found in anaerobic digester effluent. The most important findings from this work
were:
1. Ammonium rejections using membranes were in excess of 93% and were generally
above 97%. These high rejections are favorable for the intended application to
concentrate ammonium ions in the retentate using these membranes.
2. In the presence of multiple ions ammonium rejections are found to increase with
increasing feed concentrations and increasing pH. But beyond the suspected
isoelectric point, ammonium rejections decrease slightly as the membranes became
negatively charged.
3. Solute transport through the membranes occurred via diffusive, convective, and
electromigration mechanisms, and in single salt experiments non-stoichiometric
rejections were observed.
4. The physical properties of the membranes can be determined using the Donnan steric
pore model. The effective membrane thickness, however, was overestimated.
Based on the challenges faced during the process and the limitations observed for
both the experiments and modeling the following recommendations can be made:
1. Testing the membranes using uncharged solutes to determine the correct effective
membrane thickness;
2. Extensive testing focusing on the effects of feed pH on membrane performance,
especially as it relates to ammonium retention;
3. The study of non-stoichiometric rejections in reverse osmosis and the influence of
feed concentrations and feed pH on the stoichiometry of the ionic components in
the permeate stream;
4. The study of co-ion competition for passage through the membrane as a function
of feed concentration and pH.