coms 4771 nearest neighbors and decision trees
TRANSCRIPT
COMS 4771Nearest Neighbors and Decision Trees
Nakul Verma
Last time…
• Why machine learning
• Basics of Supervised Learning
• Maximum Likelihood Estimation
• Learning a classifier via probabilistic modelling
• Optimality of Bayes classifier
• Naïve Bayes classifier
• How to evaluate the quality of a classifier
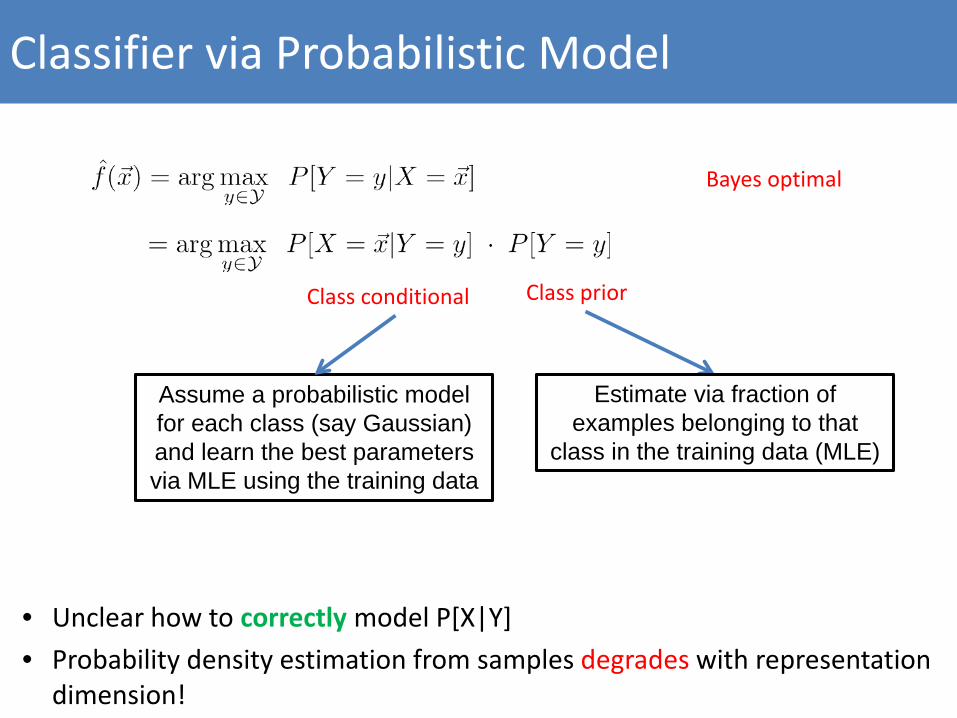
Classifier via Probabilistic Model
Bayes optimal
• Unclear how to correctly model P[X|Y]• Probability density estimation from samples degrades with representation
dimension!
Class priorClass conditional
Estimate via fraction of examples belonging to that
class in the training data (MLE)
Assume a probabilistic model for each class (say Gaussian) and learn the best parameters via MLE using the training data
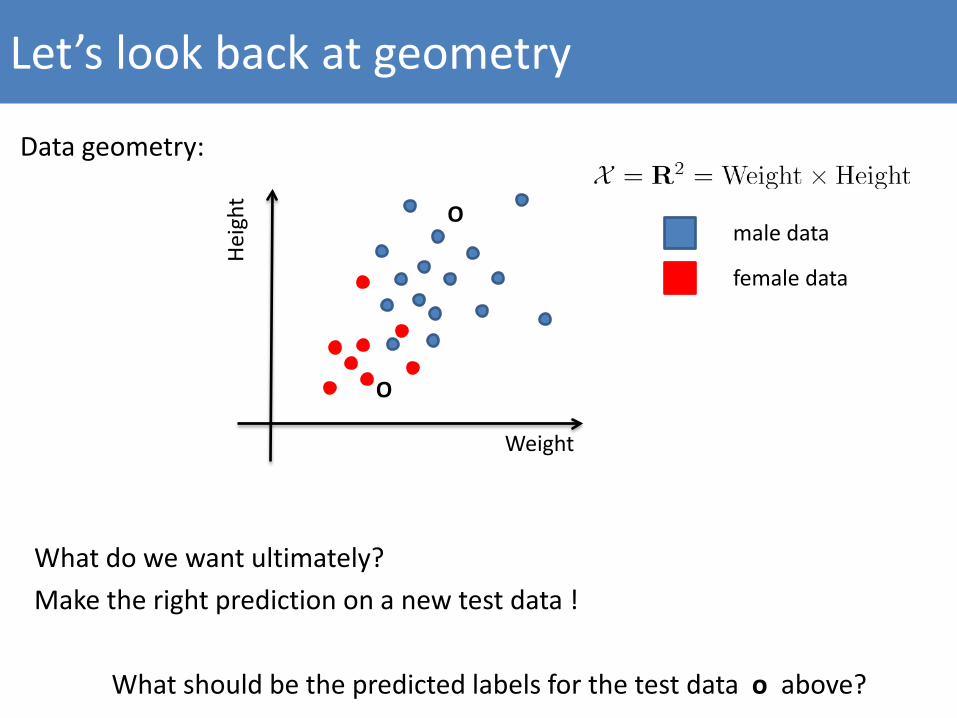
Let’s look back at geometry
Data geometry:
Weight
Heig
htmale data
female data
What do we want ultimately?Make the right prediction on a new test data !
What should be the predicted labels for the test data o above?
O
O
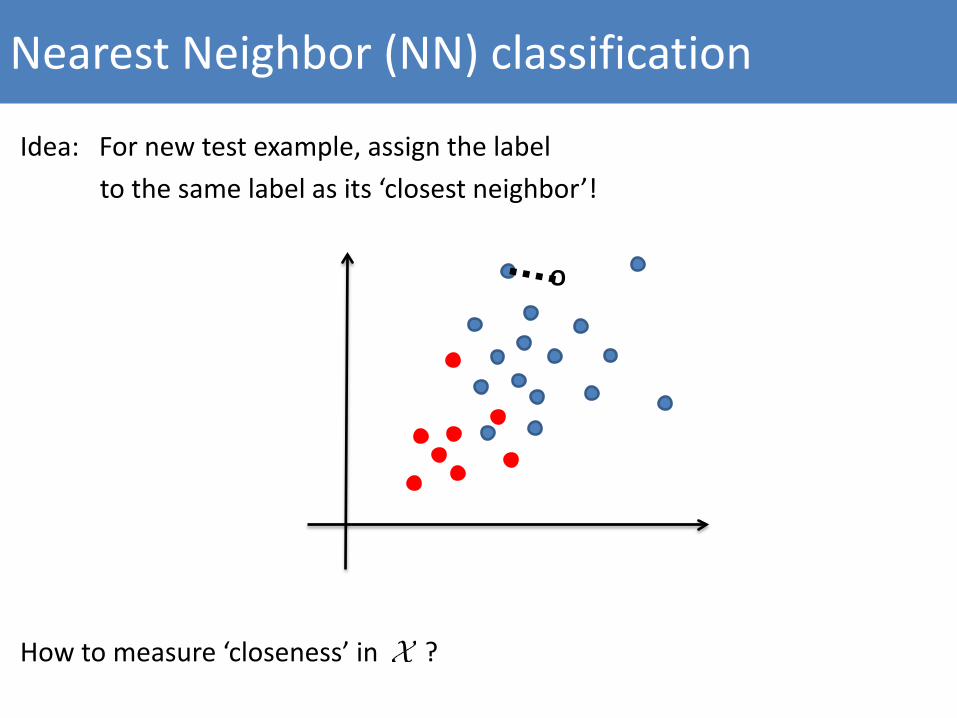
Nearest Neighbor (NN) classification
Idea: For new test example, assign the labelto the same label as its ‘closest neighbor’!
How to measure ‘closeness’ in ?
O
How to Measure Closeness in Feature Space?
We can measure closeness between two examples x1, x2 in many ways!
• Compute some sort of distance (smaller the distance, closer the examples)
• Compute some sort of similarity (higher the similarity, closer the examples)
• Can use domain expertise to measure closeness
Typically our measurements are real numbers, that is = Rd
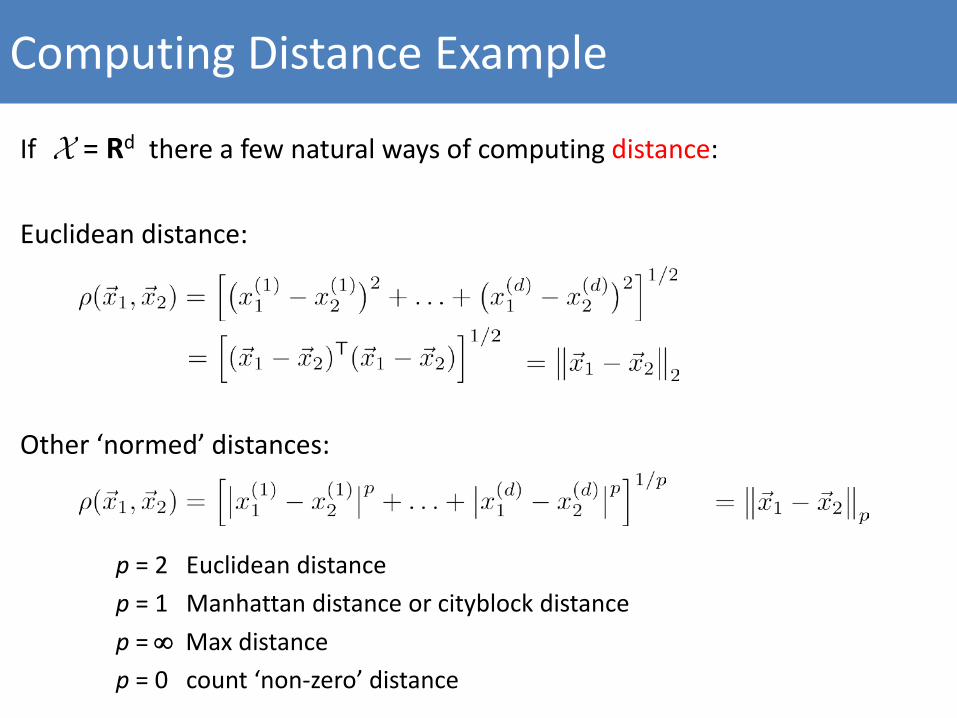
Computing Distance Example
If = Rd there a few natural ways of computing distance:
Euclidean distance:
Other ‘normed’ distances:
p = 2 Euclidean distancep = 1 Manhattan distance or cityblock distancep = ∞ Max distancep = 0 count ‘non-zero’ distance
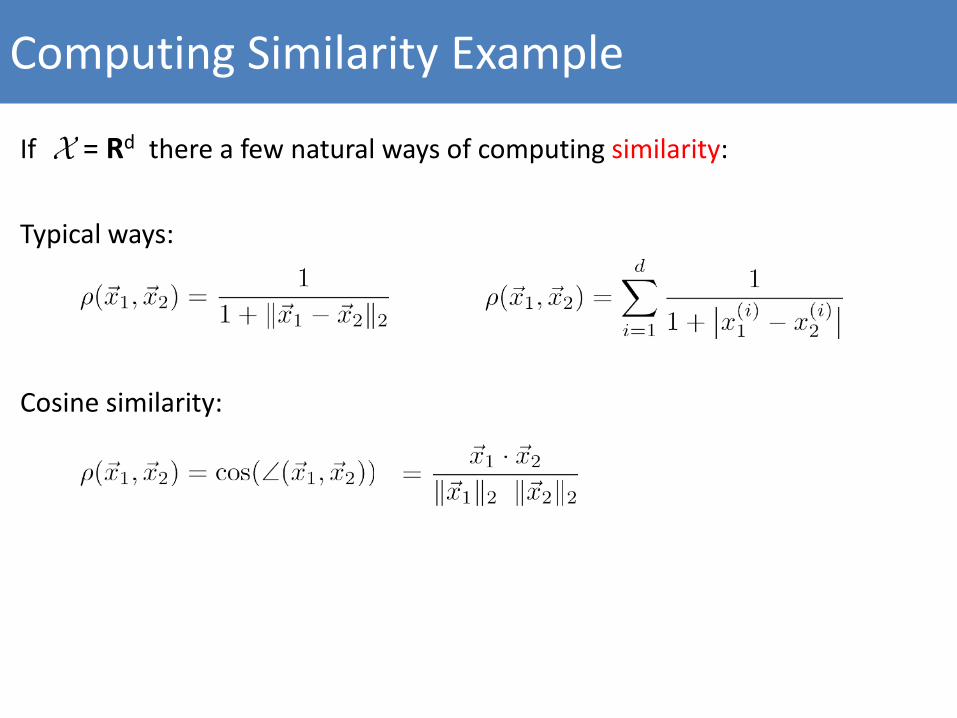
Computing Similarity Example
If = Rd there a few natural ways of computing similarity:
Typical ways:
Cosine similarity:
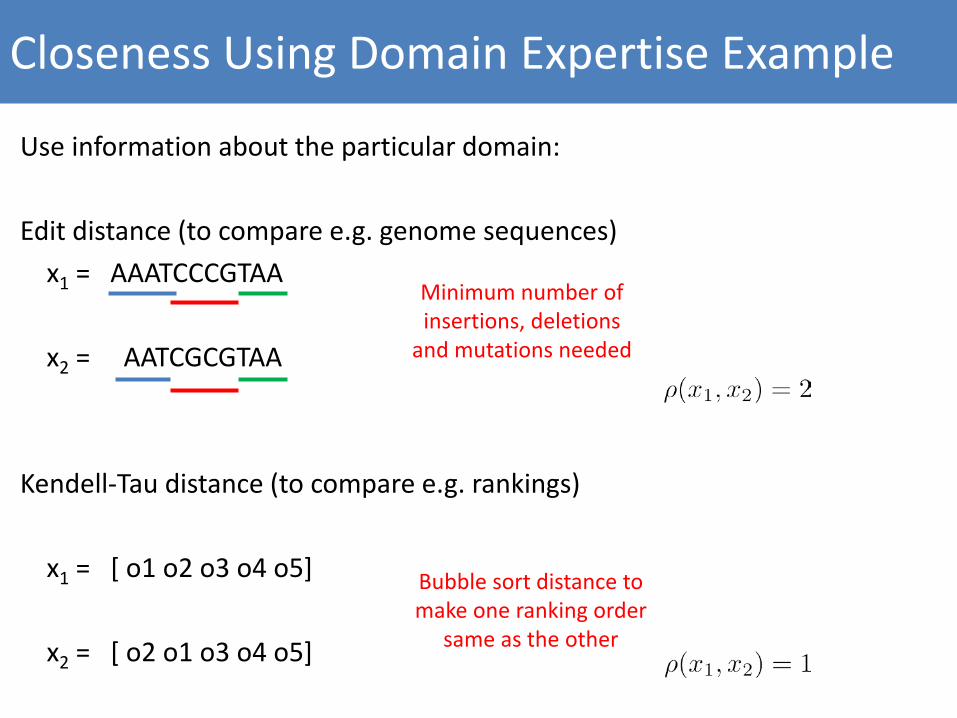
Closeness Using Domain Expertise Example
Use information about the particular domain:
Edit distance (to compare e.g. genome sequences)x1 = AAATCCCGTAA
x2 = AATCGCGTAA
Kendell-Tau distance (to compare e.g. rankings)
x1 = [ o1 o2 o3 o4 o5]
x2 = [ o2 o1 o3 o4 o5]
Minimum number of insertions, deletions
and mutations needed
Bubble sort distance to make one ranking order
same as the other
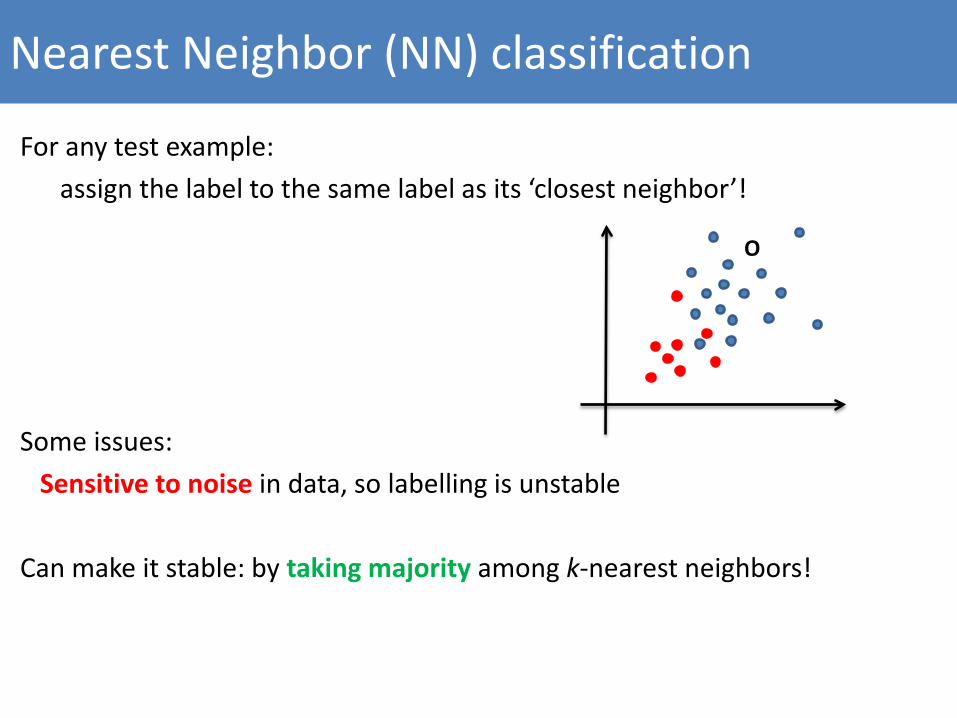
Nearest Neighbor (NN) classification
For any test example:assign the label to the same label as its ‘closest neighbor’!
Some issues: Sensitive to noise in data, so labelling is unstable
Can make it stable: by taking majority among k-nearest neighbors!
O
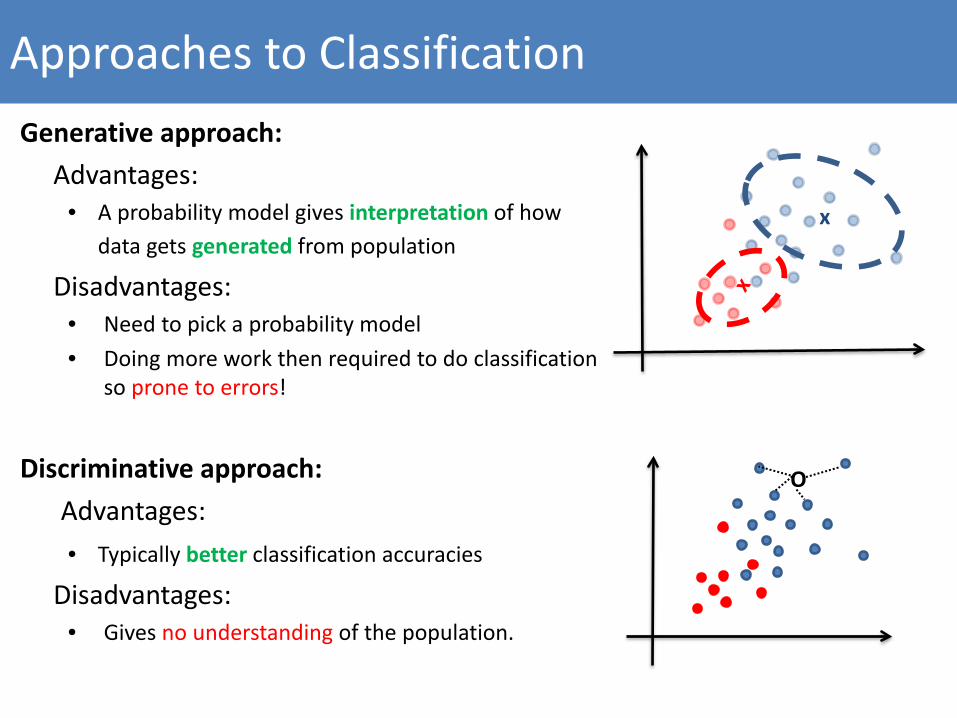
Approaches to ClassificationGenerative approach:
Advantages:• A probability model gives interpretation of how
data gets generated from population
Disadvantages:• Need to pick a probability model• Doing more work then required to do classification
so prone to errors!
Discriminative approach:Advantages:• Typically better classification accuracies
Disadvantages:• Gives no understanding of the population.
x
O
What about k-NN optimality?
Theorem 1:For fixed k, as and n →∞, k-NN classifier error converges to no more than twice Bayes classifier error.
Theorem 2:If k →∞, k/n → 0, and n →∞, k-NN classifier converges to Bayes classifier.
The proof is quite technical, we shall provide a simple sketch for 1-NN for Theorem 1
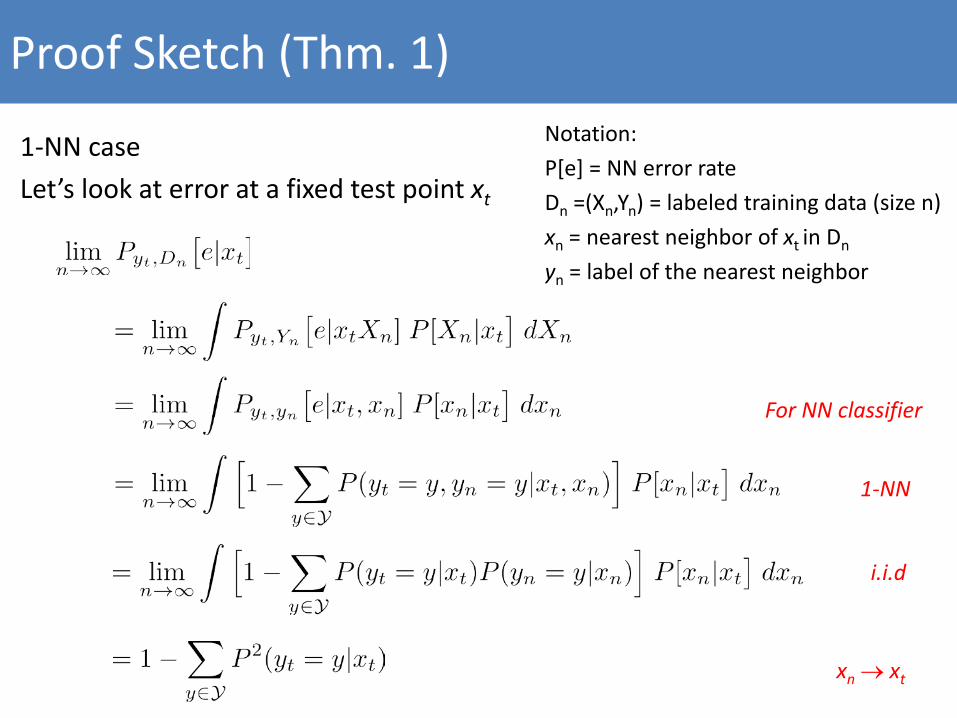
Proof Sketch (Thm. 1)
1-NN caseLet’s look at error at a fixed test point xt
Notation: P[e] = NN error rateDn =(Xn,Yn) = labeled training data (size n)xn = nearest neighbor of xt in Dn
yn = label of the nearest neighbor
For NN classifier
i.i.d
xn → xt
1-NN
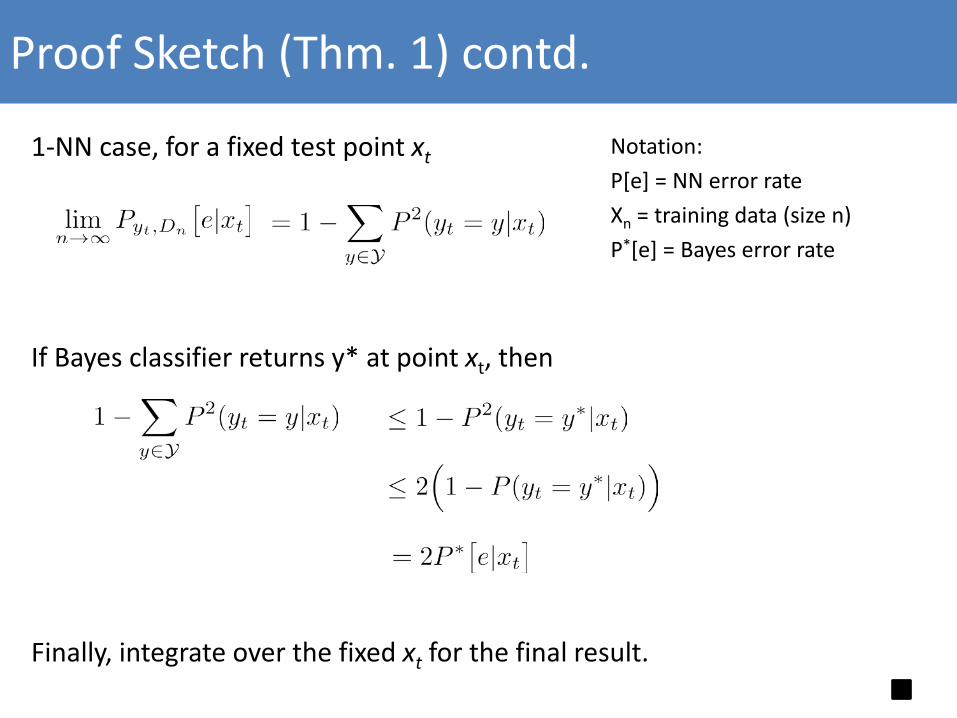
Proof Sketch (Thm. 1) contd.
1-NN case, for a fixed test point xt
If Bayes classifier returns y* at point xt, then
Finally, integrate over the fixed xt for the final result.
Notation: P[e] = NN error rateXn = training data (size n)P*[e] = Bayes error rate
A Closer Look at k-NN Classification
• Finding the k closest neighbor takes time!
• Most times the ‘closeness’ in raw measurement space is not good!
• Need to keep all the training data around during test time!
Issues with k-NN Classification
• Finding the k closest neighbor takes time!
• Most times the ‘closeness’ in raw measurement space is not good!
• Need to keep all the training data around during test time!
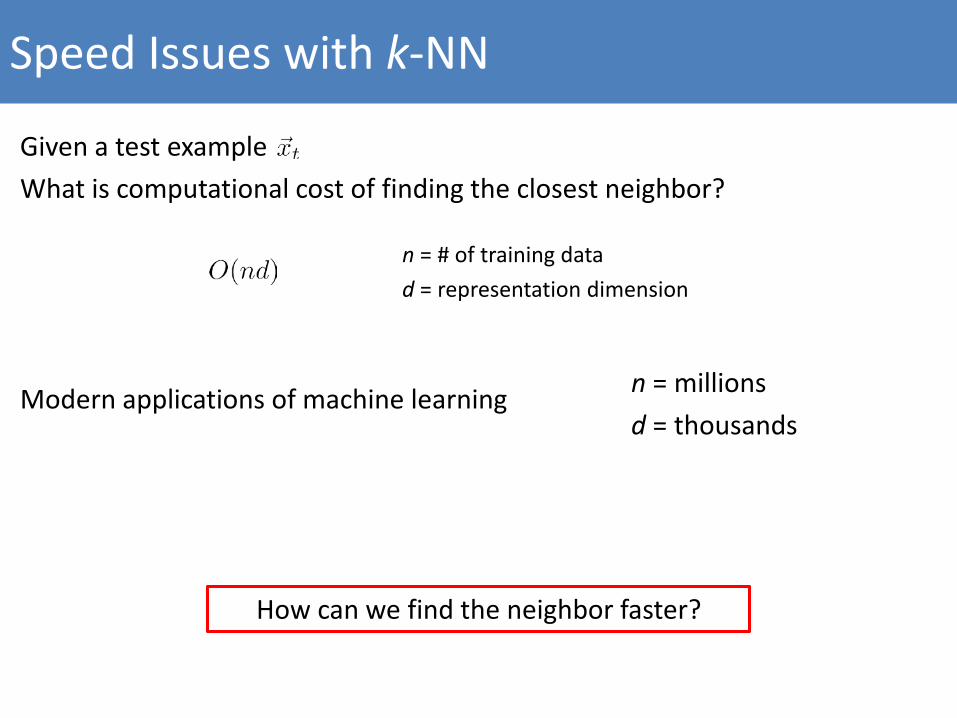
Speed Issues with k-NN
Given a test example What is computational cost of finding the closest neighbor?
Modern applications of machine learning
n = # of training datad = representation dimension
n = millionsd = thousands
How can we find the neighbor faster?
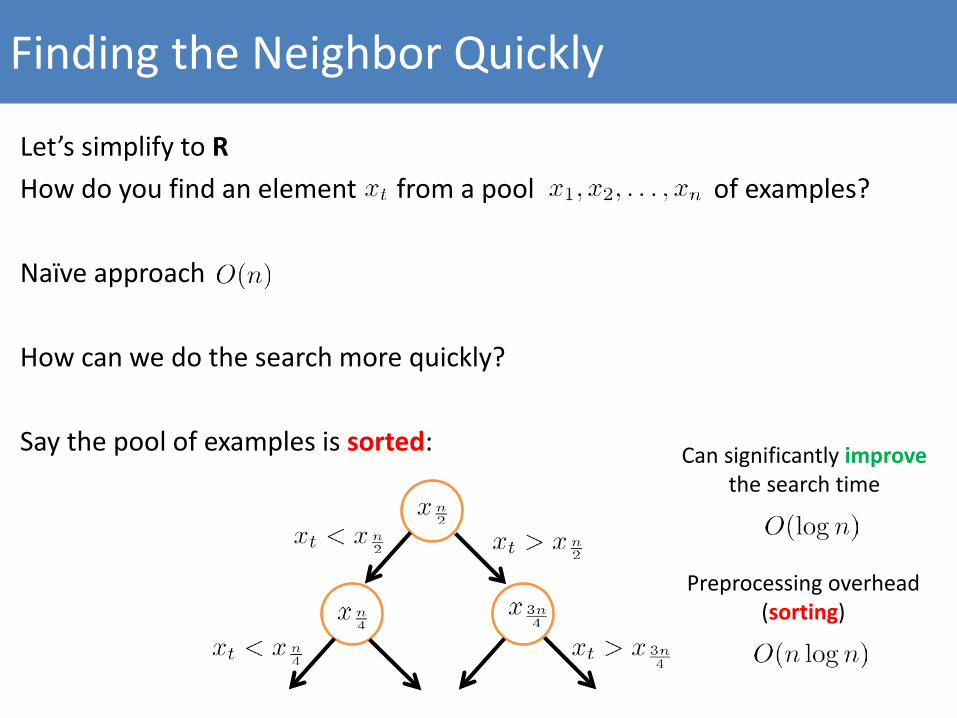
Finding the Neighbor Quickly
Let’s simplify to RHow do you find an element from a pool of examples?
Naïve approach
How can we do the search more quickly?
Say the pool of examples is sorted: Can significantly improvethe search time
Preprocessing overhead (sorting)
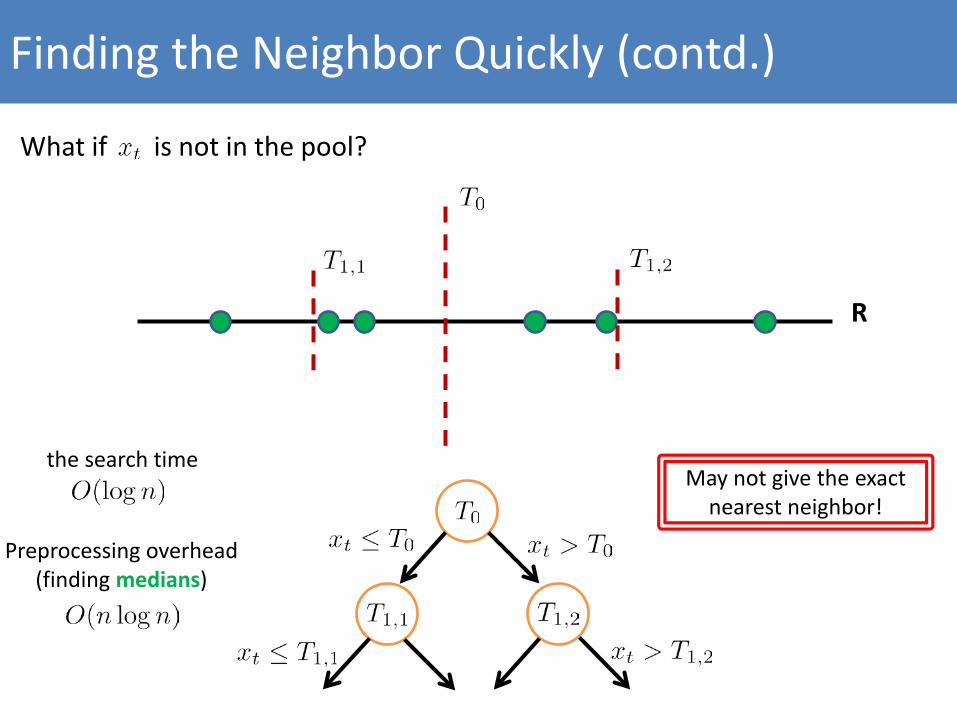
What if is not in the pool?
Finding the Neighbor Quickly (contd.)
the search time
Preprocessing overhead (finding medians)
May not give the exact nearest neighbor!
R
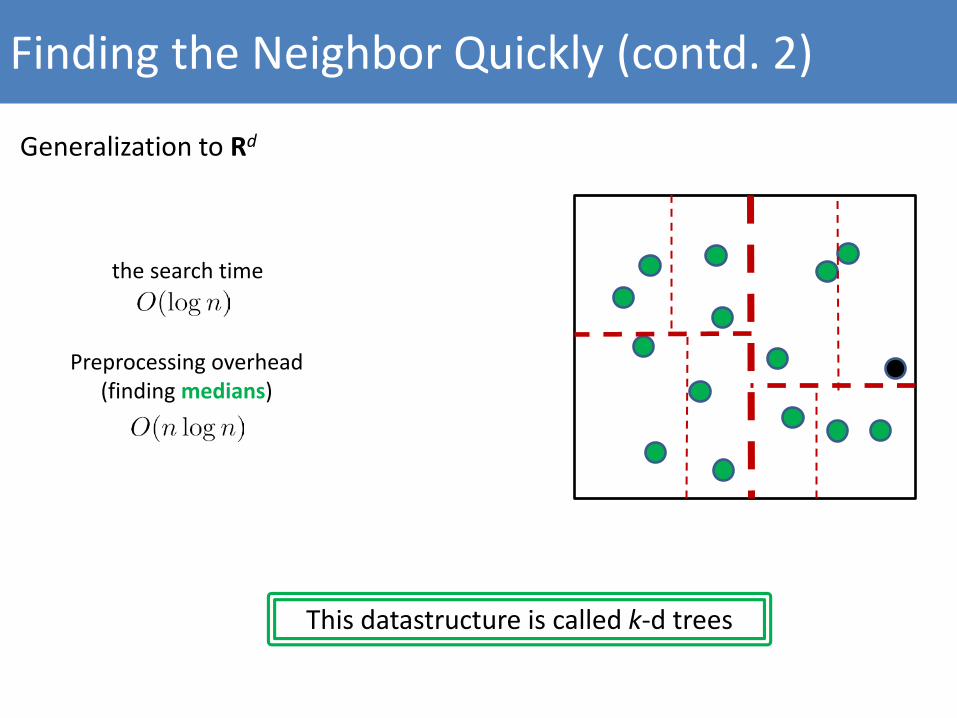
Finding the Neighbor Quickly (contd. 2)
Generalization to Rd
the search time
Preprocessing overhead (finding medians)
This datastructure is called k-d trees
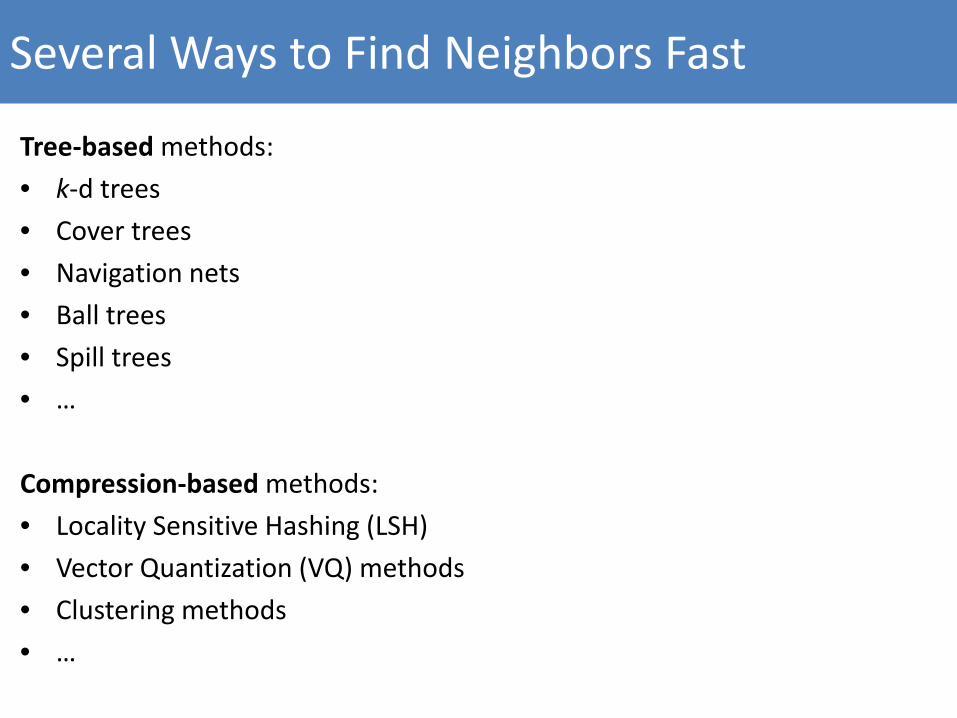
Several Ways to Find Neighbors Fast
Tree-based methods:• k-d trees• Cover trees• Navigation nets• Ball trees• Spill trees• …
Compression-based methods:• Locality Sensitive Hashing (LSH)• Vector Quantization (VQ) methods • Clustering methods• …
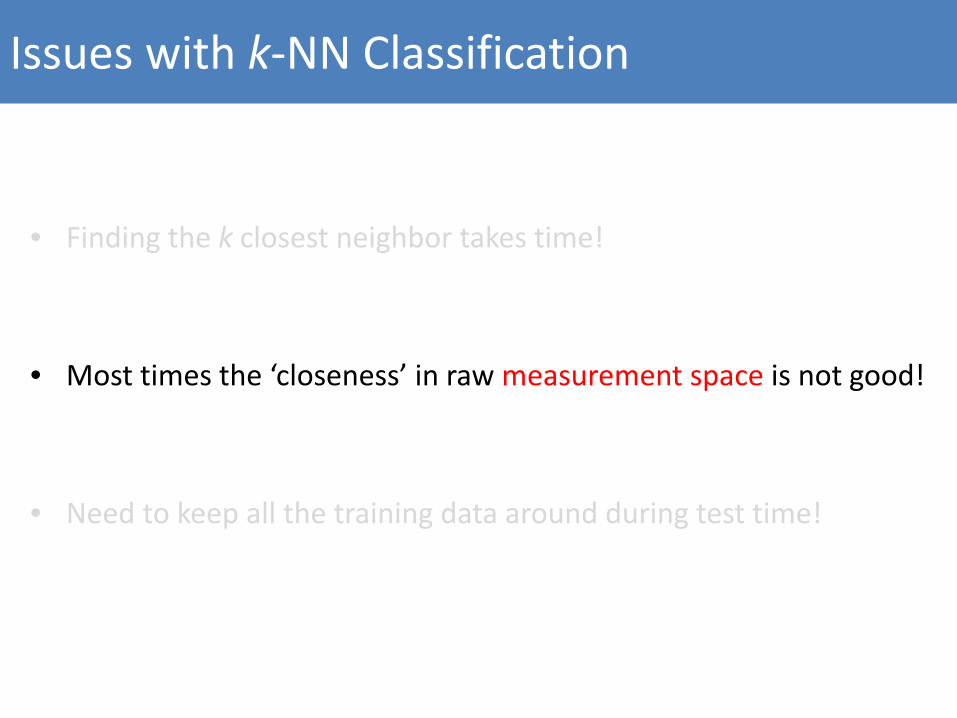
Issues with k-NN Classification
• Finding the k closest neighbor takes time!
• Most times the ‘closeness’ in raw measurement space is not good!
• Need to keep all the training data around during test time!
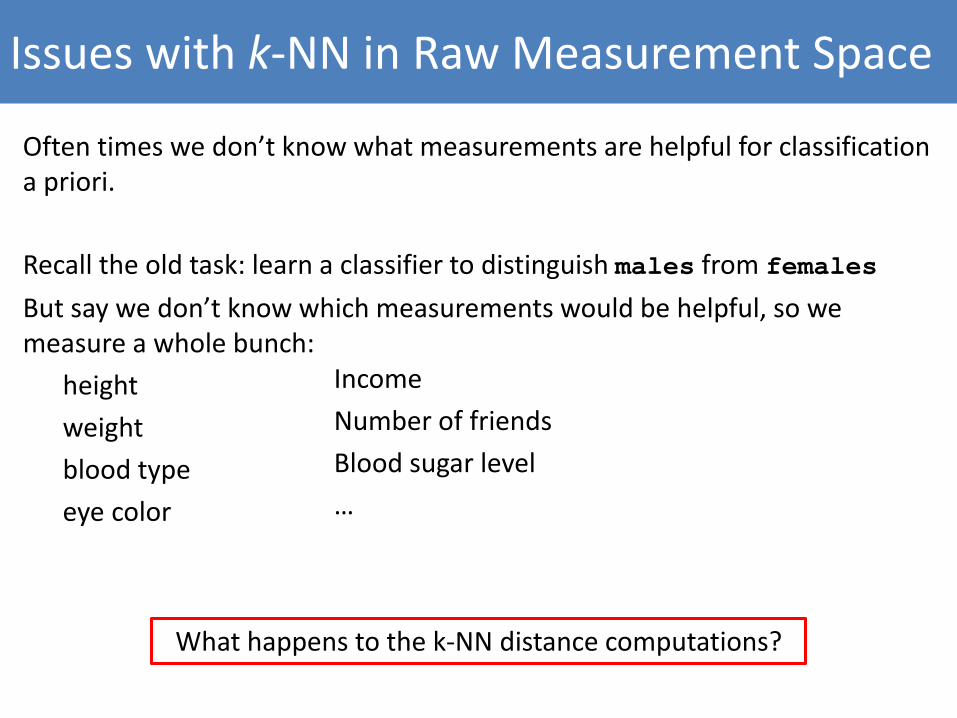
Issues with k-NN in Raw Measurement Space
Often times we don’t know what measurements are helpful for classification a priori.
Recall the old task: learn a classifier to distinguish males from femalesBut say we don’t know which measurements would be helpful, so we measure a whole bunch:
height weightblood typeeye color
Income Number of friendsBlood sugar level…
What happens to the k-NN distance computations?
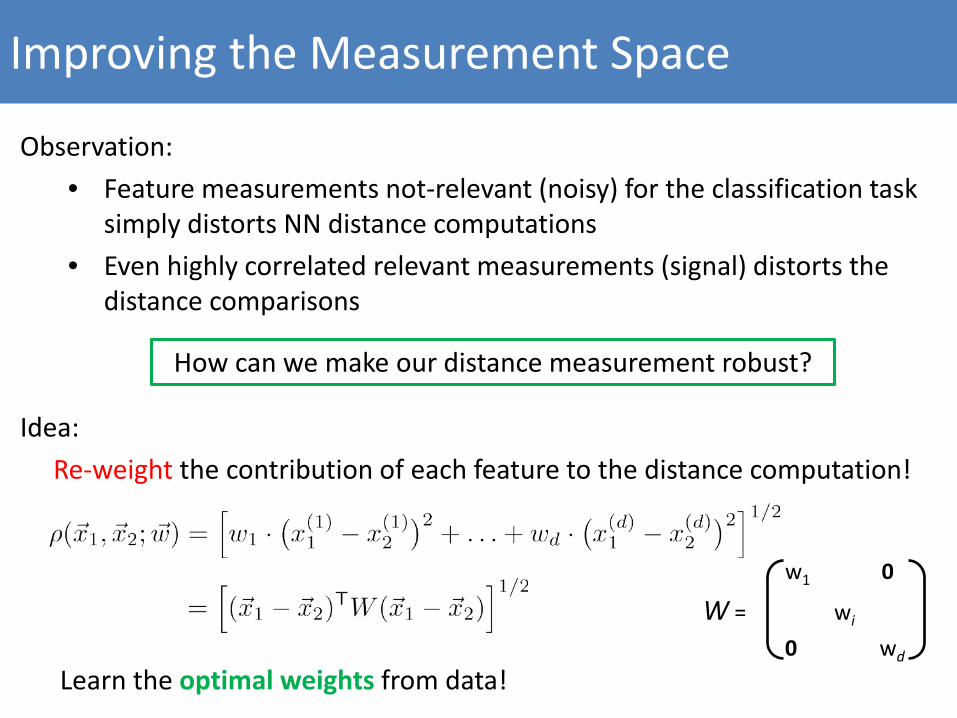
Improving the Measurement Space
Observation:• Feature measurements not-relevant (noisy) for the classification task
simply distorts NN distance computations• Even highly correlated relevant measurements (signal) distorts the
distance comparisons
Idea:Re-weight the contribution of each feature to the distance computation!
Learn the optimal weights from data!
How can we make our distance measurement robust?
w1 0
W = wi
0 wd
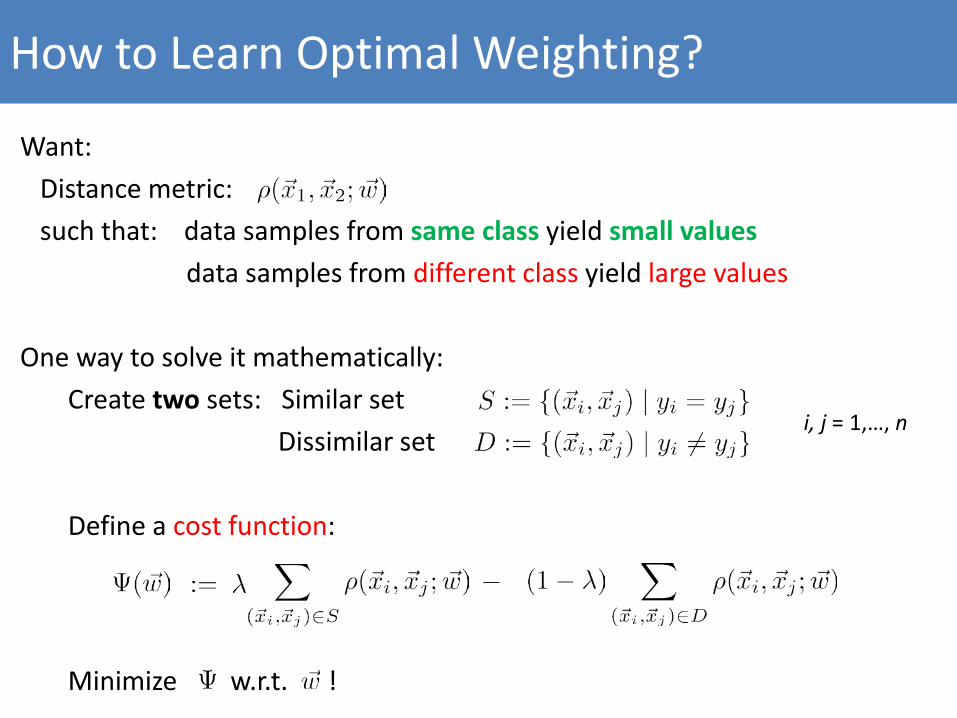
How to Learn Optimal Weighting?
Want:Distance metric: such that: data samples from same class yield small values
data samples from different class yield large values
One way to solve it mathematically: Create two sets: Similar set
Dissimilar set
Define a cost function:
Minimize w.r.t. !
i, j = 1,…, n
Issues with k-NN Classification
• Finding the k closest neighbor takes time!
• Most times the ‘closeness’ in raw measurement space is not good!
• Need to keep all the training data around during test time!
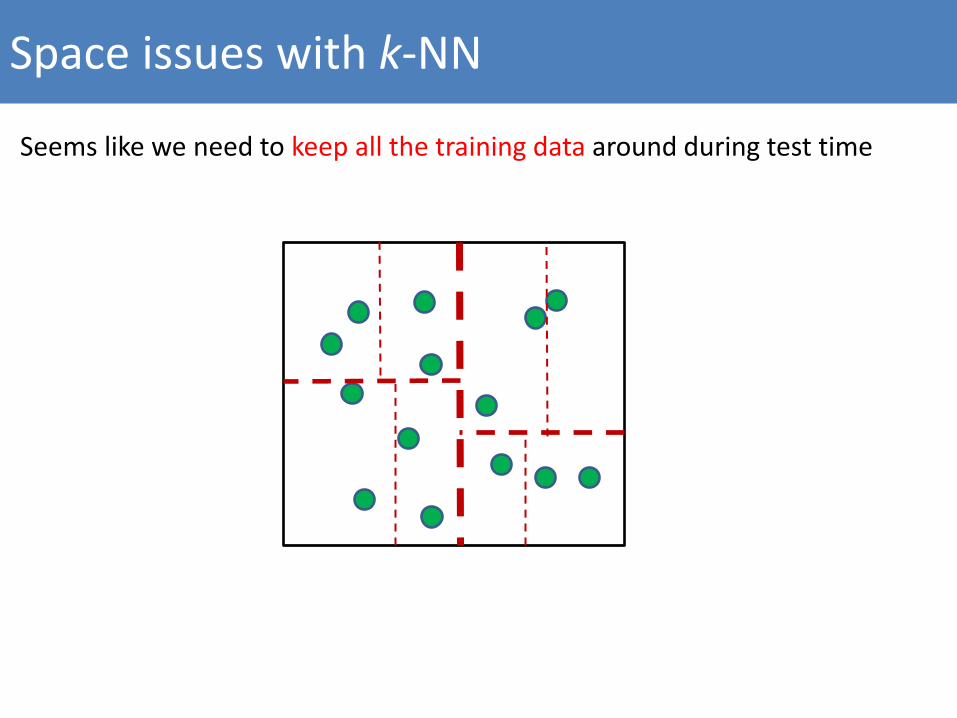
Space issues with k-NN
Seems like we need to keep all the training data around during test time
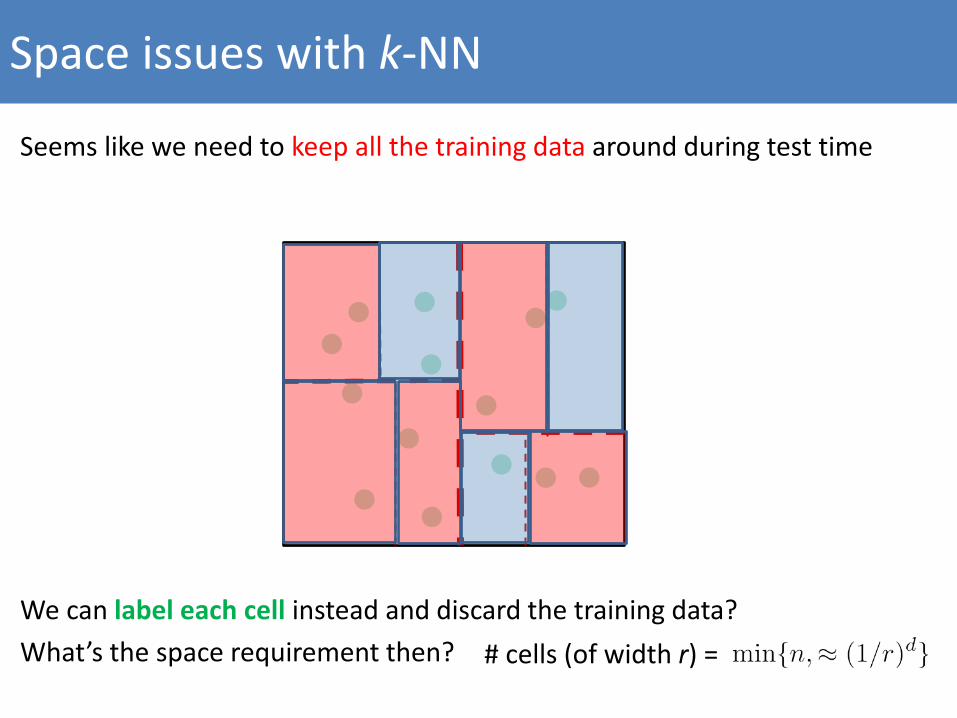
Space issues with k-NN
Seems like we need to keep all the training data around during test time
We can label each cell instead and discard the training data?What’s the space requirement then? # cells (of width r) =
NN Summary
• A simple and intuitive way to do classification
• Don’t need to deal with probability modeling
• Care needs to be taken to select the distance metric
• Can improve the basic speed and space requirements for NN
Classification with Trees (Directly)
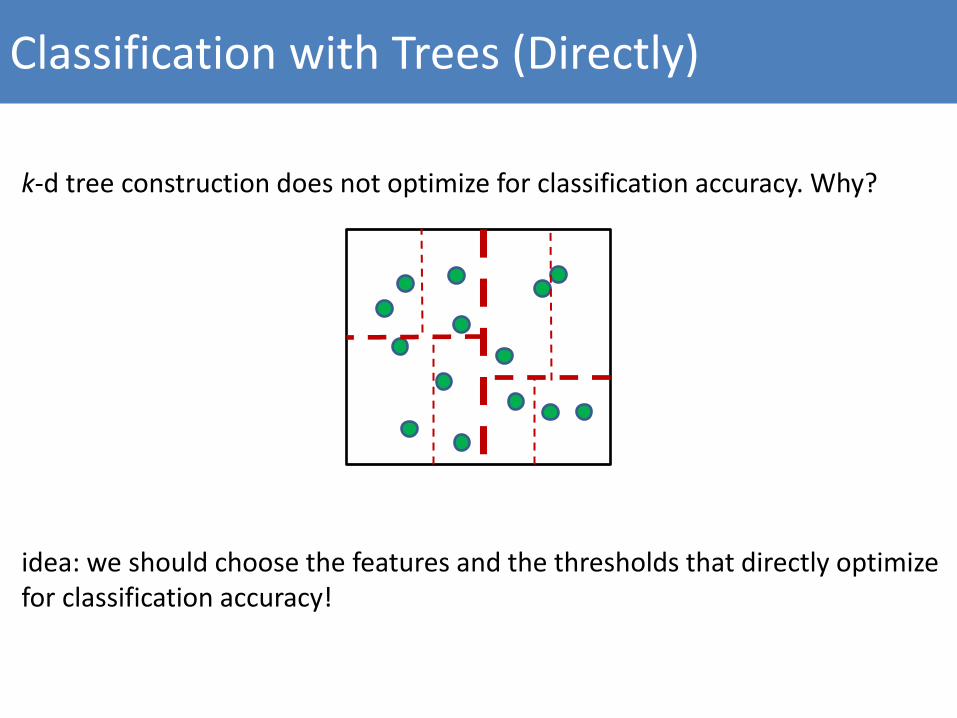
k-d tree construction does not optimize for classification accuracy. Why?
idea: we should choose the features and the thresholds that directly optimize for classification accuracy!

Decision Trees Classifier
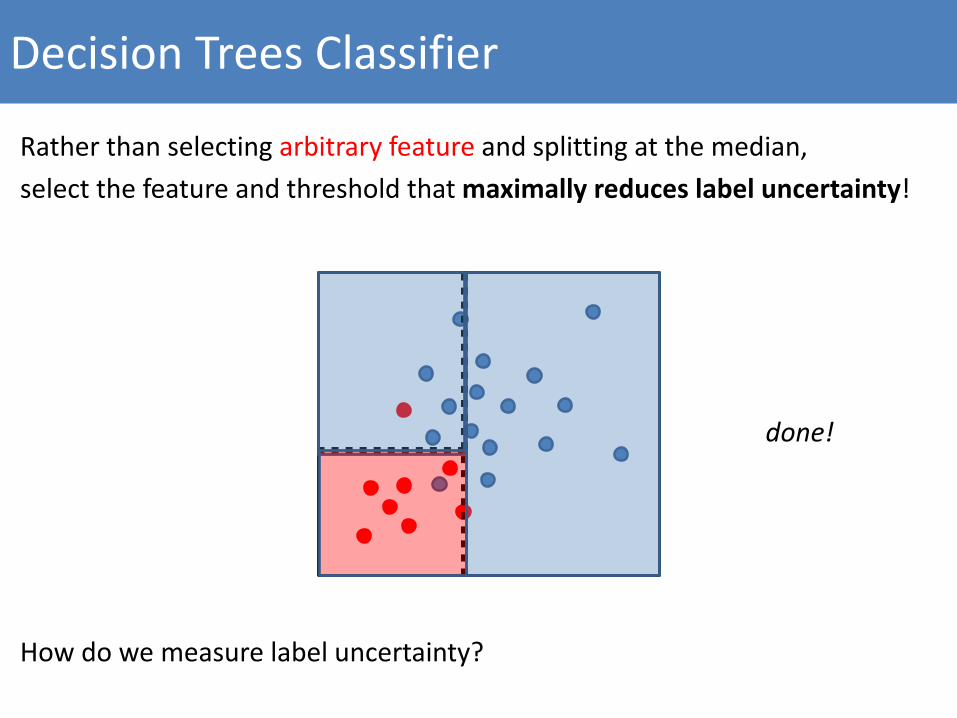
Rather than selecting arbitrary feature and splitting at the median, select the feature and threshold that maximally reduces label uncertainty!
done!
Decision Trees Classifier
Rather than selecting arbitrary feature and splitting at the median, select the feature and threshold that maximally reduces label uncertainty!
How do we measure label uncertainty?
done!
Measuring Label Uncertainty Cells
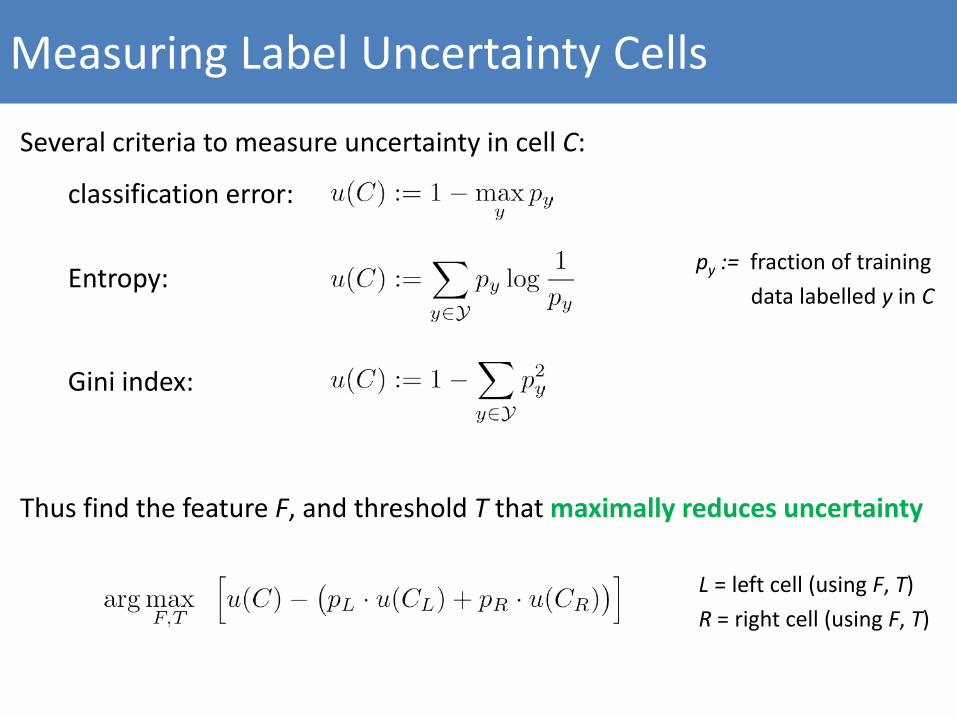
Several criteria to measure uncertainty in cell C:
classification error:
Entropy:
Gini index:
Thus find the feature F, and threshold T that maximally reduces uncertainty
py := fraction of trainingdata labelled y in C
L = left cell (using F, T)R = right cell (using F, T)
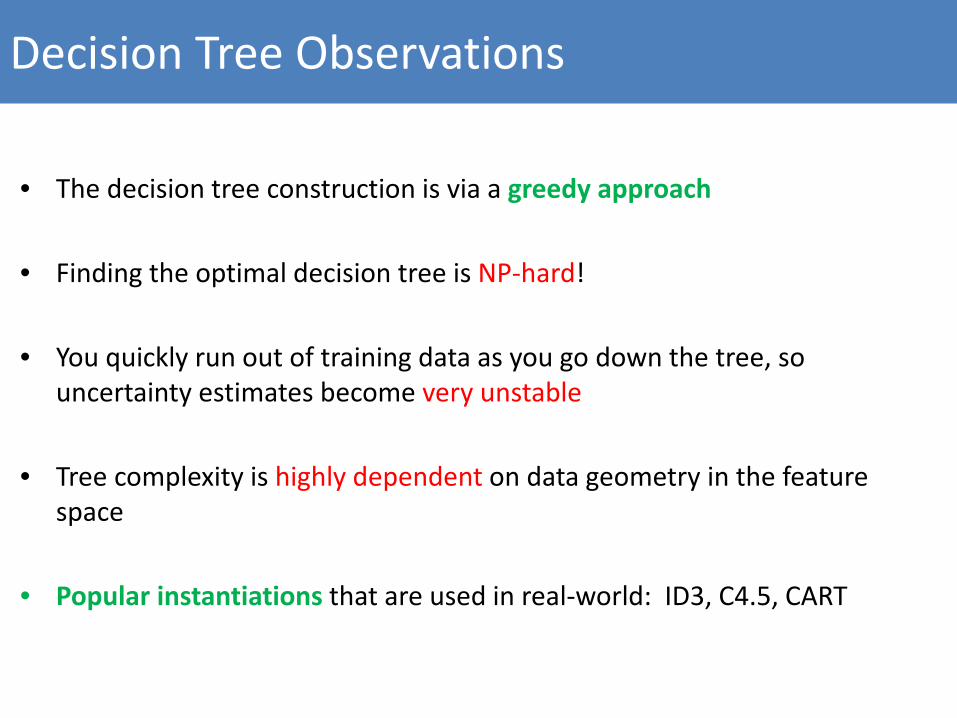
Decision Tree Observations
• The decision tree construction is via a greedy approach
• Finding the optimal decision tree is NP-hard!
• You quickly run out of training data as you go down the tree, so uncertainty estimates become very unstable
• Tree complexity is highly dependent on data geometry in the feature space
• Popular instantiations that are used in real-world: ID3, C4.5, CART
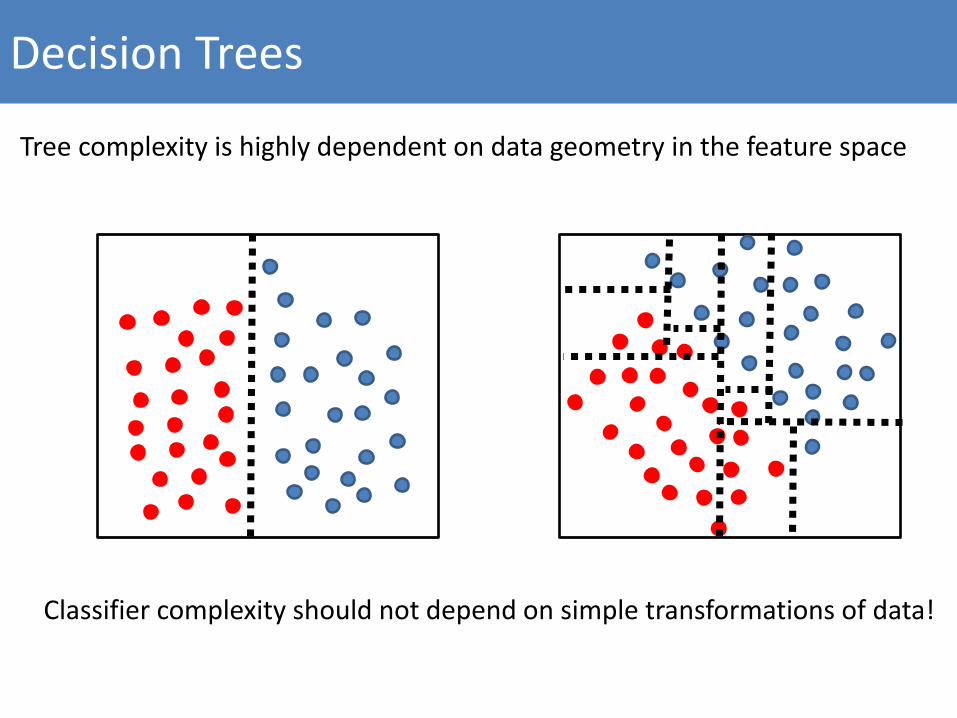
Decision Trees
Tree complexity is highly dependent on data geometry in the feature space
Classifier complexity should not depend on simple transformations of data!
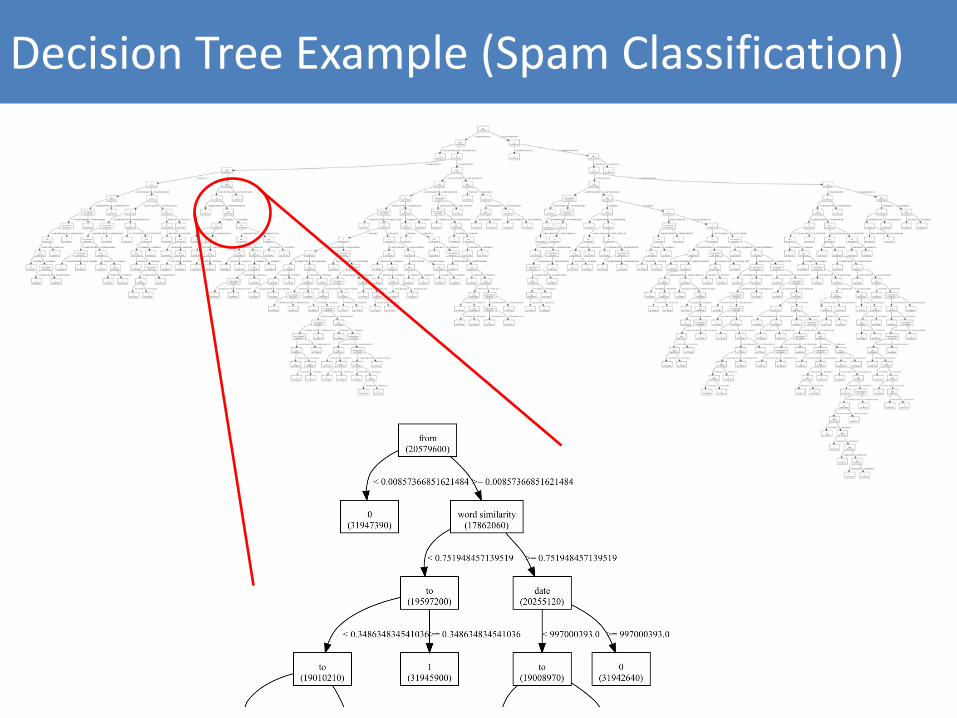
Decision Tree Example (Spam Classification)
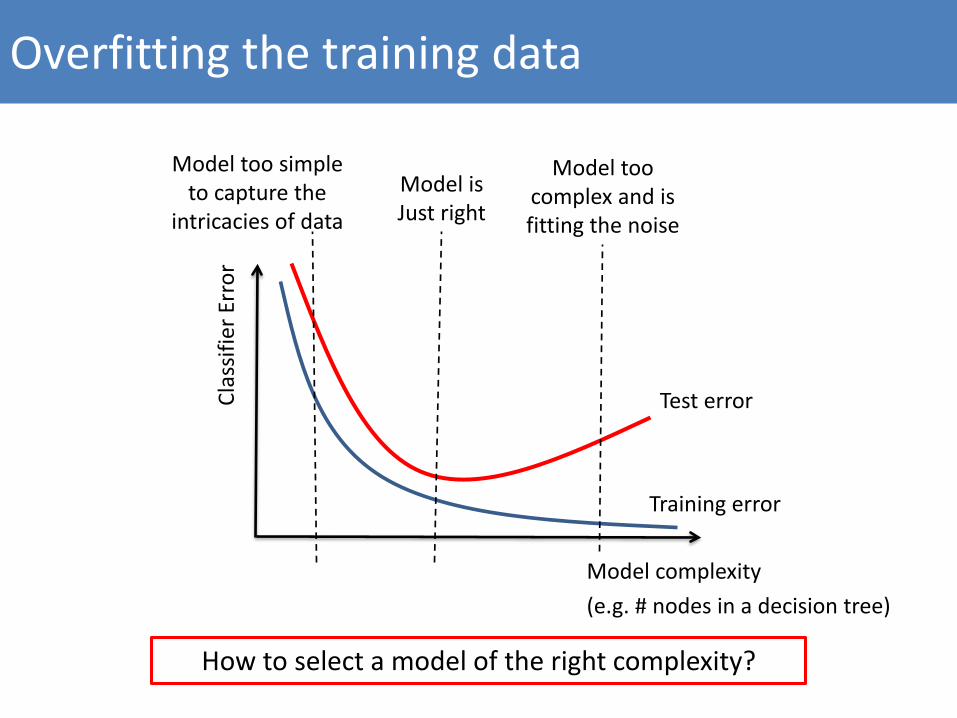
Overfitting the training data
Model complexity(e.g. # nodes in a decision tree)
Clas
sifie
r Err
or
Test error
Training error
Model too simple to capture the
intricacies of data
Model too complex and is fitting the noise
Model is Just right
How to select a model of the right complexity?
What we learned…
• Generative vs. Discriminative Classifiers
• Nearest Neighbor (NN) classification
• Optimality of k-NN
• Coping with drawbacks of k-NN
• Decision Trees
• The notion of overfitting in machine learning

Questions?
Next time…
How to construct classifiers using simple rules that can use multiple features at a time!