computing education 2010 - australian computer society€¦ · computing education 2010 proceedings...
TRANSCRIPT

Conferences in Research and Practice in
Information Technology
Volume 103
Computing Education 2010
Australian Computer Science Communications, Volume 32, Number 2
Client: Computing Research & Education Project: IdentityJob #: COR09100 Date: November 09


Computing Education 2010
Proceedings of theTwelfth Australasian Computing Education Conference(ACE 2010), Brisbane, Australia,January 2010
Tony Clear and John Hamer, Eds.
Volume 103 in the Conferences in Research and Practice in Information Technology Series.Published by the Australian Computer Society Inc.
Published in association with the ACM Digital Library.
acmacm
iii

Computing Education 2010. Proceedings of the Twelfth Australasian Computing Education Conference(ACE 2010), Brisbane, Australia, January 2010
Conferences in Research and Practice in Information Technology, Volume 103.
Copyright c©2010, Australian Computer Society. Reproduction for academic, not-for-profit purposes permittedprovided the copyright text at the foot of the first page of each paper is included.
Editors:
Tony ClearSchool of Computing and Mathematical SciencesAuckland University of TechnologyPrivate Bag 92006Auckland 1020, New ZealandEmail: [email protected]
John HamerDepartment of Computer ScienceUniversity of AucklandPrivate Bag 92019Auckland, New ZealandEmail: [email protected]
Series Editors:Vladimir Estivill-Castro, Griffith University, QueenslandSimeon J. Simoff, University of Western Sydney, NSW
Publisher: Australian Computer Society Inc.PO Box Q534, QVB Post OfficeSydney 1230New South WalesAustralia.
Conferences in Research and Practice in Information Technology, Volume 103.ISSN 1445-1336.ISBN 978-1-920682-84-2.
Printed, December 2009 by UWS Press, Locked Bag 1797, South Penrith DC, NSW 1797, AustraliaDocument engineering by Susan Henley, University of Western SydneyCover Design by Matthew Brecknell, Queensland University of TechnologyCD Production by FATS Digital, 318 Montague Road, West End QLD 4101, http://www.fats.com.au/
The Conferences in Research and Practice in Information Technology series aims to disseminate the results ofpeer-reviewed research in all areas of Information Technology. Further details can be found at http://crpit.com/.
iv

Table of Contents
Proceedings of the Twelfth Australasian Computing Education Conference(ACE 2010), Brisbane, Australia, January 2010
Preface . . . . . . . . . . . . . . . . . . . . . . . . . . . . . . . . . . . . . . . . . . . . . . . . . . . . . . . . . . . . . . . . . . . . . . . . . . . . . . . . vii
Programme Committee . . . . . . . . . . . . . . . . . . . . . . . . . . . . . . . . . . . . . . . . . . . . . . . . . . . . . . . . . . . . . viii
Organising Committee . . . . . . . . . . . . . . . . . . . . . . . . . . . . . . . . . . . . . . . . . . . . . . . . . . . . . . . . . . . . . . ix
Welcome from the Organising Committee . . . . . . . . . . . . . . . . . . . . . . . . . . . . . . . . . . . . . . . x
CORE - Computing Research & Education . . . . . . . . . . . . . . . . . . . . . . . . . . . . . . . . . . . . . . xi
ACSW Conferences and the Australian Computer ScienceCommunications . . . . . . . . . . . . . . . . . . . . . . . . . . . . . . . . . . . . . . . . . . . . . . . . . . . . . . . . . . . . . . . . . . xii
ACSW and ACE 2010 Sponsors . . . . . . . . . . . . . . . . . . . . . . . . . . . . . . . . . . . . . . . . . . . . . . . . . . . xiv
Invited Papers
Textbooks: How We Choose Them, How We Use Them, Shall We Lose Them? . . . . . . . . . . . . . . . . . . . . 3Nell B. Dale
Does Quality Assurance Enhance the Quality of Computing Education? . . . . . . . . . . . . . . . . . . . . . . . . . 9Arnold N. Pears
Computer Science in New Zealand High Schools . . . . . . . . . . . . . . . . . . . . . . . . . . . . . . . . . . . . . . . . . . . . . . 15Tim Bell, Peter Andreae and Lynn Lambert
Panel
Internationalisation and Cross Cultural Issues in Computing Education . . . . . . . . . . . . . . . . . . . . . . . . . . 25Kathryn Egea, Jie Lu, Jitian Xiao and Tony Clear
Contributed Papers
Introductory Programming and the Didactic Triangle . . . . . . . . . . . . . . . . . . . . . . . . . . . . . . . . . . . . . . . . . . 35Anders Berglund and Raymond Lister
An experience report on using collaboration technologies for distance and on-campus learning . . . . . . 45David Carrington, Soon-Kyeong Kim and Paul Strooper
Study Habits of CS 1 Students: What do they do outside the classroom? . . . . . . . . . . . . . . . . . . . . . . . . . 53Donald Chinn, Judy Sheard, Angela Carbone and Mikko-Jussi Laakso
Engaging Students in Programming . . . . . . . . . . . . . . . . . . . . . . . . . . . . . . . . . . . . . . . . . . . . . . . . . . . . . . . . . 63Malcolm Corney, Donna Teague and Richard N. Thomas

Constructive Controversy as a Way to Create True Collaboration in an Open Ended Group ProjectSetting . . . . . . . . . . . . . . . . . . . . . . . . . . . . . . . . . . . . . . . . . . . . . . . . . . . . . . . . . . . . . . . . . . . . . . . . . . . . . . . . . . 73
Mats Daniels and Asa Cajander
Introductory Programming in a Web Context . . . . . . . . . . . . . . . . . . . . . . . . . . . . . . . . . . . . . . . . . . . . . . . . . 79Michael de Raadt
Approaches used by cross-cultural and cross-discipline students in teamwork for a first-year coursein web design . . . . . . . . . . . . . . . . . . . . . . . . . . . . . . . . . . . . . . . . . . . . . . . . . . . . . . . . . . . . . . . . . . . . . . . . . . . . . 87
Kathryn Egea, Soon-Kyeong Kim, Trish Andrews and Karin Behrens
Effects of Course-Long Use of a Program Visualization Tool . . . . . . . . . . . . . . . . . . . . . . . . . . . . . . . . . . . . 97Erkki Kaila, Teemu Rajala, Mikko-Jussi Laakso and Tapio Salakoski
The case for ICT work-integrated learning from graduates in the workplace . . . . . . . . . . . . . . . . . . . . . . 107Tony Koppi, Sylvia Edwards, Judy Sheard, Fazel Naghdy and Wayne Brooks
Cross-Cultural Education: Learning Methodology and Behaviour Analysis for Asian Students in ITField of Australian Universities . . . . . . . . . . . . . . . . . . . . . . . . . . . . . . . . . . . . . . . . . . . . . . . . . . . . . . . . . . . . . 117
Jie Lu, K. L. Chin, Juan Yao, Jun Xu and Jitian Xiao
Student Perceptions of ICT: A Gendered Analysis . . . . . . . . . . . . . . . . . . . . . . . . . . . . . . . . . . . . . . . . . . . . . 127Christine McLachlan, Annemieke Craig and Jo Coldwell
The Quality of a PeerWise MCQ Repository . . . . . . . . . . . . . . . . . . . . . . . . . . . . . . . . . . . . . . . . . . . . . . . . . 137Helen Purchase, John Hamer, Paul Denny and Andrew Luxton-Reilly
Using a primary-school challenge in a third-year IT course . . . . . . . . . . . . . . . . . . . . . . . . . . . . . . . . . . . . . 147Simon
Improving the Learning of Graduate Attributes in the Curriculum: a Case-Study in IT Management . 155Alan Sixsmith and Andrew Litchfield
An Adaptable Framework for the Teaching and Assessment of Software Development across Year levels165Richard Thomas, Moira Cordiner and Diane Corney
Author Index . . . . . . . . . . . . . . . . . . . . . . . . . . . . . . . . . . . . . . . . . . . . . . . . . . . . . . . . . . . . . . . . . . . . . . . . 173
vi

Preface
Welcome to the Twelfth Australasian Computing Education Conference (ACE2010). This year, the ACE2010conference, which is part of the Australasian Computer Science Week, is being held in Brisbane Australiafrom 18-21 January, 2010.
We again see a strong international presence at the conference with 51 authors coming from Canada,Finland, New Zealand, Scotland, Sweden, United States and Australia. The Chairs would like to thank theProgram Committee for their excellent efforts in the double-blind reviewing process which resulted in theselection of 14 full papers from the 30 papers submitted, giving an acceptance rate of 47%.
The keynote speakers this year are hosted by the other ACSW conferences, in line with the policy thatthe plenary sessions will rotate between the ACSW conferences each year. We are lucky though to havethe services of three international invited speakers for this year’s ACE conference. Nell Dale from Texaswill talk on the topic of CS textbooks, and as a prolific textbook author herself we are lucky to have hershare her insights. Arnold Pears from Sweden will address the topic of Quality Assurance in ComputingEducation and some current conundrums. Tim Bell from New Zealand will profile some promising newdevelopments in the high school computing curriculum in New Zealand.
We have a very diverse set of topics this year. Papers and presentations include collaboration tech-nologies and Web 2.0, models and pedagogical frameworks for computing education, studies of noviceprogramming students, student motivations and perspectives, the use of technology in computing educa-tion, course content, curriculum structure, methods of assessment, web development, online learning, andwork-integrated learning through to graduate attributes. The high quality papers this year continue to pushthe frontiers of opportunities for research and innovation in computing education, and this conference willenable these educators to meet and share their experiences in a new forum. We will be holding a Panel onInternationalisation in Computing Education, profiling institutional developments, a major ALTC fundedstudy into international students in Australian Universities and a critical perspective on Internationalisa-tion and the ‘Export Education’ industry.
In keeping with the ACE tradition, there will be conference workshops, two prior to the conferenceand one at the end of the conference continuing to build research and expertise in computing education inAustralasia. The BRACElet workshop this year is thankful for the kind sponsorship from the AustralianCouncil for Learning and Teaching through their fellowship to Raymond Lister and Jenny Edwards.
We are grateful to SIGCSE for sponsoring the Conference jointly with the ACM. We thank everyoneinvolved in Australasian Computer Science Week for making this Conference and Proceedings publica-tion possible, and we thank CORE, our hosts Queensland University of Technology, Brisbane, and theAustralasian Computing Education Executive for the opportunity to chair this ACE2010 Conference.
Tony ClearAuckland University of Technology, New Zealand
John HamerUniversity of Auckland
ACE 2010 Programme ChairsJanuary 2010
vii

Programme Committee and Additional Referees
Chairs
Tony Clear, Auckland University of Technology, New ZealandJohn Hamer, University of Auckland, New Zealand
Members
Alison Young, CPIT, New ZealandAngela Carbone, Monash University, AustraliaMargaret Hamilton, RMIT University, Australia (senior co-chair)Judy Kay, University of Sydney, AustraliaJudy Sheard, Monash University, AustraliaJosh Tenenberg, University of Washington, USAMats Daniels, Uppsala University, SwedenMichael de Raadt, University of Southern Queensland, AustraliaRaymond Lister, University of British Columbia, CanadaSally Fincher, University of Kent, UKSimon, University of Newcastle, Australia
Additional Reviewers
Arnold Pears, Uppsala University, SwedenJacqueline Whalley, AUT University, AucklandGwyn Claxton, AUT University, AucklandGraham Bidois, AUT University, AucklandGordon Grimsey, AUT University, Auckland
Conference Webmaster
Graham Bidois, AUT University, Auckland
viii

Organising Committee
Co-Chairs
Dr. Wayne KellyProf. Mark Looi
Budget and Facilities
Mr. Malcolm Corney
Catering and Booklet
Dr. Diane Corney
Sponsorship and Web
Dr. Tony Sahama
Senior Advisors
Prof. Colin FidgeProf. Kerry Raymond
Finance and Travel
Ms. Therese CurrellMs. Carol Richter
Registration
Mr. Matt Williams
DVD and Signage
Mr. Matthew Brecknell
Satchels and T-shirts
Ms. Donna Teague
ix

Welcome from the Organising Committee
On behalf of the Australasian Computer Science Week 2010 (ACSW2010) Organising Committee, wewelcome you to this year’s event hosted by the Queensland University of Technology (QUT). Striving tobe a ”University for the Real World” our research and teaching has an applied emphasis. QUT is one ofthe largest producers of IT graduates in Australia with strong linkages with industry. Our courses andresearch span an extremely wide range of information technology, everything from traditional computerscience, software engineering and information systems, to games and interactive entertainment.
We welcome delegates from over 21 countries, including Australia, New Zealand, USA, Finland, Italy,Japan, China, Brazil, Canada, Germany, Pakistan, Sweden, Austria, Bangladesh, Ireland, Norway, SouthAfrica, Taiwan and Thailand. We trust you will enjoy both the experience of the ACSW 2010 event and alsoget to explore some of our beautiful city of Brisbane. At Brisbane’s heart, beautifully restored sandstonebuildings provide a delightful backdrop to the city’s glass towers. The inner city clusters around the loopsof the Brisbane River, connected to leafy, open-skied suburban communities by riverside bikeways. QUT’sGarden’s Point campus, the venue for ACSW 2010, is on the fringe of the city’s botanical gardens andconnected by the Goodwill Bridge to the Southbank tourist precinct.
ACSW2009 consists of the following conferences:
– Australasian Computer Science Conference (ACSC) (Chaired by Bernard Mans and Mark Reynolds)– Australasian Computing Education Conference (ACE) (Chaired by Tony Clear and John Hamer)– Australasian Database Conference (ADC) (ADC) (Chaired by Heng Tao Shen and Athman Bouguet-
taya)– Australasian Information Security Conference (AISC) (Chaired by Colin Boyd and Willy Susilo)– Australasian User Interface Conference (AUIC) (Chaired by Christof Lutteroth and Paul Calder)– Australasian Symposium on Parallel and Distributed Computing (AusPDC) (Chaired by Jinjun Chen
and Rajiv Ranjan)– Australasian Workshop on Health Informatics and Knowledge Management (HIKM) (Chaired by An-
thony Maeder and David Hansen)– Computing: The Australasian Theory Symposium (CATS) (Chaired by Taso Viglas and Alex Potanin)– Asia-Pacific Conference on Conceptual Modelling (APCCM) (Chaired by Sebastian Link and Aditya
Ghose)– Australasian Computing Doctoral Consortium (ACDC) (Chaired by David Pearce and Rachel Cardell-
Oliver).
The nature of ACSW requires the co-operation of numerous people. We would like to thank all thosewho have worked to ensure the success of ACSW2010 including the Organising Committee, the ConferenceChairs and Programme Committees, our sponsors, the keynote speakers and the delegates. Special thanks toJustin Zobel from CORE and Alex Potanin (co-chair of ACSW2009) for his extensive advice and assistance.If ACSW2010 is run even half as well as ACSW2009 in Wellington then we will have done well.
Dr Wayne Kelly and Professor Mark LooiQueensland University of Technology
ACSW2010 Co-ChairsJanuary, 2010

CORE - Computing Research & Education
CORE welcomes all delegates to ACSW2010 in Brisbane. CORE, the peak body representing academiccomputer science in Australia and New Zealand, is responsible for the annual ACSW series of meetings,which are a unique opportunity for our community to network and to discuss research and topics of mutualinterest. The original component conferences ACSC, ADC, and CATS, which formed the basis of ACSWinthe mid 1990s now share the week with seven other events, which build on the diversity of the Australasiancomputing community.
In 2010, we have again chosen to feature a small number of plenary speakers from across the discipline:Andy Cockburn, Alon Halevy, and Stephen Kisely. I thank them for their contributions to ACSW2010. Ialso thank the keynote speakers invited to some of the individual conferences. The efforts of the conferencechairs and their program committees have led to strong programs in all the conferences again, thanks.And thanks are particularly due to Wayne Kelly and his colleagues for organising what promises to be astrong event.
In Australia, 2009 saw, for the first time in some years, an increase in the number of students choosingto study IT, and a welcome if small number of new academic appointments. Also welcome is the news thatuniversity and research funding is set to rise from 2011-12. However, it continues to be the case that per-place funding for computer science students has fallen relative to that of other physical and mathematicalsciences, and, while bodies such as the Australian Council of Deans of ICT seek ways to increase studentinterest in the area, more is needed to ensure the growth of our discipline.
During 2009, CORE continued to work on journal and conference rankings. A key aim is now tomaintain the rankings, which are widely used overseas as well as in Australia. Management of the rankingsis a challenging process that needs to balance competing special interests as well as addressing the interestsof the community as a whole. ACSW2010 includes a forum on rankings to discuss this process. Also in2009 CORE proposed a standard for the undergraduate Computer Science curriculum, with the intentionthat it be used for accreditation of degrees in computer science.
COREs existence is due to the support of the member departments in Australia and New Zealand, and Ithank them for their ongoing contributions, in commitment and in financial support. Finally, I am gratefulto all those who gave their time to CORE in 2009; in particular, I thank Gill Dobbie, Jenny Edwards, AlanFekete, Tom Gedeon, Leon Sterling, and the members of the executive and of the curriculum and rankingcommittees.
Justin Zobel
President, COREJanuary, 2010

ACSW Conferences and theAustralian Computer Science Communications
The Australasian Computer Science Week of conferences has been running in some form continuouslysince 1978. This makes it one of the longest running conferences in computer science. The proceedings ofthe week have been published as the Australian Computer Science Communications since 1979 (with the1978 proceedings often referred to as Volume 0 ). Thus the sequence number of the Australasian ComputerScience Conference is always one greater than the volume of the Communications. Below is a list of theconferences, their locations and hosts.
2011. Volume 33. Host and Venue - Curtin University of Technology, Perth, WA.
2010. Volume 32. Host and Venue - Queensland University of Technology, Brisbane, QLD.
2009. Volume 31. Host and Venue - Victoria University, Wellington, New Zealand.2008. Volume 30. Host and Venue - University of Wollongong, NSW.2007. Volume 29. Host and Venue - University of Ballarat, VIC. First running of HDKM.2006. Volume 28. Host and Venue - University of Tasmania, TAS.2005. Volume 27. Host - University of Newcastle, NSW. APBC held separately from 2005.2004. Volume 26. Host and Venue - University of Otago, Dunedin, New Zealand. First running of APCCM.2003. Volume 25. Hosts - Flinders University, University of Adelaide and University of South Australia. Venue
- Adelaide Convention Centre, Adelaide, SA. First running of APBC. Incorporation of ACE. ACSAC heldseparately from 2003.
2002. Volume 24. Host and Venue - Monash University, Melbourne, VIC.2001. Volume 23. Hosts - Bond University and Griffith University (Gold Coast). Venue - Gold Coast, QLD.2000. Volume 22. Hosts - Australian National University and University of Canberra. Venue - ANU, Canberra,
ACT. First running of AUIC.1999. Volume 21. Host and Venue - University of Auckland, New Zealand.1998. Volume 20. Hosts - University of Western Australia, Murdoch University, Edith Cowan University and
Curtin University. Venue - Perth, WA.1997. Volume 19. Hosts - Macquarie University and University of Technology, Sydney. Venue - Sydney, NSW.
ADC held with DASFAA (rather than ACSW) in 1997.1996. Volume 18. Host - University of Melbourne and RMIT University. Venue - Melbourne, Australia. CATS
joins ACSW.1995. Volume 17. Hosts - Flinders University, University of Adelaide and University of South Australia. Venue -
Glenelg, SA.1994. Volume 16. Host and Venue - University of Canterbury, Christchurch, New Zealand. CATS run for the first
time separately in Sydney.1993. Volume 15. Hosts - Griffith University and Queensland University of Technology. Venue - Nathan, QLD.1992. Volume 14. Host and Venue - University of Tasmania, TAS. (ADC held separately at La Trobe University).1991. Volume 13. Host and Venue - University of New South Wales, NSW.1990. Volume 12. Host and Venue - Monash University, Melbourne, VIC. Joined by Database and Information
Systems Conference which in 1992 became ADC (which stayed with ACSW) and ACIS (which now operatesindependently).
1989. Volume 11. Host and Venue - University of Wollongong, NSW.1988. Volume 10. Host and Venue - University of Queensland, QLD.1987. Volume 9. Host and Venue - Deakin University, VIC.1986. Volume 8. Host and Venue - Australian National University, Canberra, ACT.1985. Volume 7. Hosts - University of Melbourne and Monash University. Venue - Melbourne, VIC.1984. Volume 6. Host and Venue - University of Adelaide, SA.1983. Volume 5. Host and Venue - University of Sydney, NSW.1982. Volume 4. Host and Venue - University of Western Australia, WA.1981. Volume 3. Host and Venue - University of Queensland, QLD.1980. Volume 2. Host and Venue - Australian National University, Canberra, ACT.1979. Volume 1. Host and Venue - University of Tasmania, TAS.1978. Volume 0. Host and Venue - University of New South Wales, NSW.

Conference Acronyms
ACDC Australasian Computing Doctoral ConsortiumACE Australasian Computer Education ConferenceACSC Australasian Computer Science ConferenceACSW Australasian Computer Science WeekADC Australasian Database ConferenceAISC Australasian Information Security ConferenceAUIC Australasian User Interface ConferenceAPCCM Asia-Pacific Conference on Conceptual ModellingAusPDC Australasian Symposium on Parallel and Distributed Computing (replaces AusGrid)CATS Computing: Australasian Theory SymposiumHIKM Australasian Workshop on Health Informatics and Knowledge Management
Note that various name changes have occurred, which have been indicated in the Conference Acronyms sections
in respective CRPIT volumes.
xiii

ACSW and ACE 2010 Sponsors
We wish to thank the following sponsors for their contribution towards this conference.
Client: Computing Research & Education Project: IdentityJob #: COR09100 Date: November 09
CORE - Computing Research and Education,www.core.edu.au
Queensland University of Technology,www.qut.edu.au
Australian Computer Society,www.acs.org.au
CEED,www.corptech.com.au
CSIRO ICT Centre,www.csiro.au/org/ict.html
SAP Research,www.sap.com/about/company/research
Association for Computing Machinery,www.acm.org
ACM Special Interest Group onComputer Science Education,
www.sigcse.org
The Commonwealth Scientific and IndustrialResearch Organisation,
www.csiro.au
Australian Learning and Teaching Council,www.altc.edu.au
xiv

Invited Papers
Proc. 12th Australasian Computing Education Conference (ACE 2010), Brisbane, Australia
1

CRPIT Volume 103 - Computing Education 2010
2

Textbooks: How We Choose Them, How We Use Them,
Shall We Lose Them?
Nell B. Dale, Retired Computer Science Department
University of Texas at Austin
Austin, Texas 78712
Abstract
This paper describes the results of a survey designed to
explore how computer science educators view textbooks:
how they choose them, how they use them, how they view
the role of textbooks within the curriculum, and how they
view the future of textbooks.
The survey was posted on the Internet, with invitation
email messages sent to the mailing list for SIGCSE, the
ACM’s Special Interest Group for Computer Science
Education, asking them to fill out the survey. Of the
1053 addresses on the mailing list, 188 recipients
responded, giving a response rate of almost 18%.
This paper describes the demographics of the
respondents, presents the objective responses, and
provides a content analysis of the subjective responses.
Keywords: computer textbook survey, curriculum
materials.
1 Introduction
As both an educator and a writer, I have been intimately
involved with textbooks for almost forty years. I know
what I have looked for in a text and what disqualifies one
for me. When I was working actively as an instructor, the
text was the part of the basis for assigned readings and
biweekly quizzes. In my experience, good textbooks both
lead and follow curriculum guidelines. Do my views
parallel those of my colleagues?
I read a textbook with a highlighter in my hand. I mark
interesting passages; I write questions and comments in
the margin; and I bookmark special pages—all of which
is difficult to do with an electronic version. Do my
colleagues feel the same about electronic versions of
textbooks? Do their students?
Working with editors over many years of textbook
authoring, I know very well what my editor says the
"market‖ requires in terms of ancillaries. Does any editor
really know what my colleagues require?
To see if my views did parallel those of my
colleagues, I designed a survey to explore how computer
science faculty choose and use textbooks. The results did
not show anything surprising but did present avenues for
future research.
Copyright © 2010, Australian Computer Society, Inc. This
paper appeared at the Twelfth Australasian Computing
Education Conference (ACE2010), Brisbane, Australia, January
2010. Conferences in Research and Practice in Information
Technology, Vol. 103. Tony Clear and John Hamer, Eds.
Reproduction for academic, not-for-profit purposes permitted
provided this text is included.
2 Methodology
This survey was designed to discover how computer
science teaching faculty felt about and used textbooks in
their classrooms. As an exploratory study, there were no
hypothesis to test, but hopefully future avenues of
research would surface Though not planned as such, an
analysis of this data meets the definition of an empirical
study: "The empirical method…is generally characterized
by the collection of a large amount of data before much
speculation as to their significance, or without much idea
of what to expect...‖ [1].
I used the tool SurveySuite [2] to design a survey,
consisting of multiple-choice items alone, multiple-choice
items with the option of adding comments, and open-
ended questions. The SurveySuite tool produces
frequency tables of the responses. For objective questions
with comments, the results are shown in tabular form,
followed by a list of the comments. In processing the
results, I have read the through all of the comments and
where possible folded them into one of the original
options.
For open-ended questions, the tool makes the entire
text of each response available for analysis. For concrete
questions, I analysed the responses using key words. For
opinion questions, I read the responses and allowed
categories to emerge from the content. Once I had
considered all of the responses, I made second pass and
classified each response (or partial response) based on the
categories formed in the first pass.
3 Respondent Demographics
There were a total of 188 responses to the survey. Figures
1, 2 and 3 show the type of institution with which the
respondents are associated, the level at which they teach,
and their years of teaching experience. One respondent
filled in the "Other" category, saying that he had been
teaching over 40 years.
In order to explore the breadth of the respondents’
backgrounds, one question asked if they had ever taught
an interdisciplinary course. The responses were
surprising: Fifty-five interdisciplinary courses were
represented in the survey. They included courses in the
fields of biology, media and gaming, philosophy (ethics),
mathematics, music, business, freshmen seminars, and
women’s studies.
Because this survey was about textbooks, a relevant
part of the demographics of the group was whether or not
a respondent had published a textbook. Figure 4 shows
the responses to this question.
Proc. 12th Australasian Computing Education Conference (ACE 2010), Brisbane, Australia
3

Sixty-three out of 188 have written or is in the process of
writing a textbook. Another 22 have thought about
writing a textbook.
4 Choice of Textbooks
Of the respondents, 108 said that each individual
instructor chooses textbooks in their department; 3 said
that a committee chooses the textbooks; the remainder
reported that the way in which the textbook was chosen
depended on the course.
4.1 Individual Instructor
There were three questions relating to how each
respondent chooses a textbook: One asked how a choice
is made, one asked for desirable features, and the third
CRPIT Volume 103 - Computing Education 2010
4

asked how important certain features were. Figure 5
shows the responses to the first question.
Most of the ―Other‖ responses combined the
possibilities already represented in the figure. However,
several mentioned that they make choices by looking at
books in the Exhibits area at the SIGCSE Technical
Symposium.
The second question asked the respondents to state
what they looked for when choosing a textbook. Figure 6
summarizes these responses. The first five points in
Figure 6 were options in the original question; the last
two rows were abstracted from the ―Other‖ category.
Table 1 shows the responses to a table question
showing features and ancillaries and measures of
importance. Such features as chapter openers with goals
and multiple color formats are not important. Clearly
clarity is of prime importance to most instructors, but
visuals are only mildly important. Stratified exercises are
important but most respondents do not particularly care
whether exercise answers are provided. PowerPoints,
study guides, and testbanks are not important. These
results should be of interest to editors.
Feature
Co
uld
n’t
care
les
s
Mil
dly
imp
ort
an
t
Imp
ort
an
t
Ver
y
Imp
ort
an
t
Ess
en
tia
l
Chapter
opener w/goals 24 41 22 10 2
Exercises of
various levels 3 11 27 36 24
Clarity 1 0 6 34 60
Visuals 4 26 42 21 6
Exercise
answers 19 36 26 16 4
PowerPoints 51 29 8 9 4
Testbanks 55 26 10 7 2
Student study
guide 39 43 15 3 1
Two color 53 31 10 5 1
Four color 58 24 11 6 0
Table 1: Percentage Rating
of Features and Ancillaries [grey cells are discussed in text]
When asked if they used CourseSmart.com or other
websites that allow an instructor to evaluate HTML
versions of a textbook, 56 said yes, 91 said no, and 39
indicated that they didn’t know such sites existed. When
asked if they let their students purchase online versions of
a textbook, 26 said no, 107 said yes, and 53 said maybe.
4.2 Committee Makes Selection
One respondent’s answer sums up the committee-
selection process: ―1. Get books. 2. Meet & discuss
3. Select.‖ The rigor of the process varies widely across
institutions as shown by these quotes:
―For introductory courses, the relevant faculty review
a range of textbooks, map the books to the topics
desired, develop tentative day-by-day class
schedules, review the problems and reading clarity,
and pick the book that seems to fit best.‖
―The process usually has some evaluation forms that
each committee member completes ranking various
categories about the textbook. Additionally, we must
begin the process earlier.‖
―Informal meetings‖
―If someone really champions a book, it is usually
chosen.‖
―Consensus building‖
5 Textbook Use
Figure 7 summarizes how instructors make use of their
textbooks. The final entry in Figure 7, using the textbook
as a source for homework assignments and exam and
exercise questions, was abstracted from the ―Other‖
category. However, further examination of the raw
responses revealed that this question was badly designed.
Of the ten respondents who do not use a textbook, six
make the textbook optional, seven expect the students to
read the appropriate chapters, five assign readings, and
four assign readings and quiz over what was read. This
apparent contradiction shows that instructors use
textbooks differently in different classes.
5.1 Should Textbooks Follow Curriculum
Guidelines?
A Google search of "computer curriculum guidelines"
returned almost 9 million hits. In the United States, the
ACM/IEEE curriculum work is the best known [3, 4].
Other countries have their own curriculum guidelines,
thus this question was deliberately left ambiguous. Of the
comments that supported having textbooks follow
curriculum guidelines, several focused on the consistency
they provided, especially at the lower-division level.
These respondents indicated that conformity would make
it easier for new faculty and would help students as they
make the transition from 2-year schools to 4-year schools.
Another group of comments coalesced around the
concept that curriculum guidelines are a minimum set.
To follow guidelines slavishly stifles innovation and
initiative. One respondent pointed out that guidelines are
long-term goals, rather than a road map of how to get
there. Two respondents commented that some schools
still use the course-oriented guidelines of ACM
Proc. 12th Australasian Computing Education Conference (ACE 2010), Brisbane, Australia
5

Curriculum 1968 [5] and Curriculum 1978 [6] because
more recent guidelines use knowledge units rather than
well-defined courses. This approach presents small well-
defined concepts—knowledge units--involved in a topic
but the collection of these knowledge units into a course
is not defined.
A number of respondents basically said ―what
guidelines?‖
5.2 Should Textbooks Guide Innovations?
Although the question asked whether textbooks should
―… guide innovations in curriculum,‖ many answered the
question in terms of teaching and pedagogy. This group
is characterized by the following quotes:
―Definitely, teachers often get stuck on approaches
with which they are comfortable. Textbooks which
guide innovations can help us get un-stuck – to the
benefit of our students.‖
―I think that would be great. I am always looking for
new ideas and new ways to teach.‖
―Yes – a well-written textbook (along with
supporting materials) can help an instructor adopt
new and more effective instructional methods.‖
Another group felt strongly that innovation should
guide textbooks, not the other way around. One
respondent in this group remarked that textbooks can help
disseminate innovations in the curriculum beyond the
original innovators.
A third group saw the possibilities of innovative
textbooks guiding curriculum but felt that the turnaround
time for producing a textbook is too long for that to be
practical. Several respondents pointed out that textbook
publishers are reluctant to publish anything ―different.‖
5.3 Availability of Textbooks in Curriculum
Revision
Almost all of the respondents felt that the availability of
textbooks should be taken into account when revising a
curriculum. However, many made the distinction
between lower-division courses and other courses, stating
that upper-division and graduate courses were not as
dependent on a textbook.
One respondent pointed out that appropriate textbooks
are a key factor for curriculum revision at the institutional
level but not at the national level. Others said that it
depended on the people implementing the revision: Were
the instructors ready and willing to prepare curriculum
materials as they went along?
5.4 Textbooks that Caused Radical Change
Of the 182 respondents who commented on whether or
not a textbook had radically changed their teaching or
approach to a class, 129 said no, 50 said yes, and 6 were
still hoping to find one. Oh! Pascal by Doug Cooper and
Mike Clancy [7] was mentioned four times, while How to
Design Programs by Matthias Felleison [8] was
mentioned five times. Authors such as David Patterson,
John Hennessy, David Gries, A. V Aho, J. D. Ullman,
and Don Knuth were also cited.
5.5 Will Textbooks Become Obsolete?
Many respondents felt that some form of electronic book
would eventually dominate the market place. Others
were not so sure, and still others had no idea. Many of
the responses were quite emphatic. Here is a sample of
the different types of responses:
―I suspect that printed textbooks will be obsolete
within the next 20 years. When I give students the
option to use a pdf version of a book or a paper one
(both for purchase), the overwhelming majority
choose the electronic version already.‖
―I certainly hope not! The ability to highlight parts of
a text and leaf through the book to see pages as a
whole would be preferable to me, and I hope, to
students. I don’t have a Kindle and am only slightly
familiar with them, so perhaps I’m not the best judge.
But I personally would not want to sit down and read
using one.‖
―There are two answers: Should it? I think not. The
ability to go back to references, answers, tables, etc.
makes the book format very valuable. Will it? I think
probably yes because today’s students tend to be
skimmers rather than deep readers.‖
―The delivery of electronic materials in general
(Kindle or web) seems quite likely to seriously
change the textbook market. Obsolete? Newspapers
aren’t obsolete but they’re in trouble and making
major changes.‖
―Only if an open standard is developed that authors,
publishers and customers all embrace. The current
models (such as CourseSmart’s 180 day window or
Kindle’s deletion backdoor) are inadequate.‖
―No. We will not see a common preferred platform,
paper versus electronic, any more than we will see a
predominant learning style.‖
Figure 8: Author's motivation
(in terms of number of responses)
14
39
47
27
6
10
5
0 10 20 30 40 50
Advance my
career
I can change
course direction
I can explain it
better
I like to write
Money
Couldn’t find
one I liked
Other
6 Motivation for Writing a Textbook
The last set of questions on the survey asked about
motivation: What did motivate you to write a book (if you
have); what would motivate you to write a book; and
what should be the motivation for becoming an author.
CRPIT Volume 103 - Computing Education 2010
6

6.1 Author’s Motivation
Figure 8 shows what motivated authors to write a
textbook. Category ―Couldn’t find one I liked‖ came
from the ―Other‖ responses. A further analysis of the
data shows that most authors have more than one
motivation. Money was not the only motivator for any of
the respondents. Advancement was the only motivator
for two respondents. The majority of all motivations can
be classified as ―I can do it better and make a difference.‖
Figure 9: Future Motivations
(in terms of num ber o f responses)
30
73
88
47
22
7
6
7
14
0 20 40 60 80 100
A dvance my career
I can change the direction of a
course
I can explain it better
I like to write
Money
Do a better job
Better fit curriculum
Nothing!
O ther
6.2 Future Motivation
When asking what might motivate the respondents to
write a textbook in the future, the results were similar to
the answers in the previous question. Figure 9 shows
these results. Two ―Other‖ responses stand out: ―loss of
sanity‖ and ―major financial difficulties.‖
6.3 Proper Motivation
The last question about motivation asked what should be
the motivation to write a textbook. The answers fell into
three categories: personal reasons, better job, and new
directions.
The first group was exemplified by such phrases as
―desire to communicate,‖ ―advancement,‖ ―money,‖
―serious belief,‖ and ―love of writing.‖ The second group
included such phrases as ―more accessible,‖ ―have a
message,‖ ―build a better mousetrap,‖ and ―unique and
refreshing.‖ The third group used such phrases as
―different content,‖ ―new perspective,‖ ―provoking
thought,‖ ―fill a need,‖ and ―void in current literature.‖
The following quotes sum up these respondents’
thoughts on appropriate motivation to write a textbook:
―passion, creativity, an urge to teach that can’t
merely be satisfied in the classroom.‖
―You’ve created something that you feel will
significantly improve student learning.‖
―To provide a learning aid to students that is either
currently unavailable or surpasses the currently
available texts.‖
―To illuminate, shed new light, new synthesis of a
subject, to inspire, to motivate.‖
―The belief that one can produce something better
than what exists.‖
7 Conclusion
This paper describes the results of a survey about the
choice and use of textbooks in computer science. Several
trends emerged among the 188 respondents. The first is
that these instructors who took the time to respond to the
survey are passionate about teaching and their students.
They are always striving to become better teachers and
provide better materials for their students.
Secondly, a number of respondents made it clear that
they do not like publishers. This bias showed up on such
comments as these:
―Textbooks should express the soul of the author
on the subject (of course the publisher’s editor
may weigh in).‖
―Further, textbooks tend to be at least a few years
behind the cutting edge, especially since
publishers are notoriously focused on sales rather
than innovation.‖
―Innovative texts are harder to sell to publishers
and don’t seem to do well in the market.‖
―No, individual authors and more importantly
publishers should have little influence over
curriculum innovations, IMO.‖
―On the other hand, publishers seem very
reluctant to take on innovative text projects, as
they are considered too risky.‖
―No way in hell. Publishers mindless
beaureaucrats [sic].‖
Although the respondents share a common passion,
they are not of the same mind. They differ on how they
use textbooks in the classroom. They differ on their view
of the role of textbooks in the curriculum. They differ on
their view of the future of textbooks. They have differing
views on author motivation.
Did I learn anything new from conducting this survey
and analyzing the responses? Yes; I learned that my
views parallel those of many colleagues and diverge from
those of many others. I learned that the features and
ancillaries that some editors consider essential are in fact
not very important to many dedicated instructors.
More importantly, did you learn anything new? Please
share your thoughts with me.
8 Future Directions
I am not aware of any previous survey on the choice and
use of textbooks in any discipline. Thus, there is nothing
with which to compare these results. This leads to
several interesting questions for future research.
Do the views concerning textbook choice and use of
this sample mirror those of the wider computer
science faculty community? This sample was drawn
from an organization dedicated to CS education; is
the sample biased?
Do the views of the computer science community
mirror the views of other scientific disciplines?
This survey suggests that a disconnect exists between
what instructors want and what publishers think they
want. A parallel survey given to publishers might
help to clarify this issue.
Do faculty at institutions with graduate programs
have the same views as those who teach at
Proc. 12th Australasian Computing Education Conference (ACE 2010), Brisbane, Australia
7
undergraduate institutions? The results stratified by
type of institutions might be very instructive.
Do inexperienced faculty (say less than six years of
teaching experience) have the same views as their
more experienced colleagues? The results stratified
by years of teaching should be examined.
The survey itself should be refined based on the
results. The objective choices should be rephrased so
that most categories are represented. The fewer the
"Other" categories, the more concise the results.
I will be glad to make the full results of the survey
available to anyone who is interested in looking into any
of these questions.
9 References
[1] ―Empirical method,‖ AccessScience, McGraw-Hill
Encyclopedia of Science and Technology. Online,
http://www.accessscience.com/search/asearch
[2] SurveySuite Software, the University of Virginia:
http://intercom.virginia.edu/cgi-
bin/cgiwrap/intercom/SurveySuite/ss_index.pl
[3] Computing Curricula 1991, Communications of the
ACM, Volume 34, Issue 6 (June 1991).
[4] Computing Curricula 2001Computer Science, Final
Report, The Joint Task Force on Computing Curricula,
IEEE Computer Society, Association for Computing
Machinery, December 13, 2001.
[5] Curriculum 68: Recommendations for academic
programs in computer science: a report of the ACM
curriculum committee on computer science
Communications of the ACM, Volume 11, Issue3
(March 1968).
[6] Curriculum '78: Recommendations for the
undergraduate program in computer science—a report
of the ACM curriculum committee on computer
Science, Communications of the ACM, Volume 22,
Issue 3 (March 1979)
[7] Cooper, D., Clancy, M. Oh! Pascal! W. W. Norton
and Company, 1985.
[8] Felleisen, M., Findler, R., Flatt, M., Krishnamuthi, S.
How to Design Programs: An introduction to
Programming and Computing, MIT Press, 2003.
CRPIT Volume 103 - Computing Education 2010
8

Does Quality Assurance Enhance the Quality of ComputingEducation?
Arnold N. Pears
IT Department, Uppsala University, Box 337, 751 05 Uppsala, SWEDEN,[email protected]
Abstract
Delivery of “quality” education is a major element ofthe mission statements of the world’s tertiary institu-tions. Quality has emerged as an important academicperformance metric and can have significant impacton the reputations of individuals, departments, fac-ulties and institutions. This paper explores qualityand quality assurance (QA) from several perspectives,production and manufacturing, service provision andpersonal growth, relating them to current QA frame-works and practices in computing.Keywords:quality, assessment, computing education
1 Introduction
Fundamental to the discussion of educational qualityis a discussion of the epistemology of tertiary educa-tion. This paper argues that a shift in the focus ofuniversities towards providing more broad scale ed-ucation, to a larger segment of the population, haschanged our view of education. The perception ofUniversities as seats of learning engaged in inculcatingstudents with academic values and knowledge as partof a process of self discovery and personal growth, hasgiven way to one of providing a product to a customer.Defining education as a commodity transforms ourworld view, making students into customers, and thewidespread practice of charging tuition fees can beconstrued as presenting education as a product or ser-vice.
Retail and production companies have developedsophisticated mechanisms for quality control. To-tal quality management(TQM) approaches integratequality control and production process refinement toachieve high levels of output quality and internal pro-duction accountability. In areas such as science, andperhaps especially engineering, process monitoring forquality control and management is a natural part ofcommercial operations and may even be an explicitpart of the curriculum. Application of similar ap-proaches to educational quality assessment and pro-cess is evident as in initiatives such as CDIO increasein significance (Brodeur & Crawley 2009).
Another significant factor driving the introduc-tion of QA is the global trend emphasising manage-rial practices and education for academic administra-tion (Hattie 1990, Soutar & McNeil 1996). The corpo-ratisation of tertiary institutions also leads naturallyto the application of business models of productionand quality assurance of process and product, as is
Copyright c©2010, Australian Computer Society, Inc. This pa-per appeared at the Eleventh Australasian Computing Edu-cation Conference (ACE2010), Brisbane, Australia, January2010. Conferences in Research and Practice in InformationTechnology (CRPIT), Vol. 103, Tony Clear and John Hamer,Ed. Reproduction for academic, not-for profit purposes per-mitted provided this text is included.
evident in a number of recent publications dealingwith the evaluation of marketing and service scalesdeveloped in other sectors (Abdullah 2006, Soutar &McNeil 1996).
Are managerial and quality practices from pro-duction and service corporations really appropriatein computing education? This paper explores ap-proaches to QA and TQM frameworks. We examinehow existing practices might fit into such a frame-work, and propose new strategies with which to ad-dress academic content quality and pedagogy. Con-tent is often addressed during accreditation activi-ties, while issues such as pedagogy and progressionin learner maturity are not often taken directly intoaccount.
In this paper we approach the issue of educationalquality from three perspectives, production, serviceprovision, and learning development.
2 Perspectives on Education and EducationalQuality
2.1 Production
Education provision can be viewed as the process ofequipping students with a set of skills and compe-tencies. Assessment of educational structure, deliv-ery process and content are clearly important aspectsof quality assurance activity. This section exploressome of these ideas in the context of teaching andlearning processes and activities in computing. Fo-cus on this dimension of educational quality has beenincreasingly popular among accreditation bodies andtertiary education administrators, at least in the areaof engineering and computing.
CDIO (Beggeren et al. 2003) adopts a broad modelbased on supporting students to Conceive, Design,Implement and Operate (CDIO) complex systems.The objectives as stated by Berggren (Beggeren et al.2003) are as follows.
Three overall goals direct the alliances en-deavours. They are to educate students to:
• Master a deep working knowledge oftechnical fundamentals.
• Lead in the creation and operation ofnew products and systems.
• Understand the importance and strate-gic value of their future research work.
The CDIO approach to quality deals with specify-ing and analyzing the content of courses and degreeprograms with respect to specific and general learn-ing outcomes. CDIO course and programme matricesspecify the nature of individual courses and their re-lationship to, and role within, the degree programmeas a whole. Each matrix lists all CDIO syllabus itemsin one dimension and marks them with one or more of
Proc. 12th Australasian Computing Education Conference (ACE 2010), Brisbane, Australia
9

the values ”Introduce” (I), ”Teach” (T) and ”Utilize”(U) (Gunnarsson et al. 2007).
The detailed nature of the production engineeringstyle documentation that CDIO embraces also allowsadopters to propose production quality metrics. Us-ing production metrics drawn from the productionprocess description CDIO can implement a type ofTQM that will be familiar to many practicing engi-neers. The Swedish Government approach to usingCDIO for quality assurance of engineering educationis described by Malmqvist and Sadurskis (Malmqvist& Sadurskis 2009).
National and international accreditation bodiesalso play an important role. In the U.S. ABET ac-creditation focuses on the structure and outcomes,as well as the content of engineering programmes.ABET provides very detailed guidelines on the struc-ture, content and assessment practices which are re-quired in order for a degree to be accredited. Simi-lar bodies exist in many other countries. These ini-tiatives have significant effect on how education pro-grammes are structured and taught.
In the UK the British Computer Society accreditsboth degree programmes and individuals as doesthe Australian Computer Society in Australia.Quality organisations in the European HigherEducation Area are coordinated centrally by theEuropean Association for Quality Assurance inHigher Education (ENQA). EHEA member statesare required to have or create quality assuranceagencies, which in turn are required to join ENQA.These agencies are charged to conduct regular exter-nal assurance audits at the program or institutionallevel. Program-specific accreditation is handleddifferently in different countries. In Germany, alluniversity programs are required to be accredited bydiscipline-based organizations. For example, ASIIN(http://www.asiin.de/english/newdesign/index ex5.html)accredits programs in engineering, informatics, natu-ral sciences and mathematics. In 2009, a Europe-widenetwork of computing accreditation organizationswas established called Eqanie. Its goal is to ratifyEuropean standards for Bachelor’s and Master’sprograms in computing.
In Sweden, curricula and degree structures, as wellas overall quality assessment, is managed by the uni-versity and subject to the Swedish Higher EducationAct and Ordinances. Regular evaluation of universi-ties is conducted by the Swedish ministry for highereducation to ensure that universities meet the re-quired standards.
2.2 Service
Production quality management is one approach todefining structures and processes to deliver qualityeducation. Another major area of activity associatedwith assessment of educational quality is evaluation ofstudent perceptions of the quality and value of theireducation experience at University. These studies de-velop survey instruments working from a fundamentalassumption that education is a product and that stu-dents are consumers/customers.
When dealing with perception and profit relation-ships in service markets Buzzell and Gale (Buzzell &Gale 1987) concluded that customer perception is aprimary factor when defining service quality. Thisargument is developed further by Soutar (Soutar &McNeil 1996) as follows.
“Following in this vein,Hittman (HITTMAN 1993) is highlycritical of the traditional approach toquality assessment in tertiary institutions.He suggests that the approach has been
too narrow, with an over-emphasis on thequality of academics and too little attentionpaid to the non-academic aspects of theeducational experience. He believes thatquality in a tertiary education contextis about much more than pedagogy. Itwould seem that measurements of studentsatisfaction must be holistic.”
While an holistic approach is almost certainly de-sirable, current student survey based approaches toevaluation of educational quality, in which aspects oflearning outcomes and student development figure atbest marginally, can hardly be claimed to be holis-tic in nature. In addition, there does not seem to bemuch real support for a claim that prior approachesmeasured aspects of pedagogy to any significant ex-tent.
The objectives of a customer focused approachto TQM are also emphasised by Soutar, and he re-emphasises the, then dominant, role of academics indefining performance indicators. No specific indica-tors are mentioned by Soutar, but the following quoteillustrates his position.
“One way to attain this quality mind-set isto develop an understanding in the employeegroup that TQM is concerned with meetingcustomers requirements. However, there isa tendency for the performance indicatorsto be written from the perspective of theeducator. There has been little attempt toapproach this topic from the point of viewof the student.”
There are several aspects of this argument thatmight cause educators some concern. Students’ abil-ity to evaluate a number of crucial aspects of edu-cational quality is likely to be uncertain. Studentsare often not experts in the topic area being stud-ied, nor expert educators, at the time they are tak-ing most undergraduate courses. Consequently, theirjudgments regarding the appropriateness of the in-struction in terms of their learning development areoften not well supported by relevant expertise. Stu-dent perceptions of what is taught and examined, es-pecially for verbal approaches to continuous assess-ment, and other assessment methods which are notbased on the evaluation of artifacts such as assign-ments or written examinations, can be misleading,both for students and academic administration if toogreater reliance is placed on course evaluation surveyscompleted by students (Berglund et al. 2009).
Customer service surveys targeting student per-ceptions of education quality in the tertiary educa-tion domain have been investigated in a number ofstudies. Abdullah (Abdullah 2006) investigates twoof the major higher education quality instruments,SERVPERF, and HEdPERF deriving a combinedscale. During the evaluation reliability measures werecomputed and reported as follows.
“The Cronbachs a for HEdPERF dimen-sions ranged from 0.81 to 0.92, with the ex-ception of the dimension understanding (a0.63). Owing to its low reliability score,the dimension understanding was removedas part of the scale modication process.
It might be argued that the low reliability on the ”un-derstanding” scale is linked to poor reliability of stu-dent perceptions of their own learning gains, and un-derstanding of the pedagogy used in the instructionaldesign in the courses and programmes under evalua-tion.
CRPIT Volume 103 - Computing Education 2010
10

Board of Studies
Course
Teacher
Students
Course Description
StudentEval
Direct input
ProgrammeDirector
Degree AdvisoryBoard
Figure 1: Quality Assurance Process
Finally, as Soutar observes, success in quality as-surance ultimately depends on the credibility of theQA system.
“... quality assurance programmes are essen-tially doomed if the service delivery peoplelack a belief in quality and are not imbuedwith a philosophy of quality.”
In our case this implies that course and degree pro-gramme quality assurance processes must have cred-ibility in the eyes of academics in order to be trulysuccessful.
3 Development
The final view of educational activity we consider inthis paper is of education as development. Here thefocus is on the student, and helping the student togrow, realise their potential and contribute in a widersocial context. This view can be related to the per-ceptions of university computing educators in regardto teaching and learning. These perceptions havealso been characterised by a number of research stud-ies (Berglund et al. 2009, Lister et al. 2007, Sheard &Carbone 2007).
Much of the literature in developing more student-centric approaches to learning and assessment in com-puting imply a developmental view of the educationpractice at universities. However, several studies ob-serve that there are indications that academics donot embrace new teaching methods with enthusiasm.Sheard attributes this to an inherent conservatism inthe computing academic community (Sheard & Car-bone 2007, pp. 2).
The higher education sector is still bound bytraditional values and expectations. As En-twistle, Skinner, Entwistle and Orr (2000)argue, the pedagogies that academics adoptare strongly influenced by their own experi-ences as students.
Pears et al. (Berglund et al. 2009, Pears et al. 2007)argue that teacher beliefs about the nature of studentsuccess and difficulty in CS might limit their range ofpedagogical responses.
University lecturers are recognised, often interna-tionally renowned, experts in their discipline areas.
The technical content of the courses they teach areoften closely aligned with their research. While teach-ing excellence has become increasingly important overthe last few decades, the impact of this on academicclassroom practice is limited and many courses arestill taught in a traditional manner.
The Bologna process in the EHEA has providedparticipating computing departments with a motiva-tion to revisit the scholarly foundations of degrees andthe instructional design of courses. These aspects ofcourses are often not documented, even in the CDIOand ABET approaches, since these frameworks focuson content and delivery methods, not on underlyingphilosophy and teaching and learning theory. Viewingthe role of education as helping individual studentsto develop their potential focuses on the student, andsimultaneously recognises the role of academic men-torship in guiding and developing potential in collab-oration with the student.
We argue that this increases the need for greateracademic involvement. High levels of integrity, col-legiality and empowerment among computing aca-demics needs to fostered and appreciated to a greaterextent. An aspect of academic teaching which is cru-cial to success is to recognise that teaching methodsin computing are highly individual, and related tocourse level and teaching philosophy and style. Micro-management of the fragile educational ecology can bedetrimental to the quality of the education studentsreceive.
4 Discussion
The previous sections have provided an overview of arange of aspects related to the quality of tertiary edu-cation in computing. Figure 1 presents a conceptual-isation of the quality assurance roles and informationflows for degree programmes at the author’s univer-sity, focusing on individual course quality assessment.
Internal quality evaluation, however, relies in as-sessments made by degree program coordinators. Theadvisory boards rely heavily on student input col-lected using online surveys and student representa-tives from degrees and courses. Student course eval-uation questionnaires are collected for Most courses,but the response rates on surveys are typically low,There are several risks associated with using the datacollected in such surveys as a direct measure of course
Proc. 12th Australasian Computing Education Conference (ACE 2010), Brisbane, Australia
11

Industrial effectiveness of graduates
Quality of graduates
Reputation of University/Programme
Market shareQuality/motivation
of entering students
Teaching quality
Staff capability Equipment and support services
Financial power
Quality of research
Funding for under/graduate education
Grants and other external research funding
Figure 2: An Holistic View of Educational Quality
quality. Low response rates make the statistical valueof the data low. The surveys themselves are oftenuntested in terms of reliability and validity. Thereare few surveys, of which the author is aware, thathave been constructed to reveal underlying percep-tion of service constructs, such as those proposed inSERVPERF and other similar instruments. If we areto place reliance on student survey data in quality as-surance activity more attention needs to be paid toissues of what we wish to measure, and the validityand reliability of the surveys that we employ to collectQA data.
Even when reliable QA instruments are developed,it seems likely that more than one instrument will beneeded. One key question that emerges is, who is thecustomer or consumer of a computing education? Ifthe sole consumer were the student, then perhaps stu-dent perceptions are the appropriate way to evaluatequality. However, there are a number of other poten-tial customers, employers and society seem plausiblecandidates.
However, it seems intuitive that educational qual-ity depends on more than student perceptions. Whilecustomers may know what they want, likening stu-dents to other consumer segments is not necessarilyappropriate. Learning theories dealing with conceptand knowledge acquisition (Entwistle 2007, Meyer &R.Land 2005, Ozdemir & Clark 2007) describe aspectsof the process of acquiring new knowledge and compe-tencies as placing learners under stress. This type ofuncomfortable experience, though ultimately reward-ing, may not be viewed with unequivocal approbationby the student engaging in the process.
Trust in academic systems can also be argued tobe a vital component of creating a successful learningexperience. It is not clear that learners are always
adept at assessing the relevance and scope of theirown learning gains while undertaking a course, or di-rectly after its completion. These are the points atwhich we traditionally survey student opinions. Addi-tionally, innovative teaching and learning approachesmay be in conflict with student’s conceptions of what”good teaching” is, and this can have serious effectson how students evaluate non-traditional educationalapproaches.
Employers can also be considered the customerwith respect to University product. In this role, theyalso have a part to play in evaluating the quality ofthe outcomes of the production process. What met-rics are appropriate in this domain? Graduate em-ployability? Employer satisfaction?
Society also has expectations of the outcome of ed-ucation. This is particularly apparent in disciplinessuch as computing and branches of engineering, wherefailure to perform a task competently and ethically innewly appointed University graduates might be at-tributed to poor educational quality. The ultimateimplications of poor quality in this definition are sys-tems that fail with consequent financial implicationsand perhaps loss of life.
Finally academics themselves have a significantstake in the quality of the knowledge and competen-cies instilled in students during their studies at Uni-versity.
Figure 2 gives an holistic model of factors relatedto educational quality adapted and extended fromOwlia and Aspinwall (Owlia & Aspinwall 1997). Aquality framework incorporating many of these as-pects has also been proposed by Owlia and Aspin-wall (Owlia & Aspinwall 1996). The integration ofthese factors into a multi-faceted QA survey instru-ment, or several QA instruments targeting differentstake-holder segments, would help to improve the in-
CRPIT Volume 103 - Computing Education 2010
12

ternal credibility of QA activities.
5 Conclusions
This paper discusses three perspectives on quality ofcomputing education. Treating education as a pro-duction process, with standards and process descrip-tions designed to produce certain guaranteed out-comes has been discussed in the light of accreditationefforts, and standardisation of education in the US,Europe and Australasia. While there are advantagesto this type of approach in terms of making explicitthe aims and processes involved in educating gradu-ates, there is also a risk that such approaches becomeoverly prescriptive. An overly prescriptive approachcan result in QA processes that attempt to deny thevariability of experience, learning styles, and learn-ing goals and educational approaches, intrinsic to thecomplex socio-cultural system embodied in an seat ofhigher learning.
Treating education as a service, and identifyingthe student as a customer, or primary consumer, ofan educational service we argue can also be highlydetrimental to educational quality. We challenge theassumption that the view of the student as customeris appropriate in modelling higher education service.Alternative definitions of the customer as either so-ciety, or employer groups produces a very differentview of what appropriate quality metrics might be,and how they should be assessed. We also argue thatthe role of academics as experts and valuable inter-nal stake-holders in the delivery of quality educationdeserves greater recognition. Academic teachers em-body expertise in the academic disciplines at the coreof University education, their role and opinions inachieving quality education deserve greater weight.
Finally an assessment of the current practices andinstruments used in typical QA processes at univer-sities show a number of shortcomings. Survey instru-ment validation and reliability is questionable, andthis places the value of the entire exercise in doubt.Academic stake-holders increasingly perceive theseinstruments as a threat, and fall back on traditionalteaching models as more easily defensible in the pre-vailing QA climate. We identify aspects of a moreholistic model of educational quality for universities,and urge computing departments to draw on the es-tablished literature to construct reliable and valid stu-dent QA survey instruments, while at the same timebroadening the the scope of QA activities to embraceall of the themes mentioned in this paper.
References
Abdullah, F. (2006), ‘Measuring service quality inhigher education: Hedperf versus servperf’, Mar-keting Intelligence & Planning 24(1), 31–47.
Beggeren, K.-F., Brodeur, D., Crawley, E., Ingemars-son, I., Litant, W., Malmqvist, J. & Ustlund,S. (2003), ‘CDIO: An international initiative forreforming engineering education’, World Trans-actions on Engineering and Technical Education2(1).
Berglund, A., Eckerdal, A., Pears, A., East, P., Kin-nunen, P., Malmi, L., McCartney, R., Mostrom,J.-E., Murphy, L., Ratcliffe, M., Schulte, C.,Simon, B., Stamouli, I. & Thomas, L. (2009),Learning computer science: Perceptions, actionsand roles, in C. Baillie & J. Bernhardt, eds, ‘Eu-ropean Journal of Engineering Education’, Vol.To Appear, Taylor and Francis.
Brodeur, D. R. & Crawley, E. F. (2009), ‘Cdioand quality assurance: Using the standards forcontinuous program improvement’, EngineeringEducation Quality Assurance pp. 211–222.URL: http://dx.doi.org/10.1007/978-1-4419-0555-0 17
Buzzell, R. & Gale, B. (1987), The PIMS Principles:Linking Strategy to Performance, The Free Press,New York.
Entwistle, N. (2007), Conceptions of Learning andthe Experience of Understanding: Thresholds,Contextual Influences, and Knowledge Objects,in S. Vosniadou, A. Baltas & X. Vamvakoussi,eds, ‘Re-framing the conceptual change ap-proach in learning and instruction’, Elsevier,Amsterdam, The Netherlands, chapter 11.URL: http://books.google.com/books?hl=sv&lr=&id=qfDhF23azp8C&oi=fnd&pg=PA123&dq=entwistle+2007+conceptual+change&ots=fWeQNn bOM% &sig=IPfC0C7Z0l889-k-U9QuuSw5sOk
Gunnarsson, S., Wiklund, I., Svensson, T., Kind-gren, A. & Granath, S. (2007), Large scale useof the cdio syllabus in formulation of programand course goals, in ‘Proceedings of the 3rd In-ternational CDIO Conference’, MIT, Cambridge,Massachusetts.
Hattie, J. (1990), ‘Performance indicators ineducation’, Australian Journal of Education34(3), 249–76.
HITTMAN, J. (1993), ‘TQM AND CQI INPOSTSECONDARY EDUCATION’, QUALITYPROGRESS 26(10), 77–80.
Lister, R., Berglund, A., Box, I., Cope, C., Pears, A.,Avram, C., Bower, M., Carbone, A., Davey, B.,de Raadt, M., Doyle, B., Fitzgerald, S., Mannila,L., Kutay, C., Peltomaki, M., Sheard, J., Simon,Sutton, K., Traynor, D., Tutty, J. & Venables, A.(2007), Differing ways that computing academicsunderstand teaching, in Simon, ed., ‘ACE ’07:Proceedings of the ninth Australasian conferenceon Computing education’, Australian ComputerSociety, Inc., Darlinghurst, Australia, Australia,pp. 97–106.
Malmqvist, J. & Sadurskis, A. (2009), ‘Qualityassurance of engineering education in swe-den’, Engineering Education Quality Assurancepp. 133–143.URL: http://dx.doi.org/10.1007/978-1-4419-0555-0 10
Meyer, J. & R.Land (2005), ‘Threshold conceptsand troublesome knowledge (2): Epistemologi-cal considerations and a conceptual frameworkfor teaching and learning’, Higher Education49(3), 373–388.
Owlia, M. S. & Aspinwall, E. M. (1996), ‘A frameworkfor the dimensions of quality in higher educa-tion’, Quality Assurance in Education 4(2), 12–20.
Owlia, M. S. & Aspinwall, E. M. (1997), ‘Tqmin higher education – a review’, InternationalJournal of Quality and Reliability Management14(5), 527–543.
Ozdemir, G. & Clark, D. (2007), ‘An overview of con-ceptual change an overview of conceptual changetheories’.
Proc. 12th Australasian Computing Education Conference (ACE 2010), Brisbane, Australia
13

Pears, A., Berglund, A., Eckerdal, A., East, P., Kin-nunen, P., Malmi, L., McCartney, R., Mostrom,J. E., Murphy, L., Ratcliffe, M. B., Schulte, C.,Simon, B., Stamouli, I. & Thomas, L. (2007),What’s the problem? : Teachers’ experience ofstudent learning successes and failures, in ‘Proc.7th Baltic Sea Conference on Computing Educa-tion Research : Koli Calling’, number 88 in ‘CR-PIT’, Australian Computer Society, pp. 207–211.
Sheard, J. & Carbone, A. (2007), Ict teaching andlearning in a new educational paradigm: lec-turers’ perceptions versus students’ experiences,in R. Lister & Simon, eds, ‘Seventh Baltic SeaConference on Computing Education Research(Koli Calling 2007)’, Vol. 88 of CRPIT, ACS,Koli National Park, Finland, pp. 109–117.URL: http://crpit.com/confpapers/CRPITV88Sheard.pdf
Soutar, G. & McNeil, M. (1996), ‘Measuring servicequality in a tertiary institution’, Journal of Ed-ucational Administration 34(1), 72–82.
CRPIT Volume 103 - Computing Education 2010
14

Computer Science in New Zealand High Schools
Tim Bell Department of Computer Science and Software Engineering
University of Canterbury Christchurch, New Zealand [email protected]
Peter Andreae School of Engineering and Computer Science
Victoria University of Wellington New Zealand
Lynn Lambert Physics, Computer Science and Engineering Department
Christopher Newport University Newport News, Virginia, USA
Abstract The New Zealand Ministry of Education has recently released a new “Digital Technologies” proposal for delivering computing topics in the final three years of High Schools. The proposal aims to address a number of issues by offering topics that will be academically challenging for students, and provide them with a broader view of the kinds of advanced topics they might study beyond High School. The proposed structure includes having Digital Technologies as a separate area in the technology curriculum, and includes a strand called “Computer Science and Programming” that has sufficient coverage to communicate to students what the subject area is really about. This paper reviews the circumstances that led to this proposal, describes the international context (especially in the US) for High School computing curricula, and examines the published proposal in some detail. It also considers the issues that are likely to come up in the implementation of the proposal, and how they might be addressed. Keywords: Computer Science curriculum. Copyright © 2010, Australian Computer Society, Inc. This paper appeared at the Twelfth Australasian Computing Education Conference (ACE2010), Brisbane, Australia, January 2010. Conferences in Research and Practice in Information Technology, Vol. 103. Tony Clear and John Hamer, Eds. Reproduction for academic, not-for-profit purposes permitted provided this text is included.
1 Introduction A secondary school Computer Science curriculum can have a significant influence on student career paths, both for laying the groundwork for further study, but more importantly, for exposing students to the topic. The latter is particularly valuable because the discipline of Computer Science is not well understood by High School students, who often make career choices based on an inaccurate perception and bad experiences unrelated to the topic itself (Margolis and Fisher 2002).
In recent times, New Zealand schools have rarely taught Computer Science – at best there have been courses on programming at some schools, but often computing education has been focused on general purpose applications and skills. Even worse, sometimes courses that teach “computing as a tool” have given students the impression that CS must be an extension of these topics. Of course, it is important for students to be able to use computers effectively, but often this has been a distraction from getting students involved in “computing as a discipline”.
For a period (1974-1985) computing was taught as a discipline in NZ schools through “Applied Maths”. However, there have been several changes since then, and recently assessment for computing courses that go
Proc. 12th Australasian Computing Education Conference (ACE 2010), Brisbane, Australia
15

beyond just using applications have typically been via “unit standards”, which are pass/fail skills-based standards that are not attractive to top students who would like to get high grades to reflect their academic achievements.
In addition to these issues, NZ had adopted a technology curriculum that provided generic assessment tools for teaching areas ranging from food technology to digital technology, which meant that computing wasn’t a subject area of its own, and the same kind of assessment criteria would be used for a large range of technologies (such as meal planning and software development). Because computing was combined with other technologies, it was less accessible as a discipline in its own right, and less attractive to students who were specifically interested in the discipline of computing.
Some progress had been made towards a broader and deeper approach to the curriculum, such as the “Fluency in IT” project (Clear and Bidois 2005), but mapping such proposals onto the new national technology curriculum was proving to be problematic.
In 2008, two reports were released that very clearly pointed out the weaknesses of the current offerings in schools, and called for action from the government agencies that set the standards used to determine the courses delivered by schools (Grimsey and Phillipps 2008; Carrell, Gough-Jones, and Fahy 2008).
This resulted in the Ministry of Education calling together a “Digital Technologies Experts Panel” (DTEP) representing industry, tertiary and High Schools, to develop a plan to address the issues raised in these two reports. The panel first met in November 2008, and by mid 2009 it had produced a body of knowledge and recommendations for a way forward.
The DTEP recommendations were released in May 2009, along with an agreement negotiated with the Ministry of Education for moving forward1. The agreement included: • A specific area called “Digital
Technologies” within the technology learning area.
1 The full version is available from
http://www.techlink.org.nz/curriculum-support/tks/
• An aggressive timeline for implementation, with guidelines to be made available to schools in 2010, so that courses in this area could be run from 2011.
• A body of knowledge in five strands of Digital Technologies (see below).
The DTEP report also mentions the following, which seem likely to be achieved by the changes planned: • Better alignment of school material to
tertiary and industry expectations of areas such as Computer Science.
• Assessment standards that are academically challenging, and help students to meet entrance standards for tertiary study.
• Use of ICT-related terminology in schools that reflects the usage in industry and tertiary organisations.
• Urgent professional development for teachers.
Considerable work had already been done in previous years on “Digital Technology Guidelines” (DTG)2, and the DTEP recommendations included adapting these guidelines to match the recommended body of knowledge, rather than starting from scratch. This meant that the new material could be delivered taking advantage of the existing momentum achieved by the DTG.
The new proposal (called “Technological Context Knowledge and Skills”) was posted publicly for comment in August 20093. At the time of writing, the plan is being updated to take account of feedback, and the version reported on here is the August 2009 version. The public discussions of the proposal indicate that it is being well received by industry, tertiary institutions, and schools, which bodes well for its implementation.
If the new proposal is successful, it should inspire and prepare students to contribute to the growth of New Zealand’s economy through innovative work based on good foundations in subject knowledge, and give students an understanding of the different areas in ICT so that students can make sensible choices. It should also address the issue of computing not being regarded as having a high academic status 2 http://dtg.tki.org.nz/ 3 http://www.techlink.org.nz/curriculum-support/tks/
CRPIT Volume 103 - Computing Education 2010
16

in schools, and so should attract more high academic achievers into the field.
Section 2 reviews some of the international work on the development of CS curricula that constitutes a context for the new NZ guidelines; section 3 describes the proposed NZ learning area for Digital Technologies in general, and section 4 focuses on the proposed Computer Science topics within Digital Technologies. The issues surrounding implementation of the new guidelines are discussed in section 5, and we draw conclusions in section 6.
2 CS in school curricula Computing in school curricula is often diluted because it has to cover three quite different directions: (1) using computers as a tool for teaching (e.g. e-learning), (2) using computers as a tool for general purpose applications (sometimes called ICT), and (3) computing as a discipline in its own right (including programming and CS). Sometimes administrators and leaders confuse these roles, and this can make it difficult for Computer Science to be visible as a discipline in its own right.
Although computing as a tool is commonly taught around the world, relatively few countries have a significant CS curriculum, and even fewer make such a curriculum mandatory for schools (Ragonis 2007).
In the United States, there is no federal organization that guides the curriculum of Computer Science. The main federal law regarding education in the United States is the “No Child Left Behind” act. This law states that all teachers must be highly qualified except teachers in non-core areas (Wilson and Harsha 2009). The non-core areas are: Physical Education, Computer Science, and vocational education. There are several implications of this: first, Computer Science is not considered a core area, so schools tend to emphasize it less than core areas (the states receive funding based on how well they are doing in core areas). Second, it is up to the 50 states to implement Computer Science programmes. Thus, there is no single technology or Computer Science program in the United States, but many.
Although there are no federal guidelines and differing state requirements, several different organizations have developed technology or
computer guidelines for the United States. The Computer Science Teachers Association (CSTA) standards differentiate technology and using computers in the support of education in general from the field of Computer Science in its model K-12 Computer Science curriculum (Tucker et al. 2006). The International Society for Technology in Education (ISTE) has developed technology standards called NETS, National Education Technology Standards4. The National Association for Educational Progress (NAEP) is developing technology literacy guidelines5 that will become part of the nation’s report card in 2012, although these are not specifically computing technology. With no federally enforced standard, the de facto standard for High School curricula are Advanced Placement exams – of 23,000 high schools nationally, 17,000 offer some AP courses. AP Computer Science, which has the same curriculum and test across the country, is almost exclusively programming (currently in Java). A group of prominent Computer Science educators is attempting to redesign the AP curriculum to create a course that is less centred on programming (Cuny 2009).
Many of the difficulties implementing effective computing curricula are common to a number of countries, and the NZ experience has reflected the experience of others, including the rapid decline in tertiary CS enrolments after the year 2000 (Vegso 2008). The recent developments in NZ appear to have addressed many of the issues raised, and no doubt there will be lessons to learn and new material developed as the new proposal is implemented in schools.
3 New Digital Technology Guidelines
The proposed guidelines for Digital Technology in NZ schools are given in a “Technological Context Knowledge and Skills” (TCKS) document released by the NZ Ministry of
4http://www.iste.org/AM/Template.cfm?Section=NETS 5 A draft is available at http://www.edweek.org/media/nagb_assessment_devel_comm_aug_7-09.pdf
Proc. 12th Australasian Computing Education Conference (ACE 2010), Brisbane, Australia
17

Education (Dinning 2009). The guidelines have five “contexts” for Digital Technologies: • Digital Information (digital tools and
systems for managing information), • Digital Infrastructure (hardware and
networks, including installing software), • Digital media (video, audio, layout/design,
web, graphics, animation, games, web), • Electronics (electronic and embedded
systems), and • Programming and Computer Science
(concepts from CS and Software Engineering, designing and implementing programs).
These five areas address a range of interests and career paths that students might take, and are aimed at the final three years of high school.
Each area contains a set of objectives specifying the different aspects of knowledge and skill in the area. Each objective is broken down into three levels (6, 7 and 8) of the NZ curriculum, which would correspond to the last three years of High School for most students (years 11 to 13) with a list of “indicators” that give more details of the objective for each level.
In addition to these subject-specific guidelines there are supplementary “generic” achievement standards on “Technological practice”, “Nature of technology” and “Technological knowledge”, which would be available to assess topics such as the history of computing, the effect of digital technology on society, or project management.
If the proposed guidelines are accepted, then the ministry will develop a set of achievement standards addressing the knowledge and skills described by the indicators in the document, and guidelines for teachers. The way the curriculum works in NZ, schools will then be free to make up courses that are built around their own selection of achievement standards, based on local interests and strengths. A likely outcome in many schools is that a year 11 student may study an introduction to several of the five areas in a single course, whereas at year 13 schools might offer a whole course based on just one or two of them.
Some of the “contexts” (especially Digital Information and Digital Media) will be more concerned with the computer as a tool, but the others are more concerned with the computer itself. In the following section we will look in
detail at the “Programming and Computer Science” context.
4 CS in the new guidelines What had previously been just “programming” in the existing Digital Technology Guidelines now appears as “Programming and Computer Science”, reflecting a concern for giving students a broader basis for making an informed decision about possible paths in the tertiary sector. The first of the three objectives in the published proposal addresses this broadening:
“ Demonstrate an understanding of concepts across Computer Science and Software Engineering.”
The indicators for the above objective introduce the fundamental concepts of algorithms and programming languages at level 6. At level 7, these are expanded to include four further important concepts: • The ideas of complexity/tractability/
computability – that some problems are inherently difficult or impossible to solve on a computer.
• Coding (e.g., compression, error correction, encryption), and how it has enabled new technologies.
• That programming languages are specified precisely.
• The need for Software Engineering methodologies, and an appreciation of the steps in the Software Development Life cycle.
The indicator at Level 8 is broader, and allows a selection of topics from across Computer Science and Software Engineering.
The wording of (and the examples in) the indicators make it clear that the goal is an appreciation of what Computer Science and Software Engineering are about, and not an in-depth understanding of the content of the topics. For example, the concepts of complexity/tractability/computability at level 7 are intended only to have the students understand that some problems are very difficult to solve, no matter how clever the algorithm, and that some problems are impossible. It would not be appropriate at this level for the students to have to determine the complexity class of a problem or construct a proof of intractability, but they might appreciate
CRPIT Volume 103 - Computing Education 2010
18

that binary search is significantly better than linear search, even if only for searching a telephone book. Students who gain an appreciation of these concepts will know that Computer Science is more than just programming and will be much better placed to start a tertiary qualification in Computer Science – or to decide that Computer Science is not what they want to study!
The other two objectives for the Programming and CS context address two complementary aspects of programming. One addresses the design of programs:
“ Be able to understand, select and design data types, data structures, algorithms, and program structures for a program to meet specified requirements, and evaluate user interfaces.”
The other addresses the processes for actually constructing programs:
“ Be able to read, understand, write, and debug software programs using an appropriate programming language, tools, and software development process.”
Although these two aspects would almost certainly be intertwined in teaching practice, distinguishing designing from constructing emphasises that programming involves understanding and design at a more abstract level, as well as knowing the technical details of a programming language and being able to read and write programs in that language. There is also a practical advantage in distinguishing them, at least for assessment, in that weaker students who cannot cope with the design aspects may still be able to pass achievement standards addressing the practical skills of reading, understanding, writing and debugging programs if they are given sufficient guidance and support on the design aspect.
The design objective also includes a component on evaluating user interfaces. Although actually designing a good user interface is a more advanced topic than is appropriate at school level, it is quite feasible for students to analyse existing interfaces from a design perspective. Because most students will already have used a wide variety of interactive programs in a range of contexts, including multiple programs for the same task (e.g., mobile phones, browsers, mail clients,
picture viewers, DVD players), there will be plenty of options for getting students to compare, evaluate, and suggest improvements to existing user interfaces. At level 6, such evaluation would be strictly informal; at level 7, it would be based on lists of useability heuristics, and level 8 would use a wider range of Human-Computer Interaction (HCI) principles. Having students look at this aspect of computing means that they can broaden their view to appreciate the broader skills and knowledge (such as psychology for HCI or linear algebra for graphics) that are valuable for constructing successful digital systems.
Both programming objectives have a sequence of indicators at the three levels that build up from having students develop very simple programs. At level 6, the indicators require only programs that use variables, expressions, selection, and loops, and the primitive data types available in the chosen language. This is sufficiently simple that popular introductory languages (such as Scratch or Alice) could be used to assess them if delivered appropriately. Level 7 extends the indicators to include methods (or procedures/ functions/subroutines) and compound data structures (e.g., arrays, or lists); level 8 adds the use of data from files and procedures with parameters and return values. The higher levels are likely to require a conventional general purpose language to cover the concepts listed (e.g. Java, Python, or Visual Basic).
Level 8 also adds a greater understanding of data types, with an appreciation of the properties and limitations of different data types. This might include an understanding of different ways of representing numeric data (binary, hexadecimal, fixed point, floating point, etc.) but it could equally be addressed in the context of representing textual data or image data. For many students, understanding different ways of representing pixel colour values for images may provide better motivation than traditional scientific calculation.
The proposal makes no mention of topics such as classes, packages, inheritance, or exceptions, and does not require programs to have graphical user interfaces. Of course, with some languages or program development tools,
Proc. 12th Australasian Computing Education Conference (ACE 2010), Brisbane, Australia
19

students may be exposed to programs using such concepts, but they are not required.
No particular programming language is specified, and teachers could use any appropriate language they wish as long as it has sufficient constructs to cover the structures required. At level 6, a very wide range of languages would be possible, including domain or application specific languages, as long as they supported programming with variables, expressions, selection, and loops. At level 7, the selected language would need to support procedural abstraction. At level 8, a general purpose programming language is required, along with an appropriate software development environment.
The indicators also require some documentation in the students’ programs, but this is at the level of choosing good names, suitable layout, and using some appropriate comments. For the small programs that the students would be able to construct, elaborate documentation is not only unnecessary, but is generally unmotivating. Level 7 also introduces testing.
At Level 8, the indicator for the program construction objective requires some level of discipline in the programming process, with some problem analysis for simple requirements, and the use of a simple software development process. In general, this would be a simplified version of an agile process, emphasising repeated cycles with increasing requirements and careful testing against the requirements at each stage. The goal is not to gain a mastery of software engineering practice, but to become aware of the need for discipline in the programming process, and to appreciate the role of aspects such as requirement specification, testing, and debugging, in addition to the actual writing of program code.
5 Implementation The proposed changes have a number of implementation challenges and implications for teacher training and student career paths.
Because the proposal introduces some topics not previously taught in schools, most teachers will require professional development to be able to teach them. For many, this may mean learning to program, and even for some of those who are comfortable teaching programming, it
will require gaining some familiarity with the overview of Computer Science topics. Fortunately the new standards will be introduced over a period of four years, which gives teachers some time to get up to speed. During this time, there will need to be extensive communication with teachers so that they can keep in touch with developments, be aware of strong support for the transition, and feel engaged in the process. New material will be needed for teaching topics that haven’t existed before in schools. The Computer Science academic community in NZ is offering extensive support to develop material and help with professional development. This material will be published online, so it can be used by the international community.
If the new guidelines bring about the hoped-for growth in the discipline, more teachers will need to be found to deliver the resulting classes. This in turn will require more training opportunities, particularly in the Colleges of Education where teachers receive their key qualifications. For new teachers, College of Education courses will need to expand to cover the new topics proposed. Some teachers who are already in service, but are not currently involved in computing, might elect to retrain in these areas, in which case distance-learning or flexible courses may be more accessible. Finally, students and graduates with a background in Computer Science might be recruited to become teachers and bring their expertise to the classroom, given appropriate training to qualify them for the role.
There will be implications for tertiary institutions because the students leaving school may now have more advanced knowledge and experience in the discipline. While some schools may not offer the full range of standards proposed, others could potentially have students graduating who are competent programmers in a language such as Java or Python, and who have a reasonable understanding of algorithm analysis, including simple searching and sorting algorithms. For some tertiary institutions, this may represent a similar standard to their first-year Computer Science courses, and they may need to consider alternative paths for such students. In either case, students who have done well in these areas can be identified and
CRPIT Volume 103 - Computing Education 2010
20

potentially offered scholarships or more challenging courses.
In addition, students will need guidance on what other subjects to take at school. For example, Computer Science departments would typically be looking for students with strong mathematics and communication skills, and structures may need to be put in place to ensure that students are aware of the importance of these complementary subjects for success in their chosen career path. This will include communicating the new pathways to career counsellors and advisors.
6 Conclusions New Zealand is on the verge of delivering an exciting programme for computing as a discipline in High Schools. The current design reflects enough technical material that students can get some insight into the career paths available to them, and also provide academic challenges to make the courses attractive to top students.
Implementing such changes requires a lot of careful design and testing, particularly for topics that have never been taught before. Teachers will need considerable help to become comfortable with new topics, and given the fast time scale, support from the tertiary community will be essential.
It is important that the change is not seen as a bigger list of things to learn in less time. The new topics are generally at the level of exposing students to them so they have an appreciation of their significance. More important than the details of what is taught is that students know what career paths are available, and are able to get a sufficiently accurate taste of the discipline to find out if it suits them or not, rather than making up their mind based on incorrect information and mislabelled topics.
Once the context and skills outlined above have been finalised, they will guide the creation of guidelines for teachers, and standards for assessment. This process will need to be complete enough by early 2010 that schools can plan and publish their Year 11 (level 6) programmes for students making decisions about their 2011 courses. Despite this rapid pace, the pipeline is three years long, and the first students to leave school having completed the new programmes will not be entering the
tertiary institutions (or the workforce) until 2014, so it will be some time before the effects of the changes are fully realised.
7 Acknowledgement We are grateful to an anonymous referee for detailed feedback and suggestions.
8 References Carrell, T., Gough-Jones, V. and Fahy, K.
(2008): The future of Computer Science and Digital Technologies in New Zealand secondary schools: Issues of 21st teaching and learning, senior courses and suitable assessments. http://dtg.tki.org.nz/content/download/670/3222/file/Digital%20Technologies%20discussion%20paper.pdf. Accessed 16 Sep 2009.
Clear, T. and Bidois, G. (2005): Fluency in Information Technology – FITNZ: An ICT Curriculum Meta-Framework for New Zealand High Schools. Bulletin of Applied Computing and Information Technology Vol. 3, Issue 3. ISSN 1176-4120. http://www.naccq.ac.nz/ bacit/0303/2005Clear_FITNZ.htm. Accessed 16 Sep 2009.
Cuny, J. (2009): A clean-slate approach to High School CS. http://www.cra.org/Activities/ summit/Cuny_A_Clean_Slate_Approach_to_High_School_CS.pdf. Accessed 16 Sep 2009.
Dinning, N. (2009): Technological Context Knowledge and skills: Exploring specific knowledge and skills to support programmes in technology. Materials for consultation to support Ministry decision making. http://www.techlink.org.nz/curriculum-support/tks/resources/Technological-Context-Knowledge-and-Skills-07-2009.pdf. Accessed 15 Sep 2009.
Grimsey, G., and Phillipps, M. (2008): Evaluation of Technology Achievement Standards for use in New Zealand Secondary School Computing Education: A critical report. NZ Computer Society. Available from http://www.nzcs.org.nz/news/uploads/PDFs/200805NCEAReport.pdf. Accessed 16 Sep 2009.
Margolis, J. and Fisher, A. (2002): Unlocking the clubhouse: Women in computing , The MIT Press, Boston, MA.
Ragonis, N. (2007): Computing Pre-University: Secondary Level Computing Curricula. In Encyclopedia of Computer
Proc. 12th Australasian Computing Education Conference (ACE 2010), Brisbane, Australia
21

Science, 4th Edition, Ralston, A., Reilly E. D., and Hemmendinger, D. (Eds.)
Tucker, A. (editor), Deek, F., Jones, J., McCowan, D., Stephenson, C., and Verno, A. (2006): A Model Curriculum for K-12 Computer Science: Final Report of the ACM K-12 Task Force Curriculum Committee. Association for Computing Machinery (ACM), New York, New York, (Second Ed.)
Vegso, J. (2008): Enrollments and Degree Production at US CS Departments Drop Further in 2006/2007, CRA bulletin, 1 March 2008. http://www.cra.org/wp/index.php?p=139. Accessed 16 Sep 2009.
Wilson, C. and Harsha, P. (2009): IT policy The long road to Computer Science education reform. Commun. ACM 52, 9 (Sep. 2009), 33-35.
CRPIT Volume 103 - Computing Education 2010
22

Panel
Proc. 12th Australasian Computing Education Conference (ACE 2010), Brisbane, Australia
23

CRPIT Volume 103 - Computing Education 2010
24

Internationalisation and Cross Cultural Issues in Computing Education
Kathryn Egea School of
Information Technology and
Electrical Engineering
The University of Queensland,
Australia
Jie Lu
Faculty of Engineering &
Information Technology, University of
Technology Sydney, Australia
Jitian Xiao
School of Computer and Security Science,
Edith Cowan University, Australia
Tony Clear
School of Computing & Mathematical
Sciences, AUT University,
Auckland, New Zealand
Introduction by Kathryn Egea as panel chair
Prosser and Trigwell (1998) contend that ‘teaching with an awareness of cultural diversity is simply good teaching’ (p. 170). Biggs (2003) extends this argument indicating this awareness of culturally diverse classrooms in Australia affords better teaching for all students, particularly when academics focus on ‘teaching as education’ rather than ‘teaching as assimilating’ or ‘teach as accommodating’ students from other countries. Strategies that help all students learn support our abilities to be better teachers for international students. Using a student-centred approach to teaching, programs can be designed to support the student to be responsible for their own learning in the new culture, and help them make connections for meaningful learning and thereby achieving the learning objectives of their course. Understanding the needs of learners underpins this focus.
It is with these concepts, that the four papers placed into this panel on internationalisation and cross-cultural issues in computing education are presented. Egea et al. demonstrates a training plan which guides students to reflect on their own ways of learning in team work. Students work individually and in teams (cross-cultural and cross-discipline) to create a web page project as a first year first semester class. The study compares cross-cultural with single culture students for difference of working patterns – there are very few, but cross-cultural teams tend to value relationships and cultural dimensions more strongly than single culture teams.
Awareness of learning needs of the newly arrived Asian student have been identified in the papers 2 (Lu et al) and paper 3 (Xiao et al) where both authors have worked on a large ALTC grant titled ‘Strategies and approaches to teaching and learning cross cultures’.
Copyright © 2010, Australian Computer Society, Inc. This paper appeared at the Twelfth Australasian Computing Education Conference (ACE2010), Brisbane, Australia, January 2010. Conferences in Research and Practice in Information Technology, Vol. 103. Tony Clear and John Hamer, Eds. Reproduction for academic, not-for-profit purposes permitted provided this text is included.
Lu et al report on the current situation of cross-cultural teaching and learning of Asian students in the IT field of Australian universities through a survey in five universities. The large survey across five universities found Asian students learn from textbooks, lectures, learn by rote and memorisation and want group work to be structured by the academic into cross-culture groups. Xiao et al expands this focus from tools for learning to methods of learning particularly for first year students in the discipline of Information Technology. Students from Asian cultures were found to have low levels of confidence in their ability to speak and understand the English language, thereby finding lectures difficult to understand; and have limited confidence to ask questions in class, to participate in class discussions and in their ability to take notes. Presentations require lots of practice and need assistance as does homework tasks.
The final paper (Malhotra and Clear) poses some critical questions about the goals, impacts and sustainability of internationalisation within our universities. Rather than viewing the positive benefit that students have working in an internationalised and global university environment, they argue that increasing student enrolment places pressure on public funding, demanding high productivity with reduced support. Universities have become entrepreneurial. Computing programs are especially popular with the Asian and South Asian student cohort, resulting in an increasingly diverse student body without appropriate teaching and learning support. The key challenge is sustainability, equitable treatment of all students and course integrity. Patterns of relaxed pre-requisites and managerial mandated pass rates are seen to ‘dumb down’ some courses. This in turn affects the health of the Australasian IT industry and its quality of the future, particular in ICT. The search for and evaluation of responsible and sustainable models of internationalisation may be the new frontier in Computing Education Research.
Keywords: computer education, globalisation, cross-cultural and cross-discipline teams, internationalisation
Proc. 12th Australasian Computing Education Conference (ACE 2010), Brisbane, Australia
25

Paper 1: Influences affecting cross-cultural and cross-discipline teams for a first-year course in
web design
Kathryn Egea1, Soon-Kyeong Kim1, Trish Andrews2, and Karin Behrens3
1School of Information Technology and Electrical Engineering, 2TEDI, 3Institute of Social Science
Research, The University of Queensland, Australia
Cross-cultural and cross-discipline teams are commonplace in ICT global work projects, an area where students in an IT program may head. This paper presents preliminary research that is concerned with outcomes from an intervention strategy designed to help first-year first-semester students to work in cross-cultural and cross-disciplinary team tasked with the completion of a series of team-based assessment tasks in a web design course. Using reflective activities (three online surveys), students were guided to explore their own approach and expectations when working in a team. Reflection was combined for each team enabling the team to view their team health, identify strengths and weaknesses, and establish a strategy to improve team working.
The online survey items consisted of both qualitative and quantitative items covering four areas (components) of teamwork: communication, task management, relationship, and cultural dimensions. Response style for communication was text based, while the attributes within each of the other components were to be rated with a 5 point Likert scale. A demographic survey was also developed for indication of gender, age group, cultural influence, country of birth, perceived team membership (members from other countries and members from other disciplines).
With a class of 301 students (semester 1, 2009), 80 teams submitted the final assessment project of a 10 page website. 553 responses to the online surveys were examined for quantitative data on the components task management, relationship and cultural dimensions. The focus of the examination was to identify the differences across attributes within each component for members in cross-cultural or cross-discipline teams with members of single cultural or discipline teams. Study 1 examined attribute ratings from cross-cultural and single-culture teams where the team grouping was based on the student perception of team membership with different cultures (demographic data). Study 2 examined attribute ratings from cross-cultural and single culture teams where the team groupings were based on country of birth (born in Australia or otherwise). Study 3 examined attribute ratings from cross-discipline and single discipline teams based on enrolment data. Study 4 examined attribute ratings from cross-discipline and single discipline teams for four sets of disciplines (Communication, Information Technology, Multimedia and Science/Business/Law). For each of these studies, attributes with significant
difference provided information on different levels of importance for the various attributes, while where no significant level of difference occurred; both groups had a similar focus to the attribute.
It was found that Study 1 had similar ways of working in a team while Study 2 significant differences occurred for two components (relationships and cultural dimensions) where cross-cultural teams rated these attributes higher than the single cultural teams. However, there was no difference for the task management component between both groups. In Studies 3 and 4, significant differences were noted in task management and cultural dimensions (with cross-discipline rating the items higher than the single discipline teams) but not in relationship components. Analysing team results for the teams for significant differences, it was found that cross-discipline teams had much higher marks for teamwork (10% more) than those in single-discipline teams while those in cross-cultural teams had no significant difference in team marks to single-culture teams.
This study therefore demonstrates that when working with cross-discipline teams, a great focus on task management and cultural dimensions is needed in the support material for team training. When working with cross-cultural teams, attention to relationships is significant in resource support. When working with cross-discipline and cross-cultural team, all three areas (task management, relationships and culture dimensions) need support in student training for successful teamwork. The next stage of the research will examine the student reflections on their team health within each of these four areas of study.
Paper 2: Cross-Cultural Education: Learning Methodology and Behaviour Analysis for Asian Students in the IT Field of Australian Universities
Jie Lu1, KL Chin2, Juan Yao3, Jun Xu4, Jitian Xiao5
1Faculty of Engineering & Information Technology, University of Technology Sydney, Australia 2Faculty of Business, Curtin University of Technology, Perth, Australia, 3Faculty of Business, University of Sydney, Australia, 4Graduate School, Southern Cross University, Australia, 5School of Computer and Security Science, Edith Cowan University, Australia
Australian tertiary education has attracted a large number of international particularly Asian students in the IT field. Cross-cultural teaching and learning becomes an important issue in IT departments of Australian universities. This study has completed a questionnaire survey of 1026 students, including 292 IT (28.5%) students from five universities in Australia. Among these IT students, there are 100 (34.25%) local students and 192 (65.75%) international students from 39 other countries (mainly in Asia). The questionnaire contains 55 questions within one information section (Section I) and six question sections as follows: (II) Teaching Contents and
CRPIT Volume 103 - Computing Education 2010
26

Textbooks; (III) Teaching and Learning Methods; (IV) Education Management Systems; (V) Language; (VI) Culture-based Teaching & Learning Concepts; (VII) Others (open questions). We distinguished local and international students based on the question of where a student completed most of his/her education before studying in an Australian university. Both quantitative and qualitative analyses were conducted to reveal the differences between local and international students in learning methods and behaviours. In this paper, we show the results of comparing the data distributions of a few typical questions related to teaching contents (questionnaire Section II) and learning methods (Section III). To analyse the open questions in Section VII, we categorized international students into two groups: undergraduate and postgraduate students. From the students’ comments, key words were identified and grouped. Contents of each group were then summarized.
Through this research, several interesting findings have been obtained. First, Asian background students have specific difficulties in reading/understanding textbooks. Although they believe that textbooks are very important to their study, they cannot read many contents of their textbooks within teaching weeks. Second, some Asian students prefer more lectures and fully use these lecture hours. On one hand, they believe the teachers are authoritative and tend to give up their ideas when conflicting with teachers. On the other hand, they are less confident when challenging their teachers due to their poor English communication skills. Third, students from different cultural backgrounds have different attitudes to working in groups. Although they show similar level of participation in group work, they tend to have fewer different ideas and argue less to show their respect for others. They would prefer that lecturers arrange groups to have local students in their groups. This research also finds that for Asian students, undergraduates rely more on rote learning and memorization than postgraduates. In contrast, postgraduate students participate more in variable teamwork and have better academic achievement.
Teaching and learning in a cross-culture environment remain a great challenge in our current educational systems. This paper reports on the current situation of cross-cultural teaching and learning of Asian students in the IT field of Australian universities through a survey in five universities. The findings of the study will help the universities in making better focused cross-cultural teaching and learning strategies, which will further help the lecturers more successfully teach our international students, and at the same time help our international students more effectively overcome their difficulties in learning caused by cultural barriers.
Paper 3: Challenges and Strategies in Teaching First-year Asian International Students in Australian Universities
Jitian Xiao1, Jie Lu2, KL Chin3, Jun Xu4, Juan Yao5
1School of Computer and Security Science, Edith
Cowan University, Australia 2Faculty of Engineering & Information Technology,
University of Technology Sydney, Australia 3Faculty of Business, Curtin University of Technology,
Australia 4Graduate School, Southern Cross University,
Australia 5Faculty of Business, University of Sydney, Australia
Using the data collected in Paper 2, the focus of this study reveals a number of leaning challenges facing Asian international students in Australian universities. Similar to results from other researches done in Australian universities (Briguglio, 2000 for example), our survey data showed that language and communication skills are still the main burden to first-year Asian background students, though this difficulty rate decreases in the later stages of their university study. The findings from the surveys specific to first year students demonstrate the challenges for teaching international students with Asian backgrounds: 1. Use of English language
o 36% of international students are not confident in using English language
o more than 50% of international students felt difficulty in communicating to others (students or staff);
2. Lectures o more than 20% of international students do
not understand lectures or cannot understand lectures most of the time;
o 32% international students have difficulties in taking notes during lecture;
3. Homework o nearly 50% international students need some
help in completing their homework; o about 7% of them even need to translate into
their first language before attempting the homework;
4. Classroom discussion o more than 50% international students are not
very confident in their English when participating in classroom discussion,
o nearly 10% students are not confident in their English at all thus they do not participate in classroom discussion.
5. Presentations o about half of international students can do in-
class presentation after practice, o more than 11% international students need
help from others for their in-class presentation.
Proc. 12th Australasian Computing Education Conference (ACE 2010), Brisbane, Australia
27

[It is noted that nearly 90% of local students have no problems with their in-class presentation skills.]
Interview data was also collected. Staff from Edith Cowan University generally supported the above findings from the survey questionnaire. Asian international students indicated that they were reluctant to speak in lecture/tutorial sessions and/or in class discussion in their first year of university study as they did not feel confident; their spoken English was not as fluent as that of local students; they were shy about speaking up; they did not want to challenge their lecturer, and so on. Both the survey and interview results showed the need to improve international students’ English language ability, especially in their first year study at university. While this is a complex issue, most students and staff agreed that while university level English classes are provided to support international students, teaching activities can be designed to help international students develop their English ability. The authors suggest the following strategies to improve the learning environment for the international students: (1) For lecture/tutorial sessions, lecturers should
invite specific international students to participate in discussion or asking/answering questions, after giving adequate time for them to reflect on what to say; encourage international students to respond to in-class discussion from both the teacher and fellow students.
(2) Lecturers should be encouraged to mix local and international students when forming groups or make a structured intervention for forming groups wherever possible.
(3) Lecturers should set aside one-to-one consultation time, or provide office hours for clarifying and explaining material that students did not fully understand in class
(4) Lecturers should encourage face-to-face consultation instead of answering questions via emails
Paper 4: Yet Another East India Company? The Australasian Education Industry
Vishv Malhotra1, Tony Clear2
1University of Tasmania, Australia, 2AUT University, New Zealand
In this presentation the authors pose some critical questions about the goals, impacts and sustainability of internationalisation in our Universities.
At the macro level, demands upon tertiary funding in Australia and New Zealand are key drivers for internationalisation. Increasing student enrolments and participation in tertiary education have placed pressures upon public funding of the system, and
brought demands for higher productivity with reducing support. Clark (2004) has noted these trends are not unique to Australasia. Universities in many countries, seeking to retain their autonomy and viability, have adopted a number of entrepreneurial responses, frequently with government encouragement.
In New Zealand for instance ‘export education’ for 2007/2008 (mostly generated by foreign fee-paying students), contributed NZD$2.1 billion to the economy, with 32% of that coming from the university sector (Infometrics, 2008, pp. 1-2). This value at 1.2% of GDP, equates roughly with that contributed by dairy farming at 1.3% of GDP (p.4), and positions export education as a major industry. Explicit government support is given in a recent tertiary education strategy:
The flow of international students can boost the incomes of New Zealand institutions…We will review policy settings to ensure that international education can maximise its contribution to New Zealand’s economic performance (MoE, 2009 p. 9).
Challenges for Computing Educators Computing has been an especially popular
discipline for students from Asian and South Asian countries. As a result most Australasian computing educators are now teaching an increasingly international and diverse student body. But on the front-lines individual educators facing large numbers of international students in their classes are challenged with managing equitable treatment of students, both domestic and international, while maintaining the academic integrity of their courses.
These are now key challenges facing computing educators and their institutions. How we deal with these is critical for the sustainability of an internationalisation agenda, and the reputation of the Australasian higher education sector. However the delicacy of the associated issues of access, quality, equity, race and culture ensure that this topic is one that one reviewer has termed an "elephant in the room".
For an ‘industry’ of this significance, where is the research into the impacts on those working in the system, the perceptions and experiences of the students and their parents, and the future prospects for productive and mutually reinforcing partnerships?
The academy may fearlessly research questions outside its own walls, but with the growing marketing phalanxes guarding its own reputation and branding, can it really say it is open to honest scrutiny of its own ‘business’ affairs?
Steady State or Impending Crash Are we witnessing a sea-change in the Australasian
University landscape with a much broader and sustained regional and national outreach which will truly include sound partnerships with the “Asia” within its name (unlike this conference for instance)?
CRPIT Volume 103 - Computing Education 2010
28

Or are we merely seeing the flush of a boom not far from an impending major crash of our own doing, which will have severe impacts on our national higher education systems?
At the institutional level an internationalisation strategy can be implemented well or badly. In the worst cases the “sheer financial opportunism” slated by Clark (2004, p. 17) and which has embarrassed several UK universities, results in inadequately prepared students struggling to succeed, and institutions ‘dumbing-down’ courses to accommodate the capabilities of the anonymous hordes of students they have accepted.
An accompanying pattern of relaxed prerequisite structures to ease access for international students especially at the postgraduate level, and managerially mandated high pass rate targets (cf. Clear, 2008), further exacerbate the situation. Unfortunately the confusion between educational performance metrics such as retention and progression rates and assurance of educational quality, often serve at a department or institutional level to cloak the true nature of the problem.
While Edmund Burke observed in 1786 that the East India Company, in short, was “a State in disguise of a Merchant, a great public office in disguise of a Countinghouse” (cf. Murray, 2007), the financially opportunist modern University can equally be termed nothing more than “a Merchant in disguise of a State institution”, exploitatively seeking to lure foreign fee-paying students.
This in turn leads to wider social impacts, nicely captured in a news item in The Australian newspaper:
Dr Birrell argued the appeal of permanent residency and lax rules for skilled migration delivered strong growth in business and information technology courses at universities in the early 2000s...But the education business had come to distort the migration program, producing graduates ill equipped or uninterested in the jobs they were supposedly trained for (The Australian 25 July 2009).
Anecdotal evidence through personal feedback to one of the authors, suggests that the reputation of Australasia as a destination for high quality education may already be suffering in such major markets as India.
Frustrated Parents The Australian author heard a level of anxiety and frustration among the parents of the graduated students as they wait for their children to get gainful employment in the area of their specialisation and education. An employment in a developed country is necessary to repay the educational bank loans that the middle-income parents have guaranteed in the hope of better future for their child in Australia. An inordinately large time gap between graduation and employment for many international students, as compared to the domestic students with similar academic achievements, gives rise to fears of
discrimination and racism among these financially stressed families as they pay interests on the loans.
Yet the author did not hear any parent wondering about the improved academic grades of their child as compared to their record while they studied in India. The Indian employers, however, remain more circumspect and are not willing to treat many foreign degrees at par with those from the best Indian Universities and institutions. Cervin (2009) in the Age newspaper reports ensuing softening of demand for Australian education in India.
The emotional and socio-economic aspects of international education must be given equal consideration in a sustainable model for the education industry.
Sound Institutional Strategies Globalisation can be seen as one component in a
wider “discourse of enterprise” whereby the social realm is defined in economic terms, and “patients, parents, passengers and pupils are re-imaged as customers” (Clear, 2002). This is far too narrow a view to sit easily with the reality of a reputable University, which needs to counterbalance it with the “discourse of community” (ibid.), where broader societal and ethical responsibilities must co-exist with more commercial ones.
Burton Clark (2004) arguing for the inevitability of ever reducing public funding for Universities, suggests that five elements must be considered for an institution embarking upon a transformative pathway to self-reliance as an ‘entrepreneurial university’. These elements address: 1) diversified funding base 2) strengthened steering core (e.g. balancing the
central, departmental and individual academic interests)
3) elaborated developmental periphery (e.g. grants offices, capital projects office, conference and special events offices, with a development orientation)
4) stimulated academic heartland (more postgraduate higher quality students and research intensity. And, also continuing education, professional development , contract education)
5) integrated entrepreneurial culture The implementation of an internationalisation
strategy by different institutions varies widely. The study of Monash University by Clark (2004, p. 122) provides an interesting example of the ‘entrepreneurial university’ in action. He concluded that Monash had strengthened its steering core through a managerial approach, and had diversified its funding base, but had damaged the academic heartland by engaging in merger activities at the cost of research and its international outreach had resulted in a diffusion of resources into teaching and alliances not closely linked to research. Moreover this managerial approach had damaged the “Ambitious
Proc. 12th Australasian Computing Education Conference (ACE 2010), Brisbane, Australia
29

collegial volition” (ibid.) that was necessary to sustain change.
A Role for Computing Educators This latter collegial role is the one we must
actively assert, as educators and researchers standing before our classes. We must actively work collegially, and strive to set and maintain high standards. As a community with more exposure to international students than most, we should look for opportunities to link research with the internationalisation agenda within our institutions and feed that into better informed and more strategic decision making processes. We must find the courage to resist financial opportunism girded by heavy-handed, short term managerial actions with likely damaging longer term consequences.
The health of our institutions, the quality of our futures and that of our IT industries depends upon approaches driven by strategies aimed towards quality. Perhaps a positive sign in the ‘offshore education’ segment is appearing in New Zealand, “which may now be entering a phase of more strategic choices, based on feasibility studies, business case analyses and effective due diligence” (Infometrics. P.12). At a broader level the quality of our choices has the scope to impact upon the stability of significant segments of our economies, now so dependent on the ‘export education’ industry.
The search for and evaluation of responsible and sustainable models of internationalisation may be the new frontier in Computing Education Research.
Biographical information Dr. Tony Clear is Associate Head of School, Computing and Mathematical Sciences at AUT University, New Zealand. His research interests are in Computing Education Research, Collaborative Computing and Global Software Development. After an early career in industry as a practicing software developer and manager, and following a ten year programme of research into global collaborations, he has recently completed a doctoral thesis investigating Technology-use Mediation in Global Virtual Teams. Tony holds positions as a Column Editor and Associate Editor for ACM Inroads; Editorial Board member for the journals Computer Science Education & NZ Journal of Applied Computing & IT; program co-chair Australasian Computing Education Conference 2009 & 2010. In 2008 he was a guest researcher at Uppsala University Sweden. Tony has been engaged in global virtual research collaborations over the last decade spanning the continents of Europe, Australia, Asia and the United States. Dr Kathryn Egea is the first year coordinator for students in the Bachelor of Multimedia Design and Bachelor of Information Technology in the School of Information Technology and Electrical Engineering at University of Queensland. Her research areas include teamwork and virtual working, particularly in academic assessment, computer-based diagnostic test designs for mathematic education, and adult learning in computer education. She is a member of the state board for the Australian Computer Society where her focus is young professional career pathways. She has won several faculty and university level grants in teaching and learning towards teamwork, most recently connected to cross-discipline and cross-cultural teams in first year. Professor Jie Lu is the director of Decision Systems and e-Service Intelligence Research Lab at the University of Technology Sydney, Australia. Her main research interests lie in the area of multi-objective, bi-level and group decision making, decision support system tools, uncertain information processing, e-Government, e-Business and e-Service intelligence and cross-culture education methodology. She has published five research books, over 200 papers in refereed journals and conference proceedings. She has won four Australian Research Council (ARC) discovery grants, one ALTC (Carrick) competitive grant, and many other research grants. She served as a guest editor of special issues for five international journals, and delivered four keynotes in international conferences.
Dr Jitian Xiao is a senior lecturer in the School of Computer and Security Science at Edith Cowan University. He completed his Bachelor and Master degrees in China and PhD at the University of Southern Queensland. His research interests include databases and large data warehouses, spatial data
CRPIT Volume 103 - Computing Education 2010
30

processing, data mining and Web mining, software engineering, and cross-culture teaching and learning. He has published over 60 refereed research papers in journals and conference proceedings. He has been served as reviewer board members for several journals, PC members and session chairs for several international conferences.
References
Biggs, J. (2003). Teaching international students. In J. Biggs, Teaching for quality learning at university. 2nd Ed, MaindenHead; Open University Press, pp 120 – 139.
Briguglio,C. (2000). Language and cultural issues for English-as-a-second/foreign language students in traditional educational settings, Higher Education in Europe 25(3), 425-434
Cervin, E. (2009). The Australian Universities – Safe, but not very good, The Age (Newspaper dated: 25 October 2009) http://www.theage.com.au/opinion/australian-universities--safe-but-not-very-good-20091024-he1g.html Accessed on 26 October 2009.
Clark, B. (2004). Sustaining Change in Universities - Continuities in Case Studies and Concepts. Maidenhead, Berkshire: The Society for Research into Higher Education and Open University Press.
Clear, T. (2002). E-Learning: A Vehicle for Transformation or Trojan Horse for Enterprise? - Revisiting the role of Public Higher Education
Institutions. International Journal on E-Learning, 1(4), 15 - 21.
Clear, T. (2008). Assessment in Computing Education: Measuring Performance or Conformance? SIGCSE Bulletin, 40(4), 13-14.
Green, W. (2007). "Write on or write off? An exploration of Asian international students' approaches to essay writing at an Australian university." Higher Education Research & Development 26 (3), 329-344.
Infometrics, NRB, & Skinnerstrategic. (2008). The Economic Impact of EXPORT EDUCATION. Wellington: Education New Zealand & Ministry of Education.
Prosser, M., & Trigwell, K. (1998). Teaching in higher education. In B. Dart and G. Boulton, (Eds). , Teaching and Learning in Higher education (pp. 250- 268). ACER Press, Camberwell, Australia.
MoE. (2009, 29 Sept 2009). Draft Tertiary Education Strategy - 2010-2015. Retrieved 20 Oct, 2009, from http://www.minedu.govt.nz/~/media/MinEdu/Files/TheMinistry/Consultation/DraftTertiaryEducationStrategy20102015.pdf
Murray, J. (2007). Company Rules: Burke, Hastings, and the Specter of the Modern Liberal State. Eighteenth-Century Studies, 41(1), 55-69.
The Australian (27 July 2009): http://www.theaustralian.news.com.au/story/0,25197,25816526-12332,00.html Accessed on 27 July 2009.
Proc. 12th Australasian Computing Education Conference (ACE 2010), Brisbane, Australia
31

CRPIT Volume 103 - Computing Education 2010
32

Contributed Papers
Proc. 12th Australasian Computing Education Conference (ACE 2010), Brisbane, Australia
33

CRPIT Volume 103 - Computing Education 2010
34

Introductory Programming and the Didactic Triangle
Anders Berglund UpCERG, Uppsala Computing Education Research Group
Department of Information Technology Uppsala University Uppsala, Sweden
Raymond Lister Faculty of Information Technology University of Technology, Sydney
Sydney, NSW, Australia
Abstract•••• In this paper, we use Kansanen’s didactic triangle to structure and analyse research on the teaching and learning of programming. Students, teachers and course content are the three entities that form the corners of the didactic triangle. The edges of the triangle represent the relationships between these three entities. We argue that many computing educators and computing education researchers operate from within narrow views of the didactic triangle. For example, computing educators often teach programming based on how they relate to the computer, and not how the students relate to the computer. We conclude that, while research that focuses on the corners of the didactic triangle is sometimes appropriate, there needs to be more research that focuses on the edges of the triangle, and more research that studies the entire didactic triangle.
Keywords: didactic triangle, phenomenography, object-oriented programming.
1 The teaching of introductory programming is still a problem
Programming is hard to learn, and hard to teach. These problems are frequently acknowledged within the computing education community and are confirmed in several studies (e.g. Bennedsen, 2008; Berglund & Lister, 2007; Pears et al., 2007; Robins, Rountree, & Rountree, 2003). This paper begins by discussing previous research efforts that have tackled this problem. We then argue that, while previous research has advanced our understanding of how students learn to program, it is time to broaden our collective research focus. We will argue for a wider, more systematic focus on the complete teaching picture, instead of focusing upon parts of the picture. We will base our argument on new research findings, as well as other research sources, and will, as a conclusion, sketch
• Copyright © 2010, Australian Computer Society, Inc. This paper appeared at the Twelfth Australasian Computing Education Conference (ACE2010), Brisbane, Australia, January 2010. Conferences in Research and Practice in Information Technology, Vol. 103. Tony Clear and John Jamer Eds. Reproduction for academic, not-for-profit purposes permitted provided this text is included.
the direction in which we propose that research now move.
We start (in section 2) by presenting Kansanen’s (1999) didactic triangle, which is a model aimed at analysing and describing the entire teaching and learning situation. We then (in section 3) discuss separately each of the three corners of the triangle – teachers, students and programming. In section 4, we discuss the edges of the triangle – the relationships between teachers and programming, between students and programming, and between teachers and students. In sections 3 and 4, our analysis will focus on ambiguities and problems in the components and/or their relationships. In section 5, we then return to the complete didactic triangle, and apply the research results described in sections 3 and 4. In section 6, we conclude with our proposals for future work.
Figure 1: The Didactic Triangle (Kansanen, 1999;
Kinnunen, forthcoming)
2 The Didactic Triangle A teaching situation can be analysed and described in terms of its three main components: the student, the teacher and the content. These entities and their interaction can be illustrated in a didactic triangle, as shown in Figure 1 (Kansanen, 1999). When applying the model to the teaching of introductory programming, Kinnunen (forthcoming) argues that the context of the teaching situation must be taken into account, as teaching
Proc. 12th Australasian Computing Education Conference (ACE 2010), Brisbane, Australia
35

does not occur in a vacuum; this is represented by the shading in Figure 1.
Although the didactic triangle should be seen and analysed as a whole – that is its raison d’être – we claim, based on Kansanen & Meri (1999), that it is often fruitful to precede (but not replace) analysis of the whole triangle with analysis of its components. The following two sections discuss the components of the didactic triangle, as best we can, given that each component by necessity has relations to its neighbours and the context.
The triangle is an analytic tool for, in the case of this paper, improving our awareness of issues often taken for granted and left implicit in discussions about programming.
3 The Corners of the Didactic Triangle In this section, we discuss content, students and teachers in isolation from one another. Such a tight focus can sometimes be useful and appropriate in research, but it can also be a naïve perspective. Many of the topics discussed here in section 3 will need to be revisited in section 4, when we consider larger parts of the didactic triangle.
3.1 The “Content” Corner of the Triangle Discussion about the learning and teaching of programming is often conducted without explicit reference to students and teachers. Instead, the focus is on the technology. Such a discussion rests upon the plausible, but often implicit, assumption that the simpler a technology is, the easier it is to learn. (In this paper, we ignore the difficulty of measuring simplicity.) Consequently, a discussion on how to simplify the technology can proceed without explicit reference to students and teachers. For example, Kolling, Koch and Rosenberg (1995) enumerated 10 requirements for a first year teaching language, where all 10 requirements related to principles of simplicity and transparency in programming languages. Students are only mentioned in one of the requirements, and only then in passing. That is not to say that the 10 requirements are wrong, or inappropriate, but merely that the 10 requirements offer a limited perspective on a complex issue.
The remainder of this section discusses briefly some other examples of where the focus is on the “content” corner, and where the student and teacher remain in the implicit background.
3.1.1 Languages and Language Wars ACM Java Task Force (2006) was convened in 2004
with the following charter: To review the Java language, APIs, and tools from the perspective of introductory computing education and to develop a stable collection of pedagogical resources that will make it easier to teach Java to first-year computing students without having those students overwhelmed by its complexity.
The Task Force identified four significant challenges that instructors face teaching Java:
• Static methods, including “main” • Lack of a simple input mechanism
• Conceptual difficulty of the graphics model • GUI components inappropriate for beginners
Some other researchers (e.g. Grandell et al., 2006) have gone further, to advocate not using Java, and instead using other object-oriented languages, such as Python. There argument is that these other languages are simpler, and therefore (in their view) simpler to learn.
3.1.2 Tools It is only natural that, when computing scientists are faced with a problem in their teaching, they look for a software solution. For example a very popular notion among computing educators is that students struggle with programming because they have difficulty visualizing how the algorithms work. That notion has spawned a plethora of visualization tools. As Stasko and Hundhausen (2004) explained, prior to a shift in the mid-1990’s, the focus in that research was on the technology, not the students:
The notion of using illustrations and pictures to explain computer algorithms and programs is nearly as old as computer programs themselves. … Initial research in the field of algorithm visualization was dominated by efforts to build algorithm visualization software systems and to expand the capabilities and expressiveness of these systems. … system paradigms, specification paradigms, types of views, and the like...
In section 5.2, we will examine what Stasko and Hundhausen then went on to say about the subsequent work on visualization. As a preview, we now paraphrase them, in terms of the nomenclature of this paper: they wrote that subsequent research broadened to examine larger parts of the didactic triangle.
3.2 The “Student” Corner of the Triangle In this subsection, we discuss theories of student learning, without reference to the specific content of what is learnt by the student. Also, the theories discussed here assume that the teacher has no influence on the behaviour of the student. As noted at the commencement of section 3, such a perspective of the student can be naïve, and we shall revisit these topics later.
3.2.1 Deep and Surface Learning In the 1970s, early phenomenographers identified two different approaches that students bring to learning. In the "deep" approach, students attempt to develop a genuine understanding of what they are studying, while students using the "surface" approach merely seek to complete the tasks set by the teacher (Marton & Booth, 1997).
While the notions of deep and surface approaches to learning are now well known, these notions are often understood and articulated in an incorrect, naïve fashion, where students are represented as being by nature “deep learners” or “surface learners”. That is, the students are described without reference to either the content they are learning, or their teachers. As Biggs (2003) and many others have noted, both the teacher and the content have a profound influence on whether students adopt a deep or surface approach to learning.
CRPIT Volume 103 - Computing Education 2010
36

3.2.2 Student motivation In research on student motivation, the distinction between intrinsic and extrinsic motivation is commonly made. For an overview, see Entwistle (1998) or Ryan & Deci (2000).
While “intrinsic” and “extrinsic” are often used by teachers to describe the motivations of their students, the terms are often used naïvely, perhaps even incorrectly. In the naïve use of “intrinsic” and “extrinsic”, it is the “student” corner of the didactic triangle that is in focus. That is, the motivation of student is described as an intrinsic property of the student, not as a reaction to the teacher or content being learnt.
The educational psychology literature on motivation reveals that student motivation is a complex issue that involves more than just one corner of the didactic triangle. Ryan & Deci divide extrinsic motivation into four subcategories, of which only one, “external regulation”, describes what most teachers mean by “extrinsic motivation”. Two of the extrinsic subcategories “identification” and “integration” are actually part of what most teachers naively refer to as “intrinsic” motivation. When many teachers use the terms “intrinsic” and “extrinsic”, they are really referring to what Ryan & Deci refer to as the locus of causality, “internal” or “external”.
3.3 The “Teacher” Corner of the Triangle In this subsection, we discuss how teachers view their general role, independent of the specific content and specific students they teach.
During the last twenty years, studies in teaching and learning in higher education have to an increasing degree focused on the role of teachers (see for example Boyer, 1997; Kember, 1997; Ramsden, 2003; Trigwell, Prosser, Martin, & Ramsden, 2005), but such studies are sparsely represented compared to studies focusing on students. In computing education, there are very few studies of the teacher.
3.3.1 Content- versus Student-Centred Fox (1983) identified four personal theories of teaching on the basis of his many anecdotal encounters with polytechnic teachers, from a variety of disciplines. The four personal theories formed pairs, with one pair being content- or teacher-focused and the other pair being student-focused.
Within the broad content- or teacher-focused category, Fox identified the sub-categories of ‘transfer’ and ‘shaping’. In the first of these sub-categories, the student is viewed as a container into which the knowledge is to be poured. In the second sub-category, the student is viewed as a raw material to be moulded, or turned by some other ‘manufacturing’ process into a finished product.
Within the broad student-focused category, Fox identified the sub-categories of ‘travelling’ and ‘growing’. In the ‘travelling’ sub-category, the teacher views the student as someone undertaking a journey, where discipline knowledge is the landscape, and the teacher is a guide. To define the ‘growing’ sub-category, Fox resorted to quoting Northedge (1976):
In this case we conceive of the teacher as a gardener with the student’s mind, as before, an area of ground.
There have been a number of studies – among them Dunkin (1990) and also Samuelowicz and Bain (1992) – using a variety of research methods, that have drawn broadly similar conclusions to Fox. In a meta-study, Kember (1997) found that numerous studies in this area showed a reliable distinction between teacher-centred/content-oriented and student-centred/ learning-oriented.
3.3.2 Research on Teachers within Computing Lister et al. (2007) conducted a phenomenographic
study of computing academics’ understanding of teaching, and found categories consistent with Kember’s meta-study.
Pears et al (2007) discusses the attitudes of teachers towards the students’ success or failure in learning to program. They confirm that teachers often, when discussing the students, focus their arguments on themselves as teachers, not upon the students.
4 The Edges of the Didactic Triangle In this section, we discuss the relationships between content and teachers, between content and students, and between teachers and students. With regard to content, we focus upon computer programming, particularly object-oriented programming.
4.1 Programming and Teachers In section 3, we discussed teachers without reference to what they taught. At the university level, most academics do not separate the act of teaching from what they teach. As Bowden and Marton (1998, p. 143) expressed it:
… being good at teaching means that you are good at teaching something. You cannot teach in general and the way in which you deal with the particular content you are dealing with is what matters.
Rowland (2000, p. 120) expressed a similar sentiment, and went further to warn of the dangers of making such a separation:
… a focus on generic approaches to teaching, and theories of learning, can lead to a separation of teaching method and subject matter. Academics or educational developers come to be seen as experts in how to teach but ignorant about what to teach … like experts of love who have no lover.
Shulman has written extensively on this topic, introducing the concepts of pedagogical content knowledge (Shulman, 1987) and pedagogy of substance (Shulman, 1989).
4.1.1 Understandings of OO Programming In April 2004, there was a vigorous e-mail discussion on the ACM SIGCSE members’ mailing list (SIGCSE, 2004a, 2004b), concerning object-oriented programming (that discussion has since been regularly reprised in the
Proc. 12th Australasian Computing Education Conference (ACE 2010), Brisbane, Australia
37

mailing list, on a smaller scale). Two quotes from that e-mail discussion illustrate the differences in how members of the SIGCSE community understand object-oriented programming:
[Some email messages in this discussion imply] that selection and repetition are no longer necessary in object-oriented programming. I've been in this field for about 25 years, so maybe that makes me old, but I don't see how you can write a graphics render, a system simulation (eg: waiting-line simulation), an operating system, etc. without repetition and selection. (Jeffrey J. McConnell)
The second posting was written by Carl Alphonce:
Selection and repetition are fundamental, but if statements and for loops are not. How selection and repetition are expressed in different paradigms differs. In OO polymorphism is the primary means of achieving selection. (Carl Alphonce)
Clearly, these two teachers have different understandings of OOP. In an earlier paper (Lister et al., 2006), we carried out a phenomenographic analysis (Berglund, 2006; Marton & Booth, 1997) of this April 2004 e-mail discussion. In this subsection of this paper, we extend our earlier work with a further analysis of the same data. This new analysis revealed three fundamentally different understandings of what OOP “is”:
OO1. OOP is an extension of procedural programming OO2. OOP is something fundamentally new OO3. OOP transcends OO1 and OO2
Table 1 summarizes our findings. The next three subsections elaborate upon that summary.
4.1.1.1 OOP extends procedural programming This category is illustrated by the earlier quote by Carl Alphonce (above) and by the following quote from Stan Warford:
Java has the assignment statement. It has the if statement. It has loops. It has recursion. It has arrays. Your statement would be more convincing if it had none of these features because they were abstracted away at a lower level. But as long as it has them and students must use them it seems that traditional algorithmics (and by implication mathematics) must remain at the heart of CS. (Stan Warford)
4.1.1.2 OOP is something fundamentally new In the second category, polymorphism and the interaction between objects are important. Also, the programming methodology of OO focuses on extending classes (i.e. inheritance) and refactoring rather than algorithm development and writing code from scratch. This understanding is illustrated in the following contribution to the discussion:
I agree with your comments that if, while and repeat are not fundamental concepts, but rather selection and repetition are the fundamental concepts that may be represented by if and while. I can readily use and teach these concepts using polymorphism and recursion. (Richard Thomas)
4.1.1.3 OOP transcends OO1 and OO2 The third category presents an integrated perspective
of OOP. This category transcends the idea that either procedural programming or object-oriented programming is more fundamental than the other. It goes further than a mere unification of categories OO1 and OO2, and contains relationships between the two previous understandings. The following contribution to the discussion illustrates part of that understanding:
Philosophically, we must decide whether successively higher levels of abstraction provided by OO software development environments have caused algorithmic thinking and mathematics to become non-fundamental. (Stan Warford)
Important aspects of the categories Categories
OO1. OOP is an extension of procedural programming
OO2. OOP is something fundamentally new
OO3. OOP transcends OO1 and OO2
Selection IF-clause Polymorphism
}
The aspects that distinguishes OO1 and OO2 are not relevant. They are simply variations on a single theme
Program execution Sequential execution of algorithms
Interaction between objects gives algorithm
Role of objects Containers of data and behaviour, created empty
The core concept. This is where “everything happens”
Development Writing code from scratch Completing a framework Working methods Problem solving and
algorithm development. Extending and refactoring
Table 1: Teachers Understandings of Object-Oriented Programming
CRPIT Volume 103 - Computing Education 2010
38

Warford then continues his email with a comment on an earlier statement by another discussant:
I find it interesting that you would consider the Turing Machine, at the very lowest level of abstraction, to be fundamental and OO programming at the highest level to also be fundamental, while algorithmic reasoning with if, while, and arrays to be not so fundamental.
Warford acknowledges the thinking represented by the
two previous categories, by discussing algorithmic thinking and OO programming. He then goes further in that he evaluates certain aspects of them. To be able to compare the understandings represented by the two categories, he has to see both of them from “the outside”. Thus, we have identified a third category that transcends OO1 and OO2. This category takes a “bird’s eye” perspective in that it sees the two previous understandings as variations on the same theme.
4.1.2 Mathematics or Software Engineering? In the SIGCSE-mailing discussion, a further variation among teachers’ understandings of OOP was revealed in their discussion of the relationship between OOP and mathematics, on one hand, and the relationship between OOP and software engineering (SE) on the other. In the discussion, Michael Kölling made the following claim:
I think the only way this can eventually be resolved is that separate degrees are being taught in what are now regarded as sub-areas of computing (computer science versus software engineering being the obvious ones, but there will be more). (Michael Kölling)
Later, Conrad Cunningham addresses the question in
the following way: This dispute gets to the heart of what software and computer science are all about. It is also one battle in a war that rages up and down modern intellectual history, the war between mathematical and physical worldviews. They have been fought in civil engineering: Do we design bridges based on mathematical models, or based on experience, aesthetics, and intuition? (Conrad Cunningham)
Two main positions about what underlies OOP were
present in the data: Underlying1. Mathematics underlies OOP Underlying2. Software Engineering underlies OOP The first category (Underlying1) offers a theory-driven
perspective, stating that the fundamentals of CS are of a mathematical character. From this perspective, good teaching emphasises the theoretical, or mathematical.
The second category (Underlying2) gives voice to software engineering aspects. It is a people oriented perspective, summarised below by Michael Kölling:
I also want students to learn to work in a programming team, read other people's code, assess quality of code in terms of maintainability and adaptability, and reason about quality trade-offs.
[…] There just are not many problems out there anymore that are solved by recluse individuals in a dark cellar room. (Michael Kölling)
4.1.3 Teacher Familiarity with the Content As part of the SIGCSE-members email discussion, Stuart Reges made the following point:
… if the material isn’t straightforward for a lifelong computer scientist to teach, then can it really be all that fundamental? (Stuart Reges)
In a paper commenting upon the SIGCSE-mailing list discussion, Bruce (2005) acknowledged that not all computing academics have the background to teach OOP:
[Some academics] … are simply thrown into an introductory Java course, even though their main experience is with procedural programming. Quite naturally, they will tend to teach most of the course the way they always have, including object-oriented topics where they occur in the text or syllabus, but without rethinking the overall approach of the course. … [The teachers of OOP] need to have developed programs larger than those assigned in introductory courses to have a real understanding why the organization supported by the object-oriented style is valuable. Once that understanding is there, the style can be taught more effectively to novices, even on relatively small programs. (Kim Bruce)
The technical background of teachers, and how it
affects their teaching, is a relatively unstudied area of computing education research. We are aware of only two studies in this area. The first study was a biographical analysis done, by Carsten Schulte, as part of an ITiCSE 2006 working group (Lister et. al, 2006). Schulte analysed only two biographies, one from a OOP advocate and one from an OOP sceptic. One observed difference in the two biographies was that the OOP advocate had made a commitment to OOP before teaching it, whereas the OOP sceptic had found himself teaching OOP, not by his own decision, but as a result of an institutional decision. The second study (Liberman, Kolikant and Beeri, 2009) was of a high school teacher, who knew procedural programming, but who had been called upon to teach OOP while still learning it herself.
4.1.4 The Objectivist Perspective By considering the relationship between programming and the teacher, a conversation ensues that is more rich than the conversation that ensues from considering each by itself. However, any conversation that is restricted to programming and teachers, and ignores the student, will inevitably become a conversation in the objectivist tradition. In that tradition, the curriculum and the pedagogy are constructed in such a way as to be most meaningful to the teacher, not the student. One example of objectivist pedagogy was articulated by Gries (2008), in his six principles for teaching objects first:
1) Reveal the programming process, in order to ease and promote the learning of programming.
2) Teach skills, and not just knowledge, in order to promote the learning of programming.
Proc. 12th Australasian Computing Education Conference (ACE 2010), Brisbane, Australia
39

3) Present concepts at the appropriate level of abstraction. 4) Order material so as to minimize the introduction of
terms or topics without explanation: as much as possible, define a term when you first introduce it.
5) Use unambiguous, clear, and precise terminology. 6) Introduce names for entities under consideration.
Gries’ pedagogy is expressed in terms of content. The student is implicit in Gries’ pedagogy. The constructivist perspective, of building upon what a student already knows, is not present in Gries’ pedagogy.
4.1.5 OOP and Students This section gives some examples of recent research
on how students learn OOP.
4.1.5.1 Quantitative Studies Butler and Morgan (2007) surveyed several hundred
students in an object-oriented introductory programming unit. Students nominated the difficulty of several topic areas, on a 7 point scale (with 7 as the hardest). The topic areas were Algorithms, Syntax, Variables, Decisions and Loops, Arrays, Methods, OO Concepts, OO Design, and Testing. The average response was highest for OO Concept and OO Design.
Ma et al. (2007) investigated the mental models of assignment held by 90 students who had completed 70 hours of classroom learning in an introductory programming class. They found that approximately one third of the students held non-viable mental models of value assignment and over 80% of students held non-viable mental models of reference assignment.
4.1.5.2 Qualitative Studies Eckerdal and Thuné (2005) performed a
phenomenographic study to determine how students experienced the OOP concepts of object and class. They found that the students experienced an object as:
1. A piece of code. 2. As something that is active in the program. 3. As a model of some real world phenomenon.
They found that the students experienced a class as:
1. An entity in the program, contributing to the structure of the code.
2. As a description of properties and behaviour of the object.
3. As a description of properties and behaviour of the object, as a model of some real world phenomenon.
Eckerdal and Thuné described the educational implications of their research as follows:
For the Java educator, one challenge is to construct an educational environment which facilitates for students to reach a rich understanding of the concepts object and class. To this end it is important to know the different ways in which students (as opposed to experts) typically experience these concepts. Our phenomenographic study has given such insight. Next, the educator needs to identify what variation the students have to discern in
order to become aware of aspects belonging to a rich understanding of these concepts.
4.1.6 Student Motivation and Programming Earlier, we discussed student motivation from the perspective of the “student” corner of the didactic triangle. That simple perspective has been problematized and questioned – it has been argued that what students are studying has an important role in motivation (see for example Salili, Chiu, & Hong, 2001).
Hansen and Eddy (2007) have taken the interesting step of surveying their students and directly asking them to rate their engagement with, and frustration with, the various assignments the students do across three courses. They found that frustration and engagement do vary according to the type of task given to the students.
4.1.7 Student Learning of CS in a context Few education research projects have discussed learning of computer science in a context. One example can be found in Berglund (2005), which identifies complex relationships between the learning and the learning environment in a distributed project course in computer systems. Kinnunen (forthcoming) studies introductory programming courses and proposes models to analyse the full picture of a teaching and learning situation, with the ultimate aim of improving the teaching of programming.
Other projects take a more practical, and less research focused approach. For example, in a project by Tew, McCracken, & Guzdial (2005), exercises are remodelled and the course reorganised to better suit the students study interests.
4.1.8 Students and Teachers The relationship between teachers and students is a neglected area of computing education research.
Hitchens and Lister (2009) reported on a focus group study of the attitude toward lectures by computing students. One of the outcomes of the focus groups was the importance the students attributed to a positive personal relationship with the lecturer. This is illustrated in the following comments by two students from the focus groups:
… what makes a good lecture is more the lecturer and his attitude towards giving the lecture. … I've noticed that I've walked out of lectures thinking ‘oh that's a good lecture’ actually when the lecturer's happy more or less.
… don't get me wrong because older people can be really happy and really energetic and really passionate. But, you know… I think they get older so they just don't care. They just want to hurry up and teach and get out of there.
The “feeling”, or climate, in a class-room was studied by Barker & Garvin-Doxas (2004). They argued, based on their empirical investigations, that the CS class-room can be experienced as a male-dominated impersonal environment with guarded behaviours.
The teacher–student relationship is two-way, but there is probably less research on computing teachers’ attitudes to their students than there is on the reciprocal relationship. Kutay and Lister (2006) conducted focus groups with
CRPIT Volume 103 - Computing Education 2010
40

computing teachers and, amongst other issues, asked how teachers felt about their students. One focus group participant made the following statement about the importance of the emotional connection with students:
… If you want to be a good teacher, you really have to show the students … that you are passionate about the things you are teaching. The students can very quickly discover the fraud, so you must actually show your love of that material, if that comes across I think half the battle is won.
4.1.9 Teacher- versus Student-Centred Kember (1997) argued, from a phenomenographic perspective, that the student-centred approach is more advanced, or more complex, in that it presupposes the teacher-centred approach. To focus on the student a teacher must be capable of taking a step ‘outside’ herself and seeing her acts not as an aim in itself, but in relation to the student. The rather few studies that have quantified these orientations with individual teachers confirm that the student-focused orientation is less common than the teacher-focused one.
The insights from Kember’s work tell us that the attitude of the teacher is an important factor in determining how she teaches. It would be interesting to explore what it is that leads some teachers to take the step to seeing their teaching, and the object of their teaching, from the perspective of their students.
5 The Complete Didactic Triangle In the previous two sections, we have explored parts of the didactic triangle, and its implications for teaching programming. In this section, we consider the whole.
Our first observation, flowing from the previous sections, is that it is hardly surprising that there is not a consensus in our community as to what OOP is and how to teach it, when there are so many different perspectives stemming from different foci on different portions of the didactic triangle. Thus, we teachers “invite” our students to join a community of practice (Wenger, 1998) when the community itself does not share an understanding of what is OOP. Similar results have been found in a study based on questionnaires (Bennedsen & Schulte, 2007).
5.1 Content- versus Student-Centred, again With the perspective gained from the didactic triangle, perhaps the concepts of content- versus student-centred teaching should not be seen as being in competition. Instead, as the content-centred orientation falls on the Teacher-Programming edge of the didactic triangle, while the student-centred orientation falls on the Teacher-Student edge of that triangle, perhaps it would be more profitable to see them – not mutually exclusive, but instead – as equally necessary aspects of the complete teacher. The teacher who is an expert in their subject but who cannot communicate with her students is perhaps no more or less effective a teacher than the talented communicator who simply doesn’t know the content.
5.1.1 Learning as Entering a Culture As computer scientists and academics we are part of, and carry, a certain culture, with its own values and norms. These values and norms need to be made explicit in the discourse of teaching. Booth (2001) presents learning of programming as a entering a community with its own ways of thinking.
Contrasts between our culture and the students’ culture, based on their own experiences of home computers and games, are highlighted in the work of Kolikant (2005), where she argues that errors in students’ programmes can have cultural reasons: “Correctness” means something different to students than what it means to us, their teachers.
Liberman, Kolikant and Beeri (2009) is a study spanning the entire didactic triangle. One aspect of the study is the way in which a teacher grapples with her own uncertainty with OOP concepts, all the while attempting to respond quickly to student questions.
In this culturally-oriented research work, all aspects of the didactic triangle are explicit. Not only is the technology and the student explicit in this research, but so is the culture to which the teachers belong.
5.2 Tools, again Earlier, we discussed the summary, written by Stasko and Hundhausen (2004), of work in program visualization. They described how, prior to the mid-1990s, the focus in that work was on the technology, not the students, but then they went on to add:
In the mid-1990’s, the focus of algorithm visualization research shifted markedly. Rather than concentrating on the development of algorithm visualization technology … researchers began to turn their attention to the pedagogical effectiveness of the technology. The evaluation of algorithm visualization technology became paramount as researchers began to question their intuitions about the utility of algorithm visualizations as learning aids.
Since the mid-1990s, this style of research in algorithm visualization has encompassed the entire didactic triangle. Not only is the technology and the student explicit in this research, but so also are the (previously taken for granted) intuitions of the teachers.
6 Conclusion Much of the work presented at CS education conferences today focuses upon details or “small picture” issues, such as specific teaching tools or tips and tricks (Simon, 2007a, 2007b; Valentine, 2004). These projects emphasise the corners of the didactic, but these projects serve important needs by offering platforms for discussions between teachers, and by disseminating good teaching experiences. However, our students face other problems than those which are addressed by these projects.
Based on the research presented earlier, we argue that an alternative line of research ought to be prioritized. Our arguments are given below:
Proc. 12th Australasian Computing Education Conference (ACE 2010), Brisbane, Australia
41

1. Educators do not have a shared picture of the fundamentals of object-oriented programming. Certainly, a discussion is valuable and is a sign of life in the community, but the question of what OOP is might overshadow the question of what our students need and what and how we should teach them.
2. We tend to base our teaching on our own needs, or our assumptions about the students’ needs. In this paper, we have discussed how our knowledge of both our students and ourselves is limited.
3. We know very little about our students’ world and our students’ motivations. We need to meet our students where they are, in order to make our teaching accessible to them, and thereby meaningful. Currently, we only approach them on their terms to a very limited extent
4. We tend to focus on details instead of the bigger picture.
In short: we teach and research that which we find important, but what is important to us may not be as important to our students and their learning. Computing education research needs to broaden its focus. Although it is tempting for us to explicitly prescribe certain lines of research, we cannot, and should not, do this – research should offer surprises. But we can hint at which forms of projects we believe are of less importance, and we can nominate research directions that we judge as more important.
The development of new teaching tricks, new “single-user” tools or other “detail-oriented” projects are generally of a limited value. They often prove be beside the point, as these projects are normally based upon the teacher’s perception of importance, rather than on the world of the students
When studying student learning, we suggest that researchers should frame their questions in terms of the students’ point of view, not the teacher’s point of view. However, we also suggest that researchers study the teacher as much as the student.
Many of us, as CS education researchers, have our research training from computer science (or other sciences), we are trained in an “objectivist” or “positivistic” tradition (Cohen, Manion, & Morrison, 2000). Naturally, we bring this competence with us when doing research in CS education. Complementing this research with alternative approaches, stemming from the social sciences, opens new research questions for inspection and would, for example, invite to a further exploration of the students’ learning context. (Berglund, Daniels, & Pears, 2006)
Acknowledgements Raymond Lister’s work in computing education research is partially funded by an Associate Fellowship awarded to he and Jenny Edwards from the Australian Learning and Teaching Council (formerly the Carrick Institute).
References ACM Java Task Force (2006) Version 1.0.
http://jtf.acm.org/ [Accessed September 2008]
Astrachan, O., Bruce, K., Koffman, E., Kölling, M., & Reges, S. (2005). “Resolved: Objects Early Has Failed”. SIGCSE'05, February 23-27, 2005, St. Louis, Missouri, USA., 451-452.
Barker, L., & Garvin-Doxas, K. (2004). Making Visible the Behaviors that Influence Learning Environment: A Qualitative Exploration of Computer Science Classrooms. Computer Science Education, 14, 119-145.
Bennedsen, J. (2008). Teaching and learning introductory programming – a model-based approach (PhD thesis): Oslo University, Oslo, Norway.
Bennedsen, J., & Schulte, C. (2007). What does “objects-first” mean? An international study of teachers’ perceptions of objects-first. In proceedings of Seventh Baltic Sea Conference on Computing Education Research, Koli National Park, Koli, Finland. 21 - 30.
Berglund, A. (2005). Learning computer systems in a distributed project course: The what, why, how and where (Uppsala Dissertations from the Faculty of Science and Technology Vol. 62). Uppsala, Sweden: Acta Universitatis Upsaliensis.
Berglund, A. (2006). Phenomenography as a way to research learning in computing. Bulletin of the National Advisory Committee on Computing Qualifications, BACIT, 4(1).
Berglund, A., Daniels, M., & Pears, A. (2006). Qualitative Research Projects in Computing Education Research: An Overview. Australian Computer Science Communications, 28(5), 25 - 34.
Berglund, A., & Lister, R. (2007). Debating the OO debate: Where is the problem? In proceedings of Seventh Baltic Sea Conference on Computing Education Research, Koli National Park, Finland. 171 -174.
Biggs, J. B. (2003). Teaching for quality learning university. Buckingham: Open University Press/Society for Research into Higher Education. (Second edition)
Booth, S. (2001). Learning to program as entering the datalogical culture: A phenomenographic exploration. In 9th European Conference for Research on Learning and Instruction (EARLI), 28th August–1st September 2001, in Fribourg, Switzerland.
Bowden, J. & Marton, F. (1998) The University of Learning: Beyond Quality and Competence in Higher Education. London: Kogan Page.
Boyer, E. (1997). Scholarship Reconsidered: Priorities the Professoriate). Hillsdale, NJ, USA.: Jossey-Bass.
CRPIT Volume 103 - Computing Education 2010
42

Bruce, Kim. Controversy on how to teach CS 1: a discussion on the SIGCSE-members mailing list ACM SIGCSE Bulletin. Volume 37, Issue 2 (June 2005) 111-117.
Butler, M. Morgan, M. (2007) Learning challenges faced by novice programming students studying high level and low feedback. Proceedings of the Conference of the Australasian Society for Computers in Learning in Tertiary Education (ASCiLiTE). Singapore, December 2-5. http:// www.ascilite.org.au/conferences/singapore07/procs/procs/butler.pdf [Accessed September 2008]
Cohen, L., Manion, L., & Morrison, K. (2000). Research Methods in Education (5th Edition)). London, UK: Routledge Falmer.
Denning, P. (2008) The Computing Field: Structure. In Wah, B. W. (Ed.) (2008) Wiley Encyclopedia of Computer Science and Engineering. Wiley-Interscience
Dunkin, M (1990): The induction of academic staff to a university: processes and products. Higher Education 20:47-66.
Eckerdal, A. and Thuné, M. 2005. Novice Java programmers' conceptions of "object" and "class", and variation theory. In Proceedings of the 10th Annual SIGCSE Conference on innovation and Technology in Computer Science Education (Caparica, Portugal, June 27 - 29, 2005). ITiCSE '05. ACM, New York, NY, 89-93.
Entwistle, N. (1998). Motivation and approaches to learning: Motivating and conceptions of teaching. In B. Brown, S. Armstrong & G. Thompson (Eds.), Motivating students (pp. 15-24). Lodon, UK: Kogan Page.
Fincher, S, and Petre, M. (2004) Computer Science Education Research, Taylor & Francis.
Fox, D (1983): Personal Theories of Teaching. Studies in Higher Education, 8(2):151-163.
Grandell, L., Peltomaki, M., Back, R.-J. and Salakoski, T. (2006). Why Complicate Things? Introducing Programming in High School Using Python. In Proc. Eighth Australasian Computing Education Conference (ACE2006), Hobart, Australia. CRPIT, 52. Tolhurst, D. and Mann, S., Eds. ACS. 71-80.
Gries, D. (2008). A principled approach to teaching OO first. In Proceedings of the 39th SIGCSE Technical Symposium on Computer Science Education (Portland, OR, USA, March 12 - 15, 2008). SIGCSE '08. ACM, New York, NY, 31-35.
Hansen, S. and Eddy, E. 2007. Engagement and frustration in programming projects. SIGCSE Bull. 39, 1 (Mar. 2007), 271-275.
Hitchens, M. and Lister, R. (2009). A Focus Group Study of Student Attitudes to Lectures. In Proc. Eleventh Australasian Computing Education Conference (ACE 2009), Wellington, New
Zealand. CRPIT, 95. Hamilton, M. and Clear, T., Eds. ACS. 93-100.
Kansanen, P. (1999). Teaching as Teaching-Studying-Learning Interaction. Scandinavian Journal of Educational Research, 43(1), 81 - 89.
Kansanen, P., & Meri, M. (1999). The Didactic relation in the teaching-studying-learning process. In TNTEE Publications (Vol. 2, pp. 107 - 116).
Kember, D. (1997). A reconceptualisation of the research into university academics' conceptions of teaching. Learning and instruction, 7(3), 255 - 275.
Kinnunen, P. (forthcoming). The instructional process in an introductory programming course from students', teachers', and organizations' point of view - the system theoretical approach to the higher education at Helsinki University of Technology (prel.. title) (PhD theses in Computer Science). Espoo, Finland: Helsinki University of Technology.
Kinnunen, P., McCartney, R., Murphy, C., & Thomas, L. (2007). Through the eyes of instructors: a phenomenographic investigation of student success. In proceedings of The Third International Computing Education Research Workshop, ICER, Atlanta, GA, USA. 61 - 72.
Kolikant, Y. B-D. (2005). Students' alternative standards for correctness. In proceedings of ICER '05: Proceedings of the 2005 international workshop on Computing education research, Seattle, WA, USA. 37–43.
Kölling, M., Koch, B., and Rosenberg, J. (1995) Requirements for a first year object-oriented teaching language. In proceedings of the twenty-sixth SIGCSE technical symposium on Computer science education, Nashville, Tennessee, USA. pp. 173-177.
Kölling, M. (2007). I object. From http://www.bluej.org /mrt/docs/objection.pdf
Kölling, M., Quig, B., Patterson, A., & Rosenberg, J. (2003). The BlueJ System and its Pedagogy Computer Science Education, 13(4), 240 - 268.
Liberman, N., Ben-David Kolikant, Y., and Beeri, C. (2009) In-service teachers learning of a new paradigm: a case study. In Proceedings of the Fifth international Workshop on Computing Education Research Workshop (Berkeley, CA, USA, August 10-11, pp. 43-50.
Lister, R., Berglund, A., Clear, T., Bergin, J., Garvin-Doxas, K., Hanks, B., et al. (2006). Research Perspectives on the Objects-Early Debate. SIGCSE Bulletin Inroads, 38(4), 173 - 192.
Lister, R., Berglund, A., Box, I., Cope, C., Pears, A., Avram, C., et al. (2007). Differing Ways that Computing Academics Understand Teaching. Australian Computer Science Communications, 29(5), 97-106.
Ma, L., Ferguson, J., Roper, M., and Wood, M. (2007). Investigating the viability of mental models held
Proc. 12th Australasian Computing Education Conference (ACE 2010), Brisbane, Australia
43

by novice programmers. In Proceedings of the 38th SIGCSE Technical Symposium on Computer Science Education (Covington, Kentucky, USA, March 07 - 11, 2007). SIGCSE '07. ACM, New York, NY, 499-503.
Marton, F., & Booth, S. (1997). Learning and awareness. Mahwah, New Jersey, USA: Lawrence Erlbaum Associates.
Northedge, A (1976): Examining our implicit analogies for learning processes. Programmed Learning and Educational Technology 13(4):67-78.
Pears, A., Berglund, A., Eckerdal, A., East, P., Kinnunen, P., Malmi, L., et al. (2007). What’s the Problem? Teacher’s experience of student learning. In proceedings of 7th Baltic Sea Conference on Computing Education Research, Koli Calling, Koli, Joensuu, Finland. 207-211.
Ramsden, P. (2003). Learning to teach in higher education 2nd ed.). London, UK; New York, NY, USA: Routledge.
Robins, A., Rountree, J., & Rountree, N. (2003). Learning and teaching programming: A review and discussion. Computer Science Education 13(2), 137 - 172.
Rowland, S. (2000) The enquiring university teacher. Buckingham: SRHE and Open University Press.
Ryan, R., & Deci, E. (2000). Intrinsic and Extrinsic Motivations: Classic Definitions and New Directions. Contemporary Educational Psychology, 25(1), 54 - 67.
Salili, F., Chiu, C., & Hong, Y. (Eds.). (2001). Student Motivation: The Culture and Context of Learning. New York, MY, USA: Kluwer Academic.
Samuelowicz, K, & Bain, J (1992): Conceptions of teaching held by academic teachers. Higher Education, 24:93-111.
Shulman, L. S. (1987) Knowledge and Teaching: Foundations of the New Reform. Harvard Educational Review, 57:1(Feb) pp. 1-22. Also included in Shulman ( 2004), as chapter 5 (same title), pp. 83-.113
Shulman, L. (1989) Towards a Pedagogy of Substance, AAHE Bulletin, 41(10) pp. 8-13. Also included in Shulman ( 2004), as chapter 7 (same title), pp. 127-138.
Shulman, L. S. (2004) Teaching as community property: essays on higher education. San Francisco: Jossey-Bass, 2004.
SIGCSE. (2004a). SIGCSE-MEMBERS Archives March 2004, Week 3. Retrieved February, 2008, from http://listserv.acm.org/scripts/wa.exe?A1=ind0403c&L=SIGCSE-members
SIGCSE. (2004b). SIGCSE-MEMBERS Archives March 2004, Week 4. Retrieved February, 2008, from http://listserv.acm.org/scripts/wa.exe?A1=ind0403d&L=SIGCSE-members
Simon. (2007a). A classification of recent Australasian computing education publications. Computer Science Education, 17(3), 155 - 169.
Simon. (2007b). Koli Calling comes of age: an analysis. In proceedings of Seventh Baltic Sea Conference on Computing Education Research (Koli Calling), Koli National Park, Finland. 119 - 126
Simon, S., Carbone, A., de Raadt, M., Lister, R., Hamilton, M., and Sheard, J. 2008. Classifying computing education papers: process and results. In Proceeding of the Fourth international Workshop on Computing Education Research (Sydney, Australia, September 06 - 07, 2008). ICER '08. ACM, New York, NY, 161-172.
Stasko, J and Hundhausen, C. (2004) Algorithm Visualization. Chapter 17 in Fincher and Petre (2004).
Tew, A. E., McCracken, M., & Guzdial, M. (2005). Impact of Alternative Introductory Courses on Programming Concept Understanding. In proceedings of 2005 international workshop on Computing education research Seattle, WA, USA. 25 - 35.
Trigwell, K., Prosser, M., Martin, E., & Ramsden, P. (2005). University teachers' experiences of change in their understanding of the subject matter they have taught. Teaching in Higher Education, 10(2), 251-264.
Valentine, D. (2004). CS educational research: a meta-analysis of SIGCSE technical symposium proceedings In proceedings of the 35th SIGCSE technical symposium on Computer science education Norfolk, Virginia, USA 255-259
Wenger, E. (1998). Communities of Practice. Learning, Meaning, and Identity). Cambridge, UK: Cambridge University Press.
CRPIT Volume 103 - Computing Education 2010
44
An experience report on using collaboration technologies for distance and on-campus learning*
David Carrington, Soon-Kyeong Kim and Paul Strooper School of Information Technology and Electrical Engineering
The University of Queensland Brisbane, 4072, Queensland
{davec,soon,pstroop}@itee.uq.edu.au
Abstract This paper summarises our experiences and observations using two online collaboration technologies, Blackboard and Wimba Live Classroom, while teaching Software Engineering courses. Blackboard is used to make announcements and course materials available. The Wiki facility of Blackboard is used to update information about software tools used in the course. In addition to the text chat and record feature in Blackboard, Wimba Live Classroom is used for audio chatting with application sharing and the whiteboard facility, and also to record lectures. Blended learning, which combines traditional face-to-face teaching with online methods, can improve the quality, convenience and flexibility of communication for participants and student satisfaction. This paper reports our experiences using Blackboard and Wimba in a blended-learning environment and presents our suggestions for using collaboration technologies in teaching. . Keywords: Software Engineering Education, Blended Learning, Collaboration Technology.
1 Introduction The motivation for using online collaboration in teaching is to:
• improve the quality and convenience of communication for participants who are not collocated,
• share experiences between the different cohorts of students, and
• achieve economies of scale. The challenge is to use the technology to enhance the
educational experience without overwhelming either the teacher or the students.
This paper reports our experiences using online collaboration systems with distance learning in the context of the Master of Engineering (Software Engineering) at the University of Queensland (UQ). The paper evaluates our use of online collaboration systems * This research is funded by a UQ Teaching and Learning Strategic Fund Grant: evaluating factors for success combining distance education and collaboration technologies. Copyright © 2010, Australian Computer Society, Inc. This paper appeared at the Twelfth Australasian Computing Education Conference (ACE2010), Brisbane, Australia, January 2010. Conferences in Research and Practice in Information Technology, Vol. 103. Tony Clear and John Hamer, Eds. Reproduction for academic, not-for-profit purposes permitted provided this text is included.
within this program and identifies some ways to use online collaboration to the benefit of the program’s participants (both teachers and students).
Education is enhanced by communication, and compared to face-to-face teaching, distance education typically reduces the amount and quality of communication between teacher and learners, and between the learners themselves. By improving the quality and convenience of communication, we expect that student satisfaction will improve, which in turn is likely to lead to better student outcomes and increased student success. Attrition in distance education is a well-known problem that is expected to be reduced by improving the flexibility and quality of communication. Benefits of our approach combining distance education and collaboration technologies include:
• Synchronous bi-directional text/audio that works even on dial-up internet connections, or using traditional phone systems (for audio).
• An interactive whiteboard supporting drawing and highlighting.
• Ability to share programs executing on any participant’s desktop.
• Break-out “rooms” to enable small group work. • Video quality that is adjustable to available
bandwidth. • On-the-fly survey and quiz development. • Ability to record sessions for later playback. Two different collaboration technologies, Blackboard
(Blackboard 2009) and Wimba Live Classroom (Wimba 2009) were used in one of the Software Engineering courses offered at UQ. Blended learning (Graham 2005), which combines traditional face-to-face teaching with online methods, should improve communication between instructor and students (Schwartzman and Tuttle 2002), and students’ learning experiences (Cameron 2003, Riffell and Sibley 2003, and Schweizer et al. 2003).
The structure of the rest of this paper is as follows. Section 2 summarises the background to our work, and the collaboration technologies used and their features. Section 3 reports our experiences and observations using these collaboration technologies and provides suggestions for using these technologies in teaching. It also discusses our evaluation results. Section 4 reviews related work and Section 5 summarises our work.
2 Background
2.1 Context The University of Queensland has entered into a partnership with Carnegie Mellon University (CMU) to
Proc. 12th Australasian Computing Education Conference (ACE 2010), Brisbane, Australia
45

offer courses from their Master of Engineering (Software Engineering) through distance learning, enabling industry professionals to complete the program off-campus. CMU’s Models of Software Systems course (Models) was offered for the first time at UQ in Semester 1, 2008. A version of the course is available to post-graduate students enrolled in either the Master of Engineering or the Master of Science programs. The course is also available to honours students in the Bachelor of Information Technology and final-year Bachelor of Engineering students. Both courses are available to on-campus (internal) students and the post-graduate course is also available to external students. In 2008, the course attracted 17 students: 15 internal and 2 external.
The course covers a number of formalisms (e.g. Logic, FSP, Z, State machines, and UML) for modelling software systems and reasoning about those models. These formalisms are discussed and explored, so that students can choose an appropriate formalism for a particular system and context, model the system, and demonstrate that the model satisfies certain properties.
Several software tools are used in the course to create and check models. For example, Latex is used for preparing homework assignments. LTSA is used to write and analyse FSP models. CZT and Fuzz are used to write and analyse Z models. We used the application-sharing feature of Wimba Live Classroom to demonstrate some of these software tools during live chat sessions. Assessment in the course includes 13 weekly homework assignments, three small group projects, and the final exam.
Courses at UQ are taught over 13 weeks followed by a one-week study period and a two-week exam period. Unlike most other courses offered at UQ, the Models course has no scheduled lectures. Instead, recordings of lectures conducted by faculty and staff from the School of Computer Science at CMU are distributed on DVD. The primary live teaching activities are tutorial sessions. For internal students, the class is scheduled to meet for one two-hour session per week. This session is mainly used in “tutorial-mode” to deal with feedback and issues related to the homework assignments that have been completed by the students in the previous week as well as any other issues raised by the students (for example, questions about the tools, the next homework assignment, the group projects, etc.). For external students, the course is scheduled to meet in two one-hour chat sessions per week. Any significant issues raised during the tutorials with the internal students are discussed during the chat sessions, as well as any specific issues raised by the external students.
2.2 Collaboration technologies used Two different collaboration technologies were used for teaching and learning activities. Table 1 shows the collaboration technologies and their use in different learning modes.
Collaboration Technologies
Synchronous Learning mode
Asynchronous Learning mode
Blackboard
• Tutorial chat sessions using text chat and whiteboard
• Announcements and bulletin boards
• Course materials • Wiki pages • Group pages
Wimba classroom
• Tutorial chat sessions using audio and text chat (with video available, but not heavily used), whiteboard, and application sharing
• Recording of special and guest lectures
Table 1: Collaboration technologies used
Blackboard was used to make course materials and announcements available (see Figure 1). The Wiki facility of Blackboard was used for software tools used in the course (see Figure 2). Initially, the chat sessions were run using the chat facility of Blackboard (see Figure 3), but when Wimba Live Classroom (Wimba) became available in the second half of the semester, it was used instead because of the advantage of live audio, as well as text chat and whiteboard facilities. We also used Wimba to record a guest lecture and a special presentation by the course instructor (see Figure 4).
3 Experiences and Observations Table 2 summarises our experiences using the two collaboration technologies. Blackboard provides a framework to update course materials, announcements, and Wiki pages. We found that Wiki pages are effective for updating information about software tools used in the course (see Figure 2). Recording lectures with video using Wimba provides great flexibility and convenience for students to catch up with sessions that they have missed, or to review and strengthen their comprehension of the course content (see Figure 4).
Recently some courses offered at UQ have been using Lectopia (Lectopia 2009) to record lectures for later playback. Lectopia records audio and screen capture of the in-room data projector. This can be used with a computer, a visualiser or the centralised video replay centre. In contrast, Wimba Live classroom provides an interactive virtual classroom environment with features such as video of the presenter or of a student, audio, application sharing, whiteboard and content display.
Live chat sessions enable communication for participants who are not collocated. Students can ask questions on homework assignments and receive feedback on their own work via the chat sessions as if they were meeting face-to-face. Instructors can ensure students’ understanding by asking for immediate feedback, answering their questions, and giving in-depth verbal explanations of complex materials (with audio chatting). Students also communicate with their co-learners as if they were in the same classroom. These chat sessions can be recorded for replay by students who were not available for the live chat, or by students wishing to review the discussion.
CRPIT Volume 103 - Computing Education 2010
46

Figure 1: Blackboard screen example
Figure 2: Blackboard wiki screen example
Proc. 12th Australasian Computing Education Conference (ACE 2010), Brisbane, Australia
47

Figure 3: Blackboard text chatting example
Figure 4: Wimba lecture recording example
CRPIT Volume 103 - Computing Education 2010
48

Collaboration Technologies Positive Negative
Blackboard
• Easy to review and search text chat recordings
• Text chatting allows simultaneous questions and parallel discussion threads
• User interface is cumbersome for advanced users
• Drawing diagrams or writing mathematical expressions on the whiteboard is difficult
• The whiteboard is only recorded via the “Snapshot” feature
Wimba classroom
• Application sharing is effective
• Audio chat sessions are more effective than text chat sessions
• Whiteboard content is captured dynamically and automatically
• Searching recordings of audio chats is difficult
• Wimba and Internet connection required to replay lectures and chats (the audio can be transformed to podcast format)
• Drawing diagrams or writing mathematical expressions on the whiteboard is difficult
Table 2: Positives and negatives
3.1 Text vs. Audio chatting During the semester, data was collected and analysed for students' participation in the tutorials and chat sessions. Based on our experiences and the data collected from the chat sessions, we compare the chatting facilities of the two collaboration technologies.
We found that it is easy to review and search recordings of text chats using Blackboard. Text chatting also allows simultaneous questions and parallel discussion threads. However, the user interface of the text chatting facility of Blackboard was cumbersome for advanced users, and its whiteboard was only recorded via a “Snapshot” feature that has to be invoked manually.
By comparison, we found that audio chatting with Wimba classroom is more effective for communication. It also has a text chatting facility. Collected data shows that the average duration of audio chat sessions was much shorter than that of text chat sessions (65 mins for text chat sessions and 31 mins for audio chat sessions). Also fewer questions were asked during the audio chat sessions with the same number of students participating on similar topics. The ability to give in-depth verbal explanations of complex materials with advanced features such as application sharing and dynamic capture of whiteboard content is another positive aspect of the audio chatting. However, recorded audio sessions are difficult to search, and students need Wimba and an Internet connection to replay lectures and chat sessions, although it is possible to transform the audio of Wimba’s recorded sessions into podcast format.
It is difficult to draw diagrams or to write mathematical expressions on the whiteboard for both collaboration tools (see Figure 5).
3.2 Evaluations Since the opportunity to compare Blackboard and Wimba only became possible during the running of the 2008 offering of this course, we had not systematically planned a before-and-after evaluation. Instead we chose to focus on student perceptions of the approaches. A survey on the
collaboration technologies and software tools used in the course was conducted at the end of the semester. An online questionnaire was prepared covering three themes, such as enabling collaboration/interaction, course learning objectives and working with the technology using the Participant Perception Indicator (PPI) evaluation method (University of Michigan 2009). Twelve of the seventeen enrolled students responded anonymously by rating their responses on a scale of 1 (Low) to 5 (High) for each question.
The survey on communication and collaboration technologies showed that students:
• have a high-level of knowledge, experience and confidence in communicating with the instructor during tutorial sessions including live chat sessions,
• are confident about using the collaboration technologies to support their learning, and
• rely largely on the technologies that have enabled collaboration and interaction.
In addition to the PPI questionnaire, the course was evaluated via the standard UQ TEVAL (Teaching Evaluation) questionnaire administered anonymously to the students in the last week of lectures (or via mail for the external students). The survey on the course and teaching also reveals that student satisfaction is high and the collaboration technologies helped the students to achieve their goals from the course. The rating in response to the summary question “All things considered, how would you rate this staff member’s effectiveness as a university teacher?” was 4.64 on a 5-point scale. Written comments on the questionnaires were generally positive, but a few students commented on the heavy workload and one commented that the marking was too strict. Because our evaluations were both anonymous and the number of external students so few (2), it was not possible to investigate differences in performance or perception between on-campus and external students.
3.3 Suggestions Our suggestions for using these collaboration technologies are: 1. Allow time to resolve technical issues with using
Internet connections and the collaboration technologies prior to their use.
2. Audio chatting is effective for a single discussion thread, but text chatting is easier for tracking or controlling parallel discussion threads.
3. Recorded text chats are easier to review or search than recorded audio chat sessions.
4. Application sharing with Wimba is effective, but requires some practice.
5. It is difficult to draw diagrams or write mathematical expressions on an electronic whiteboard without a graphics tablet.
6. Video is a nice feature but not essential, and can cause bandwidth problems.
7. Avoid using wireless connections unless they are known to be reliable.
Proc. 12th Australasian Computing Education Conference (ACE 2010), Brisbane, Australia
49

Figure 5: Wimba screen with whiteboard
4 Related work There is a growing body of research in the areas of distance learning and blended learning with online technologies. Wrubel et al. (2009) provide a research foundation for a virtual classroom environment. They discuss different dimensions of teaching models (e.g. asynchronous, synchronous, virtual and physical) and how e-Learning can affect student learning.
Graham (2005) and Heinze and Proctor (2004) give a good overview of blended learning and discuss the general benefits of blended learning with on-line collaboration technologies. Schwartzman and Tuttle (2002), and Schweizer et al. (2003) show that blended learning improves interaction between instructor and students, and collaboration between students. Cameron (2003) reports that blended learning improves students’ motivation for learning. Twigg (2003) presents information on the effectiveness of blended learning.
It has been pointed out that a major limitation of distance learning technologies is lack of interactivity (Jonassen et al. 1995 and Sherry 1996). Distance learning will be more effective when it takes place in stimulating learning environments designed to engage students (Jonassen et al.1995).
Belanger and Jordan (2000) introduce six distance-learning technologies (computer-based training, videotape, computer-aided instruction, web-based training, teleconferencing, and video tele-training), and discuss the advantages and disadvantages of each technology for learners, instructors, and institutions.
Jonassen et al. (1995) suggest that computer-mediated communication (especially computer conferencing), computer-supported intentional learning environments, and computer-supported collaborative work environments should support constructive learning.
Several case studies have reported using different collaboration technologies in education. For example, Sonnenwald et al. (1999) use several collaboration technologies (e.g. MBone for integrated synchronous audio- and video-conferencing, and Microsoft NetMeeting for electronic whiteboard and shared application tools) to provide university students in different countries with opportunities to participate in interactive class exercises and discussions, and to collaborate on class assignments. Rhode (2009) and Roberts et al. (2007) present the use of Wimba Classroom at Northern Illinois University and the University of Southern Mississippi in the United States respectively. Maneira et al. (2009) use Wimba Live Classroom in high-school education. These case studies report mostly positive results of using the on-line collaboration technologies in their education, such as improving communication quality and student learning. However, it is claimed that to realise benefits from the technology and effectively compensate for the limitations of the technology, students should be taught principles of collaboration, including accountability, trust management, commitment, respect, tolerance and appreciation of differences, adaptability, knowledge
CRPIT Volume 103 - Computing Education 2010
50

sharing and interpersonal communication skills (Sonnenwald et al. 1999).
5 Summary This paper presents an informal evaluation of online collaboration software in the context of a Software Engineering course with both internal and external students. Combining face-to-face and online learning methods improves the amount and quality of communication between instructor and students for distance learning, and enhances the convenience and flexibility of the communication in general. Student satisfaction from the course was high and the collaboration technologies helped the students to achieve their goals from the course.
Wimba provided some immediate advantages for external students but it needs a more effective way to view/search recordings. There are limited benefits for internal students so far (they can join chat sessions and view recording of lectures and/or chats). We are currently investigating how to improve these limitations.
6 Acknowledgements We wish to thank Greta Kelly from the University of Queensland’s Teaching and Educational Development Institute (TEDI) for her guidance and advice on evaluation. We are also grateful to Jon Edwards from TEDI for his help with the Participant Perception Indicator (PPI) evaluation method.
7 References Belanger, F. & Jordan, D. H. (2000). Evaluation and
implementation of distance learning: Technologies, tools and techniques. Hershey, PA: Idea Group.
Blackboard (2009): Blackboard Inc.http://www.blackboard.com/. Accessed 13 August 2009.
Cameron, B. (2003). The effectiveness of simulation in a hybrid and online networking course. TechTrends, 47(5), 18-21.
Graham, C. R. (2005): Blended learning systems: Definition, current trends, and future directions, In Bonk, C. J. and Graham, C. R. Handbook of blended learning: Global perspectives, local designs, San Francisco, CA: Pfeiffer. pp. 3-21.
Heinze, A. and Procter, C. (2004): Reflections on the Use of Blended Learning, Education in a ford, Education Changing Environment conference proceedings, University of Salford, SalDevelopment Unit http://www.ece.salford.ac.uk/proceedings/papers/ah04.rtf, pp. 1-2.
Jonassen, D. Davidson, M. Collins, M. Campbell, J (1995). Constructivism and Computer-Mediated Communication in Distance Education, American journal of distance education, 9(2), 7-26.
Lectopia (2009): Anystream Australia Pty Ltd. http://www.lectopia.com.au/. Accessed 13 August 2009.
Maneira, M.J.P., Ribeiroand, P. and Maneira, A. (2009): Blended Learning project with Applied Optics, Case
study, http://dspace.fct.unl.pt/dspace/bitstream/10362/760/1/blended_oa_07.pdf. Accessed 13 August 2009.
Rhode, J. (2009): Use of Wimba Classroom, http://www.slideshare.net/jrhode/wimbaclassroom-at-niu-presentation. Accessed 13 August 2009.
Riffell, S.K. and Sibley, D.F. (2003): Using web-based instruction to improve large undergraduate biology courses: An evaluation of a hybrid course format. Journal of College Science Teaching, 44(3), 217-235.
Roberts, J., McNeese, M. and Thornton, A. (2007): Pilot Use of Wimba Classroom at USM, http://www.slideshare.net/ahornton/a-research-study-on-the-use-of-wimba-classroom. Accessed 13 August 2009.
Schwartzman, R. and Tuttle, H.V. (2002): What can online course components teach about instruction and learning?, Journal of Instructional Psychology, 29(3), 179-188.
Schweizer, K., Paechter, M. and Weidenmann, B. (2003). Blended learning as a strategy to improve collaborative task performance. Journal of Educational Media, 28(2-3), 211-224.
Sherry, L. (1996). Issues in Distance Learning. International Journal of Educational Telecommunications, 1(4), 337-365.
Sonnenwald, D. H., Iivonen M. Api J. and Kokkinen H. (1999). Collaborative Learning Using Collaboration Technology: Report from the Field, Integrating Information and Communications Technology to Higher Education, pp. 241-258. Kluwer Publishers.
Twigg, C. (2003): Improving learning and reducing costs: New models for online learning. Education Review, 28-38.
University of Michigan (2009): Participant Perception Indicator (PPI), http://sitemaker.umich.edu/ppi.evaluation.tool/home. Accessed 13 August 2009.
Wimba (2009): Wimba Inc. http://www.wimba.com/. Accessed 13 August 2009.
Wrubel, J., White, D. and Allen, J. (2009): High-Fidelity e-Learning: SEI’s Virtual Training Environment (VTE), TECHNICAL REPORT, CMU/SEI-2009-TR-005, Software Engineering Institute, Carnegie Mellon University.
Proc. 12th Australasian Computing Education Conference (ACE 2010), Brisbane, Australia
51

CRPIT Volume 103 - Computing Education 2010
52

Study Habits of CS 1 Students: What do they do outside the
classroom?
Donald Chinn Institute of Technology
University of Washington, Tacoma
Tacoma, WA, USA 98402
Judy Sheard Faculty of Information Technology
Monash University
Victoria, Australia
Angela Carbone Faculty of Information Technology
Monash University
Victoria, Australia
Mikko-Jussi Laakso Department of Information Technology and
Turku Centre for Computer Science (TUCS)
University of Turku, Finland
Abstract
In this paper, we report the results of a survey of the study habits of CS1 students. In this survey, students were
asked how much time they spent on course-related
activities such as reading the textbook, working on
problems outside class, using online learning tools, and
consulting with their instructor. We identified factors that
influenced student study habits and how those factors
affected students’ final course score. The findings show
that students engaged in a wide range of study behaviours
in terms of time spent and use of resources. Previous programming experience and lecture attendance were
positive factors to final course score, and a tendency to
work with others was a negative factor. We found no
difference in final course score based on gender; however,
females tended to read the textbook more than males and
they tended to work with others more than males. .
Keywords: Study habits, gender, factors of success.
1 Introduction
Practicing educators often design individual courses with the profile of an “average” student in mind and then teach
to that kind of student (or, perhaps, one who is a bit better
prepared than the “average” student). While this kind of
reflection on teaching practice represents a good first step
towards designing educational environments that
maximise learning, it ignores the variation of individual differences amongst students. For example, the exposition
of a topic or idea using visualisation might be helpful to
some, or even many, students, but be less helpful to
others. As another example, exposition through numerous
concrete examples might be helpful to some and not so
much to others. Indeed, using a conception of an
“average” student as the basis for course design will
almost certainly be inadequate for a large number of
Copyright © 2010, Australian Computer Society, Inc. This paper appeared at the Twelfth Australasian Computing Education Conference (ACE2010), Brisbane, Australia, January 2010. Conferences in Research and Practice in Information
Technology (CRPIT), Vol. 103. Tony Clear and John Hamer, Eds. Reproduction for academic, not-for-profit purposes permitted provided this text is included.
students because very few students have all of the
characteristics of such a profile. Instead, a course design that takes into account the
different ways students learn and the way knowledge can
be conveyed to facilitate learning is more likely to
achieve maximum learning, not just for the best or
poorest students or the students who fit the “average”
profile, but for all students in the course.
Even if it is the case that the majority of instructors
design their courses with knowledge of the course
material and some general knowledge of how students
learn, it is unlikely that instructors know what students
actually do to achieve mastery of the course. To
understand how students learn, instructors might reflect on their own and colleagues' experiences as university
students and the anecdotes of their own and colleagues'
students today. Reflection on one's own and colleagues'
experiences as students is faulty for three reasons: (1)
memory fades and is inaccurate, (2) the experiences of
university professors does not fairly represent the range
of student experiences (university professors tend to be at
the top of their class), and (3) the experiences and study
habits of even the best students in today's classroom
might be different from those of a generation or two ago.
Anecdotes from one's own students or second-hand accounts through colleagues are troublesome as a basis
for course design, as they tend to represent extreme
situations.
A significant amount of learning happens outside the
classroom; the standard advice to students is two hours of
outside study for every hour in class. Courses are
designed with an expectation of what the students will do
outside the classroom, and if the goal of course design is
to maximise learning, then knowledge of what students
are actually doing in that out-of-classroom time is critical
to such a design. The goal, then, of our work is to discover the range
and variation of CS 1 students' academic life by asking
them about their study habits and experiences. This
information can be used to design a combination of
educational experiences where maximum learning can
occur (again, not just for the “best”, “poorest” or
“average” students, but for all students).
Proc. 12th Australasian Computing Education Conference (ACE 2010), Brisbane, Australia
53

In this study, we focus on gaining understanding of:
(1) how much time students spend on their studies, (2)
what activities they work on, (3) what resources they use,
(4) what resources they perceive as valuable, and (5) how
these influence their final result.
2 Previous Work There have been numerous studies which aimed to
identify factors that are correlated to success in learning
programming.
One line of research involves using quantitative methods to identify student characteristics before entering
CS 1 that are predictors of performance. Hagan and
Markham (2000) reported that in an introductory
programming course, students with prior programming
experience performed significantly better than novices.
Goold and Rimmer (2000) reported that gender,
secondary school performance, and dislike of
programming were predictors of performance in an
introductory programming course. Wilson (2001) found
that comfort level, mathematics background, and
attribution to luck for success/failure were predictors of performance. Wilson also found that formal training in
programming was positively correlated and computer
game playing was negatively correlated with
performance. Bergen and Reilly (2005) examined 15
factors across a variety of dimensions and found that
gender, score on a high school math and science exit
exam, perceived understanding of the material, and
comfort level were strongly correlated with performance
in CS 1. Sheard et al. (2008) found that students with
prior programming knowledge, whose first language was
English, or who entered the program directly from high school performed better in programming, whereas a
student’s interests or expectations of the degree program
had little predictive power for performance. Females were
more likely to drop technical courses in the first year than
males.
Other studies have investigated teaching and learning
approaches in relation to success in learning
programming. For example, Bennedsen and Caspersen
(2005) report that when using an objects-first approach to
CS 1, grades on the assignments and mathematics ability
(as measured by a high school exam) were predictors of
the final grade, whereas gender and intended major were uncorrelated with final grade. Simon et al. (2006)
examined a different set of factors related to learning
processes. They found that deep learning approaches of
students were positively correlated with performance,
whereas surface learning approaches were negatively
correlated. Spatial visualisation skills, “a progression of
map drawing styles,” and the ability to articulate search
strategy are positively correlated with performance.
Kinnunen et al. (2007) conducted a
phenomenographical study of what teachers think are
success factors for CS 1 students, confirming much of what the quantitative studies have found.
Another line of research looks specifically at the
relationship between gender and retention in computer
science programs. Bunderson and Christensen (1995)
report that lack of previous experience was a key factor
for much of the female attrition, in addition to gender-
based attitudes and biases, their interactions with other
computer science students, and the nature of computer
science as a discipline. More recently, Lang et al. (2007)
examined seven factors that affect success and found that
no one factor was dominant in its effect on retention, but
some combinations of factors were. For example, a
critical mass of female students, the presence of a female role model in academic staff, when combined with an
academic staff member who had no formal education
qualifications, had a negative impact on the learning
environment for all students and a greater than average
fail rate for female students.
In research on non-majors and programming, Taylor
and Mounfield (1994), in an introductory programming
course required for business majors but open to all non-
majors, found that prior computing experience matters for
performance for males and females, but especially for
females. Byrne and Lyons (2001), in a first programming
course for humanities students, found that experience in programming and aptitude in mathematics and science
are correlated with performance, whereas gender and
learning style are not. Wiedenbeck (2005), again in a
course for non-majors, found that previous programming
experience, perceived self-efficacy, and knowledge
organization were important factors of success. Gender
seems to be less of a factor in non-major courses.
A different line of research involves gaining
understanding of what students do while studying at the
university in an attempt to understand influences on their
learning. Hanks et al. (2009) collected advice from students about how to succeed in computer science. The
result was a set of general and programming-specific
habits that instructors could provide for their students. In
first-year calculus, Treisman (1992) changed the problem
solving habits of traditionally low-performing students to
ones similar to those of high-performing students to
increase their performance. Nelson (1996), inspired by
Treisman’s work, argues that teaching for a diverse
student population requires teachers to change their
pedagogical methods in fundamental ways. Chinn et al.
(2007) have adapted the methods of Treisman to
computer science in a range of core courses. Pair programming is another pedagogical technique that
directly changes the way students learn. There is a large
body of evidence that indicates it improves performance
of all students, but especially those who would likely
perform poorly if not engaged in pair programming
(Braught et al. 2008).
There is concern that university students of the so-
called Net Generation have study habits that are quite
different from previous generations (Roberts 2005). This
has led to the creation of learning environments that
students might find more appealing and engaging. Specifically, much has been done to create online
environments that support CS 1. For example, Kaila et al.
(2008) have created an online tool that provides formative
and summative feedback to students about their
understanding of CS 1 concepts by having them read
code and answer questions about it, such as what the
value of a variable is after executing some part of the
code. The tool seems to benefit the most students who
have had no prior programming experience.
Our work here focuses on understanding what students
do when they study and what resources they value. This
CRPIT Volume 103 - Computing Education 2010
54

could inform the design of learning environments that
encourage study habits that will lead to success. As a
particular focus we also investigate any differences based
on gender.
3 Study Context
The study investigates study habits of first year novice programming students enrolled in a core first year unit1.
The unit is taught as part of a common core unit across
four Information Technology (IT) degrees.
Students enrolled in the unit attend one 2-hour lecture,
one 1-hour tutorial and one 2-hour laboratory class per
week. The unit is delivered across 13 weeks, and the last
week is reserved for revision. Students attend lectures on
campus. All students are provided with the following set of learning resources via Moodle:
Unit guide. The Unit Guide contains information
about how the unit is administered and details about the
unit structure and assessment.
Lecture notes and audio recording of lecture notes. The lecture notes are presented as PowerPoint
presentations. Each lecture commences with a slide that
highlights the knowledge that the lecturer assumes the
students should have prior to coming to the lecture. The
slides then outline the objective of the session, provide
details of the lesson and conclude with a set of questions
for the students to reflect on. Embedded in the lecture slides are two to three thinking questions.
Lectures are also audio recorded every week. Students
can either download an MP3 file or audio stream the
recording two hours after the end of the lecture.
Summary sheets. Summary sheets consolidate the
key concepts of the week on a single A4 page. Summary
sheets include the purpose of the week’s content, some
key objectives, and the relevant reading. At the end of
each summary sheet, a joke or puzzle is provided to ease
the intensity of the unit.
Tutorial exercises and solutions. A set of tutorial exercises are provided weekly. Tutorials are held in flat
rooms without PCs, yet many students bring their own
laptops. In tutorial classes a tutor facilitates discussion
and group work. These exercises are not assessed but it is
a requirement for students to attend at least ten of the
twelve tutorial sessions. Solutions are released two weeks
after the tutorial class.
Practical exercises and solutions. A set of laboratory
exercises are provided weekly. Laboratory classes are
held in rooms equipped with PCs that run a Java IDE.
Students are encouraged to use jCreator or BlueJ.
Although these lab exercises are not assessed, there is a requirement to attend at least ten of the twelve laboratory
sessions. Solutions are released two weeks after the lab
class.
Assignments. Three assignments were issued, each
worth 10%. The first assignment (week 4) contained a
variety of simple and closed exercises that were intended
to build student confidence to later tackle difficult
exercises requiring more open approaches.
1 “Unit” refers to a single semester program of study. In other contexts, “course” or “subject” may be used.
For the second assignment (week 9) the students were
asked to design a programming solution and were
provided with the opportunity to take control over some
parameters of the task, thereby ‘owning’ or personalising
its relevance to them. The third assignment (week 12), which was the most
challenging, required a high degree of linkage to other
tasks and the theory. It was more conceptually complex
than the first two assignments, requiring students to apply
advanced programming concepts.
Mid-semester test and sample test. A mid-semester
test worth 10% of the unit was held in week 6 of
semester. The test comprised a variety of questions: seven
multiple choice style questions, five questions that
required students to evaluate Boolean expressions, a
question in which students had to identify elements of a
program, a tracing code question, a debugging question, and one code writing question.
ViLLE quizzes. A set of weekly online ViLLE
quizzes (Kaila et al. 2009) that focused on the topic for
the week were provided for the students in a hosted
TRAKLA2 server environment (Laakso et al. 2005).
These web-based quizzes were available to students
outside class hours and were not compulsory. Students
were able to attempt the quizzes as many times as they
liked, and each attempt was graded automatically by the
system, but not counted in their final grades.
4 Study Design
The research team decided to use a survey to capture the data on students’ study habits. The advantage of
surveys is that they are reflective and relatively low-cost
in terms of data collection and analysis. The disadvantage
of surveys is that student memory might be faulty.
Methods that capture the data in real time such as
journaling are not as reliant on memory; however, they
are more intrusive and students may be (subconsciously)
less honest. The students were informed that the instructional staff was not allowed to look at the
responses until after final grades were assigned. The
analysis of data from this survey is reported in Section 5.
The survey responses were also used to inform the design
of an interview protocol for a further data collection. This
data is not reported in this paper. The remainder of this
section describes the participants, survey questionnaire,
and method of data collection used for this study.
4.1 Participants All students enrolled in a first year undergraduate
computer programming unit in semester 1, 2009 were
surveyed using a paper-based questionnaire. There were
166 students enrolled in the unit. The cohort comprised
138 (83%) males and 28 (17%) females.
4.2 Survey questionnaire The survey questionnaire was designed by the project
team. The questionnaire contained closed response
questions (mainly Likert-style) to gain information about the following aspects of students’ study behaviour:
lecture attendance, time spent on learning activities, time
spent consulting and discussing work with others, time
spent using online resources, extent to which students
Proc. 12th Australasian Computing Education Conference (ACE 2010), Brisbane, Australia
55

work individually or with other students, usefulness of
resources, value of resources, amount of learnt about
programming, and expectations of final results in the unit.
See Appendix A for the full text of the survey.
4.3 Method The survey was administered to the introductory
programming students in week 9 of the 13-week
semester. The questionnaires were distributed by team
members to the students in their laboratory classes. It was
decided to distribute the questionnaires to the students in their laboratory classes, as these were better attended than
the lectures.
5 Study habits and perceived learning of
programming In this section we report the analysis of survey data. First
we report the descriptives of the questionnaire responses.
In this analysis we also explore any differences in study
habits based on gender. We then investigate relationships
between students’ final results and their study habits.
5.1 Demographic profile
A total of 96 students responded to this survey and gave permission to use their responses and also their final
semester results. This represented 58% of the 166
students enrolled in this unit. The gender profile of the
respondents was 81% (78) male and 19% (18) female. A
chi-squared test found no difference between the gender
distribution of the respondents and the whole cohort.
5.2 Previous programming experience
Most respondents claimed they did not have much programming experience (73%), with only one
respondent claiming that they had had a lot of experience.
A Mann Whitney U test found no statistically significant
difference in previous experience based on gender.
5.3 Attendance at lectures
Most students (70%) claimed that they had attended most
or all of the lectures (ref Table 1). A Mann Whitney U
test found no statistically significant difference in lecture
attendance based on gender.
Attendance Number of
students
Percentage
All 29 30
Most 37 39
Half 10 10
A few 14 15
None 5 5
Table 1: Attendance at lectures.
5.4 Time spent on study
The students nominated how many hours per week, within ranges, they spent outside of class on unit-related
activities. As the times were given as ranges on the
questionnaire, we used the mid-point of each range in the
calculations of times in our analysis.
5.4.1 Time spent on learning activities
Students indicated that they spent more time each week working through problems (mean = 1.6 hours) rather than
reading the textbook (mean = 1.0 hour) (ref Table 3).
The females indicated that they spent longer reading
the textbook (mean = 1.5 hours) than the males (mean =
0.9 hours) and a comparison using a Mann Whitney U
test indicated that this difference was significant (U =
461.5, p < 0.05). There were no statistically significant
differences based on gender in any of the other activities listed in Table 3.
5.4.2 Time spent consulting or discussing work
with others
The students nominated how long they spent consulting
with teaching staff or discussing their work with their
classmates. Students indicated that the most time was spent discussing work with friends and classmates (ref
Table 4).
The females spent more time (mean = 0.4 hours) than
the males (mean = 0.1 hours) in consulting with a private
tutor and a Mann Whitney U test indicated that this
difference was significant (U = 533, p < 0.05). There
were no statistically significant differences based on
gender in any of the other activities listed in Table 4.
5.4.3 Time spent using online resources
The students nominated how long they spent accessing online resources. Most students indicated that the Internet
was a source of help with 36% of students spending an
hour or more a week accessing the Internet (ref Table 5).
The time students spent accessing the Internet (mean =
1.1 hours) was higher, but not significantly different from
the time spent reading the textbook.
5.4.4 Overall time spent on study
To understand further the time spent on study we calculated the total time students spent on each of the
three broad categories of study related activities (ref
Tables 2, 3, 4, and 5). These times indicate that students
spent almost half their study time in working on problems
and exercises.
Relationships between the times spent on these study
categories were tested using Pearson correlations. These
showed positive relationships for each pair of activities
indicating that students who tended to spend time on
learning activities also spent time using online resources
and on consulting and discussing their work.
Study activity Mean time (hours)
SD
Learning activity 2.6 2.0
Discussion or
consultation 1.2 1.2
Online resource 1.5 1.4
Total time 5.3 3.5
Table 2: Time spent on study related activities.
CRPIT Volume 103 - Computing Education 2010
56

Learning activity Mean hours per week
None <0.5 0.5-1 1-2 2-4 >4
Read the textbook (including working out and thinking
about examples given in the text).
8 23 29 28 9 1
Work through problems from the book (at the end of each
chapter).
50 25 15 7 2 0
Work through problems using ViLLE. 53 24 17 4 2 0
Work through problems you didn't finish in tutorial or lab. 18 29 27 24 3 0
Work through problems from some other source (not the
textbook and not ViLLE and not the lab)
63 17 13 6 0 0
Table 3: Hours per week (on average) spent on learning activities outside of lecture, tutorial, and lab classes.
The values shown are the percentages of students for time ranges within each learning activity.
Discussion or consultation Mean hours per week
None <0.5 0.5-1 1-2 2-4 >4
Talk to friends and/or classmates about the unit material. 5 29 37 24 5 0
Use a private tutor to help you with the unit material. 85 3 6 4 1 0
Visit other instructors during consultation hours. 77 12 9 2 0 0
Visit the lecturer during consultation hours. 83 10 4 3 0 0
Table 4: Hours per week (on average) spent discussing the work with others. The values shown are the
percentages of students for time ranges within each type of consultation.
Online resource Mean hours per week
None <0.5 0.5-1 1-2 2-4 >4
Use the Internet to help you with unit material. 7 26 30 23 9 4
Use the Moodle discussion forum to discuss class material. 51 24 15 9 1 0
Table 5: Hours per week (on average) spent accessing on-line resource. The values shown are the percentages of
students for time ranges within each type of online resource.
5.5 Usefulness of resources The students rated how useful they found resources,
using a 5-point Likert scale, where 1 indicates not useful
and 5 indicates very useful. They also had the option of
nominating never used. The students indicated that resources and activities where they were provided with
solutions were the most useful. (ref Table 6). Most
students stated that the resources provided were sufficient
for their needs (74%). However, the males found the labs
and lab solutions more useful than the females and this
difference was significant according to a Mann Whitney
U test (U = 663, p < 0.05).
Resource Ratings of usefulness
(1 = not useful, 5 = very
useful)
1 2 3 4 5
Labs and lab solutions (n=94)
0 0 7 24 67
Sample exams and solutions (n=80)
1 4 9 22 47
Tutorials and tutorial solutions (n=95)
3 16 14 24 43
Textbook (n=26a) 0 0 27 39 34
Mid-semester test and feedback (n=93)
1 8 28 25 34
Lecture slides (n=94) 2 10 27 43 16
One-page summaries of material (n=72)
6 16 26 17 10
Lecture presentation (n=91)
5 13 27 28 13
Non-lecturer consultation (n=40)
1 8 13 9 8
Lecturer consultation hours (n=36)
2 5 14 12 5
ViLLE quizzes (n=50) 6 8 16 17 5
Discussion forum on Moodle (n=68)
6 13 34 18 2
a Only 31 students were given this question.
Table 6: Ratings of the usefulness of each resource.
The values are the percentages of students for ratings
within each resource.
The students rated how valuable they found the
resources overall, using a 5-point Likert scale, where 1
indicates low value and 5 indicates high value. (ref Table
7). There was no statistically significant difference based
on gender.
Proc. 12th Australasian Computing Education Conference (ACE 2010), Brisbane, Australia
57

Ratings of value
(1 = low value, 5 = high
value)
1 2 3 4 5
Value to learning of
the resources
provided in this unit
2 7 33 25 21
Table 7: Overall value of resources to learning.
5.6 Extent to which students work individually
or with other students
The students nominated the extent to which they worked
individually and/or worked with others. Most students
indicated that they usually or always worked alone (79%)
and 20% worked about half the time with others. Only
one student claimed that he or she worked mostly with others and another claimed that he or she worked always
with others.
The females indicated that they worked more with
others and a Mann Whitney U test indicated that this
difference was significant (U = 577.5, p < 0.05).
5.7 Confidence with programming concepts The students rated how confident they were with
concepts covered in the unit, using a 5-point Likert scale,
where 1 indicates low confidence and 5 indicates high
confidence. (ref Table 8). There was no statistically
significant difference based on gender.
Ratings of confidence
(1 = low, 5 = high)
1 2 3 4 5
Confidence with concepts covered
3 7 34 41 14
Table 8: Overall level of confidence with
programming concepts.
5.8 Expected grade
The students nominated the final grade that they expected
to achieve (ref Table 9). The expected grade was
compared to the actual final grade they achieved using a
Wilcoxon test. The results showed that the students
gained lower final results than they expected (Wilcoxon,
Z = -7.091, p < 0.05). More than two-thirds of the students received a lower grade than expected and only
three students received a higher grade. There were no
statistically significant differences in expected grade and
final results based on gender.
Result Fail Pass Credit Distinct-
ion High
distinction
Expected
(n=95) 2 9 20 40 24
Actual (n=95)
29 18 24 12 12
Table 9: Students’ expected and actual final grades.
5.9 Relationships between students’ final
results and their study habits We now include the students’ final results in the analysis
and investigate, through regression, factors that may have
influenced students’ final results.
To investigate relationships between final result and
students’ study habits, Spearman’s correlation tests were
used. The students’ final results were correlated with
experience, lecture attendance, work style, time spent on
individual learning activities, consulting and discussing
work with others, and using online resources, and their
opinions of the usefulness and value of resources. The items which showed a statistically significant
relationship are presented in Table 10.
Of the five learning activities (ref Table 3) that the
students were questioned on, none showed a relationship
between the final result and the time spent on that
activity. Of the four different consultations or discussions
(ref Table 4), only one showed a relationship with final
results. Surprisingly this was a negative relationship
indicating that students who spent time consulting
instructors other than their lecturer tended to gain lower
final results. Another negative relationship was shown with online resources. Students who spent time accessing
learning resources on the Internet tended to gain lower
final results than those who did not spend as much time
on this activity. Furthermore, students who rated the
tutorials and solutions as useful tended to attain lower
final results as those who did not rate them as useful.
There was a relationship between the extent to which
students worked individually and their final results.
Item Correlation coeff.
Programming experience 0.34
Lecture attendance 0.33
Visit other instructors during
consultation hours -0.27
Use the Internet -0.29
Tendency to work with others -0.34
Tutorials and tutorial solutions -0.25
Table 10: Significant correlation coefficients (all
significant at p ≤ 0.01).
The influence of these variables on the final result was
further investigated through regression analysis. The six items in Table 10 were regressed against final result.
These items produced a model with an R2 of 0.336,
significant at F (6,96) = 6.460 for p < 0.05 with three
significant variables, shown in Table 1.
Item Standardised
Beta t
Significance
(p value)
Prog experience 0.240 2.54 0.013
Lectures 0.305 3.13 0.002
Tendency to
work with others
-0.201 -2.16 0.034
Table 11: Regression analysis results showing factors
which influence students’ results.
CRPIT Volume 103 - Computing Education 2010
58

6 Study Limitations
It is difficult to make generalizations based on a study such as ours for a number of reasons. The data collected
was from one instance of CS 1 at a single institution. The
students who did not respond to the survey did not attend
the lab section, which probably is indicative of study
habits that differ from the survey population.
Furthermore, the activities listed in Tables 2, 3, 4, and
5 might not be the only ones that students engaged in that were of significance. We did not ask, for example, how
much time was spent working on the programming
assignment. The survey had a question that allowed
students to list any other study activity (question 7g), but
perhaps in the context of a filling out a survey, students
were unable to recall such activities. There is also the
issue of whether students can reliably estimate the
average amount of time per week they spend on different
activities.
7 Conclusions and Discussion
Student study habits present a complex picture. Despite the limitations mentioned in Section 6, there are some
patterns that emerge from the analysis reported in Section
5. Up to week 9, when the survey was administered, most
of the students who responded to the questionnaire had
attended most or all of the lectures and lecture attendance
was positively correlated with final results.
Students spent on average 5.3 hours per week on the
activities mentioned in Tables 3, 4, and 5, and individuals
varied widely on how much time they spent on different activities. For example, whereas some students did not
read the textbook at all, one student spent 4 or more hours
per week reading the textbook and working out examples
from the text. Students spent as much time using the
Internet as their textbook. Not able to be determined from
our study however, is how the students used the Internet.
Were they seeking explanations of concepts, code to read
and problems to solve?
Students found several of the unit resources to be
useful. The most useful seemed to be the labs and lab
solutions, sample exams and solutions, tutorials and tutorial solutions, the textbook, and the mid-semester test
and feedback. From our data collection we were not able
to determine why these resources were perceived to be
the most useful to students, however Pea’s (1993) work
suggests that learning is embedded in and augmented by
the cultural tools at hand. Resources are used, or come
together in use, to shape and direct possible activity
emerging from students’ desire to learn.
The vast majority of students reported that they tend to
work alone, but there was a non-trivial minority of
students who reported working as much time by
themselves as with others. This could be explained by the practices embedded in the unit, that is, all assignments
and lab work are to be complete by the individual. As
Rogoff (2003) suggests, human development must be
understood as a cultural process. Individuals develop as
members of a community, and their development can
only be fully understood by examining the practices and
circumstances of their communities.
By the 9th week of the unit, students felt confident
with programming concepts and had high expectations of
their final grade in the unit. However, comparison with
the final results showed that the students did not perform
as well as expected.
The factors that positively correlated with final results
performance were programming experience and lecture attendance, whereas visiting non-lecturer instructors,
using the Internet, working with others, and use of
tutorial and tutorial solutions were negatively correlated.
When these factors were used in regression analysis,
programming experience, lecture attendance, and
working with others were statistically significant.
The literature on factors of success in CS 1 identifies
gender as a predictor of success. It is plausible that
gender is associated with social phenomena that influence
performance. In our study, we discovered that females
differed in some of their study habits from males.
Females tended to spend more time reading the textbook, they were more likely to use a private tutor, and they
tended to work in groups more than males. Of these
factors, only the tendency to work in groups was
statistically significant (and negatively correlated) in our
regression analysis on the entire population.
Although the implications of our findings might be
limited to the particular institution studied here, our work
provides another perspective on the results of the work
mentioned in Section 2. We have confirmed that previous
programming experience is positively correlated to
success. We have also observed that there are gender differences in study habits.
It is somewhat puzzling why, for example, study time
is not a positive factor to final results performance. This
leads to the question of what students are doing when
they are studying. For example, how effectively are
students reading the textbook? As another example, when
students study in groups, how effective is that time spent?
Plant et al. (2005) found that the amount of study only
emerged as a significant predictor of final grade when the
quality of study and previously attained performance
were taken into consideration. Treisman’s work (1992)
and the research on pair programming (Hanks 2005) both indicate that working with others is beneficial, but it is
only beneficial to the extent that the activity is structured
so that the other people in the group act as intellectual
gadflies, demanding justifications for solutions.
Instructors can influence factors such as motivation
and self-efficacy, but they can also influence the way
students study. Our work here indicates that perhaps
developing effective study habits is as important for
students in CS 1 as learning specific content; unit design
should take both into account.
8 Further Work There are several ways to clarify and strengthen the
conclusions from this study. We will administer the
survey to students in semester 2 of 2009 to see if the patterns of responses hold across different groups of CS 1
students. The study will also be replicated in other
institutions. Once a pattern of responses is established, we
could survey students twice in a term to see if their study
habits change. The survey will be modified to further
explore some of the issues raised by the first set of data,
such as distinguishing between, the perceived usefulness
of labs and lab solutions, since they are currently one
Proc. 12th Australasian Computing Education Conference (ACE 2010), Brisbane, Australia
59

item. Interviews with students would help to understand
their study strategies and the rationale for those strategies.
Finally, real-time journaling could be integrated into the
unit to determine whether the survey data on how time
was spent accurately reflect what students actually do.
9 References
Bennedsen, J. and Caspersen, M. (2005): An investigation of potential success factors for an
introductory model-driven programming course. Proc.
of the First International Workshop on Computing
Education Research, Seattle, Washington, USA, 155-
163.
Bergin, S. and Reilly, R. (2005): Programming: factors that influence success. Proc. of the 36th SIGCSE
Technical Symposium on Computer Science Education,
St. Louis, Missouri, USA, 411-415.
Braught, G., Eby, L., and Wahls, T. (2008): The effects of pair-programming on individual programming skill.
Proc. of the 39th SIGCSE Technical Symposium on
Computer Science Education, Portland, Oregon, USA,
200-204.
Bunderson, E. and Christensen, M. (1995): An analysis of retention problems for female students in university
computer science programs. Journal of Research on
Computing in Education, 28(1): 1-18.
Byrne, P. and Lyons, G. (2001): The effect of student
attributes on success in programming. Proc. of the
Sixth Annual Conference on Innovation and
Technology in Computer Science Education,
Canterbury, United Kingdom, 49-52.
Chinn. D., Martin, K., and Spencer, C. (2007): Treisman
workshops and student performance in CS. Proc. of the
38th Annual SIGCSE Technical Symposium on
Computer Science Education, Covington, Kentucky,
USA, 203-207.
Goold, A. and Rimmer, R. (2000): Factors affecting
performance in first-year computing. ACM SIGCSE
Bulletin, 32(2): 39-43.
Hagan, D. and Markham, S. (2000): Does it help to have
some programming experience before beginning a
computing degree program? ACM SIGCSE Bulletin,
32(3): 25-28.
Hanks, B., Murphy, L., Simon, B., McCauley, R., and Zander, C. (2009): CS1 students speak: advice for
students by students. Proc. of the 40th Annual SIGCSE
Technical Symposium on Computer Science Education,
Chattanooga, Tennessee, USA, 19-23.
Hanks, B. (2005): Student performance in CS1 with distributed pair programming, Proc. of the 10th Annual
SIGCSE Conference on Innovation and Technology in
Computer Science Education, Caparica, Portugal, 316-
320.
Kaila, E., Rajala, T., Laakso, M.-J. & Salakoski, T. (2009). Effects, Experiences and Feedback from
Studies of a Program Visualization Tool. Informatics in
Education, 8(1):17–34.
Kinnunen, P., McCartney, R., Murphy, L., and Thomas, L. (2007): Through the eyes of instructors: A
phenomenographic investigation of student success.
Proc. of the Third International Workshop on
Computing Education Research, Atlanta, Georgia,
USA, 61-72.
Laakso, M.-J., Salakoski, T., Grandell, L., Qiu, X., Korhonen, A. and Malmi, L. (2005): Multi-perspective
study of novice learners adopting the visual algorithm
simulation exercise system TRAKLA2. Informatics in
Education, 4(1): 49-68.
Lang, C., J. McKay, Lewis, S. (2007): Seven factors that influence ICT student achievement. Proc. of the 12th
Annual Conference on Innovation and Technology in
Computer Science Education, Dundee, Scotland,
United Kingdom, 221-225.
Nelson, C. (1996): Student diversity requires different approaches to college teaching, even in math and
science. American Behavioral Scientist, 40(2): 165-
175.
Pea, R. D. (1993): Practices of distributed intelligence
and designs for education. In G. Salomon (Ed.). Distributed Cognitions. New York: Cambridge
University Press, 47-87.
Plant, E. A., Ericsson, K. A., Hill, L., and Asberg, K.,
(2005): Why Study Time Does Not Predict Grade Point
Average across College Students: Implications of Deliberate Practice for Academic Performance,
Contemporary Educational Psychology, 30(1), 96-116.
Roberts, G. (2005): Technology and learning expectations
of the net generation. In Educating the Net Generation,
Chapter 3. Oblinger, D. and Oblinger, J. Washington,
DC, e-EDUCAUSE.
Rogoff, B. (2003): Thinking with the tools and
institutions of culture. In Cultural Nature of Human
Development, Chapter 7. Oxford University Press:
Oxford, 236-246.
Sheard, J., Carbone, A., Markham, S., Hurst, A., Casey, D., and Avram, C. (2008): Performance and
progression of first year ICT students. Proc. of the 10th
Australasian Computing Education Conference,
Wollongong, Australia, 119-128.
Simon, Fincher, S., Robins, A., Baker, B., Box, I., Cutts, Q., de Raadt, M., Haden, P., Hamer, J., Hamilton, M.,
Lister, R., Petre, M., Sutton, K., Tolhurst, D., and
Tutty, J. (2006): Predictors of success in a first
programming course. Proc. of the Eighth Australasian
Computing Education Conference, Hobart, Tasmania,
Australia, 189-196.
Taylor, H. and Mounfield, L. (1994): Exploration of the relationship between prior computing experience and
gender on success in college computer science. Journal
of Educational Computing Research, 11(4): 291-306.
Treisman, U. (1992): Studying Students Studying Calculus: A Look at the Lives of Minority Mathematics
Students in College. The College Mathematics Journal,
23(5): 362-372.
Wiedenbeck, S. (2005): Factors affecting the success of non-majors in learning to program. Proc. of the First
International Workshop on Computing Education
Research, Seattle, Washington, USA, 13-24.
Wilson, B. (2002): A study of factors promoting success in computer science including gender differences.
Computer Science Education, 12(1-2):141-164.
CRPIT Volume 103 - Computing Education 2010
60

Appendix A: Survey
Study Habits of Introductory Programming Students
1. Your name: ____________________________
2. Your gender: Male Female
3. How much previous programming Not much A lot
experience have you had?
4. Please list the programming languages you have programmed in before this unit.
5. Of the lectures so far in the unit, how many None A few Half Most All
of them have you attended and/or listened to
the recording of?
6. On average, how many hours per week and outside of lecture, tutorial, and lab do you:
a. read the textbook (including working out and
thinking about examples given in the text)
never <0.5 0.5-1 1-2 2-4 >4 hours
b. work through problems from the book (at the
end of each chapter)
never <0.5 0.5-1 1-2 2-4 >4 hours
c. work through problems using ViLLE never <0.5 0.5-1 1-2 2-4 >4 hours
d. work through problems you didn't finish in
tutorial or lab
never <0.5 0.5-1 1-2 2-4 >4 hours
e. work through problems from some other source (not the textbook and not Ville and not
the lab)
never <0.5 0.5-1 1-2 2-4 >4 hours
7. On average, how many hours per week do you:
a. visit the lecturer during consultation hours never <0.5 0.5-1 1-2 2-4 >4 hours
b. visit other instructors during consultation
hours
never <0.5 0.5-1 1-2 2-4 >4 hours
c. use the discussion forum on Moodle to discuss
class material
never <0.5 0.5-1 1-2 2-4 >4 hours
d. talk to friends and/or classmates about the unit
material
never <0.5 0.5-1 1-2 2-4 >4 hours
e. use the internet to help you with unit material never <0.5 0.5-1 1-2 2-4 >4 hours
f. use a private tutor to help you with the unit
material
never <0.5 0.5-1 1-2 2-4 >4 hours
g. other (specify) never <0.5 0.5-1 1-2 2-4 >4 hours
8. Circle the statement that best describes how you work on problems (not including work in tutorials and labs):
a. always by myself
b. mostly by myself
c. roughly equal amount of time by myself as with others
d. mostly with others
e. always with others
1 2 3 4 5
1 2 3 4 5
Proc. 12th Australasian Computing Education Conference (ACE 2010), Brisbane, Australia
61

9. For each of the unit resources listed, rate the usefulness of that resource to your learning the unit material.
Never Not Very
Used Useful Useful
a. the lecture presentation N 1 2 3 4 5
b. the lecture slides N 1 2 3 4 5
c. one-page summaries of the week's material N 1 2 3 4 5
d. tutorials and tutorial solutions N 1 2 3 4 5
e. labs and lab solutions N 1 2 3 4 5
f. sample exams and solutions N 1 2 3 4 5
g. mid-semester test and feedback N 1 2 3 4 5
h. ViLLE quizzes N 1 2 3 4 5
i. discussion forum on Moodle N 1 2 3 4 5
j. lecturer consultation hours N 1 2 3 4 5
k. other consultation hours N 1 2 3 4 5
l. textbook N 1 2 3 4 5
m. other (specify)
_________________________________ N 1 2 3 4 5
10. Rate the overall value to your learning
of the resources provided in this unit. Low Value High Value
11. Circle the statement that most closely describes your experience with the resources provided in this unit:
a. They are sufficient for my needs.
b. There are too many – I often feel overwhelmed.
c. There are not enough – I often have to search elsewhere.
12. How well do you think you understand each of these programming concepts?
Weak Strong
Understanding Understanding
a. variables, constants, and primitive data types 1 2 3 4 5
b. the pre-defined classes String and Math 1 2 3 4 5
c. the Scanner class 1 2 3 4 5
d. evaluation of expressions 1 2 3 4 5
e. selection (if statements) 1 2 3 4 5
f. repetition (for, while, and do-while loops) 1 2 3 4 5
g. methods 1 2 3 4 5
h. user-defined classes 1 2 3 4 5
13. How confident are you with the concepts Low High
covered so far in this unit? Confidence Confidence
14. Considering the unit so far, how much have
you learned about programming? Not much A lot
1 2 3 4 5
15. What grade do you expect to receive in the unit? N P C D HD
1 2 3 4 5
1 2 3 4 5
CRPIT Volume 103 - Computing Education 2010
62

Engaging Students in Programming
Malcolm Corney, Donna Teague and Richard N. Thomas Faculty of Science and Technology
Queensland University of Technology
Brisbane, Australia
[m.corney, d.teague, r.thomas]@qut.edu.au
Abstract
Poor student engagement and high failure rates in first
year units were addressed at the Queensland University of
Technology (QUT) with a course restructure involving a
fresh approach to introducing programming. Students‟
first taste of programming in the new course focused less
on the language and syntax, and more on problem solving
and design, and the role of programming in relation to
other technologies they are likely to encounter in their
studies. In effect, several technologies that have
historically been compartmentalised and taught in
isolation have been brought together as a breadth-first
introduction to IT.
Incorporating databases and Web development
technologies into what used to be a purely programming
unit gave students a very short introduction to each
technology, with programming acting as the glue between
each of them. As a result, students not only had a clearer
understanding of the application of programming in the
real world, but were able to determine their preference or
otherwise for each of the technologies introduced, which
will help them when the time comes for choosing a
course major.
Students engaged well in an intensely collaborative
learning environment for this unit which was designed to
both support the needs of students and meet industry
expectations. Attrition from the unit was low, with
computer laboratory practical attendance rates for the first
time remaining high throughout semester, and the failure
rate falling to a single figure percentage.
Keywords: introductory programming, IT course, student
engagement, attrition
1 Introduction
Attrition from programming courses is historically high
(Berenson, Slaten et al. 2004; Kinnunen and Malmi 2006;
Biggers, Brauer et al. 2008), particularly in minority
groups for whom there is often poor representation to
begin with (Cohoon 2002; Fisher and Margolis 2002;
Lewis, McKay et al. 2006; Varma 2006; Vilner and Zur
2006).
Introductory programming units in particular have had
an alarming failure rate (Sheard and Hagan 1998; Robins,
Rountree et al. 2003). More than 30% of QUT students
Copyright © 2010, Australian Computer Society, Inc. This
paper appeared at the Twelfth Australasian Computing
Education Conference (ACE2010), Brisbane, Australia, January
2010. Conferences in Research and Practice in Information
Technology, Vol. 103. Tony Clear and John Hamer, Eds.
Reproduction for academic, not-for-profit purposes permitted
provided this text is included.
on average had failed QUT‟s introductory programming
subject since 2003, and for some semesters that
percentage was significantly higher (Teague and Roe
2009).
Much research has focused on this dilemma
culminating in a range of cognitive theories for high
failure rates including:
the difficulty of understanding the purpose of
programs and their relationship with the computer;
difficulty in grasping the syntax and semantics of a
particular programming language (Robins, Rountree
et al. 2003);
misconceptions of programming constructs (Soloway
and Spohrer 1989);
inability to problem-solve (McCracken, Almstrum et
al. 2001); and
inability to read and understand program code
(Lister, Adams et al. 2004; Mannila 2006).
The idea that the failure lies in the ability of some
students to grasp the course content has seen repeated
redevelopment of introductory programming courses with
changes of language, paradigm, and swapping between
breadth and depth of content approaches.
Motivation, however, has been found to be one of the
major reasons for students dropping out of IT courses
(Kinnunen and Malmi 2006). QUT‟s data shows that
there is a correlation between students who fail an intro-
ductory programming unit and those who withdraw from
their degree. This has been informally confirmed by
many other institutions. The implicit assumption is that
lack of motivation leads to failure or that poor perform-
ance in early assessment tasks leads to poor motivation.
To address student motivation by making learning
more fun, courses and tools have been developed to help
captivate introductory programming students (Lister
2004; Parsons and Haden 2006; Pollard and Duvall 2006;
Davis and Rebelsky 2007; Feinberg 2007).
The „big picture‟ for many students is that
programming is perceived as a solitary occupation, and
one which is conducted in a competitive environment.
This is unwittingly reinforced at university where
faculties demand that programming students be
individually assessed. The generally accepted stereotype
of a programmer is the „geeky‟ young male with dubious
social skills, and it is not surprising that many students
are alienated by this image. This may often negatively
affect their confidence and lead to a subsequent lack of
engagement and interest (Fisher and Margolis 2002).
Collaborative learning establishes an environment
conducive to learning and addresses some of the social
and cultural barriers facing students (Wilson, Hoskin et
al. 1993; Williams and Kessler 2000; McDowell, Werner
et al. 2002; Gehringer, Deibel et al. 2006). It has been
Proc. 12th Australasian Computing Education Conference (ACE 2010), Brisbane, Australia
63

found that students benefit from the peer support while
learning, and at the same time are motivated by peer
pressure and a sense of purpose and belonging
(McKinney and Denton 2006).
Taking the collaborative approach by using pair
programming in the learning environment has been
documented as having significant educational benefits
including active learning and improved retention,
program quality, and confidence in the solution
(McDowell, Werner et al. 2002; Nagappan, Williams et
al. 2003; McDowell, Werner et al. 2006; Mendes, Al-
Fakhri et al. 2006). A more social rather than competitive
environment is established with pair programming which
promotes more interaction and lends twice as much brain
power and an extra set of eyes to a programming exercise
(Simon and Hanks 2007).
In this paper we report on our approach to redesigning
the introductory programming unit at QUT. Our aim was
to focus on the issues of motivation and engagement, as
well as the social and cultural attitudes affecting the way
students engage in their learning to program. We
provided students with an intensely collaborative learning
environment and were better able to engage students in
programming by providing them with a taste of a number
of technologies, each of which relies on programming.
The redesign of this introductory unit came about
within a new overall course structure for the Bachelor of
IT. By providing students with introductions to various
technologies, it was hoped that students with a preference
for a particular area of study could get a brief taste of that
area before embarking on a more serious investment of
time in a particular unit.
The remainder of the paper is structured as follows. In
Section 2, we discuss previous approaches taken in
teaching introductory programming at QUT and the
perceived problems with those approaches. Section 3
presents the approach we have developed for the new
introductory programming unit, describing the unit‟s
structure and how it fits into the new course structure, and
the unit‟s approach to teaching and assessment. An
analysis of the student cohort enrolled in the unit is also
provided. The evidence of our success in improving the
unit is presented in Section 4. Finally we present our
future plans for the unit and our conclusions in Sections 5
and 6.
2 Historical Units
2.1 Introductory Programming Units
The teaching of programming at QUT has undergone an
evolution over the past twenty years as undergraduate
degree course structures were reviewed and redeveloped.
Introductory programming has always been seen as a
requirement for all students enrolled in our IT course by
industry advisers. QUT has recently offered an
undergraduate degree program in Games and Interactive
Entertainment (GIE) and advisers in this field similarly
agree that programming is necessary.
Over the past eight years many changes were made to
our introductory programming units as the number of
students entering IT degree courses first swelled and then
dwindled for many reasons – the rise and fall of the tech
bubble, post Y2K, programming and programmers being
seen as an outsourced commodity etc.
Rising numbers of students lead to problems in the
quality of teaching and learning inherent with large class
sizes and the overall student experience suffered
accordingly.
A subsequent and dramatic decline in the number of
students entering the course resulted in fewer students
with high university entrance scores which affected the
nature of the student cohort. Methods of teaching which
had previously been seen as successful were no longer
working as well as they had.
Student cohorts typically contained a mixture of
students who could already program to some extent and
those who had never programmed before. As the
introductory units were aimed at the lowest common
denominator, students with programming skills typically
saw the units as too simple and failed to engage with the
content. Other students simply did not cope with learning
to program for any number of reasons, and then failed to
engage as they fell behind in their learning.
Assessment in these units typically consisted of one or
two programming assignments of varying levels of
difficulty and an end of semester exam which was worth
70% of their final grade for the unit. Assignments were
often quite large in the context of novice programming,
were often poorly attempted and were rarely completed
successfully. While formative feedback was provided to
students for assignments, it was typically not useful to the
students in examinations.
Recent offerings of first programming units attempted
to focus on problem solving but this was done with an
emphasis on producing programs, rather than through
categorization of problems into types that can be solved
with different algorithmic approaches.
2.2 Approaches Taken
In previous course designs a number of approaches have
been taken in the teaching of introductory programming
units at QUT. Imperative programming was used initially
with languages such as Pascal and Modula 2. Attempts
were made to introduce object oriented programming
with Java and C#, though this was mainly taught with an
introduction to imperative programming before objects
were introduced. A purely functional approach was also
trialled using Scheme as the language du jour.
2.3 The Impact of Course Structure
The design of many information technology courses has
compartmentalized the teaching of the main building
blocks of IT systems development, i.e. programming,
database design, administration and use; and Web
development. Each of these areas has been taught as a
separate body of knowledge that IT students should learn
in isolation.
The IT course at QUT had been altered after faculty
reviews to address falling student numbers. However,
little was done in these reviews to address the poor
student outcomes for introductory programming.
CRPIT Volume 103 - Computing Education 2010
64

2.4 Retention
Retention of students in introductory programming units
suffered as the student cohort altered as discussed above.
This was evidenced each semester at census dates by
shrinking class sizes.
Tutorial and/or practical attendances nearly always
declined as the weeks of the semester progressed. Factors
such as workload from other units and external
commitments were often blamed but a major factor may
likely have been lack of engagement with the unit
materials.
Overall results for introductory programming units in
the past have typically had a bimodal distribution with
one mode for those students who either had prior
knowledge of programming or managed to learn it
quickly and another mode for those students who did not
manage to learn to program well at all.
Students who performed poorly in these programming
units, which were normally core to all IT courses, were
unlikely to continue tertiary study and those who were
enrolled in double degrees would often discontinue the IT
degree. As Table 1 shows, semester 1, 2008 saw 19% of
students failing the first programming unit. In the same
semester, 35% of students discontinued their course with
over half of them withdrawing from university altogether
(see Table 2).
Semester 1, 2008 First Programming Unit
pass 81%
fail 19%
Table 1: Fail/Pass Rates
Semester 1, 2008 Attrition Rates
Changed to other course or
inactive/on leave
16.2%
Discontinued course enrolment 18.4%
Withdrew from First
Programming Unit
19.4%
Table 2: Attrition Rates
3 The New Course Structure
The design goal for the first semester core of the new
Bachelor of IT (BIT), introduced in 2009, was to improve
student engagement, and consequently progression, while
maintaining the quality of our graduates. The core
maintains the idea of ensuring that all of our BIT
graduates have a common set of skills and knowledge.
The technical material in the previous core was taught
pretty much the same way for the past 30 years. Many of
the technical units had poor progression rates and
particularly the programming and database units had very
poor progression rates. The Faculty of Science and
Technology (SciTech‟s) approach to teaching the
technical material was similar to most other mainstream
IT degrees and we had similarly poor progression rates.
We needed a different approach to introducing technical
content to see significant changes in progression rates.
The design of the new BIT took into account our
experiences teaching IT, model curricula and research in
pedagogy. In particular we considered the guidelines
provided by the ACM, AIS and IEEE Computer Society
Computing Curricula 2005 (The Joint Task Force for
Computing Curricula ACM/AIS/IEEE-CS 2006) along
with its companion volumes Computer Science (The
Interim Review Task Force ACM/IEEE-CS 2008),
Information Systems (Gorgone, Davis et al. 2002),
Information Technology (Lunt, Ekstrom et al. 2008) and
Software Engineering (The Joint Task Force on
Computing Curricula IEEE-CS/ACM 2004). (In the
remainder of this section we will use the term CC2005 to
refer to Computing Curricula 2005 and all of its
companion volumes.) CC2005 is a content driven view
of curricula. The design of the new BIT took into
account the knowledge areas and recommended topic
weighting from CC2005 but we purposely did not aim to
meet the recommended weightings. Given the breadth of
computing and the need to adequately develop generic
capabilities we found the CC2005 recommendations to be
too heavily biased towards content over general abilities.
We also noted that even the content recommended by
CC2005 was too narrow to adequately cover both the
breadth of information technology and the associated
non-computing knowledge required by graduates. A
recent workshop on redefining computing curricula noted
that in a short period of time they were able to identify
over 100 additional knowledge areas relevant to
computing that were not covered by CC2005 (Isbell,
Stein et al. 2010). In the end, the design of the new BIT
followed current pedagogical research being undertaken
at QUT (QUT 2009). The first semester core units and
units which immediately follow focus on preparing
students for their university studies. The middle part of
the degree focuses on delivering relevant material in
realistic contexts. The final year core units focus on
preparing students for their post-degree careers with an
emphasis on integrating the topics studied earlier in their
degree and on understanding the context in which they
will apply the knowledge and skills.
Consequently the new core has a shallower
introduction to the technical content and introduces this
content using an integrated approach, which matches how
the content is used in practice. We wanted to shift the
focus from didactic teaching to a more constructivist
approach to learning (Bowden and Marton 1999). Our
own experience introducing Problem-Based Learning
(PBL) into programming units (Adams, Clarke et al.
2001) and the experience of MacDonald (1998) in
medicine validates this shallower introduction of
material. The experience from the PBL community is
that a limited and focussed coverage of content provides a
better basis for students to learn material on their own,
rather than trying to cram everything into a course. The
integrated approach to introducing content material was
informed by the framework for Teaching and Assessment
of Software Development (Thomas, Cordiner et al. 2010),
which provides a structure for designing a stream of
technical units that make up a coherent whole. We
believe that if students are engaged in the learning
process and the material, they will learn the fundamental
concepts well giving them adequate skills for the
remainder of their degree, regardless of the area in which
they specialise.
The core is intended to develop well rounded students,
and leave technical depth to a set of specialisation
Proc. 12th Australasian Computing Education Conference (ACE 2010), Brisbane, Australia
65

streams. This reflects industry feedback on requirements
for graduates with better business, communication and
teamwork skills, and also on the expected technical
ability of our graduates. The first semester units are not
meant to eliminate difficult technical material, but to
present it in a more engaging manner which better shows
how the course content inter-relates. The motivation for
this is the number of our students who do not see how the
different aspects of IT fit together (e.g. believing that
working with databases does not require programming
skills).
In student focus groups conducted at QUT, some of
the comments from students were that they wanted more
"hands on" work, more exposure to "real world" projects
and examples, a better introduction to object-oriented
programming, and more industry certification options.
Double degree students commented that SciTech was
better at building student cohorts than other faculties and
that we were better at getting students to work together.
Most students disliked working in teams if some team
members did not "pull their weight". However, we
recognise the importance of students building a network
of friends during their transition to university, as well as
the valuable generic skills that collaborative learning
affords them.
INB104 – Building IT Systems – is one of four core
units offered in the first semester of the first year of study
for Bachelor of IT students. It is also a core unit for
Bachelor of Games and Interactive Entertainment
students and for all students enrolled in double degrees
involving either of these degrees. Double degree students
typically undertake study in INB104 in the second
semester of their course.
The four core units form a coherent group which
expose students to: the breadth of domains in which IT is
used and how IT has changed those domains; advances in
computing devices to introduce hardware architecture,
networking and operating systems; and an introduction to
the profession of IT and the generic skills required by all
IT graduates.
INB104 rounds this set of units out with an
introduction to the basic building blocks of IT systems:
networks, databases, and software – programs, scripts and
Web development. While this may seem like a large
amount of material, the topics are covered without going
into too great a depth.
An aim of the unit is to provide students with some
experience in these building blocks before they choose a
set of follow-on units in second semester, which includes
Programming, Databases, Networks, and the Web. These
units then lead on to the areas in which students may
specialise, such as enterprise systems, software
engineering, Web development or networking.
3.1 Introducing INB104 – Building IT Systems
Combining programming, databases and Web
development into one first year unit allows the students to
gain an earlier understanding of these basic concepts
albeit at a more general level. The main aim of this unit
is to engage the students in these building blocks and to
learn the basics by immersing them in a variety of
interesting tasks that will use one, two or all three of the
technologies. Programming is being used as the glue
between the systems, rather than simply for the sake of
something that must be learnt.
Given the range of topics in INB104, programming
skills are restricted to the fundamental concepts of
sequence, selection, iteration and functions. We decided
to use Python as the introductory language due to our
experience with the language and its simplicity. Python
is open source, involves hassle-free installation and has a
simple syntax and development interface. It can be used
for writing simple scripts, full blown programs and for
the creation of object-oriented systems. It is also possible
to use the functional programming paradigm with this
language.
INB104 focuses on imperative programming using a
top down design approach which motivates the use of
functions. An imperative approach was chosen because it
provides the best approach to teaching the fundamental
concepts covered in the unit. A functional or object-
oriented approach would require too much overhead in
the form of other concepts to suit the goals of the unit
when using Python. It is also an approach that suits the
design of scripting programs as well as providing the
underlying algorithmic logic required by object-oriented
programming. Students will encounter both of these
approaches in following units. Python library modules
are utilised for animation (PyGame), image manipulation
(PIL), and database communication (MySQLdb).
MySQL is used for projects which require database
interaction. It provides good GUI based tools for
interaction with a database server, so that SQL queries
can be tested before they are used in Python programs.
The Web development element of the unit covers a
subset of HTML and uses simple text editors in
preference for sophisticated development environments
like DreamWeaver.
INB104 highlights the fact that SQL and HTML are IT
system development languages that can be used to build
interactive systems.
3.2 Teaching Approach
Students are expected to attend a two hour demonstration-
style lecture and a two hour computer laboratory based
tutorial session each week. The laboratory sessions are
supervised by one tutor for each class of 25 to 30
students. This level of support has been provided to our
first year students for some time now and does not
represent any increase in resources required for delivery
of the unit.
Lecture slides and laboratory worksheets are published
online prior to delivery and audio recordings are made
available following the lectures.
In the first week of semester, students are encouraged
to partake in an animated social discussion in the
practical sessions, aimed at breaking the ice and getting
to know a little about their fellow students. Students then
self-select into pairs. They are asked to choose carefully,
a partner they believe they will be able to work with
effectively throughout semester. Students are encouraged
to consider such things as demographics, culture,
background, motivation, programming experience and
timetabling. They are then introduced to the concept and
protocol of pair programming (Beck 2005) and provided
CRPIT Volume 103 - Computing Education 2010
66

with background information supporting its use in both
industry and the learning environment. In the university
environment, we believe that the student pairs should be
fixed for the semester as the main aim of the learning
experience is the content matter rather than the pair
programming protocol. In this and previous pair
programming experiments (Teague and Roe 2009) we
have found that after an initial settling in period, students
prefer to continue with the same partner for the duration
of the semester rather than spend time developing a
workable relationship with someone new.
Paired students are encouraged to actively engage with
their partner to complete practical exercises both during
practicals and at other negotiated times either on or off
campus. Tutors enforce regular swapping of roles
between driver and navigator, reminding them of ways
they can be active members of the pair including asking
questions, offering alternatives, researching syntax etc.
Activities in the weekly computer based practical
sessions are all directly related to the unit content
delivered at the prior lecture and these activities in many
cases feed directly into similar tasks that are required for
assessment. This approach is seen by the unit developers
as vital for providing relevance to the weekly schedule
and engagement with the unit material.
3.3 Assessment
Previous studies (McDowell, Werner et al. 2002; Urness
2009) have found that assignments developed by novice
programmers involving pair-programming result in better
quality code than individual submissions. The same
studies also note that similar exam averages are achieved
by those learning in a pair-programming environment as
those who have worked individually throughout semester.
Assessment for this unit is a combination of a portfolio
of activities undertaken during the semester, a reflective
report comparing initial and final skills in the areas taught
in the unit, and weekly online quizzes.
„Threshold concepts‟ that novice programmers
encounter and often get stuck on (Eckerdal, McCartney et
al. 2006) are made less of an issue with the support of
collaborative learning, and by offering a range of
assessment items that appeal to the students‟ sense of
enjoyment and target their interest areas e.g. gaming,
graphics, and Web development.
The assessment items are described in more detail
below.
3.3.1 Portfolio
Small projects are developed by pairs but teamwork is not
assessed. Student pairs spend some time working on the
project tasks in computer laboratory practical sessions but
are expected to complete the tasks using the same
collaborative protocols at negotiated times and places
with their partner between practicals. The students use a
problem solving framework which provides a scaffold for
developing the required skills. Students are expected to
take an inventory of their current skills at the beginning
of the task and then determine an approach that will
enable them to complete the task.
The tasks are somewhat open ended in their definition
and most include challenge content, allowing those
students who have pre-existing skills to use and challenge
those skills. For those students with little or no prior
knowledge, supporting material is supplied in lectures
and readings, while laboratory exercises supported by
tutors provide the opportunity for them to develop the
required skills with hands-on practice and
experimentation. For the first offering of this new unit,
the portfolio was submitted twice in draft form, allowing
the students to receive feedback on their submissions
before finally being graded. The drafts were due for
submission at the end of weeks four and eight, with the
final portfolio submitted at the end of week 13.
Each submission required a selection of two projects
per pair, resulting in a final portfolio containing six
projects overall. The first draft submission required a
choice of practical exercises which students had been
completing in class. These were programming exercises
which entailed writing simple functions with or without
parameters which involved sequential expressions,
Boolean logic, conditions, iteration and/or the use of
Turtle graphics.
The second draft submission of the portfolio included
a selection of more challenging programming projects,
some of which required a little research and development
of skills not covered in class. One example of this was a
project to produce a bouncing balls animation using an
imported PyGame library. Other projects available for
selection at this stage involved using Lindenmayer
systems (Prusinkiewicz and Lindenmayer 1990) for
drawing fractal patterns with Turtle graphics and a
language translator using Python‟s built-in dictionary data
type and its functionality.
The final portfolio stage offered the choice of projects
which involved programming, SQL and/or HTML
development. A programming and SQL project required
students to populate an existing database with the
contents of supplied text files. One project required the
use of all three technologies, in which students produced
a HTML popularity cloud of gathered student data.
Another project had students design a set of static Web
pages to display images captured by traffic cameras
deployed around the South East corner of Queensland in
the form of a traffic camera wall.
3.3.2 Reflective Report
A brief search indicates that few programming courses
incorporate the use of reflective practice by its students.
Zagal and Bruckman (2007) talk about a blogging
environment developed for students as a learning tool, to
reflect on their game-play experiences. Kay et al (2007)
incorporated student reflective practice in their
programming education system which was designed to
facilitate self-assessment and reflection.
The reflective report for this unit required the students
to compare their initial and final skill levels in the areas
of computer programming, database usage and Web
programming. The students were instructed to undertake
a learning style survey (Fleming 2009) and to reflect
upon how that style was manifested during their learning
in this unit.
The development of the report was guided by a series
of questions that asked about knowledge of a topic,
comparison of understanding between the beginning and
Proc. 12th Australasian Computing Education Conference (ACE 2010), Brisbane, Australia
67

end of the semester and whether or not the student
enjoyed learning about the topic. There was also a
further question asking if the student would enrol in
further units related to the topic.
3.3.3 Quizzes
For the first ten weeks of the unit students were required
to complete an on-line quiz, each contributing 1%
towards their final grade. The first quiz was a
questionnaire designed simply to gather information
about students‟ IT and programming skills as well as
perceptions and attitudes which was later used by them to
help reflect on their development of skills and knowledge
throughout the semester.
The remainder of the quizzes consisted of multiple
choice questions which tested their knowledge of
concepts covered in the previous week‟s lecture and
practical session. Only one attempt per student was
permitted for each quiz, and they were expected to
complete the quizzes in their own time, within a week or
so from being available online. With no real time
restriction for completing a quiz and the freedom to use
whatever resources they felt necessary in order to answer
the questions, each quiz provided the opportunity for
students to reflect on their understanding of technical
content.
3.4 Cohort Analysis
The cohort for this unit‟s first offering did not consist
entirely of straight Information Technology students.
Many of its students were enrolled in the School of IT‟s
new Bachelor of Games and Interactive Entertainment
(BGIE) degree and many combine their studies in IT with
a second degree. Information on the cohort is reported
below.
We have also surveyed the learning style preferences
of students in the cohort, using an on-line survey
(Fleming 2009). Information gathered from this survey
will be used to ensure that all learning styles are catered
to in future offerings of the unit. The predominant
learning styles of the cohort are also reported below.
3.4.1 Course Breakdown
The students undertaking the course come mainly from
the School of IT‟s two main courses, the Bachelor of
Information Technology (BIT) and Bachelor of Games
and Interactive Entertainment (BGIE) and double degrees
paired with these. Table 3 shows the breakdown of
courses in which students undertaking this unit are
enrolled. Further information about the student cohort
undertaking the unit is shown in Table 4.
Course Semester 1 Semester 2
BIT 34% 26%
BIT/Double 19% 42%
BGIE 39% 4%
BGIE/Double 1% 18%
Other Single Degree 4% 8%
Other Double Degree 1% 1%
Other 3% 2%
Table 3: Breakdown of Degree Course Enrolments
Students Semester 1 Semester 2
Male 86% 80%
Female 14% 20%
Full Time 94% 93%
Part Time 6% 7%
Domestic 98% 99%
International 2% 1%
Table 4: Student Cohort Statistics
3.4.2 Learning Style The VARK Learning Style questionnaire that students
completed as part of their reflective report assessment
provided a profile of their learning preferences in terms
of giving and receiving information (Fleming 2009).
Figure 1 below shows the breakdown of the learning
styles of students in the first offering of INB104.
Figure 1: Student Cohort Learning Styles
4 Measures of Success
Our approach in measuring the evidence of the success of
the unit was as follows:
Comparison of student results before and after the
introduction of this unit.
Comparison of student attrition rates before and
after the introduction of this unit.
Comparison of number of instances of plagiarism
before and after the introduction of this unit.
Analysis of formal and informal student feedback
from this unit.
Comparison of attendance rates at computer
laboratory classes before and after the introduction
of this unit.
Analysis of commentary relating to favourite
assessment tasks in reflective reports.
4.1 Final Results and Attrition
The outcome of the assessment regime for the first
offering of the unit was a unimodal distribution centred
around 75%. Approximately 70% of students achieved a
grade of 6 or 7, 20% achieved a grade of 4 or 5 and only
6% of the cohort failed to achieve a passing grade.
Updating Table 1 and Table 2 above gives some
indication of the effect that pass rates may have had on
attrition. Table 5 below shows that in semester 1, 2009
the failure rate dropped from 19% to 6%. Table 6
indicates that the attrition rate from the courses dropped
CRPIT Volume 103 - Computing Education 2010
68

from 35% to 9% while the attrition rate from the first
programming unit has dropped from 19% to 6%.
Result First Programming Unit
Sem 1, 2008 Sem 1, 2009
pass 81% 94%
fail 19% 6%
Table 5: Fail/Pass Rates
Withdrawal Attrition Rates
Sem 1,
2008
Sem 1,
2009
Changed to other course or inactive 16% 4%
Discontinued enrolment 18% 5%
Withdrew 1st Programming Unit 19% 6%
Table 6: Attrition Rates
There has been a slight increase in the number of
students who submitted assignments and who undertook
weekly quizzes, indicating that the assessment tasks
chosen for the unit seem to have been engaging to the
student cohort.
4.2 Plagiarism
An unexpected but welcome benefit of the approach
being used has been a reduction in plagiarism of
assignment work. There have been only two instances of
plagiarism so far in the new unit. This is a dramatic
reduction when compared to previous offerings where
there have typically been five to ten cases of plagiarism
detected.
The reason for this has not been fully investigated but
the most likely reason is the collaborative learning
environment.
4.3 Student Feedback
To measure the success of the design of Building IT
Systems we have collected formal and informal student
feedback. Some student commentary is reproduced
below. While there has been some feedback from
students that has been negative, the majority of the
comments have praised the unit. This is definitely the
case with students who identified themselves through
their comments as having failed the predecessor unit.
Students also provided positive feedback in their
reflective reports about their learning experiences:
I have definitely changed my mind slightly about several
aspects after completing this course. I thought the
programming part would be extremely hard and boring.
I was very wrong about this and the programming parts
didn’t turn out to be as difficult as I expected and they
were more challenging and exciting than boring.
Students were invited to provide feedback through the
university‟s Learning Experience Survey (LEX). The
response rate from students in the unit was over 37%.
Students were asked a number of questions using a five-
point Likert scale, while also given the opportunity to
provide free form qualitative comments:
This unit wastes no time in getting right into the fun stuff,
getting you engaged and making you participate. The
problems were complex but solvable and the tutors and
lecturers were always willing to help.
The unit has been useful in providing me with skills to
develop my programming expertise. The collaborative
approach has been very useful for me personally.
The whole unit is structured well. I personally found it
engaging, as it had a great many ways to learn the topic.
Going to lectures, listening to lectures via recording, the
tutorial exercises and going to the practical for extra
help, you can't lose.
The PASS (Peer Assisted Study Scheme) leader for
this unit also provided interesting feedback about the
collaborations:
I think the [pair] programming team idea is working very
well, I have had a fair few couples come in and talk to me
during pass sessions, and they often manage to figure out
answers as a pair with a little push in the right direction.
From what I have seen it is also stopping people being
lazy...(I've seen some very motivated groups).
4.4 Workshop Attendance
Historically in first year IT subjects at QUT, attendance at
scheduled lectures, tutorials and practicals dramatically
declines through the teaching semester. For example in
2007, an average of 80% of students initially attended
programming practicals, and by the end of semester only
16% of students turned up. A similar pattern has been
recorded for subsequent semesters (Teague and Roe
2009). Figure 2 displays a comparison of practical
attendance rates from previous semesters for the first
programming unit at QUT and for the first two offerings
of INB104 in 2009.
0%
10%
20%
30%
40%
50%
60%
70%
80%
90%
100%
2 3 4 5 6 7 8 9 10 11 12 13
Sem 2, 2007
Sem 1, 2008
Sem 1, 2009
Sem 2, 2009
Percentage of Students Attending Practicals
Week of Semester
Figure 2: Practical Attendance Rates
Attendances were recorded for 50% of the practicals in
both semester 2, 2007 and semester 1, 2008. For the
subsequent semesters in 2009, attendances were recorded
for the entire cohort. A marked improvement in
attendance rates by students in the new unit has been
evidenced.
In semester 1, 2009, attendances were not collected in
two of the practicals, one in week 10 and the other in
week 12. For these two practicals, the attendance
averages were 24 and 23 students respectively, each
equating to approximately 7% of the entire cohort of
enrolled students. Therefore, the actual attendance
percentages for weeks 10 and 12 was more likely 7%
higher than recorded in the graph. In week 4 of semester
Proc. 12th Australasian Computing Education Conference (ACE 2010), Brisbane, Australia
69

2, 2009 the significant drop in attendances is due to a
public holiday.
The reason for improved attendance at weekly
computer laboratory practical sessions seems to be linked
to the assessment tasks that have been used. This is
discussed further in the next section regarding evidence
collected from the reflective reports.
4.5 Analysis of Reflective Reports
The reflective reports were intended to highlight to the
students the amount of learning that was achieved by
participation in INB104. This was elicited from students
through a series of questions.
The reflective reports have also provided insights from
the students as to what engaged them in the unit. These
insights indicate that the use of the portfolio of activities
as the main assessment item for the unit and allowing
students to choose which project tasks to include in their
portfolios was a major reason for the success of the unit
in reducing attrition and for increasing the pass rate.
Approximately 20% of students made some comment
in their reflective reports about the specific projects that
they undertook in the unit which they found most fun and
engaging. Table 7 below shows that the projects with
some visual feedback component were favoured by the
students in the unit. We believe that this is not
unexpected as the visual result indicates the successful
completion of the project.
Project Topic Preferred Project
PyGame Animation 36%
Database Manipulation 10%
Turtle Graphics 41%
Popularity Cloud (HTML
production by Python with
data from a database)
33%
Table 7: Students' Preferred Projects
Further analysis of the reflective reports shows that
92% of students made some comment in their reflective
reports about which breadth units they would or would
not study in future semesters of their degree course and
this is shown in Table 8 below.
Area of Study Response
Programming Will Study 63%
Will Not Study 33%
No Indication 4%
Databases Will Study 51%
Will Not Study 37%
No Indication 12%
Web
Development
Will Study 66%
Will Not Study 25%
No Indication 9%
Table 8: Response Rates Regarding Future Units
It is postulated that this will have a positive impact on
the student cohorts in those breadth units. By being
exposed to the major building blocks of IT systems in this
unit, students have gained a better understanding of the
areas and made decisions on whether these areas are of
interest to them in their future careers and further studies.
5 Future Plans
The next iteration of INB104 (this current teaching
period) introduces an end of semester exam which will
contribute 30% to a student‟s final grade. The exam will
attempt to test a working understanding of the basic
concepts introduced during the semester covering
programming, SQL, HTML and how these technologies
inter-relate. Plenty of time will be provided to complete
the exam, and enable them to perform to the best of their
ability and to experience university exam conditions with
low stress.
None of the introductory core units in the new course
initially incorporated an exam as an assessment item. It
was felt that INB104 was the logical unit among these
core units for an exam to be used as a type of assessment
that first year students should be exposed to.
Examinations provide an alternative yet valid method for
measuring learning outcomes in a compressed time frame
with minimal opportunities for plagiarism.
Marking of the portfolio projects was very time-
consuming, with both source code files and often quite
verbose documentation to wade through and markers
were instructed to provide significant and effective
feedback to the students. The current iteration of the unit
will have only one draft portfolio before the final version
is submitted. This will reduce the marking workload on
teaching staff, but still provide students with valuable
feedback in order to both improve their submission, and
prepare for the final exam.
Students loved the „fun stuff‟, and that meant
something different for each student. The Games degree
students tended to prefer Turtle graphics and the task
using the PyGame library, while others found joy in
building a database or creating Web pages using Python.
While the projects will generally be recycled in
subsequent semesters, new projects will also be
developed, providing a wider range of project options for
students. Ideas for new projects include making use of
readily available libraries for Python.
Students were generally very interested in their
learning style profiles provided by the VARK Learning
Style questionnaire. In the current and future offerings of
this unit, students will be required to complete the
learning style questionnaire in week 1, which gives them
the opportunity to immediately take advantage of the
information they gain about their learning preferences
during their study.
6 Conclusions
In response to falling student numbers in the Bachelor of
IT degree at QUT, and high failure rates and high attrition
rates in introductory computer programming units, the
faculty undertook a major course revision which included
significant changes to the first programming unit
encountered by first year students.
We believe that the changes made to the unit have
resulted in better engagement with the material by the
students. Attrition from the unit has been reduced to 6%.
The failure rate in the unit has also been reduced to 6%.
This has been achieved while maintaining introductory
computer programming concepts – statement sequences,
conditional statements, iterative and recursive approaches
CRPIT Volume 103 - Computing Education 2010
70

to repetition, and functional decomposition using top
down design.
The unit has also introduced some of the basic
concepts of database design and manipulation,
networking, and Web page production using HTML. We
believe that we have covered the core fundamentals of
these topics in this unit, giving students sufficient
grounding in these areas so they are aware of them in
their professional lives, even if they will not directly use
those skills.
Workshops were conducted in a pair programming
mode so that students could learn in a collaborative
manner, being able to support each other‟s learning.
Informal and formal feedback indicates that this has been
well received by the students.
Data collection from student assessment supports our
claim that project tasks have been designed to be
engaging. We believe that this is because many of the
projects have a visual outcome, and that they are
extensible so that students with prior knowledge in the
area can demonstrate their higher level skills.
For assessment, students have undertaken weekly
quizzes and produced a portfolio of the collaborative
project tasks undertaken and have written a reflective
report, outlining the skills and knowledge gained during
the semester. The reflective report has also required
students to articulate their preferences with regard to the
topics covered in the unit. This has afforded them the
opportunity to contemplate the different study paths that
are offered from which they can select topics to study for
the remainder of their course. We believe that this may
also lead to lower attrition rates and lower failure rates for
follow on units, as students have written in their
reflections that they will not enrol in units that they now
know to be personally unappealing.
7 References
Adams, M., Clarke, S. and Thomas, R. (2001): Model of
thinking in the PBL process: Comparison of medicine
and information technology. Proc. Third Asia Pacific
Conference on Problem Based Learning,
Rockhampton, QLD, Australia.
Beck, K. (2005): Extreme programming explained:
embrace change Boston, MA, Addison-Wesley.
Berenson, S.B., Slaten, K.M., Williams, L. and Ho, C.-W.
(2004): Voices of women in a software engineering
course: Reflections on collaboration. Journal on
Educational Resources in Computing (JERIC) 4(1).
Biggers, M., Brauer, A. and Yilmaz, T. (2008): Student
perceptions of computer science: a retention study
comparing graduating seniors vs. CS leavers. Proc.
39th SIGCSE Technical Symposium on Computer
Science Education, Portland, OR, USA, ACM.
Bowden, J. and Marton, F. (1999): The university of
learning. London, Kogan Page.
Cohoon, J.M. (2002): Women in CS and biology. ACM
SIGCSE Bulletin 34(1): 82-86.
Davis, J. and Rebelsky, S.A. (2007): Food-first computer
science: starting the first course right with PB&J. Proc.
38th SIGCSE Technical Symposium on Computer
Science Education, Kentucky, USA, ACM.
Eckerdal, A., McCartney, R., Moström, J.E., Ratcliffe,
M., Sanders, K. and Zander, C. (2006): Putting
threshold concepts into context in computer science
education. ACM SIGCSE Bulletin 38(3): 103-107.
Feinberg, D. (2007): A visual object-oriented
programming environment. Proc. 38th SIGCSE
Technical Symposium on Computer Science Education,
Kentucky, USA, ACM.
Fisher, A. and Margolis, J. (2002): Unlocking the
clubhouse: the Carnegie Mellon experience ACM
SIGCSE Bulletin 34(2): 79-83.
Fleming, N.: VARK a guide to learning styles.
http://www.vark-learn.com/english/index.asp.
Accessed 6 Aug 2009.
Gehringer, E.F., Deibel, K. and Whittington, K.J. (2006):
Panel: cooperative learning - beyond pair programming
and team projects. Proc. 39th SIGCSE Technical
Symposium on Computer Science Education, Houston,
Texas USA, ACM.
Gorgone, J.T., Davis, G.B., Valacich, J.S., Topi, H.,
Feinstein, D.L. and Longenecker, H.E., Jr. (2002).
Model curriculum and guidelines for undergraduate
degree programs in information systems. Association
for Information Systems.
Isbell, C., Stein, L.A., Cutler, R., Forbes, J., Fraser, L.,
Impagliazzo, J., Proulx, V., Russ, S., Thomas, R. and
Xu, Y. (2010): (Re)defining computing curricula by
(re)defining computing. InRoads SIGCSE Bulletin (in
press).
Kay, J., Li, L. and Fekete, A. (2007): Learner reflection
in student self-assessment. Proc. Ninth Australasian
Computing Education Conference, Ballarat, Victoria,
Australia, ACS.
Kinnunen, P. and Malmi, L. (2006): Why students drop
out CS1 course? Proc. Second International Workshop
on Computing Education Research, Canterbury, United
Kingdom, ACM.
Lewis, S., McKay, J. and Lang, C. (2006): The next wave
of gender projects in IT curriculum and teaching at
universities. Proc. Eighth Australasian Computing
Education Conference, Hobart, Tasmania, Australia,
ACS.
Lister, R. (2004): Teaching Java first: experiments with
pigs-early pedagogy. Proc. Sixth Australasian
Computing Education Conference, Dunedin, New
Zealand, ACS.
Lister, R., Adams, E.S., Fitzgerald, S., Fone, W., Hamer,
J., Lindholm, M., McCartney, R., Moström, J.E.,
Sanders, K., Seppällä, O., Simon, B. and Thomas, L.
(2004): A multi-national study of reading and tracing
skills in novice programmers. ACM SIGSCE Bulletin
36(4): 119-150.
Lunt, B.M., Ekstrom, J.J., Gorka, S., Hislop, G., Kamali,
R., Lawson, E., LeBlanc, R., Miller, J. and Reichgelt,
H. (2008). Curriculum guidelines for undergraduate
degree programs in information technology. ACM and
IEEE-CS.
MacDonald, P.J. (1998): Selection of health problems for
a problem-based curriculum. In The Challenge of
Proc. 12th Australasian Computing Education Conference (ACE 2010), Brisbane, Australia
71

Problem-Based Learning. 2. D. Boud and G. Feletti
(eds). Kogan Page.
Mannila, L. (2006): Progress reports and novices‟
understanding of program code. Proc. Sixth Baltic Sea
Conference on Computing Education Research, Koli
Calling.
McCracken, M., Almstrum, V., Diaz, D., Guzdial, M.,
Haga, D., Ben-David, K.Y., Laxer, C., Thomas, L.,
Utting, I. and Wilusz, T. (2001): A multi-national,
multi-institutional study of assessment of programming
skills of first-year CS students. ACM SIGCSE Bulletin
33(4): 125-180.
McDowell, C., Werner, L., Bullock, H. and Fernald, J.
(2002): The effects of pair-programming on
performance in an introductory programming course.
Proc. 33rd SIGCSE Technical Symposium on
Computer Science Education, Cincinnati, Kentucky,
USA, ACM.
McDowell, C., Werner, L., Bullock, H.E. and Fernald, J.
(2006): Pair programming improves student retention,
confidence, and program quality Communications of
the ACM 49(8): 90-95.
McKinney, D. and Denton, L.F. (2006): Developing
collaborative skills early in the CS curriculum in a
laboratory environment. ACM SIGCSE Bulletin 38(1):
138-142.
Mendes, E., Al-Fakhri, L. and Luxton-Reilly, A. (2006):
A replicated experiment of pair-programming in a 2nd-
year software development and design computer
science course. ACM SIGCSE Bulletin 38(3): 108-112.
Nagappan, N., Williams, L., Ferzli, M., Wiebe, E., Yang,
K., Miller, C. and Balik, S. (2003): Improving the CS1
experience with pair programming. Proc. 34th SIGCSE
Technical Symposium on Computer Science Education,
Reno, Nevada, USA, ACM.
Parsons, D. and Haden, P. (2006): Parson's programming
puzzles: a fun and effective learning tool for first
programming courses. Proc. Eighth Australasian
Computing Education Conference, Hobart, Australia,
ACS.
Pollard, S.L. and Duvall, R.C. (2006): Everything I
needed to know about teaching I learned in
kindergarten: bringing elementary education techniques
to undergraduate computer science classes. Proc. 37th
SIGCSE Technical Symposium on Computer Science
Education, Houston, Texas, USA, ACM.
Prusinkiewicz, P. and Lindenmayer, A. (1990): The
algorithmic beauty of plants. New York, Springer
Verlag.
QUT: Supporting real world learning.
http://www.otq.qut.edu.au/initiatives/projects/.
Accessed 23 Oct 2009.
Robins, A., Rountree, J. and Rountree, N. (2003):
Learning and teaching programming: a review and
discussion. Journal of Computer Science Education
13(2): 137-172.
Sheard, J. and Hagan, D. (1998): Our failing students: a
study of a repeat group. ACM SIGCSE Bulletin 30(3):
223-227.
Simon, B. and Hanks, B. (2007): First year students'
impressions of pair programming in CS1. Proc. Third
International Workshop on Computing Education
Research, Atlanta, Georgia, USA, ACM.
Soloway, E.I. and Spohrer, J.C. (1989): Studying the
novice programmer. Hillsdale, NJ, Lawrence Erlbaum
Associates.
Teague, D. and Roe, P. (2009): Learning to program -
from pear-shaped to pairs. Proc. First International
Conference on Computer Supported Eductaion, Lisbon,
Portugal, INSTICC Press.
The Interim Review Task Force ACM/IEEE-CS (2008).
Computing science 2008: an interim revision of
CS2001. ACM and IEEE - CS.
The Joint Task Force for Computing Curricula
ACM/AIS/IEEE-CS (2006). Computing curricula
2005: the overview report. ACM and IEEE Computer
Society.
The Joint Task Force on Computing Curricula IEEE-
CS/ACM (2004). Curriculum guidelines for
undergraduate degree programs in software
engineering. ACM and IEEE Computer Society.
Thomas, R., Cordiner, M. and Corney, D. (2010): An
adaptable framework for the teaching and assessment
of software development across year levels. Proc.
Twelfth Australasian Computing Education
Conference, Brisbane, Queensland, Australia, ACS.
Urness, T. (2009): Assessment using peer evaluations,
random pair assignment, and collaborative programing
in CS1. Journal of Computing Sciences in Colleges
25(1): 87-93.
Varma, R. (2006): Making computer science minority-
friendly. Communications of the ACM 49(2).
Vilner, T. and Zur, E. (2006): Once she makes it, she is
there: gender differences in computer science study.
Proc. 11th Annual SIGCSE Conference on Innovation
and Technology in Computer Science Education,
Bologna, Italy, ACM.
Williams, L. and Kessler, R.R. (2000): The effects of
“pair-pressure” and “pair-learning” on software
engineering education. Proc. 13th Conference on
Software Engineering Education & Training, Austin,
Texas, USA, IEEE Computer Society.
Wilson, J.D., Hoskin, N. and Nosek, J.T. (1993): The
benefits of collaboration for student programmers.
Proc. 24th SIGCSE Technical Symposium on Computer
Science Education, Indianapolis, Indiana US, ACM.
Zagal, J.P. and Bruckman, A.S. (2007): GameLog:
fostering reflective gameplaying for learning. Proc.
2007 ACM SIGGRAPH Symposium on Video Games
San Diego, California, ACM.
CRPIT Volume 103 - Computing Education 2010
72

Constructive Controversy as a Way to Create “True Collaboration” in an Open Ended Group Project Setting
Mats Daniels and Åsa Cajander Department of Information technology
Uppsala University PO Box 337, 751 05 Uppsala, Sweden
[email protected] and [email protected]
Abstract1 The IT in Society course is based on an Open Ended Group project framework that has been developed in an action research manner. It is a course where students participate in a real project, where they have the possibility to take part of an unusual learning experience where they address a complex and multifaceted real problem. A learning theory has evolved in parallel to the process of developing the course, and this paper will illustrate how the instructional procedure constructive controversy has influenced a recent development of the course and the underlying learning theory. The focus has been on the issue of creating “true collaboration” through introducing the action speed dating.
Keywords: Open Ended Group Problems, action research, constructive controversy
1 Introduction The IT in Society course [Laxer, Daniels, Cajander & Wollowski, 2009] is based on an Open Ended Group project framework that has been developed in an action research [McKay & Marshall, 2001] manner. A learning theory has evolved in this process and this paper will illustrate how constructive controversy [Johnson & Johnson, 2009] has influenced a recent development of the course and the underlying learning theory. The focus has been on the issue of creating “true collaboration” [King, 2007] through introducing the action ‘speed dating’.
There are two reasons for striving to create a setting where true collaboration is achieved. The foremost being that it is an essential part of the constructivist model of learning assumed, but it is also seen as important for the outcome of the project in the course. Hence true collaboration in this setting would improve the learning experience as well as the product of the project. The latter is of importance for the collaboration, present and future, with the client and for the self esteem of the students.
Copyright © 2010, Australian Computer Society, Inc. This paper appeared at the Twelfth Australasian Computing Education Conference (ACE2010), Brisbane, Australia, January 2010. Conferences in Research and Practice in Information Technology, Vol. 103. Tony Clear and John Hamer, Eds. Reproduction for academic, not-for-profit purposes permitted provided this text is included.
Constructive controversy is based on the idea that discussions and controversies might create a good starting point when trying to understand a complex problem. Students will improve their skills to constructively and innovatively think and find solutions to complex and wicked problems. In this paper we will describe how we used the ideas of constructive controversy to enhance the learning experience in a project course through the use of speed dating as a method.
The outline of the paper is to first present the action research framework, the educational setting, and the main underlying learning theories relevant for the action studied in order to provide a background. This is complemented with a short description of views of collaboration and a capturing of previous attempts to address the issue of true collaboration. Speed dating was introduced 2008 in order to promote collaboration. A more structured, scripted, version of speed dating is the action suggested to enhance the learning environment with regard to true collaboration. The new version of speed dating is described and motivated from a constructive controversy point of view.
2 Method Action Research is the methodology used in the work reported here and it has been the work model for several years in developing the IT in Society course [Laxer, Daniels, Cajander & Wollinski. 2009] and a learning theory corresponding to this course. The action research cycle as described in [Susman & Evered, 1978] is used to provide a setting for our discussions, where we consider the passing of one academic year as the time it takes to complete one cycle. We will start with Specifying learning by presenting some general findings related to one learning objective of the course preparing for the Diagnosing stage where the problem we wish to address is identified. The more concrete stages Action planning and Action taking follows and is the core of this paper. The Evaluation stage will be approached in two ways, first by recapturing the results from a first prototype of the action taken during 2008 and then by outlining the manner of capturing relevant data from the action implementation in the 2009 course.
We will further use the elements in the action research framework defined in [McKay & Marshall, 2001] to give a structure to the key dimensions of the work presented. The five elements are:
Proc. 12th Australasian Computing Education Conference (ACE 2010), Brisbane, Australia
73

[F] the research framework or conceptual element informing the research;
[MR] the research method to be adopted;
[MPS] the problem solving method that will be used in the practice situation;
[A] the problem situation of interest to the researcher (the research questions);
[P] the problem situation in which we are intervening (the practice questions of interest to the practitioners).
Where F comprises Constructivism [Piaget, 1970], an Open Ended Group Projects (OEGP) framework [Faulkner, Daniels & Newman, 2006], Cognitive load [Miller, 1956], Collaborative learning [Dillenbourg, Baker, Blay & O’Malley, 1996]. The research method MR used is what could be called Practical action research. Scripting [King, 2007] what the students last year invented under the name ‘speed dating’ will be used to build a scenario for creating a Constructive conflict [Johnson & Johnson, 2009] situation as the problem solving method MPS. The problem situation A of interest is how to facilitate a learning situation where true collaboration within the student cohort is achieved. The problem situation P is finding relevant overlap between the work done in subgroups in the student project team.
In prior years we have used the dual action research cycle to generate knowledge about: global collaboration, the introduction of an external mentor and gender in education. Some of these iterations have resulted in international research publications, most notably [Daniels, Cajander, Clear & Pears, 2010] and all the iterations have improved the learning experience of the students.
3 Educational Setting The IT in Society course is run in collaboration with a course in USA (Communication in a Global Society) and is offered to students taking the first semester of the fourth year. The course accounts for half of the study load for a student during that semester in the IT engineering degree program at Uppsala University, Sweden. A goal of the IT in Society course is that the students should be able to constructively participate in a project dealing with a complex and multifaceted problem set in a real environment.
The educational setting is described in [Laxer, Daniels, Cajander & Wollinski. 2009]. Some issues in the 2008 instance: introduction of an external mentor [Cajander, Clear, and Daniels, 2009]; and an analysis of the process [Cajander, Clear, Daniels, Edlund, Hamrin, Laxer & Persson, 2009] done mostly by the students themselves, also provide useful information about the course. A short summary might however be useful in reading this paper.
Since 2002 the setting has been the Uppsala Academic hospital and since 2004 all students have been involved in the same project. The number of students has varied from 20 to 45, depending on the year. The results in the course
have several times been presented at the European Council level.
4 Theoretical Background Theories of learning are central to the action research approach taken by the authors and this section will briefly introduce Constructive controversy and Open Ended Group Projects (OEGP). Constructive controversy is relevant to the MPS element in the framework by McKay and Marshall and OEGP is an important framework for the research. The evolved learning theory for running the IT in Society course is also part of the research framework, equally in the F element.
4.1 Constructive Controversy Controversy is a (negatively) loaded word and is something that most teachers would by instinct try to avoid in their courses. Constructive on the other hand conveys a clear positive signal to these teachers. The combination of the two still leads to warning signals and thoughts related to conflict. The potential of constructive controversy as an instructional procedure is however quite promising. Johnson and Johnson define it as follows:
Constructive controversy exists when one person’s ideas, information, conclusions, theories, and opinions are incompatible with those of another and the two seek to reach an agreement [Johnson & Johnson, 2007]
The key aspect for the concerned teacher is the seeking of agreement. The important aspect in a learning situation is the focus on different aspects of an issue. The literature about constructive controversy [Smith, Johnson & Johnson, 1981; Johnson & Johnson, 2009] typically contrasts the method with ‘Concurrence seeking’ regarding the conflict or controversy side and with ‘Debate’ relating to the issue of bringing up alternative views.
The drawback with concurrence seeking is the danger of not considering alternative solutions and becoming too focused on the positive aspects of the solution selected. An analogy is to see all “problems” as nails when one has a hammer as a tool.
The debate on the other hand does address the issue of not giving enough space to alternative solutions, but the problem is that there is no incentive to look into the virtues of alternative solutions. The whole point is to prove ones own solution as superior at the expense of the others.
The benefit of constructive controversy is that alternative solutions will be presented and adequately considered and efforts will be made to find ways to reconcile the differences in finding a satisfying solution considering the different aspects that has been brought forward in the process. The idea is that the participants needs to have a thorough understanding of the different aspects, including questioning their own solution, in order to be constructive in their seeking of agreement. There is an emphasis on
CRPIT Volume 103 - Computing Education 2010
74

creating new solutions as opposed to sticking to original ones as in e.g. a debate.
Demonstrated effects of constructive controversy are an epistemic curiosity for new information and perspectives even after the course, high achievement in task at hand, building of positive relationships among the students [Johnson & Johnson, 2009] which are highly valuable outcomes and indicate that the approach should be considered for adoption. The cautionary view of many teachers when being asked about using constructive controversy in their courses does have relevance, in that non-resolved conflicts, with all the accompanying negative consequences, can occur. The implementation of the method is thus of high importance and the prototype version of speed dating used in the 2008 course instance indicates that with proper scripting a successful implementation is likely.
To summarize, the aspects of constructive controversy concerning learning are in accordance with the learning theory developed around the OEGP based IT in Society course. Furthermore, scripting the speed dating concept based on the constructive controversy concept seems like a promising approach towards improving collaboration in the course.
4.2 Open Ended Group Projects The Open Ended Group Project (OEGP) framework referred to in this paper is described in [Faulkner, Daniels & Newman, 2006; Hauer & Daniels, 2008]. It is based on a similar view of learning as underpins Problem Based Learning [Kolb, 1984; Kolmos & Algreen-Ussing, 2001], Situated Cognition [Brown, Collins, & Daguid, 1989], Practice fields [Barab & Duffy, 2000], and Communities of Practice [Wenger, 1998]. It is furthermore closely related to ideas concerning use of ill-structured problem solving [Jonassen, 1997].
The view of knowledge, the epistemology, is constructivism [Piaget, 1970] in which knowledge is constructed in interaction with the environment. Thus construction of knowledge, here seen as learning, is seen as a social process. The immersion of the learner in a complex realistic real world problem is seen as instrumental for creating the context for learning. The need for discussion is paramount in addressing open ended problem and the social process vital for learning is a natural component of an OEGP setting. Selecting a real world problem stems from the concern of finding a problem that is relevant for the learner. A good problem is defined in [Brooks & Brooks, 1999] as one that:
• Requires students to make and test at least one prediction.
• Can be solved using only equipment and facilities that are available.
• Is realistically complex. • Benefits from a group effort. • Is seen as relevant and interesting by students.
The actual implementation of an OEGP can unsurprisingly vary considerably depending on a number of factors, e.g.:
• Where it occurs in the academic programme (i.e. which year/semester).
• Number of students involved. • Time available for the OEGP. • Academic credit offered for the work. • Method by which groups are formed and managed. • Type of task chosen as the problem. • Inter-relationship between the groups. • Educational 'objectives' or 'intended learning
outcomes'.
We wish to conclude this paragraph with a quote from [Faulkner, Daniels & Newman, 2006]
“An OEGP can often be a way of creating a much more exciting and fulfilling environment for the teacher too since with an OEGP both students and teacher are carrying out a piece of work the result of which may be wholly or partially unknown. As the backgrounds of the students are likely to be very different, their attitudes and solutions to problems will be different too and this makes for a much richer and more exciting learning experience since they will come across a mix of solutions that they would not find on their own. The OEGP approach has the added advantage that plagiarism, typically a serious concern for coursework exercises, has not been a problem for any of the authors.”
4.3 The Theory of Learning in the IT in Society Course
Action research is used to develop and evaluate actions introduced in the IT in Society course. It is also used when developing a theory of learning underlying the course, or rather a sequence of theories starting from a rather pure OEGP version to versions where other related learning theories are blended in to create a more “scaffolded” version of OEGP. The development towards a more scaffolded version is due to observations that some students have not been able to accommodate to a “genuine” OEGP approach. Time constraints and unfamiliarity with the education setting can lead to too high a cognitive load and might be explanations for the unsatisfactory situation.
Developing a balance between scaffolding and a “genuine” OEGP is a delicate task [Hauer & Daniels, 2008] and the approach in this case will be in the form of scripting. Scripting, i.e. giving a script for the students to follow, will be used as a scaffold by providing a scenario in which the students will be guaranteed to experience all the aspects of the Constructive controversy situation.
5 The True Collaboration Issue Here, the problem situation A is described and discussed. We have experienced that students in the project focus too much on their own perspective of the project and that there is a lack of true collaboration.
5.1 Collaboration vs. Cooperation This is related to the discussion comparing collaboration and cooperation as presented in [Dillenbourg, Baker, Blay
Proc. 12th Australasian Computing Education Conference (ACE 2010), Brisbane, Australia
75

& O’Malley, 1996; King, 2007] and by others in the cognitive psychology domain. This is captured by King as follows:
Generally the term collaborative learning means that learners are engaged in activities that are intended to introduce socio-cognitive processes. This meaning implies an important distinction between collaborative and cooperative learning. Cooperative learning often involves separate activities by individuals through the distribution of labor or task components, with little of the joint activity that induces socio-cognitive processes so characteristic of true collaborative learning. (p. 18)
This description of collaborative learning fits well with the intention of collaboration in the IT in Society course.
5.2 Previous Iterations The issue of true collaboration is, as we see it, closely related to the motivation aspect in the course. Situating the project in the hospital and addressing a real problem has been introduced in order to increase motivation to work hard in the project and to aim for high quality. This has largely been a successful approach.
The setting deemed most important in order to achieve true collaboration has been the OEGP approach. The framework, if successful, is based on the students owning the problem as well as the solution. The students are however not used to the OEGP approach and some never seem to ‘get over the hump’ and end up in some sort of limbo not knowing what to do. The approach up till now has mainly been based on informing the students about the learning theory and pointing out collaboration as an important vehicle towards outstanding and interesting solutions.
Another attempt to increase motivation in line with OEGP ideas has been the adding of an international component in the form of students from the US. This is based on the students recognizing the ability to collaborate in an international setting as an important skill in the increasingly global workplace. To actually run a close collaboration with participants on two sides of the Atlantic is however nontrivial and often leads to low levels of collaboration. This component has for many students been seen as too complex and they have thus avoided close involvement.
5.3 Next Iteration We have seen improvement, but some students in the course still remain in a confused or non-interested state. They are not motivated enough to put in a real effort and do not see the value of collaboration, but rather look towards cooperation in order to get the basic version done.
The attempts described above will continue to be the base in our efforts to create a learning environment fostering true collaboration. This has however been deemed deficient in creating a learning environment in which the students are truly collaborating. The step to remedy this shortcoming and the next evolution of the learning theory
behind the IT in Society course will include using constructive controversy in order to push the students towards true collaboration.
6 “Speed Dating” as Conveyor of “True Collaboration”
6.1 Speed Dating The speed dating concept was introduced in the 2008 version of the course as a student initiative. The students were faced with having to do a major restructuring of the white paper they were working on and needed a way to get the whole cohort up to speed with the new direction as well as identifying concrete examples on what to enter into the new structure. An afternoon was set aside in which each of the seven subgroups met with all the other subgroups and tried to identify common issues during a quick meeting [Cajander, Clear, Daniels, Edlund, Hamrin, Laxer & Persson, 2009].
This turned out to be an effective way to get a large portion of the students aware of the project as a whole and how their own work fitted, as well as providing useful insights into who could address an issue that subsequently surfaced in the work to create the white paper. The authors, who were teachers in the course, were of the opinion that the collaboration was of a depth and genuineness that had a much stronger sense of true collaboration than in earlier instances of the course. This is of course not solely due to the speed dating exercise, but the contribution was deemed to be highly important.
6.2 Relation to Constructive Controversy The idea of speed dating worked well in 2008, but the felt potential of the idea was not reached. The constructive controversy model will be used to provide an informed decision in line with the ambitions in our action research approach to developing the course. The aspects to pay attention to are how to ensure that the students will be involved with the stages related to constructive controversy [Johnson & Johnson, 2009]:
1. Students are assigned problem/decision, initial conclusion
2. Students present and listen, are confronted with opposing position
3. Students experience uncertainty, cognitive conflict, disequilibrium
4. Cooperative controversy 5. Epistemic curiosity, information search 6. Incorporation of new information, adaption to
diverse perspectives, new conclusion
These stages and the underlying learning model will be integrated in the new version of the learning theory for the course and as such serve as the guiding light for the development of the script for the speed dating activity.
6.3 Plans for the 2009 Course Instance There will be two speed dating instances, one mid way with the prime focus on creating trust among the students
CRPIT Volume 103 - Computing Education 2010
76

and concrete insights into the value of true collaboration. This will be based on having formed a firmer opinion and knowledge about their specific subgroups. The second one will be held near the end of the course when the students need to truly integrate what they know in creating a document for the client. The focus for the first instance is on issues clearly identified as being valuable for the progress of the project as a whole. One aspect is to prepare for a potential restructuring of the groups, where subgroups may be closed and new subgroups formed as well as students moving into new constellations.
There will be scripts for pre and post meetings as well as a script for the speed dating event to be followed including a definition of specific roles for the students to follow at the speed dating event. The pre and post meetings are important parts of the constructive controversy component. The scripts will serve both as a guide for the students on how to act in line with the learning theory for this action and as a way for us to get information about the result of the action.
The plan for the first speed dating instance is related to the six stages of constructive controversy in the following manner.
Stage 1 This is based on the students having become “experts” in the area of their subgroup (each subgroup is responsible for one area within the overall project) during the project up till the pre meeting point in time. The assignment at the pre meeting is to identify, for each of the other subgroups, something the subgroup wants them to do in order to strengthen their work.
Stage 2 This is done during the speed dating event where each subgroup will have a short meeting with all the other subgroups. Both groups in a meeting will follow a script in which the members act according to specific roles and where both groups present something that they want the other group to do to help them. The proposition will come from the perspective of the presenting subgroup and may be in conflict with how the other subgroup wants to spend its time.
Stage 3 The propositions will be based on a perception from the other subgroup about what the area is for a subgroup and what the value of that area is for the overall project. This is in most cases likely to be an enlightening experience for the students and one where doubt and conflicting thoughts will arise.
Stage 4 The outcome of the speed dating meeting is an agreement on how to proceed with each proposition. This should be based on the criteria of spending time on the action being of value to the project overall. This is deemed to require a fair amount of creative thinking and in line with realizing values essential in true collaboration settings.
Stage 5 The speed dating event is intended to give the students a genuine understanding of the project as a whole and
create a curiosity about how they best can contribute to the progress. This stage will start during the speed dating event and is assumed to continue during the rest of the project (as well as after the course).
Stage 6 This stage is associated with the post meeting in which plans for the reminder of the project will be defined.
7 Conclusions The constructive controversy model has been used to inform the development of a new action for the IT in Society course and the learning theory for the course has been modified accordingly as part of an action research approach. One essential benefit of this approach is to have a structure to refer to when it comes to specifying how to change the course. It has also been important to have the benefits and pitfalls presented in the development process.
The changes do not sit in a vacuum and it is also imperative that the overall learning theory for the course is not violated. Of special interest here is not over specifying what the students should do in order to keep the learning benefits associated with the OEGP framework. Important in the process of keeping a balance has been to look into work concerning different methods for working together. The “true collaboration” concept as defined in [King, 2007] has been useful in this case.
The approach is also deemed to be beneficial for the international collaboration aspect of the course. Firstly as a byproduct of a deeper collaboration, but also as an opportunity to lift cultural difference to the light. An example of the latter is to discuss the effects of the gap between the consensus searching Swedish culture with the more (early) decision oriented American approach.
References Barab, S. & Duffy, T. (2000): From practice fields to
communities of practice, Theoretical Foundations of Learning Environments, eds. Jonassen, D, H and Land, S, M, Lawrence Erlbaum Ass. Inc, 25-56
Brooks, M. & Brooks, J.(1999): The courage to be constructivist, Educational leadership, vol. 57, no. 3.
Brown, J. S., Collins, A. & Daguid, P. (1989): Situated cognition and the culture of learning, Educational Researcher, vol 18, no 1., 32-42
Cajander, Å., Clear, T. & Daniels, M. (2009): Introducing an External Mentor in an International Open Ended Group Project, ASEE/IEEE Frontiers in Education, San Antonio, USA.
Cajander, Å., Clear, T., Daniels, M., Edlund, J., Hamrin, P., Laxer, C. & Persson, M. (2009): Students analyzing their collaboration in an international Open Ended Group Project, ASEE/IEEE Frontiers in Education, San Antonio, USA
Proc. 12th Australasian Computing Education Conference (ACE 2010), Brisbane, Australia
77

Daniels, M., Cajander, Å., Clear, T. & Pears, A. (2010): Engineering education research in practice: Evolving use of open ended group projects as a pedagogical strategy for developing skills in global collaboration, International journal of engineering education, accepted for publication.
Dillenbourg, P., Baker, M., Blaye, A. & O’Malley, C. (1996): The evolution of research on collaborative learning, Learning in Humans and Machine: Towards an interdisciplinary learning science, eds. Spada E. & Reiman, P., Elsevier, 189-211.
Faulkner, X., Daniels, M. & Newman, I. (2006): The Open Ended Group Project: A way of including diversity in the IT curriculum, Diversity in Information Technology Education: Issues and controversies, ed. Trajkovski, G., Information Science Publishing, 166-195
Hauer A. & Daniels, M. (2008): A learning theory perspective on running open ended group projects (OEGPs), CRIPT, vol. 78, 85-92.
Johnson, D. & Johnson, R. (2007): Creative constructive controversy: Intellectual challenge in the classroom, 4th ed, Edina.
Johnson, D. & Johnson, R. (2009): Energizing learning: The instructional power of conflict, Educational Researcher, vol. 38, no. 1, 37-51
Jonassen, D. H. (1997): Instructional design models for well-structured and ill-structured problem-solving learning outcomes, Educational technology Research and Development, vol 45, no 1, 65-94
King, A. (2007): Scripting collaborative learning processes: a cognitive perspective,
Computer-Supported Collaborative Learning, vol. 6, Springer Verlag, 13-37.
Kolb, D. (1984): Experiential learning: Experience as the source of learning and development, Prentice Hall.
Kolmos, A. & Algreen-Ussing, H. (2001): Implementig problem-based and project organized curriculum, Das Hochschulwesen, 1, 15-20
Laxer, C., Daniels, M. Cajander, Å. & Wollowski, M. (2009): Evolution of an international collaborative student project, CRPIT, vol. 95, 111-118.
McKay, J. & Marshall, P. (2001): The dual imperatives of action research, Information Technology and People, vol. 14, 46-59.
Miller, G. (1956): The magic number seven plus minus two: some limits on our capacity to process information, Psychological review, vol. 63, 81-93.
Piaget, J. (1970): Science of Education and the Psychology of the Child, Orion.
Smith, K., Johnson, D. & Johnson R. (1981): Can conflict be constructive? Controversy versus concurrence seeking in learning groups, Journal of Educational Psychology, vol. 73, no. 5, 651-663.
Susman G. & Evered, R. (1978): An assessment of the merits of scientific action research, Administrative Science Quarterly, vol. 23, 583-603.
Wenger, E. (1998): Communities of practice: Learning, meaning, and identity, Cambridge University Press
CRPIT Volume 103 - Computing Education 2010
78

Introductory Programming in a Web Context
Michael de Raadt Department of Mathematics and Computing, Centre for Research in Transitional Pedagogies
University of Southern Queensland
Toowoomba, Queensland, 4350
Abstract
A number of studies have recognised the benefits of using
a context or theme consistently throughout an
introductory programming course. Examples of contexts
in which programming is related and taught include
micro-worlds, robotics, games and media computation.
Such contexts bring relevance to the content of
programming courses. In this paper, a Web context is
proposed and described. This context has been
successfully used in an introductory programming course
and received a positive student response..
Keywords: Introductory programming, context, Web.
1 Introduction
Traditionally, introductory programming has been taught
independently of any context; removed from the real
world to distil programming to its purest, simplest form.
Relevance has been achieved through assignments and
practical examples, but on the whole, programming has
been presented as an independent practice. A study of
assignments in “top” US computer science institutions
found, “Only 34% of the CS1 projects had a practical or
socially-relevant context, 41% had no context at all...”
(Layman et al., 2007, p. 459)
A context can be used consistently through an entire
course of programming, in illustrations of programming
concepts, practical exercises and assignments. Students
can become familiar with the context and see how
programming is relevant there. Often students may
already be familiar with the context before they begin.
Contexts can be stimulating and exciting and can be
relevant to novice programmers’ lives, outside of their
academic careers, thus providing an incentive to learn
about programming with a deep approach. “Engaging
students is critical for them to learn something well
enough to use it again in a new situation.” (Guzdial &
Soloway, 2002, p. 18).
At the same time, contexts can be detrimental to
students learning. If students learn in a particular domain,
it can be difficult for them to transfer their learning to
another domain. Within programming, if novices have
learned in one context they may see programming only in
the related domain. It is therefore important to choose a
domain that is relevant to students (Guzdial, 2005) and to
Copyright © 2010, Australian Computer Society, Inc. This
paper appeared at the Eighth Australasian Computing Education
Conference (ACE2010), Brisbane, Australia. Conferences in
Research and Practice in Information Technology (CRPIT),
Vol. 103. Tony Clear and John Hamer, Eds. Reproduction for
academic, not-for-profit purposes permitted provided this text is
included.
demonstrate how concepts learned in the chosen context
are relevant in other domains (Guzdial, 2009).
This paper begins with review of contexts that have
been used in introductory programming courses, and the
effects of using these contexts. A description of a Web
context and its use in an introductory programming
course is then described. This is followed by possible
impact results and measured student attitudes towards this
context. Finally, conclusions are made.
1.1 Contexts in Introductory Programming
A number of contexts have been used in introductory
programming courses. In this section, some of these
contexts are reviewed, and their effects reported. This
brief overview is far from comprehensive (as many
papers have been written on contexts), but provides a
number of examples from each context.
1.1.1 Micro-worlds
The earliest context proposed for teaching programming
was used in Logo (Papert, 1970), which focussed on
“physical examples” of geometric principles, in a
programmable graphical environment with Lisp-like
syntax. Seymour Papert believed physical analogies
involve students in their learning. “Without this benefit,
seeking to "motivate" a scientific idea by drawing an
analogy with a physical activity could easily denigrate
into another example of "teacher's double talk"” (Papert,
1980, p. 96).
Another example of a micro-world used for
programming is that of Karel the Robot (Bergin et al.,
2005), who embodies the notion of an object with
behaviours in a virtual world. A similar notion is used
with Jeroo, which attempts to engage novice
programmers on a virtual island (Sanders & Dorn, 2003).
Lister (Lister, 2004) used a micro-world called “Pig’s
World” to emphasise object-oriented concepts such as
message passing and containers, using fun-loving pigs as
objects.
A micro-worlds context is useful for teaching, but
students may not be able to transfer the relevance of this
context to the real world.
1.1.2 Robotics
Using robotics as a context for introductory programming
has been successful at a number of institutions. Imberman
& Klibaner (2005) report on the use of Lego robots in an
introductory programming course. “The drudgery of
traditional text based programming assignments was
replaced with a "real life" application” (p. 136). They
claim a positive student response.
Proc. 12th Australasian Computing Education Conference (ACE 2010), Brisbane, Australia
79

Summet et al. (2009) reported that students studying
programming in a robotics context were more successful
than students in non-robotics contexts (including media
computation and Matlab). Yet, when searching for
quantitatively improved student motivation, McWhorter
& O'Connor (2009) found little statistical evidence to
suggest Lego robots motivated students to learn. Follow-
up interviews in this study discovered that students did,
however, enjoy working with robots.
The downside to a robotics context is the cost of
robots and their availability to students. This context is
not convenient when students are studying via distance
education.
1.1.3 Games Programming
A number of papers have reported the use of games
programming as a context.
Bayliss & Strout (2006) used games programming in
an alternate CS1 course and compared student attitudes
with those in their traditional course. They found students
felt less intimidated by their peers in a games context,
Students reported bonding with other students through the
development of games.
Haden (2006) reported on the use of a games
programming context in a follow-on programming
course. Students created simple 2D games, applying
object-oriented techniques, physics and recursion.
Students were positive about their outcomes in the
course. A number of games were exhibited in a public
showing and were received with enthusiasm.
The success of a games programming context relies on
students having a familiarity with computer games and an
interest in producing them, which is not true for all
students. There may also be barriers created by the cost of
purchasing environments and suitable hardware for
games programming. Again this may be a limitation
when students are studying via distance education.
1.1.4 Media Computation
A media computation context for programming,
sometimes referred to as “media-comp”, was originally
considered for students from non-computer science
backgrounds (Guzdial, 2003). Initial studies of the use of
a media-comp context showed improved retention and
enthusiasm among students. Media computation has also
been shown to encourage greater participation of females
(Rich et al., 2004). Media computation involves the
manipulation of media such as images and sound files,
stimulating creative expression while still covering
programming concepts such as iteration and data
handling. The success of this context has encouraged
wider adoption (Yarosh & Guzdial, 2008).
2 A Web Context
A Web context, put simply, is students writing code
which is used in Web pages (JavaScript in HTML pages).
The description of a Web context given here relates to
Web pages as viewed in a Web browser. It does not
attempt to include a client-server model, merely files on
the local machine.
This context arose after a change of language in an
introductory programming course. Previously this course
had used the C programming language and was targeted
towards computer science students. After an
amalgamation of programs, this course became the single
introductory programming course for the university. The
mix of students changed also; currently, the greater
majority of students in the course will not go on to study
further programming, so a strong computer science focus
is unnecessary for these students.
A number of languages were proposed to replace C,
including Python. JavaScript was chosen as a
compromise as it had been used previously in a now
defunct course. Despite initial reservations over the
limitations of JavaScript, it soon became apparent that
this language could be used in a Web context, which has
advantages (and some disadvantages) when compared to
other contexts used in introductory programming.
2.1 Relevance to Students
It is hardly necessary to define “the Web” here in this
paper. Most people in developed countries have a
familiarity with the Web. Although students may be naive
about how the Web works, they do have an understanding
of what Web pages are and the interaction that can take
place in them. They are familiar with the purpose of
JavaScript, even if they have not heard this name before.
What is most important is for students to see that what
they are learning has relevance to themselves and to the
real-world. In that sense, a Web context is more potent
than any of the contexts mentioned earlier in this paper.
Figure 1. A simple card game in JavaScript
The Web context can be stimulating, reaching beyond
text based interaction to graphical user interfaces and
interactive programs. Figure 1 shows a simple card game
which students created in their final assignment (cards
must be revealed in the correct order and will reset on a
failed attempt).
Figure 2. Demonstrating a swap concretely
CRPIT Volume 103 - Computing Education 2010
80

Even before students can achieve this level of interaction,
it is possible to provide examples in materials that use
these ideas, without daunting students with complexity.
Figure 2 shows an illustration of a triangular swap plan.
One disadvantage of using JavaScript as a
programming language is that it must be used in, or with,
an HTML document. This means that HTML tag syntax
and document structure must be introduced, which creates
additional teaching. Persuading students that HTML and
the presentation of documents, is not the focus of the
course, is also somewhat problematic. Styles and CSS
were avoided in the course described here, but could be
studied in a course with a different focus.
2.2 Ability to Embed Malleable Examples in
Materials
The course described in this paper involved on-campus
students (28%) and external (distance) students (72%),
which is typical at this university. There is therefore an
emphasis on creating materials suitable for both modes.
In the course, all materials were presented online with
no paper alternative. The materials were also made
available to download and view offline, and recorded
onto CD for distribution to external students. Written
materials were complemented with short (~5min)
recorded video snippets of on-campus didactic teaching.
Exercises and examples were intermixed with teaching
materials so students would experience concrete
examples of code throughout each lesson. This mix of
teaching and practice was referred to as a workshop.
Figure 3. Embedded code examples in course
materials (note textareas with code and run button)
The key advantage of this approach was the potential
to provide examples of code, embedded in a page, which
could be edited and executed. An example of this is
shown in Figure 3. All code examples in the course were
presented in this manner. Students could manipulate and
test the examples immediately, without leaving the
learning environment.
These embedded examples are simple to create,
making use of the eval() function in JavaScript. The
text content of a pre-filled textarea can be passed to this
function and executed as code, with the same results as
normal code. Students can modify the code, on their own
or as directed in an exercise, and experience the results of
such changes immediately. HTML examples can be
achieved in a similar manner. HTML source can be
written in a text area and rendered to a section of the
document by assigning its innerHTML property.
The downside of such embedded examples is that it
creates a second way of entering code. Students are also
expected to create source code documents in a text editor.
The distinction between the two methods of entering code
must be explicit when giving students tasks.
2.3 Ability to Teach the Majority of Basic
Programming Concepts
JavaScript is not a general purpose language. It is
primarily a scripting language used to enhance Web
pages. Despite this, most concepts taught in a traditional
programming course can still be covered in this context.
The following topics were covered in the course
described here.
Programming process, HTML and JavaScript
Sequence
Values, Objects, Arrays, Operations, Dynamic
typing, Roles of variables
Expressions, Using functions
User I/O, String handling
Programming Strategies (Initialisation,
Averaging, Divisibility, Cycle position, Number
decomposition, Triangular swap)
Testing, Debugging, Programming style
Selection, Iteration
Programming Strategies (Summing and
Counting, Guarded exceptions, Counter
controlled loops, Primed sentinel-controlled
loops, Validation)
Writing functions, Recursion
Programming Strategies (Tallying, Searching,
Min/Max, Sorting)
Interacting with HTML objects, Forms, Events
Topics that are not covered in this course, but can be
covered using JavaScript, also include exceptions,
creation of objects (paradigm issues are discussed in
section 2.4) and possibly more advanced Web interaction
through technologies such as Ajax. It is even possible,
with perhaps some effort, to achieve media-comp, games
and micro-worlds contexts within JavaScript, although
going this far may confuse students. In a limited fashion,
a games context was used for some later assignments in
the course described here.
JavaScript, like other scripting languages, offers a
simple typing model. There are three primitive types:
numbers, strings and Booleans. Typing is not strict and
variables can change their type dynamically.
JavaScript offers a simple I/O model. The prompt()
function delivers a string input, which is easily converted
to the number type as either an integer or floating point.
Output can be in the form of simple alert() calls,
Proc. 12th Australasian Computing Education Conference (ACE 2010), Brisbane, Australia
81

which pop up a message box, or written to the document
body using document.write(). Output written to the
document body can include HTML tags, so students can
create formatted output such as tables and lists, however
writing to the document body from a script in the head
section can cause confusion for some students. Input and
output to a script can be extended to include form
elements and images (event driven programming will be
discussed in section 2.4).
Because JavaScript is limited to working in a Web
browser, it cannot be used to cover the following topics.
Compilers and libraries
File I/O
ADTs and Information hiding
For the majority of students who take this course alone as
a brief exposure to programming, these limitations are
acceptable. However, transitioning the smaller number of
continuing programming students to a general purpose
language does require more time and effort than using a
single general purpose language through a series of initial
programming courses.
2.4 Potential to explore multiple paradigms
JavaScript is a scripting language, however there is also
potential to explore other paradigms in the Web context,
to a degree that suits the instructor and the course. One
benefit of this flexibility is the possibility to start with
very simple scripts, then move to more complex
programs as the course progresses.
An imperative paradigm can be examined through the
creation and use of functions. Functions can be written in
a script and called as needed. One downside of writing
functions in JavaScript is that they are automatically
overloaded. For example, a function that has two
specified arguments can be called and supplied zero, one,
two or more arguments. It is the responsibility of the
programmer to check that sufficient arguments have been
provided and to ensure the function reacts accordingly.
Objects can be explored in a simple manner. A number
of built in “global” objects are provided in the language,
which are used for I/O, arrays, date and time, and
mathematical functions. Object-oriented programming
can be investigated to a greater depth, however the object
model presented in JavaScript is not as clear as in other
OO languages. Firstly, there are no classes, only objects,
some which can be copied and some which cannot. It is
possible to use global objects without copying them,
which can cause problems. Functions are objects and
primitive types can also be treated as objects.
Graphical user interfaces and event driven
programming can be explored through the use of HTML
forms and images. This was explored in the last part of
the course described here. Some students had trouble
understanding a second paradigm. Interacting with
HTML elements is not trivial as each has its own set of
properties. Care must also be taken when dealing with
timeouts as this can result in unwanted parallel sub-
processes in a program.
2.5 Consistent environment across platforms
Consistency between browsers is not a great issue with
JavaScript. The ECMA standard is followed in almost all
browsers. Incompatibilities tend to arise in the use of
styles and formatting. The only JavaScript
incompatibility that arose in the course was the use of the
const modifier, which is not supported by Internet
Explorer and was therefore avoided (unfortunately). Any
script written by students should have worked equally
well in all browsers. Students were encouraged to use the
Firefox browser as it is available for and consistent across
multiple platforms. It can also be extended to support
JavaScript development as described in section 2.6.
2.6 Access to error messages and debugger
The Firebug add-on for Firefox includes an error console,
debugger and stack tracer. These were particularly useful,
right from the start of the course. JavaScript error
messages are not perfect, but they are relatively
informative and accurate, especially considering the
interpreter is relaxed about syntax. Testing and debugging
were introduced into the course, which was not possible
with previous languages without forcing students to use a
specific platform. The stack tracer worked remarkably
well and assisted in illustrating recursive function calls
without great effort.
Figure 4. Debugger and Stack Trace
An example of the debugger and a stack trace is shown in
Figure 4.
3 Evaluation
To evaluate the Web context after it was used in an
introductory programming course, impact on student
retention and student attitudes were measured.
Student results were not comparable with previous
instances of the course as the student cohort had changed
after an amalgamation of programs. Student retention is a
major problem in the course being examined here; more
students drop out of the course than those who complete
the course and fail. Student retention can be seen as
removed from student potential so it is possible to
examine impact in that regard. Impact was measured by
comparing participation in the course with previous
instances of the course. Participation was judged by
submissions of assignments and the completion of the
examination. Results of this comparison are shown in
section 3.1.
To measure student attitudes a survey was conducted
after the final assignment deadline and before the exam.
The anonymous survey contained six questions related to
the Web context, including five five-point Likert scale
statements and the potential to add a free-form comment.
The survey was delivered using a feedback facility of the
learning management system used in the course. Students
CRPIT Volume 103 - Computing Education 2010
82

were encouraged by email to participate, but participation
was voluntary. Results of this survey are shown in section
3.2.
3.1 Impact
Participation in the course was measured by counts of
assignment and exam submissions. All assignments are
submitted electronically in the course, so a count was
easily obtained.
0%
20%
40%
60%
80%
100%
120%
Ass 1 Ass 2 Ass 3 Ass 4 Ass 5 Ass 6 Exam
S1 2008
S2 2008
S1 2009
Figure 5. Student retention
Student participation in the exam rose from 74% and 60%
in the previous two offerings, to 77% as shown in Figure
5. This is not significant, particularly in light of the
irregularity of the previous two semesters. A number of
other factors beyond the introduction of a Web context
may have affected this result, including the reduction of
the number of assignments from six to five, the
introduction of weekly quizzes with incentive marks and
the use of a new time-management tool for students.
What is interesting to note in Figure 5 is the
consistency of participation through the course. It could
be argued that students were more engaged.
3.2 Student Attitudes
This section reports on a survey of student attitudes
towards a Web context. Seventy-six survey responses
were recorded, corresponding to a response rate of 55%
when measured against initial enrolments, and to 75%
when measured against the total number of active
students at the time of the fifth and final assignment.
Students were asked what mode they were enrolled in.
The responses were 28% from on-campus students and
72% from external students, which was consistent with
enrolments in the course.
Instead of using the phrase “Web context” the term
“workshop” was used to describe the context through the
course and this was continued in the survey.
0 0.1 0.2 0.3 0.4 0.5
Strongly Disagree
Disagree
Neutral
Agree
Strongly Agree
Figure 6. I appreciated the mix of learning and
practice in the workshops.
Students were asked about the mix of learning and
practice in the course (Figure 6). It is clear that students
appreciated the practice they could achieve through the
embedded examples that were presented in this context.
0 0.1 0.2 0.3 0.4 0.5 0.6
Strongly Disagree
Disagree
Neutral
Agree
Strongly Agree
Figure 7. Being able to interact with embedded
examples was helpful to my understanding.
When asked if the embedded examples helped their
understanding (Figure 7), an even stronger majority
agreed that it was helpful. This is a clear indicator that the
potential that can be achieved in a Web context is valued
by the students.
0 0.1 0.2 0.3 0.4 0.5
Strongly Disagree
Disagree
Neutral
Agree
Strongly Agree
Figure 8. I was confused between when I should be
working in an embedded example and when I should
be working in my editor.
The majority of initial exercises made use of embedded
examples. As the course progressed students were
transitioned to writing code in a text editor. One concern
with this transition was that asking students to write code
in both these forms would cause confusion. The question
Proc. 12th Australasian Computing Education Conference (ACE 2010), Brisbane, Australia
83

(reported in Figure 8) asked students if they had been
confused by this change. This was a negatively phrased
statement. A majority of students disagreed, thus stating
they were not confused. A small proportion (12%) said
that they were confused and a number were neutral about
this statement. There is still a need to clearly distinguish
these two coding activities.
0 0.1 0.2 0.3 0.4 0.5
Strongly Disagree
Disagree
Neutral
Agree
Strongly Agree
Figure 9. The workshops presented materials that
catered for my learning style.
The notion of learning styles had been introduced during
the introduction to the course and students had measured
their learning style using the VARK questionnaire
(Fleming, 2009). The use of the Web context allowed the
materials to be presented in visual, aural, read/write and
especially kinesthetic modalities, within the same,
interactive documents. As shown in Figure 9, 75% of
participating students agreed that this mix catered for
their learning style.
0 0.05 0.1 0.15 0.2 0.25 0.3 0.35
Strongly Disagree
Disagree
Neutral
Agree
Strongly Agree
Figure 10. Completing workshops took more time
than I normally put into studying the materials of
other courses.
The final statement (in Figure 10) asked students if this
course required more time than other courses. This
received a mixed response (SA+A≈45%, N≈16%,
D+SD≈38%). Students in the course come from a variety
of disciplines including IT and other sciences, business,
engineering and the arts. There is a large part of the
cohort that sees this course as requiring more time and
work than their other courses (which is probably quite
true).
3.2.1 Comments
Students were asked to provide open comments using the
prompt “Please feel free to provide comments on the
workshops.” One of the reasons for asking for comments
was to discover if students saw a Web context as relevant.
No student specifically stated that it was relevant or
irrelevant; it seems they were familiar with this context
and merely accepted it. Some students expressed
surprised enjoyment in the course, and perhaps this can
be attributed to the context. The course material is well-
detailed and so I have had no trouble understanding what
is required of me. It is possibly even enjoyable! Wow.
The majority of comments were positive. A number of
students commented on the “format” of the workshops.
The workshop format is how courses of this nature should
be laid out.
Embedded examples were appreciated by students.
The most frequently repeated comment related to these
examples. The embedded examples are a great idea as
you have the ability to see the code working and also
make small modifications to see what the results will be.
Enhances learning (sic).
A number of negative comments provided by students
related to workload. I found the workshops took
considerably more time than other subjects, but that I
also had a much more thorough understanding of the
subject afterwards. This was consistent with Figure 10
and with student feedback on the course from previous
offerings conducted before the introduction of the Web
context.
Using a Web context was done, in part, to achieve
real-world relevance. Some students, it seems, cannot be
distracted from their own discipline. One student
commented, I couldn't relate how I'd need to know so
much about computer programming to be a surveyor.
Perhaps the best perspective was provided by a student
who had failed the course in its previous incarnation. The
teaching team has clearly put a lot of work into the
preparation of this course. It is truly appreciated... I have
previously undertaken this course with the C content and
found that to be difficult to follow and understand.
Please, please make all IT cou[r]ses like this one. It
should be noted that most of the concepts covered in the
course were repeated in the new version of the course;
some of the delivery methods changed slightly, but the
most significant change was the use of the Web context.
4 Conclusions
Use of a Web context has many advantages over a
traditional context-free introductory programming course.
Instructors intending to use a context in their introductory
programming teaching should consider the Web context,
particularly to provide relevance to a cohort from various
disciplines. The Web context is well suited for a blended
learning environment, providing more immediate
kinesthetic interaction than other contexts.
A Web context can be used across platforms with no
more than a Web browser and a text editor. It can be used
to teach multiple paradigms to varying degrees.
Students are familiar with the Web context. Students
appreciate the features made possible by a Web context,
particularly embedded examples which allow students to
experiment with example code.
It is clear that the use of a context doesn’t magically
make student’s workload disappear, but it may engage
and encourage them to participate longer.
CRPIT Volume 103 - Computing Education 2010
84

5 References
Bayliss, J. D., & Strout, S. (2006): Games as a "flavor" of
CS1. Proceedings of the 37th SIGCSE technical
symposium on Computer science education
(SIGCSE2006), Houston, USA 1-5 March, 2006. 500 -
504.
Bergin, J., Stehlik, M., Roberts, J., & Pattis, R. E. (2005):
Karel J Robot: A Gentle Introduction to the Art of
Object-Oriented Programming in Java. Redwood City,
USA, Dream Songs Press.
Fleming, N. D. The VARK Questionnaire,
http://www.vark-
learn.com/english/page.asp?p=questionnaire. Accessed
17 August 2009.
Guzdial, M. (2003): A media computation course for non-
majors. Proceedings of the 8th annual conference on
Innovation and technology in computer science
education, Thessaloniki, Greece. 104 - 108, ACM
Press, New York, NY, USA.
Guzdial, M. (2005): Design process for a non-majors
computing course. Proceedings of the 36th SIGCSE
technical symposium on Computer science education
(SIGCSE2006), St. Louis, USA 1-5 March, 2006. 361 -
365.
Guzdial, M. (2009): Contextualized Computing
Education of Programming. Proceedings of the
Eleventh Australasian Computing Education
Conference (ACE 2009), Wellington, New Zealand, 20
- 23, 2009. 3.
Guzdial, M., & Soloway, E. (2002): Teaching the
Nintendo generation to Program. Communications of
the ACM, 45(4):17 - 21.
Haden, P. (2006): The Incredible Rainbow Spitting
Chicken: Teaching Traditional Programming Skills
Through Games Programming. Proceedings of the
Eighth Australasian Computing Education Conference
(ACE2006), Hobart, Australia, January 2006. 81 - 89.
Imberman, S. P., & Klibaner, R. (2005): A robotics lab
for CS1. Journal of Computing Sciences in Colleges,
21(2):131 - 137.
Layman, L., Williams, L., & Slaten, K. (2007): Note to
self: make assignments meaningful. Proceedings of the
38th SIGCSE technical symposium on Computer
science education (SIGCSE2007), Covington,
Kentucky, USA 7 - 9 March, 2007. 459 - 463.
Lister, R. (2004): Teaching Java First: Experiments with
a Pigs-Early Pedagogy. Proceedings of the Sixth
Australasian Computing Education Conference
(ACE2004), Dunedin, New Zealand, 18 - 22 January,
2004. 193 - 199.
McWhorter, W. I., & O'Connor, B. C. (2009): Do
LEGO® Mindstorms® motivate students in CS1?
Proceedings of the 40th ACM technical symposium on
Computer science education (SIGCSE2009),
Chattanooga, USA 4-7 March, 2009. 438 - 442.
Papert, S. (1970): Teaching Children Thinking (LOGO
Memo), Massachusetts Institute of Technology, A.I.
Laboratory
Papert, S. (1980): Mindstorms: Children, Computers, and
Powerful Ideas, Basic Books, Inc., USA.
Rich, L., Perry, H., & Guzdial, M. (2004): A CS1 course
designed to address interests of women. Proceedings of
the 35th SIGCSE technical symposium on Computer
science education (SIGCSE2004), Norfolk, USA
March, 2004. 190 - 194.
Sanders, D., & Dorn, B. (2003): Jeroo: a tool for
introducing object-oriented programming. Proceedings
of the 34th SIGCSE technical symposium on Computer
science education (SIGCSE2003), Reno, Navada, USA
19-22 Februrary. 201 - 204.
Summet, J., Kumar, D., O'Hara, K., Walker, D., Ni, L.,
Blank, D., et al. (2009): Personalizing CS1 with robots.
Proceedings of the 40th ACM technical symposium on
Computer science education (SIGCSE2009),
Chattanooga, USA 4-7 March, 2009. 433 - 437.
Yarosh, S., & Guzdial, M. (2008): Narrating data
structures: The role of context in CS2. Journal of
Educational Resources in Computing, 7(4):1 - 20.
Proc. 12th Australasian Computing Education Conference (ACE 2010), Brisbane, Australia
85

CRPIT Volume 103 - Computing Education 2010
86

Approaches used by cross-cultural and cross-discipline students in
teamwork for a first-year course in web design
Kathryn Egea1, Soon-Kyeong Kim
1, Trish Andrews
2, and Karin Behrens
3
1School of Information Technology and Electrical Engineering
2TEDI
3 Institute of Social Science Research
The University of Queensland
Brisbane, 4072, Queensland
1kegea,soon{@itee.uq.edu.au},
Abstract
Cross-cultural and cross-discipline teams are
commonplace in ICT global work projects, an area
where students in an IT program may head. This paper
presents preliminary research that is concerned with
outcomes from an intervention strategy designed to help
students identify and address cross-cultural and cross-
disciplinary team issues while undertaking a series of
team-based assessment tasks in a web design course.
Students were asked to complete an online questionnaire
three times over the semester to rate attributes for
communication, task management, relationships, and
cultural dimensions as a means of self-assessing their
approach to teamwork. Using the data collected from
the three surveys, a quantitative evaluation was
conducted. This paper presents a preliminary result from
this analysis and also discusses future research
directions. .
Keywords: Information Technology Education, Cross-
cultural and cross-discipline team work.
1 Introduction
Global projects are becoming the norm in large
companies in the Information Communication
Technology (ICT) area. Significantly, organisations
benefit from the intercultural co-operation (Hofstede
and Hofstede 2004) within cross-discipline teams, often
in virtual working environments (Mitchell and Zigurs,
2009) to build improved interactive technologically
based products (Sharp, Rogers, and Preece 2007).
Consequently, successful cross-cultural and cross-
discipline teams are essential in ICT global work
projects, a popular destination for ICT graduates.
Teams are viewed as effective for today‟s
dynamically changing environment and hence are
valued by the workplace (Johnson and Johnson 2006).
Johnson and Johnson (2006) demonstrate that teamwork
improves students‟ academic performance,
communication skills, and builds higher student self-
esteem. They identify communication and leadership as
Copyright © 2010, Australian Computer Society, Inc. This
paper appeared at the Twelfth Australasian Computing
Education Conference (ACE2010), Brisbane, Australia,
January 2010. Conferences in Research and Practice in
Information Technology, Vol. 103. Tony Clear and John
Hamer, Eds. Reproduction for academic, not-for-profit
purposes permitted provided this text is included.
key aspects in building effective teams (Johnson and
Johnson 2006).
This study presents a team-based project used to
connect first year students in web design. The student
cohort has multiple disciplines and multiple national
cultures with the majority of student in transition from
high school.
For this study, the first-year first-semester students in
web design formed teams of four members, with at least
two disciplines and if possible two different national
cultures. Each student was required to reflect on the
importance of various team-working attributes in weeks
four, eight and 12.
1.1 Rationale of the project: the 2008 class
MMDS1400 is a first-year web design course offered at
the School of Information Technology and Electrical
Engineering (ITEE) at the University of Queensland
(UQ). In semester 1 2008, the course was redesigned to
include teamwork for the major assessment tasks. This
was based on the concepts that collaboration supports
transition and cross-discipline teamwork underpins the
course methodology. Teams were required to design,
develop and implement a 10 page website for a
particular client chosen by the students and framed by
user-centred website development methodology
presented in McCracken and Wolfe (2004).
The course was core to two programs: Bachelor of
Information Technology and Bachelor of Multi-Media
Design. Students from other programs including
engineering, science, arts and journalism also
participated in this first-year first-semester course.
In 2008, students self-grouped into teams of four
members. Some early assistance was given to support
team work (eg team charter) but limited formal
assistance was provided. Students were required to
monitor their own efforts each week in individual work
and teamwork. At the end of the semester, students
submitted a reflection on the effectiveness of their work
both as an individual in the course and in their
teamwork.
A significant number of individual student
submissions revealed diverse experiences and
expectations when working in a team with team
members from different cultures and disciplines. Many
reports demonstrated evidence of Hofstede‟s (Hofstede
2001) five dimensions of national culture: power
distance, uncertainty avoidance, individual/collective
Proc. 12th Australasian Computing Education Conference (ACE 2010), Brisbane, Australia
87

perspectives, achievement- orientation and reward
orientation. It became apparent to the course designers
that raising student awareness of the issues that affect
cross-cultural and cross-discipline teams and
intervention strategies to overcome such issues is a
necessary complement to building successful and
healthy team interaction.
1.2 The next step…
The authors applied for a small Teaching and Learning
grant from the Faculty of Engineering, Physical
Sciences and Architecture at the University of
Queensland to research student approaches to teamwork
under the proposed training program for teamwork. The
training program utilised the literature relating to cross-
cultural and cross-discipline team working within an
ICT globalised work force and academic environment
(see Section 2). It is noted that this paper focuses only
on the quantitative data collected over the semester.
Later papers will present qualitative responses provided
by teams and individuals over the semester.
2 Literature review
Teamwork focus is built on team members and their
interactions, the process of teamwork and the output of
the teamwork (Saunders 2000). Using Saunders‟s
virtual team lifecycle model, the initial stage of team
working considers the task requirements, the different
expectations of team members, the technology used for
working, and initial team training. The period that
follows, the process stage, considers both the socio-
emotional aspects of team building (relationships, team
cohesion and trust) and the task design and development
activity (communication, collaboration and task-
technology fit). At the completion of the team project,
the output stage, both the outputs and the level of
satisfaction of individual team members rate the team‟s
success.
Asherman, Bing and Laroche (2000) link trust with
productivity in teamwork, noting that cultural
differences play a key role in the creation of trust. They
note that trust is built in different ways, and has a
different meaning in different cultures. It is therefore
necessary to plan the course work around teamwork
through some form of training and the building of trust.
Ocker et al. (2009) indicate that team-training
modules help students in teams to work more
effectively within the domain of Information
Technology, in both face-to-face situations and
distributed virtual environments. These modules focus
on shared views of identity, trust, awareness,
coordination, competence, and conflict (to build more
creative solutions).
Using an alternative approach to team training, Egea
(2006) showed that a series of iterative reflections on
the concepts of communication and collaboration
(conversation, awareness and coordination) over the life
cycle of the team not only framed successful teamwork,
it also build stronger relationships between team
members, including trust.
Patterns of difference underpin the literature in cross-
cultural influences in team working. Hofstede (1996,
2001) examined 72 cultures and modelled the outcomes
into five dimensions of culture difference based on
national value (power distance, individual/collective
perspectives, masculine/feminine perspective [also
termed achievement orientation (Hofstede, 1996)],
uncertainty avoidance, long/short term orientation).
Using this data, Hofstede generated an index score
along a continuum for each cultural dimension for each
culture. Hofstede (2001) warned of the danger of
stereotyping, indicating that the score reflect cultural
generalities or half-truths (p.14) for the individual.
Approaching teaching of international students,
Sanderson (2007) advises awareness of these five
dimensions is useful for teaching, but advises lecturers
to get to know the students as individuals and move
beyond stereotypical views (p.7). Biggs (2003) argues
that for student-centred approaches of „teaching as
educating‟ (p. 138), one needs to focus on the
similarities between students rather than their
differences.
In other work, (Hofstede and Hofstede 2005)
modelled organisational culture as six dimensions based
on the practice of work: process/results; concern for
employee/job; inclusive/exclusive; identity is
parochial/professional; open/closed work environment;
loose/tight management; ideological/market driven
orientation. This approach builds from a hierarchical
model of management versus the employee, which is
not appropriate to cross-culture and cross-discipline
teams as established for this study. It is more likely that
teams will develop successfully based on their
communication and collaborative approaches to
teamwork as shown in Egea (2006) over the life cycle
of the team (Saunders 2000).
A number of studies explore cross-cultural
understandings using globally distributed teams where
teams draw members from multiple countries (Walther
1997, Altin, Bektik, et al. 2009). Several authors
address communication problems for international
students (Hinchcliff-Pelias and Greer 2004). Chin, Lu,
et al. (2009) showed that the major problem area faced
by International students studying in Australian
Universities was English-language related difficulties
while cultural differences had little or no impact.
The value of cross-discipline teams has been shown
to broaden the students‟ breadth of understanding in
their areas of study (Weinberg, White et al. 2005) and
prepare students for work (Tvedt, Tesoriero and Gary
2001). Other studies report teamwork across multi-
universities and multi-disciplinary environments. For
example, Burnell, Priest, and Durrett (2002) designed a
course in software design and identified the challenges
affecting team members: scheduling, mindset and
communication and special teaching skills to support
team members (technical and behavioural).
However, good teaching occurs when attention is
given to design through a constructively aligned
approach between the elements of the curricula. Biggs‟s
(2003) argues that good teaching overcomes issues of
culturally diverse classrooms. In his model, Three
Levels of Teaching, he describes the lowest level to be
assimilation involving student differences, the second
level to be accommodating involving teaching
CRPIT Volume 103 - Computing Education 2010
88

techniques, while the highest and third level to educate,
involving cognitive processes. This highest level attends
to „learning in context‟ where students develop skills
and the cognitive processes to achieve the learning
goals of the course. It is therefore essential that the web
design course develops a cognitive approach to team
working while the assessment design is aligned to the
course objective of building a web site that satisfied the
client‟s requirements.
Deeks (2004) examines success factors for cross-
discipline working and the cross-cultural working as
part of international teams working as The Cochrane
Collaboration. Building on the value systems that
underlie national culture difference (Hofstede 1996,
2001), Deeks (2004) describes these differences in
terms of team working, where team members work
internationally in cross-cultural teams:
1: Leadership Style
Hierarchy: Successful teamwork requires a leader
to provide direction and make decision
Collaboration: Successful teamwork requires the
contribution of all members, intense consultation
and group decision-making
2: Working Style
Risk Taking: Tries out new things and different
ways to approach tasks
Routine/ Regulation/ Formality: Prefers tried and
tested ways of doing things
3: Personal Goals
Individualism: Values self-determination,
individual success and the need to look after oneself
Collectivism: Values being part of groups, group
loyalty and promoting the interest of the group
4: Personal Goals
Achievement: Values success, achievement and
money
Harmony: Values quality of life, interpersonal
harmony and sharing
5: Personal Commitment
Long Term Orientation: Value commitment,
persistence and concern about the future
Immediate Gain: Value taking advantages as they
occur, consumerism, use what is available now
Since the approach by Deeks (2004) supports the
cross-discipline and cross-cultural makeup of the teams
in the web design first year undergraduate course, the
study will utilise these dimensions as part of the
individual reflection on team working within cross-
cultural and cross-discipline teams. Further, requiring
students to reflect on their changing personal values
during the process stage with the teamwork lifecycle
(Saunders 2000), will attend to both socio-emotional
factors and task management process and possibly
support more productive teamwork as found in the
earlier study (Egea 2006).
By attending to building stronger working
relationships though cross-cultural and cross-discipline
understandings, it is suggested that students themselves
will create satisfying team outcomes. This design is
discussed in detail in the next section.
3 Study design
Following 2008‟s preliminary examination, we
conducted a formal study into the cross-cultural and
cross-disciplinary issues in team work in the same
course in Semester 1, 2009.
The study developed and implemented an
intervention strategy designed to help students identify
and address cross-cultural and cross-disciplinary team
issues for the course MMDS1400 in Semester 1, 2009.
The project aimed to develop students‟ life skills for
teamwork in their university study and future workforce
tasks. Additionally, it aimed to develop an effective
teaching and assessment approach for effective cross-
cultural and cross-disciplinary teams.
3.1 Approach
Drawing from the literature, several instruments were
developed to support students‟ reflection on their
approach to teamwork including an online individual
survey, team health template and individual reflective
template. A fourth instrument was designed to collect
demographic data. Each of these instruments is
described below.
Each instrument was designed to cover four areas in
team working: communication, task management,
relationships and cultural dimensions. The aim was to
identify individual and team strengths and weaknesses
for each team.
The survey consisted of both qualitative and
quantitative items. The first component,
Communication, was designed to cover vocabulary
range (e.g. style – language expression, gesture – body
language), using technology, culture, discipline,
working style, other, with opportunities for individual
students to make a comment about their selection.
The other three components: Task Management,
Relationship and Cultural Dimension covered 23
attributes using a five point Likert scale indicating level
of importance (1 = lowest level of importance, 5 =
highest level of importance). Task Management had
four attributes (task description, responsibility of team
members, schedule/task plan, awareness of task and
completion by each member). Relationship addressed
nine attributes and includes trust, equal contribution,
cohesion, equal valuing of team members,
sharing/friendship, openness, respect, coordination. The
final area, Cultural Dimension had 10 attributes which
addressed hierarchical structure, collaborative structure,
risk taking, routine, individualism, collectivism,
achievement, harmony, long term orientation and
immediate gain.
Following the completed individual submissions, a
collated version of the individual responses was
provided to all team members. This team view
presented the average value for each attribute and
displayed each attribute as a numerical category. Figure
1 shows an example of how a team view might look. In
this example, the average for Hierarchical Structure is
Proc. 12th Australasian Computing Education Conference (ACE 2010), Brisbane, Australia
89

3.5, with each person choosing separate values from
level 2 to level 5. However, in Collaborative Structure,
with the same average of 3.5, we see that one person
has chosen level 3, two persons level 4 and one did not
choose any level (and was not included in this average).
It was envisioned that this view would enable the
team to discuss the team‟s health by identifying
attributes that contributed to team strengths and team
weaknesses. Students were directed to online resources
to help with devising strategies to address identified
weaknesses in the team interaction. To support this
process, for the first two surveys, time and guidance
was allocated for team health strategies in the tutorial
following the survey. The completed team health
document would then be submitted online as a course
assessment piece.
Figure 1: Example of how a team view might look
The final tool in supporting the students in
experiencing successful teamwork was the template for
individual reflection. Here the student was asked to
reflect on each of the four themes in terms of strengths
and weaknesses of the team‟s approach towards cross-
discipline and cross-cultural working. Feedback on the
usefulness of the individual survey, its frequency
alongside the team health discussion and submission
was also requested.
3.2 Student task
At the start of the semester, students formed teams (self-
select) and completed a team charter. Over the semester,
students in MMDS1400 were required to follow these
four steps to build strategies for healthy teams:
Step 1:
a) In week 4, students responded to demographic
survey
b) In week 4 and 5, team heath is accessed by the
following process
i. Students completed online survey to reflect their
cultural and discipline perspectives on teamwork
ii. Using collective view of survey for each team,
teams analysed their strengths and weaknesses and
identified a strategy to improve team health in
tutorial. Online documentation to support team
health was also available.
iii. Teams documented their analysis and strategies
to improve team health
Step 2:
a) In weeks 8 and 9, team health is again accessed as
in Step 1(b)
Step 3:
a) In weeks 12 and 13, teams repeat Step 1(b) to Step
(e) without class or tutor support
Step 4:
a) At end of semester, students completed an overall
reflection on the team strengths, weaknesses with a
direct focus on cross-discipline and cross-cultural
issues.
4 Data Analysis and Findings
This section presents the analysis of quantitative data
collected from the completion of the three surveys by
students as described in the previous section. This
relates to the 23 attributes used in the survey, which are
separated into the three components (task management,
relationship, and cultural dimension) in the following
section.
While each of the surveys has the same items, they
will be termed Survey 1, Survey 2, and Survey 3 to
delineate the different time periods of week 4, week 8
and week 12.
4.1 Participants
The 301 students enrolled in the course made up 81
teams. These teams were both cross-discipline and
single discipline teams with a large number of
international students threaded through the teams.
While most teams had four team members, five teams
had 2, 3 or 5 team members.
Overall, 96 students completed all three surveys, 99
students completed two surveys, 51 students completed
one survey, and 35 students did not complete the
surveys but were included in team health submissions. 7
students didn‟t respond to the survey at all or to the
team health submissions.
4.2 Method of Analysis
The data were analysed using SPSS (SPSS 2009). The
data analysis included frequency distributions,
descriptive statistics and comparisons of students‟ rating
scores of team work attributes in an analysis of variance
(ANOVA). Significant differences were reported with
regard to students‟ rating and these differences were
evaluated according to probability levels of .05 to .001.
These low probability values indicate that differences in
attribute ratings of comparison groups, such as single
versus cross culture, are not due to chance and thus
significant and support our findings.
4.3 Demographic Data
Students were asked to complete demographic
information to provide an indication of gender, age,
cultural influence, country of birth, discipline of study.
In all, 280 students completed some or all of the items
on the questionnaire. The student demographic
information is summarised below.
Gender: There were 126 females and 141 males who
responded to the questionnaire. Most students were 20
years or younger (196), 52 students were between 21
and 25 years old, 16 students were between 26 and 35
CRPIT Volume 103 - Computing Education 2010
90

years old and three were 36 years or older. 25 students
did not indicate their age group or gender.
Cultural influences: Most students indicated one
cultural influence (180), 66 students indicated two
cultural influences and 21 students indicated three or
more cultural influences, while 25 students did not
indicate their cultural influences.
Country of birth: Most students indicated Australia to
be their country of birth (176). Other countries of birth
included China (11 students), Taiwan (8 students),
Malaysia (8 students) and Singapore (6 students). Fifty-
eight students indicated that they were born in countries
other than Australia without selecting from the range of
countries in the demographic survey, while a further 25
students did not indicate their country of birth.
Discipline of Study: Most students were enrolled in the
Bachelor of Information Technology program (81), 65
students studied for the Bachelor of Communication, 43
students for the Bachelor of Multimedia Design, 24
students were enrolled in the combined Bachelor of
Communication/Arts, 14 students in the combined
Bachelor of Communication/Journalism and smaller
numbers of students enrolled in various other programs.
Team members from other disciplines:
When asked whether there were members from other
disciplines in their team, 233 students indicated that this
was the case, while 47 students indicated that there were
no members from other disciplines in their team.
Team members from other cultures:
When asked about the team composition 179 students
indicated that there were members from other cultures
in their team, while 101 students indicated that there
were no members of other culture in their team.
4.4 Findings
4.4.1 Cultural Differences (based on
individual perception of team members)
For the first survey (Survey 1), 136 students had
indicated that they were in a cross-cultural team while
75 students did not have members from another culture
in their teams. For the second survey (Survey 2) 135
students had indicated that they were in cross-cultural
teams and 64 students were not. For the third survey
(Survey 3), 100 students indicated they were part of a
cross-cultural team and 42 students were not.
There was only one significant difference between
the ratings of students who had indicated that they were
in a cross-cultural group and those of students who were
not. This difference occurred in Survey 2, for the ratings
about long term orientation (F=4.85, p=.03). On average
the 135 students in cross-cultural teams had higher
ratings for long term orientation (4.01), indicating
greater importance of this attribute in their team, than
the 64 responses from students who were in all Teams
where members are born in Australia (3.73).
There was one significant difference between
students in cross-cultural teams as compared to those in
all Teams where members are born in Australia for the
attribute of equal contribution (F=4.08, p=. 04). The
overall 371 responses from students in cross-cultural
teams had higher scores (4.27), indicating greater
importance of equal contribution in their teams, than
students in all Teams where members are born in
Australia (4.13).
Finally, when one explores student grades in relation
to the cultural choices, there were no significant
differences between students in cross-cultural and single
culture teams for either their individual and group
marks.
4.4.2 Cultural Differences (based on country
of birth) When considering the results of each of the three
surveys, there was one significant difference for Survey
1. This difference between the 138 students born in
Australia and the 72 students who were not born in
Australia occurred for the ratings of openness (F=4.72,
p=.031). Students who were not born in Australia rated
openness higher (4.01), indicating this to be of greater
importance, than those born in Australia (3.75).
For Survey 2, there was one significant difference
between the 125 students who were born in Australia
and the 72 students who were not born in Australia.
This difference occurred for coordination (F=4.571,
p=.034). Again, students who were not born in Australia
rated coordination higher (4.22), indicating this to be of
greater importance, than those born in Australia (4.01).
For the third survey (Survey 3), there were a number
of significant differences between the 87 students born
in Australia and the 55 students who were not born in
Australia. Students who were not born in Australia
indicated that the team attributes relating to a clear task
plan, coordination, collectivism and harmony were
more important to them than to students who were born
in Australia (Table 1).
Component
and Attribute
Born in
Australia
Not Born in
Australia ANOVA
M SD M SD F
Task Management
Clear task
plan 4.00 0.84 4.27 0.73 3.95*
Relationship
Coordination 3.93 0.73 4.24 0.67 6.33*
Cultural Dimension
Harmony 3.94 0.80 4.25 0.70 5.66*
Collectivism 3.75 0.82 4.02 0.65 4.26*
*p<.05
Table 1. One-Way Analysis of Variance for the
Effects of Born in Australia on Ratings of Team
Work Attributes for Survey 3
There were 350 responses from students who
indicated that they were born in Australia and 199
responses from students who were born elsewhere. A
number of significant differences occurred for the
attributes regarding teamwork and are presented in
Table 2. Students not born in Australia consistently
indicated greater importance of the attributes in
comparison to students who were born in Australia.
Proc. 12th Australasian Computing Education Conference (ACE 2010), Brisbane, Australia
91

There were no significant differences in the
individual and team marks between students who were
born in Australia and those that were born elsewhere.
Component
and Attribute
Born in
Australia
Not Born in
Australia ANOVA
M SD M SD F
Task Management
Clear task plan 4.03 0.74 4.25 0.74 10.31***
Relationship
Sharing/
friendship 3.61 0.88 3.77 0.91 4.55*
Openness 3.77 0.83 3.96 0.79 6.94**
Respect 4.25 0.74 4.38 0.78 3.95*
Coordination 4.01 0.73 4.22 0.66 10.37***
Cultural Dimension
Hierarchical/
leader 3.24 0.91 3.42 0.86 5.01*
Risk taking 3.20 0.73 3.33 0.73 3.97*
Collectivism 3.90 0.75 4.12 0.76 10.10**
Harmony 3.95 0.80 4.11 0.75 5.09*
*p<.05 **p<.01 ***p<.001
Table 2: One-Way Analysis of Variance for the
Effects of Born in Australia on Ratings of Team
Work Attributes for all three surveys
4.4.3 Discipline Differences (based on
individual perception of team members)
For the first survey 175 students indicated that they
were in teams with members from other disciplines,
while 35 students did not have members from other
disciplines in their teams. For the second survey, there
were 164 students in cross-discipline teams and 33
students in teams from a single discipline. And for the
third survey there were 117 students from cross-
discipline teams and 25 students in teams from a single
discipline.
When considering the responses for each of the three
surveys, for the first survey (Survey 1) there were no
differences between students in cross-discipline teams
and those in teams from a single discipline.
For Survey 2, there was one significant difference
for students‟ ratings regarding harmony (F=7.76,
p=.006). The students in cross-discipline teams had
higher ratings (4.01), indicating greater importance of
harmony in their teams, than the students from single
discipline teams (3.61).
For Survey 3, there were a number of significant
differences in the rating of attributes regarding team
work. Overall the ratings of students from cross-
discipline teams were higher, indicating greater
importance of the attribute, than the ratings of students
from single discipline teams. Table 3 presents the
particular attributes for each component that have
significant differences in ratings and the associated
average scores for cross-discipline and single discipline
teams.
When considering the ratings from all surveys
together, there were 456 responses from student in
cross-discipline teams and 93 responses from students
in single discipline teams. Table 4 presents the overall
average ratings for cross-discipline and single-discipline
teams. Interestingly the attribute regarding immediate
gain appeared to be more important to cross-discipline
teams overall, while when considering each survey
individually these differences were not significant.
Component
and Attribute
Cross-
discipline
teams
Single
discipline
teams
ANOVA
M SD M SD F
Task Management
Clear task
description 4.48 0.64 3.96 0.84 12.09***
Clear team
member
responsibilities 4.33 0.68 3.76 1.01 12.06***
Clear task plan 4.17 0.74 3.80 1.04 4.48*
Relationship
Coordination 4.11 0.63 3.76 1.01 5.07*
Cultural Dimension
Routine/
regulation 3.74 0.73 3.32 0.75 6.83**
Collectivism 3.91 0.71 3.56 0.96 4.46*
Achievement 4.18 0.67 3.76 1.23 5.65*
Harmony 4.13 0.76 3.76 0.78 4.79*
*p<.05 **p<.01 ***p<.001
Table 3: One-Way Analysis of Variance for the
Effects of Discipline on Ratings of Team Work
Attributes for Survey 3
Component
and Attribute
Cross-
discipline
teams
Single
discipline
teams
ANOVA
M SD M SD F
Task Management
Clear task
description 4.50 0.63 4.31 0.74 6.15*
Clear team
member
responsibilities
4.33 0.71 4.16 0.84 3.92*
Cultural Dimension
Harmony 4.07 0.76 3.74 0.83 13.52***
Collectivism 4.02 0.73 3.80 0.90 6.64**
Immediate
gain 3.52 0.81 3.31 0.94 4.96*
*p<.05 **p<.01 ***p<.001
Table 4. One-Way Analysis of Variance for the
Effects of Discipline on Ratings of Team Work
Attributes for all three surveys
There were significant differences for the individual
marks (F= 8.20, p = .004)) and for team marks (F= 7.25,
p =.007) for students in cross-discipline and single
discipline teams. Students in cross-discipline teams had
on average higher individual (76%) and team marks
(77.8%) than students in single discipline teams (71.7%
and 73.4%).
CRPIT Volume 103 - Computing Education 2010
92

4.4.4 Cross-Discipline Differences (based on
student discipline of study)
Definition of Cross-Discipline teams: Students were
divided into four discipline groups as detailed below:
1) Arts, Journalism, Communication, Social Science
2) Engineering, Science, Business management,
Commerce, Law
3) Information Technology
4) Multi Media, Interaction Design
Cross-discipline teams had one or more members
from different discipline groups. If all team members
were from one discipline group they were considered as
a single discipline team. According to this classification
there were 40 students in single discipline teams and
260 students in cross-discipline teams.
The ratings of attributes Survey 1 differed
significantly between the 22 students from single
discipline teams and the 190 students from cross-
discipline teams for awareness of task and completion
(F=5.00, p=.026) and immediate gain (F=8.50, p=.004).
Students from single discipline teams had higher ratings
for task awareness (4.28), indicating greater importance
of this attribute, than students from cross-discipline
teams (3.95). However students from cross-discipline
teams had higher ratings for immediate gain (3.54),
indicating greater importance of this attribute, than
students from single discipline teams (3.12).
Component and
Attribute
Cross-
discipline
teams
Single
discipline
teams
ANOV
A
M SD M SD F
Task Management
Clear team
member
responsibilities
4.33 0.66 3.58 1.12 17.26***
Task awareness
each member 4.29 0.64 3.84 0.96 7.09**
Clear task plan 4.18 0.73 3.63 1.11 7.98**
Relationship
Coordination 4.11 0.66 3.63 0.96 7.78**
Equal
contribution 4.23 0.77 3.84 0.83 4.07*
Cultural Dimension
Immediate gain 4.43 0.87 4.11 1.08 9.58**
Achievement 4.18 0.68 3.63 1.34 7.80**
Long term
orientation 3.91 0.77 3.37 1.17 7.02**
Collaboration 4.09 0.74 3.68 1.01 4.50*
Collectivism 3.90 0.73 3.53 0.96 4.00*
*p<.05 **p<.01 ***p<.001
Table 5. One-Way Analysis of Variance for the
Effects of Discipline on Ratings of Team Work
Attributes for Survey 3
In Survey 2, there were significant differences
between the 26 students in single discipline teams and
the 171 students in cross-discipline teams for harmony
(F=8.47, p=.004). Students from cross-discipline teams
had higher ratings (4.01) than students from single
discipline teams (3.54).
In Survey 3, there were numerous differences
between the 19 students from single discipline teams
and 123 students from cross-discipline teams. Students
from cross-discipline teams had consistently higher
ratings than students from single discipline teams as
demonstrated in Table 5.
When considering all responses together, there were
significant differences between the 70 responses from
single discipline teams and the 484 responses from
cross-discipline teams for the team attributes of
hierarchical/ leader (F=4.93, p=.027), harmony (F=9.86,
p=.002), long term orientation (F=4.35, p=.038) and
immediate gain (F=19.19, p=.000), as well as for the
team mark (F=41.64, p=.000).
In comparison to single discipline teams for all
surveys, cross-discipline teams had higher scores for
hierarchical/ leader (3.33 versus 3.07), harmony (4.05
versus 3.73) long-term orientation (3.96 versus 3.75)
and immediate gain (3.55 versus 3.07), as well as for
the team mark (78.4% versus 66.5%)
5 Discussion This discussion reflects on student results, their patterns
of work in both cross-cultural and cross-discipline
teams when compared to single-culture and single-
discipline teams. Throughout each section, the paper
addresses pedagogical implications for teaching within
a computing educational environment.
5.1 Performance and pedagogical goals Teams from cross-cultural groups perform no
differently to those in single cultural groups, while
those in cross-discipline teams perform far better than
those in single disciplined teams. This finding is similar
to that of Weinberg et al. (2005) in their cross-discipline
teamwork in a robotics course. Chin et al. (2009) also
showed that cultural difference had minimal impact for
Asian student cohorts undertaking studies in
information technology, other than a perceived view of
their English language difficulties.
5.2 Patterns in the difference data
Table 6 (end of paper) draws together the results of all
attributes that had significant difference (p <.05, p <.01,
p < .001) in the study from Section 4 and places them
together by cultural and discipline studies for each
survey. The first study in Section 4.4.1 describes the
Cultural Differences (based on individual perception of
team members) and is coded in Table 6 as SRC. The
second study, Cultural Differences (based on country of
birth) in Section 4.4.2 is coded as CB. The third study,
Section 4.4.3, discusses Discipline Differences (based
on individual perception of team members) and is coded
as SRD while the final study in Section 4.4.4: Cross-
Discipline Differences (based on student discipline of
study) is coded as DP in Table 6.
5.3 Attributes valued without difference
By examining Table 6, students appear to work with
similar approaches in the web design course team
Proc. 12th Australasian Computing Education Conference (ACE 2010), Brisbane, Australia
93

project for the attributes of trust, cohesion, equal
valuing of team members, awareness (relationship
component). These attributes are not highlighted by any
code in Table 6. Building on Saunders‟s (2000) team
life cycle and Egea‟s (2006) relationship building
strategies, it would seem that the team training process
of regular reflection supports all teams with members
from other cultures and other disciplines as well as
those in homogenously grouped teams. Students in
these teams also appear to have a similar approach to
individualism, which values self-determination,
individual success and the need to look after oneself.
This approach is not consistent with Hofstede‟s (2001)
view of cultural norms, but reflects technological
practice (Erickson, 2007) for web-based social
interaction.
5.4 Stages of difference
Table 6 also demonstrates differences across the various
surveys: only three of the 23 attributes are significantly
different in Survey 1 and 2; in Survey 3, over half of the
attributes rated as areas of difference (in team working)
- four attributes in task management, 2 attributes in
relationships and 7 attributes in cultural dimensions.
When combining all survey results, 16 attributes had
significant difference. This suggests that members in the
teams had a similar approach at the start of the project,
but as the project became more demanding, along with
meeting requirements for other courses, team members
started to notice their differences. Anecdotal evidence
appears to support this.
For educators, these findings suggest the need to
carefully guide students, especially in first year, to
manage their workloads and team tasks later in the
semester.
5.5 Attributes of difference
On viewing other patterns in Table 6, cross-cultural
teams identified the attribute of harmony, with a mean
score above 4, more often and cross-discipline teams as
more important than for single culture or single
disciplined teams. This sends a strong message to
course designers to consider this attribute in team
training, where students learn to work together, sharing
and valuing interpersonal activity.
Both cultural and discipline groupings map attributes
from the cultural dimension component as far more
significant than either of the other two components. The
attributes for cultural dimensions were described on the
survey to ensure the strict Hofstede (2001) description
of national culture. However, members of cross-
discipline teams identified more of the attributes
differently to those in single disciplines team for this
component. Interestingly this contrasts with Hofstede
and Hofstede (2005) who indicated that the national
culture dimensions were inappropriate for organisations
thereby providing a new set of dimensions as presented
in section 2. However, it might be argued that culture
may not simply be national culture but also discipline
culture.
Other findings from Table 6 demonstrate that cross
culture teams have more difference in relationships than
cross-discipline teams while the reverse is true of the
cross-discipline teams who rated task management as
significant areas of difference. Hence cross-cultural
teams benefit from more team training via discussion
and reflection on relationships (see Egea 2006 for
similar work) and cross-discipline teams need more
support on the task management of the teamwork, so
structure and management of the team activity should
be carefully monitored throughout the project life.
5.6 Limitations of study
The culture teams were grouped by personal rating of
members from other countries (Study 1) and by country
of birth (Study 2). This second study identifies students
from other cultures, and independent of years of study
within the Australian culture. To identify students who
would be classified as international students, it may be
identify these students from student records or to create
teams with members from other cultures.
As noted in the literature, most studies examining
cross-cultural groupings explore communication
differences between team members. The project design
for this research has collected such data, but at this
point, the data is not yet analysed.
6 Conclusion and Future directions
The findings from this study indicate that raising
awareness of cross-cultural and cross-disciplinary
differences and encouraging students to put strategies in
place to address these differences can have a positive
impact on team health. Importantly, the study identifies
that discipline culture can be of more significance than
national culture and interdisciplinary teams can have a
positive impact on team outcomes (Weinberg et al.
2005).
The study identified that task management and
cultural dimension are inherent to the input and process
stage of team working (Saunders 2000). Additionally
the five dimensions of national culture: power distance,
uncertainty avoidance, individual/collective
perspectives, achievement orientation, and reward
orientation (Hosftede 1996, 2001) and adapted by
Deeks (2004) to personal view of team working
(Leadership style, Working style, Personal values,
Personal goals, Personal commitment) were noted as
significant attributes across both Surveys 2 and 3 and
overall for both cross-cultural and cross-discipline
teams.
These findings suggest the need to consider how
these aspects might be addressed as part of the
curriculum design process. In particular the study
indicates a need to focus on careful team learning
design and monitoring of team outcomes.
While there are further aspects to examine from this
research (qualitative data for the communication
component of the survey, and the students‟ reflective
logs), it is intended to carry out further research in this
area, particularly in relation to the efficacy of the
strategies that students adopt or develop to address
issues relating to cross-cultural and cross-disciplinary
issues in their teams.
CRPIT Volume 103 - Computing Education 2010
94

7 References
Asherman, J.W., Bing, J.W., & Laroche, L. (2000):
Building Trust Across Cultural Boundaries.
http://www.itapintl.com/facultyandresources/articleli
brarymain/buildingtrust.html. Accessed 10 Jul 2009.
Altin, R., Bektik, M., Eksioglu, N., Koray, C., Oner, O.
C., Sadetas, M., Sener, H., Simsek, D., Ma, C., Price,
C., and Routh, C. (2009): Working across time zones
in cross-cultural student teams. Proc. ACM SIGCSE
Conference on Innovation and Technology in
Computer Science Education, Paris, France,
(ITiCSE‟09), 360-360, ACM Press.
Bentley, T. (2000): Gestalt in the boardroom. Gestalt
Review, 4(3):176–193.
Burnell, L.J., Priest, J.W. and Durrett, J.R. (2002):
Distributed Multidisciplinary Software Development,
IEEE Software, 19(5): 86-93.
Chin, K.L., Lu, J., Xu,J. Xian, J. and Yao, J. (2009):
Cross-cultural learning and teaching in Australian
universities, Proc IUT International Conference:
Navigating Innovations in Teaching and Learning,
Vancouver, Canada.
http://www.iutconference.org/pdf/KumLengChin.pdf. Accessed 6 Sep 2009.
Cohen, P.R. and Levesque, H.J. (1991): Teamwork.
Oxford, Blackwell Publishing.
DuPraw, M. E., and Axnes, M. (1997): Working on
Common Cross-Cultural Communication Challenges.
http://www.pbs.org/ampu/crosscult.html. Accessed 2
Jul 2009.
Egea, K. (2006). Relationship Building in Virtual
Teams: an academic case study. Proc. InSite06
International Conference, Greater Manchester,
England. http://2006.informingscience.org/. Accessed
10 Jul 2009.
Erickson, I. (2007): Understanding socio-locative
practices, Group '07 Doctoral Consortium Papers,
Sanibel Island, Florida, USA,1-2, ACM Press.
Johnson, D.W., and Johnson, F. P. (2006): Joining
together: Group theory and group skills. (9th ed.).
Englewood Cliffs, N. J., Prentice Hall.
Deeks, M. (2004): Cross-cultural team working within
The Cochrane Collaboration.
http://www.cochrane.org/docs/crossculturalteamwork
.doc. Accessed 9 Jan 2009.
Hinchcliff-Pelias, M. and Greer, N.S. (2004): The
important of intercultural communication in
international education. International Education,
33(2):5-18.
Hoegl, M. and Gemueden, H.G. (2001): Teamwork
Quality and the Success of Innovatve project: A
theoretical concept and empirical evidence.
Organization Science, 12(4):435-449.
Hofstede G (1996): Cultures and organizations;
software of the mind. Intercultural co-operation and
its importance for survival. New York, McGraw-Hill.
Hofstede, G., Hofstede, G. and Pedersen, P. B. (2002):
Exploring Culture. Exercises, stories and sythetic
cultures. Yarmouth, Maine: Intercultural Press.
Hofstede, G. and Hofstede, G. (2005): Cultures and
organizations; software of the mind. New York:
McGraw-Hill.
Lee, I., Choi, G. W., Kim, J., Kim, S., Lee, K., Kim, D.,
Han, M., Park, S. Y., and An, Y. (2008): Cultural
dimensions for user experience: cross-country and
cross-product analysis of users‟ cultural
characteristics. Proc. 22nd British HCI Group Annual
Conference on HCI : People and Computers Xxii:
Culture, Creativity, interaction - Volume 1, Swinton,
UK, 3-12. British Computer Society Press.
McCracken, D.D. & Wolfe, R.J., (2004): User Centered
Website Development: a human computer interaction
approach. Pearson Prentice Hall, New Jersey.
Mitchell, A. and Zigurs, I. (2009): Trust in virtual
teams: solved or still a mystery? SIGMIS Database,
40(3):61-83.
Ocker, R., Rosson, M., Kracaw, D., and Hiltz, S.
(2009): Training Students to Work Effectively in
Partially Distributed Teams. ACM Transactions on
Computing Education (TOCE), 9(1):1-24.
Saunders, C.S. (2000): Virtual teams: Piecing together
the puzzle. In Framing the domain of IT
management: Projecting the future through the past,
29-50. Zmud R.W (ed). Cincinnati, Ohio, USA:
Pinnaflex Educational Resources.
Sharp, H., Rogers, Y. and Preece, J. (2007):Interaction
design: Beyond human-computer interaction. 2nd
ed.
New York: Wiley.
SPSS (nd): Data Mining, Statistical Analysis Software,
Predictive Analysis, Predicative Analytics, Decision
Support Systems. http://www.spss.com/au/index.htm?
source=homepage&hpzone=nav_bar. Accessed Jul
11 2009.
Tvedt, J. D., Tesoriero, R., and Gary, K. A. (2001): The
software factory: combining undergraduate computer
science and software engineering education. Proc.
International Conference on Software Engineering,
Toronto, Ontario. Washington, DC, USA, 633-642,
IEEE Computer Society.
Walther, J. B. (1997): Group and interpersonal effects
in International Computer-Mediated Collaboration. In
Human Communication Research, 23(3): 342-369.
Weinberg, J. B., White, W. W., Karacal, C., Engel, G.,
and Hu, A. (2005): Multidisciplinary teamwork in a
robotics course. In Proc. 36th SIGCSE Technical
Symposium on Computer Science Education, St.
Louis, Missouri, USA, 446-450. ACM Press.
8 Acknowledgement
This research is funded by an UQ EAIT Faculty Teaching and
Learning Strategic Fund “Developing strategies to address
cross-cultural and cross-discipline teamwork for a first year
subject in web design”.
Proc. 12th Australasian Computing Education Conference (ACE 2010), Brisbane, Australia
95

Team Components and their
Attributes
Cultural Influence Discipline Influence
S1 S2 S3 All S1 S2 S3 All
Task Management
clear task description √(SRD)
√(SRD)
clear task plan √(CB) √(CB) √(SRD)
√(DP)
clear team member responsibilities √(SRD)
√(DP)
√(SRD)
task awareness each member √(DP) √(DP)
Relationship
Trust
Cohesion
equal valuing of team members
sharing/ friendship √(CB)
Openness √(CB) √(CB)
Respect √(CB)
awareness
equal contribution √(SRC)
coordination √(CB) √(CB) √(CB) √(SRD)
√(DP)
Cultural Dimension
Leadership style
hierarchical/ leader √(CB) √(DP)
collaboration/ team √(DP)
Working style
risk taking √(CB)
routine/ regulation √(SRD)
Personal values
individualism
collectivism √(CB) √(CB) √(SRD)
√(DP)
√(SRD)
Personal goals
achievement √(SRD)
√(DP)
harmony √(CB) √(CB) √(SRD)
√(DP)
√(SRD)
√(SRD)
√(DP)
Personal orientation
long-term orientation √(SRC) √(DP) √(DP)
immediate gain √(DP) √(DP) √(SRD)
√(DP)
Table 6: Significant differences noted in attributes for the team surveys
S1= Survey 1, S2 = Survey 2, S3 = Survey 3, All = combined results for the three surveys
√ - Cultural differences based on students’ ratings (SRC);
√ - Cultural differences based on country of birth (CB)
√ - Discipline based on students’ ratings (SRD);
√ - Discipline based on students’ degree program (DP)
CRPIT Volume 103 - Computing Education 2010
96

Effects of Course-Long Use of a Program Visualization Tool
Erkki Kaila, Teemu Rajala, Mikko-Jussi Laakso, Tapio SalakoskiUniversity of Turku and Turku Centre for Computer Science (TUCS)
Informaatioteknologian laitos, 20014 Turun yliopisto, Finland{ertaka, temira, milaak, sala}@utu.fi
AbstractWe studied the course-long use of a program visualizationtool called ViLLE in high school in Finland. The studywas conducted in three consecutive instances of the firstprogramming course. In the first two instances of thecourse, the students did not utilize ViLLE – except for ashort session – while in the last instance students didViLLE exercises throughout the whole course. Thestudents who used ViLLE got significantly better resultsfrom the course’s final exam. This supports ourhypothesis that program visualization can be an effectivemethod in teaching programming, and indicates that weshould continue developing program visualizationmethods to further enhance learning.Keywords: Programming education, programvisualization, long-term effects of visualization,integrating visualization into a course.1
1 IntroductionThe difficulties of novice programmers in introductorycourses are discussed in various studies (see McCrackenet al. 2001, Lister et al. 2004, Tenenberg et al. 2005). Inaddition to the cognitive difficulties in learning, problemsoften arise from lack of resources in teaching. Whencourses are quite large, teachers or lecturers cannot payenough attention to single students. Moreover, the timeavailable for introductory courses is usually quite brief,forcing the teachers to advance to more complicatedtopics without a possibility to ensure the level of learning.Hence, the students often lack even the basic reading andwriting skills after these introductory courses.
Program visualization (or program animation) is amethod of illustrating the program behaviour in differentstates of the execution. Program visualization (PV)systems typically visualize the execution and programstates (such as variable values, expression evaluation orobject and function dependencies) with various graphicaland textual components. Program visualization tools aimto enhance learning in two distinctive ways: firstly, ateacher can use such systems in lectures to illustrate thechanges in program states during the execution ofprograms, and secondly, students can use toolsindependently to rehearse topics they found difficult. The
Copyright © 2010, Australian Computer Society, Inc.This paper appeared at the Twelfth AustralasianComputing Education Conference (ACE2010), Brisbane,Australia, January 2010. Conferences in Research andPractice in Information Technology, Vol. 103. TonyClear and John Hamer, Eds. Reproduction for academic,not-for-profit purposes permitted provided this text isincluded.
potential benefit of independent use is the possibility tofocus on more advanced topics in the lectures, and let thestudents rehearse the basics on their own. However, thisscenario presents a couple of issues: firstly, how toencourage the students to use the tool independently, andsecondly, how to pick a tool that can be used to producelearning results?
1.1 Integrating a visualization tool into aprogramming course
In order to gain the possible benefits from PV tools in thecourse they should be properly introduced and integratedinto a course. Introduction should be done with enoughcare. In our earlier research (Laakso et al. 2008) we foundout that the students who were properly familiarized witha visualization tool beforehand gained statisticallysignificantly better learning results than the otherstudents. Though it is likely that the familiarization willeventually happen during the course long use, theadditional cognitive load of learning to use the tool itselfmay frustrate the students (even more since the studentsat the introductory phase usually have a lot of differentsystems and tools they need to adapt to). Hence, theintroduction should be more than a mere link at thecourse web site and the graphical notation of the toolshould be carefully explained to the students.
It is important to have a plan of what kind of role avisualization tool will have in a course. The tool can beused to replace or complement the traditional methods ofteaching, however, some things that need to beconsidered are:
What kind of topics will the tool be used for?Will it be fully integrated into all areas ofteaching or used specifically to teach only sometopics?What kind of “reward” will be awarded tostudents for using the tool? Lehtonen (2005)notes that getting in a top list of the bestachievements can be enough motivation forstudents. Additional or alternative rewards canbe, for example, extra points for the course gradeor replacement of some of the course exerciseswith use of the tool. Though the improvedlearning should be a reward on itself, it oftendoes not seem to be enough.How hard will it be for the teacher to mobilizethe tool, and what kind of advantages (other thanimproved learning results) could be gained?Could the tool be used, for example, for theautomatic assessment of exercises, what kind ofstatistics is available and so on?
Proc. 12th Australasian Computing Education Conference (ACE 2010), Brisbane, Australia
97

In this article we present the results of a course long studyof the program visualization tool called ViLLE. Earlierresults from two-hour controlled studies on theeffectiveness of ViLLE were encouraging. We consider itis important to also study the effects of the tool whileused throughout programming courses.
2 Related WorkOver the years, various program visualization tools havebeen developed, but there are very few studies on theeffectiveness of such tools, and even less on their long-term effects on learning performance. In general,algorithm and program visualization tools are studiedwith qualitative methods; there are very few studieswhere the results are based on quantitative data.
Crescenzi and Nocentini (2007) describe a two-yearexperiment of integrating an algorithm visualization (AV)tool called ALVIE into a programming course. Thecourse also included a textbook associated with the AVtool. They report no quantitative results, but studentfeedback was mainly positive.
Laakso et al. (2005) report an experiment inintroducing a web-based AV system called TRAKLA2(Malmi et al. 2004) to students at two universities. Theyreport that the tool seems to be very useful as the midtermpass rates raised significantly after the tool wasintroduced, and it promoted student activity in the course.The student feedback was also very positive.
Carlisle et al. (2005) used a flowchart basedvisualization tool called RAPTOR in introductorycomputing courses and found out that students using thetool got better results from two questions in the final
exam when compared with the earlier course where thetool was not utilized. However, they also got worseresults from the third question in the exam
Ben-Bassat Levy et al. (2003) utilized a programvisualization tool Jeliot 2000 (an earlier version of Jeliot3(Moreno et al. 2004)) in a year-long course. Theyconclude that since the control group had so little roomfor improvement, the quantitative data only showsimprovement in the animation group (the group that usedthe tool).
Stasko (1997) studied the effects of the visualizationtool called Samba, which students used in building theirown visualizations. No quantitative data was presented,but student feedback indicated that students thought thatthey understood algorithms well. Moreover, according toan informal measure by the writer, in the final exam thestudents answered nearly perfectly to questions regardingthe algorithms they had built earlier.
Brown and Sedgewick (1984) describe the use ofBalsa AV tool in an introductory course and in analgorithm and data structures course. It was found out thatthe students understood algorithms in less time comparedwith traditional teaching methods.
3 ViLLEIn this section we present the tool and describe someearlier results from the studies about ViLLE’seffectiveness.
3.1 FeaturesViLLE is a program visualization tool which illustratesthe changes in a program’s states with various graphical
Figure 1: the visualization view in ViLLE
CRPIT Volume 103 - Computing Education 2010
98
and textual components. The tool combines visualizationswith the automatic assessment of program code readingexercises. Using ViLLE, a teacher can create examplesets and include questions (multiple choice and graphicalarray questions in the version were used in this research)which the students answer during the execution of theexample programs. As we have previously stated (Kailaet al., 2009a), mere visualizations are not enough to havea substantial effect on learning. Providing questionsengages students to perform at the active level oflearning.
Some of ViLLE’s key features are:Possibility to visualize programs with variousprogramming languages. Several syntaxes areincluded and the teacher can define newsyntaxes with the built-in syntax editor.Flexible controls of animation: students canexecute the program step by step or continuouslyin adjustable speed. Stepping backwards is alsopossible – a feature that is not commonlyincluded in such tools.A built-in question editor which allows theteacher to attach questions in the chosen pointsin the example program. The current versionincludes also coding and code shufflingexercises; however, these were not in use in theversion used in this research.Flexibility and ease of use both for teachers andstudents.
Complete list of ViLLE’s features can be found attool’s website, at http://ville.cs.utu.fi.
3.2 Motivation for developing ViLLEAlthough other program visualization systems have beendeveloped (see section 2), they seem to lack somefeatures we found necessary for such system:
The tool should have support for variousprogramming languages instead of focusing onone particular language.Visualizations should always be combined withexercises to actively involve students.The tool should support the creation of newexercises and visualizations. The process shouldbe as straightforward as possible to encourageteachers to develop their own materials.
These features were the basis for the development ofViLLE.
3.3 Previous StudiesWe have previously conducted series of experimentsabout the effectiveness of ViLLE in various studies. Inthis section we present the most significant results ofthose studies.
The effectiveness of ViLLE was studied at Universityof Turku, in a course called “Introduction to informationtechnology”. Seventy two students participated in thestudy, randomly divided into two groups: 32 in thetreatment group and 40 in the control group. At thebeginning of the session all students took a pre-test,which measured their earlier programming knowledge.
After the pre-test the students rehearsed the programmingconcepts with a web-based tutorial. In addition, thetreatment group could visualize the examples in a ViLLEtutorial.. After this, a post-test was arranged to measurethe learning effects. Both groups performed significantlybetter at the post-test, but no significant differencesbetween the groups were found. However, when students’earlier programming experience was taken into account,we found out that the difference between novices andexperienced ones in the treatment group narrowed downand statistically disappeared during the session. Hence,we concluded that ViLLE is especially useful for noviceprogrammers. The study is presented in detail in Rajala etal. (2008).
Following this, the study was extended so that therewere three groups, each in a different engagement level(see Naps et al. 2002). The aim of the study was to findout whether we could confirm the hypothesis, whichstates that visualization tools can produce learning resultsonly if used in active levels, i.e. the mere tracking of thevisualizations is not enough. In addition to the earlierresearch, a third group was formed. This group (theviewing group, N=62) could control the animation ofprogram executions, but had no other ways to activelytake part in them. The responding group (N=32) had afull version of ViLLE in use, with multiple choicequestions about examples activated. The results showed,that the difference between experienced and the noviceprogrammers remained in the viewing group (as well asin the tutorial-only group, i.e. the no-viewing group). Thisconfirms the earlier findings that ViLLE is especiallyuseful for novices, but only if used in engagement levelhigher than viewing. The study is presented in detail inKaila et al. (2009a).
Another study investigated whether prior experiencein using a tool has an effect on learning results. The studywas conducted in two instances of an introductoryprogramming course in high school, with a sessionsimilar to the ones mentioned earlier in this section. Theonly difference between groups was that the (treatmentgroup (selected randomly out of the two) was familiarizedwith ViLLE before the session was arranged. There wereno statistically significant differences between the groupsin the pre-test. However, in the post-test a statisticallysignificant difference was found: the treatment groupoutperformed the control group in shared questions (i.e.the questions that were similar in pre- and post-tests) andin all questions. Based on the results we can conclude thatthe earlier experience of the tool has a significant effecton learning results, a fact that should be taken intoaccount when arranging such studies. The study ispresented in detail in Laakso et al. (2008).
Next we arranged a study to find out if the learningeffects of ViLLE can be further enhanced by using thetool in collaboration with other student. The studentswere randomly divided into two groups: the students intreatment group (N=62) used ViLLE in collaborationwith other students, while the students in the controlgroup (N=50) used it alone. The results confirmed ourprevious findings: all students’ succeeded statisticallysignificantly better in the post-test, thus proving that it ispossible to teach basic programming concepts effectivelywith ViLLE, even in such short time (45 minutes). While
Proc. 12th Australasian Computing Education Conference (ACE 2010), Brisbane, Australia
99
there were no differences between the groups in the pre-test, a significant result was found in the post-test. Thissupports the earlier findings of Laakso et al. (2009), thatcollaboration is highly beneficial when using avisualization tool. The study is presented in detail inRajala et al. (2009).
In addition to all quantitative tests proving that ViLLEis beneficial in learning, we also wanted to find out whatstudents think about the tool. We gathered students’opinions at the course “Introduction to informationtechnology” at our university. The students had usedViLLE throughout the course, with more than 10,000exercises taken. 114 students answered the questionnaire,consisting of questions about the features, usability andusefulness of the tool. Based on the answers, most of thestudents think that ViLLE is beneficial when learning thebasic programming concepts. Some students even thoughtthat they learned better using ViLLE than with traditionallearning methods (exercises, demonstrations andlectures). However, some students think that the best wayto use such tool would be to integrate it with moretraditional forms of teaching. The study is presented indetail in Kaila et al. (2009b).
In this study, in contrast to our earlier studies, wewanted to examine the effects of a visualization toolwhen used throughout a programming course. Since thelong-term effectiveness of program visualization is rarelystudied, and since we have found encouraging resultsfrom two-hour sessions, we find this very relevant topicof interest.
4 ResearchThe effectiveness of ViLLE was studied in threeconsecutive high school programming courses. In the firsttwo course students used ViLLE only in a two hour labsession at the beginning of the course. In the third coursestudents used ViLLE throughout the course. The idea wasto find out what kind of effects program visualization hason learning programming when used throughout thecourse.
4.1 MethodThe experiment was a between subject design with a pre-test and final exam results (dependant variable). We hadone between-subject factor (independent variable): theamount of usage of ViLLE.
4.2 MaterialsAll course material was distributed via the courselearning management system Moodle (Dougiamas &Taylor 2003). The material included background theory,code examples, and coding exercises for each topictaught. Python was used as the teaching language.
In the third week of the courses, a computer labsession was arranged where students rehearsedprogramming concepts with a programming tutorial. Inthe tutorial some programming concepts (variables,selection, loops, and methods) were shortly explained andstudents solved included ViLLE exercises. At thebeginning of the course, before the lab session, studentswere familiarized with the syntax of Python, variables,user input and selection statements. The session begun
with students answering a pre-test (see Appendix A),which included three questions about selection, loops andmethods, and ended with a similar post-test. The resultsfrom these sessions are presented in Laakso et al. (2008).
The final exam was divided into two parts (seeAppendices B and C). The first part included five codereading exercises which were solved on paper. Theexercises included selection statements, explaining themeaning of each line in a program, and what the programdoes, the number of short questions about syntacticalfeatures in Python, and explaining what certain codefragments do and writing down their output. Whenstudents returned the first part, they got three more codingexercises which were solved with computers. The codingexercises included writing a program that counts theaverage of an array, a program that asks a number fromuser and counts factorial of the number, and program thatreads a file, and counts the line and word count inside thefile. Each of the five questions in the first part of theexam was worth 6 points, while three coding exercises inthe second part were worth 10 points each. Thus, themaximum score in the final exam was 60 points.
4.3 ParticipantsThe participants were students from the high school ofKupittaa, a school that focuses on teaching informationtechnology and media. There were two instances of thecourse in the fall 2007: in the first course there were 12students and in the second there were 8 students, totalling20 students in the non-ViLLE group; however, sincethere were two students, who took the courseindependently (i.e. they did not participate in lectures orother teaching, but merely took the final exam), and threestudents who dropped out from the course, the totalnumber in non-ViLLE group becomes 15 (N=15). In the2008 course the student count was 7 (the ViLLE group),because one student dropped out. The selection of theViLLE group was randomized. The course was the firstprogramming course in the curriculum for each student.
4.4 ProcedureAll lessons in the programming courses were held in acomputer lab. Each topic was first introduced by theteacher. After the introduction students solved exerciseswith the help of code examples and background theory.The teacher also did live-coding by explaining all hisactions during the coding process to further clarify things.
The courses were identical in the following aspects:Both were taught by the same teacher.All materials were identical.Final exams were identical.
Hence, the only difference was that in the 2008course students did visualization exercises with ViLLEthroughout the course. When each programming conceptwas introduced, a number of ViLLE-exercises coveringthe concept were prepared for the students in the ViLLEgroup. The non-ViLLE group had similar program codeexamples included in the web material, but they could notvisualize them. Hence, the time used in studying differentprogramming topics was the same for both groups.
CRPIT Volume 103 - Computing Education 2010
100

The starting level of students was measured with thepre-test (see section 4.2). Student performance wasmeasured by comparing the final exam scores betweenthe ViLLE and non-ViLLE groups.
The results between the groups were analyzed with atwo-tailed t-test. Levene’s test was used to calculatevariances for all statistics to determine if the data holdsequal or non-equal variances.
5 ResultsIn this section we present the results on the researchquestion ”is there any difference in learning when ViLLEis used throughout the course”.
In addition, correlations between previous math andcomputer science (CS) knowledge and success in readingand writing exercises are presented.
5.1 Previous knowledgeParticipants’ previous programming knowledge wasdetermined by reviewing their earlier success in CS andmath studies, and by comparing their scores in the pre-test of the computer lab session. CS and math grades arepresented in Table 1. The table includes averages (on thescale of 4 to 10), standard deviations (in parentheses) andp-values of the t-test between groups.
Non-ViLLEgroup (N=9)
ViLLE group p-value
Math 6.56 (1.82) 7.53 (1.35), N=5 0.278CS 7.83 (1.15) 8.54 (1.10), N=6 0.254
Table 1: Participants' Math and CS grades
In math studies the grades are presented for the three firstadvanced math courses, and naturally for only thosestudents who took these courses (because of this the tabledoes not include all students). Similarly, CS studiesreported in the table include two first introductorycourses. The courses were the same for all the students.As seen as the table, no statistically significantdifferences were found between the groups.
The results of the pre-test in the computer lab sessionwere analyzed similarly (see Table 2). The ViLLE groupperformed better in the absolute scale (10.83 vs. 7.79 onthe scale of 0 to 30), but no statistically significantdifferences were found (p-value 0.430). In both groupsthere was on student who could not participate in the pre-test, but did the final exam (thus the N-values). Based onthe results we can conclude that there were no significantdifferences between the groups’ programming knowledgebefore taking the course.
Non-ViLLEgroup (N=14)
ViLLE group (N=6) p-value
Q1 5.35 (2.53) 6.50 (3.89) 0.529Q2 1.64 (2.50) 2.16 (3.92) 0.721Q2 0.79 (0.80) 2.17 (3.87) 0.425Total 7.79 (4.34) 10.83 (8.38) 0.430
Table 2: Pre-test results
5.2 Final exam scoresLearning effects on the course were measured with finalexam results. The exam consisted of five code reading(Q1-Q5) and three code writing (QW1 – QW3) exercises(see section 4.2 for details). Results are presented inTable 3.
Non-ViLLEgroup(N=15)
ViLLE group(N=7)
p-value
Q1 3.73 (2.12) 4.43 (2.15) 0.484Q2 3.13 (1.19) 4.14 (1.46) 0.099Q3 2.67 (1.59) 4.07 (1.74) 0.075Q4 4.73 (1.44) 6.00 (0.00) 0.004Q5 1.27 (1.67) 3.00 (2.16) 0.052Reading total 15.53 (5.58) 21.64 (6.34) 0.033QW1 3.20 (2.24) 6.29 (3.73) 0.077QW2 4.67 (2.92) 8.00 (2.52) 0.017QW3 2.93 (3.17) 3.86 (4.26) 0.574Writing total 10.80 (7.03) 18.14 (9.06) 0.050Exam Total 26.33 (11.84) 39.79 (14.11) 0.030
Table 3: Final exam results
As seen on Table 3, ViLLE group performed statisticallysignificantly better in Q4 (t (20) = -2,301), in total ofreading questions (t (20) = -2,294), total of writingquestions (t (20) = -2,084) and in combined total score (t(20) = -2,339); moreover, the difference in QW2 wasalmost significant. Since the Q4 was a question aboutfunction calls, ViLLE’s visualization of functions seemedto be especially helpful.In absolute scale and by looking the p-values of differentquestions, it seems that only in Q1 and QW3 groupsperformed somewhat similarly. Q1 was about if-statement, a topic already presented in the course beforethe lab session. That might be one reason why studentsgot good results from a similar assignment in the pre-test(see table 2). QW3 was about reading a file, which is notpossible to visualize in ViLLE, and thus the topic wastaught similarly to both groups. In all other questions thetrend was favouring the ViLLE group.
5.3 Correlations between math and CS gradesand total scores
Finally, we wanted to examine correlations betweenstudents’ grades and the scores of reading and writingsections on the final exam. Math and CS grades hadmedium correlation with reading exercises (0.699, p <0.01 and 0.557, p < 0.05, respectively) and strongcorrelation with writing exercises (0.781, p < 0.01 and0.725, p < 0.01). Since the CS course grades were fromintroductory courses, and did not include anyprogramming, we suggest that the grades actually depictmore about students’ motivation than actual programmingknowledge. The pre-test results (see section 5.1) supportthis.The quite low averages indicate that students’programming skills were rather poor before taking thecourse.
Another interesting aspect is the strong correlationbetween reading and writing exercise points in the finalexam (0.776, p < 0.001). This seems to be in line with the
Proc. 12th Australasian Computing Education Conference (ACE 2010), Brisbane, Australia
101

findings by Lopez et al. (2008) which state that there is astrong correlation between students’ tracing and writingskills.
6 DiscussionThe results show that the group that used ViLLEthroughout the course got statistically significantly betterresults from the final exam in total scores, reading total,writing total, and in question 4 in the reading exercises.Hence, ViLLE seems to be beneficial in tracing programcode. Since the question 4 was about functions, ViLLEseems the most helpful when tracing the executionbetween the main program and subprograms.Remarkably, all students in the ViLLE group got fullpoints from the question. Moreover, there was a trendfavoring the treatment group in absolute scale in allquestions, although in Q1 and QW3 the groups performedquite similarly. Based on the results, ViLLE also seems tohelp in developing program writing skills. Cronbach’salpha value 0.866 calculated for the questions in the finalexam indicate high reliability.
It is hard to estimate how other factors influenced theresults. Although the materials in the courses wereidentical and the courses were taught by the same teacher,the teacher might have had more experience in teachingthe course in the spring. Moreover, the group sizes werequite small, and it is impossible to isolate all the factorsthat influence the learning in a six-week course. Oneconfounding factor might be the randomization of groups;although the ViLLE group was selected randomly, thecourses were taught in different semesters.
However, since the difference between the non-ViLLEand ViLLE groups was so substantial in total points, andall our previous studies indicate that ViLLE has a positiveeffect on learning, we can conclude that ViLLE isbeneficial when learning basic programming skills.
It seems that the biggest advantage of ViLLE is thepossibility to offer lots of program code reading exercisesto students. Students get direct feedback on their successfrom the tool. This is especially helpful in mass courseswhere the teacher does not have enough time to addresseach student individually, but also applicable in courseswith fewer students; the teacher can not always help allstudents that need guidance, no matter how few there are.The feedback given by the tool helps students understandsome concepts by themselves and the teacher is freedfrom having to repeatedly answer basic questions. Evenif the feedback from a tool is not as good as personalfeedback from the teacher, students still get usefulinformation on the events occurring in the program.Moreover, they can retake examples as many times asthey see necessary – thus, the tool can be very helpful inensuring that all the concepts taught are sufficientlyrehearsed.
7 ConclusionsWe conducted a study on the effects of course-long use ofa program visualization tool in a high school in Finland.The results indicate that the students who used the toolthroughout the course got significantly better results ontheir final exam. The difference was significant in all totalscores, which indicates that program visualization is a
highly beneficial method of teaching basic programmingconcepts. This confirms our earlier findings fromcontrolled two hour sessions. Moreover, we couldconfirm our other earlier finding that ViLLE is especiallyuseful when tracing the execution of function calls. Infuture we plan to retake a similar study at the universitylevel, and study the effects of new features (mainly codesorting and coding exercises) of ViLLE.
8 ReferencesBen-Bassat Levy, R., Ben-Ari, M. and Uronen, P.A.
(2003): The Jeliot 2000 program animation system.Computers & Education, 40(1): 15-21.
Brown, M.H. and Sedgewick, R. (1984): Progress report:Brown university instructional computing laboratory.SIGCSE Bull. 16(1): 91-101.
Carlisle, M. C., Wilson, T. A., Humphries, J. W., andHadfield, S. M. (2005): RAPTOR: a visualprogramming environment for teaching algorithmicproblem solving. Proc. of the 36th SIGCSE TechnicalSymposium on Computer Science Education (St. Louis,Missouri, USA, February 23 - 27, 2005). SIGCSE '05.ACM, New York, NY, 176-180.
Crescenzi, P. and Nocentini, C. (2007): Fully integratingalgorithm visualization into a cs2 course: a two-yearexperience. Proc. of the 12th Annual SIGCSEConference on innovation and Technology in ComputerScience Education (Dundee, Scotland, June 25 - 27,2007). ITiCSE '07. ACM, New York, NY, 296-300.
Dougiamas, M. and Taylor, P. (2003): Moodle: UsingLearning Communities to Create an Open SourceCourse Management System. Proc. of WorldConference on Educational Multimedia, Hypermediaand Telecommunications, Lassner & C. McNaught(Eds.), Chesapeake, VA: AACE, 171-178.
Kaila, E., Laakso, M.-J., Rajala, T. & Salakoski, T.(2009a): Evaluation of Learner Engagement inProgram Visualization. To appear in 12th IASTEDInternational Conference on Computers and AdvancedTechnology in Education (CATE 2009), November 22– 24, 2009, St. Thomas, US Virgin Islands.
Kaila, E., Rajala, T., Laakso, M.-J. & Salakoski, T.(2009): Effects, Experiences and Feedback fromStudies of a Program Visualization Tool. Informatics inEducation, 8(1): 17-34.
Kannusmäki, O., A. Moreno, N. Myller and E. Sutinen.(2004): What a Novice Wants: Students Using ProgramVisualization in Distance Programming Courses. Proc.of the Third Program Visualization Workshop: 126-133.
Laakso, M.-J., Rajala, T., Kaila, E. and Salakoski, T.(2008): The Impact of Prior Experience In Using AVisualization Tool On Learning To Program.Proceedings of CELDA 2008, Freiburg, Germany,129-136.
Laakso, M.-J., Salakoski, T., Grandell, L., Qiu, X.,Korhonen, A. and Malmi, L. (2005): Multi-perspectivestudy of novice learners adopting the visual algorithmsimulation exercise system TRAKLA2. Informatics inEducation, 4(1): 49-68.
CRPIT Volume 103 - Computing Education 2010
102
Laakso, M.-J., Myller, N. and Korhonen, A. (2009):Comparing learning performance of students usingalgorithm visualizations collaboratively on differentengagement levels. Journal of Educational Technology& Society, 12(2): 267-282.
Lehtonen, T. (2005): Javala – Addictive E-Learning ofthe Java Programming Language. Proc. of KolinKolistelut / Koli Calling – Fifth Annual BalticConference on Computer Science Education, Joensuu,Finland, 41-48.
Lister, R., Adams, S., Fitzgerald, S., Fone, W., Hamer, J.,Lindholm, M., McCartney, R., Moström, J.E., Sanders,K., Seppälä, O., Simon, B. and Thomas, L. (2004): AMulti-National Study of Reading and Tracing Skills inNovice Programmers. SIGCSE Bulletin, 36(4): 119-150.
Lopez, M., Whalley, J., Robbins, P. and Lister, R. (2008):Relationships between reading, tracing and writingskills in introductory programming. Proc. of the fourthinternational workshop on Computing educationresearch, Sydney, Australia, 101-112.
Malmi, L., Karavirta, V., Korhonen, A., Nikander, J.,Seppälä, O., and Silvasti, P. (2004): Visual AlgorithmSimulation Exercise System with AutomaticAssessment: TRAKLA2. Informatics in Education,3(2): 267-288.
McCracken, M., Almstrum, V., Diaz, D., Guzdial, M.,Hagan, D., Kolikant, Y., Laxer, C., Thomas, L., Utting,I. and Wilusz, T. (2001): A Multi-National, Multi-Institutional Study of Assessment of ProgrammingSkills of First-year CS Students. ACM SIGCSEBulletin, 33(4): 125-140.
Moreno, A., Myller, N., Sutinen, E. and Ben-Ari, M.(2004): Visualizing Programs with Jeliot 3. Proc. of the
Working Conference on Advanced Visual Interfaces(AVI 2004), Gallipoli (Lecce), Italy. ACM Press, NewYork: 373-380.
Naps, T.L., Rößling, G., Almstrum, V., Dann, W.,Fleischer, R., Hundhausen, C., Korhonen, A., Malmi,L., McNally, M., Rodger, S. and Velásquez-Iturbide, J.Á. (2002): Exploring the Role of Visualization andEngagement in Computer Science Education. WorkingGroup Reports from ITiCSE on Innovation andTechnology in Computer Science Education, 35(2):131-152.
Petre, M. (1995): Why Looking Isn’t Always Seeing:Readership Skills and Graphical Programming.Communications of the ACM, 38(6): 33-44.
Rajala, T., Laakso, M.-J., Kaila, E. and Salakoski, T.(2008): Effectiveness of Program Visualization: ACase Study with the ViLLE Tool. Journal ofInformation Technology Education: Innovations inPractice. 7: IIP 15-32.
Rajala, T., Kaila, E., Laakso, M.-J. & Salakoski, T.(2009): Effects of Collaboration in ProgramVisualization. Technology Enhanced LearningConference 2009 (TELearn 2009), Taipei, Taiwan.
Stasko, J.T. (1997). Using student-built algorithmanimations as learning aids. SIGCSE Bull. 29(1): 25-29.
Tenenberg, J., Fincher, S., Blaha, K., Bouvier, D., Chen,T.-Y., Chinn, D., Cooper, S., Eckerdal, A., Johnson,H., McCartney, R. and Monge, A. (2005): Studentsdesigning software: a multi-national, multi-institutionalstudy. Informatics in Education, 4(1): 143-162.
Proc. 12th Australasian Computing Education Conference (ACE 2010), Brisbane, Australia
103

Appendix A: Pre-test
The pre-test consisted of three assignments: in each assignment a block of program code was presented, and thestudents were asked to either write down the output (assignments 2 and 3) or variable values in different states ofexecution (assignment1).
Assignment 1:
Assignment 2:
Assignment 3:
CRPIT Volume 103 - Computing Education 2010
104
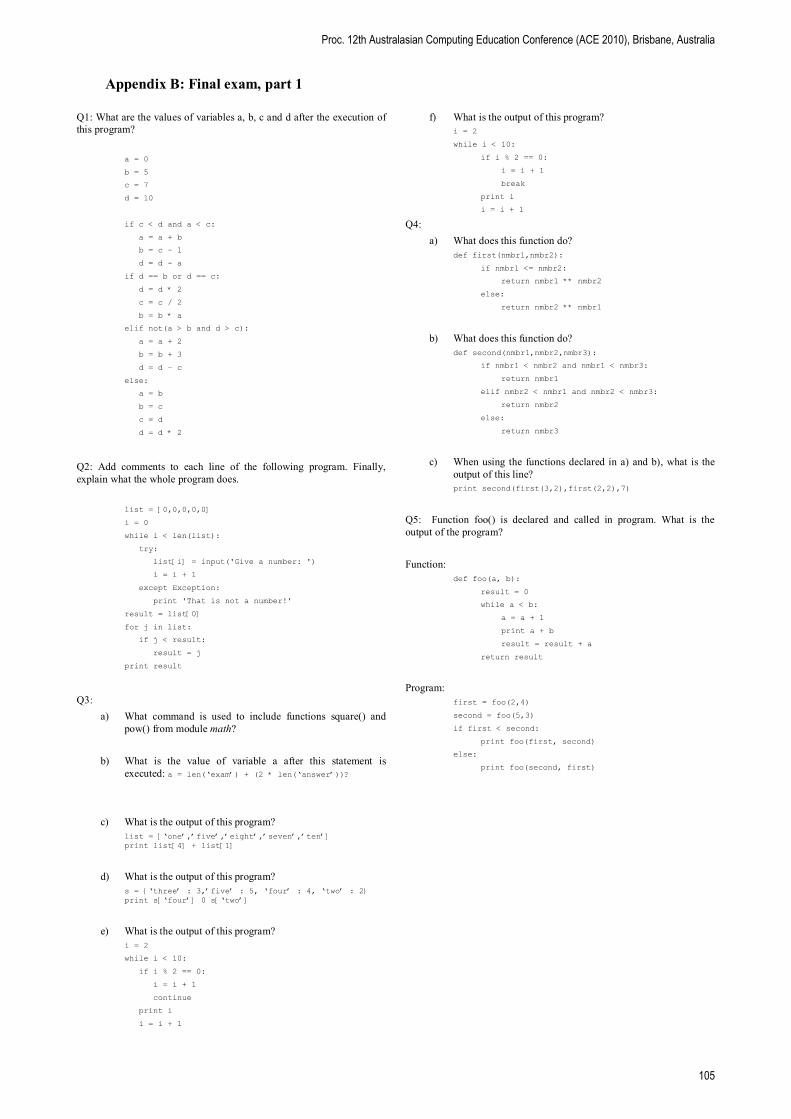
Appendix B: Final exam, part 1
Q1: What are the values of variables a, b, c and d after the execution ofthis program?
a = 0
b = 5
c = 7
d = 10
if c < d and a < c:
a = a + b
b = c - 1
d = d - a
if d == b or d == c:
d = d * 2
c = c / 2
b = b * a
elif not(a > b and d > c):
a = a + 2
b = b + 3
d = d – c
else:
a = b
b = c
c = d
d = d * 2
Q2: Add comments to each line of the following program. Finally,explain what the whole program does.
list = [0,0,0,0,0]
i = 0
while i < len(list):
try:
list[i] = input('Give a number: ')
i = i + 1
except Exception:
print 'That is not a number!'
result = list[0]
for j in list:
if j < result:
result = j
print result
Q3:a) What command is used to include functions square() and
pow() from module math?
b) What is the value of variable a after this statement isexecuted: a = len(‘exam’) + (2 * len(‘answer’))?
c) What is the output of this program?list = [‘one’,’five’,’eight’,’seven’,’ten’]print list[4] + list[1]
d) What is the output of this program?s = {‘three’ : 3,’five’ : 5, ‘four’ : 4, ‘two’ : 2}print s[‘four’] 0 s[‘two’]
e) What is the output of this program?i = 2
while i < 10:
if i % 2 == 0:
i = i + 1
continue
print i
i = i + 1
f) What is the output of this program?i = 2
while i < 10:
if i % 2 == 0:
i = i + 1
break
print i
i = i + 1
Q4:a) What does this function do?
def first(nmbr1,nmbr2):
if nmbr1 <= nmbr2:
return nmbr1 ** nmbr2
else:
return nmbr2 ** nmbr1
b) What does this function do?def second(nmbr1,nmbr2,nmbr3):
if nmbr1 < nmbr2 and nmbr1 < nmbr3:
return nmbr1
elif nmbr2 < nmbr1 and nmbr2 < nmbr3:
return nmbr2
else:
return nmbr3
c) When using the functions declared in a) and b), what is theoutput of this line?print second(first(3,2),first(2,2),7)
Q5: Function foo() is declared and called in program. What is theoutput of the program?
Function:def foo(a, b):
result = 0
while a < b:
a = a + 1
print a + b
result = result + a
return result
Program:first = foo(2,4)
second = foo(5,3)
if first < second:
print foo(first, second)
else:
print foo(second, first)
Proc. 12th Australasian Computing Education Conference (ACE 2010), Brisbane, Australia
105

Appendix C: Final exam, part 2
Q1: Define function average(), which gets a list as a parameter and calculates and returns the average of the values inthe list. Example of usage:
list = [2,3,3,4,7]
print “The average is:”, average(list)
The output of the example above would be:The average is 3.8
Q2: Write a program that asks for a number and prints out the factorial of that number. Use exception handling toensure that a number is given. Factorial of e.g. number 5 is calculated like this: 5 * 4 * 3 * 2 * 1 = 120. Example run:
Give a number: 6
The factorial of number 6 is 720
Q3: Write a program that reads a file and prints out the number of rows and words in that file. For example, for a file:
This is a file
There is more text here
And even more here
The output would be:
There are 3 rows and 13 words in the file.
Create a file test.txt to test your program. The words can be calculated with split() function, which can be used tosplit a string around spaces.
CRPIT Volume 103 - Computing Education 2010
106

The case for ICT work-integrated learning from graduates in the workplace
Tony Koppi1 Sylvia L. Edwards2 Judy Sheard3 Fazel Naghdy1 Wayne Brookes4
1Faculty of Informatics, University of Wollongong, Australia tkoppi{fazel}@uow.edu.au
2Faculty of Science & Technology, Queensland University of Technology, Australia [email protected]
3Faculty of Information Technology, Monash University, Australia [email protected]
4Faculty of Information Technology, University of Technology Sydney, Australia [email protected]
Abstract An online survey of recent ICT graduates in the workplace was carried out as part of a recent project funded by the Australian Learning and Teaching Council. The survey was concerned with the ICT curriculum in relation to workplace job requirements and university preparation for these requirements. The survey contained quantitative and qualitative components and findings from the former have been published (Koppi et al., 2009). This paper reports on a quantitative comparison of responses from graduates who had workplace experience and those who did not, and a qualitative analysis of text responses from all ICT graduates to open-ended questions concerning the curriculum and their perceived university preparation for the workplace. The overwhelming response from ICT graduates in the workplace was for more industry-related learning. These industry relationships included industry involvement, workplace learning and business experience, up-to-date teaching and technologies, practical applications, and real-world activities. A closer relationship of academia and industry was strongly advocated by ICT graduates in the workplace. Keywords: ICT curriculum, ICT graduates, professional work requirements, university courses, work-integrated learning
1 Introduction This paper reports on the findings from an Australian Learning and Teaching Council (ALTC) project (Koppi and Naghdy, 2009) concerned with the Information and Communications Technology (ICT) higher education curriculum. The focus of this paper is on selected quantitative and qualitative data in relation Copyright © 2010, Australian Computer Society, Inc. This paper appeared at the Twelfth Australasian Computing Education Conference (ACE2010), Brisbane, Australia, January 2010. Conferences in Research and Practice in Information Technology, Vol. 103. Tony Clear and John Hamer, Eds. Reproduction for academic, not-‐for-‐profit purposes permitted provided this text is included.
to work-integrated learning as expressed by recent ICT graduates in the workplace.
Recent graduates who have been in the workplace from one to five years were consulted about their experience of their university curriculum by means of an online survey. A survey of graduates in the workplace was a recommendation from an Australian Universities Teaching Committee (AUTC) project concerned with ICT education (AUTC, 2001). In recent times there have been several surveys of graduates in the workplace (e.g., Chartered Institute of Personnel and Development, 2006; Allen and van der Velden, 2007; Gresty, 2007; Pricewaterhouse Coopers, 2008), and work reported shedding light on requirements of particular aspects of the broader ICT profession (For example: VonKonsky, 2008), but they shed no light on the university curriculum experienced by ICT graduates. This lack of information about the perceptions about the relevance of the ICT curriculum in relation to workplace requirements, and the value of work-integrated learning in particular, is the focus of the analysis of the results from this survey.
Work-integrated learning (WIL) is a common practice in many higher education disciplines in Australia (Fincher et al., 2004; Patrick et al., 2008) and is practiced to different extents in the disciplines comprising ICT. Formal work-integrated learning that is more than simply ‘work experience’ has advantages that were discussed by Jancauskas et al. (2000), who concluded that such structured programs ‘provide a mechanism by which industry can contribute to curriculum development, keeping programs up to date and relevant to the real world’. Work-integrated learning is claimed to have mutual benefits for universities, students and industry (Orrell, 2004), and specifically in the ICT context (Poppins and Singh, 2005; Pauling and Komisarczuk, 2007). These benefits have been recognised by Universities Australia (2008), which has advocated a national internships scheme. A discussion paper on the scheme by McIlveen et al. (2008) reflects on the substantial benefits of work-integrated learning to the career development of students and opportunities for recruitment by
Proc. 12th Australasian Computing Education Conference (ACE 2010), Brisbane, Australia
107

employers even though the viability of these schemes depends upon successful partnerships between industry and universities that may be difficult to maintain.
The perspective on work-integrated learning experiences from recent ICT graduates in the workforce will make a useful contribution to the development of such schemes as part of the ICT higher education curriculum.
2 Research method The project team (Koppi and Naghdy, 2009) designed and prepared an online survey of ICT graduates in the workplace and requested Australian university alumni offices to invite their ICT graduates employed in the last five years to complete the survey. The survey was designed to elicit from graduates in the workforce the abilities they consider important for successful performance in their current professional work, and their perceptions of how well their university course prepared them. The survey’s design was based on Scott (2003) but modified for the purposes of this study to give quantitative data and qualitative text responses. There was a total of 37 abilities in four categories: personal/interpersonal; thinking/cognitive; business; and technical. In addition to the quantitative questions, there were six open-ended text-response questions and none of them specifically asked about work-integrated learning: • In what ways did your university course(s) prepare
you well for professional work? • What aspects were missing from your university
courses that you needed for work preparation? • Were there other experiences (e.g. part-time work)
that had an impact on your professional preparation?
• What were the most valuable course(s)/topics at university?
• What were the least valuable course(s)/topics at university?
• Do you have any suggestions for improvement to your university course(s)?
The quantitative data were analysed by the SPSS statistical software package. The qualitative text responses were analysed manually by a multi-stage iterative approach. The first stage involved reading of the responses to enable provisional categories of responses to be created. The second stage involved allocating responses to categories and modifying the categories until all responses were allocated. The third stage included the use of ‘Find’ in Microsoft Word to count the number of responses in the categories and to verify category creation and response allocation. Thus the categories were created from the text responses themselves rather than imposing a set of pre-ordained categories Examples of categories are: industry and real-world experiences; practical skills; teaching issues; group work; programming issues; and written communication. The categories identified during the text analysis enabled the number of responses per category to be counted to give a quantitative
estimation. Once the categories were created, responses were searched again to find expressions (quotes) from the respondents that would serve to illustrate the categories. This paper reports on findings concerned with work-integrated learning which is “an umbrella term used for a range of approaches and strategies that integrate theory with the practice of work within a purposefully designed curriculum.” (Patrick et al., 2008).
3 Results and discussion There were 719 valid responses from the graduates in the workplace and these represented 21 Australian universities (out of a total of 38 public universities). It is not possible to estimate the proportion of people that have obtained ICT degrees in the last five years this figure represents because the completeness of the records of each university alumni office is unknown as is the effectiveness of the targeted alumni contact mechanism. Nevertheless the number of responses is sizeable and allowed quantitative and qualitative analyses.
To create valid responses, the discriminating criteria used were the completion of an ICT degree and having worked in the ICT industry since graduation or in a job that utilises ICT training for no longer than 5 years. Graduates from other disciplines or who had no workplace experience following graduation were removed. There was a wide range of ICT degree names. There were between 533 and 660 text responses for each of the open-ended questions listed above. Quantitative results are presented for the abilities given in the questionnaire where there was a significantly different response from people with an internship or workplace learning experience. Qualitative results concerned with general aspects of work-integrated learning are given from an analysis of the six open-ended text responses.
3.1 Quantitative analysis About 40% of respondents had participated in an internship or workplace learning whilst doing their degree. At the time of the survey, all the respondents were in the workforce and it could be expected that there would be no significant differences in responses between those who had prior internship or workplace experience and those who did not. However there were significant differences in responses between these two groups. It seems that graduates with prior internship or workplace experience are in a stronger position to indicate the importance of the abilities listed for the workplace because of their relatively greater combined work and industry experience. For those graduates who have had an internship or workplace learning experience, we have listed their significantly higher rankings of statements in Table 1. This shows that people with an internship or workplace experience ranked the 14 items higher in importance than people without that experience.
CRPIT Volume 103 - Computing Education 2010
108

Table 1: Significantly (p ≤ 0.05, Mann-Whitney Test) higher rankings of statements by people with an internship or workplace learning (WIL) for the importance of abilities in the workplace
Ability Ability to speak to groups of people effectively Ability to communicate effectively in writing Ability to communicate effectively in visual or graphical formats Ability to communicate effectively and appropriately using electronic media Ability to contribute positively to team-based projects A willingness to face and learn from my errors and listen openly to feedback Ability to synthesise information into appropriate formats Ability to represent and interpret information in a variety of formats (e.g., graphical, text or multimedia) Ability to identify the core issue in any situation from a mass of detail Ability to understand, appreciate and meet the needs of your clients Having exposure to ICT professionals prior to my current job Having the practical skills to generate creative solutions to abstract problems Researching publications to prepare documents/reports/presentations Having experience with industry-based project work
Table 2: Significantly (p ≤ 0.05, Mann-Whitney Test) higher rankings of statements
by people with an internship or workplace learning (WIL) for the university preparation Ability
Ability to contribute positively to team-based projects Having experience with industry-based project work Having numerical skills Giving presentations
Table 2 shows the significantly higher ranking of statements with respect to university preparation by people with the same experience. This shows that people with an internship or workplace experience ranked the four items higher in university preparation than people without that experience. It seems that people with workplace experience while at university appreciate the ability to contribute to team-based projects more than people without that experience. Similarly, an appreciation of experience with industry-based project work while at university is ranked higher by people with workplace experience. Likewise, university preparation of numerical skills and giving presentations are ranked higher by people with workplace experience. Several respondents commented on how important it was to be able to give presentations in the workplace and illustrates the point that people with an experience of the requirements of the workplace are more amenable to university teaching. People with an internship or workplace experience also significantly indicated: ‘My part-time job helped me prepare for the workplace’.
Graduates with an internship or workplace learning experience ranked communication in all forms and formats (including client liaison) higher than those without workplace experience. This also included university preparation in giving presentations and probably reflects an appreciation of university efforts in the development of a broad range of communication skills that are necessary for the workplace. It also
seems that the academic ability of researching publications for various communication purposes is appreciated more by people with workplace experience.
Graduates with workplace experience also ranked higher the importance of teamwork in the workplace and preparation for it while at university. The importance of teamwork in the workplace was also noted by Taft (2007) and Nagarajan and Edwards (2008). Greater importance of problem-solving abilities was also given by respondents with workplace experience. These were indicated by ‘Ability to identify the core issue in any situation from a mass of detail’ and ‘Having the practical skills to generate creative solutions to abstract problems’ and to some extent by ‘Ability to represent and interpret information in a variety of formats’. Many of the text responses also noted the importance of problem-solving abilities.
The importance of exposure to ICT professionals prior to current work was ranked more highly by people with workplace experience as was having experience with industry-based project work in the workplace and while at university. Respondents also stated that their part-time job (which may have been of any kind) also helped in workplace preparation. This workplace exposure also seems to indicate the development of greater maturity as evidenced by the higher ranking of a willingness to face and learn from errors and listening to feedback.
Proc. 12th Australasian Computing Education Conference (ACE 2010), Brisbane, Australia
109

Based on this feedback from graduates, workplace experience has apparently contributed to the preparation of work-ready graduates from a number of perspectives, particularly in the areas of communication and problem solving.
3.2 Qualitative analysis This was concerned with the analysis of the text responses to the six open-ended questions listed in section 2. Responses which were concerned with the theme of work-integrated learning and the views expressed by the graduates with respect to their university preparation were identified and categorised for each question and have been reported under those same headings. In the sections below, indented text blocks in italic are direct anonymous quotes by survey respondents. Rarely was a responded quoted twice but it was possible because the same respondents contributed to many categories.
3.3 Effective preparation for professional work There were 660 responses to this question. Only 5% of respondents remarked that their degree was of little or no use in preparing them for their professional work. 18% of respondents noted that theoretical and fundamental knowledge was the most important preparation for professional work. Several respondents noted that the theoretical basis has a longer currency than the technology that changes rapidly. Nevertheless, technological capabilities were ranked next in importance (13% of respondents) because they are required in their current jobs.
Nearly half of the responses were concerned with the universities preparing graduates well in the generic attributes that are perceived as being of relevance to the workplace. These included team and group work, problem solving abilities, presentations, writing, critical thinking and analysis, and communication in general.
Some respondents gave detailed responses about how their university had prepared them for work in a comprehensive way, e.g.:
My course prepared me by teaching me; 1) essay writing, 2) technical writing, 3) programming, 4) group work, 5) presentations and public speaking, 6) how to convey my ideas verbally and in writing, 7) how to be a salesman, 8) how to [be] innovative, 9) how [to] work effectively in groups, 10) how to write reports, 11) how to dress in the corporate world, 12) how to write a resume/CV, 13) how to take part in a business meeting etc. Showed me to think in a logical and structured manner, so that when I need to plan for new situations and upcoming projects, I know exactly how to go about it. Gave me such a
broad range of topic knowledge, I can understand and communicate with professional people from many disciplines e.g. finance, marketing, IT. Provided strong theoretical background and reasonable technical skills and exposure to a wide range of technology. Introduced social skills and ability to speak in front of groups of people. Left me confident exploring new technologies due to strong researching skills and strong fundamental understanding of IT systems. I developed skills in time management, research, independent thought, decision making, presentation etc. I learnt how to quickly identify the core needs of a project and to develop logical and progressive pathways to problem solving and project design. I also strengthened my skills of both self evaluation and outcomes assessment.
A few respondents noted how university had helped
them with independent learning and ‘learning how to learn’, which they considered to be an important ability in a rapidly changing world, e.g.:
A university degree teaches you how to learn and think by yourself, it, for the most part, does not teach the job specific skills/experience required to do your job.
Provided me with an environment in which I could develop many cognitive and personal skills that I utilise on a day to day basis. I have heard it said that university teaches you how to learn. This is what I have gained from my degree. The technical content has turned out to be irrelevant to my current employment. By the time I move into an area that is relevant to the technical content of my degree, the technical content will probably be outdated.
It was noted occasionally that universities
cannot be expected to fully prepare someone for the workplace, e.g.:
Realistically, I don't think any university course can fully prepare any person [for] the real world. The individual has to come to terms and realise that once he/she enters into the job market, it is a whole new learning process again, exactly like entering into the 1st year of uni.
In general, respondents noted favourably the
abilities and skills they had learned in preparation for the workplace but did not indicate the conditions under which this learning had taken place. Further insights
CRPIT Volume 103 - Computing Education 2010
110

into work-integrated learning are given in responses to the remaining questions.
Apart from my qualifications my university course prepared me for work by learning to think for myself, manage my time appropriately, solve problems, have confidence in my abilities.
3.4 Aspects missing from preparation for professional work
There were 612 responses to this question. Only 4% of respondents said there was nothing missing from their courses. The dominant criticism of university courses was concerned with lack of association with industry and real-world experiences. Over one-third of respondents commented on this, e.g.:
More hands-on on technical and industry related curriculum. Courses must be more real life industry specific. Strong logical skills, real world examples. Less of a focus on the “real world common knowledge” basics such as scholarship skills and social sciences, and more focus on the required skills and methods of problem solving. Ask for real world problems and solutions, from real industries, and then teach students how to solve these and discuss the real problems.
Many participants even stating that they would prefer learning from the industry experts, e.g.:
I would like to see university courses more aligned with industry. University courses should not be designed by academic educators, but by industry experts who know what's going on out there. Due to the changing nature of IT, the subjects should be updated every couple of years. Better to have industry based learning, e.g. engage in real project work or work closely with the industry. Industry placement – I cannot stress that enough… This stemmed directly from recruiters preferring students with industry experience.
The next most common criticism (17%) of university courses was that they were out of date in many respects, including technologies, industry trends and teacher knowledge were inadequate or lacking. 14% of respondents noted the importance of a range of
business skills are and that more than technical competence is required for the workplace. Related to industry is the practical application of theory to the real-world (12%). The main criticisms of teaching (only 4%) included a lack of industry awareness.
Regarding aspects missing from university preparation as a whole, about 70% of the responses were concerned with workplace aspects and industry practices. However, a few comments noted that retraining for industry was inevitable, e.g.:
I believe you will always need to retrain a graduate. The investment is in their ability to understand and work through complex problems. Pay back comes one or two years after hiring a graduate, if you can keep them.
3.5 Other experiences (such as part-time work) impacting on workplace preparation
There were 605 responses to this question. The great majority of the respondents were positive about their part-time work experience (some included work placement) and its contribution to their professional development. Examples of comments include:
My organisational skills were honed by running a university sporting club, being on the social committee at my college and being involved in the running of my college. My work experience was invaluable because it gave me insight into current technologies and relevancy to many subjects and topics within subjects. An understanding of a real world full-time work environment meant that I was more focused on achieving as much understanding in my uni degree as possible, which in turn, meant that I was more prepared for post-uni employment in ICT. The 12 week placements I completed were of real benefit. If I could do it again I would look for a cadetship. The cadetship is a far better way to learn a profession. Working in the job while studying is the best method for learning. Part time work always helps even though not directly. Any work experience helps towards the overall growth. Part-time work in hospitality during my study term. This provided excellent communication and conflict resolution skills.
Proc. 12th Australasian Computing Education Conference (ACE 2010), Brisbane, Australia
111

Part time work puts education in perspective.
Many indicated how their part-time or full-time work experiences had been in their chosen discipline. This experience within the industry was therefore of great benefit to them in their courses, e.g.:
I had already being working in the industry for over 20 years which helped with an understanding of what was really needed against what was actually taught. I had a strong understanding of all the Microsoft suites. I worked as a trainer (full-time) while studying for the degree (part-time) and this gave me the insight of the ever evolving ICT world. In addition, as a trainer I needed to have good presentation and communication skills in order to convey my teachings into meaningful and easily understandable information to the students/clients. And at the same time I was able to gain some knowledge on ICT skills that was not taught in the university. I worked full time in the industry I was studying for the whole time of my degree. I felt that this not only gave me the opportunity to immediately put my knowledge into practice but it also has provided me with experience and a better employment position at the end. I worked full-time for an ICT company while studying, so in a lot of ways my work helped to prepare me for university as much as university helped to prepare me for work. Yes – working at Nortel Networks was invaluable in gaining insight and understanding what is relevant in a practical work environment as compared to a theoretical educational perspective. Yes, skills picked up during my part-time and contract work help[ed] me in listening, speaking, presenting and networking.
However, many respondents did not indicate when the part-time work occurred, whether it was in an ICT-related job or some other field. Some indicated that the work even though in a field unrelated to ICT was still beneficial to them, e.g.:
Growing up working on construction sites prepared me more for my job than the degree did!
I did a cadetship at the BHP (later Bluescope) steelworks. [I] learned a lot more there than at uni for preparation for a life in industry. I was working full time for the Department of Treasury and Finance throughout the last year of my university degree. This experience provided me with a great understanding [of] the business environment of a large government agency and also an appreciation of deadlines, timeframes, milestones etc. I learnt so much faster at work than in uni. When I finished by bachelor of science part-time, I was learning in three months at uni what I'd normally learn in two weeks at work.
A number of respondents also spoke of the direct and ongoing networking benefits they have reaped from their part-time work. For example:
I worked full-time in a related field, so that had massive benefits, possibly more so than my uni course. Though the degree is still the required key. Part time work definitely has played a very important factor in my profession. I can say due to the experience gained I have been able to make numerous contacts and also learn more about different workplaces. It is th[r]ough contacts that I have found new employment opportunities. Part-time work had a major positive impact on my preparation. The work I do now is similar to but at a higher level than during my degree.
These responses show that the professional development for an ICT career can occur through work experience in a wide range of job situations even though a combination of university study and related professional ICT work appears to be the most useful combination. From these responses, it could be argued that work integrated learning in preparation for an ICT career could occur in a variety of professional job situations.
3.6 Most valuable course(s)/topics at university There were 642 responses to this question. Nearly 90% of respondents referred to specific ICT domain courses or topics; very few referred to ‘soft’ or generic topics. Three per cent relate to aspects of communication and 11% to the value of project work, particularly capstone project experiences, e.g.:
My final semester information systems project was the most valuable course I undertook as this was a real-world project and the
CRPIT Volume 103 - Computing Education 2010
112

competitive aspect of the course helped provide incentive to work hard. If an ICT degree consisted of a year of basic concept book-learning and a further four semesters each containing major real-world projects such as this, the course would prepare students better than any other professional development that is available at the moment. The degree would be just about entirely experience-based. There is just no substitute for the kind of value that adds to a young professional! I would also rate my project work in my last semester as a very useful learning experience. We spent a lot of time on it, learned a lot, and it was probably the most realistic real-world course I had.
21% of respondents referred to the value of business courses and topics which was the largest category. Programming of all kinds closely followed (19%), with aspects of databases and project management at 12% each. Many other subjects were mentioned as most valuable, and it is likely that many of the responses from the graduates were related to their current daily work.
A listing of most valuable courses and topics does not add to information regarding work-integrated learning because the respondents did not indicate how or where the learning occurred. However, since business-related subjects were the most commonly expressed by graduates in the workplace, the implication is that knowledge in this area is relevant to daily work and that it may be gained to some extent by participation in work-integrated learning.
3.7 Least valuable course(s)/topics at university
There were 576 responses to this question. 25% of respondents noted that every subject was valuable, and those listed as the least valuable are all in single figure percentages. One respondent noted that they found an appreciation of subjects taught had grown since joining the workforce:
Can't think of any. But I can think of subjects that I thought were less valuable at the time and I payed less attention to. It would have been good to have a reminder of how [these] subjects would help in the workplace back then. Maybe you should let the students read the answers to these questionnaires.
Several respondents commented that their
responses were influenced by their current job rather than implying what was of little value in their degree. Nevertheless, there were comments concerning the teaching of out-of-date technologies or courses that
were not perceived as relevant. Work-integrated learning would address these issues, as noted by Jancauskas et al. (2000) and (Orrell, 2004) for example.
3.8 Suggestions for improvement of university courses
There were 533 responses to this question. 34% of respondents directly expressed the need for greater industry-associated learning, e.g.:
Have key people from the industry to talk about real experiences not fully rely on theory – design more course material that's more industry related. … better teaming with industry professionals – teaching by people with substantial industry experience and understanding. I would say that a brief outposting to the industry in some way (such as a weekly or even monthly trip to a local ICT business) could benefit students really well, especially younger students who may not have had any experience in working full-time at all. Maybe more of the courses could include some liaison with industry to give the students access to actual work experience during their studies. Offering courses together with industry partners.
There were also calls for industry-associated learning that may help to either ease the debt burden from a university course, or help the student gain work experience in order to join the industry, e.g.:
Add some course[s] for more practical industry focus. So graduate[s] can join in industry easily. Make all university courses that lead to professions, cadetships. Let those companies who benefit the most from universities pay for the training. I believe then that some loyalty to employers will be returned. At the moment graduates come out with $50,000 in HECS and have been working 70–80 hours a week to survive. They therefore want to get as much money as possible and don't owe their employers anything. I believe that if you asked those that completed a cadetship how long they stayed with their employer who paid for it, it would be much longer than those that had to pay for it themselves.
Proc. 12th Australasian Computing Education Conference (ACE 2010), Brisbane, Australia
113

Industry experience is vital and without it, a degree is of no use.
If the university aligned itself with the ICT industry, it would make the postgraduate students work harder, and it would tend to open up the “closed teams” in industry. This must ultimately be good for the industry and good for the student and good for the country.
22% of respondents were concerned with out-of date issues, including methodologies, technologies, and programming languages, and 19% complained about teachers with a lack of industry experience and engaging in teaching activities that were not perceived as relevant to industry. Recommended improvements in practical, real-world and business issues amounted to over 20% of responses. 11% of respondents were in favour of less theory and fundamentals and wanted more practical application, and only 3% of respondents advocated more theory and fundamentals. Few respondents mentioned group work or other generic skills.
Teach more in depth on subjects that are valuable to getting a job, teach the students industry standard software, encompass industry placement, introduce the students to the world in which they will be walking in to after their 3–4 years by introducing them to industry professionals. Academics need to look at what is out there in the real world and cater for it – I think an industry type of course should be included in ICT degrees. Look to moving a lot more quickly with curriculum and involve industry in the design and delivery to a much higher extent.
The calls for greater industry involvement in
learning and teaching, up-to-date practical and relevant industry-based technologies and practices, real-life examples, and business knowledge related to industry amounted to over 70% of the total responses.
I think it would be useful to have more contact with industry through for example having working programmers delivering guest lectures. Incorporate industry placements and/or work experience as a compulsory element for graduation. Provide practical industry experience please.
Industry placement is a must.
4 Conclusion The quantitative and qualitative analysis of survey responses from ICT graduates in the workplace has revealed a range of issues concerned with work-integrated learning. Graduates with work experience appreciated the importance of communication, problem solving and teamwork more so than graduates without work experience. In relation to these abilities, graduates with work experience observed that their readiness to engage in university learning was enhanced because they were aware of the relevance of these abilities in the workplace. Furthermore, graduates commented that workplace experience provided a framework for integration of university studies which leads to greater engagement and better learning.
The analysis of open text responses from graduates to a range of questions about the university curriculum has revealed a strong desire for more work-integrated learning. In regard to missing aspects of university preparation for the workplace, and aspects for improvement of university courses, the overwhelming response from graduates in the workplace was concerned with greater industry involvement mainly because academia was perceived as somewhat remote from industry. This included direct industry involvement in curriculum development and teaching to ensure it was up to date and relevant to the real world. Workplace learning by many respondents was seen as an essential component of their university program, and placements of 12 weeks or less were considered too brief. While fundamental theories were seen as providing a firm foundation for a dynamic and changing discipline, the need for their practical relevance and application to the real world were stressed. There will always be a challenge in academia to bridge the gap between theory and the real needs of industry (Anderson, 2001), but that is not the topic of this paper. Our work here was to report the graduates perspectives on how they felt university had prepared them, or not prepared them, for their place in the ICT industry.
Work-integrated learning is an umbrella term that includes learning and teaching practices that incorporate or reflect industry practices and real-life examples or case studies. As advocated by the graduates, and others (e.g., Orrell, 2004; Poppins and Singh, 2005; Pauling and Komisarczuk, 2007) greater association of industry with academia would bring mutual benefits to students, teachers and industry. We would also advocate, echoing the call from one of the respondents, that universities “should let the students read the answers to these questionnaires” in this paper. It may help current students understand the need for these skills being emphasised in their university experience.
5 References Allen, J. and van der Velden, R. (2007). The Flexible
Professional in the Knowledge Society: General
CRPIT Volume 103 - Computing Education 2010
114

Results of the REFLEX Project. Research Centre for Education and the Labour Market, Maastricht University, Netherlands. http://www.educpros.fr/uploads/media/reflex_01.pdf [viewed 20 February 2009
Anderson, M. S. (2001). The Complex Relations Between the Academy and Industry: Views from the Literature. The Journal of Higher Education, 72(2), 226-247.
AUTC (2001). The ICT-Ed Project: The report on learning outcomes and curriculum development in major university disciplines in Information and Communication Technology, Computing Education Research Group, Faculty of Information Technology, Monash University.
Chartered Institute of Personnel and Development (2006). Graduates in the Workplace: Does a degree add value? http://www.cipd.co.uk/NR/rdonlyres/ABF47E00-4DDE-40EC-9F20-B3C61574A110/0/gradwrkplsr.pdf [viewed 20 February 2009]
Fincher, S., Clear, T., Petrova, K., Hoskyn, K., Birch, R., Claxton, G. and Wieck, M. (2004). Cooperative Education In Information Technology. In R. Coll & C. Eames (Eds.), International Handbook for Cooperative Education (pp. 111-123). Boston MA: World Association for Cooperative Education.
Gresty, M. (2007). Graduates’ Experiences of the Workplace. http://www.prospects.ac.uk/cms/ShowPage/Home_page/Main_menu___Research/Labour_market_information/Graduate_Market_Trends_2007/Graduates__experiences_of_the_workplace__Spring_2007_/p!elkbbiF [viewed 20 February 2009]
Jancauskas, E., Atchison, M., Murphy, G. and Rose, P. (2000). Unleashing the Potential of Work-Integrated-Learning through Professionally Trained Academic and Industry Supervisors. http://www.waceinc.org/pdf/Erin_Jancauskas_6_14_00.pdf [viewed 6 January 2009]
Koppi, T. and Naghdy, F. (2009) Managing educational change in the ICT discipline at the tertiary education level (University of Wollongong, Monash University, Queensland University of Technology, University of Technology, Sydney) ALTC Discipline Based Initiative: ICT Project Final Report, ALTC. http://www.altc.edu.au/resource-managing-educational-change-ict-discipline-uow-2009 [viewed 14 August 2009]
Koppi, T., Sheard, J., Naghdy, F., Chicharo, J., Edwards, S. L., Brookes, W. and Wilson, D. (2009). ‘What our ICT graduates really need from us: a perspective from the workplace’. Eleventh Australasian Computing Education Conference (ACE2009). Conferences in Research and Practice in Information Technology, vol. 95, M. Hamilton and T. Clear (eds), pp 101–110.
McIlveen, P., Brooks, S., Lichtenburg, A., Smith, M., Torjul, P. and Tyler, J. (2008). Career Development Learning and Work-integrated Learning in Australian Higher Education: A discussion paper. National Association of Graduate Careers Advisory Services, Australia, Inc. http://www.usq.edu.au/resources/cdlandwilpaper.pdf [viewed 6 January 2009]
Nagarajan, S. and Edwards, J. (2008). ‘Towards understanding the non-technical work experiences of recent Australian information technology graduates’. Tenth Australasian Computing Education Conference (ACE2008), Wollongong, Australia. Conferences in Research and Practice in Information Technology, vol. 78, S. Hamilton and M. Hamilton (eds), pp. 103–12.
Orrell, J. (2004). ‘Work-integrated learning programmes: management and educational quality’. Proceedings of the Australian Universities Quality Forum 2004, AUQA Occasional Publication, pp 1–5. http://www.auqa.edu.au/auqf/pastfora/2004/program/papers/Orrell.pdf [viewed 6 January 2009]
Pauling, J.W. and Komisarczuk, P. (2007). ‘Review of work experience in a Bachelor of Information Technology’. Ninth Australasian Computing Education Conference (ACE2007), Ballarat, Victoria, January 2007. Conferences in Research in Practice in Information Technology, vol. 66, S. Mann and Simon (eds) Pp. 125–132.
Poppins, P. and Singh, M. (2005). ‘Work integrated learning in information technology education’. In Information and Communication Technologies and Real-Life Learning: New education for the knowledge society, T. van Weert and A. Tatnall (eds). Springer, New York, USA. Pp. 223–30.
PricewaterhouseCoopers (2008). Millennials at Work: Perspectives from a new generation. http://www.pwc.com/extweb/pwcpublications.nsf/docid/18E31741D06BA7A0852575120073CEBA [viewed 20 February 2009]
Patrick, C-j., Peach, D., Pocknee, C., Webb, F., Fletcher, M., Pretto, G. (2008, December). The WIL [Work Integrated Learning] report: A national scoping study [Australian Learning and Teaching Council (ALTC) Final report]. Brisbane: Queensland University of Technology. Available online at: http://www.altc.edu.au and www.acen.edu.au
Taft, D.K., (2007). ‘Programming grads meet a skills gap in the real world’. http://www.eweek.com/article2/0,1895,2178319,00.asp [viewed 15 November 2008]
VonKonsky, B. (2008). Defining the ICT Profession: A Partnership of Stakeholders. In S. Mann & M. Lopez (Eds.), Proceedings of the 21st Annual NACCQ Conference (pp. 15-21). Auckland, New Zealand: NACCQ.
Proc. 12th Australasian Computing Education Conference (ACE 2010), Brisbane, Australia
115

Universities Australia (2008). A National Internship Scheme: Enhancing the skills and work-readiness of Australian university graduates. Position Paper No. 3/08, May 2008.
http://www.universitiesaustralia.edu.au/documents/publications/discussion/National-Internship-scheme-May08.pdf [viewed 6 January 2009].
CRPIT Volume 103 - Computing Education 2010
116

Cross-Cultural Education: Learning Methodology and Behaviour Analysis for Asian Students in IT Field of Australian Universities
Jie Lu1, KL Chin2, Juan Yao3, Jun Xu4, Jitian Xiao5 1Faculty of Engineering & Information Technology, University of Technology Sydney, Australia
2Faculty of Business, Curtin University of Technology, Australia
3 Faculty of Business, University of Sydney, Australia
4Graduate School, Southern Cross University, Australia
5School of Computer Science, Edith Cowan University, Australia
Abstract Australian tertiary education of information technology (IT) has attracted a large number of international students, particularly from Asia. Cultural factors have affected the quality of learning of international students and the teaching approaches adopted by Australian lecturers. Therefore, cross-cultural teaching and learning situations have become an important issue in Australian universities. This study intends to improve the understanding of Asian students' cultural backgrounds, their previous learning approaches and their perspectives on Australian culture and educational mode, with the objective of helping international students from different cultural backgrounds to overcome the difficulties of cross-cultural study. This study has completed a questionnaire survey of 1026 students, including 292 Information Technology (28.5%) students from five universities in Australia. Among these IT students, there are 100 (34.25%) local students and 192 (65.75%) international students from 39 other countries. The questionnaire contains 55 questions within six question sections and one information section. This paper presents comparison-based data analysis results of this survey on learning methodology and behaviours of Asian students in IT field of Australian universities. It particularly reveals the main difference for students between the universities in their home countries and in Australia, also the difficulties of these students during their study in Australian university through qualitative analysis on open questions of the survey. This paper also reports the research methodology and main findings in cross-culture teaching and learning generated from this study. This work was fully supported by Australian Learning and Teaching Council (CG7-494). .
Copyright © 2010, Australian Computer Society, Inc. This paper appeared at the Twelfth Australasian Computing Education Conference (ACE2010), Brisbane, Australia, January 2010. Conferences in Research and Practice in Information Technology, Vol. 103 Tony Clear and John Hamer, Eds. Reproduction for academic, not-for-profit purposes permitted provided this text is included.
Keywords: Cross-cultural teaching and learning, IT students, Survey, Australian tertiary education, Asian students, International students.
1 Introduction International student education is now the third-biggest export earner in Australia and international students, particularly students from Asian countries, make up information technology (IT) departments/schools/ faculties of all Australian universities. According to the website www.studiesinaustralia.com, over 455,000 international students enrolled in courses in Australia in 2007. The largest number of international students in Australia is studying in the high education (university) sector, 177,760. Top five nationalities for 2007 of international students are China (23.5%), India (14%), Korea (7.6%), Thailand (4.4%) and Malaysia (4.4%). IT field (including computer science, information systems and software engineering) is the second majority of international students followed business field. Obviously, these Asian students have different cultural backgrounds from the majority of Australian local students and teachers. Many facts show that cultural factors have obvious influences on many aspects of learning of students and working relationship between staff and students and also among students themselves. In a cross-culture environment, international students may have different expectations in their interaction and different learning understandings from their teachers (Green 2007, Hodne 1997, Ho, 1991). The difference of languages is the most important issue in a cross-culture environment, however, the evidence obtained from survey (Lu et al. 2008) proves that not only language problem can generate confusion, but also different ways to think and perspective to the roles of teacher and student in the education process can generate it (Chen 2003). To explore more effective and suitable teaching and learning approaches in a cross-cultural education environment becomes a significant task for Australian universities.
Although the development of the research on cross-cultural education is growing, most researches in this field only focus on the issues of language,
Proc. 12th Australasian Computing Education Conference (ACE 2010), Brisbane, Australia
117

communication, specific courses and differences in learning styles (Asmar 1999, Watkins 2000, Wei 2007). There is little research to investigate the degree of implications on learning methodology and behaviours brought by culturally specific assumptions and situational variables. Therefore, there is an urgent need to explore current new cross-cultural teaching and learning situations and to develop more suitable approaches to help improve learning practices of Asian students in high IT education of Australia. This project aims to identify the positive and negative influence of the trend of increase of cross-cultural students on teaching and learning approaches in Australian IT educational environment through finding the differences and difficulties of Asian students who are studying in IT field. It aims to improve the understanding of the students’ cultural backgrounds, their previous learning approaches and their perspectives on Australian culture and educational mode; to help IT international students who come from different cultural background overcome the difficulties of cross-cultural study. In the meantime, it is expected to bring new ideas to IT lecturers who teach different cultural background students and improve the quality of cross-cultural teaching in their course. It is also expected to develop strategies via recognizing the factors which influence teaching and learning under the cross-cultural environment, and to propose a set of suggestions that can enhance the quality of IT teaching and learning in Australian universities.
We have conducted student questionnaire survey in five Australian universities in 2008. As Business and IT have the majority of Asian international students we therefore selected the two types of departments/schools/ faculties in the above five universities to conduct the survey. Questionnaires were handed out by lecturers in classrooms. We totally received 1026 complete student questionnaires including 652 (63.5%) undergraduate students and 374 (36.5%) postgraduate students; and 387 (37.7%) local students and 639 (62.3%) international students in other 56 countries. We have conducted various quantitative and qualit1tative data analysis including frequency analysis, correlation analysis and hypotheses testing, and word mining. Some interesting results have been obtained which are very useful for both teachers and students on teaching and learning in a cross-cultural environment. However, this paper only report some parts of these results obtained.
This paper is organized as follows. After this introduction Section 2 reviews literature on cross-culture teaching and learning. The research methodology including the design of questionnaire, conduction of survey and data analysis approaches is reported in Section 3. Section 4 presents a set of data analysis results: comparison-based distributions and open questions mining. Related findings are shown in Section 5. Section 6 concludes this paper and highlights out suggestions and further study.
2 Literature Review Cross-cultural education research literature involves various aspects. Here we conduct review mainly from the following aspects: textbook and knowledge authority, learning methods and attitudes, language issues, as well
as the relationships between teachers and students in a cross-culture environment, which are related to our student survey results. In students’ attitudes to authority, literature indicates that students from Confucian-heritage cultures are modest and compliant. They are highly dependent on text books and lecture notes. Slay (1999) and Hong (1991) comment that "the respect for the elderly and books is the central idea of Chinese education." It was further stated that this "also means respect for authority, classics and experience". Asian students are more influenced by the childhood education that is you just need to do what a teacher asks you to do and you do not need to have your own idea. This makes that many Asian students are more introverted (Huang and Trauth, 2007). Chiu (2009) argues that the students who come from Confucian-heritage countries have no wish to express critical thinking, which is opposite to western countries’ students. In students’ learning methods, attitudes and styles, and perceptions of learning, Phillips, Lo and Yu (2002) point out that there are three kinds of approaches in terms of learning: surface approach, deep approach and achieving approach. They found that Chinese and Asian students often use different approaches in different situations. Demanding examinations may lead them to use surface approach. The traditional Confucian heritage promotes them to use deep approach. Achievement motivation promotes them to use achieving approach. Some other investigators hold the view that students in East and Southeast Asian countries typically rely on rote learning and memorization (Baumgart and Halse, 1999). This kind of learning style only results in low-level cognitive outcomes. In contrast, western countries pay more attention on deep learning over surface ones (Biggs, 1996). It is accepted widely that western learners are independent, favouring deep and cultural learning and encouraged to use constructivist approaches where as Asian learners are more docile, compliant and good at rote memorization attached with surface approaches to learning (Baumgart and Halse, 1999). However, researchers have found that Asian research students have high performance during their study in western universities, which shows they applied the deep approach and achieving approach in their learning. About the relationships between teachers and students in a cross-culture environment, Littlewood (2001) presents his research results that “Asian students are more ready than European students to accept the traditionally dominant role of the teacher. It may be that this tradition is still felt or imposed more strongly in Asia than in Europe.” The classrooms in China and some other Asian countries are different from the ones in western countries. Chinese teachers give lecture with little interaction and students don’t like teachers to ask questions in class. In students’ attitudes to working in groups, Hofstede (2001) and Littlewood (2001) found that people who come from Australia, Europe and North America perform strongest individualist orientation, whereas people who come from Latin America and Asia perform strongest collectivist orientation. The individualism people value self-fulfilment and freedom of choice and claim his or her rights over the interests of in-groups to which he or she
CRPIT Volume 103 - Computing Education 2010
118

belongs (Li and Campbell 2008). On the other hand the collectivism people’s identity attitudes and actions are determined by the groups. They value the interests of in-groups to which they belong to over their own individual interests. Fussell and Zhang (2007) believe that comparing with individualist in western countries, eastern countries high valued communal well-being and harmony. Similarly, Pan et al. (1994) indicate that American culture emphasizes on individualism, and equality and freedom. Some scholars argue that western students prefer working alone, Asian students like working together. “It is important evidence that western students are more independent. They are more likely to work according to their own ideas whereas students from China or other Asian countries prefer work together (Hofstede, 2001).”
In language and communication aspects, both students and teachers are aware of the fact and agree that many international students require English language support during their study (Chalmers and Volet 1997, Eisenchlas and Trevaskes 2003). Tiong and Yong (2004) state that Asian international students become silent in group discussion and in the classroom because of Asian students’ inadequate language skills and their underdeveloped interpersonal communication skills. Some scholars also examine the methods which can help international students to improve their language skills (Briguglio 2000).
3 Research Methodology in This Study This section will describe the research objectives, questionnaire design, survey conduction and data analysis approaches used in this study.
3.1 Research objectives The research is proposed to explore what influence do learning and teaching have on the relationships between teacher and student, student and student under a cross-cultural education environment? What are the effects on the quality of student learning in university and what their expectation on the effects of teacher and other student in study process? How to help cross-cultural students adapt to Australian educational system and to learn about Australian academic culture through knowing about different learning styles from their own culture? It aims to identify the positive and negative influence of the trend of increase of cross-cultural students on teaching and learning approaches; to improve understanding of the students’ cultural background, their previous learning approaches and their perspectives on Australian culture and educational mode; to develop strategies via recognize the factors which influence teaching and learning under the cross-cultural environment; and to propose a set of suggestions that can enhance the quality of teaching and learning in Australian universities. This paper only focuses on IT international students learning methodology, behaviour, and difficulty analysis.
3.2 Questionnaire design Based on the 59 hypotheses, the questionnaire consists of over 50 questions within six sections as follows: (I) Teaching Contents and Textbooks; (II) Teaching and
Learning Methods; (III) Education Management Systems; (IV) Language; (V) Culture-based Teaching & Learning Concepts; and (VI) Others (open questions). The questionnaire also contained a set of identification information, including the educational degree of respondents; study field of respondents; how long the respondents have studied in Australia; birth country of respondents; first language of respondents; and which country respondents were mainly educated in. This information helps to identify the respondents’ major and which cultural backgrounds the respondents belong to. In this study, ‘international student’ means that he/she has completed most of their education in countries other than their own. This definition is the most suitable for the Australian immigration situation. From the data obtained in this project, over 90% of international students are Asian students.
Teaching contents and textbooks: we assumed that textbooks have different degrees of importance and are used in different ways in different cultural backgrounds. In some countries, teachers use textbooks a lot in their subjects and students mainly follow textbooks for their study. However, in other countries, teachers either do not use textbooks or use only very limited selected parts of textbooks in their subjects. They prefer to design their personal lecture notes and just give students slides in the classroom and references for reading. Therefore, students from different countries have different attitudes and behaviours towards the use of textbooks. This part of the survey aims to obtain feedback about students’ attitudes to teaching content and textbooks. Some examples of questions include: how students evaluate textbooks; the difficulties they have when they read textbooks; what content students read in textbooks; and if they use textbooks written in another language.
Teaching and learning method: It is assumed that international students and local students experience different teaching methods prior to current university study and their learning methods may be also different. This part of the survey is intended to test this assumption. Questions include: whether students feel that the current teaching methods are suitable; what the main differences are between the teaching methods in Australia and their home country; whether they like lecturers to ask questions in classes; what aspects of teaching concern them most; and how satisfied students are with the teaching methods in their current subjects.
International students may have a different education management system in their home country which is adapted to the local cultural background. Therefore, the education management system part of the questionnaire aims to acquire feedback from international students on how they adapt to the Australian education management system. Questions include: experience with the academic credit system; attitude to elective subjects; evaluating guidance within the education management system; and evaluating the degree of satisfaction with the subject selection system.
Language problem is the first problem that will be met by international students. It is the main obstacle preventing international students from improving their performance in the overseas study process. Questions on language include: whether the main reason for
Proc. 12th Australasian Computing Education Conference (ACE 2010), Brisbane, Australia
119

communication difficulty is language; do international students have difficulties in understanding lectures due to language; do international students have language-related difficulties in completing homework/assignments; do international students have the confidence to take part in asking questions and in-class discussions; and do international students experience difficulty when they perform oral presentations in class.
Culture-based teaching and learning concept is another important part of the questionnaire. This part of the survey reflects on whether cultural factors have an influence on teaching and learning, and if so, in what aspects and to what degree do cultural factors influence students. Questions include: what are the criteria of good students from the student’s point of view; whether students want to express their opinions in classes; do students care whether they have same ideas as others or not; whether students often argue about grades with their lecturers; whether students prefer working with students from the same cultural background in assignments; whether students have participated in any activities that are not related to their course.
3.3 Survey conduction Under the support of our Australian Learning and Teaching Council grant we applied the designed questionnaire to have conducted a survey in IT and Business academic units at University of Technology Sydney, Curtin Universities, Sydney University, Edith Cowan University and Southern Cross University respectively. We have totally received 1026 completed students’ questionnaires in the five universities with 292 in IT field. These IT students have their main educations backgrounds in Australia (100 students) and other 39 countries (192 students). Top five countries are China (48 students, 16.4%), India (27, 9.2%), Indonesia (20, 8.9%), Thailand (11, 3.8%) and Malaysia (8, 2.7%). In these IT international students, there are 76 undergraduate and 116 postgraduate students. See Table 1 for details.
Students Local International Total
undergraduate 86 76 162
postgraduate 14 116 130
Total 100 192 292
Table 1: IT student distribution in the survey
3.4 Data analysis approaches We used three questions in the questionnaire as measures to clarify and compare the culture issues in student learning. They are (I) country of birth; (II) first language or mother tongue; and (III) where the student completed most of their education before studying at an Australian university. Data analysis results shown in this paper are based on (III). As most of international students surveyed in this project are from Asian countries the term “international students” in this paper means “Asian students”. We conducted data distribution/frequency analysis, correlation analysis and qualitative analysis for open questions for data obtained from this survey. This paper only reports distribution/frequency and open question analysis results.
4 Data Analysis The questionnaire contains 55 teaching and learning questions and some identification questions. Almost questions are multiple-choice questions, agreement questions with degrees, but also have a group of open questions. This section only analyses few typical questions related to learning methods and textbooks (questionnaire Section II) and two main open questions (questionnaire Section VII) since the limitation of pages of the paper.
4.1 Data distributions and frequency analysis This study has over 50 questions and we have generated distributions for all these questions. This paper here only lists 10 questions’ data distributions related to learning methodology and study behaviour. QII.1 Which of the following best describes the textbooks you have used in your study? This question is about what attitudes the students take toward effect of the textbooks. The attitudes of students are grouped into four possible responses (four categories): (1) more important than lectures, (2) very effective in helping understand lectures, (3) just a reference, and (4) others. As indicated in Figure 1 the proportion of international students who believe that textbooks are very effective in helping understand is obviously higher than of local students. More than half international students believe that textbooks are very effective in helping me understand lectures. QII.2 In what proportion of recent subjects studied in Australia do you use textbooks?
This question compares textbooks use degree in process of study between local students and international students. According to Figure 2, about 15% local students use their textbooks more than 90% in their process of study. On the other hand, international students use their textbooks more than 90% is only 8.33%. However, international students’ proportions in groups of 50-70% and 70-90% are obviously higher than local students’. The results shown in Figure 2 indicate that most of international students read textbooks but as English problem or some other reasons they don’t read whole textbooks. QII.3 If you choose D (<50%) in question QII.2, what is the main reason? This question aims to find reasons about why students use textbooks less than 50% in their study process and any difference between local and international students in this matter. As showed in Figure 3, there are 24.62% of students who choose D (<50%) in QII.2 point out the textbooks are useless. Local students are more than international. The high cost of textbooks is another important reason (43%) and the number of international students is much more than local.
CRPIT Volume 103 - Computing Education 2010
120

MoreImprotant
thanlecture
Veryeffective
Just aReference
Others
0.00%
10.00%
20.00%
30.00%
40.00%
50.00%
60.00%
AustraliaInternational
Figure 1: Distribution of Question II.1
90-100% 70-90% 50-70% <50%
0.00%
5.00%
10.00%
15.00%
20.00%
25.00%
30.00%
35.00%
AustraliaInternational
Figure 2: Distribution of Question II.2
High price Useless Otherchoice
Others
0.00%
5.00%
10.00%
15.00%
20.00%
25.00%
30.00%
35.00%
40.00%
45.00%
50.00%
AustraliaInternational
Figure 3: Distribution of Question II.3
All contents Suggestedsections
Very little Others
0.00%
10.00%
20.00%
30.00%
40.00%
50.00%
60.00%
AustraliaInternational
Figure 4: Distribution of Question II.5
QII.5 On average, what do you read in your textbooks? Data in this question shows that more than half
international students (55.5%) choose reading suggested sections of textbooks, much more than local students (See Figure 4). The proportion of local students who choose reading very little is obviously higher than international students’.
QII.6 Describe the characteristics of the textbooks you prefer This question includes a set of sub-statements. Students give an agreement degree (1-5; 1 stands for strongly
disagree and 5 stands for strongly agree) for each of these statements. A: Emphasize theories
Figure 5 shows that most local and international students choose 3, 4 as their have some degree of agreement for the characteristic “emphasize theories” of textbooks. The proportion of local students is dramatically higher than international students’ on 3 but lower on 1 and 2. B: Introduce novel ideas
Figure 6 indicates the proportions of local students’ choices on 3 is much higher and on 2 are much lower than international students. C: Encourage students to think
Figure 7 shows that there are 24% of internationals students who strongly agree with the characteristics of textbooks in terms of encourage students to think, which is higher than local students’ proportion (14%).
1 2 3 4 5
0.00%
5.00%
10.00%
15.00%
20.00%
25.00%
30.00%
35.00%
40.00%
45.00%
50.00%
AustraliaInternational
Figure 5: Distribution of Question II.6 (A)
1 2 3 4 5
0.00%
10.00%
20.00%
30.00%
40.00%
50.00%
60.00%
AustraliaInternational
Figure 6: Distribution of Question II.6 (B)
D: Give many examples to help with exercises and assignments Form Figure 8, we can see that there are about 60% of internationals students who strongly agree with the statement.
1 2 3 4 5
0.00%
5.00%
10.00%
15.00%
20.00%
25.00%
30.00%
35.00%
40.00%
45.00%
AustraliaInternational
Proc. 12th Australasian Computing Education Conference (ACE 2010), Brisbane, Australia
121

Figure 7: Distribution of Question II.6 (C)
1 2 3 4 5
0.00%
10.00%
20.00%
30.00%
40.00%
50.00%
60.00%
AustraliaInternational
Figure 8: Distribution of Question II.6 (D)
E: Provide up-to-date knowledge and techniques Form Figure 9 we can see that there are 48.68% of
internationals students who strongly agree with the statement. Figure 10 shows that there are 41% of international students strongly agree with the statement.
1 2 3 4 5
0.00%
5.00%
10.00%
15.00%
20.00%
25.00%
30.00%
35.00%
40.00%
45.00%
50.00%
AustraliaInternational
Figure 9: Distribution of Question II.6 (E)
1 2 3 4 5
0.00%
5.00%
10.00%
15.00%
20.00%
25.00%
30.00%
35.00%
40.00%
45.00%
AustraliaInternational
Figure 10: Distribution of Question II.6 (F)
4.2 Open questions analysis This questionnaire has a set of open questions (in Part VII) regarding to the main difficulties of international students in learning at Australian universities and main differences in teaching and learning between the universities in their home countries and current Australian universities they are studying. The methodology used to perform these open question analysis include the following steps: (1) reading scheme/sentence in students’ answers to get a picture about what the students tried to explain; (2) classifying international students into two groups: undergraduate and postgraduate students; (3) word mining and searching, that is, mining all comments (sentences) to generate some key words such as ‘lecturer’, ‘assignment’, ‘text book’ and define these key words’ similarity groups such as ‘teacher’, ‘professor’ and ‘lectures’ are in the same group with the word ‘lecturer’; (4) clustering and summarizing contents of each group; (5) generating findings including
main differences on education between universities in their home countries and in Australia and main difficulties of international students to study in Australian universities. Below are the analysis results of students’ comments, opinions and stories in the open questions.
4.2.1 Main differences for international students to study in their home country universities and in Australian universities
About 53% undergraduate international students and 57.87% postgraduate international students indicated that the main difference between the universities in their home countries and in Australia is teaching methods. For example, one undergraduate student from China states that “teaching methods in China are more emphasis on results while in Australia value the process a lot.” One postgraduate student states that “less instruction here, students need to study mainly by themselves, in my country students just did what their teachers told.”
Second main difference between Australian university education and their home countries indicated in international students’ comments is the environment (13.37% of undergraduate and 11.06% of postgraduate). There are over 40 comments indicated this issue. Students live in college halls in campuses in their home country universities and there are many full-time managers to look after their living and university life, but international students here need to find houses and organize all living matters by themselves.
Textbook issue is the third difference indicated by 21 comments from undergraduate and 19 comments from postgraduates. Over 10 students claimed that they need more time to read textbooks because they need dictionaries to understand the contents. Six students claimed that the textbooks in Australia are very expensive. The two points match with the result obtained in QII.2.
The fourth difference indicated in students’ comments is assignment methods. There are 12 comments from undergraduate and 19 comments from post graduate international students to have indicated that the assignment methods in Australia are very different from in their home countries. The weights of assignments here are higher and the assignments here have more challenges.
There are three other main differences indicated by students: communication (11 comments from undergraduate and 16 comments from postgraduate international students), university regulation (over 20 comments), and cross culture issues. For example, one student states that “sometimes because of the language, it leads to misunderstanding with group members and other students.” Another student says that “when work with local students in group assignments, there is no confidence to make comments as English problem; to work with students from the same country, although feel confident to contribute group assignments but with less improvement of English.” Another two examples are about university regulations. One student argues that “in China, one semester has 17 weeks and has 6-8 subjects for undergraduate students to study, but in Australia only
CRPIT Volume 103 - Computing Education 2010
122

13-14 teaching weeks.” Figure 11 (a)-(b) shows the distributions of international undergraduate students who proposed these seven main differences discussed above in the Curtin University and Sydney University respectively.
Figure 11 (a): Curtin University
Figure 11 (b): University of Sydney
Figure 12: Comparison between postgraduate and
undergraduate international students in difficulties to study in Australian universities
4.2.2 Main difficulties to study in Australian universities
There are 66.67% of undergraduate students’ comments and 67.57% of postgraduate students’ comments to have indicated that language and communication are the main difficulties experienced when they study in Australian universities. For example, one student from Curtin University states that “it was hard to communicate with local students.” Another student from Southern Cross University argues that “there is a bit difficulty to exchange opinions with students who come from other countries due to the English problems.” Some students have difficulties to directly contact their lecturers when they have trouble in study. They prefer to ask their classmates who come from the same country. Figure 12 shows the comparison between undergraduate and postgraduate students in their main difficulties in studing in Australian universities. Both indicated communication is the major difficulty.
Culture shock, culture differences and adaptation are the second main difficulties that experienced by
international students. One student from Southern Cross University states that he/she confused by some cross-cultural problems, for example the mutual understanding and the way of life between him/her with local students. There are another 10 comments with similar opinions. One student from University of Sydney states that “people from different culture usually have little in common in cultures which may impact on learning behaviours.”
There are other difficulties that students felt when they study in Australia including the difficulties in doing assignments, exams, and accepting Australian teaching methods. One student from University of Sydney argues that he/she “could not fully master one subject because 14 weeks for one semester is too short.” Other students also indicate that “totally 26 hours lectures for a subject is not enough and should have more lectures.” Some other students indicate their difficulties on acceptance of teaching methods in Australia.
5 Findings We conducted interviews after survey data analysis in
this project and combined interview data with survey data analysis results. Interview data analysis will be reported in separate papers. Through survey data analysis, and combining with interview data analysis, a set of interesting findings have been obtained. We explain some compressive findings as follows.
On textbook, learning material, and subject study, we found that Asian background students have different difficulties when reading textbooks, different ways to face the issue that they can’t understand their textbooks, and different views in learning from a textbook from local students (QII.2, QII.4). They are more dependent on textbooks. They believe that textbooks are very important to their study but are difficult to read more contents of their textbooks within teaching weeks as English problems (QII.5 and open questions). They therefore strongly agree to have more examples in textbooks and lecture notes.
Some Asian students prefer less students’ questions during lectures so lecturers have more time to talk. They don’t like some students to ask many questions in lectures and think that students should not be given more opportunities to ask questions in a lecture class (QIII.4 and interviews). From open questions and interviews to students Some Asian students considered it is as a respect and an appreciation to teachers when students listen attentively and quietly in class. All discussions should be done after classes as the class is given to teachers and any discussion work will occupy teachers’ talk which result in less knowledge transmissions to students and students will learn less. In contrast, Australian university teachers encourage students to express themselves well in classes and use some class-time to organize discussions. Many teachers here encourage their students to express their different opinions from teachers on the table, whereas, in some other cultures making critiques on teachers in the class is rude behaviour. Asian students face the challenge in their current cross-cultural teaching and learning environment. On one side, they are likely to follow the teachers’ opinions and the authority is high values. They
Proc. 12th Australasian Computing Education Conference (ACE 2010), Brisbane, Australia
123

believe their teachers are authority in the subject and the authority is generally not questioned by students. As Littlewood (2001) indicated that they think the knowledge is a thing that should be transmitted from teachers to students but not a new thing that should be discovered by their own. On another hand, they have poor English communication skills and therefore lacking of confidence to challenge their teachers. Many Asian students are not suited to this learning approach; as a consequence they seldom question what the teachers tell them.
Moreover, many Asian students don’t like to insist on their opinions when they conflict with teachers’. They sometimes have difficulties to directly contact their lecturers when they have questions in study (open questions, Question VI.6 and interviews). These issues in somehow resulted from some students’ culture background. In some Asian countries, the questions asked by lecturers in classes are often very hard. Students feel to take an oral exam in a public situation. Sometimes, teachers ask questions aiming to check students’ understanding of the contents they just taught rather than encouraging critical and creative thinking.
The students from different cultural backgrounds have different attitudes to working in groups. Our data shows that Asian students have the similar level of participation in group work and group assignments, but less providing different ideas because they values group harmony, respect for authority and less arguments (Open questions, Question VI.4, question VI.5, and interviews). However, they often have team works after classes to help each other and shire their understanding of subjects in their daily study.
The survey results also show that for Asian students, undergraduates have more rely on rote learning and memorization than postgraduates. In contrast, postgraduate students more participate on variable team work and have better academic achievement. Indian students, as one of the biggest international student community, have better English skills than other countries. They prefer indirect communication style. In contract, Chinese students prefer reading and writing capabilities-based communication style such as e-mail as their reading and writing capabilities are in general better then listening and speaking. In classrooms, when they cannot fully understand what the teacher talked about in class, they will read the text books and lecture notes after class as compensation (interview data analysis). As Wan (2001) indicated that the gap between such abilities among Chinese students resulted from English teaching method in China. Chinese teachers teach English mostly through the traditional grammar-translation method. The result is that students know the grammar and vocabulary of English, but they are still “deaf and mute” in English in authentic situations. Some Asian students explain that because of inadequate oral English and underdeveloped interpersonal communication skills, they seldom express themselves in classes and group discussion even they know the answer and have personal opinions. As an example, in group assignments, Asian students are almost in charge of some reading-based tasks such as data collection, literature review rather than presentations.
There are very few Asian students to be a group leader (even they were leaders in their home countries). However, some evidences suggest that the problems of cross-cultural teaching and learning include not only language barrier, but also the different assumptions about knowledge, logicality, teaching and learning.
6 Conclusions and further study Teaching and learning in a cross-culture environment remain a great challenge in our current educational systems. This study aims at understanding the learning methods, specific requirements and prior learning experiences for our international students, analysing their difficulties and frustrations in learning in Australian universities, finding out main factors that may influence their learning outcome and exploring new teaching and learning methods in the cross-cultural IT educational environment. This paper reports current situation of cross-cultural teaching and learning of Asian students in IT field of Australian universities through a survey in five universities. The findings of the study will help the universities in making more aimed cross-culture teaching and learning strategies, which will further help the lecturers more successfully teach our international students, and at the same time help our international students more effectively overcome their difficulties in learning caused by cultural barriers.
According to data collected, this study outlines the commonness of Asian international students in their learning attitude, learning methods, specific requirements for lectures and teaching materials, analyses the main differences between their culture and Western culture carried out in IT high education systems. Our results (this paper only reports a small part of the results we obtained) indicate that study abroad is a tough thing because internationals students have to face a lot of difficulties in learning a new language, adapting to a new environment, living alone and at the same time they need to get academic improvement. We found some general phenomenon happed on international students. We hope this research will be able to provide assistance to international students in the future. As further work, we will report correlation analysis for the survey data and hypotheses testing results. We will also report interview data analysis results obtained in this study in details. Particularly, we will discuss a guideline to teaching staff and a guideline for international students.
Acknowledgment The work presented in this paper was supported by Australian Learning and Teaching Council (ALTC) by the project “Strategies and approaches to teaching and learning cross cultures” (CG7-494).
References Asmar, C. (1999): Scholarship, experience, or both? A
developer’s approach to cross-cultural teaching. International Journal for Academic Development, 4 (1): 18-27.
Baumgart, N. and Halse, C. (1999): Approaches to learning across cultures: the role of assessment. Assessment in education 6(3): 321-339.
CRPIT Volume 103 - Computing Education 2010
124

Biggs, J.B. (1996): Western misperceptions of the Confucian-heritage learning culture. In: The Chinese Learner: cultural, psychological and contextual influences, Wstkings, D.A. and Biggs, J.B. (Eds), Hong Kong and Melbourne, CERC and Australian Council for Educational Research.
Briguglio, C. (2000): Language and cultural issues for English-as-a-second/foreign language students in traditional educational settings. Higher Education in Europe 25(3): 425-434.
Chalmers, D. and Volet, S. (1997): Common misconceptions about students from South-East Asia studding in Australia. Higher Education Research and Development 16(1): 87-98.
Chen, H. (2003): Contextualizing citation behavior: Chinese graduate students’ thesis writing, language and academic skills. Latrobe University.
Chiu, Y.C. J. (2009): Facilitating Asian students' critical thinking in online discussions. British Journal of Educational Technology 40(1): 42-57.
Eisenchlas, S. and Trevaskes, S., (2003): Teaching intercultural communication in the university setting: an Australian perspective. International Education 14(4): 397-408.
Fussell, S.R. and Zhang, Q. (2007): Culture and collaborative technologies. CHI '07 extended abstracts on Human factors in computing systems, April 28-May 03, San Jose, USA, 2845-2848.
Green, W. (2007): Write on or write off? An exploration of Asian international students' approaches to essay writing at an Australian university. Higher Education Research & Development 26(3): 329-344.
Hodne, B. (1997): Please speak up: Asian immigrant students in American college classroom. New Directions for Teaching and Learning 70: 85–92.
Ho, D.Y.F. (1991): Cognitive socialization in Confucian heritage cultures. Workshop on Continuities and Discontinuities in the Cognitive Socialization of Minority Children, US Dept. of Health and Human Services, Washington, DC, June 29 to July 2.
Hofstede, G. (2001): Cultures Consequences: Comparing Values, Behaviors, Institutions, and Organizations Across Nations. Sage Publications, Thousand Oaks, London.
Hong. P.Z. (1991): A Thorny Journey - A study of the acculturation process of some Chinese ELICOS students in Brisbane, Australia. Griffith University, Brisbane, Australia.
Huang, H. and Trauth, E.M. (2007): Cultural influences and globally distributed information systems development: experiences from Chinese IT professionals. Proceedings of the 2007 ACM SIGMIS CPR Conference on Computer Personnel Research: the Global information Technology Workforce St. Louis, Missouri, USA, April 19 - 21.
Li, M. and Campbell, J. (2008): Asian students' perceptions of group work and group assignments in a New Zealand tertiary institution. Intercultural Education 19(3): 203-216.
Lu, J., Chin, K.L., Yao, J., Xu, J. and Xiao, J. (2008): Survey Analysis on Cross Culture Learning. UTS Teaching and Learning Forum 2008, 27 November. http://datasearch.uts.edu.au/site_manager_sites/iml_2003/learnteach/forum/forum08/
Littlewood, W. (2001): Students’ attitudes to classroom English learning: a cross-cultural study. Language Teaching research 5(1), 3-28.
Pan, Z., Chaffee, S.H., Chu, G.C. and Ju, Y. (1994): To See Ourselves: Comparing Traditional Chinese and American Cultural Values. San Francisco, CA: Westview Press.
Phillips, W. K., Lo, S. C.J. and Yu, T. O. (2002): Teaching techniques among Chinese international Students in Christian colleges and universities. Christian Higher Education 1(4), 347-369.
Tiong, K.M. and Yong, S.T. (2004): Confucian heritage culture learners’ and instructors’ expectations and preferences in collaborative learning: Convergence or divergence? HERDSA Conference July 4–7, Miri, Sarawak. http://herdsa2004.curtin.edu.my/Contributions/NRPapers/ A055-jt.pdf.
Wan, G. (2001): The learning Experience of Chinese Students In American University: A cross-cultural perspective. College Student Journal 35: 28-37.
Watkins, D. (2000): Learning and Teaching: a cross-cultural perspective. School Leadership and Management 20(2): 161-173.
Wei, F.Y.F. (2007): Cross-cultural teaching apprehension: A coidentity approach toward minority teachers. New Directions for Teaching & Learning 110: 5-14.
Proc. 12th Australasian Computing Education Conference (ACE 2010), Brisbane, Australia
125

CRPIT Volume 103 - Computing Education 2010
126

Student Perceptions of ICT: A Gendered Analysis
Christine McLachlan School of Information Systems Deakin University, Australia
Annemieke Craig School of Information Systems Deakin University, Australia
Jo Coldwell School of Information Technology
Deakin University, Australia
Abstract This paper investigates the attitudes and perceptions of secondary school students to ICT. During the last decade there have been decreasing numbers of students completing ICT subjects at secondary school in their senior years. The data was collected from university students enrolled in a range of first year units. Although the survey was undertaken by university students, the data collected related to their opinions whilst still at secondary school. This study explored two areas: firstly, the reasons why students had elected not to study ICT in their senior years at secondary school; and secondly, it describes a gender analysis of the attitudes and perceptions of students who had elected to study ICT. The analysis found that many students were not interested in studying senior ICT subjects, and for those that were, there were only a few differences between the gendered opinions to ICT.
Keywords: ICT, nomenclature, gender, skill shortages, attitudes, perceptions, influences, computer usage, students
1 Introduction In Australia, the Information and Communication Technology (ICT) industry is suffering from a significant shortage of skilled personnel (Lynch 2007; GradCareers in Engineering, Science and IT 2008). McKinney et al (2008, p. 84) suggest that there is a greater problem with the ‘input’ of new employees rather than with their ‘throughput’, and as a result the supply of qualified people in ICT is decreasing at a time when demand is increasing (Multimedia Victoria 2007b). Fewer students are choosing ICT related degrees; the number of domestic students enrolling in tertiary ICT courses in Victoria has decreased by 53% between 2000 and 2005 (Multimedia Victoria 2007b).
Lynch (2007) warns that the current shortages in ICT will worsen unless more school students (both boys and
Copyright © 2010, Australian Computer Society, Inc. This paper appeared at the Twelfth Australasian Computing Education Conference (ACE2010), Brisbane, Australia, January 2010. Conferences in Research and Practice in Information Technology, Vol. 103. Tony Clear and John Hamer, Eds. Reproduction for academic, not-for-profit purposes permitted provided this text is included.
girls) can be encouraged to consider a career in ICT. In Victoria, ICT studies are compulsory in secondary schools until year 10, after which ICT becomes an elective subject in the final two years. During the last seven years there has been a continual decline in the number of students who elected to study ICT. The enrolment numbers in senior elective ICT units in Victoria has dropped dramatically between the years 2001 (66,386 students) and 2007 (24,665 students), resulting in ICT subjects being removed from the curriculum in some schools (Craig 2009), thus ultimately contributing to the lack of qualified graduates entering the work force.
Many studies have been conducted exploring the perceptions and attitudes of young people to ICT; they have concentrated mainly on collecting data from students already enrolled in computer and business courses (Wilson and Avison 2007; Akbulut, Looney and Motwani 2008) or on the lack of female students studying ICT (Mbarika et al. 2007; Lynch 2007).
The research reported here broadened the pool to include those who had recently completed secondary school and are now studying a variety of tertiary courses including ICT. It investigated whether there were differences in the opinions of male and female students to ICT and, if so, whether these differences are contributing to the lack of uptake of further studies in ICT.
2 Literature Review
2.1 Confusion of Nomenclature Information and Communication Technology (ICT) is a broad name that is often used interchangeably with many other terms such as Information Technology (IT), Computer Science (CS) (Heywood 2006), Information Systems (IS) (Benson and Standing 2005), Informatics (Avgerou, Siemer-Matravers and Bjorn-Andersen 1999), and Computing and Information Technology (Lynch 2007). This confusion of nomenclature arises due to the overlapping nature of the fields within the discipline (Heywood 2006). Lynch (2007, p. 3) investigated IT and gender at secondary schools and found that the terminology used to describe ICT areas was ‘fraught with potential confusion’, while Benson and Standing (2005) suggested that a number of managers tend to interpret IT and IS as identical. An Australian government report
Proc. 12th Australasian Computing Education Conference (ACE 2010), Brisbane, Australia
127

explains that ‘Students also continue to relate ICT with IT and transfer their association from one to the other’ (Multimedia Victoria 2007a, p.7). Panko (2008, p. 196) defines ‘the term “Information Systems” to emphasize that you cannot simply deal with hardware and software but also must bring humans and organization into the picture.’ Benson and Standing (2005, p. 9) simplify the differences between IT and IS by saying that IT is the ‘what?’ of the system, whereas IS is the ‘how?’ and ‘why?’ of the system.
This research paper uses the term ICT, although nomenclature used in cited work is used as intended by the relevant authors. Therefore the use of ICT in this research will not add to the existing misunderstandings of computer terminology, as this term has previously been used to describe the wider areas of computing.
2.2 Influences on Career Choice Adolescents and young adults are in the process of creating their own image of who they would like to be. They then measure this image against that of a profession to determine if they possess the potential for that occupation (Rommes et al 2007). Young adults are influenced by role models (Ogan et al 2005), family members, and society’s expectations of them (Guichard and Lenz 2005). Bimrose (2006) expands the term ‘society influence’ to include those from the individual’s social groups as well as motivation given from others, including their family, mentors, education settings, and the workplace.
2.3 Computer Usage Computer success comes with understanding, usage, time spent working on computers, and accessibility to computers. Broos (2005) suggested that computer experience was a positive influence on computer attitude, whereas Rommes et al (2007, p. 303) commented that ‘though someone may like to work with computers, he/she may definitely not want to be regarded as the kind of person who is associated with computers’.
2.4 Attitudes and Perceptions of ICT The ICT industry has been portrayed as being male oriented, uninteresting, a poor work environment, and unexciting. Many authors (for example Rommes et al 2007; and Lynch 2007) have reported that the image of a person who works with computers is typically male with a geeky or nerdy appearance. When Rommes et al, (2007) asked adolescents in the Netherlands to draw an image of a computer scientist, the students drew males, with glasses, wearing unattractive clothing, and described them as nerdy, anti-social and unattractive. Lynch (2007) wrote that the typical image of an ICT worker is seen as not only male but also socially inept. This image supports the impression that the computer industry is a male-dominated pursuit (Newmarch, Taylor-Steele, and Cumpston 2000; Staehr, Martin and Byrne, n.d.). Newmarch et al. (2000, p. 6) concluded that many females perceive the ICT industry to be ‘blokey’ and ‘nerdy’.
One of the more recent perceptions of ICT reported in the literature is one of disinterest, mainly by female
students. Rommes et al (2007) reported that many of the females interviewed preferred to work with people and not things. Earlier research conducted in 2001 suggested that most of the Australian female participants ‘reported being “not interested in” or “didn’t like” computers’ (von Hellens and Nielsen 2001, p. 49). The same result was reported by Lynch (2007, p. 10) when students (mainly females) from across Australia indicated that ICT subjects were ‘irrelevant to their aspirations’ and viewed ICT as a ‘bad strategic choice’ for ‘long-term career prospects’. Fisher and Margolis (2002) reported that gender differences in attitudes to technology occur at a young age and that female students see technological studies as not for them. Females tend to underestimate their abilities where males overestimate them, resulting in females having less self-confidence and lower interest in technological studies than males (Fisher and Margolis 2002; Besterfield-Sacre et al 2001).
Panko (2008, p. 183) has conducted multiple focus groups since 2002 and has found that ‘there is a deep belief among both IS majors and non-IS students that the career outlook for IS professions is poor.’ This perception was due to the concern that jobs are being sent offshore to developing countries such as China and India. This concern does not appear to have been alleviated by the wide spread reports of skill shortages in ICT (Lynch 2007; GradCareers in Engineering, Science and IT 2008; McKinney et al 2008; Panko 2008).
Generally there is a lack of understanding as to what a computer occupation involves, and what an ICT professional does (Harris and Wilkinson 2004; Newmarch et al. 2000). Male and female students perceive ICT workers as spending long hours indoors, in front of a computer screen on their own, and with little human interaction (Harris and Wilkinson 2004; Staehr, Martin and Byrne 2001; von Hellens and Nielsen 2001; Rommes et al 2007; Multimedia Victoria 2007a; Multimedia Victoria 2004; Lynch, 2007). Young adults see the nature of ICT work as boring (Lynch 2007) and nerdy (Multimedia Victoria 2004) where they do not need to have good written or oral communication skills (Staehr, Martin and Byrne n.d.). Women are reported as viewing it as a lonely, dull job with little human contact (Newmarch et al. 2000).
Technology and technology subjects have been perceived as being difficult because they are too theoretical and rigidly structured (Newmarch et al. 2000; Staehr, Martin and Byrne n.d.), they focused on programming and were highly competitive (Sanders 2005). Students perceive ICT as being not fulfilling or rewarding and choose not to follow the technology path (Wilson and Avison 2007). Working in the ICT field has been interpreted as not exciting, this has contributed to reinforcing the perception that ICT is boring (von Hellens and Nielsen 2001). Although, on the other hand students considered computer skills to be useful (Multimedia Victoria 2007a).
While ICT has the image of people working alone, being computer-bound and programming all day, this is not the reality of the field. For example, the Australian Public Servants in ICT work in teams and liaise with businesses to strive to create change in the organisation (Department of Finance and Administration 2007), and
CRPIT Volume 103 - Computing Education 2010
128

there are opportunities to combine multiple skills in order to work together to ‘manage and help people’ (Adams et al 2006, p. 373). Those that work in the profession have found that the job provides good job security, a variety of opportunities (McKinney et al 2008), a challenging and exciting environment that allows for a creative outlet (Anderson 2006), and an opportunity to ‘work with the latest technology’ in a ‘growing industry’ (Multimedia Victoria 2004, p. 17).
3 Research Methodology The literature review presents multiple aspects of the ICT industry, including an image of how it is perceived by outsiders. This paper investigates whether this image is perceived differently by secondary students and whether there are any differences in the opinions of males and females.
A cross-sectional research project was conducted with students who attended first-year subjects at a large Australian University with multiple campuses across Victoria. The survey research methodology was adopted employing purposive sampling; where a broad sample of students from multiple faculties was selected. The majority were aged between eighteen and twenty years and had commenced university studies within a year or two of completing their secondary education. These young adults would have retained a vivid memory of their secondary school experiences and were able to provide useful information and insights into their perceptions and attitudes towards ICT. In total 796 questionnaires were administered resulting in 681 that were usable, they were subsequently divided into two groups. The first group of 506 responses were from those who had not elected to study ICT at secondary school, while the remaining 175 were those who had chosen to study ICT past the compulsory level (Table 1).
Table 1: Student Numbers
The anonymous questionnaire was administered during a four week period, from mid July to early August, in 2008, and was delivered and collected from the students in their classes. The possible outcomes of questions on the questionnaire were measured by either a category choice, a five point Likert scale, or by textual responses. Individual textual responses were read and assigned a code. The quantitative data was analysed using Cross-Tabulation and t-tests, with the confidence level set at 0.95.
4 Results and Discussion
4.1 Students who Elected Not to Study ICT in Secondary School
4.1.1 Reasons for not Studying ICT in School The students that did not study ICT in their senior years at secondary school (n = 506) were asked to indicate why that choice was made (see Table 2).
The choice not to study ICT was made by students based mainly on disinterest rather than any perceived difficulty of the subject. The majority of respondents choose not to study ICT at school due to a lack of interest in the subject, while almost one fifth indicated that ICT subjects were not on offer at their school in senior years. The stereotypical options of ‘too hard’ and ‘too boring’ produced minor results, suggesting that these issues are not of major concern to this student cohort.
Reason ICT not
studied Female Male Total % n % n % n
Not Interested 69.4 229 59.9 67 67.0 296
Not Offered 14.8 49 21.4 24 16.5 73
Too Boring 7.6 25 8.9 10 7.9 35
Not Convenient 6.4 21 8.9 10 7.0 31
Too Hard 1.2 4 0.9 1 1.1 5
Prefer other subjects
0.6 2 0.0 0 0.5 2
100 330 100 112 100 442
Table 2: Reasons for not studying ICT
The high level of disinterest by the participants is consistent with results reported by Rommes et al (2007) and Lynch (2007). In addition Multimedia Victoria (2007a) reported that students who did not study ICT above Year 9 did so firstly due to a preference for other subjects (42%), and secondly as they were not interested (39%). Further statistical analysis shows that there are no differences in gender responses. A Pearson Chi-Square of 5.068 and a non significant p-value of 0.408 verify this.
Studying ICT at University
Yes No unknown Total
ICT School Studies
T F M T F M T F M T F M
Yes 8 3 5 141 85 56 26 12 14 175 100 75
No 4 2 2 440 326 114 62 46 16 506 374 132
Total 12 5 7 581 411 170 88 58 30 681 474 207 4.1.2 Four Special Cases Interestingly four students, two females and two males, did not elect to study ICT in senior secondary school but now studied an ICT related course at university. These four students were highlighted only after statistical analysis was performed. All four students had started using computers in primary school or early secondary school. Three of the students (1 male and both females) were aged 18-19 and had completed school in 2007. The fourth student was aged over 21.
The reasons given for studying ICT at university appeared to contradict their perceptions of the ICT industry. Their perceptions of the ICT industry were both positive and negative (as indicated in their questionnaire responses), and yet they had a positive attitude to the industry having elected to study in the area and were considering future employment in the ICT industry. Concerns were mentioned about issues such as outsourcing, the nature of the work expected in the industry and the male domination in the industry. In fact
Proc. 12th Australasian Computing Education Conference (ACE 2010), Brisbane, Australia
129

one of the male students had elected to study in this area despite having the perception that there was no future in the ICT industry due to the current prevalence of outsourcing.
The very different responses from these four students compared to the rest of the sample would suggest that further investigation could reveal significant insights into how students’ choices of study and career could be influenced to the benefit of the ICT industry. Unfortunately the numbers of students who choose ICT later in their studies in this study are too small to attempt to identify any significant factors.
4.2 Students who Elected to Study ICT in Secondary School
4.2.1 Demographic data The overall sample of students (n = 682) included 69.8% females. The breakdown of the students who had elected to study ICT in senior years at secondary school (n = 175) shows that female students (57.2%) outnumbered male students (42.8%). The remainder of the analysis will focus on these students who had elected to study ICT in secondary school. All students were aged over 18 with no significant difference in age between genders (Pearson Chi-Square 0.491, p-value=0.921).
Age
(Years) Female Male Total % n % n % n
18 22.2 22 25.7 19 23.7 41 19 28.3 28 25.7 19 27.2 47 20 13.1 13 14.8 11 13.8 24
21+ 36.4 36 33.8 25 35.3 61 100 99 100 74 100 173
Table 3: Student Age
Those students who had completed secondary school in 2007 and had studied an elected ICT subject accounted for 48.5% of participants, representing the majority of the 18 and 19 year olds. A third of the students in this study had returned to study after reaching 21 and had previously studied an elected ICT subject.
Faculty Female Male Total % n % n % n
Business 24.5 24 43.8 32 32.6 56
Science & Technology 19.4 19 28.8 21 23.6 40
Arts & Education 22.4 22 24.7 18 23.4 40
Health 33.7 33 2.7 2 20.4 35
100 98 100 73 100 171
Table 4: Faculty of Enrolment
Half of the students that had elected to study ICT at school had attended public secondary schools, a quarter, independent schools, one fifth, religious based schools, and the remainder TAFE or international schools. Students who had elected to study ICT were now studying a variety of courses in different faculties (Table 4), including a small number (8 students) in the ICT area, three of whom where female. A significant gendered difference by faculties (Pearson Chi-Square 20.001, p-value=0.000) suggests that in this sample students are still
choosing gender related courses, as represented by the female dominance in Health and male dominance in Science and Business.
4.2.2 Differences between IT and IS The students who had elected to study ICT at school
were asked what they understood the difference between IT and IS to be. The textual responses were coded into three categories (Table 5); the placement of textual answers into these categories depended on the correctness of the responses as defined in the literature.
Opinion Female Male Total % n % n % n
Don’t Know 37.3 22 9.3 4 25.5 26
Answered question 55.9 33 86.0 37 68.6 70
No difference 6.8 4 4.7 2 5.9 6
100 59 100 43 100 102
Table 5: Understanding of IT and IS
Those students who answered this question gave a variety of explanations; most of these contained relevant information, although there were a few unusual answers. Some students went into great detail to explain what they thought was the difference with responses such as:
An information system is a collection of hardware, software, people, data and procedures. I.T. encompasses all areas of computer technology
and IT involves R & D and development and maintenance of hardware and software. IS involves implementing, developing, maintaining systems. Some students responded with brief comments such
as: ‘IT - computers, programming, technical. IS - databases and programs used to benefit an organisation more practical than IT’; or ‘IS is more than just computers - a calendar is an info system ICT is computers’; others were unclear with ‘Technology is involved with cars. Systems are involved in sport’, ‘Ones tech, ones systems’, and ‘Info systems more to system of programming and computer stuff, info technology is more to create new technology stuff.’
There was a significant difference in the answers when it came to gendered opinions (Pearson Chi-Square 11.121, p-value=0.004) although on further investigation this did not apply to the actual correctness of the explanations. Females were more likely not to have known the difference between IT and IS, while males offered more detailed explanations.
4.2.3 Influences on Career Choice The students who had elected to study ICT were asked to indicate from a list of possible personal influences on their choice of course. The results are displayed in Table 6, showing that young people entering university are independent thinkers and are more likely to make decisions on course choice without adult or expert assistance. No significant differences between genders
CRPIT Volume 103 - Computing Education 2010
130

were found (Pearson Chi-Square 4.029, p-value=0.402), although females tended to be influenced more by their parents than males, and males were influenced slightly more than females by their peers. These results are consistent with the findings of others. Ogan (2005), for example, found that about half of the students had made their study choice independently, and Papastergiou (2008) reported that almost 80% of the study respondents were not influenced by others in their choice.
Influence Female Male Total % n % n % n
No-One 51.0 50 54.8 39 52.6 89
Parents 21.4 21 11.3 8 17.2 29
Peers 9.2 9 14.1 10 11.2 19
Teachers 10.2 10 8.5 6 9.5 16
Other 8.2 8 11.3 8 9.5 16
100 98 100 71 100 169
Table 6: Influence on Career Choice
Students were then asked if they knew of someone who worked in the ICT industry, 62.3% (F 50, M 41) indicated that they did. Of these, 42.9% (F 27, M 24) indicate that that person had an effect on their perceptions of ICT, although it is not known to what extent, or if the effect was positive or negative. No difference in gendered opinions occurred in either knowing someone (Pearson Chi-Square 1.005, p-value=0.302) or the influence of that person (Pearson Chi-Square 0.025, p-value=0.873). The Labour Force Survey conducted by the Australian Bureau of Statistics indicated that Victoria was the second largest employer of ICT workers in Australia (as cited by Multimedia Victoria 2007b). The large number of students in this study who indicated that they knew someone who worked in the ICT industry suggests that two situations may be present: the first is that the surveyed students are located close to ICT centres; the second is that participants have interpreted that someone who uses a computer at work, works in the ICT industry.
4.2.4 Intentions of Career Choice Students that had chosen to study an ICT subject were asked to indicate if they had ever considered doing a university degree in computing (Table 7). A quarter of the students (42) indicated that they had considered this as an option, although only 12 students had followed through with their intention. The analysis showed a significant difference (Pearson Chi-Square 7.169, p-value=0.007) in gendered opinions with males being more interested than females.
Considered ICT
Female Male Total % n % n % n
Yes 18.1 17 36.8 25 25.9 42
No 81.9 77 63.2 43 74.1 120
100 94 100 68 100 162
Table 7: Considered IT as a Career
Students were asked why they had or had not considered ICT as a career. The most frequent qualitative responses are shown in Table 8. Even after students have
elected to and studied ICT at school, many are still not interested in ICT as a career. These results are consistent with the reasons given for not studying ICT at school. Some students preferred other areas for future investigation into career choice. Only a small amount of students indicated that their reason for considering ICT as a career was due to their enjoyment of computers, a similar amount of students indicated that an ICT career would be boring.
Why Female Male Total % n % n % n
Not Interested 29.3 22 19.6 10 25.4 32
Prefer other areas 16.0 12 19.6 10 17.5 22
Enjoy using computers 10.7 8 13.7 7 11.9 15
Boring 13.3 10 5.9 3 10.3 13
Too difficult 8.0 6 3.9 2 6.3 8
77.3 58 62.7 32 71.4 90
Table 8: Reasons for ICT Careers
The minor qualitative responses indicated both positive and negative attitudes towards ICT. These included ‘important skills for future’, ‘job opportunity, security in job’, ‘not work from a desk, not wanting to sit all day’, ‘nerdy, I’m too attractive’, ‘was into IT once’, ‘too many people do it’, ‘not relevant to my future career’, ‘not like at school, but like it at home’, and ‘can learn on my own’. One international student noted that she was ‘told IT not suitable for women’ by an overseas teacher.
4.2.5 Computer Usage Students were asked at what age they first started to use a computer (Table 9). No significant differences were found between genders (Pearson Chi-Square 6.636, p-value=0.156), although more males started earlier than females, and by the age of 21 some females had not yet used a computer.
These results show that most of the students have used a computer prior to commencing university, this is expected since the personal computer become common in Australia in the early 1980’s. Most first year university students in this sample would have began primary school in 1995 when Windows 95 was released and, with the proliferation of computers in schools, have had long term exposure to computers.
Comencement
Age Female Male Total % n % n % n
0-5 10.2 10 17.8 13 13.5 23
6-10 49.0 48 41.1 30 45.6 78
11-15 33.6 33 31.5 23 32.7 56
16-20 4.1 4 9.6 7 6.4 11
Over 21 3.1 3 0 0 1.8 3
100 98 100 73 100 171
Table 9: Age First Used a Computer
The students were asked to indicate the average daily length of time that they spent on a computer (Table 10). A small number of students did not use a computer daily, with the majority of students using a computer between 1 and 4 hours a day, while the remainder indicated usage of
Proc. 12th Australasian Computing Education Conference (ACE 2010), Brisbane, Australia
131

more than 5 hours a day. High computer usage is expected in this study as the students currently required it for course work, assignment preparation, as well as for entertainment and communication. Gendered differences were not found, with a Pearson Chi-Square of 2.555, and a p-value of 0.635. The students were not asked to indicate the type of computer use, so no distinction has been made between study, work, or personal enjoyment.
Hours used Female Male Total % n % n % n
0 hours 1.0 1 2.7 2 1.8 3
1-2 44.3 43 39.7 29 42.4 72
3-4 28.9 28 34.3 25 31.2 53
5-6 16.5 16 11.0 8 14.1 24
7+ 9.3 9 12.3 9 10.5 18
100 97 100 73 100 170
Table 10: Average Daily Computer Usage
This research has found that by the age of 18, over 90% of respondents had started to use a computer and over 87% of those would use a computer for between 1 and 6 hours a day. However Richardson and Tan (2005) suggests that not all computer users are equal, with inexperienced users requiring more daily use than experienced users to gain and keep the same skills.
4.2.6 Differences in Attitudes to ICT Students who had elected to study ICT were asked to rate 30 statements relating to their attitudes to ICT. In analysing these statements a comparison of means was employed; a mean of ‘1’ indicates strong agreement, ‘3’ neutrality, and ‘5’ strong disagreement. In eight of these statements a significant difference occurred in gendered opinions (Table 11). All 30 statements, their means, standard deviation, and p-value are shown in Appendix A.
No. Attitude Statement
2 I am familiar with technology (female mean 1.99, male mean 1.62, p-value .001)
3 I am confident using technology (female mean 2.09, male mean 1.70, p-value .003)
4 I have confidence in technology (female mean 2.41, male mean 2.07, p-value .017)
8 I am interested in studying ICT in the future (female mean 3.54, male mean 3.01, p-value .003)
10 I think ICT subjects are more for boys than girls (female mean 4.10, male mean 3.74, p-value .021)
11 Studying ICT locks you into the ICT industry (female mean 3.84, male mean 3.48, p-value .019)
12 I am attracted to the ICT industry (female mean 3.66, male mean 3.22, p-value .005)
24 Working in ICT involves repetitive work (female mean 2.86, male mean 2.51, p-value .011)
Table 11: Differences in Gender Opinions
Males tended to agree to a greater extent than females with technology familiarity, confidence in and using technology. This suggests that males are more comfortable with technology than females. This result supports the research by Broos (2005), Fisher and Margolis (2002), and Besterfield-Sacre et al (2001) where
it was found that males perceived themselves as less anxious about computers and were ahead in computer use, whereas females were less confident in their abilities in using technology. Both genders were in agreement when concerning computer and technology satisfaction, showing that technology has been accepted as part of their lifestyle. Staehr, Martin and Byrne (2001), found that first year university computing students were confident, were not anxious about computers, and liked using them. Lynch (2007) said that young Australians used technological devices regularly, but this usage did not lead to further study in the fields required to produce them, and that university students take them for granted.
The four statements about interest in future ICT study, gender suitability, being locked into the industry and industry attractiveness all recorded negative outcomes. Most students are not interested in additional study in ICT, which is confirmed by Rommes et al (2007, p. 307) where the students that were interviewed stated that they were ‘just not interested’ in working with computers. Females were less attracted to the ICT industry than males, although males in this study have indicated that they are undecided about being attracted to, or considering further studies in, ICT.
The dominance of males in ICT has been widely reported (McKinney et al 2008; Rommes et al 2007; Multimedia Victoria 2004; Lynch 2007). In this study both genders disagree with the statement ‘I think ICT subjects are more for boys than girls’, with the females disagreeing to a greater extent than the males. This is supported by the results of Papastergiou (2008) who found that a job in ICT is not more suited to either gender. Fear and a lack of confidence maybe one of the reasons females are reluctant to move into the ICT industry. Almost half of the women interviewed by Griffiths, Moore, and Richardson (2007) feared that they faced discrimination in the ICT industry. They felt that this was due to their lack of involvement in after-work activities, such as weekend sport and drinking with the boys, and perceived that they were missing out on being involved in important decision making discussions. Some women also felt that their career progression would be hampered by not attending non-work social events with male workmates (von Hellens and Nielsen 2001). The feeling of alienation by females is also evident in other careers dominated by males, such as in business and science, where few women hold high managerial positions.
Students of both genders (although females more than males) perceive that studies in ICT does not lock you into working in this industry; they expect to be able to use their skills in many sectors of employment. ICT is required to perform basic functions in all areas of society and ‘underpins most sectors of the economy’ (Heywood 2006, p. 4). This result is also supported by Multimedia Victoria where the majority (86%) of students agreed that by studying ICT, multiple opportunities in other career areas are opened up to them.
The perception that ICT work is repetitive is supported in this study, though females tend to be more indecisive about this statement than males. Could it be that they are misinformed about what is involved in working in the ICT industry, and therefore are not able to
CRPIT Volume 103 - Computing Education 2010
132

make an informed decision? Staehr, Martin and Byrne (n.d.) found that information distributed to secondary schools remained with one teacher, usually the careers teacher, and other teachers were not aware of its existence, and therefore not able to pass details onto students. They also observed that there were ‘misconceptions of what a career in computing involved’ (Staehr, Martin and Byrne n.d., p. 7). Students did not know enough about ICT jobs and their availability to be able to make an informed decision (Rommes et al 2007), and ‘the single greatest inhibitor to an interest in an ICT career is the lack of knowledge about the types of jobs available” (Multimedia Victoria 2004, p. 5).
4.2.7 Similarities in Attitudes to ICT The eight statements discussed in the previous section were the only ones that showed any gendered differences. A non-significant difference occurred in gendered opinions in the remaining 22 statements, suggesting that, with these issues at least, there is no difference in the way females and males view the realm of ICT (Appendix A).
Statements 13 to 19 from the questionnaire related to the attitude students might hold related to the ICT industry as a career. These statements investigated whether students thought that the ICT industry was in a period of growth, if it paid well, had potential for task variety, and availability of job opportunities. The students agreed with these statements indicating that their opinion of the ICT industry was a positive one.
The results of this research are similar to those of McKinney et al (2008) who reported that there was no significant difference in gendered opinions with respect to variety in ICT jobs and remuneration, in fact having variety in ICT jobs (McKinney 2008) and good incomes (Papastergiou 2008) were stated as motivations by students for entering into ICT. Participants in the Multimedia Victoria (2007a) study agreed that growth is evident in the ICT industry; however Lynch (2007) found that participants viewed the industry as shrinking.
A further group of statements (20 – 25) related to the students’ opinions of working in ICT. There was slight agreement to the statements relating to the work environment. The students in this research have the opinion that working in ICT still involves working in front of a computer all day and spending a large amount of time programming. Multimedia Victoria (2007a, p. 21) reported that the top negative factor about a career in ICT was ‘being stuck in front of a screen all day’.
Working with computers has long had the perception of involving a lot of programming. This perception may have come from earlier computer workers who had to have programming skills to operate older style systems that did not have the benefit of a graphical user interface. This is further supported by research undertaken by Sanders (2005) where secondary school students considered that working with computers focused exclusively on programming.
Students indicated that they neither agreed nor disagreed with statements relating to working long hours and if ICT work involved minimal human interaction. This shows that they are either unsure about these issues or do not know enough to correctly respond to the statements. The average working week for ICT
employees in Victoria is 40.5 hours a week, while the average for all Victorian employees is greater at 41.3 hours (ABS data as cited by Multimedia Victoria 2007b), indicating that ICT workers have, on average, a shorter working week than other full time employees.
The results of three statements support these students’ decision to not continue in this field. They have a low interest level of working in ICT, a perception that the industry is unattractive, and had little intention of future ICT studies. This lack of interest and the perception that ICT involves large amounts of programming with minimal human interactions reinforces the lack of interest in working in an ICT occupation. Does this indicate that students do not know what is expected in the ICT industry? Staehr, Martin and Byrne (n.d.), Rommes et al (2007) and Multimedia Victoria (2004) all support the suggestion that they do not!
The final section of the questionnaire (statements 26 – 30) asked students to rate their experience of chosen ICT subjects in relation to their fun, interest, amount of challenge, difficulty, and boringness. Students indicated that their elected subjects and their content were fun and interesting but also challenging. Multimedia Victoria (2007a) reported similar results from students who had studied ICT, with interest and having fun rating highly as reasons why ICT was well taught.
The perceptions that ICT subjects are boring and difficult are not coming from those who had elected to study ICT. This research found that students were neutral on whether ICT subjects were boring, and disagreed that the subject was difficult. This suggests that subject content or delivery may be the problem. Lynch (2007, p. 22) also suggested that the school curriculum may be an issue and commented that students with high computer abilities learnt more about computers at home than at school, and that they were ‘bored and frustrated’ with the way ICT subjects were taught at school.
5 Conclusion This research paper explored students’ opinions of ICT. In order to evaluate the data, the sample was divided into two, those who had elected to study ICT in their senior years of secondary school and those that had not.
Those students who had not elected to study an ICT subject in their senior years of secondary school made their decision mainly based on their lack of interest in this area. There were however a few students who had not studied ICT at school who were now undertaking an ICT related degree. Further research into similar students may provide useful insights.
The remainder of the paper concentrated on those students who had elected to study ICT during their final two years at secondary school. These students had a positive outlook of their experiences in their past ICT studies as well as a positive view of the industry. Despite this, students still hold the stereotypical perceptions that ICT involves an abundance of programming while sitting alone at a desk all day. Most of these students had commenced using a computer by their mid-teen years, and now used a computer daily.
This study has shown that there are few differences in the opinions of students who elected to study ICT at senior years of secondary school; therefore both males
Proc. 12th Australasian Computing Education Conference (ACE 2010), Brisbane, Australia
133

and females in this research view the ICT industry, ICT studies, computers, and technology in a similar way to each other. These students found their ICT studies to be challenging and interesting, although not difficult or boring, but despite this, fewer females are actually undertaking this course of study. Females were less confident than males when it came to technology. Could this lack of techno-confidence be a factor why females are less interested in ICT as a career?
Even though there are few differences in gendered opinions to ICT many students are still reserved about entering ICT as a future career. This fact is not just evident in this research; there is an ongoing low level of interest in ICT with decreasing numbers of students selecting ICT subjects at school. Young people have indicated that they enjoy using their technological devices but still most have little interest in studying ICT or developing ICT tools. They did not wish to continue in this field even after finding their ICT studies fun. Others indicated that they enjoyed using computers and had considered further study, but only a few had actually followed this through. Equally of concern is the increasing lack of availability of ICT subjects in senior years of high school, and the many students who appear to have incorrect perceptions of what employment in the ICT industry entails. The career information relating to ICT that is received by schools does not seem to be filtering down to those who need it.
Today’s young people are independent thinkers making career choices by themselves, rather than with assistance from others. By the time students enter university the decision whether or not to study ICT has been made.
The factors influencing students’ decision to not continue with ICT studies seem to be coming from areas other than those explored in this research. An investigation into the lack of interest, curriculum expectations, curriculum delivery, experiences in ICT, and motivations for continuing or not continuing ICT studies at strategic decisional points in time is forthcoming.
6 References Adams, A., Griffiths, M., Keogh, C., Moore, K.,
Richardson, H. and Tattersall, A. (2006): Being an ‘it’ in IT: gendered identities in IT work. European Journal of Information Systems, 15:368-378.
Akbulut, A.Y., Looney, C.A. and Motwani, J. (2008): Combating the decline in Information Systems Majors: the role of Instrumental assistance. Journal of Computer Information Systems, 48(3):84-93.
Anderson, N., Timms, C. and Courtney, L. (2006): “If you want to advance in the ICT industry, you have to work harder than your male peers.” Women in ICT Industry Survey: Preliminary findings. Proc. AusWIT: participation one year on, 10th Australian Women in IT conference. Adelaide, Australia.
Avgerou, C., Siemer-Matravers, J. and Bjorn-Anderson, N. (1999): The academic field of information systems in Europe. European Journal of Information Systems, 8(2):136-153.
Australian Bureau of Statistics (2004): 1370.0 - Measures of Australian Progress. Accessed 27 November 2008. http://www.abs.gov.au/Aussats/[email protected]/46d1bc47ac9d0c7dca256c470025ff87/12D74A6C075E8CC4CA256E7D00002651?opendocument.
Benson, S. and Standing, C. (2005): Information systems: a business approach, 2nd edn. Milton, John Wiley and Sons Australia Ltd.
Bestrerfield-Sacre, M., Moreno, M., Shuman L.J. and Atman, C.J. (2001): Gender and Ethnicity differences in Freshmen Engineering Student Attitudes: A Cross-Institutional Study. Journal of Engineering Education, 90(4):477-489.
Bimrose, J. (2006): Career theory for women. http://www.gla.ac.uk/rg/egende09.htm, web page created on 7 November 2006, by Dr P M Clayton, Faculty of Education, University of Glasgow. Accessed 8 May 2008.
Broos, A. (2005): Gender and Information and Communication Technologies (ICT) Anxiety: Male self-Assurance and Female hesitation. CyberPsychology and Behavior, 8(1):25-31.
Craig, A. (2009): Intervention Programmes to Recruit Female Computing Students: Why Do the Programme Champions Do It? Proc. 11th Australasian Computing Conference, Wellington, NZ, 95:35-44, ACS.
Department of Finance and Administration (2007): Meeting the Demand for ICT Skills in the Australian Public Service – Today and for the Future. Barton, Australian Government.
Fisher, A. and Margolis, J. (2002): Unlocking the Clubhouse: the Carnegie Mellon Experience. Inroads - SIGSCE Bulletin, 34(2):79-83.
GradCareers in Engineering, Science and IT (2008). Melbourne, Hobsons Australia Pty Ltd.
Griffiths, M., Moore, K. and Richardson, H. (2007): Celebrating Heterogeneity?: A survey of female ICT professionals in England. Information, Communication and Society, 10(3):338-357.
Guichard, J. and Lenz, J. (2005): Career theory from an international perspective. The Career Development Quarterly, 1 September 2005, Accessed 1 May 2008. http://goliath.ecnext.com/coms2/summary_0199-4696208_ITM.
Harris, R. and Wilkinson, M.A. (2004): Situating gender: students’ perceptions of information work. Journal of Information Technology and People, 17(1):71-86.
Heywood, A. (2006): Careers for Information Technology Graduates. Parkville, Graduate Careers Council of Australia Limited.
http://www.vcaa.vic.edu.au. Accessed 12 May 2008.
Lynch, J. (2007): Exploring the gender and IT problem and possible ways forward. In Gender and I.T: Ongoing challenges for computing and Information Technology education in Australian secondary schools. Lynch J. (editor). 1-26. Altona, Common Ground Publishing.
Mbarika, V.W.A., Cobb Payton, F., Kvasny, L. and Amadi, A. (2007): IT Education and Workforce
CRPIT Volume 103 - Computing Education 2010
134

Participation: A New Era for Women in Kenya? The Information Society, 23:1-18.
McKinney, V.R., Wilson, D.D., Brooks, N., O’Leary-Kelly, A. and Hardgrave, B. (2008): Women and Men in the IT Profession. Communications of the ACM, 51(2):81-84.
Multimedia Victoria (2004): Attitudes to ICT careers and study among 17-19 year old Victorians. Melbourne, Department of Infrastructure.
Multimedia Victoria (2007a): ICT Skills Research, Attitudes to ICT Careers and Study among 14-19 year old Victorians (Years 9-12). Melbourne, Multimedia Victoria.
Multimedia Victoria (2007b): ICT Skills Snapshot, The State of ICT skills in Victoria. Melbourne, State of Victoria.
Newmarch, E., Taylor-Steele, S. and Cumpston, A. (2000): Women in IT – What Are the Barriers? Network of Women in Further Education Conference, www.dest.gov.au/research/docs/womenin_it.pdf. Accessed 31 March 2008.
Ogan, C., Herring, S., Ahuja, M. and Robinson, J. (2005): The More Things Change, the More They Stay the Same: Gender Differences in Attitudes and Experiences Related to Computing. International Communication Association Conference Papers, Annual Meeting, New York, pp. 1-32.
Panko, RR (2008): IT employment prospects: beyond the dotcom bubble. European Journal of Information Systems, 17:182-197.
Papastergiou, M. (2008): Are Computer Science and Information Technology still masculine fields? High school students’ perceptions and career choices. Computers & Education, 51(2):594-608.
Richardson, A. and Tan, R. (2005): Building a better “geekness” measure for the world of tomorrow. 16th Australian Conference on Information Systems. 29 November to 2 December 2005, Sydney.
Rommes, E., Overbeek, G., Scholte, R., Engels, R. and De Kemp, R. (2007): I’m not interested in computers: Gender-based occupational choices of adolescents. Information, Communication and Society, 10(3):299-319.
Sanders, J. (2005): Gender and Technology in Education: A Research Review. Accessed 31 March 2008. http://www.josanders.com/pdf/gendertech0705.pdf.
Staehr, L., Martin, M. and Byrne, G. (n.d.): Encouraging Participation and Retention of Women in Undergraduate Computing Programs: An Australian Perspective. Unpublished report.
Staehr, L., Martin, M. and Byrne, G. (2001): Computer Attitudes and Computing Career Perceptions of First Year Computing Students. Informing Science. http://proceedings.informingscience.org/IS2001Proceedings/pdf/staehrEBKcompu.pdf. Accessed 5 May 2008.
von Hellens, L. and Nielsen, S. (2001): Australian Women in IT. Communications of the ACM, 44(7):46-52.
Wilson, D.N. and Avison, D. (2007): Double Jeopardy: the Crises in Information Systems, an Australian Perspective. 18th Australian Conference on Information Systems, pp. 60-68.
Proc. 12th Australasian Computing Education Conference (ACE 2010), Brisbane, Australia
135

Appendix A: Survey Results for Recent ICT Students (n = 175)
Attitude Statement Female Male Sig.
Mean Std. Dev. Mean Std. Dev. p-value 1 I enjoy using computers 1.86 .908 1.62 .735 .070
2 I am familiar with technology 1.99 .735 1.62 .716 .001
3 I am confident using technology 2.09 .905 1.70 .735 .003
4 I have confidence in technology 2.41 .937 2.07 .941 .017
5 I am dependent on technology 2.37 1.029 2.27 .969 .531
6 Computers are important to me 1.95 .866 1.81 .680 .252
7 I like using the latest technology 2.01 .863 1.82 .970 .186
8 I am interested in studying ICT in the future 3.54 1.073 3.01 1.196 .003
9 ICT subjects are not relevant to my future career 3.53 1.009 3.44 1.112 .620
10 I think ICT subjects are more for boys than girls 4.10 .918 3.74 1.106 .021
11 Studying ICT locks you into the ICT industry 3.84 .862 3.48 1.094 .019
12 I am attracted to the ICT industry 3.66 1.005 3.22 1.050 .005
13 The ICT industry is growing 1.79 .753 1.88 .721 .449
14 A career in ICT is well paid 2.40 .780 2.33 .728 .524
15 There is variety in ICT jobs 2.29 .763 2.31 .875 .860
16 There are job opportunities available in ICT 2.07 .684 2.23 .750 .157
17 There is job security in ICT 2.65 .846 2.64 .877 .959
18 An ICT job enables flexibility in working hours 2.83 .789 2.99 .935 .239
19 There is no future in ICT as it will all be out-sourced overseas 3.68 .877 3.61 1.011 .670
20 Working in ICT is an interesting occupation 2.97 1.060 2.92 1.030 .755
21 Working in ICT means working in front of a computer all day 2.95 .972 2.86 1.071 .588
22 Working in ICT involves little human interaction 2.98 .967 3.22 1.091 .130
23 Working in ICT means working long hours 3.12 .770 2.97 .888 .266
24 Working in ICT involves repetitive work 2.86 .841 2.51 .925 .011
25 Working in ICT involves a lot of computer programming 2.62 .856 2.75 .983 .354
26 I found ICT subjects fun 2.90 1.144 2.58 1.182 .078
27 I found ICT subjects interesting 2.76 1.099 2.47 1.081 .087
28 I found ICT subjects difficult 3.23 1.081 3.32 1.189 .625
29 I found ICT subjects boring 3.04 1.136 3.03 1.082 .940
30 I found ICT subjects challenging 2.88 1.083 2.89 1.067 .925
Scale: 1 – Strongly Agree, 2 – Agree, 3 – Neither Agree or Disagree, 4 – Disagree, 5- Strongly Disagree
Shaded sections indicate a significant difference between genders.
CRPIT Volume 103 - Computing Education 2010
136

The Quality of a PeerWise MCQ Repository
Helen Purchase1 John Hamer2 Paul Denny2 Andrew Luxton-Reilly2
1 Department of Computing ScienceUniversity of Glasgow,Glasgow, Scotland,
Email: [email protected]
2 Department of Computer ScienceThe University of Auckland
Private Bag 92019, Auckland, New Zealand{J.Hamer,paul,a.luxton}@cs.auckland.ac.nz
Abstract
PeerWise allows students to create a repository ofmultiple choice questions which can be attempted bytheir peers, and discussed between them online. Peer-Wise has been shown to foster deep learning and toimprove students’ performance. In this paper, we con-sider the nature of the repository created by a large,first year programming class, looking in particular atthe quality attributes of Coverage, Question Quality,Difficulty and Indexing. The effect of student ability(as measured by a class test given before use of Peer-Wise) on the contributions to the repository is alsoinvestigated. We find that the overall quality of therepository is good, with only a few minor deficiencies,and conclude that these small defects are a small priceto pay when compared with the substantial learningbenefits that result from PeerWise use.
Keywords: MCQ, PeerWise
1 Introduction
Assessment and feedback are key ingredients of thelearning process. For practical reasons, multiple-choice tests have been used extensively for student as-sessment in large classes. However, the literature alsoreports a number of benefits in learning offered by thisstyle of question (Draper 2009, Kuechler & Simkin2003, Epstein et al. 2002), as well as comprehensiveguides on developing and using multiple-choice ques-tions effectively (Woodford & Bancroft 2004). On theother hand, there are an equal number of reports onthe limitations of MCQs (Wesolowsky 2000, Paxton2000), which include the time and effort necessary todevelop question sets.
One approach to overcoming the work requiredto generate sufficiently large question repositories in-volves the use of technology for automatically gen-erating questions. For example, Traynor & Gibson(2005) describe a system involving random code gen-eration and mutation as a method for automaticallysynthesising multiple choice questions which are thenused for assessment. Brusilovsky & Sosnovsky (2005)present the QuizPACK system which is able to gen-erate parameterized exercises for the C language andautomatically evaluate the correctness of student an-swers. Although reports of these systems are very
Copyright 2010, Australian Computer Society, Inc. This pa-per appeared at Twelth Australasian Computing EducationConference (ACE2010), Brisbane, Australia, January 2010.Conferences in Research and Practice in Information Technol-ogy (CRPIT), Vol. 103. Tony Clear and John Hamer, Ed.Reproduction for academic, not-for profit purposes permittedprovided this text is included.
positive, both from a student attitude and learningperspective, the questions that are generated are lim-ited to some extent by the parameters and templatesprovided by the instructors.
Kumar (2005) points out that at the other endof the spectrum from automatically generated ques-tions are systems that depend on problems carefullyhand-crafted by an instructor, but these generallyhave a limited repertoire. In addition, questions gen-erated by one instructor that are highly suitable fortheir teaching context, may not be re-usable by aninstructor teaching in another context with perhapsa slightly different curriculum.
One very different approach to generating largerepositories of relevant questions is the PeerWiseproject. PeerWise places the responsibility for ques-tion creation in the hands of the students, consistentwith a contributing student philosophy (Hamer et al.2008), and transforming them from passive recipientsto active learners. PeerWise has proved successful insupporting the generation of repositories with thou-sands of questions in a matter of weeks, without guid-ance or effort on the part of the instructor. Thesequestion banks are then available for students to usefor self-directed study, in a similar vein to the ap-proach taken by Roberts (2006) that has offered sig-nificant gains for both educators and students. More-over, by actually developing the questions themselves,students must reflect on the learning outcomes ofthe course, consider misconceptions when proposingdistracters (plausible, yet incorrect, answers), under-stand the topic in depth, and write a clear explanationfor the correct answer. In addition, students are en-couraged to evaluate the quality of the questions cre-ated by their peers, an activity that would not be aseffective with instructor generated questions. Doingthis brings important critical analysis skills into play,requiring behaviour at the higher levels in Bloom’staxonomy of the cognitive domain (Anderson 2001).
1.1 Coverage, Quality, Difficulty and Index-ing
Elsewhere, we have reported on the learning benefitsof PeerWise use (Denny et al. 2008); the focus of thispaper is the quality of the question repository devel-oped by the students. For the purposes of this evalua-tion, we have considered four aspects of a repository:Coverage, Quality, Difficulty and Indexing. Cover-age and Quality have been studied previously: earlierwork has shown that, despite having the freedom tochoose any topic on which to write questions, studentscan create a repository covering all the major topics inthe curriculum (Denny, Luxton-Reilly, Hamer & Pur-chase 2009). In addition, we found the vast majorityof questions were clearly worded, free from error, and
Proc. 12th Australasian Computing Education Conference (ACE 2010), Brisbane, Australia
137

gave the correct answers (Denny, Luxton-Reilly & Si-mon 2009). Students were also found to be effectivejudges of question quality, and were willing to usethe judgements of their peers to decide which ques-tions to answer for review. In this paper, we extendthis earlier work by examining the extent to whichacademic ability influences the quality of questions.We re-examine coverage and quality by comparingthe contributions of students in different achievementquartiles.
Difficulty and Indexing have not previously beenstudied. As students are not given guidance over thekinds of questions to write, it seems plausible thatmany questions may be simplistic. Ideally, we wouldlike to see questions with a range of difficulties presentin the repository, and we would like students to haveaccurately assessed the question difficulty so this in-formation can be shared, and used, by their peers inthe same way as question quality ratings.
Indexing refers to the“tags” students can associatewith a question when they write it. As students areable to filter a PeerWise question bank by viewingonly questions tagged with a certain topic, an accu-rate index improves the usefulness of the repository.
2 Context of use
The analysis in this paper is based on a repository ofquestions developed by students in a standard Java-based CS1 course at the University of Auckland inthe first semester of 2008. Students were not givenany guidance regarding the topics on which to writequestions, but were required to contribute at least twoquestions to the repository. Students’ choice of topicsdid not have any influence on the coursework markfor this activity.
Of the 400 students who sat both the mid-termtest and the final exam, 334 contributed at least onequestion. As a result we were left with 602 questionsfor the analysis.
When a student develops a question, they are ableto assign one or more “tags”, each of which can be aword or short phrase. In this course, no pre-set tagswere provided and no guidance given to students ontagging. Students can either select tags from a list ofall previously used tags in the repository, or they canenter their own. They could use as many tags as theyliked, or no tags at all.
As soon as a student contributes a question toPeerWise, it becomes available for other students toanswer. Upon selecting an answer, a student is shown:the author’s answer; a frequency chart of previous stu-dent responses; the author’s explanation; and a dis-cussion thread. The student can then rate the ques-tion for quality on a 6-point subjective scale (0=poor,5=excellent), and for difficulty on a 3-point scale(0=easy, 2=difficult).
3 Features of a “good” MCQ repository
We consider the following to be important features ofa good MCQ repository:
Content:
1. The repository covers a wide range of topics, in-cluding all those that staff use in formal assess-ment questions.
2. It includes complex questions, covering morethan one topic.
Quality:
3. The questions are of good quality, with respectto five criteria:
(a) The question is clearly stated;
(b) The question is error free;
(c) The distractors are feasible;
(d) The accompanying explanation is good;
(e) The specified answer is correct.
4. No topics lack good quality questions.
Difficulty:
5. The questions are available in a range of levels ofdifficulty.
6. There is a range of difficulty within each topic.
Indexing:
7. The index is of appropriate granularity.
8. All questions have at least one indexing term.
9. The assigned indices match the topic of the ques-tions.
The coverage and quality features have previouslybeen reported (Denny, Luxton-Reilly, Hamer & Pur-chase 2009, Denny, Luxton-Reilly & Simon 2009). Inthis paper, we present data addressing the indexingand difficulty of the repository, and consider all fourfeatures with respect to the varying ability of the stu-dents.
4 Methodology
4.1 The question topics
All 602 questions contributed were categorised ac-cording to their content, with some questions beingassociated with more than one category and all ques-tions associated with at least one category. The cat-egorisation was done by two academic staff who havebeen involved in the course over several years and whoauthored the coursebook used as the standard text.Initially, the two staff members began classifying thequestions together to develop consistency. Once thisprocess had settled down, the questions were dividedup and each one classified by a single person, with anyquestions that proved difficult to classify discussedwith the other.
The syntactic and semantic content of each ques-tion was noted (e.g. array initialisation, array dec-laration, array length), and a fine-grained categori-sation of 124 categories emerged. These were thenorganised into 14 topics, where Table 1 shows eachtopic and examples of their associated categories. Thetopics themselves were drawn from the chapters ofthe coursebook, with the addition of two categories:“Miscellaneous”, and “Unassessed”. The Miscella-neous topic included material which was relevant tothe course, but which would not tend to be assessedin isolation (such as the Java style conventions, useof literals, and the difference between run-time andcompile-time errors). The Unassessed topic was usedto classify questions that contained material outsidethe scope of the course.
CRPIT Volume 103 - Computing Education 2010
138

1 Std. output escape sequences, print vs println2 Variables as named storage locations, assignment, scope of local variables3 Expressions evaluating arithmetic expressions, String concatenation4 Objects reference variables, creating objects, equality of objects5 API using the API for String methods, static methods, graphics6 Methods calling, tracing, parameters, return7 Relational/logical boolean and relational operators, (>, <, ==), equality of doubles8 Conditionals if, if-else9 Arrays primitive and object arrays10 Loops while and for11 Classes defining classes, instance variables, instance methods12 Java GUI Swing, event handling13 Misc. code conventions, symbolic constants, literals, error types14 Unassessed outside the scope of the course
Table 1: Topics and examples of their question categories
4.2 The effect of ability
While we might be able to conclude that a good MCQrepository can be developed by students, we needto consider the effect of student ability: it may bethat only high-performing students contribute sub-stantially to the overall quality of the repository.
We divided the 334 students into four quartiles,based on the marks obtained in their mid-term test,which was held before they used PeerWise. Q1 is thelowest performing quartile, and Q4 the highest.
As all students were required to submit at least twoquestions, few students submitted more than this, andthe division of the 602 questions by quartile results inalmost equal numbers. The number of students andquestions in each quartile is shown in Table 2.
Q1 Q2 Q3 Q4 SumNumber of students 84 83 82 85 334
Total questions 152 147 145 158 602
Table 2: Division of questions and students into quar-tiles
We considered each of our quality features listedin Section 3 above, over the whole class, and withrespect to these quartiles, so as to see whether theability of the students can affect the quality of therepository. In the categories of Coverage and Qual-ity, we restate our previous findings for the purposesof comparison (Denny, Luxton-Reilly, Hamer & Pur-chase 2009, Denny, Luxton-Reilly & Simon 2009).
5 Coverage
5.1 The range of topics covered
We previously reported the distribution of studentgenerated questions according to topic was stronglycorrelated with the distribution of staff questions informal assessments (Denny, Luxton-Reilly, Hamer &Purchase 2009). However, students wrote fewer ques-tions on topics that were more complex (such as meth-ods, arrays and classes) than staff used in the formalexamination content.
Students had been given no instruction on the top-ics they should choose for their questions, and wereunconstrained in their choice (e.g. they were not toldthat they could not write a question covering a topicthat had already been included in an existing ques-tion).
Table 3 shows the percentage of questions on eachtopic in the student-created question repository. Byway of comparison, it also includes the percentage ofquestions on each topic used in 233 staff-generatedquestions used in formal assessments (mid-term testsand examinations) in the previous five semesters.
Note that many questions relate to more than onetopic, so the percentages do not total to 100%.
The table shows coverage of all course topics, withcontributions from all ability levels. A notable omis-sion is the low number of questions from Q1 and Q2on Classes and Loops. Questions on the Java APIand Expressions dominate the repository, and provedpopular across all quartiles. Methods, Arrays andClasses are all deficient compared to the assessmentused by staff. In the case of Classes, this deficiency isdue to the absence of contributions from Q1 and Q2.Relatively low contributions for Methods and Arraysare seen across the board.
Staff All Q1 Q2 Q3 Q4Q1–4Trend
Output 2.1 7.0 4.6 5.4 9.0 8.9Variables 9.9 12.3 12.5 10.2 11.0 15.2
Expr 21.0 35.2 35.5 32.7 37.2 35.4Objects 13.3 10.8 9.2 10.2 9.0 14.6
API 39.5 34.1 40.1 29.9 36.6 29.7Methods 24.0 5.6 3.9 4.1 7.6 7.0
Rel. 8.6 11.6 9.2 13.6 9.7 13.9Cond. 16.7 16.3 12.5 13.6 20.7 18.4Arrays 18.9 11.6 6.6 10.2 17.9 12.0Loops 15.5 18.8 9.2 12.2 22.8 30.4
Classes 5.6 2.5 na 0.7 4.8 4.4Java GUI 5.2 5.6 2.6 6.1 6.9 7.0
Misc. 4.3 3.2 2.0 3.4 4.1 3.2Unass. na 1.3 1.3 1.4 1.4 1.3
Table 3: Percentage of questions on each topic
5.2 The density of question topics
In an earlier study of the repository questions, wefound that the majority of questions focused on a sin-gle topic, but the repository contained a substantialnumber of questions that involved two or more top-ics (Denny, Luxton-Reilly, Hamer & Purchase 2009).We consider that the greater the number of topics, thegreater the level of cognitive sophistication. A ques-tion that involves multiple topics requires students tounderstand a greater breadth of course material inorder to pose and answer the question correctly.
In this study, we analysed the density of topics re-lated to each question with respect to student ability.Table 4 summarises the number of topics associatedwith each question, divided into quartiles.
While overall about half the questions address asingle topic, there is a consistent, upward trend withability level. An“inversion point”can be seen at the 2-topic level: lower quartiles dominate before this line,
Proc. 12th Australasian Computing Education Conference (ACE 2010), Brisbane, Australia
139

1 2 3 4 5 6 7
0.0
0.5
1.0
1.5
2.0
Number of topics
Difficulty r
ating
Figure 1: Difficulty rating increases with the numberof topics in a question
while the upper quartiles dominate after. Confidencein dealing with two or more programming topics ap-pears to arise only with higher performing students.This is consistent with the work of Lister et al. (2006),who also identify a transition from a “uni-structural”to a “multi-structural” understanding in novice pro-grammers.
#topics Overall Q1 Q2 Q3 Q41 308 97 87 59 652 190 42 47 46 553 62 8 9 27 184 29 3 3 10 135 10 2 0 2 66 2 0 1 1 07 1 0 0 0 1
Questions 602 152 147 145 158Topics 1059 227 226 288 318
Table 4: Density of question topics, by quartile
It is interesting to investigate whether ‘more top-ics’ means ‘greater difficulty’. We performed a cor-relation analysis, finding a significant correlation be-tween the number of topics covered by a question andthe average difficulty rating given by students for thatquestion (R = 0.402, p ≪ 0.01) (Figure 1).
As can be clearly seen, difficulty rises steadily withthe number of topics.
6 Question quality
Previously we investigated the quality of the ques-tions that compose the repository (Denny, Luxton-Reilly & Simon 2009). We measured quality withrespect to the clarity of the question stem, the feasi-bility of the distracters, the extent of the explanationand whether the question contained any errors. Aca-demic staff assigned ratings to 57 of the 602 questionsin the repository, by selecting every tenth question inchronological order (skipping only questions that hadbeen deleted by the author). For each question in thesample, academic staff also assigned an overall sub-jective quality score to the question, using the same
Clarity of question∙ No: had something that made it hard to un-
derstand;∙ Yes: could understand what was being asked.
Error free question∙ No: it contained minor errors, including
grammatical errors in the stem or minor syn-tax errors in code presented in the questions;
∙ Yes
Distracters feasible∙ Less than 2 distracters feasible (of correct
type, and could be justified);∙ At least 2 (but not all) distracters feasible;∙ All distracters feasible (note: not necessarily“a perfect set”of distracters, such as one mightdevise for an exam)
Explanation∙ Poor or missing;∙ Good, explained why the correct answer was
correct;∙ Very good, explained not only the correct an-
swer, but included some discussion of commonmistakes/misconceptions or explicit analysisof distracters
Correctness∙ Incorrect answer indicated by the author;∙ Correct answer indicated.
Table 5: Objective quality rubric
six point scale (0 to 5) that the students use, as a mea-sure of how good the question was overall for learningand revision.
We found that the majority of the questions wereclearly written, were written without errors, had fea-sible distracters, and gave the correct answer. How-ever, only about 60% of the accompanying explana-tions were good, and the overall quality of the ques-tions was variable.
6.1 The five quality criteria
The five quality criteria as assessed by staff on a sub-set of the questions were based on the rubric shownin Table 5.
Table 6 summarises our classifications of the 57questions in our sample according to this rubric,showing the percentage questions that satisfy each ofthe five quality criteria.
All Q1 Q2 Q3 Q4Clearly stated 93 100 95 89 88Error free 83 71 73 87 98All distractors fea-sible
81 60 88 86 89
Good or very goodexplanation
61 45 51 68 78
Correct answer 89 92 88 79 95
Table 6: Percentages of questions satisfying qualitycriteria, by quartile
There is a surprising negative trend in the clar-ity of questions over the four quartiles. The lowestperforming group wrote consistently clear questions,while the higher performing groups sometimes strug-gled. However, we know that the higher quartiles alsoattempt more ambitious questions involving multipletopics, while the weaker quartiles favour simple, eas-ily expressed questions along the lines “what is the
CRPIT Volume 103 - Computing Education 2010
140

Q1 Q2 Q3 Q4
01
23
4
Stu
dent−
assessed q
ualit
y
Figure 2: Distribution of student assessed quality rat-ings, by quartile
output of this expression”. We speculate that ques-tions that cover fewer topics (which are typically con-tributed by the lower quartile students) are easier tophrase clearly.
The trend reverts back when considering errors,which appears to be an area of concern for a largeportion of the class. Only the very highest performingstudents consistently checked their grammar and thatthe code compiled, while the lower two quartiles wereoften satisfied to submit erroneous work.
Interestingly, all but the lowest quartile of studentswere able to pick good distracters. This is known tobe a difficult task, even for instructors.
As expected, the ability to produce a good expla-nation increases with quartile. Even so, over 20% ofthe highest performers failed to explain their answeradequately. Producing a good explanation is clearlya demanding task.
Selecting the correct answer follows an interest-ing dip, with the lowest and highest quartiles bothperforming better than the middle. The explanationagain seems to be due to more difficult questions beingattempted by better students, giving more opportu-nity for error.
6.2 The quality of questions in each topic
Only a random sample of the 602 questions was ratedfor quality by staff. To do a more detailed analysis ofthe quality of the questions with respect to all ques-tions, we needed an alternative quality measurement.All questions were given an overall quality rating on asix point scale (0=poor, 5=excellent) by the studentswho answered them, and the staff gave an overallquality rating to the subset of questions they assessedon the same six point scale. These two quality ratingsare largely correlated (R = 0.459, p ≪ 0.01), and soour subsequent analyses with respect to quality usesthe student assigned quality ratings as a measurementof question quality.
Figure 2 shows the distribution of student-assignedquality ratings to questions authored by students ineach quartile, and Table 7 shows, for every topic, themean student-assigned quality ratings to questionsauthored by students in each quartile.
All Q1 Q2 Q3 Q4Q1–4Trend
Output 2.7 1.8 3.1 2.7 3.1Variables 2.8 2.6 2.7 2.8 3.0
Expr 2.8 2.6 2.6 2.8 3.1Objects 2.8 2.9 2.6 2.7 2.8
API 2.7 2.7 2.6 2.7 3.0Methods 2.8 2.4 2.5 2.7 3.2
Rel. 2.7 2.7 2.3 2.8 2.9Cond. 2.8 2.8 2.5 2.9 2.8Arrays 2.9 2.9 2.6 2.9 3.1Loops 3.0 2.6 3.0 2.9 3.1
Classes 3.0 na 1.3 3.0 3.2Java GUI 2.7 2.0 2.1 3.2 3.1
Misc. 2.2 3.0 1.4 2.3 2.6Unass. 2.6 1.5 2.5 2.7 3.6
Table 7: Mean quality rating per topic, by quartile
Percentage correct
Perc
ent of Tota
l
0
2
4
6
8
10
0.0 0.2 0.4 0.6 0.8 1.0
Figure 3: Distribution of correct answer frequency
Quality ratings are largely uniform across all topicsand all student quartiles. The figures for Output,Methods, Classes, and the Java GUI are based on toosmall a sample to draw robust conclusions. However,the Output questions for Q1 are anomalously low, butthe reason for this is unclear. There is a modest risein quality with student ability.
7 Difficulty
There are two ways in which the difficulty of a ques-tion may be determined: by the mean of the diffi-culty ratings given by the students (on a three-pointscale from easy=0 to 2=difficult), or by the percent-age number of students answering the question whogot the correct answer. Figure 3 shows the distribu-tion of the percentage number of students who gotthe correct answer. Note that the high number at 0%is likely to reflect answers to questions for which thecontributor specified an incorrect answer.
These two measures (percentage correct answersand difficulty rating) are largely correlated (R =−0.445, p ≪ 0.01; see Figure 4). In our analysis of
Proc. 12th Australasian Computing Education Conference (ACE 2010), Brisbane, Australia
141

0.0 0.5 1.0 1.5 2.0
020
40
60
80
100
Difficulty rating
Perc
enta
ge o
f corr
ect answ
ers
Figure 4: Question difficulty against percentage ofcorrect answers
the difficulty of the repository, we have chosen to usethe average difficulty rating, avoiding any accuracyconfounds arising from cases where a student gets aquestion ‘right’ when the correct answer specified bythe author is, in fact, incorrect.
7.1 The range of difficulty
Each question has a mean difficulty rating between 0and 2: the mean over all 602 questions is 0.418. Fig-ure 5 shows the distribution of question difficulty rat-ings, and Figure 6 shows the distribution of student-assigned difficulty ratings to questions authored bystudents in each quartile.
The difficulty rating is strongly skewed towardsthe ‘easy’ end of the scale, and there is a steady trendtoward greater question difficulty with student quar-tile. However, even the highest performing studentsare predominantly writing ‘easy’ questions.
7.2 The range of difficulty within each topic
Table 8 shows the mean difficulty per topic, andFigure 7 shows the distribution of difficulty ratingswithin each topic.
No topics emerge as distinctly more difficult.Questions on the API tend to be a little easier, al-though the top quartile students were able to set morechallenging examples. The trend toward greater diffi-culty with quartile is only disturbed by the Java GUItopic, but this may be an artifact of the small numberof questions.
8 Indexing
In this section we consider the extent to which theMCQ question repository is satisfactorily indexedby tags.Tags have gained some prominence recentlywith the increased popularity of websites associatedwith information sharing and social networking (“Web2.0”). For example, the popular photo sharing sitewww.flickr.com allows users to attach tags to pho-tographs, thus enabling other users to search thearchive. Tags may also have importance beyond sim-ple searching. Student-created meta-data (i.e. tags)
Difficulty ratingP
erc
ent of Tota
l
0
5
10
15
0.0 0.5 1.0 1.5 2.0
Figure 5: Distribution of question difficulty ratings
Q1 Q2 Q3 Q4
0.0
0.5
1.0
1.5
2.0
Difficulty r
ating
Figure 6: Distribution of student-assigned questiondifficulty ratings, by quartile
CRPIT Volume 103 - Computing Education 2010
142

All Q1 Q2 Q3 Q4 TrendOutput 0.48 0.21 0.44 0.48 0.62
Variables 0.46 0.24 0.30 0.59 0.65Expr 0.44 0.28 0.33 0.46 0.69
Objects 0.52 0.35 0.45 0.39 0.74API 0.40 0.22 0.30 0.43 0.71
Methods 0.66 0.56 0.50 0.63 0.84Rel. 0.57 0.28 0.47 0.63 0.81
Cond. 0.57 0.38 0.35 0.54 0.87Arrays 0.56 0.41 0.45 0.60 0.67Loops 0.66 0.52 0.58 0.61 0.75
Classes 0.57 0.00 0.00 0.71 0.50Java GUI 0.48 0.47 0.26 0.66 0.50
Misc. 0.41 0.50 0.52 0.36 0.30Unass. 0.74 0.70 0.29 1.37 0.62
Table 8: Mean difficulty, overall and by quartile
Outp
ut
Vari
able
s
Expr
Obje
cts
AP
I
Meth
ods
Rel.
Cond.
Arr
ays
Loops
Cla
sses
Java
GU
I
Mis
c.
Unass.
0.0
0.5
1.0
1.5
2.0
Difficulty r
ating
Figure 7: Distribution of difficult ratings by topic
may directly contribute to learning, by engaging stu-dents in a cognitively demanding, reflective activity(Or-Bach 2005).
There is also evidence suggesting tags may be help-ful in forming and shaping knowledge when the tagsare allowed to emerge from social group interaction(Yew et al. 2006).
When answering a question, each student was pre-sented with a ‘tag cloud’ showing the tags associatedwith the questions currently in the system. The visualprominence of each tag in this tag cloud was propor-tional to the number of times it had been used in thequestion bank (Figure 8). Students could select a tagwithin the tag cloud, which meant that only questionsassociated with that tag would be presented to themfor answering.
So, while there was no formal incentive for the stu-dents to provide appropriate tags for their questions(or indeed, provide tags at all), tags provided infor-mation to other students when they chose which ques-tions to answer. Students may have chosen to answerquestions according to the most popular tags, accord-ing to the tags that they think they understand, or notused the tags at all in making their question choice:
Figure 8: A tag cloud
Frequency of student−assigned tags
declarationrelational operators
the math classcolor
identifiersrectangles
return valuespaintcomponentactionperformed
animationparameters
whileclassesindexof
concatenatevariable scope
substringsequality
guistatic methodsclass methods
compilingcode recognising
order of precedencelogical operators
method callsarithmetic operators
string methodserror checkingstring equation
evaluationdrawingdoubles
arraysif statements
booleanloops
integersstrings
printing output
0 50 100
Figure 9: Frequency of student tags (minimum fiveoccurrences)
the students’ choice of questions is beyond the scopeof this paper.
8.1 The granularity of the indexing
The students used 62 distinct tags to provide an indexto the MCQ questions. All tags were created by thestudents, and most tags were used more than once,with some being used as many as 101 (“strings”) and133 (“printing output”) times (Figure 9). A total of1226 tags were used over 559 questions, with a further43 questions being untagged. 40 of the 62 tags wereused five or more times.
Most of the tags provided by the students are con-crete and specific; e.g. “variables scope” (14 times),“keyboard events” (4 times), “string equation” (34times); see Table 10. There were also some tags thatwere used widely as ‘catch-all’ tags; e.g. “printing out-put” (139 times), “strings” (104 times), “integers” (86times). These frequently used tags were typically cou-pled with other tags: 20% of the time for “printingoutput”, 10% for “strings”, 9% for “integers.”
The tagging terms covered all course topics, andthe sizable repertoire allowed for a detailed index.
Proc. 12th Australasian Computing Education Conference (ACE 2010), Brisbane, Australia
143

8.2 Extent of indexing
Table 9 shows the number of tags given by studentsfor each question: we note that there is an overallpattern of higher ability students providing more tags.
All Q1 Q2 Q3 Q40 43 19 15 5 41 222 70 64 47 412 143 31 40 33 393 100 17 14 36 334 52 8 7 15 225 42 7 7 9 19
Total 602 152 147 145 158Tags 1226 250 249 326 401
Table 9: Number of tags given by students, by quar-tile
Only 43 out of 602 questions were untagged(7.1%), despite there being no incentive for the stu-dents to tag their questions other than assisting theirpeers in choosing questions to answer. The facility fortagging was available, but students were not explicitlyasked to provide tags.
As we saw with the density of topics in Table 4,an “inversion point” is apparent at the 2-tag level.Before this level, lower quartile students dominate,while after it is the two higher quartiles. Studentsappear to be aware of and respond to the need formore tags in questions that cover multiple topics.
8.3 Appropriateness of the indexing
In order to analyse this tag data, two of the authorsmapped each student tag to one of the 14 staff-topiccategories described previously. We looked at eachof the tags that the students associated with theirquestions, and mapped these tags onto the 14 topicslisted in Table 10. There are clearly multiple tags as-sociated with several of the topics, for example, thestudent tags “evaluation”, “order of preference” and“arithmetic operators” were all classified under “Ex-pressions.” The only one of the student defined tagsthat we felt that we could not assign to any of the 14topics was “code recognising.” We describe this set ofcategory assignments as the “student-topics”.
Each question now had at least one staff topic andat least one student topic, for the 602 questions in therepository.
Three ways of determining the appropriateness ofthe student tags were considered:
Corresponding Questions with one or more topicin common
Noisy Questions for which students included extra-neous irrelevant topics
Incomplete Questions for which students omittedrelevant topics
Table 11 shows the percentages of Corresponding,Noisy, and Incomplete tags for all questions, and byquartile.
All Q1 Q2 Q3 Q4Total 602 152 147 145 158
Corresponding (%) 73 63 64 80 83Noisy (%) 50 48 50 54 50
Incomplete (%) 58 57 60 59 57
Table 11: Overlaps between student and staff ques-tion classification
Outp
ut
Vari
able
s
Expr
Obje
cts
AP
I
Meth
ods
Rela
tional
Cond.
Arr
ays
Loops
Cla
sses
Java
GU
I
Mis
c.
Unass.
Staff
Student
Perc
enta
ge o
f questions
0
5
10
15
20
Figure 10: Student topics compared to staff topics
Figure 10 shows the frequency of the student tagsin comparison with the staff tags, thus showing wherethe main discrepancies lie.
While the percentage of Corresponding tags im-proves with student quartile, Noisy and Incompletetags are present in similar proportions across all quar-tiles. Accurate indexing is clearly a difficult task, andthese results suggest that students require some guid-ance and training if they are to produce a high qualityindex.
9 A good MCQ repository
In order to address the question of whether studentscan produce a good quality MCQ repository, we re-visit each of the criteria stated in Section 3 above.
9.1 Content
1. The repository covers a wide range of topics, in-cluding all those that members of staff use informal assessment questions.
This is the case overall, although Methods,Classes and Arrays are not as well represented asin staff-generated formal assessment. In particu-lar, there is a reluctance on the part of studentsin the lower two quartiles to contribute questionson Classes. Questions on Output were more pop-ular (even among the higher quartiles) than instaff assessments.
2. It includes complex questions, covering morethan one topic.
Only around half of the questions cover morethan one topic, with just under one third cov-ering two topics. Lower quartiles dominate thosequestions covering one topic, and the upper quar-tiles dominate those questions covering at leastthree topics. The number of topics is shown tobe related to the students’ judgements of the dif-ficulty of the question.
9.2 Quality
3. The questions are of good quality, with respectto five criteria:
CRPIT Volume 103 - Computing Education 2010
144

1 Std. output printing output, escape sequences2 Variables variable scope, variables, storing information, declaration3 Expressions evaluation, order of precedence, arithmetic operators, concatenate, incre-
ments, doubles, integers, string equation4 Objects reference, fields5 API static methods, random numbers, string methods, indexof, . . .6 Methods method calls, class methods, return values, parameters7 Relational/logical boolean, logical operators, relational operators, equality8 Conditionals if statements, selection statements9 Arrays arrays10 Loops loops, while11 Classes classes, instance variables12 Java GUI gui, drawing, paintcomponent, timer, components, layout, keyboard events,
fonts, color, textfields, actionperformed, . . .13 Miscellaneous compiling, error checking, identifiers, comments, conventions14 Unassessed
Table 10: Mapping student tags (verbatim) to topics
The question is clearly stated This is thecase for nearly all the questions, althoughit is apparent that those (typically simpler)questions contributed by the lower quartilestudents are more likely to be clear thanthe more complex ones contributed by thehigher-ability students.
The question is error free This is lower thanwe would like overall, and we note thatonly the highest quartile had few problemswith posing error free questions, despite thegreater complexity of their questions. Ittakes time and effort to check a questionfor errors, and it seems the lower perform-ing students were less conscientious than therest of the class.
The distracters are all feasible Forming ap-propriate distracters is a tricky task, evenfor instructors, and so the low overall resultis not unexpected. However, all but the low-est quartile performed well in their creationof distracters.
The accompanying explanation is goodThis was the most disappointing resultoverall, as few students made the effortto provide good explanations for theirquestions. This is the case even with thehighest quartile.
The specified answer is correct Here wehave an interesting result, with the middletwo quartiles performing worse than theextremes. We suggest that this is due tothe lower performing students writing ques-tions that are well within their ability, andfor which they know the correct answer,while the middle two quartiles appear tobe over-extending themselves.
4. No topics lack good quality questions.
This is indeed the case overall, and the questionquality within topics does not vary notably withquartile. The mean overall quality measure, 2.7out of 5, is a little lower than we might have liked.However, students largely managed to avoid poorquality questions: the mean response count forquestions with a quality rating above 3 was 24.4,compared to 7.7 for questions rated less than 1.
9.3 Difficulty
5. The questions are available in a range of levels ofdifficulty.
There are questions on a wide range of difficulty,but the repository is more skewed towards the
easy end of the scale than we might like. Wewant to encourage all students to answer as manyquestions as possible, and not to be discouragedby difficult questions. However, we would alsolike our repository to contain a reasonable pro-portion of challenging questions.
6. There is a range of difficulty within each topic.
This is the case, although for most topics it isclear that only the highest quartile students arecontributing the difficult questions.
9.4 Indexing
7. The index is of appropriate granularity.
The tags are plentiful and mostly phrased ac-cording to concrete and specific phrases. Theycovered all topics in the course, and resulted ina rich index.
8. All questions have at least one indexing term.
Overall, few questions had no tags at all. Likethe number of topics covered by each question,the density of the tags depends on quartile, withlower quartiles dominating those questions withless than two tags, and the upper quartiles dom-inating those questions with at least three tags.
9. The assigned indices match the topic of the ques-tions.
The ability to choose tags that correspond withthe topic of the question improves with studentperformance, although all quartiles included ad-ditional irrelevant tags and missed relevant tags.
10 Conclusion
Most of our criteria for a good MCQ repository havebeen satisfied, if not wholly, to an acceptable extent.Notable exceptions include: the requirement for thestudents to provide good explanations for the ques-tions; a higher proportion of single-topic or easy ques-tions than we might like; and a large number of re-dundant or missing indices. Given that this databaseof questions was developed entirely by first-year stu-dents with no guidance at all from instructors, weconsider this an impressive result. It is clear that thequality of the repository may be improved by pro-viding some guidance to students (particularly in thelower two quartiles) on how to devise distracters, thebest kind of explanations, choosing appropriate tags,and how to include more than one topic within a sin-gle question.
However, such guidance would make the creationof the repository instructor-led, and may limit the
Proc. 12th Australasian Computing Education Conference (ACE 2010), Brisbane, Australia
145

freedom students feel they have to experiment withtheir own ideas. The contributing student approachfollowed by PeerWise encourages students to haveownership and control of their contributions, and tojudge and engage in discussion on others’ contribu-tions. Focused guidance on the expected nature oftheir contributions could remove that control, andmay constrain peer-judgements to instructor-definedcriteria. We believe that the cost of having a slightly-less-than-perfect repository is a small price to pay forthe deep learning opportunities its creation offers stu-dents.
References
Anderson, L. W., ed. (2001), A taxonomy for learningand teaching and assessing: A revision of Bloom’staxonomy of educational objectives, AddisonWesleyLongman.
Brusilovsky, P. & Sosnovsky, S. (2005), ‘Individ-ualized exercises for self-assessment of program-ming knowledge: An evaluation of QuizPACK’,Journal on Educational Resources in Computing5(3), 6. http://doi.acm.org/10.1145/1163405.1163411.
Denny, P., Hamer, J., Luxton-Reilly, A. & Pur-chase, H. (2008), PeerWise: Students sharing theirmultiple choice questions, in ‘Fourth InternationalComputing Education Research Workshop (ICER2008)’, Sydney, Australia, pp. 51–58.
Denny, P., Luxton-Reilly, A., Hamer, J. & Purchase,H. (2009), Coverage of course topics in a studentgenerated MCQ repository, in ‘14th Annual ACMSIGCSE Conference on Innovation and Technologyin Computer Science Education’, ACM, New York,NY, Paris, France, pp. 11–15. http://doi.acm.org/10.1145/1562877.1562888.
Denny, P., Luxton-Reilly, A. & Simon, B. (2009),Quality of student contributed questions usingPeerWise, in M. Hamilton & T. Clear, eds, ‘11thAustralasian Computing Education Conference’,Vol. 95 of CRPIT, Wellington, New Zealand,pp. 45–53.
Draper, S. W. (2009), ‘Catalytic assessment: un-derstanding how MCQs and EVS can foster deeplearning’, British Journal of Educational Technol-ogy 40(2), 285–293.
Epstein, M. L., Lazarus, A. D., Calvano, T. B.,Matthews, K. A., Hendel, R. A., Epstein, B. B. &Brosvic, G. M. (2002), ‘Immediate feedback assess-ment technique promotes learning and corrects in-accurate first responses’, The Psychological Record52(2), 187–201.
Hamer, J., Cutts, Q., Jackova, J., Luxton-Reilly, A.,McCartney, R., Purchase, H., Riedesel, C., Saeli,M., Sanders, K. & Sheard, J. (2008), ‘Contributingstudent pedagogy’, SIGCSE Bulletin 40(4), 194–212.
Kuechler, W. L. & Simkin, M. G. (2003), ‘How well domultiple choice tests evaluate student understand-ing in computer programming classes?’, Journal ofInformation Systems Education 14(4), 389.
Kumar, A. N. (2005), ‘Generation of problems, an-swers, grade, and feedback—case study of a fullyautomated tutor’, Journal on Educational Re-sources in Computing 5(3), 3. http://doi.acm.org/10.1145/1163405.1163408.
Lister, R., Simon, B., Thompson, E., Whalley,J. L. & Prasad, C. (2006), Not seeing the for-est for the trees: novice programmers and theSOLO taxonomy, in ‘11th Annual SIGCSE Con-ference on Innovation and Technology in Com-puter Science Education’, ACM, New York, NY,Bologna, Italy, pp. 118–122. http://doi.acm.org/10.1145/1140124.1140157.
Or-Bach, R. (2005), ‘Educational benefits ofmetadata creation by students’, SIGCSE Bull.37(4), 93–97.
Paxton, M. (2000), ‘A linguistic perspective on multi-ple choice questioning’, Assessment and Evaluationin Higher Education 25(2), 109.
Roberts, T. S. (2006), The use of multiple choice testsfor formative and summative assessment, in D. Tol-hurst & S. Mann, eds, ‘8th Austalian Conferenceon Computing Education’, Vol. 165 of ACM Inter-national Conference Proceeding Series, AustralianComputer Society, Hobart, Australia, pp. 175–180.
Traynor, D. & Gibson, J. P. (2005), Synthesis andanalysis of automatic assessment methods in CS1:generating intelligent MCQs, in ‘36th SIGCSETechnical Symposium on Computer Science Edu-cation’, ACM, St. Louis, Missouri, USA, pp. 495–499. http://doi.acm.org/10.1145/1047344.1047502.
Wesolowsky, G. O. (2000), ‘Detecting excessive simi-larity in answers on multiple choice exams’, Journalof Applied Statistics 27(7), 909.
Woodford, K. & Bancroft, P. (2004), Usingmultiple choice questions effectively in infor-mation technology education, in R. Atkinson,C. McBeath, D. Jonas-Dwyer & R. Phillips,eds, ‘Beyond the comfort zone: Proceed-ings of the 21st ASCILITE Conference’, Perth,pp. 948–955. http://www.ascilite.org.au/conferences/perth04/procs/woodford.html.
Yew, J., Gibson, F. P. & Teasley, S. D. (2006), ‘Learn-ing by tagging: The role of social tagging in groupknowledge formation’, MERLOT Journal of OnlineLearning and Teaching 2(4).
CRPIT Volume 103 - Computing Education 2010
146

Using a primary-school challenge in a third-year IT course
Simon School of Design, Communication, and Information Technology
University of Newcastle, Australia
Abstract
Programmable Lego Mindstorms robots are used as a challenge activity in competitions for schools, and in various capacities in university-level computing courses. We describe an assignment that we use in a third-year IT course, part of which is identical to one of the school-level challenge tasks. We explore the benefits of this assignment in our university course, and explain why it is legitimate to ‘challenge’ our final-year students with an exercise undertaken by children in primary school..
Keywords: Lego Mindstorms, robotics, programming.
1 Introduction
Robotics has long been a fascinating topic area in computer science, artificial intelligence, and other related areas. Until the last decade or so, however, most university courses in robotics have been purely theoretical, as the price of actual working robots has been well beyond the reach of most departments. A typical robotics textbook of the early 1990s suggests that industrial robots cost tens or hundreds of thousands of dollars, while personal robots cost only thousands or tens of thousands, are more experimental than functional, and are more use in education than as personal household servants (McKerrow 1991).
When cheaper robots did arrive on the scene their uptake was still fairly slow, because they were perceived as toys rather than real robots. Lego’s Mindstorms robots are a case in point. Costing only a few hundred dollars, they are on first impression simply a Lego construction kit.
What sets them aside, what makes them robots, is the RCX™ ‘brick’ (Figure 1), a large Lego block incorporating an eight-bit programmable processor with 32Kb of memory. Three ports accept input from a variety of simple sensors; another three direct output to motors or lamps; a simple screen displays a handful of characters at a time; and four buttons provide a certain degree of direct control. These features together make the RCX a programmable autonomous device capable of sensing its environment and effecting action – a robot.
.Copyright © 2010, Australian Computer Society, Inc. This paper appeared at the Twelfth Australasian Computing Education Conference (ACE2010), Brisbane, Australia, January 2010. Conferences in Research and Practice in Information Technology, Vol. 103. Tony Clear and John Hamer, Eds. Reproduction for academic, not-for-profit purposes permitted provided this text is included.
Programs for the RCX are written and compiled on a standard computer, then downloaded to the RCX by way of an infra-red link. A single button press on the RCX then tells it to begin execution, and it executes the program until either the program ends or another button press tells it to stop. It is important to recognise that while executing the program, the robot is not under any form of remote control – it is simply carrying out its programmed instructions.
The RCX is not the only device of this kind. Engineering departments have been making their own for many years, and there are several other commercially available kits. This one is undoubtedly popular, though, perhaps in part because of the marketing power that lies behind it. More than a million units have been sold (Devine 2008).
One attraction of the Lego Mindstorms kit is the vast variety of robots that can be constructed from it. A typical kit contains close to a thousand pieces, including a dozen different kinds of wheel, caterpillar tracks, an impressive variety of gears, and hundreds of associated rods, axles, swivels, and other challenges to the imagination.
2 Lego robotics at school level
Early marketing of Mindstorms was to schools, for educational purposes. RoboLab, the programming language sold with the kits, is a purely graphical
Figure 1: The RCX brick (Devine 2008). The input ports (1, 2, 3) and output ports (A, B, C) have electric- al connections in the otherwise normal Lego ‘bumps’.
Proc. 12th Australasian Computing Education Conference (ACE 2010), Brisbane, Australia
147

language. Icons representing programming concepts are dragged and dropped onto a form and linked with a ‘wiring tool’ to determine the flow of control. The language incorporates variables, subroutines, branching, looping, and most of the features expected in a procedural programming language, although of course there are limitations and bugs. Figure 2 shows a small segment of a RoboLab program.
Mindstorms robotics appears to have been used generally as a challenge activity for brighter students rather than a core part of the school syllabus, and various competitions have sprung up to support this use. RoboCupJunior in the USA was joined by RoboCup Junior Australia and RoboCup Junior New Zealand. In these competitions, teams of school students compete in robotic dance, rescue, or soccer tasks. The first and third of these are reasonably self-explanatory. In the rescue competitions, robots are expected to follow a line of some sort in terrain of varying difficulty with the goal of finding and rescuing one or more ‘victims’.
For some years the RoboCup Junior Australia rescue competition used the field illustrated in Figure 3. Robots started at the end of the black line near the top left of the image, followed the line to its other end (taking the light-coloured shortcut if desired), then entered the ‘swamp’ and rescued the victim by pushing her out of it. Any similarity between the swamp and Australia is to be taken as purely coincidental, and the competition is definitely not a simulation of Australia’s policy to refugees under the recent conservative government – notwithstanding that both that government and the rescue field were replaced at about the same time.
3 Lego robotics at university level
The use of Lego robotics at university level appears to have been sparked in part by the introduction of text-based alternatives to the graphical programming language. Supplements to existing mainstream programming languages include LeJos for Java (SourceForge 2009), Not-Quite-C (NQC 2007), and Visual Studio for Mindstorms (Mindstorms 2007). We speculate that programming in a graphical language was
considered too trivial a task for university students, although in fact this is far from being the case.
Barnes (2002) reported on the use of Mindstorms robots as an approach to teaching Java. Later in the same year an ITiCSE working group (Lawhead et al 2002) set out a road map for teaching introductory programming using Mindstorms robots, discussing the concepts that could be taught in this way and proposing some simple assignments. A poster at the same ITiCSE conference (Garcia 2002) describes the use of Mindstorms robots in a software analysis and design course. All of the teaching reported in these papers used Java and LeJos.
With the flurry of interest in using these cheap and simple robots as teaching tools, it was appropriate to ask whether they offered any advantage to students who used them. Fagin and Merkle (2002) conducted an experiment with
Figure 2: a segment of program code in Robolab (the text box contains explanatory comment)
Figure 3: rescue map as formerly used in the RoboCup Junior Australia competition (RCJA 2004)
CRPIT Volume 103 - Computing Education 2010
148

more than 800 students and reported that the students who had used robots actually performed worse in subsequent tests than those who hadn’t. They suggest that one reason for this is that their students had access to the robots only during timetabled classes, depriving them of the facility to continue working on their programs in their own time.
More recent publications explore the use of Mindstorms for teaching courses other than introductory programming. McNally (2006) uses them in a data structures course, again with LeJos, to traverse a grid and determine which squares of the grid are occupied by objects. Jipping et al (2007) use the robots to teach Java bytecode in a computer organisation course.
A number of interesting assignments emerge from the literature, but few educators seem to have decided to make use of the well thought out challenge tasks of the various RoboCup Junior contests. Sklar et al (2004) are an exception: they clearly document their choice to use the RoboCup Junior tasks as assignments in their courses on robotics, artificial intelligence, and autonomous multi-agent systems.
4 A course in IT Applications
The course in which we use Mindstorms robots is a final-year undergraduate course called Information Technology Applications, which has been offered at four campuses of the University of Newcastle. Over a single semester the course dips into three quite different applications of IT – currently cryptography, robotics, and computational modelling – taking a brief look at the theory and algorithms of each. While it would never have been possible to justify the purchase of more expensive robots for a few weeks in a single course, the Lego Mindstorms kits fall well within the typical budget of a computing department.
The main point of the IT Appliations course is to expose students to just a few applications that they do not encounter in any other courses, in the hope of helping them to realise that there are countless other applications in the real world, and that they should not leave university believing that they know all there is to know about computing.
A specific benefit of the robotics application is that it is perhaps the only course in which students see the interface between their programs and the physical world. They discover, much to their dismay, that the same program cannot be relied upon to produce the same output each time in response to the same input. They discover that the amount of charge in the robot’s batteries can have a dramatic effect on its performance. They discover that a minute difference in the robot’s initial location can lead it to take an entirely different route. They discover that light sensors will give different readings for the same light source when the ambient light conditions are different. They learn the hard way that a debugged and working computer program is not as predictable as they had always assumed.
Robotics also provides a simple introduction to real-time programming. It is not enough that the program respond in a particular way to particular circumstances; it must do so within an appropriate time-frame, or the circumstances will change and the response will no longer be appropriate.
Yet another important lesson is the interaction between hardware and software. There is no such thing as a successful program or a successful robot; rather, there is a successful combination of robot and program. A change, even an apparently minor one, to the robot’s structure can result in a completely different execution of the same program.
Finally, of course, there is the fun. While working with robots can be deeply frustrating, it can also be thoroughly enjoyable, and most of our students do see both sides of it.
5 The robotics assignment
The robotics assignment in IT Applications is in two parts, a maze task and a rescue task. The tasks require different programs and different robot structures, so they are assessed in two consecutive weeks.
The marking scheme for the assignment required serious consideration. Programming assignments are generally criterion-referenced: fully satisfying the criteria earns full marks. It was felt, though, that students would perform better under the pressure of competition, so aspects of the competition were incorporated into the marking. In broad terms, teams are awarded a mark for successfully completing the task, a mark for programming style and documentation, and a mark based on their rank in the competition. The first time the assignment was run, each of these items earned a third of the available marks. In subsequent offerings the mark for successful completion was raised to 50%, the mark for style and documentation was lowered to 30%, and the competition mark was lowered to 20%. This change meant that any team successfully completing the task would earn at least half marks.
The kits are issued to groups on loan for the duration of the assignment, getting round the problem of restricted access reported by Fagin and Merkle (2002). Students sign an undertaking to return the kit in good condition, and so far there have been no problems with this arrangement. Students who know young children are encouraged to involve them in the design and construction of the robots.
Groups are permitted to program the robots in whichever language they wish. Those more familiar with Java tend to prefer LeJos, but many others choose PBrick, a language that comes with Visual Studio for Mindstorms. We thought long and hard before deciding to permit them to use RoboLab, as intuition suggests that this is an easier option. In practice, though, it isn’t. Students familiar with text-based programming would spend a long time learning the graphical language and its environment, and more time discovering and working around the limitations and bugs in the language. Besides, this choice
Proc. 12th Australasian Computing Education Conference (ACE 2010), Brisbane, Australia
149

would make it difficult for them to work at home, as RoboLab is a licensed product for which our site licence does not extend to students’ computers.
5.1 The rescue component
The rescue task of the assignment is modelled closely on the RoboCup Junior Australia rescue task, using the field illustrated in Figure 3. The following aspects are taken directly from that task: • robots must fit within a vertical cylinder 18cm in
diameter; • competitors have five attempts at the rescue; • for each attempt the referee places the victim in a
different part of the swamp; • each attempt is limited to 90 seconds; • if the robot leaves the road during an attempt, it
must be restarted at the beginning of the road while the timer continues;
• the score for a successful rescue is the number of seconds taken for that rescue;
• the score for a failed attempt is 100; • the score for the whole activity is the sum of the
team’s best four scores from the five attempts; • teams are ranked according to the scores, the lowest
score winning.
While all of the points above determine a team’s rank, and thus the competitive 20% of the score, there is also a gradation in the 50% score for success. There are four measures of partial success, the first three being to reach specified points along the road and the fourth being to reach the swamp. A team’s success is based not on an aggregate of its five attempts but on the best of the five. Thus a team that rescues the victim just once in five attempts still scores full marks for success, and a team that never even reaches the swamp can still earn up to 60% of the success mark.
Following the road is in principle quite a simple task. Each Mindstorms kit comes with two light sensors, which shine an infra-red light and measure the intensity of its reflection. The three colours on the field (black, green, and yellow) reflect different amounts of light, and thus return clearly distinct sensor readings. So, for example, a robot can be programmed to straddle the road by instructing it to turn left when the left sensor reads black, to turn right when the right sensor reads black, and to go straight ahead when neither sensor reads black.
But even this simple task has challenges. The road has some very tight turns, especially towards the swamp end, and it is easy for a robot to be misled into leaving the road on such a turn. The problem is exacerbated if the robot is long, limiting the tightness of its turns, or if the wheels are too far from the sensors, limiting its responsiveness. The quest for more speed, while potentially offering a better score, also increases the chance of overshooting a tight bend.
On reaching the swamp the robot will generally move to a different phase of its program, one in which it systematically or randomly criss-crosses the swamp in the hope of eventually ‘finding’ the victim and pushing her to safety. This phase has its own problems, such as trying to ensure a good coverage of the swamp in a reasonably short time.
In the five years that we have used this assignment we have seldom seen a robot succeed on all five rescue attempts, and we have often seen teams fail on all five. What seems a relatively simple task is in fact a worthy challenge to groups of three or four students.
5.2 The maze component
While the rescue task is based on a well-known competition for school students, the maze task is one that we have never seen elsewhere. Other people (Sklar et al 2004, Jipping et al 2007) have used mazes in their assignments, but these are mazes in which the robot has a line to follow, in a similar manner to the rescue task.
Our maze is built of white timber walls 10cm high, with no passage less than 20cm wide. Robots are placed at a referee-specified location inside the maze and must find their way to and out of the single exit (Figure 4). The maze is reconfigurable, so the students do not know its structure until the competition begins. Their programs must be general maze solvers, not specific to a known maze.
The standard way of solving a maze is wall-following: place a hand, for argument’s sake the left hand, on a wall, proceed in whatever direction one must to keep that hand on the wall, and come eventually to the exit. The choice of wall can have a dramatic effect on the distance to be travelled – consider the distance to be travelled by the robot in the lower left corner of Figure 4 depending on which wall it follows – but should have no effect on the eventual outcome.
However, wall-following is guaranteed to succeed only if there are no islands in the maze. Consider the maze in Figure 5, and the time that a robot could spend following a wall if that wall were on one of the islands.
Figure 4: a simple timber maze
CRPIT Volume 103 - Computing Education 2010
150

In our assignment students are given two mazes, one without islands and one with islands, and are to solve both mazes with the same program. Wall-following clearly makes sense for the first maze, and some sense for the second, but the program must have some way of deviating from this pattern. Some groups consider trying to deduce when the robot is touring an island; for example, they might note if there have been four consecutive turns in the same direction. However, islands are not necessarily rectangular, which makes this an unreliable measure. Worse, the robot’s wall-following movement invariably involves small alternating left and right turns, so the program would have to distinguish between these turns and the bigger turn resulting from a junction between walls. In the end most groups program something more arbitrary, such as a 1% chance of deliberately turning away from the wall at any time.
Wall-following can be implemented with light sensors, touch sensors, or both. Because the walls are a uniform colour, the amount of reflected light received by a light
sensor can be used to measure its distance from a wall, and the robot can be programmed to maintain a more or less fixed distance from the wall as it proceeds. A second sensor, pointing forward, can detect a wall blocking the path. Alternatively, a blocking wall can be detected by a touch sensor as the robot actually strikes the wall.
Robots are given ten minutes to solve each maze. Within that time they can be restarted as often as the team wishes. As with the rescue competition, there are partial success marks for reaching various points of the maze, and a competition mark based on the lowest time from (re)starting to exiting the maze. Some robots will exit the maze several times in the ten minutes, while others will not once find the exit.
However the wall is followed, careful decisions must be made as regards the robot’s means of progress. The robot in Figure 4 is in fact stuck in a corner. It repeatedly senses the wall on its left and turns to the right, then senses the wall in front of it and turns back to the left. Some robots wedge themselves so tightly into corners that they cease to move at all. On one memorable occasion a robot, having finally reached the exit after some eight minutes, became stuck halfway out. A restart is generally the best response to becoming stuck, but there are robots that simply return to exactly the same spot and become stuck in exactly the same way.
6 Assignment outcomes
As indicated in section 5, there are many problems associated with the rescue and maze tasks, not least of which are those related to the physical nature of the robots, and there are robots that simply fail to complete one task or the other. Even so, there are few teams that score less than 50% for the assignment. On each task, a reasonably written and documented program and a partial success tend to ensure this sort of mark even for the team that comes last in the competition; and it is seldom the case that the same team comes last in both rescue and
Figure 5: a maze with islands to confound wall-following
Figure 6: a selection of robots ready to compete in rescue
Proc. 12th Australasian Computing Education Conference (ACE 2010), Brisbane, Australia
151

maze.
At the other end of the scale, many teams score high marks on this assignment, notwithstanding the fact that they cannot all come first in either or both competitions.
Despite its many frustrations, the students generally enjoy the experience of designing, building, and programming the robots, of which a selection are shown in Figure 6. Some even consider buying their own kits once the course is over, though it’s not clear what use they would put them to. Others, not surprisingly, are pleased to see the back of the robots, and resolve not to play with Lego for many years to come.
Almost without exception, though, the students agree that programming takes on a new dimension when it involves control of a physical device; this important lesson would itself be reason enough to use robots in an assignment.
7 Discussion
At first glance it seems unlikely that a task used in primary schools can be legitimately used as an assignment in a final-year computing course. Of course there are many differences between the two uses. For example:
• RoboCup Junior tends to involve the brightest few school students; our assignment is for all of our students;
• RoboCup Junior teams tend to work all semester or even all year on the task; our students have just a few weeks to complete it;
• RoboCup Junior teams tends to work on just one task of the three in the competition; our students have to work simultaneously on two;
• RoboCup Junior teams tend to be given a great deal of help and guidance by their teachers and mentors as they work on the task; our students are expected to be far more self-reliant;
• RoboCup Junior teams tend to be new to programming; our students are highly familiar with programming, but not with programming to control
physical devices in the physical world; • RoboCup Junior teams have the principal goal of
winning the competition; our students are aiming to score good marks in an assignment, which is not necessarily the same thing.
In summary, we share the opinion of Sklar et al (2004) that some of the tasks developed for school-level competitions make excellent university-level assignments, and we heartily recommend this approach to other educators.
8 Postscript: the NXT
The NXT (Mindstorms 2009) is the next generation Lego robotics product. Will it take over from the RCX for our assignments? Certainly not in the near future, and possibly not until the RCX kits cease to function.
At least in the Education kit, the NXT has far fewer wheels, gears, and general construction pieces than the RCX. Along with a less Lego-like structure, this seriously limits the basic shapes and structures of NXT robots, constraining them to be all of the same mould.
Our first experience programming the NXT, in the new graphical language that is sold with it, suggests that its movement is far less precise than that of the RCX. This might be an artefact of our own programming or of the language, but we had difficulty programming the NXT for either the old-style rescue task (as mentioned in section 2, RoboCup Junior Australia now uses a different rescue task) or our own maze task. Even the NXT’s size works against it for these tasks – it simply takes up more space.
Text-based programming languages are now becoming available for the NXT, and it is possible that these will offer some relief from the imprecision, but we remain concerned that it might be a feature of the physical architecture.
Finally, of course, there is the timeless argument against obsolescence. So long as the RCX kits provide a worthwhile experience for our students, it would be environmentally irresponsible to discard them in favour of a new product, even if that new product were somewhat better.
9 References
Barnes DJ, 2002. Teaching introductory Java through Lego Mindstorms models. ACM SIGCSE Bulletin 34(1), 147-151.
Devine T, 2008. Lego Mindstorms NXT Problem Solving with Robots [PRSOCO601]. Accessed at http://www.noucamp.org/cp1/psol/NXT.html, August 2009.
Fagin BF & Merkle L, 2002. Quantitative analysis of the effects of robots on introductory Computer Science education. ACM Journal of Educational Resources in Computing 2(4) 1-18.
Figure 7: a Lego Mindstorms NXT robot (Nuggets 2009)
CRPIT Volume 103 - Computing Education 2010
152

Garcia MA & Mc-Neill HP, 2002. Learning how to develop software using the toy Lego Mindstorms. ITiCSE 2002. p239.
Jipping MJ, Calka C, O’Neill B, & Padilla CR, (2007). Teaching students Java bytecode using Lego Mindstorms robots. SIGCSE 2007, 170-174.
Lawhead PB, Bland CG, Barnes DJ, Duncan ME, Goldweber M, Hollingsworth RG, & Schep M, 2003. A road map for teaching introductory programming using Lego© Mindstorms robots. ACM SIGCSE Bulletin 35(2), 191-201.
McKerrow PJ, 1991. Introduction to Robotics, Addison Wesley.
Mindstorms, 2007. Visual Studio for Mindstorms. Accessed at http://mindstorms.lego.com/eng/ community/resources/default.asp, March 2008.
Mindstorms, 2009. Lego NXT. Accessed at http:// mindstorms.lego.com/eng/Egypt_dest/Default.aspx, August 2009.
NQC, 2007. Not Quite C. Accessed at http://bricxcc.sourceforge.net/nqc/, August 2009.
Nuggets, 2009. Lego NXT. Accessed at http:// primarynuggets.wordpress.com/lego-next/, August 2009.
RCJA, 2004. RoboCup Junior Australia Rescue Rules 2004. Accessed at www.robocupjunior.org.au, July 2004.
Sklar E, Parsons S, & Stone P (2004). Using RoboCup in university-level computer science education ACM Journal on Educational Resources in Computing 4(2), 1-21.
SourceForge, 2009. LeJos: Java for LEGO Mindstorms. Accessed at http://lejos.sourceforge.net/, August 2009.
Proc. 12th Australasian Computing Education Conference (ACE 2010), Brisbane, Australia
153

CRPIT Volume 103 - Computing Education 2010
154

Improving the Learning of Graduate Attributes in the Curriculum: a Case-Study in IT Management
Alan Sixsmith Andrew Litchfield
School of Systems, Management and Leadership Faculty of Engineering and IT
University of Technology, Sydney PO Box 123, Broadway NSW 2007
[email protected]@uts.edu.au
Abstract Government, employers and professional societies want university graduates who are more ready for work. The UTS Work-Ready Project is a curriculum renewal initiative that aims to improve graduates’ professional attributes and employability skills. The Project provides online teaching and learning resources to support the integration of Work-Ready Learning Activities (WRLA) into the existing curriculum. The paper provides an overview of the UTS Work-Ready Project and the incorporation of WRLA’s into three Information Technology (IT) Management subjects which all included a group assessment item. In each subject, students were surveyed to gain feedback regarding how useful they found a team collaborative decision-making WRLA and whether it helped in their group assessment task. When averaged across the three subjects and the five surveys undertaken 85% of students thought the activity was useful, however there were mixed results in relation to whether the WRLA helped in the group assessment task. Under-graduate students reported the WRLA made no difference to the group assessment task, whereas post-graduates indicated the WRLA did help the team produce their group assessment item. Keywords: Professional Graduate Attributes, Work-Ready, Teamwork, Curriculum Renewal
______________________
Copyright © 2010, Australian Computer Society, Inc. This paper appeared at the Twelfth Australasian Computing Education Conference (ACE2010), Brisbane, Australia, January 2010. Conferences in Research and Practice in Information Technology, Vol. 103. Tony Clear and John Hamer, Eds. Reproduction for academic, not-for-profit purposes permitted provided this text is included.
1. Introduction Teams and teamwork are essential characteristics of any organization. Employees collaborate, cooperate and work effectively together in today’s workplace to allow organizations to meet the demands of the marketplace (Hertel, Geisterb & Kontradtb 2005, Majchrzak, Malthora & John 2005). This is not a new phenomenon, a survey of U.S. firms in 1995 found that over 84% of complex and innovative products and projects relied on cross-functional teams (Griffin, 1997). Most IT management texts have a chapter dedicated to working in teams (for example see Hughes & Cotterell 2006, Marchewka 2009, Smith & Imbrie, 2007) such is the importance of teamwork in the workplace. The focus of the paper is the implementation of a teamwork-oriented collaborative decision-making Work-Ready Learning Activity (WRLA) into the curriculum of three Management subjects within the IT under-graduate and post-graduate programs at UTS. Being able to work effectively as a team member is crucial to the successful operation of organizations and hence a core skill for any graduate entering the workplace. To enable graduates to be more ready for professional employment, the learning of graduate attributes needs to be closely aligned to relevant employability skills. Teamwork is a major attribute identified in the key employability skills in the Australian Government Department of Education, Science and Training employability skills framework (DEST, 2004). The paper has the following components. An overview of the need for better work-ready graduate attributes in the curriculum is presented followed by a discussion of the Work-Ready Project. The teamwork literature is then discussed followed by details of the implementation of the collaborative decision-making WRLA into the three UTS IT subjects. The next section evaluates the student feedback on the WRLA. Lastly conclusions are drawn and future research is discussed.
Proc. 12th Australasian Computing Education Conference (ACE 2010), Brisbane, Australia
155

2. Work-Ready Graduate Attributes and the Curriculum
Over the last two decades a variety of reports by government departments, professional societies, accrediting bodies and employers have expressed the belief that universities should produce graduates that are more ready for professional employment (Mayer, 1992; ACNielsen Research Services, 2000; ACCI and BCA, 2002; DEST, 2004; Precision Consulting, 2007). The academic literature during the same period has discussed and debated the importance of developing professional graduate attributes (Clanchy and Ballard, 1995; Finn, 1999; Holmes, 2002; Barrie, 2005; Barrie, 2006; von Konsky, 2008; von Konsky, Hay & Hart, 2008). Barrie and Prosser observe that graduate attributes “have their roots in the contested territory of questions as to the nature of knowledge and the nature of a university”(2004, p.244). Traditionally universities have focused their curriculum at the disciplinary body-of-knowledge and profession-based understandings. However, today this focus is no longer sufficient to meet the employment needs of the various stakeholders as they increasingly require university graduates to have contemporary workplace professional attributes, understandings and skills (Litchfield, Nettleton & Taylor, 2008). Continuing pressure for graduates to possess work-ready skills is influencing universities to better map the systematic development of professional work-ready learning objectives and outcomes in curriculum design and renewal activities. However an important caveat is that improving the teaching and learning of professional graduate attributes and employability skills in the existing curriculum cannot replace the real-world experiences of a lengthy work-placement or on-the-job training. Nevertheless through curriculum renewal universities can more methodically address student learning of graduate attributes together with the traditional body-of-knowledge of the discipline and profession. These pedagogic outcomes are not incompatible and can be combined to support each other.
3. The UTS Work-Ready Project The UTS Work-Ready Project is a collaborative curriculum renewal initiative involving five Faculties that aims to improve professional graduate attributes through the design and integration of work-ready learning activities into the existing curriculum (Litchfield et al, 2008). The UTS strategic plan has an objective of increasing graduate preparedness to pursue successful careers in a changing professional workplace and the Work-Ready Project is directly aligned to this objective.
3.1 Identifying key professional graduate attributes for IT Students
During the period September to November 2007 representatives of the Australian Computer Society (ACS), which accredits the IT courses run by the UTS Faculty of Engineering and IT, were interviewed to gather specific data relating to the work readiness of graduating IT students. The key question asked was ‘what are the attributes of a professional work-ready graduate?’ In the interviews, questions were asked in regards to - what is meant by ‘professional’ and the understandings, knowledge and skills employers seek in a university graduate. Suggestions on how to improve graduates work-readiness were also requested. The ACS representatives observed that large employers believe that the basis for recruitment decisions are made on generic professional attributes rather than technical skills. They also believe that whilst employers have the ability to train new graduates in the required technical skills it was simply ‘too hard’ to develop the generic skills of communication, teamwork, initiative, ability to develop rapport with clients, analytical skills, making sound judgments and applying their technical knowledge (Litchfield et al, 2008). The identification of the key IT professional work-ready graduate attributes has been informed by; 1) the interviews with the ACS representatives and 2) the key employability skills highlighted in the Australian Government Department of Education, Science and Training (2004) framework, namely communication, teamwork, planning and organizing, technology, problem solving, self-management, life-long learning, and initiative and enterprise. The ACS highlighted the DEST employability skills as well as professionalism and ethics, global perspectives and the ability to apply knowledge. Discussions with colleagues identified information literacy and research as key attributes, and the application of knowledge was incorporated into a number of other key work-ready attributes. Eleven key work-ready graduate attributes have been identified as follows:
1. Communication 2. Ethics and Professionalism 3. Global and Local Perspectives 4. Information Literacy and Management 5. Initiative, Enterprise and Creativity 6. Planning and Organizing 7. Problem Solving and Critical Thinking 8. Research 9. Self-Management and Life-Long Learning 10. Teamwork and Leadership 11. Technology Literacy
CRPIT Volume 103 - Computing Education 2010
156

3.2 Online matrices of work-ready learning activities for each profession
For each key professional graduate attribute relevant sub-attributes, understandings and skills that can be learnt have been identified to form a conceptual matrix which is the backbone of the UTS Work-Ready Project’s wiki website. These professional understandings and skills are then aligned with short Work-Ready Learning Activities (WRLA) designed by colleagues, educational designers and the project’s UTS partners; the ELSSA academic literacy centre, the Careers Service, and the Library. Academics can browse the matrices for relevant learning activities, which are 50 minutes in duration and therefore suitable for tutorials and laboratories. The first and most up-to-date matrix supports an online collection of generic work-ready learning activities. Then for each professional field of study involved in the project there is a separate matrix of these learning activities (currently 16 exist) which have been contextualised to suit each profession and to improve academic and student relevance and motivation to learn. Thus the work-ready understandings and skills are learnt within their professional context and hence this approach supports the integration and embedding of the learning of graduate attributes into the curriculum Figure 1 depicts the project’s online matrices and their relationship to one another. The figure depicts the project’s support for the learning and teaching of graduate attributes via two key components;
1. Contextualising learning activities for each profession and discipline, and
2. Integrating and embedding work-ready learning into the existing curriculum.
For IT students an example of how the generic attributes for Teamwork and Leadership are aligned and contextualised to the graduate attribute of Teamwork is shown in figure 1. Involvement by academics in the process of developing and sharing learning activities and experiences is actively encouraged. Academic ownership of developing graduate attributes has been well documented (Scoufis, 2000; Sharp and Sparrow, 2002) in the success of such projects. In each profession’s matrix the work-ready learning activities are colour-coded to indicate availability. An academic searching for a suitable activity in their profession’s matrix can see which activities are available or already taken or not yet designed. WRLA’s may have introductory, intermediate and advanced versions which are suitable for use in both undergraduate and postgraduate programs. Each work-ready learning activity is designed for easy, effective and practical integration into the existing curriculum and teaching program. Academics can view, choose and download work-ready learning activity outlines that describe each activity using a standard one-page template. Most activities are designed to take 50 minutes
to facilitate and come with down-loadable teaching and learning support resources such as lecture and tutorial slides, tutorial and classroom activities, case-studies, and relevant handouts and readings. These teaching supports enable the academic to incorporate the work-ready learning activity into their subject effectively and with relative ease.
4. Teams and Teamwork The ACS considered teamwork skills critical to functioning in organizations as most positions and projects inevitably involve working with others. Graduates need to know how to: work in teams, communicate with others, solve problems collaboratively and reach a consensus. Adaptability and flexibility to work with different departments and levels of seniority and with multicultural members are important features of successful teamwork. The contemporary professional must adapt to ever-changing teams while working on different projects with different people for different time periods. Forret & Love (2008) state that in most organizations project work is prevalent and therefore employees must work effectively as part of a team. Hertel et al (2005: p71) note that team members “collaborate interactively to achieve common goals”. However the initial formation of a team can be dysfunctional as it “is composed of some number of relatively independent individuals who each have their own needs, goals, and expected outcomes …” (Day, Gronn & Salas 2004; p860). O’Neill & Kline (2008) observe that teams are groups of individuals who have a common purpose, interact to accomplish organizational goals, and share responsibility for team outcomes .As such, individual team members need to ensure they have the collaborative skills to enable them to work effectively within their team and to deliver expected team outcomes. Forret & Love (2008), Hertel et al (2005) and Majchrzak et al (2005) all posit that collaboration and cooperation among employees in today’s workplace is essential to allow organizations to function in their dynamic environments and to meet the demands of both the global and local marketplaces. With the growth in the global marketplace, the use of distributed or virtual teams has become increasingly important. As a member of such a team knowing your role and responsibility to the team are extremely important as these teams cross geographic locations and business unit boundaries and may have diverse reporting requirements (Majchrzak et al 2005). “Senior executives … usually have a very clear idea of their roles and responsibilities and how they relate to one another and how to work together effectively, and the result is a well-oiled operation” Doz & Kosonen (2007: p1).
Proc. 12th Australasian Computing Education Conference (ACE 2010), Brisbane, Australia
157

.
.
Figure 1: The process of contextualising work-ready learning activities.
Consulting professional societies & identifying key generic graduate attributes. �
Identifying sub-attributes, understandings and skills for each attribute to create a matrix of generic learning activities
Attribute Attribute Reference
Introductory Learning Activities
Intermediate Learning Activities
Advanced Learning Activities
10. Teamwork & Leadership
10.1 Capacity to lead in organisational situations Generic GEN.10.1.intro GEN.10.1.med GEN.10.1.adv
10.2 Multicultural team formation and development Generic GEN.10.2.intro GEN.10.2.med GEN.10.2.adv
10.3 Group problem solving and applying teamwork Generic GEN.10.3.intro GEN.10.3.med GEN.10.3.adv
�
�
Each profession in the project has its own matrix of contextualised work-ready activities
�
Contextualised learning activities are quality assured by local-area leaders and the professional societies and then published on the project website
Attribute Attribute Reference Introductory
Learning Activit ies
Intermediate Learning Activities
Advanced Learning Activit ies
10. Teamwork & Leadership
10.1 Capacity to lead in organisational situations FIT.GA1 - Teamwork IT.10 .1.intro IT.10.1.med IT.10.1.adv
10.2 Multicultural team formation and development FIT.GA1 - Teamwork IT.10 .2.intro IT.10.2.med IT.10.2.adv
10.3 Group problem solving and applying teamwork FIT.GA1 - Teamwork IT.10.3.intro IT.10.3.med IT.10.3.adv
10.4 Coaching and mentoring skills including giving feedback FIT.GA1 - Teamwork IT.10.4.intro IT.10.4.med IT.10.4.adv
10.5 Group and individual dynamics in organisations FIT.GA1 - Teamwork IT.10 .5.intro IT.10.5.med IT.10.5.adv
Other Please click here to add a learning activity or suggest a new sub-attribute
�
Displayed: Beginning of the IT profession’s contextualised matrix of work-ready activities �
Academics choose 50 minute work-ready learning activities from the generic or their profession’s matrix and can down-load teaching support resources for effective and efficient integration into their subjects
�
CRPIT Volume 103 - Computing Education 2010
158

Day et al (2004) suggest most organizations strive for enhanced teamwork amongst their employees as superior employee collaboration can help achieve corporate goals and competitive advantage. Hence, teamwork is often promoted as a fundamental competency in organizations. “Star performers don’t operate in a vacuum; they operate as part of a team, and their success stems at least in part from their team relationships” (Groysberg & Abrahams 2006: p1). Good team relationships allow team members to give and take advice from one another making it easier to appreciate the team’s combined responsibility to the task (Doz & Kosonen 2007). Day et al (2004) reported on a survey of Fortune 100 company human resource professionals which highlighted that teamwork and how to capitalise on it was a high priority for these companies. There are many ways to develop teamwork skills with the most common being team training. Day et al (2004) reviewed eight specific team training and development strategies that have been used to enhance team performance. Of the areas covered team building, scenario-based team training and team coordination training appear well suited as techniques to enhance graduate teamwork skills. All authors mentioned above refer to collaboration or working collaboratively as a key to successful team operation. Decision-making in the team environment is not an individual task as input is canvassed from various team members before a team decision is put forward. Hence the ability to collaborate during the decision-making process and collaborate in the completion of work activities are fundamental skills that team member must possess.
5. The Case-Study in IT Management Having knowledge of teams, teamwork and how teams operate is essential in the IT industry. Most IT graduates and employees will at some point in their career work in a team, some may also lead a team, while others may manage projects and project teams. Over the Spring 2008 and Autumn 2009 semester’s three IT Management subjects incorporated a teamwork-oriented WRLA into their course content. These subjects were chosen as most relevant to undertake the teamwork activity as the subject assessment included a group work assignment. Students undertook the teamwork activity in a tutorial-based class and were surveyed to gain feedback concerning the impact of the WRLA. In the Spring 2008 subject all students were surveyed after the completion of their group work assignments whereas in the Autumn 2009 subjects the students were surveyed immediately after undertaking the work-ready learning activity selected teamwork
activity and also after completing the group work assignment. The aim of the surveys was to gain student feedback in relation to the WRLA in an attempt to evaluate how useful the activity was to the group assessment tasks and also to gain constructive feedback with the aim of making improvements to the WRLA. All three subjects used the one-page learning activity template describing a 6-step group collaborative problem solving model (Bolton, 1987) depicted in figure 2 below.
5.1 The Pilot In Spring Semester 2008, the IT post-graduate subject Project Management had a WRLA incorporated into the curriculum structure. Project management focuses strongly on teams and teamwork and hence this subject was a suitable choice to act as a pilot implementation of the collaborative decision-makingWRLA. In this subject two group assessment tasks were undertaken 1) a weekly workshop and 2) the final assignment. The team makeup was the same for both tasks. After providing students with the overview of the “Teamwork: Group Problem Solving” activity as shown in figure 2, they then undertook the teamwork based activity. The WRLA was conducted approximately half way through the semester. Students were surveyed after the completion of the final assignment (end of semester) as to how useful they found the “Teamwork: Group Problem Solving” activity in relation to their team assignment. The pilot survey consisted of five (5) questions with questions 2 to 5 being open questions.
1. How would you rate the Work–Ready Activity? (A scale answer with 1 not useful through to 5 very useful)
2. What are the best aspects of the Work–Ready Activity?
3. What were the least useful aspects of the Work–Ready Activity? How could it be improved?
4. Did the Work–Ready Activity influence your assignments?
5. Do you have any other comments? Twenty two (22) students responded to the survey. Eighteen (18) students rated the activity 3 or greater (question 1) and therefore identified that it was in fact a useful activity. Fifteen (15) students stated that the activity was useful for the team assignment work. One most interesting comment came from a part-time student in response to the question 4 ‘Did the Work-Ready Activity influence your assignment?’ The
Proc. 12th Australasian Computing Education Conference (ACE 2010), Brisbane, Australia
159

student’s response was “no, but that could be because I work fulltime and already use these processes and understand how to work in a group”. This comment clearly aligns with the objective of the Work-Ready
project of giving students skills that are used in the professional workplace.
v7: Work-Ready Learning Activity: UTS LTPF Curriculum Renewal Project Learning activity and template design by Andrew Litchfield © 2008
Matrix Reference #: 11.3.1intro Matrix Workready Attribute: 11. TEAMWORK: GROUP PROBLEM SOLVING Generic/Profession: Generic + contextualised version for each profession Course Graduate Attribute to be developed:
BScIT.GA1 – Work in collaborative environments BBus.GA2 – Communication & interpersonal skills + also relevant for the MIT, MPA, MBA, and other courses
Student Learning Level: Introductory – best learnt in 1st year Bachelor & 1st year Masters Best time in Semester: As soon as possible after student teams have formed Teaching Time required: Total: 50 minutes Lecture/Tutorial/Laboratory: Can be introduced in lecture and run in tutorial or laboratory
Learning Activity Name: 6-STEP COLLABORATIVE DECISION MAKING METHOD Learning activity objective/s ie. what will the students learn?
Introduction to a method to support learners understanding and skill development in collaborative decision-making to improve teamwork dynamics and teamwork outcomes.
Teaching & Learning strategy eg. classic teaching cycle case-studies games role-plays simulations, other active learning strategy.
The teaching strategy is to use the classic cycle;
1. Presentation of 6-step decision making model. 2. Guided team practice #1: case-study & discussion. 3. Guided team practice #2: case-study & discussion. 4. Plenary discussion + take-away reading & independent practice case-studies for skill mastery.
10 mins 15 mins 15 mins 10 mins 50 mins
Content synopsis
a short overview of about 100 words
more content details can be links from the teaching resources available as listed below.
The 6-step collaborative problem solving method has many applications at home, at work, and never forget university…! This is a most important personal and professional understanding and skill and its use has favourable consequences;
Step 1. Define the problem in terms of needs, not solutions. Step 2. Brainstorm possible solutions. Step 3. Select the solutions that will best meet all members’ needs. Step 4. Plan who will do what, where, and by when. Step 5. Implement the plan. Step 6. Evaluate the problem solving process and, at a later date, evaluatehow well the solution turned out.
Assessment as part of a teamwork task as part of a reflection task potential exam questions
This work-ready learning activity supports improved teamwork outcomes which are usually assessable. The assessment could also be part of a student reflection on teamwork when relevant to your subject. There is potential for exam question/s on the 6-step model.
Student learning resources links to online resources access details for hard-copies
Click for a soft copy of Chapter 14 ‘Collaborative Problem Solving: Seeking an Elegant Solution’ from Bolton, R. (1987) People Skills. Click for generic and contextualised case-studies for independent practice.
Academic teaching resources links to online resources access details for hard-copies
Click for powerpoint lecture & tutorial slides on the 6-step method. Click for various contextualised case-studies for both guided and independent practice of the 6-step model in tutorials or labs.
Copyright status permission sought if required
One chapter paper handout is fair use for educational purposes in Australia.
Acknowledgements who is responsible for the design of the activity?
This generic work-ready learning activity is designed by Andrew Litchfield <[email protected]> based on the work of Robert Bolton (1987). People Skills, Simon & Schuster.
Figure 2: The one-page template description of the team decision-making WRLA.
CRPIT Volume 103 - Computing Education 2010
160

5.2 The Follow-up In Autumn Semester 2009 two additional IT subjects IT Contracts and Outsourcing (post-graduate) and Managing Client Vendor Relations (under-graduate) were chosen to include the WRLA in their curriculumstructure. Both subjects focus on IT Outsourcing. Project work and teamwork play a major role in IT Outsourcing and therefore both subjects were suitable candidates for the use of the “Teamwork: Group Problem Solving” WRLA. Each subject had a group presentation assessment task. All students were given an overview of the learning activity (see figure 2) and then undertook a teamwork based activity.
Based on feedback obtained from the pilot, students in these two subjects were surveyed twice. The first time was immediately after they had completed the WRLA and the second time was immediately after they had completed their group assessment item. Students were requested that if they did not complete the initial survey then they were not to complete the second survey. The follow-up subject findings are presented in tabular form to allow the survey questions and summary of responses to be presented together. Table 1 below shows the post-graduate findings.
Initial Survey - 29 students responded Final Survey - 26 students responded
How would you rate the Work–Ready Activity? (A scale answer with 1 not useful through to 5 very useful) 28 students (96%) rated the activity 3 or greater (question 1) therefore giving the impression that the activity was in fact useful
How would now rate the Work–Ready Group Problem Solving Activity? (A scale answer with 1 not useful through to 5 very useful) 24 students (92%) rated the activity 3 or greater again giving the impression that the activity was useful for developing their group presentation
What are the best aspects of the Work–Ready Activity? The majority of students commented that the activity:
• gave the opportunity to hear other student’s ideas • helped to get to know other students in the class, • helped to get a feel for team or group work • helped to communicate with others
Did you find this Work–Ready Group Problem Solving Activity useful when developing your presentation? 23 students agreed that the WRLA was useful for the assessment item. Some comments included:
• “The work ready group problem solving activity certainly helped develop a good presentation”
• “Yes, quite effective” • “It reinforced the practices presented by ELSSA during
my induction week...”
What were the least useful aspects of the Work–Ready Activity? The limited responses obtained focused on:
• students not participating in the activity or giving limited input
• having a dominant person in the group • the group generating too many ideas
Did this Work–Ready Group Problem Solving Activity have any influence over how your group developed your presentation? Produced a negative result with 14 students commenting that the WRLA did not influence how the group developed their presentation. 12 students stated that it did help and the most common reason cited was using brainstorming to generate ideas.
Do you have any other comments? Only several responses received:
• “a lack of information in the case scenario” • “working in groups is a really essential for us …” • “Because I work full-time … I can see it being
beneficial for an under-grad or someone who hasn’t worked”
Do you have any other comments? Very few responses received, however the following comments were made
• “needs to be carried out frequently in class” • “effective and can be used in any problem solving
activity”
Note on the question rating the usefulness of the work-ready activity 6 students in each survey rated the activity at the mid-point of 3 indicating they were potentially neutral to the usefulness or otherwise of the activity.
Table 1: Post-Graduate IT Contracts and Outsourcing Findings
Proc. 12th Australasian Computing Education Conference (ACE 2010), Brisbane, Australia
161

Table 2 below shows the under-graduate findings.
Initial Survey - 27 students responded Final Survey - 24 students responded
How would you rate the Work–Ready Activity? (A scale answer with 1 not useful through to 5 very useful) 25 students (92%) rated the activity 3 or greater (question 1) therefore giving the impression the activity was in fact useful
How would now rate the Work–Ready Group Problem Solving Activity? (A scale answer with 1 not useful through to 5 very useful) 16 students (67%) rated the activity 3 or greater again giving the impression the activity was useful for developing their group presentation
What are the best aspects of the Work–Ready Activity? The majority of student comments focused on:
• Brainstorming to generate ideas • Collaboration to derive a consensus • Group participation leading to different opinions • Communication with others
Did you find this Work–Ready Group Problem Solving Activity useful when developing your presentation? 8 students indicated the WRLA was useful with brainstorming of ideas and determining what should be included the most cited reasons. 11 students stated that it did not help or they did not use the WRLA concepts. Comments made included:
• “It was done to long ago” • “I found it was really applicable for our group”
What were the least useful aspects of the Work–Ready Activity? Most students (22 of 27) commented on this question Most comments focused on the lack of detail or scope of the case scenario or the lack of time allowed for the activity.
Did this Work–Ready Group Problem Solving Activity have any influence over how your group developed your presentation? Produced a negative result with 19 students saying that the WRLA did not influence how the group developed their presentation. One student made the following comment “No it didn’t help, we still stuck to our old habits (which was inefficient as usual)”. Only 5 students said the WRLA helped but failed to give the reasons behind this.
Do you have any other comments? Only 4 responses were received: Two students commented on lack of detail in the case scenario. One suggested that the activity should be a whole class activity to allow more conflict to surface while another said that the activity was enthralling.
Do you have any other comments? No responses were received
Note on the question rating the usefulness of the work-ready activity a relatively high number of students (initial survey 10 and final survey 12) rated the activity at the mid-point of 3 showing they were potentially neutral to the usefulness or otherwise of the activity.
Table 2: Under-Graduate Managing Client Vendor Relations Findings
6. Lessons Learnt Overall the feedback from the students in relation to the “Teamwork: Group Problem Solving” WRLA was positive and indicated it was a beneficial change to the subject design. The activity was found to be useful by 90% of post-graduate students and 80% of under-graduate students. The different findings between the post-graduate and under-graduate subjects are quite interesting as the initial philosophy behind the work-ready project was that it should be focused on the under-graduate programs. From the feedback received it appears that under-graduate students are less concerned about work preparedness than the post-graduate students.
An influencing factor may be the high number (approximately 75%) of full-time international students in the post graduate subjects who see any attempt to provide expertise in workplace knowledge and skills as beneficial. The post-graduates were also more candid in their responses to the open-ended questions as the majority gave reasons behind their Yes / No answer. This is in stark contrast to the under-graduates who mostly answered Yes / No with little explanation. Does this suggest that our under-graduates are blasé about entering the workforce or is it that most are actually combining work with study? It is far easier to identify
CRPIT Volume 103 - Computing Education 2010
162

the full-time post-graduate student than it is to identify the under-graduate. We are pleased by the overall positive student feedback and response as the IT subjects involved are the first subjects to incorporate a WRLA into their design. However from the feedback received further improvement on the design of the case scenarios used in the WRLA is required. Additionally when we survey future cohorts of students again about the usefulness of the WRLA further questions regarding student enrollment status (full or part time) and student work experience should be included. This will help the Work-Ready Project make more informed decisions as to the content to be included in case scenario’s and the level of activity best suited to a full or part-time student.
7. Conclusion This paper has provided an overview of the Work-Ready Project and the implementation of a teamwork collaborative decision-making WRLA into the design of two post-graduate and one under-graduate subjects. As team work and project work is widespread in most organizations, the ability to collaborate with others is an essential skill for anyone entering the workforce. Hence, providing students with a collaborative decision-making framework while at university can only assist in their transition from student to employee and team member. While the implementation of the WRLA was successful in the these IT management subjects, student feedback suggests more work is needed so that the activities have enough depth of content to ensure successful outcomes are achieved by all participants. Other important feedback received suggests that thought should be given as to which cohort of students (for example full-time or part-time, under-graduate or post-graduate) are the best target group for undertaking a specific WRLA. The experience student’s gain through work-placements is crucial if they are to succeed in the workplace after graduation. Such real-world experience can never be fully duplicated by the renewal of university curriculum to incorporate work readiness through improving the learning of graduate professional attributes. Nevertheless the need for substantial curriculum renewal to better develop the professional attributes of graduates is increasingly recognised by universities, government, professional societies, accrediting bodies and employers. Recently von Konsky, (2008) and von Konsky et al, (2008) reported on work undertaken to address the skills and competencies to be demonstrated by practicing ICT professionals (the Skills Framework for the Information Age). This framework may well
provide a valid platform to steer the future of the UTS Work-Ready Project in relation to employability skills and work-ready competencies required by IT graduates. The UTS Work-Ready Project supports curriculum renewal and change through the online availability of generic and professionally contextualised learning activities and teaching resources, developing local-area implementation and integration strategies, and funding the collegial support activities of local-area change leaders. The status and matrices of the work-ready learning activities can be viewed at <wiki.it.uts.edu.au/workready>.
8. References ACNielsen Research Services. (2000): Employer
Satisfaction with Graduate Skills. Canberra, Australian Government Publishing Service.
Australian Chamber of Commerce and Industry & the Business Council of Australia (ACCI & BCI). (2002): Employability Skills for the Future. Canberra, Australian Government Publishing Service.
Barrie, S. and Prosser, M. (2004): ‘EDITORIAL’, Higher Education Research and Development, 23(3):243-246.
Barrie, S. (2005): Rethinking generic graduate attributes. HERDSA News, 27(1):1-6.
Barrie, S. (2006): Understanding what we mean by the generic attributes of graduates. Higher Education, 51(2):215-241.
Bolton, R. (1987): People Skills, London: Simon & Schuster.
Clanchy, J. and Ballard, B. (1995): Generic skills in the context of higher education. Higher Education Research and Development, 14(2): 155-156.
Day, D.V., Gronn, P. & Salas, E. (2004): Leadership capacity in teams, The Leadership Quarterly, 15:857–880.
Department of Education, Science and Training (DEST). (2004): Employability Skills. Canberra, Australian Government Publishing Service.
Doz, Y.l. & Kosonen, M. (2007): The New Deal at the Top, Harvard Business Review, June:1-7.
Finn, B. (1999): Young people’s participation in post-compulsory education and training: Report of the Australian Education Council Review Committee. Canberra, Australian Government Publishing Service.
Forret, M & Love, M.S. (2008): Employee justice perceptions and coworker relationships, Leadership & Organization Development Journal, 29(3):248-260.
Proc. 12th Australasian Computing Education Conference (ACE 2010), Brisbane, Australia
163

Griffin, A. (1997): PDMA Research on New Product Development Practises: Updating Trends and Benchmarking Best Practises, Journal of Product Innovation Management, 14(6):429-458.
Groysberg, B. & Abrahams, R. (2006): Lift Outs, Harvard Business Review, December:1-9.
Hertel, G., Geisterb, S. & Konradtb, U. (2005): Managing virtual teams: A review of current empirical research, Human Resource Management Review, 15:69–95.
Holmes, L. (2002): Reframing the skills agenda in higher education: Graduate identity and the double warrant. University of Crisis. D. Preston (ed). London, Rodopi Press.
Hughes, B & Cotterell, M. (2006): Software Project Management, 4th ed., London, McGraw-Hill.
Litchfield, A., Nettleton, S. & Taylor, T. (2008): Integrating work-ready learning into the curriculum contextualised by profession, Proc. of the WACE ACEN Work Integrated Learning (WIL): Transforming Futures Conference, 30 September -2 2 October 2008. Sydney, NSW.
Majchrzak, A, Malthora, A & John, R. (2005): Perceived Individual Collaboration Know-How Development Through Information Technology-Enabled Contextualization: Evidence from Distributed Teams, Information Systems Research16(1):9-27
Marchewka. J.T. (2009): Information Technology Project Management: Providing Measureable Organizational Value. 3rd ed., Hoboken, NJ, John Wiley & Sons.
Mayer, E. (1992): Key Competencies. Report of the Committee to advise The ACE and MOVET on Employment Related Key Competencies for Post Compulsory Education and Training. Canberra, Australian Government Publishing Service.
O’Neill, T.A. & Kline, T.J.B. (2008): ‘Personality as a Predictor of Teamwork: A Business Simulator Study’, North American Journal of Psychology, 10(1):65-78
Precision Consulting. (2007): Graduate Employability Skills: Prepared for the Business, Industry and Higher Education Collaboration Council. Canberra, Australian Government Publishing Service.
Scoufis, M. (2000): Graduate Attributes Projects: A focus for grass roots change in teaching and learning practices. Proc. of the 9th Annual Teaching Learning Forum, 2-4 February 2000. Perth: Curtin University of Technology.
Sharp, S. and Sparrow, H. (2002): Developing frameworks to embed graduate attributes in tertiary courses. Focusing on the Student: Proc. of the 11th Annual Teaching Learning Forum, 5-6 February 2002. Perth: Edith Cowan University.
Smith, K.A. & Imbrie, P.K. (2007): Teamwork and Project Management, 3rd ed., New York, McGraw-Hill.
von Konsky, B. (2008): Defining the ICT Profession: A Partnership of Stakeholders. Proc. of the 21st Annual NACCQ Conference, 4-7 July, 2008, Auckland, New Zealand.
von Konsky, B., Hay, D., & Hart, B. (2008): Skill Set Visualisation for Software Engineering Job Positions at Varying Levels of Autonomy and Responsibility. Proc. of the Australian Software Engineering Conference, 25-28 March 2008, Perth, WA.
CRPIT Volume 103 - Computing Education 2010
164

Abstract
Few frameworks exist for the teaching and assessment of
programming subjects that are coherent and logical. Nor
are they sufficiently generic and adaptable to be used
outside the particular tertiary institutions in which they
were developed. This paper presents the Teaching and
Assessment of Software Development (TASD) frame-
work. We describe its development and implementation
at an Australian university and demonstrate, with
examples, how it has been used, with supporting data.
Extracts of criteria sheets (grading rubrics) for a variety
of assessment tasks are included. The numerous
advantages of this new framework are discussed with
comparisons made to those reported in the published
literature.
Keywords: curriculum, criterion-referenced assessment.
1 Introduction
In 2006, two of the authors (Thomas and Corney) started
a research project to develop a coherent and logical
approach for implementing criterion-referenced
assessment (CRA) in software development subjects.
The goal was to improve assessment and course design in
response to continual student criticisms voiced in course
evaluations. Many of these criticisms were about a lack
of transparency about expectations. Students wanted
expectations to be explicit. Before we embarked on this
project, we, like other academics at QUT usually gave
some explicit assessment criteria to students, but the
standards we used to grade the quality of their work were
implicit. The criteria were often unrelated to those used
in software development subjects offered by other
academics, leading to a lack of cohesion across degrees,
and subsequent student dissatisfaction. CRA requires that
students are provided with explicit criteria and standards
for assessment and that these are aligned with teaching
and learning across year levels.
The intended outcome of the research was to develop
resources such as examples of assessment tasks and
criteria sheets that illustrated, not only how to implement
the principles of CRA, but also how to do it across
different year levels. Ideally this should be in a way that
was transparent, manageable, practical, and genuinely
reflected the nature of software development. The
project, therefore, became a search for a ‗levelling‘
framework that would allow us to make explicit to
stakeholders the level of expectations of all aspects of a
degree (course) across each of the years required to
complete it.
Implementing CRA has been avoided for several
reasons in the Faculty. The primary reason was a
strongly-held belief that it was not possible to write five
standards (from highest to lowest) for students‘ answers
to problems, whether there was only one solution or
multiple solutions. The other reasons were limited time
to implement and the non-availability of relevant
examples. With support from our Faculty and an
academic staff developer in assessment (Cordiner), we
developed and implemented a framework with associated
resources across different year levels.
The purposes of this paper are to:
present the Teaching and Assessment of
Software Development (TASD) framework and
describe how we implemented it
illustrate how the framework is adaptable for
use with all software development subjects and
provide supporting data
discuss the advantages of our framework
compared to others and reflect on how it has
affected our assessment practices.
2 Literature review
An Australian national survey in 2001 (Watson, Morgan,
McKenzie, Roberts, & Cochrane, 2002) revealed that
universities have no policies stating explicitly what year
levels imply in undergraduate degrees. Expectations for
students at each level (levelling) are mostly established
by content-sequencing and are not informed by a
teaching and assessment framework.
In our literature review, we found a variety of
frameworks used in software engineering education. In
the ones that focus only on assessment, the criteria for
tasks are inconsistently defined and do not reflect the
processes of software development. Teachers allocate
marks based on their own ‗internal‘ (implicit) standards.
Various difficulties have been found with these types
of frameworks. For example, Daniels, Berglund, Pears,
and Fincher, in describing the Runestone project, noted
Copyright © 2010, Australian Computer Society, Inc. This
paper appeared at the Twelfth Australasian Computing
Education Conference (ACE2010), Brisbane, Australia, January
2010. Conferences in Research and Practice in Information
Technology, Vol. 103. Tony Clear and John Hamer, Eds.
Reproduction for academic, not-for-profit purposes permitted
provided this text is included.
An Adaptable Framework for the Teaching and Assessment of Software
Development across Year Levels
Richard Thomas Faculty of Science and Technology
Queensland University of Technology
Brisbane, Australia
+61 7 3138 2736
Diane Corney Faculty of Science and Technology
Queensland University of Technology
Brisbane, Australia
+61 7 3138 9335
Moira Cordiner Centre for the Advancement of
Teaching and Learning
University of Tasmania
Hobart, Australia
+61 3 6223 6794
An Adaptable Framework for the Teaching and Assessment of Software
Development across Year Levels
Richard N Thomas Faculty of Science and Technology
Queensland University of Technology
Brisbane, Australia
+61 7 3138 2736
Moira Cordiner Centre for the Advancement of
Teaching and Learning
University of Tasmania
Hobart, Australia
+61 3 6223 6794
Diane Corney Faculty of Science and Technology
Queensland University of Technology
Brisbane, Australia
+61 7 3138 9335
Proc. 12th Australasian Computing Education Conference (ACE 2010), Brisbane, Australia
165

that ‗the process of agreeing on assessment criteria and
the actual meaning of them was far more difficult than
expected‘ (2004, p58). Michael (2000) observed that,
when students peer graded each other‘s presentations
using a checklist of questions linked to criteria, there was
no comparability between their judgments.
Various authors (Burgess, 2005; Box, 2004; Lister and
Leaney, 2003; Buck and Stucki, 2000) have used
taxonomies of generic objectives/learning outcomes as
teaching and assessment frameworks. These objectives
become increasingly complex according to the
application of a given hierarchy. For example, the
taxonomy developed by Bloom and Krathwohl (1956) is
set out under knowledge, comprehension, application,
analysis, synthesis and evaluation and implies a linear
view of how students learn.
One advantage of using a taxonomy as the basis for a
framework, is that it provides consistency in framing
objectives for teaching, and criteria and standards for
assessment. However, if this type of taxonomy is rigidly
adhered to, it can result in a course involving acquiring a
lot of knowledge in early years, with students
demonstrating increasingly higher order thinking (such as
analysing and evaluating) but learning no new knowledge
in later years (Engineering Subject Centre, 2000-2007).
Oliver, Dobele, Greber and Roberts (2004) found that
when they mapped the levels of outcomes in courses,
there was no evidence to support the assumption that
students could only achieve the higher levels of Bloom‘s
taxonomy if they achieved the lower levels (such as
knowledge) first. Buck and Stucki (2000) found that
Bloom‘s taxonomy did not reflect the processes of
software development and needed to be applied in the
reverse. They also were unable to apply it to higher
levels of study – they asked ‗the community to help us
fill in more details of how we can effectively build from
the lower to higher cognitive levels‘ (p79).
Other authors have based their frameworks on
graduate attributes (university-wide graduate outcomes).
For example, Whitfield (2003) describes a process at
Slippery Rock University in which computer science
degree outcomes were placed into four groupings and
mapped to graduate attributes. These groupings were:
‗problem-solving and decision making‘, ‗critical thinking
and analytical reasoning‘, ‗communication and
interpersonal skills‘, ‗ethical and professional
responsibilities‘ (p214). The emphasis for teaching and
assessing each of these in a subject was determined by a
rating of 1-3. The Faculty also formalized and stipulated,
instruction strategies and assessment methods to staff that
aligned with the groupings. Students at Slippery Rock
University were provided with criteria sheets in advance,
but these were inconsistently designed — some were
checklists to tick, others were descriptions of
expectations at four different standards. An evaluation of
their framework found there were far too many outcomes
to teach and assess, and the ‗communication and
interpersonal skills‘ group of outcomes urgently needed
revision (Slippery Rock University, 2006).
Matsuura (2006) took a different approach to create a
process-product-people framework based on a software
development method (requirements analysis, system
analysis, system design, implementation, testing and
meets user requirements). His framework stipulates
products under each part of the software development
method. For example, under Implementation (p165):
‗lists of source codes, source codes, installation guides,
user manual‘ rather than the qualities of these to be
assessed. This framework is not applied across year
levels. The criteria that are itemized further for
assessment (for example, under Process, p166: ‗validity
of the selection and construction of tasks for the work
plan‘) appear unrelated to the software development
method. Students are given the criteria but these are not
accompanied by described standards to show how an
overall grade is determined. This indicates implicit
standards are used by teachers to judge the quality of
student work.
3 Developing the Teaching and Assessment of
Software Development framework
We undertook the following steps to develop the
framework within a criterion-referenced approach to
teaching and assessment.
1. Initially each section of the outlines for the key
software development subjects in the IT
undergraduate and postgraduate degrees were
examined (the rationale, aim, objectives, teaching
and learning approaches, assessment and resources).
2. Rather than mapping content, we focussed on
common verbs, that is, what students are required to
‗do‘ in these subjects.
3. We recognised that these common verbs happened to
map to the recognisable stages of software
development. They were reflected in assessment
tasks and had the possibility of becoming assessment
criteria.
We added ‗communication‘ because we and industry
believe that students need to be able to communicate
effectively in professional practice. Communication is
also deemed important by professional bodies and
accreditation boards.
3.1 Defining our use of terms
Regardless of the software development model used, they
all have recognisable stages that correspond to the terms
analysis, design, implementation, testing. There may be
a one-to-one relationship between these stages and those
of a particular model, or one stage may correspond to
multiple steps in a model. A model may require stage(s)
to be carried out iteratively. In this paper, each of the
terms (analysis, design, implementation, testing)
describes a continuum from simple to advanced in
relation to concepts and their integration, and skill
development. Depending on the stage being taught,
students may be given part or all of some of the other
stages. For example, in an assessment task that focuses
on design and implementation, students could be given a
complete analysis and a partial test plan or suite. The
components of the TASD framework are Analysis,
Design, Implementation, Testing and Communication.
These are used to frame objectives and align them with
criteria for assessment tasks. They are also in alignment
with the requirements of computing degrees set out in
CRPIT Volume 103 - Computing Education 2010
166

Computing Curricula 2005 and its companion discipline
specific volumes (Cassel et al. 2008; Gorgone et al. 2002;
Lunt et al. 2008; Shackelford et al. 2006). Our defini-
tions of the TASD framework components are as follows:
Analysis: this term involves understanding the
components of a problem by, for example, defining
feasibility and scope, and determining the user
requirements
Design: this term includes interpreting and/or
producing a solution to a problem—this ranges from high
level architectural design to detailed algorithmic design
Implementation: this term includes coding of the
solution, coding style and standards, program
documentation, efficiency and data structure choices
Testing: this term includes testing the correctness of
the design and the functionality and efficiency of the
program; done by designing test plans and executing the
tests
Communication: this term involves oral and written
modes of expression using the language and genres of
professional practice, for example, report writing, oral
presentation, and use of industry templates for
documentation.
3.2 Determining validity and applicability
As an initial validation of the framework, we applied it to
a series of subjects across year levels as they were
currently taught and assessed. This was convenient
because the subjects being taught (by authors Thomas
and Corney) spanned four year levels and emphasized
different components of the framework. Part of the
validation was to examine the developmental progression
of the framework components. After this initial
validation, we then checked all the other software
development subjects taught at QUT. Naturally each
subject places different emphasis on different
components, determined by the amount of time allocated
to the teaching and assessment of the components.
4 Implementing the framework
4.1 Determining the assessment criteria
We implemented the TASD framework by using it to
devise criteria sheets for assessment tasks from different
subjects. Table 1 lists the aspects of the criteria that we
considered important in assessing students‘ knowledge
and skills, and which can be identified in their work.
These aspects are sufficiently fine-grained without
overwhelming students in the minutiae and making
assessment tedious. This list is therefore not exhaustive.
Nevertheless, it serves as a useful starting point when
devising tasks, their criteria and associated descriptions
of standards. The QUT assessment policy requires that
we describe five standards referenced to criteria. For the
purposes of this paper, these standards (achievement
levels) are represented as A to E, where A is the top
grade, D is a passing grade and E is a failing grade. On a
criteria sheet these standards are represented by bullet
points, termed descriptors. In criterion-referenced
assessment, students demonstrate that they meet a
described standard in order to be awarded a particular
grade. In contrast, norm referencing relies on a preset
distribution of the number of students to be awarded each
grade, regardless of the standard of their work.
Criterion Aspects that can be assessed
Analysis clarity and structure of system overview, quality of use case diagrams and descriptions, meaning and measurability of non-functional requirements, identification of actors, …
Design use of a design language to describe a design, identification of classes, quality of class descriptions, cohesion, coupling, quality of architecture, internal logic and data flow, correspondence between the design and analysis model, coverage of requirements, evaluation of the design, plausibility of the implementation and testing scheduling, …
Implementation completeness of task, code quality, commenting, functionality, robustness, quality of the user interface, …
Testing code coverage, requirements coverage, handling of boundary conditions, extent of condition testing, description of input and output, acceptance testing environment description, repeatability, system testing, unit testing, acceptance testing, …
Communication Written: adherence to English conventions, clarity of writing, level of detail, narrative flow, conformance to industry standard templates,…
Oral: contributions to team meetings, coherence and clarity of presentation, content and structure, delivery, timing, interaction with audience, …
Table 1: Aspects of the TASD framework criteria
4.2 Levelling expectations
4.2.1 Levelling across year levels
As shown in table 1, within the implementation criterion,
one of the typical aspects that can be assessed is code
quality. The following examples use this aspect to
illustrate how levelling can be achieved between a first
year and a Masters subject.
In the first year software development subject
(Example 1), students are taught the ―basics‖ of code
quality, including such things as naming of identifiers
and commenting to build good habits so they produce
readable code. By Masters level, we expect students to
produce readable and efficient code. Example 1 above is
an excerpt from a criteria sheet for a first year assessment
task where the students were required to write a program.
This criteria sheet illustrates our expectations for code
quality and two of the five achievement levels. In this
task, the readability of the code is emphasized by
assessing it in detail.
Readability of code is also important for more
advanced programmers. However, at a higher level, this
code quality aspect should have been already learnt and it
is expected that the student will produce readable code.
So, now a ―higher level‖ of code quality can be assessed.
Proc. 12th Australasian Computing Education Conference (ACE 2010), Brisbane, Australia
167

Implementation You have written code that:
Standard A Standard D
Code Quality
Quality issues in the Style Guide include: layout, indentation, spacing, identifier naming
conforms 100% to the style guide
has some inconsistencies and/or problems with two code quality issues
Commenting
As per Style Guide, workshops and lectures
has a comment for every class, method and instance variable where appropriate
has a comment for most classes, a few methods and instance variables where appropriate
has comments which give a good description of function (including parameter and return values for methods)
has comments which give a fair description of function, these may not include parameter and return values for methods
includes pre and post conditions for all methods
does not include pre and post conditions
uses XML style commenting
Example 1: Extract of criteria sheet, first year Object
Oriented Programming
Example 2 is from a programming assessment task for
Masters level students. Note that all of the code quality
expectations from the first year criteria sheet have been
subsumed into one descriptor ―is readable‖ in the
Masters‘ compiler task. The emphasis in the Masters‘
task is on more advanced code quality aspects, such as
efficiency of code, which would not be assessed in first
year.
Implementation You have written code that:
Standard A Standard D
Code Quality
Choice and use of code constructs and data structures.
uses code and data structures which are efficient with regard to memory use and execution speed
uses code and data structures which result in some inefficiencies with regard to memory use and execution speed
Readability (comments, variable names, layout, etc.)
is readable is mostly readable
Example 2: Extract of criteria sheet, Masters’ subject
Compiler Construction
Example 3 (on the right) illustrates how the analysis
criterion is assessed across year levels. The first subject
is the prerequisite for the second one. As in previous
examples, levelling is achieved by aspects of the criterion
in the second year subject subsuming and extending some
of the first year aspects.
4.2.2 Levelling within a year level
Example 4 demonstrates the levelling of expectations
within the design criterion for the first year second
semester subject Modelling Analysis and Design. We
Modelling Analysis and Design (first year)
Generic task description: students do a simple analysis of a large problem
derive a three-tiered architecture
design a detailed solution for the middle tier
Aspects of Analysis
Standard for an A
Quality of use case diagrams
identified the main, and some minor, actors which were all external entities that interact directly with the system.
accurately summarised the main system features and which actors use them.
Quality of use case descriptions
provided accurate, detailed and concise descriptions of the main system features that captured all the information about using the system from the actors’ perspectives.
Software Engineering Studies (second year)
Generic task description: students analyse a large problem
design a solution
implement and verify the solution
Aspects of Analysis
Standard for an A
Quality of use case diagrams and descriptions
a clear and structured overview is provided of system functional and environment requirements.
your use case descriptions unambiguously and concisely capture all important information about using the system, from a user’s perspective.
Meaning and measurability of non-functional requirements
non-functional requirements are meaningful and measurable constraints, as negotiated.
Example 3: Extract of criteria sheets from two
different year levels showing highest grade for the
analysis criterion
have achieved effective levelling by the judicious use of
adverbs and adjectives, combinations of these, and
depending on the standard, additional expectations within
the descriptors. We have extracted a descriptor for the
―Quality of Class Diagrams‖ aspect and identified how
this levelling has been achieved, by italicizing and
underlining the differences. Additional expectations are
in bold.
Standard A
Structured the design with packages of logically related classes
and with minimal dependencies between packages
Standard D
Structured the design with a few packages of loosely-related classes
Example 4: descriptor comparison for first year
Modelling Analysis and Design
4.3 Adapting criteria to suit task design
4.3.1 All relevant criteria do not have to be
assessed in each task
The particular criteria that are used in a criteria sheet
should suit the task and reflect the objectives of the
CRPIT Volume 103 - Computing Education 2010
168

subject. This means that what you assess should be what
you have taught—a fundamental principle of alignment
(Biggs, 2003). It is not necessary to use every criterion
in every task as long as the assessment plan has a balance
across the criteria. The criteria you select will depend
upon the emphases, not only of the subject, but also of
the particular task being assessed. For example, a task
might emphasize implementation, while the subject
emphasizes the three criteria of implementation, design
and testing; the assessment tasks for the whole subject
would, together, assess all three of these criteria.
4.3.2 Aspects of a criterion may be subsumed
Aspects introduced in one task may be subsumed in
subsequent tasks when the students are aware of implied
expectations and should have acquired the necessary
skills. To illustrate this, we use the subject Object
Oriented Programming as an example. Students work on
a ―large‖ (for first year) program throughout the
semester, from which a number of assessment tasks are
submitted. In task 1, ‗commenting‘ is assessed separately
from code quality, while in task 2, ‗commenting‘ is
deliberately subsumed, as it is part of code quality. This
is because task 1 has scaffolded the development of
student skills so that in task 2 students should grasp what
is expected for ‗commenting‘.
Task 1 Task 2
Involves writing test plans and code. Students are given a design and are required to write the declarations to provide a shell for the program. Then they implement a very small part of the program logic.
Builds on task 1 by requiring students to implement the rest of the program logic to complete the project (after feedback has been provided on students’ response to task 1)
Criteria:
Implementation
Testing
Criterion:
Implementation
Aspects of the criteria:
Implementation:
Completeness of the task (quantity and correctness of code- how much has been attempted by the student and how much is correct)
Aspects of the criterion
Implementation: Functionality (quantity and
correctness of code that meets the supplied specification)
Code Quality (assesses the readability of the code the same as in example 1 (section 4.2),
Code Quality (assesses the readability of the code the same as in example 1 (section 4.2), but subsumes commenting)
Commenting (see example 1, section 4.2) assessed separately in this task
Testing:
unit test plans (quality and completeness)
Example 5: Criteria for related assessment tasks for
Object Oriented Programming
4.3.3 The aspects of criteria and descriptors of
standards can be reused in different tasks
Reuse of aspects is possible when tasks are similar,
regardless of the year level. Examples 1 and 2 show how
an aspect of implementation (code quality) can be reused
across different subjects. It is also possible to reuse an
aspect within the same subject in different assessment
tasks. Note that the descriptors of the standards need not
be the same. If the tasks are similar and the year level is
the same it is also possible to reuse the descriptors. For
example an aspect of communication is ―adherence to
English conventions‖. The descriptors for this aspect are
generic enough to apply to any task requiring
communication within a year level. Adherence to
English conventions aspect may be reused at other year
levels but the descriptors would have to be altered, that is
increasing or decreasing expectations of students to
reflect the level of difficulty of the subject.
4.3.4 Criteria can be combined into one
criterion
The Framework allows you to combine criteria for an
assessment task. For example, in Masters' level Compiler
Construction, one of the assessment tasks involves the
production of a Finite State Automata diagram. This task
involves analysis and design, so the criteria are combined
into a single criterion on the criteria sheet (see example
6). We chose not to assess analysis separately from
design, as producing an analysis artefact would not be an
authentic task in industry practice.
Generic task description: This task requires the student to produce a design artefact in the form of a Finite State Automata diagram. Criterion You have analysed the functionality required to
design a FSA that:
Standard A Standard D
Analysis and Design
is deterministic may be deterministic
has all the required states and transitions to recognise all the symbols of the language
has the required states and transitions to recognise more than half of the symbols of the language
has no unnecessary states
Example 6: Extract of criteria sheet, Compiler
Construction.
4.3.5 Aspects should be selected to suit task
goals
The second year subject Software Engineering Studies
requires students to work on a large project over a
semester (typically 13 weeks). There are several
milestones and each of these is an assessment task with
its own criteria sheet.
Example 7 shows that all of the criteria are assessed
on this project – some aspects of the criteria appear on
more than one criteria sheet for different parts of the
project (e.g. clarity of structure of system overview, use
of a design language to describe a design, conformance to
industry standard templates).
Proc. 12th Australasian Computing Education Conference (ACE 2010), Brisbane, Australia
169

Generic task description: This task requires students to work in groups to analyse, design, implement, test and deliver a software product.
Criterion Aspects that are assessed
analysis clarity and structure of system overview, quality of use case diagrams and descriptions, meaning and measurability of non-functional requirements
design use of a design language to describe a design, identification of classes, cohesion, coupling, internal system logic and data flow, level of correspondence between the design and the analysis model, plausibility of the implementation and testing scheduling
implementation code quality, functionality, quality of the user interface
testing requirements coverage, description of input and output, acceptance testing environment description, effectiveness of tools usage, repeatability, system testing, unit testing, acceptance testing
communication written:
adherence to English conventions, narrative flow, conformance to industry standard templates
Example 7: Aspects of the criteria for Software
Engineering Studies large project
5 Comparison of our frameworks to others
The only framework that has some similarities to ours is
the product process-people one developed by Matsuura
(2006). This is because it is based on a software devel-
opment process and includes ‗communication‘ (as part of
the ‗process‘ and ‗people‘ components). However, its
sole purpose is for assessing an individual‘s problem-
based learning when in a group. Students are assessed in
terms of what artefacts they have created, not the
standard of these against criteria. In comparison with the
frameworks referred to earlier in the literature review,
our framework has many advantages. It serves the pur-
poses of teaching and assessment and it is based on
generic stages of software development. This makes the
framework coherent and logical, and sufficiently generic
to be used by others. It does not involve assessing a
myriad of objectives/outcomes, or use a particular taxon-
omy of learning objectives—this makes it more manage-
able and practical. Our framework follows the principles
of criterion-referenced assessment by using the compo-
nents to frame objectives for subjects and align them with
criteria for assessment tasks. It also shows how to
describe different standards within and across year levels.
This means that expectations are clear and explicit so that
students have more control over their own learning.
One of the most important advantages of the frame-
work is that teachers no longer have to use an ad hoc
approach to the creation of criteria. We have provided a
logical starting point with five criteria that can easily be
contextualized to suit particular tasks using the aspects
we have listed in table 1. This makes the framework
adaptable, regardless of what part of software develop-
ment is being taught and assessed, and it gives teachers
control over how they teach and assess. The list of
aspects will evolve as teachers explore different types of
assessment. The framework, however, is not an automatic
generator of assessment tasks or criteria sheets—teachers
still have to devise tasks and make decisions on what
criteria best suit these. A further advantage is that the
framework can be used to improve subject and course/
degree design by ensuring that teaching and assessing are
fully aligned.
6 Evaluation
In this section, initial qualitative and quantitative data is
presented. To date, TASD has been implemented in nine
subjects and been used to redesign the Bachelor of
Information Technology degree/course.
6.1 Qualitative data
Figure 1 illustrates the remarkable difference in student
satisfaction about the difficulty level of assessment in a
subject across four semesters (2006, two in 2007 and one
in 2008). The TASD framework was implemented by
one of the authors for the middle two semesters, with
another teacher delivering it in semester four. A key
feature of the framework is the use of criteria sheets, by
tutors to grade students‘ work, and by students to judge
the quality of their own work before submitting it (see
section 6.1.1 for a sample of comments).
40%
45%
50%
55%
60%
65%
70%
75%
80%
NO TASD YES
TASD
YES
TASD
NO TASD
1 2 3 4
author author author other
features of unit delivery
sati
sfa
cti
on
rati
ng
Figure 1: Student satisfaction rating of assessment
difficulty for first year Modelling Analysis and Design
6.1.1 Selection of comments about using
criteria sheets
Students
The criteria sheets helped me to know what I needed to
do to get a good result.
I like getting criteria sheets for assignments so I know
what is required, they clear up expectations for the
assignment.
Criteria sheets helped me to manage my time.
Tutors
I need the discussion about a criteria sheet to understand
how to interpret it and use it for marking.
I like having a standard to use to judge the quality of
assignments.
CRPIT Volume 103 - Computing Education 2010
170

Once I get used to a criteria sheet it speeds up my
marking.
A good criteria sheet makes it easier to talk to students
about marking and what is required for an assignment.
The TASD framework informed the approach to the
redesign of the Bachelor of Information Technology
(BIT) degree in 2008. This resulted in cohesion between
subjects which were no longer topic-driven but process-
driven, forming a better foundation for industry practice
than the previous traditional approaches. The type of
content remained the same as did academic rigour. 2009
was the first year of this degree. Table 2 shows students‘
satisfaction ratings of three features of the revised core
subjects.
Revised Core Subjects
Workload Difficulty Relevance
1 89.90% 93.90% 79.80%
2 61.70% 77.70% 84%
3 84.40% 86.20% 63.30%
4 94.40% 84.90% 97.60%
Table 2: % satisfied students–ratings of first semester
core subjects in the revised Bachelor of IT degree
6.2 Quantitative data
In 2009, the attrition rate at the end of first semester was
a significant improvement on previous years (table 3).
The overall pass and fail rates in first semester subjects
also improved in 2009 (table 4). It is not possible to
directly compare the pass and fail rates for individual
subjects from 2008 to 2009 as the redesign of the BIT has
resulted in the first semester core subjects being very
different to previous versions. Table 4 does line up the
subjects from 2008 with their closest replacement in 2009
but the teaching approaches, content and structure of the
subjects in the revised BIT are substantially different.
Degree &
Number of
Students
Degree
Structure
Attrition Data: % of Enrolled
Students
end
semester 1
end week 3
semester 2
2009
(n=208)
revised 9% 9%
2008
(n=179)
original 35% 34%
Table 3: Comparison of attrition data for Bachelor of
IT commencing students 2008-2009
2008 Semester 1 Results 2009 Semester 1 Results
Core Subjects
original (n=179) Core Subjects
revised (n=208)
% pass % fail % pass % fail
1 81% 19% 4 96% 4%
2 95% 5% 3 94% 6%
1 94% 6%
4 76% 24%
5 85% 15% 2 85% 15%
Table 4: Comparison of pass and fail rates for the
original and revised core units of the Bachelor of IT
One of the first subjects in which TASD was applied
was Modelling Analysis and Design. Figure 2 shows that
there was not a large difference in student results when
comparing the two semesters in which criteria sheets
were used, versus the previous and following semesters.
The one important difference is that in 2006/2 the cut-off
for a grade of A was normalised. Consequently there is a
higher percentage of A grades and a lower percentage of
B grades than would have been the case if the cut-offs
were not altered. If normalisation had not taken place in
2006/2 only 2% of students would have achieved a grade
of A and 24% would have achieved a grade of B;
resulting in a line very similar to 2007/1 and 2007/2. As
there is no significant difference in student results
between the semesters that used or did not use criteria
sheets it may be assumed that the use of criteria sheets
does not impact on student results. Section 6.1 noted that
student satisfaction with the difficulty of the assessment
was markedly increased in the semesters in which criteria
sheets were used. Students, and tutors, commented
positively about criteria sheets in their feedback on the
subject. Consequently we would recommend the use of
criteria sheets, and TASD to support their development,
as they seem to lead to increased student (and tutor)
satisfaction without any apparent negative affects on
student results.
Figure 2: Comparison of results for Modelling
Analysis and Design (2006/2 – 2008/1)
7 Conclusion
We devised the TASD framework by taking a holistic
approach in which we considered the whole picture of
curriculum and assessment across year levels. This meant
determining the content and assessment similarities of all
software development subjects, not just isolated ones.
The biggest challenges were to ensure that the framework
was practical and adaptable, true to the discipline and
aligned with international computing science curricula.
Initially, we implemented it in four software development
subjects in 2006-7. Resources developed during that time
included revised subject outlines, a table of aspects of
criteria suitable for assessment at different year levels
and a suite of criteria sheets (extracts of which are
Proc. 12th Australasian Computing Education Conference (ACE 2010), Brisbane, Australia
171

presented in this paper). The framework has since been
presented to faculty and used to revise the structure of a
degree (2009 was its first year).
In section 6 we stated that the introduction of criteria
sheets improved student satisfaction without markedly
affecting student results. This was an expected outcome
of the project as we were trying to explicitly show
students the alignment of assessment with learning
objectives and what standards they had to achieve to be
awarded certain grades. (An untested side effect is the
hope that this will help students become more self
evaluative.) In the experience of the one author who has
continued in a teaching position at QUT, I have found
that using the TASD framework has helped with the
design and setting of expectations for assessment tasks.
Linking criteria to learning objectives helps focus on
what activities are required for an assessment task so that
students achieve the subject‘s learning objectives.
When redesigning the Bachelor of IT degree at QUT
the design team purposely chose not to follow common
implementations of the ACM/IEEE model curricula with
a standard CS1, CS2, … sequence of subjects (Cassel et
al. 2008; Gorgone et al. 2002; Lunt et al. 2008; Shackel-
ford et al. 2006). The TASD framework provided a
mechanism to ensure that our sequence of subjects
achieved our goals and covered the important knowledge
areas from the model curricula without being constrained
by standard content delivery approaches.
We believe that our framework has advantages over
existing frameworks. It reflects the processes of software
development, has a logical and consistent whole of
degree approach, is adaptable between subjects and
across year levels, and makes assessment expectations
explicit through the use of criteria sheets. Initial
qualitative and quantitative data indicates that imple-
menting this framework improves student satisfaction
about assessment difficulty, workload and relevance of
subjects, as well as reducing attrition rates.
8 References
Biggs, J. B. (2003) Teaching for quality learning at
university, Buckingham, UK: SRHE and Open
University Press.
Bloom, B. & Krathwohl, D. 1956. Taxonomy of
Educational Objectives. New York: McKay & Co.
Box, I. 2004. Object-oriented Analysis, Criterion
Referencing, and Bloom. Proceedings of the 6th
Australasian Computing Education Conference
(ACE2004), Dunedin, NZ. Volume 30. pp. 1-8.
Buck, D. & Stucki, D. 2000. Design Early Considered
Harmful: Graduated Exposure to Complexity and
Structure Based on Levels of Cognitive Development.
Proceedings of the 31st SIGCSE Technical Symposium
on Computer Science Education, 2000, Austin, Texas.
pp. 75-79.
Burgess, G. 2005. Introduction to Programming:
Blooming in America. Journal of the Consortium for
Computing Sciences in Colleges. Volume 21, Number
1 (Oct.). pp. 19-28.
Cassel, L., Clements, A., Davies, G., Guzdial, M.,
McCauley, R., McGettrick, A., Sloan, R., Snyder, L,
Tymann, P. and Weide, B. 2008. Computer Science
Curriculum 2008: An Interim Revision of CS 2001.
ACM and IEEE.
Daniels, M., Berglund, A., Pears, A. & Fincher, S. 2004.
Five Myths of Assessment. Proceedings of the 6th
Australasian Computing Education Conference
(ACE2004), Dunedin, New Zealand. Volume 30. pp.
57-61.
Engineering Subject Centre. 2000-2007. Levels in
Module Descriptions. London: The Higher Education
Academy. http://www.engsc.ac.uk/er/theory/levels.asp
(accessed 6 June 2007)
Gorgone, J., Davis, G., Valacich, J., Topi, H., Feinstein,
D. and Longenecker, H. Jr. 2002. Model Curriculum
and Guidelines for Undergraduate Degree Programs
in Information Systems. Association for Information
Systems.
Lister, R. and Leaney, J. 2003. Introductory
Programming, Criterion-Referencing, and Bloom.
Proceedings of the 34th
SIGCSE Technical Symposium
on Computer Science Education, 2003, February 19-
23, Reno Nevada USA, p. 203.
Lunt, B., Ekstrom, J., Gorka, S., Hislop, G., Kamali R.,
Lawson, E., LeBlanc, R., Miller, J. and Reichgelt, H.
2008. Information Technology 2008: Curriculum
Guidelines for Undergraduate Degree Programs in
Information Technology. ACM and IEEE.
Matsuura, S. 2006. An Evaluation Method of Project
Based Learning on Software Development Experiment.
Proceedings of the 37th
SIGCSE Technical Symposium
on Computer Science Education, 2006, Houston,
Texas. pp. 163-167
Michael, M. 2000. Fostering and Assessing
Communication Skills in the Computer Science
Context. SIGCSE Bulletin. pp.119-123
Oliver, D., Dobele, T., Greber, M., & Roberts, T. 2004.
This Course has a Bloom Rating of 3.9. Proceedings of
the 6th
Australasian Computing Education Conference,
(ACE2004), Dunedin, NZ. Volume 30. pp. 227-231.
Shackelford, R., Cross II, J., Davies, G., Impagliazzo, J.,
Kamali, R., LeBlanc, R., Lunt, B., McGettrick, A.,
Sloan, R. and Topi, H. 2006. Computing Curricula
2005: The Overview Report. ACM and IEEE.
Slippery Rock University. 2006. Computer Science
Department Assessment Report.
http://cs.sru.edu/~whit/assessment/Report06.ppt
(accessed 10 October 2007)
Watson, G., Morgan, C., McKenzie, T., Roberts, D., &
Cochrane, K. 2002. Meeting the Challenge of
Positioning Undergraduate Units of Study at the
Appropriate Levels. Higher Education Research and
Development. pp. 704-712.
Whitfield, D. 2003. From University Wide Outcomes to
Course Embedded Assessment of CS1. Journal of the
Consortium for Computing Sciences in Colleges.
Volume 18, Number 5, pp. 210-220. Sample rubrics:
http://cs.sru.edu/~whit/assessment/ (accessed 10
October 2007)
CRPIT Volume 103 - Computing Education 2010
172

Author Index
Andreae, Peter, 17Andrews, Trish, 89
Behrens, Karin, 89Bell, Tim, 17Berglund, Anders, 37Brooks, Wayne, 109
Cajander, Asa, 75Carbone, Angela, 55Carrington, David, 47Chin, K. L., 119Chinn, Donald, 55Clear, Tony, 27Clear, Tony , iiiColdwell, Jo, 129Cordiner, Moira, 167Corney, Diane, 167Corney, Malcolm, 65Craig, Annemieke, 129
Dale, Nell B., 3Daniels, Mats, 75de Raadt, Michael, 81Denny, Paul, 139
Edwards, Sylvia, 109Egea, Kathryn, 27, 89
Hamer, John, iii, 139
Kaila, Erkki, 99
Kim, Soon-Kyeong, 47, 89Koppi, Tony, 109
Laakso, Mikko-Jussi, 55, 99Lambert, Lynn, 17Lister, Raymond, 37Litchfield, Andrew, 157Lu, Jie, 27, 119Luxton-Reilly, Andrew, 139
McLachlan, Christine, 129
Naghdy, Fazel, 109
Pears, Arnold N., 9Purchase, Helen, 139
Rajala, Teemu, 99
Salakoski, Tapio, 99Sheard, Judy, 55, 109Simon, 149Sixsmith, Alan, 157Strooper, Paul, 47
Teague, Donna, 65Thomas, Richard, 65, 167
Xiao, Jitian, 27, 119Xu, Jun, 119
Yao, Juan, 119
Proc. 12th Australasian Computing Education Conference (ACE 2010), Brisbane, Australia
173

Recent Volumes in the CRPIT Series
ISSN 1445-1336
Listed below are some of the latest volumes published in the ACS Series Conferences in Research andPractice in Information Technology. The full text of most papers (in either PDF or Postscript format) isavailable at the series website http://crpit.com.
Volume 84 - Artificial Intelligence and Data Mining 2007Edited by Kok-Leong Ong, Deakin University,Australia, Wenyuan Li, University of Texas atDallas, USA and Junbin Gao, Charles SturtUniversity, Australia. December, 2007. 978-1-920682-65-1.
Contains the proceedings of the 2nd International Workshop on Integrating AI and Data Mining(AIDM 2007), Gold Coast, Australia. December 2007.
Volume 85 - Advances in Ontologies 2007Edited by Thomas Meyer, Meraka Institute,South Africa and Abhaya Nayak, MacquarieUniversity, Australia. December, 2007. 978-1-920682-66-8.
Contains the proceedings of the 3rd Australasian Ontology Workshop (AOW 2007), Gold Coast,Queensland, Australia.
Volume 86 - Safety Critical Systems and Software 2007Edited by Tony Cant, Defence Science and Tech-nology Organisation, Australia. December, 2007.978-1-920682-67-5.
Contains the proceedings of the 12th Australian Conference on Safety Critical Systems andSoftware, August 2007, Adelaide, Australia.
Volume 87 - Data Mining and Analytics 2008Edited by John F. Roddick, Jiuyong Li, PeterChristen and Paul Kennedy. November, 2008.978-1-920682-68-2.
Contains the proceedings of the 7th Australasian Data Mining Conference (AusDM 2008),Adelaide, Australia. December 2008.
Volume 88 - Koli Calling 2007Edited by Raymond Lister University of Technol-ogy, Sydney and SimonUniversity of Newcastle.November, 2007. 978-1-920682-69-9.
Contains the proceedings of the 7th Baltic Sea Conference on Computing Education Research.
Volume 89 - Australian VideoEdited by Heng Tao Shen and Michael Frater.October, 2008. 978-1-920682-70-5.
Contains the proceedings of the 1st Australian Video Conference.
Volume 90 - Advances in OntologiesEdited by Thomas Meyer, Meraka Institute,South Africa and Mehmet Orgun, MacquarieUniversity, Australia. September, 2008. 978-1-920682-71-2.
Contains the proceedings of the Knowledge Representation Ontology Workshop (KROW 2008),Sydney, September 2008.
Volume 91 - Computer Science 2009Edited by Bernard Mans Macquarie University.January, 2009. 978-1-920682-72-9.
Contains the proceedings of the Thirty-Second Australasian Computer Science Conference(ACSC2009), Wellington, New Zealand, January 2009.
Volume 92 - Database Technologies 2009Edited by Xuemin Lin, University of NewSouth Wales and Athman Bouguettaya, CSIRO.January, 2009. 978-1-920682-73-6.
Contains the proceedings of the Twentieth Australasian Database Conference (ADC2009),Wellington, New Zealand, January 2009.
Volume 93 - User Interfaces 2009Edited by Paul Calder Flinders University andGerald Weber University of Auckland. January,2009. 978-1-920682-74-3.
Contains the proceedings of the Tenth Australasian User Interface Conference (AUIC2009),Wellington, New Zealand, January 2009.
Volume 94 - Theory of Computing 2009Edited by Prabhu Manyem, University ofBallarat and Rod Downey, Victoria University ofWellington. January, 2009. 978-1-920682-75-0.
Contains the proceedings of the Fifteenth Computing: The Australasian Theory Symposium(CATS2009), Wellington, New Zealand, January 2009.
Volume 95 - Computing Education 2009Edited by Margaret Hamilton, RMIT Universityand Tony Clear, Auckland University of Technol-ogy. January, 2009. 978-1-920682-76-7.
Contains the proceedings of the Eleventh Australasian Computing Education Conference(ACE2009), Wellington, New Zealand, January 2009.
Volume 96 - Conceptual Modelling 2009Edited by Markus Kirchberg, Institute for In-focomm Research, A*STAR, Singapore and Se-bastian Link, Victoria University of Wellington,New Zealand. January, 2009. 978-1-920682-77-4.
Contains the proceedings of the Fifth Asia-Pacific Conference on Conceptual Modelling(APCCM2008), Wollongong, NSW, Australia, January 2008.
Volume 97 - Health Data and Knowledge Management 2009Edited by James R. Warren, University of Auck-land. January, 2009. 978-1-920682-78-1.
Contains the proceedings of the Third Australasian Workshop on Health Data and KnowledgeManagement (HDKM 2009), Wellington, New Zealand, January 2009.
Volume 98 - Information Security 2009Edited by Ljiljana Brankovic, University of New-castle and Willy Susilo, University of Wollon-gong. January, 2009. 978-1-920682-79-8.
Contains the proceedings of the Australasian Information Security Conference (AISC 2009),Wellington, New Zealand, January 2009.
Volume 99 - Grid Computing and e-Research 2009Edited by Paul Roe and Wayne Kelly, QUT.January, 2009. 978-1-920682-80-4.
Contains the proceedings of the Australasian Workshop on Grid Computing and e-Research(AusGrid 2009), Wellington, New Zealand, January 2009.
Volume 100 - Safety Critical Systems and Software 2007Edited by Tony Cant, Defence Science and Tech-nology Organisation, Australia. December, 2008.978-1-920682-81-1.
Contains the proceedings of the 13th Australian Conference on Safety Critical Systems andSoftware, Canberra Australia.
Volume 101 - Data Mining and Analytics 2009Edited by Paul J. Kennedy, University of Tech-nology, Sydney, Kok–Leong Ong, Deakin Univer-sity and Peter Christen, The Australian NationalUniversity. November, 2009. 978-1-920682-82-8.
Contains the proceedings of the 8th Australasian Data Mining Conference (AusDM 2009),Melbourne Australia.
CRPIT Volume 103 - Computing Education 2010
174