computershare limited (asx:cpu) financial ... 2013 results management...computershare limited...
TRANSCRIPT

COMPUTERSHARE LIMITED (ASX:CPU)
FINANCIAL RESULTS
FOR THE FULL YEAR ENDED 30 JUNE 2013
14 August 2013 NOTE: All figures (including comparatives) are presented in US Dollars (unless otherwise stated).
The non-IFRS financial information contained within this document has not been reviewed or audited in
accordance with Australian Auditing Standards.
Copies of the FY13 Results Presentation are available for download at: http://www.computershare.com/au/about/ir/financials/Pages/results.aspx

MARKET ANNOUNCEMENT
1
Melbourne, 14 August 2013 – Computershare Limited (ASX:CPU) today reported Statutory Basic Earnings
per Share (EPS) of 28.25 cents for the twelve months ended 30 June 2013, a decrease of 9.2% on FY12. Management Earnings per Share were 54.85 cents, an increase of 11.7% over the prior corresponding
period (pcp).
A final dividend of AU 14 cents per share 20% franked has been declared, unchanged from the final dividend
of last year.
Total statutory revenues and other income increased 10.2% on FY12 to $2,046.0 million. Statutory Net Profit post Non-Controlling Interest (NCI) fell 9.2% to $157.0 million (see Appendix 4E). Management Net Profit
post NCI rose 11.8% to $304.9 million. Operating Cash Flows decreased 0.2% to $334.0 million.
Headline Statutory Results (in USD unless otherwise stated) for FY13 were as follows:
FY13 FY12* FY13 versus FY12
Earnings per Share (post NCI) 28.25 cents 31.10 cents Down 9.2%
Total Revenues & other income $2,046.0m $1,857.2m Up 10.2%
Total Expenses $1,853.3m $1,630.9m Up 13.6%
Statutory Net Profit (post NCI) $157.0m $172.9m Down 9.2%
*refer to the restatement in note 3 of the Appendix 4E.
Headline Management Results (in USD unless otherwise stated) for FY13 were as follows:
FY13 FY12 FY13 versus FY12
FY13 at FY12 exchange
rates
FY13 at FY12 exchange rates
versus FY12
Management Earnings per Share (post NCI)
54.85 cents
49.09 cents
Up 11.7% 55.62 cents
Up 13.3%
Total Operating Revenues $2,025.1m $1,818.7m Up 11.4% $2,050.1m Up 12.7%
Operating Costs $1,515.2m $1,360.1m Up 11.4% $1,534.1m Up 12.8%
Management Earnings before Interest, Tax, Depreciation and Amortisation (EBITDA)
$509.8m $459.0m Up 11.1% $515.8m Up 12.4%
EBITDA margin 25.2% 25.2% Flat 25.2% Flat
Management Net Profit (post NCI)
$304.9m $272.8m Up 11.8% $309.1m Up 13.3%
Cash Flow from Operations $334.0m $334.6m Down 0.2%
Free Cash Flow $290.3m $294.5m Down 1.4%
Days Sales Outstanding 45 days 43 days Up 2 days
Capital Expenditure $49.5m $62.1m Down 20.3%
Net Debt to EBITDA ratio 2.47 times 2.86 times Down 0.39
times
Final Dividend AU 14 cents AU 14 cents Flat
Final Dividend franking amount
20% 60% Down from 60%
MARKET ANNOUNCEMENT
2
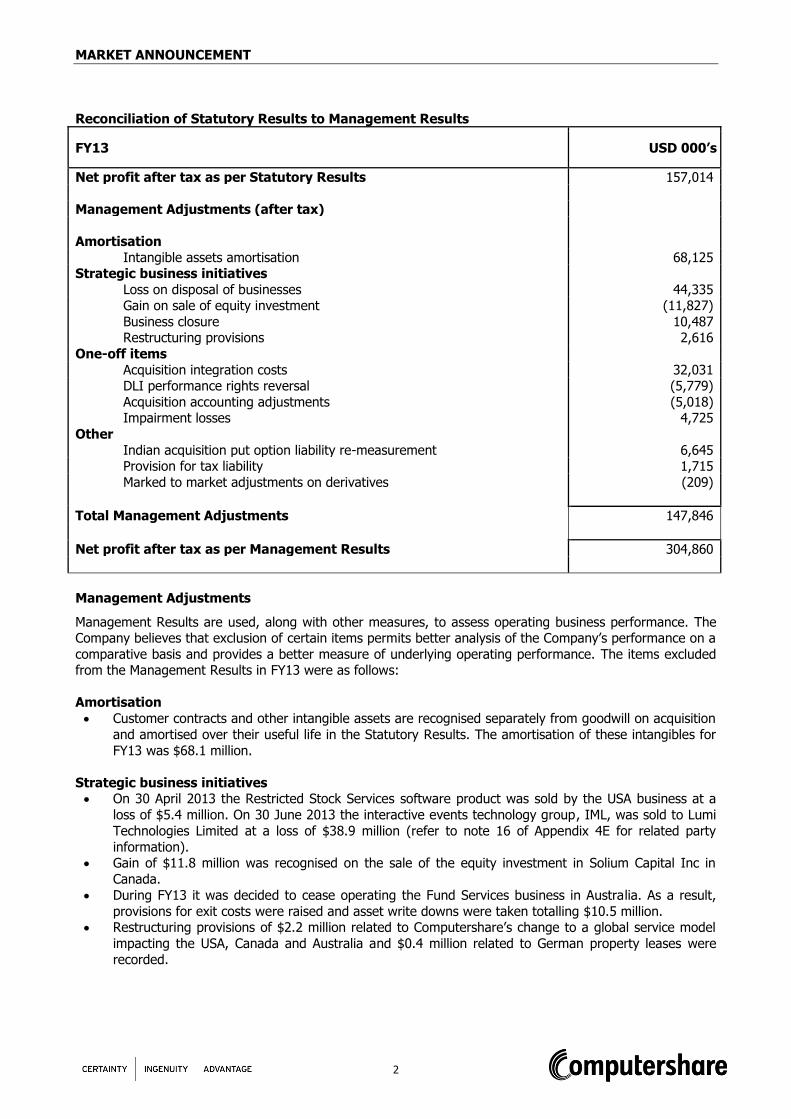
Reconciliation of Statutory Results to Management Results
FY13 USD 000’s
Net profit after tax as per Statutory Results 157,014
Management Adjustments (after tax)
Amortisation
Intangible assets amortisation 68,125 Strategic business initiatives
Loss on disposal of businesses
44,335 Gain on sale of equity investment (11,827)
Business closure Restructuring provisions
10,487 2,616
One-off items
Acquisition integration costs 32,031 DLI performance rights reversal
Acquisition accounting adjustments Impairment losses
Other
Indian acquisition put option liability re-measurement
(5,779)
(5,018) 4,725
6,645 Provision for tax liability 1,715
Marked to market adjustments on derivatives
(209)
Total Management Adjustments 147,846
Net profit after tax as per Management Results 304,860
Management Adjustments
Management Results are used, along with other measures, to assess operating business performance. The Company believes that exclusion of certain items permits better analysis of the Company’s performance on a
comparative basis and provides a better measure of underlying operating performance. The items excluded from the Management Results in FY13 were as follows:
Amortisation
Customer contracts and other intangible assets are recognised separately from goodwill on acquisition
and amortised over their useful life in the Statutory Results. The amortisation of these intangibles for
FY13 was $68.1 million.
Strategic business initiatives On 30 April 2013 the Restricted Stock Services software product was sold by the USA business at a
loss of $5.4 million. On 30 June 2013 the interactive events technology group, IML, was sold to Lumi
Technologies Limited at a loss of $38.9 million (refer to note 16 of Appendix 4E for related party
information). Gain of $11.8 million was recognised on the sale of the equity investment in Solium Capital Inc in
Canada.
During FY13 it was decided to cease operating the Fund Services business in Australia. As a result,
provisions for exit costs were raised and asset write downs were taken totalling $10.5 million. Restructuring provisions of $2.2 million related to Computershare’s change to a global service model
impacting the USA, Canada and Australia and $0.4 million related to German property leases were
recorded.

MARKET ANNOUNCEMENT
3
One-off items
Integration costs of $30.6 million related to the Shareowner Services acquisition from Bank of New
York Mellon and $1.4 million related to completion of UK acquisition integrations were incurred. As part of the FY14 budget process it was determined that it was no longer considered ‘more likely
than not’ that the performance condition applicable to 50% of the performance rights granted on 12
November 2009 would be met. On this basis, the personnel expense related to prior years totalling $5.8 million has been reversed. The expense in prior periods was charged against Management
earnings.
An acquisition accounting adjustment gain of $2.1 million for the true-up of provisions related to Shareowner Services as well as a contingent consideration adjustment gain of $3.1 million related to
Serviceworks and $0.2 million loss related to Specialized Loan Servicing (SLS).
Impairment losses of $4.7 million were recognised on unlisted investments and loan transactions with
equity investments.
Other The put option liability re-measurement expense of $6.6 million related to the Karvy joint venture
arrangement in India (refer to Note 3 in the Appendix 4E and the related FY12 restatement in the
financial accounts).
Provision of $1.7 million as a true-up of a tax liability associated with a previously identified business
issue. Derivatives that have not received hedge designation are marked to market at the reporting date and
taken to profit and loss in the Statutory Results. The valuations, resulting in a gain of $0.2 million
relate to future estimated cash flows.
MARKET ANNOUNCEMENT
4
Commentary (based on Management Results)
Computershare delivered Management EPS of 54.85 cents in FY13, up 11.7% on FY12. This is in line with the Company’s guidance of Management EPS between 10% and 15% higher than FY12. Total revenues
grew 11.4% on FY12 to $2,025.1 million largely as a result of a full year contribution from the Shareowner
Services and SLS acquisitions. EBITDA margins were flat year on year as transactional revenues remained weak. Management EBITDA grew 11.1% to $509.8 million, and Management Net Profit post NCI grew
11.8% to $304.9 million. Operating costs were up 11.4% on FY12 to $1,515.2 million, primarily due to the full year recognition of the Shareowner Services and SLS businesses. On a constant currency basis, total
revenues grew 12.7% and operating costs grew 12.8%. Cash flow from operations decreased 0.2% to
$334.0 million but increased 4.3% to $360.0 million after excluding loan servicing advances related to the SLS business.
Competition across our investor services segment has intensified in many markets which, together with the
gradual attrition in registered holders across the globe, has affected register maintenance revenues. Despite pockets of activity, corporate action revenues generally remained subdued. The employee plans business
performed strongly in all markets and was aided by the Shareowner Services plans contribution. Stakeholder
relationship management revenues continued to suffer from weak deal flow and a lack of hostile activity. Communication services revenues improved, underpinned by increased activity in the USA as previously
outsourced activity from recent acquisitions was internally captured.
The business services segment continues to drive revenue and earnings growth for the group. The full year
contribution from SLS and Serviceworks was the major growth catalyst, supported by another strong result from the deposit protection scheme business in the UK. However, bankruptcy administration in the USA and
the voucher services business in the UK were unable to match FY12 outcomes. The Canadian trust business and class actions administration business in the USA were flat year on year.
The Company continues to critically evaluate each of its portfolio assets to assess their ongoing strategic importance and the adequacy of operating performance. During the second half of the year, a range of
actions were taken with respect to certain non-core or underperforming assets. The Company sold its investment in Solium Capital Inc in Canada following its decision to retain the employee option and restricted
stock administration business acquired as part of the Bank of New York Mellon transaction. The Company divested both the Restricted Stock Services software product in the USA and its global interactive events
technology group, IML, as it was determined that the likely future returns for these businesses would not
meet internal requirements. A decision was also made to cease operating the Australian Fund Services business due to its ongoing inadequate financial performance and the prospects of any material
improvement being remote.
Computershare’s CEO, Stuart Crosby, said, “For a third year the economic climate remains challenging
across the globe, despite the broad based improvement in equity indices and pockets of M&A. Transactional activity remains substantially lower than the peak levels experienced in 2008 and 2009. Add to this another
year of very low interest rates in all of our key markets and it is plain that we will continue to have to combat a broad range of adverse factors.
“We are pleased with the portfolio clean up initiatives we have achieved during the period. While
Computershare has had a very successful history of expansion by acquisition and trying new initiatives, it’s
equally important that we recognise when things have not worked out as we might have hoped and that we make the necessary decisions.
“While we expect to realise substantial synergies in the year ahead following the Shareowner Services
integration, these benefits are anticipated to be materially offset by the impact of lower margin income
returns and the recent strengthening of the US dollar. Taking this and the continuing challenges of the operating environment into account, we are anticipating Management EPS for the full year FY14 to be
around 5% higher than FY13.”

MARKET ANNOUNCEMENT
5
Below is a summary of annual Statutory and Management Earnings per Share performance and Cash flow
from operations since FY07:
Regional Summary
Australia and New Zealand
Revenues in Australia and New Zealand increased 4.7% on FY12 to $426.5 million and EBITDA was up 0.6% to $77.4 million. Higher revenues were underpinned by a twelve month contribution from Serviceworks,
partially offset by a marginally weaker Australian dollar relative to the pcp. Register maintenance revenues were impacted by fee pressure due to competitive tension, whilst corporate action revenues remained low
but in line with FY12. Employee plans and communication services both grew revenue, however margins in the communication services business remain under pressure. Margin income deteriorated year on year due
to falling balances and falls in Australian dollar interest rates. The New Zealand business benefitted from an
increase in corporate actions in FY13. Operating costs were higher than FY12, due in part to Serviceworks’ full year contribution as well as a modest increase in salaries.
Asia
Revenues in the Asian region rose 5.8% on the pcp to $113.0 million, although EBITDA fell 2.7% to $33.4 million. The Hong Kong investor services business continues to be affected by the weak corporate actions
environment whereas the employee plans business, albeit small, continues to grow. The Indian business again saw growth in both revenue and earnings, although at lower margins compared to the broader group.
Increases in assets under management and one-off project work helped the Indian mutual funds business
grow revenues. Indian earnings were also negatively affected by the stronger US dollar during FY13.
United Kingdom, Channel Islands, Ireland & Africa (UCIA)
Revenues in the UCIA region grew 2.1% on pcp to $299.6 million and EBITDA grew 11.2% to $115.8
million. The UK investor services business revenues were flat year on year whilst employee plans and business services revenues were higher than FY12. Personnel cost savings from the HBOS EES integration
and transactional activity drove the employee plans business to an improved result whilst the deposit protection scheme business benefitted from higher balances. In contrast, the voucher services business saw
revenue and earnings impacted by competition. The Irish business improved earnings on a marginally lower
revenue base and South Africa increased both revenue and earnings on FY12.
0
50
100
150
200
250
300
350
400
450
0
10
20
30
40
50
60
70
FY07 FY08 FY09 FY10 FY11 FY12 FY13
USD
M
Ce
nts
pe
r Sh
are
Statutory / Management EPS and Cash flow from operations
Stat US cents Mgt US cents Cash flow from operations

MARKET ANNOUNCEMENT
6
Continental Europe
Revenues in the region fell 2.8% on pcp to $110.2 million while EBITDA increased 7.7% to $16.1 million
despite the weaker EUR year on year. The pick-up in earnings was largely due to the improvement in the German business. The Italian business was flat year on year and the Russian and Scandinavian businesses
performed moderately better.
United States
USA revenues grew 28.9% on FY12 to $843.2 million and EBITDA increased 37.4% to $171.8 million. The revenue and earnings uplift was underpinned by the full year contribution from the Shareowner Services and
SLS acquisitions that occurred in FY12. The full year contribution of the Shareowner Services business led to revenue growth in register maintenance, corporate actions, stakeholder relationship management, employee
plans and communication services. SLS revenue more than doubled year on year, however the associated costs that accompany onboarding significant new work and increased headcount resulted in some
compression in margins during FY13. The bankruptcy administration business was unable to match FY12
outcomes due to weak market conditions (low levels of bankruptcy filings) largely resulting from the success of the ongoing US Federal Reserve quantitative easing program. Class actions administration revenues were
higher in FY13, however increased operating costs affected earnings. Margin income grew significantly due to the contribution of Shareowner Services’ balances, despite maturing hedges and term deposits.
Canada
Canadian revenues fell 5.0% versus FY12 to $198.0 million and EBITDA decreased 14.6% to $81.6 million. The environment remains challenging, with investor services, communication services and stakeholder
relationship management revenues lower than FY12. Employee plans and corporate trust revenues were flat.
Earnings were impacted by lower margin income year on year as hedges rolled off. The region continues to focus on reducing operating costs to help counter weakening revenues as transactional activity remains
subdued.
Dividend
The Company announced a final dividend of AU 14 cents per share, 20% franked, payable on 17 September
2013 (dividend record date of 26 August 2013). This follows the interim dividend of AU 14 cents per share, 20% franked, paid in March 2013.
In January 2013, the Company announced that it had introduced a dividend reinvestment plan (DRP)
starting with the 2013 interim dividend and this DRP continues to operate for the 2013 final dividend. The
DRP pricing period for the final dividend will be from 28 August to 10 September 2013 (inclusive). The Company will purchase the relevant number of shares under the DRP election on market. No discount will
apply to the DRP price. DRP participation elections received after 5pm (AEST) on the dividend record date will not be effective in respect of this final dividend payment but will apply to future dividend payments
unless the Company elects to suspend or cancel its DRP.
Capital Management
The Company’s issued capital increased by 539,020 shares during the year as a result of the dividend
reinvestment plan. There were 556,203,079 issued ordinary shares outstanding as at 30 June 2013.
Balance Sheet Overview
Total assets decreased $62.8 million from 30 June 2012 to $3,618.9 million. Shareholder’s equity decreased
$23.4 million to $1,130.9 million over the same period.
Net borrowings decreased to $1,257.3 million (from $1,313.0 million at 30 June 2012). Gross borrowings at 30 June 2013 amounted to $1,711.7 million (down from $1,754.4 million at 30 June 2012). Debt facilities
maturity averages 4.8 years following the refinancing of a syndicated bank debt tranche in June 2013. The
tranche of $250m was extended from an October 2013 maturity to July 2017 (average maturity on drawn debt is now 5.1 years).
MARKET ANNOUNCEMENT
7
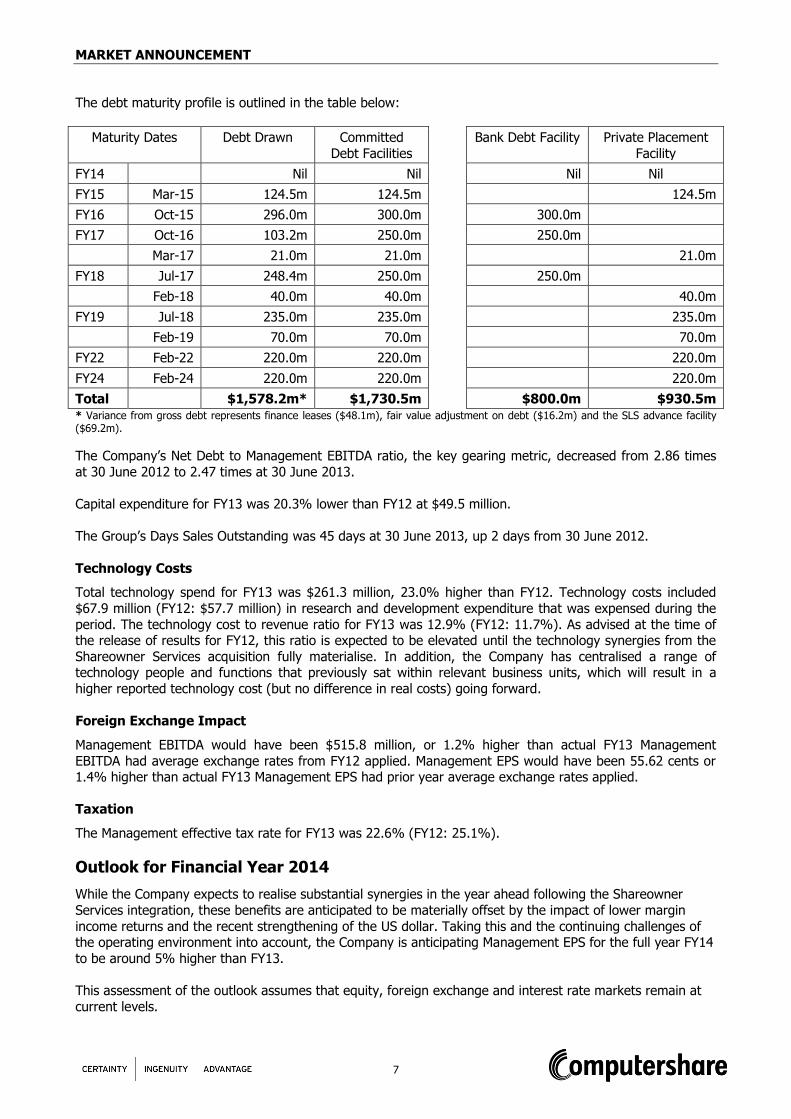
The debt maturity profile is outlined in the table below:
Maturity Dates Debt Drawn
Committed
Debt Facilities
Bank Debt Facility Private Placement
Facility
FY14 Nil Nil Nil Nil
FY15 Mar-15 124.5m 124.5m 124.5m
FY16 Oct-15 296.0m 300.0m 300.0m
FY17 Oct-16 103.2m 250.0m 250.0m
Mar-17 21.0m 21.0m 21.0m
FY18 Jul-17 248.4m 250.0m 250.0m
Feb-18 40.0m 40.0m 40.0m
FY19 Jul-18 235.0m 235.0m 235.0m
Feb-19 70.0m 70.0m 70.0m
FY22 Feb-22 220.0m 220.0m 220.0m
FY24 Feb-24 220.0m 220.0m 220.0m
Total $1,578.2m* $1,730.5m $800.0m $930.5m * Variance from gross debt represents finance leases ($48.1m), fair value adjustment on debt ($16.2m) and the SLS advance facility ($69.2m).
The Company’s Net Debt to Management EBITDA ratio, the key gearing metric, decreased from 2.86 times
at 30 June 2012 to 2.47 times at 30 June 2013.
Capital expenditure for FY13 was 20.3% lower than FY12 at $49.5 million.
The Group’s Days Sales Outstanding was 45 days at 30 June 2013, up 2 days from 30 June 2012.
Technology Costs
Total technology spend for FY13 was $261.3 million, 23.0% higher than FY12. Technology costs included
$67.9 million (FY12: $57.7 million) in research and development expenditure that was expensed during the
period. The technology cost to revenue ratio for FY13 was 12.9% (FY12: 11.7%). As advised at the time of the release of results for FY12, this ratio is expected to be elevated until the technology synergies from the
Shareowner Services acquisition fully materialise. In addition, the Company has centralised a range of technology people and functions that previously sat within relevant business units, which will result in a
higher reported technology cost (but no difference in real costs) going forward.
Foreign Exchange Impact
Management EBITDA would have been $515.8 million, or 1.2% higher than actual FY13 Management
EBITDA had average exchange rates from FY12 applied. Management EPS would have been 55.62 cents or 1.4% higher than actual FY13 Management EPS had prior year average exchange rates applied.
Taxation
The Management effective tax rate for FY13 was 22.6% (FY12: 25.1%).
Outlook for Financial Year 2014
While the Company expects to realise substantial synergies in the year ahead following the Shareowner
Services integration, these benefits are anticipated to be materially offset by the impact of lower margin
income returns and the recent strengthening of the US dollar. Taking this and the continuing challenges of the operating environment into account, the Company is anticipating Management EPS for the full year FY14
to be around 5% higher than FY13.
This assessment of the outlook assumes that equity, foreign exchange and interest rate markets remain at
current levels.

MARKET ANNOUNCEMENT
8
Please refer to the 2013 Full Year Results Presentation for detailed financial data.
About Computershare Limited (CPU)
Computershare (ASX:CPU) is a global market leader in transfer agency and share registration, employee
equity plans, proxy solicitation and stakeholder communications. We also specialise in corporate trust, mortgage, bankruptcy, class action, utility and tax voucher administration, and a range of other diversified
financial and governance services.
Founded in 1978, Computershare is renowned for its expertise in data management, high volume
transaction processing and reconciliations, payments and stakeholder engagement. Many of the world’s leading organisations use us to help streamline and maximise the value of relationships with their investors,
employees, creditors, members and customers.
Computershare is represented in all major financial markets and has over 12,000 employees worldwide.
For more information, visit www.computershare.com
For further information:
Mr Darren Murphy Head of Treasury and Investor Relations
Tel: +61-3-9415 5102
Mobile: +61-418 392 687

Computershare Limited Full Year Results 2013 Presentation
Stuart Crosby Mark Davis 14 August 2013

2
Introduction Financial Results
CEO’s Report
PRESIDENT & CHIEF EXECUTIVE OFFICER
Stuart Crosby
Introduction

4
Results Summary Statutory Results
Introduction
* Prior period Statutory results were restated due to re-measurement of put option liability. Refer to ASX Appendix 4E Note 3.
Note: all figures in this presentation are in USD M unless otherwise indicated.
Management results are used, along with other measures, to assess operating business performance. The Company believes that exclusion of certain items permits better analysis of the Group’s performance on a comparative basis and provides a better measure of underlying operating performance.
Management adjustments are made on the same basis as in prior years.
Non-cash management adjustments include significant amortisation of identified intangible assets from businesses acquired in recent years, which will recur in subsequent years, asset disposals, performance rights reversals and other one off charges.
Cash adjustments are predominantly expenditure on acquisition-related and other restructures, and will cease once the relevant acquisition integrations and restructures are complete.
A full description of all management adjustments is included in the ASX Appendix 4E Note 9.
The non-IFRS financial information contained within this document has not been reviewed or audited in accordance with Australian Auditing Standards.
Reconciliation of Statutory Revenue to Management Results FY13
Total Revenues & Other Income per statutory results $2,046.0
Management Adjustments
Acquisition accounting adjustment (6.5)
Gain on sale of equity investment (14.1)
Marked to Market adjustment on derivatives (0.3)
Total Management Adjustments ($20.9)
Total Revenue per Management results $2,025.1
Reconciliation of Statutory NPAT to Management Results FY13
Net profit after tax per statutory results $157.0
Management Adjustments (after tax)
Amortisation 68.1
Strategic Business initiatives 45.6
One-off items 26.0
Other 8.1
Total Management Adjustments $147.8
Net Profit after tax per Management results $304.9
FY13 Vs FY12
Earnings per share (post NCI) 28.25 cents Down 9.2%
Total Revenues & Other Income $2,046.0m Up 10.2%
Total Expenses $1,853.3m Up 13.6%
Statutory Net Profit (post NCI) $157.0m Down 9.2%

5
Note: all results are in USD M unless otherwise indicated.
Results Summary Management Results
Introduction
FY 2013 FY 2012 v FY 2012 FY 2013 @ FY 2012 exchange rates
Management Earnings per share (post NCI) US 54.85 cents US 49.09 cents Up 11.7% US 55.62 cents
Total Operating Revenue $2,025.1 $1,818.7 Up 11.4% $2,050.1
Operating Costs $1,515.2 $1,360.1 Up 11.4% $1,534.1
Management Earnings before Interest, Tax, Depreciation and Amortisation (EBITDA)
$509.8 $459.0 Up 11.1% $515.8
EBITDA Margin 25.2% 25.2% Flat 25.2%
Management Net Profit post NCI $304.9 $272.8 Up 11.8% $309.1
Cash Flow from Operations $334.0 $334.6 Down 0.2%
Free Cash Flow $290.3 $294.5 Down 1.4%
Days Sales Outstanding 45 days 43 days Up 2 days
Capital Expenditure $49.5 $62.1 Down 20.3%
Net Debt to EBITDA ratio 2.47 times 2.86 times Down 0.39 times
Final Dividend AU 14 cents AU 14 cents Flat
Final Dividend franking amount 20% 60% Down from 60%
Drivers Behind FY13 Financial Performance
6
Introduction
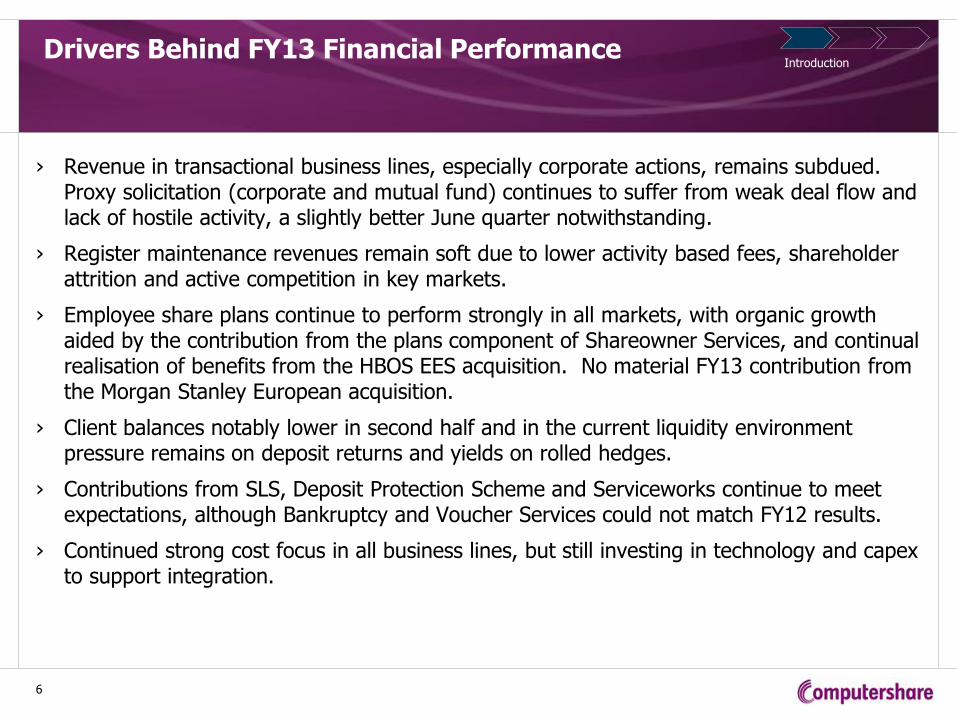
› Revenue in transactional business lines, especially corporate actions, remains subdued. Proxy solicitation (corporate and mutual fund) continues to suffer from weak deal flow and lack of hostile activity, a slightly better June quarter notwithstanding.
› Register maintenance revenues remain soft due to lower activity based fees, shareholder attrition and active competition in key markets.
› Employee share plans continue to perform strongly in all markets, with organic growth aided by the contribution from the plans component of Shareowner Services, and continual realisation of benefits from the HBOS EES acquisition. No material FY13 contribution from the Morgan Stanley European acquisition.
› Client balances notably lower in second half and in the current liquidity environment pressure remains on deposit returns and yields on rolled hedges.
› Contributions from SLS, Deposit Protection Scheme and Serviceworks continue to meet expectations, although Bankruptcy and Voucher Services could not match FY12 results.
› Continued strong cost focus in all business lines, but still investing in technology and capex to support integration.
Computershare Strengths
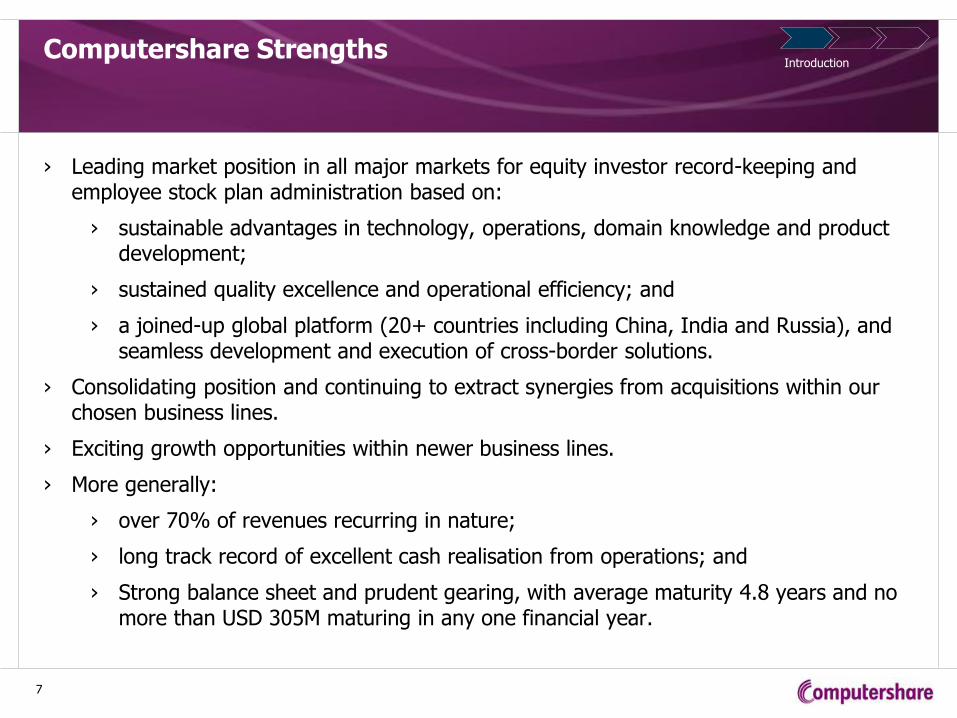
› Leading market position in all major markets for equity investor record-keeping and employee stock plan administration based on:
› sustainable advantages in technology, operations, domain knowledge and product development;
› sustained quality excellence and operational efficiency; and
› a joined-up global platform (20+ countries including China, India and Russia), and seamless development and execution of cross-border solutions.
› Consolidating position and continuing to extract synergies from acquisitions within our chosen business lines.
› Exciting growth opportunities within newer business lines.
› More generally:
› over 70% of revenues recurring in nature;
› long track record of excellent cash realisation from operations; and
› Strong balance sheet and prudent gearing, with average maturity 4.8 years and no more than USD 305M maturing in any one financial year.
7
Introduction

Guidance
› While the Company expects to realise substantial synergies in the year ahead following the Shareowner Services integration, these benefits are anticipated to be materially offset by the impact of lower margin income returns and the recent strengthening of the USD. Taking this and the continuing challenges of the operating environment into account, the Company is anticipating Management EPS for the full year FY14 to be around 5% higher than FY13.
› This assessment of the outlook assumes that equity, foreign exchange and interest rate markets remain at current levels.
8
Introduction

9
Introduction Financial Results
CEO’s Report
CHIEF FINANCIAL OFFICER
MARK DAVIS
Financial Results
11
Group Financial Performance
Note: all results are in USD M unless otherwise indicated.
Financial Results
FY 2013 FY 2012
% variance to FY 2012
2H 2013 1H 2013 2H 2012 1H 2012
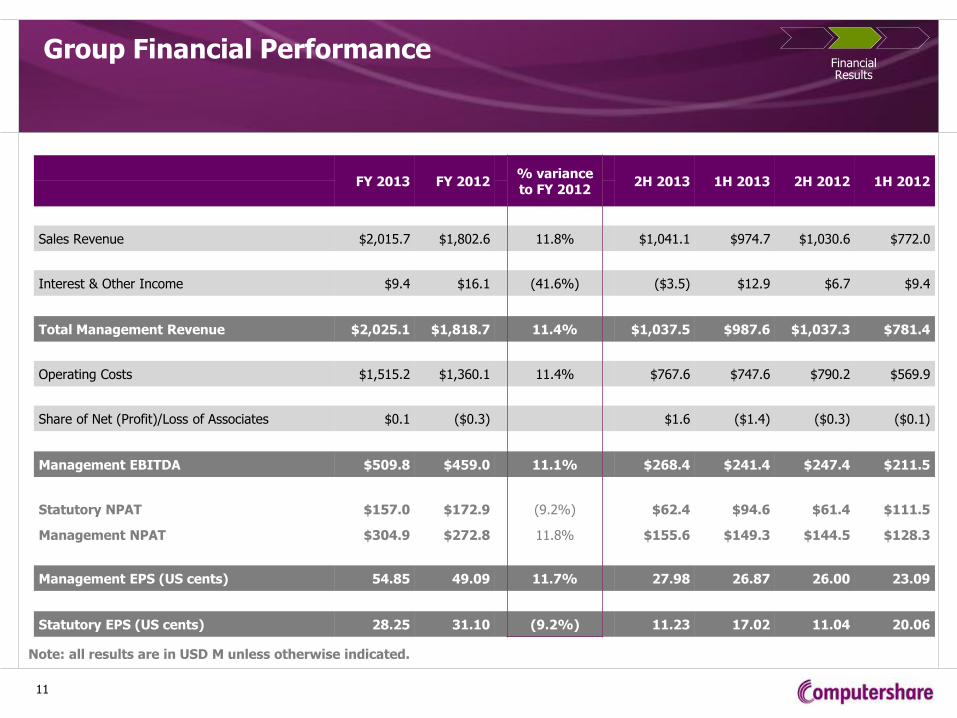
Sales Revenue $2,015.7 $1,802.6 11.8% $1,041.1 $974.7 $1,030.6 $772.0
Interest & Other Income $9.4 $16.1 (41.6%) ($3.5) $12.9 $6.7 $9.4
Total Management Revenue $2,025.1 $1,818.7 11.4% $1,037.5 $987.6 $1,037.3 $781.4
Operating Costs $1,515.2 $1,360.1 11.4% $767.6 $747.6 $790.2 $569.9
Share of Net (Profit)/Loss of Associates $0.1 ($0.3) $1.6 ($1.4) ($0.3) ($0.1)
Management EBITDA $509.8 $459.0 11.1% $268.4 $241.4 $247.4 $211.5
Statutory NPAT $157.0 $172.9 (9.2%) $62.4 $94.6 $61.4 $111.5
Management NPAT $304.9 $272.8 11.8% $155.6 $149.3 $144.5 $128.3
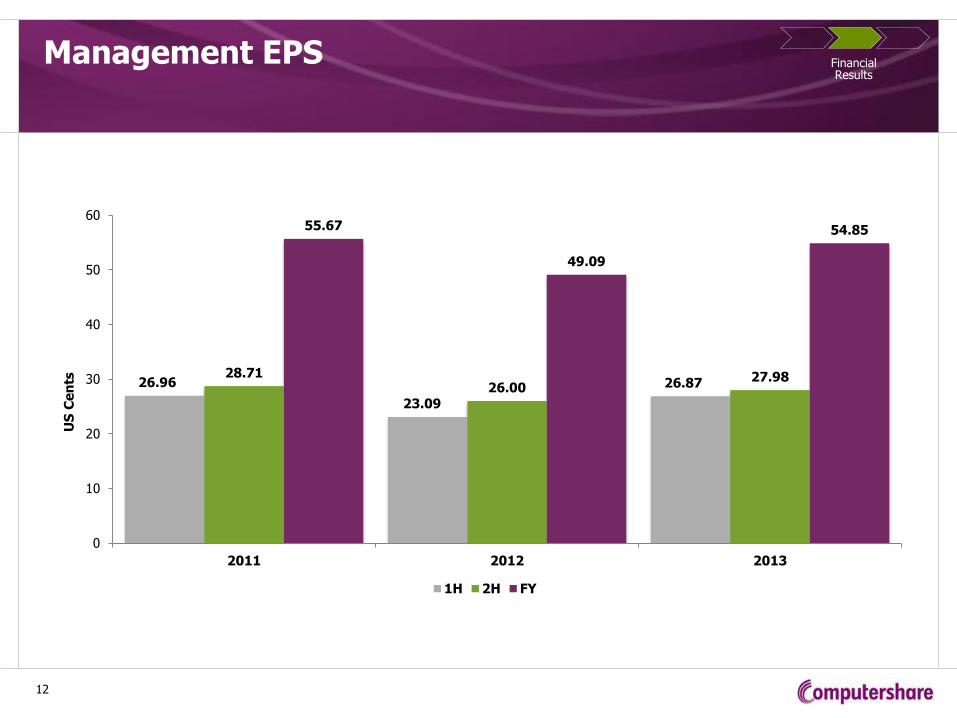
Management EPS (US cents) 54.85 49.09 11.7% 27.98 26.87 26.00 23.09
Statutory EPS (US cents) 28.25 31.10 (9.2%) 11.23 17.02 11.04 20.06
12
Management EPS
Financial Results
26.96
23.09
26.87 28.71
26.00 27.98
55.67
49.09
54.85
0
10
20
30
40
50
60
2011 2012 2013
US
Ce
nts
1H 2H FY
13
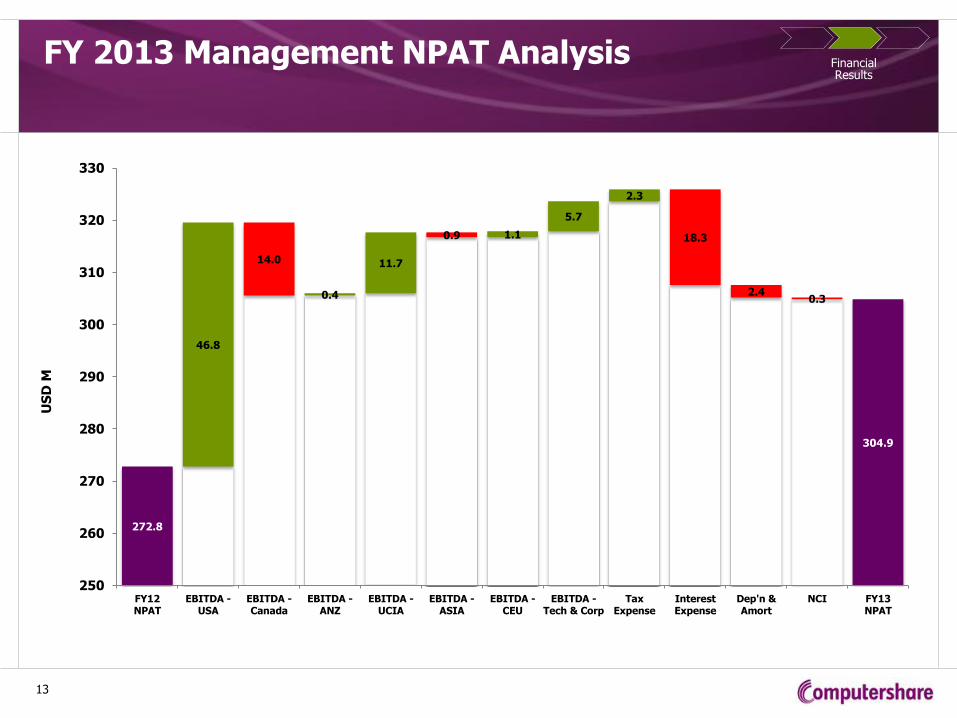
FY 2013 Management NPAT Analysis Financial Results
272.8
316.8
304.9 304.9
46.8
0.4
11.7
1.1
5.7
2.3
14.0
0.9 18.3
2.4 0.3
250
260
270
280
290
300
310
320
330
FY12NPAT
EBITDA -USA
EBITDA -Canada
EBITDA -ANZ
EBITDA -UCIA
EBITDA -ASIA
EBITDA -CEU
EBITDA -Tech & Corp
TaxExpense
InterestExpense
Dep'n &Amort
NCI FY13NPAT
US
D M
14
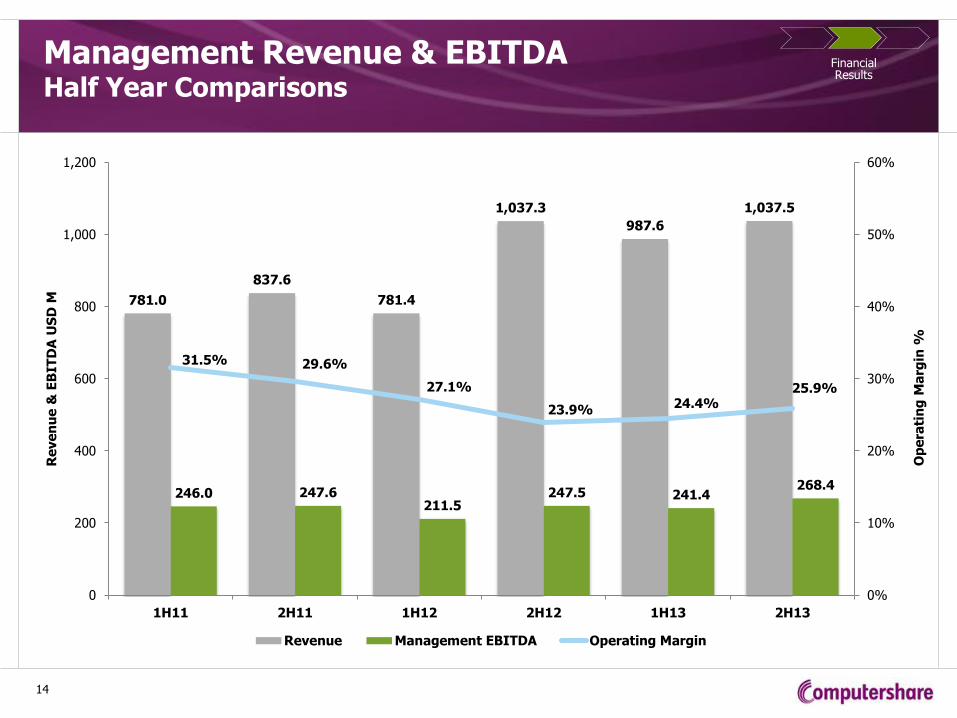
Management Revenue & EBITDA Half Year Comparisons
Financial Results
781.0
837.6
781.4
1,037.3
987.6
1,037.5
246.0 247.6 211.5
247.5 241.4 268.4
31.5% 29.6%
27.1%
23.9% 24.4% 25.9%
0%
10%
20%
30%
40%
50%
60%
0
200
400
600
800
1,000
1,200
1H11 2H11 1H12 2H12 1H13 2H13
Op
era
tin
g M
arg
in %
Re
ve
nu
e &
EB
ITD
A U
SD
M
Revenue Management EBITDA Operating Margin

15
Management Revenue Breakdown Financial Results
Note: all results are in USD M unless otherwise indicated.
Revenue Stream FY 2013 FY 2012
FY 2013 variance
to FY 2012
2H 2013 1H 2013
2H 2012 1H 2012
Register Maintenance $824.1 $774.8 6.4% $429.4 $394.7 $440.6 $334.2
Corporate Actions $169.4 $156.1 8.5% $76.6 $92.8 $88.7 $67.4
Business Services $489.1 $383.0 27.7% $247.3 $241.8 $234.7 $148.3
Stakeholder Relationship Mgt $76.6 $86.8 (11.8%) $45.4 $31.2 $52.2 $34.6
Employee Share Plans $237.1 $197.3 20.1% $124.6 $112.5 $112.3 $85.0
Communication Services $198.1 $182.0 8.8% $99.8 $98.3 $91.7 $90.3
Technology & Other Revenue $30.8 $38.7 (20.3%) $14.5 $16.3 $17.2 $21.5
Total Management Revenue $2,025.1 $1,818.7 11.4% $1,037.5 $987.6 $1,037.3 $781.4

Management Revenue & EBITDA – Regional Analysis Half Year Comparisons
16
Revenue Breakdown EBITDA Breakdown
Financial Results
184.3 180.9 214.1 200.7 232.2 199.7
68.3 57.5 57.1 54.0
59.7 58.3
141.2 162.9 147.9 156.9
150.4 160.2
34.3 58.1 45.1 62.9
41.1 61.8
258.5 266.4
217.7
452.5 407.2 455.3
94.5
111.7
99.4
110.5 97.0
102.2
781.0
837.6
781.4
1,037.3 987.6
1,037.5
0
200
400
600
800
1,000
1,200
1H11 2H11 1H12 2H12 1H13 2H13
US
D M
Australia & NZ Asia UCIA Continental Europe USA Canada
41.6 31.6 31.6 27.2 36.0
18.4
30.8
19.9 19.4 15.0
18.1
18.2
56.8
62.4 60.7 56.9
60.7
72.6
2.2 12.4
3.1 7.4
4.0 12.9
66.2 69.1
43.2
90.2 77.6
102.0
48.4 52.2
53.6
50.8 45.1
44.3
246.0 247.6
211.5
247.5 241.4
268.4
0
50
100
150
200
250
300
1H11 2H11 1H12 2H12 1H13 2H13
US
D M
Australia & NZ Asia UCIA Continental Europe USA Canada
17
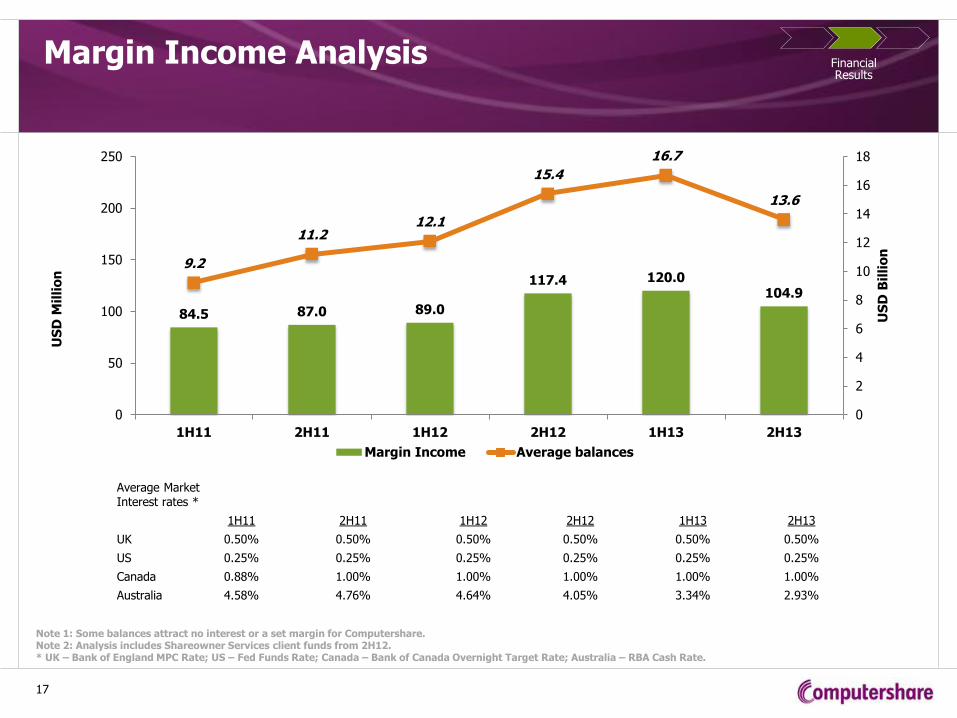
Margin Income Analysis
Average Market Interest rates *
1H11 2H11 1H12 2H12 1H13 2H13
UK 0.50% 0.50% 0.50% 0.50% 0.50% 0.50%
US 0.25% 0.25% 0.25% 0.25% 0.25% 0.25%
Canada 0.88% 1.00% 1.00% 1.00% 1.00% 1.00%
Australia 4.58% 4.76% 4.64% 4.05% 3.34% 2.93%
Financial Results
Note 1: Some balances attract no interest or a set margin for Computershare. Note 2: Analysis includes Shareowner Services client funds from 2H12. * UK – Bank of England MPC Rate; US – Fed Funds Rate; Canada – Bank of Canada Overnight Target Rate; Australia – RBA Cash Rate.
84.5 87.0 89.0
117.4 120.0 104.9
9.2
11.2 12.1
15.4
16.7
13.6
0
2
4
6
8
10
12
14
16
18
0
50
100
150
200
250
1H11 2H11 1H12 2H12 1H13 2H13
US
D B
illi
on
US
D M
illi
on
Margin Income Average balances

18
FY13 Client Balances – Interest Rate Exposure
Average funds (USD 15.2b) held during FY13
Financial Results
No exposure
23% ($3.6b)
Effective
hedging:
natural
6% ($0.9b)
Effective
hedging:
derivative /
fixed rate
27% ($4.0b)
Exposure to
interest rates
44% ($6.6b)
CPU had an average of USD15.2b of client funds under management during FY13. For 23% ($3.6b) of the FY13 average client funds under management, CPU had no exposure to interest rate movements either as a result of not earning margin income, or receiving a fixed spread on these funds. The remaining 77% ($11.6b) of funds were “exposed” to interest rate movements. For these funds: 27% had effective hedging in place (being either derivative or fixed rate deposits). 6% was naturally hedged against CPU’s own floating rate debt.
The remaining 44% was exposed to changes in interest rates.

FY13 Client Balances – Interest Rate Exposure and Currency
19
“Exposed Funds” by Currency (FY13 Average Balances)
Average exposed funds balance net of
hedging US$6.6b
(US$15.2b x 44%)
Average exposed funds balance prior to any
hedging US$11.6b
(US$15.2b x 77%)
Total Exposed Funds (pre hedging)
Non-hedged Exposed Funds
Financial Results
AUD
2% ($0.3b)
CAD
19% ($2.2b)
GBP
28% ($3.3b)
USD
47% ($5.4b)
Other
4% ($0.4b)
AUD
3% ($0.2b)
CAD
30% ($2.0b)
GBP
25% ($1.6b)
USD
37% ($2.5b)
Other
5% ($0.3b)

Client Balances – Forward view of Hedges Fixed Rate Deposits and Derivatives in place at 30 June 2013
20
Financial Results
Policy: Minimum hedge of 25% / Maximum hedge of 100% Minimum term 1 year / Maximum term 5 years (some exceptions permitted under the Board policy) Current Strategy: Continue to monitor medium term swap rates with the intention of accumulating cover should rates rise materially.
0
500
1,000
1,500
2,000
2,500
3,000
3,500
4,000
4,500
Jul-13 Jul-14 Jul-15 Jul-16 Jul-17
Hedging (fixed rate deposits) Hedging (derivatives)
USD
m T
ota
l hedges

21
Total Management Operating Costs Half Year Comparisons
Financial Results
395.4 436.2 437.9
593.4 577.9 572.7
139.6
154.2 132.0
196.8 168.3 196.2
535.1
590.4 569.9
790.2
746.3 768.9
0
100
200
300
400
500
600
700
800
900
1H11 2H11 1H12 2H12 1H13 2H13
US
D M
Controllable Costs (excl COS) Cost of Sales (COS)

22
Management Operating Costs Half Year Comparisons
* Corporate operating costs have been allocated and reported under the five main cost categories – cost of sales, personnel, occupancy, other direct and technology. Technology costs includes personnel, occupancy and other direct costs attributable to technology services.
Financial Results
13
9.6
25
6.1
33
.9
24
.6
80
.7
15
4.2
29
3.4
34
.6
28
.9
79
.3
13
2.0
29
0.4
36
.9
20
.7
89
.9
19
6.8
36
5.9
44
.3
60
.6
12
2.6
16
8.3
36
1.6
39
.2
47
.7
12
9.4
19
6.2
37
3.2
37
.3
30
.3
13
1.9
0
50
100
150
200
250
300
350
400
450
Cost of Sales Personnel Occupancy Other Direct Technology
US
D M
1H11 2H11 1H12 2H12 1H13 2H13

23
Technology Costs Continued Investment to Maintain Strategic Advantage
Financial Results
28.8 26.6 34.7
23.0 31.2 36.7
20.2 23.9 21.8 46.5
48.4
56.6 27.6 26.1
30.5
45.8
44.2 32.4
4.1 2.7
2.9
7.2 5.7 6.2
80.7 79.3
89.9
122.6
129.4 131.9 10.3%
9.5%
11.5% 11.8%
13.1% 12.7%
0%
2%
4%
6%
8%
10%
12%
14%
0
20
40
60
80
100
120
140
160
1H11 2H11 1H12 2H12 1H13 2H13
Te
ch
no
log
y c
osts
as a
% o
f re
ve
nu
e
US
D M
Development Infrastructure Maintenance Admin Technology costs as a % of revenue
24
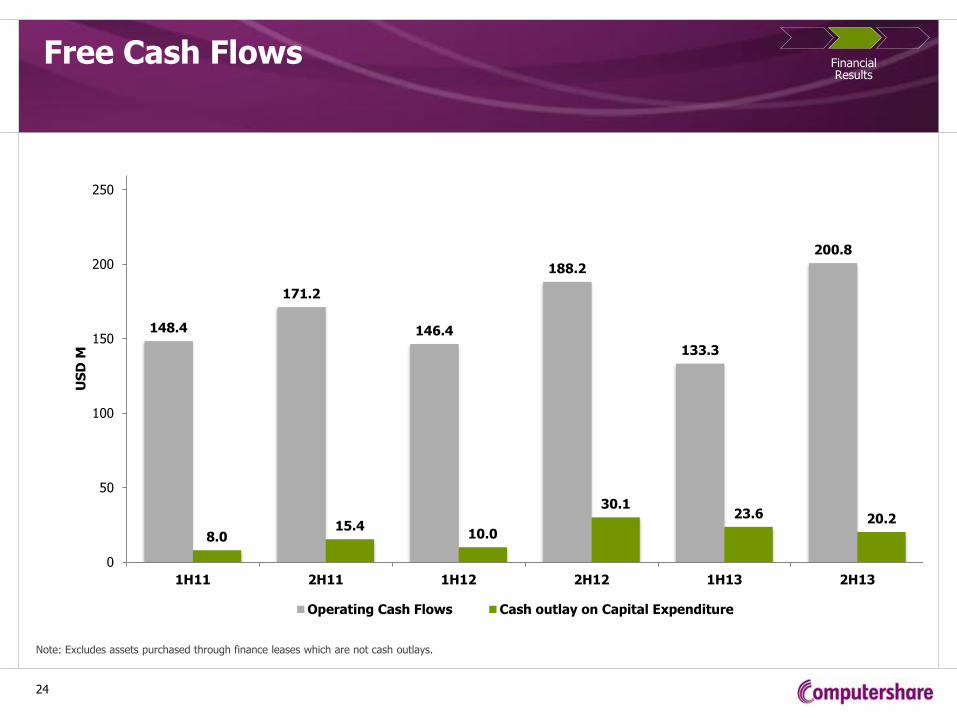
Free Cash Flows
Note: Excludes assets purchased through finance leases which are not cash outlays.
Financial Results
148.4
171.2
146.4
188.2
133.3
200.8
8.0 15.4
10.0
30.1 23.6 20.2
0
50
100
150
200
250
1H11 2H11 1H12 2H12 1H13 2H13
US
D M
Operating Cash Flows Cash outlay on Capital Expenditure

25
FY13 Operating Cash Flows Analysis Financial Results
334.6 334.0
6.0
20.5
15.3
0.3
11.4
300
305
310
315
320
325
330
335
340
345
Net Operating
Cash Flow FY12
Net Receipts &
Payments
Loan Servicing
Advances
Dividends and
Interest received
Interest paid
and otherfinance costs
Income Taxes
paid
Net Operating
Cash Flow FY13
US
D M

26
Balance Sheet as at 30 June 2013 Financial Results
Jun-13 Jun-12 Variance
USD M USD M Jun-13 to Jun-12
Current Assets $982.4 $956.6 2.7%
Non Current Assets $2,636.5 $2,725.0 (3.2%)
Total Assets $3,618.9 $3,681.7 (1.7%)
Current Liabilities $501.3 $550.9 (9.0%)
Non Current Liabilities $1,986.7 $1,976.5 0.5%
Total Liabilities $2,487.9 $2,527.3 (1.6%)
Total Equity $1,130.9 $1,154.3 (2.0%)
See ASX Appendix 4E as at 30 June 2013 for full details. › Current assets increased
mainly due to SLS’ receivables. › Non current assets: goodwill
reduced as a result of disposal of subsidiaries and business closure.
› Total liabilities decreased due to debt reduction.

27
Key Financial Ratios
EBITDA Interest Coverage Net Financial Indebtedness to EBITDA
Financial Results
17.0 15.1
13.2
9.5 7.3 7.7
0
2
4
6
8
10
12
14
16
18
1H11 2H11 1H12 2H12 1H13 2H13
Tim
es
1.42 1.35
2.92 2.86 2.72 2.47
0.0
0.5
1.0
1.5
2.0
2.5
3.0
3.5
1H11 2H11 1H12 2H12 1H13 2H13
Tim
es
Jun-13 USD M
Jun-12 USD M
Variance
Jun-13 to Jun-12
Interest Bearing Liabilities $1,711.7 $1,754.4 (2.4%)
Less Cash ($454.4) ($441.4) 2.9%
Net Debt $1,257.3 $1,313.0 (4.2%)
Management EBITDA $509.8 $459.0 11.1%
Net Financial Indebtedness to EBITDA 2.47 times 2.86 times Down 0.39 times

28
Debt Facility Maturity Profile
Maturity Dates USD M
Debt Committed Bank Private
Placement Drawn Debt Facilities Debt Facility Facility
FY14 FY15 Dec-14 69.2 150.0
Mar-15 124.5 124.5 124.5 FY16 Oct-15 296.0 300.0 300.0 FY17 Oct-16 103.2 250.0 250.0
Mar-17 21.0 21.0 21.0 FY18 Jul-17 248.4 250.0 250.0
Feb-18 40.0 40.0 40.0 FY19 Jul-18 235.0 235.0 235.0
Feb-19 70.0 70.0 70.0 FY22 Feb-22 220.0 220.0 220.0 FY24 Feb-24 220.0 220.0 220.0
TOTAL 1,647.3 1,880.5 800.0 930.5
Note: Average debt facility maturity is 4.8 years as at 30-Jun-13.
Financial Results
69.2
150.0
124.5
21.0
235.0
40.0
70.0
220.0 220.0
296.0
103.2
248.4
300.0
250.0 250.0
0.0
50.0
100.0
150.0
200.0
250.0
300.0
350.0
FY14 FY15 FY16 FY17 FY18 FY19 FY20 FY21 FY22 FY23 FY24
US
D M
SLS Advance Facility drawn SLS Advance Facility USPP Syndicated Debt drawn Syndicated Debt Facility

29
Capital Expenditure vs. Depreciation Financial Results
4.7
14.6 17.2
11.1
6.4
14.6
1.0
4.6
3.9
2.1
2.7
3.8
1.0
2.5
3.2
23.7
12.9
5.6
2.0
1.8
0.9
2.0
1.6
8.7
23.5 24.3
37.8
23.9
25.6
0
5
10
15
20
25
30
35
40
1H11 2H11 1H12 2H12 1H13 2H13
US
D M
Information Technology Communication Services Facilities Occupancy Other Depreciation
Note: 1H13 Depreciation expense has been restated. This is due to a reclass of Finance Leasehold Improvements previously classified as Amortisation.

30
Working Capital Management Financial Results
38
41 42
43
48
45
0
5
10
15
20
25
30
35
40
45
50
1H11 2H11 1H12 2H12 1H13 2H13
No
. o
f D
ays
Days sales outstanding

31
Return On Invested Capital vs. WACC and Return on Equity
Financial Results
* ROIC = (Mgt EBITDA less Depreciation less Income Tax expense)/(Total Debt add Total Equity less Cash).
9.83% 8.61% 8.97%
18.45%
14.37%
15.84%
26.93%
22.34%
25.80%
0%
5%
10%
15%
20%
25%
30%
FY11 FY12 FY13
WACC ROIC ROE

Equity Management Final Dividend of 14 cents (AU)
32
Financial Results
* Based on 12 month dividend and share price of AU$10.15 (close 9th Aug 2013).
EPS - Statutory US 28.25 cents
EPS - Management US 54.85 cents
Interim Dividend AU 14 cents (20% franked)
Final Dividend AU 14 cents (20% franked)
Current Yield* 2.8%

33
Financial Summary – Final Remarks Financial Results
› We continue to experience generally difficult trading conditions across many business lines.
› However, ongoing disciplined expense and capital expenditure management continue to drive solid results and cash flow.
› The Shareowner Services acquisition is now complete with synergy realisation ahead of targets and high levels of confidence of delivering the remainder this year.
› The SLS and Serviceworks acquisitions have both performed well with SLS, in particular, anticipated to be a future growth engine.
› A strategic review of non-core and underperforming assets resulted in the disposal of our Solium investment, IML group and Restricted Stock Services, and the decision to close our Funds Services business in Australia.
› Maintained strong and conservative balance sheet, with DRP adding further flexibility to our funding options.
› Final dividend maintained at AUD 14 cents per share, franked to 20% (down from 60%).
› Total dividends maintained at AUD 28 cents per share, franked to 20% (down from 60%).

34
Introduction Financial Results
CEO’s Report

PRESIDENT & CHIEF EXECUTIVE OFFICER CEO PRESENTATION
Stuart Crosby
CEO’s Report

Group Strategy and Priorities
36
CEO’s Report
Our group strategy remains as it has been:
› Continue to drive operations quality and efficiency through measurement, benchmarking and technology.
› Improve our front office skills to protect and drive revenue.
› Continue to seek acquisition and other growth opportunities where we can add value and enhance returns for our shareholders.
While much of the heavy integration lifting on recent acquisitions is done, we still pursue and track synergy realisation. Nonetheless, our priorities are moving from executing on past transactions to the two things that will best assure our future:
› protecting profitability in our mature businesses; and
› driving growth in businesses that offer that potential, such as loan servicing, utility back office and share plan administration.
We are also giving priority to simplifying the range of businesses we undertake.
Across all our business lines and geographies, we continue to invest in and remain engaged with regulatory developments and market structure change.

37
Delivery against strategy and priorities CEO’s Report
The first two limbs of our strategy (cost & revenue) remain key. Revenue is a defensive game in current conditions. Cost and service highlights include:
› The Shareowner Services business’s off-shore operations capabilities have started to bring meaningful quality benefits and savings across the legacy US TA client base, and are soon to be deployed into other geographies.
› Third party off-shore IT development is supporting a range of our newer projects, offering flexibility in resource commitment as well as cost savings.
› We continue to rate highly in independent service surveys across the world.
On the M&A front, we are spending more time on finding new homes for assets that no longer fit our strategy or that are not otherwise contributing.
We also see a range of potential opportunities to commit capital to grow current business lines. Mostly, these are “bolt-on” opportunities.
Mortgage servicing raises different issues. Here the challenge is to access the working capital needed to grow quickly without diluting returns. It has been met in a range of ways by different market players. We are exploring our options.

Acquisitions update – Shareowner Services
38
CEO’s Report
Cumulative Cost Synergies USD M Cost to Realise Synergies USD M
Expected realisation of synergies
Previous Update Feb-13
Update as at 30 June 2013
FY12 $9.3 $9.3 Previous estimate (Feb-13) $53.5
FY13 $36.0 $35.2 Current estimate $57.5
FY14 $72.8 $77.3 Spent to date $37.4
FY15 $77.8 $79.9 Expected to come $20.1
› While revenues remain softer than originally expected (as with most of our investor services assets around the world), the integration has been very successful, with accompanying client benefits (many major clients re-signed or re-signing).
› All client data migrations on to Computershare systems completed as scheduled.
› Synergy realisation ahead of original expectations.

USA Update CEO’s Report
39
› The US continues to experience historically low interest rates and lower-than-expected merger and acquisition activity.
› The Shareowner Services integration has brought significant synergies across the TA and employee plans business, while retaining the vast majority of clients.
› Continue to win IPOs and competitive tenders, including one of the largest remaining in-house agents, as well as employee plans deals.
› The SLS mortgage servicing business grew as expected; integration with Computershare for shared services and technology is well underway.
› Both the corporate proxy and mutual fund proxy businesses ended the fiscal year well, although the overall market continues to be sluggish.
› KCC restructuring business maintains its market share leadership position; however total bankruptcy filings continue to fall. Class actions business slowly improving market share.

Canada Update
› The TA market continues to be competitive so client retention remains a priority, with good results.
› Corporate Actions remain soft.
› Corporate Trust activity in Structured Finance continues to grow; debt under administration grew by nearly 8%.
› Employee Plans achieved record profitability and continues to prepare for the launch of ESOP services in FY14.
› Communication Services continues to win commercial mandates, however, we also saw some impact of Notice & Access in the 2H FY13.
› Operational costs continue to see year over year reductions driven by lower transactional activity and efficiency programs.
› Working closely with all major market participants in continued market structure debate.
40
CEO’s Report

41
UCIA Update
CEO’s Report
› Integration of the HBOS EES business into the UK plans business is complete and the resources released are now focussed on the European GSPS business acquired from Morgan Stanley. This together with organic growth means that the plans business is performing strongly.
› The tenancy deposit franchise now comprises of two schemes in England and Wales (custodial and insurance) as well as custodial schemes in Scotland and Northern Ireland. The strength of the Private Rented Sector in the UK continues to drive up tenancy deposit volumes.
› Investor Services businesses in the UK, Ireland and South Africa remain solid and have maintained market share. The business in Ireland saw renewed growth in the ETF market and corporate restructuring activity. In all these markets we expect change over the next few years driven by new legislative and regulatory developments.
› The UK Government has announced proposals for a new Childcare Voucher scheme which is expected to launch within the next 18 months. We believe our Voucher Services business is well positioned in the market ahead of the Government publishing its final proposal (to be followed by consultation).

Continental Europe Update
› Despite flat markets in most of Continental Europe, there is renewed IPO activity in some markets – eg, Russia, Denmark and Germany.
› Our Danish business won the only significant IPO since 2010, CPU Germany successfully pitched and won mandates for Siemens, Osram, Telefonica, and Evonik.
› After acquiring the remaining 20% stake of NRC, we bought the leading registrar in the St. Petersburg region from Interros group. Technology integration is complete, and staff and premises rationalisation well progressed.
› Whilst the Southern European markets in general were flat, our Italian business (Servizio Titoli) had another strong year and Corporate Proxy in Southern Europe had a better second half.
› We continue to look for growth opportunities in an uncertain market environment. Market pressure on traditional owners of issuer services businesses (mainly banks) is increasing, potentially creating opportunities for CPU. But it is a long game.
42
CEO’s Report

43
Asia Update
CEO’s Report
› HK IPO activity was subdued in FY2013. The pipeline is still healthy so with a recovery in market sentiment these deals will come through. However we’ve been waiting for some time.
› Other corporate action activity has been subdued due to market uncertainty, but there is some recent rights issue activity.
› Registry revenues remain stable.
› Employee Plans and Proxy businesses in Hong Kong and China continue with healthy growth in both mandates and revenue. The new AGM administration business in China continues to win clients.
› In India a small number of IPOs have got away while the improvement in stock market performance boosted the AUM and therefore fees for the mutual fund services business.

44
Australia & New Zealand Update
CEO’s Report
› Our Australian Investor Services business maintained its market leading position and was again rated number one in the Australian Registry Services Provider survey.
› Despite subdued markets we had significant corporate action wins – News Corp demerger, Woolworths/SCA demerger, Virgin Australia’s takeover of Skywest.
› The NZ business had a strong year working on the successful Fonterra and Mighty River Power listings.
› Communication Services continue to build on inbound communications opportunities. We acquired continuous colour printing capability in our Queensland market to complement that existing in Victoria and NSW.
› The Plan Managers business experienced another year of growth.
› The Serviceworks integration is complete. The Australian business experienced revenue growth while we continued to develop our US presence.
› In May 2013 we announced our exit from the unlisted unit registry market.
› Quality and service remain excellent across all our businesses.

Computershare Limited
Full Year Results 2013 Presentation
Stuart Crosby Mark Davis 14 August 2013

46
Appendix:
Full Year Results 2013 Presentation
14 August 2013
47
Group Comparisons
Appendix 1: Group Comparisons

Management Revenue Half Year Comparisons
48
Financial Results
42% 44% 43% 42% 40% 41%
12% 10% 9% 9%
9% 7%
17% 16% 19% 23% 24% 24%
5% 7% 4%
5% 3% 4%
9% 10% 11%
11% 11% 12%
11% 10% 12% 9% 10% 10%
3% 3% 3% 2% 2% 1%
0%
10%
20%
30%
40%
50%
60%
70%
80%
90%
100%
1H11 2H11 1H12 2H12 1H13 2H13
Register Maintenance Corporate Actions Business Services Stakeholder Relationship M'ment Employee Share Plans Communication Services Tech & Other Revenue

49
Management Revenue by Product Half Year Comparisons
Financial Results
330.8 367.7 334.2
440.6 394.7
429.4
96.8 82.7
67.4
88.7
92.8 76.6
131.2 134.9
148.3
234.7 241.8
247.3
39.5 57.6
34.6
52.2
31.2 45.4
74.0
83.6
85.0
112.3
112.5
124.6
84.7
87.5
90.3
91.7
98.3
99.8
24.1
23.6
21.5
17.2
16.3
14.5
781.0
837.6
781.4
1,037.3
987.6
1,037.5
0
200
400
600
800
1,000
1,200
1H11 2H11 1H12 2H12 1H13 2H13
US
D M
Register Maintenance Corporate Actions Business Services Stakeholder Relationship M'ment Employee Share Plans Communication Services Tech & Other Revenue

50
Management Revenue Half Year Comparisons
Financial Results
33
0.8
96
.8 13
1.2
39
.5 74
.0
84
.7
24
.1
36
7.7
82
.7
13
4.9
57
.6
83
.6
87
.5
23
.6
33
4.2
67
.4
14
8.3
34
.6
85
.0
90
.3
21
.5
44
0.6
88
.7
23
4.7
52
.2
11
2.3
91
.7
17
.2
39
4.7
92
.8
24
1.8
31
.2
11
2.5
98
.3
16
.3
42
9.4
76
.6
24
7.3
45
.4
12
4.6
99
.8
14
.5
0
50
100
150
200
250
300
350
400
450
500
RegisterMaintenance
Corporate Actions Business Services StakeholderRelationship
M'ment
Employee SharePlans
CommunicationServices
Tech & OtherRevenue
US
D M
1H11 2H11 1H12 2H12 1H13 2H13

51
FY 2013 Management Revenue Regional Analysis
Financial Results
13
9.1
36
.9
80
.6
2.2
27
.4
14
0.4
5.3
53
.7
11
.3 39
.1
4.6
8.7
0.0
0.6
10
2.5
9.6
66
.8
3.0
11
8.7
4.8
5.2
57
.6
4.9
3.3
10
.9
1.2
20
.3
4.7
39
3.7
86
.7
22
3.7
53
.9
64
.9
27
.3
12
.3
77
.5
20
.0
75
.5
1.9
16
.2
5.3
2.8
0
50
100
150
200
250
300
350
400
450
Register
Maintenance
Corporate
Actions
Business
Services
Stakeholder
RelationshipM'ment
Employee Share
Plans
Communication
Services
Tech & Other
Revenue
US
D M
ANZ Asia UCIA CEU USA Canada

52
Effective Tax Rate - Statutory & Management Financial Results
27.0%
22.3%
16.6%
25.6% 25.1%
22.6%
0%
5%
10%
15%
20%
25%
30%
FY11 FY12 FY13
Ta
x R
ate
%
Statutory Management
The Group’s effective statutory tax rate is 16.6% for the year ended 30 June 2013. The Group’s effective statutory tax rate for the comparative prior period was 22.3%. This reflects the full year impact of increased deductible interest expense, intangible asset amortisation and integration costs in the US as a result of its major acquisitions (which were debt funded) during FY12. Consequently, the US is in a tax loss position in FY13 which has a decreasing effect on the Group’s overall effective tax rate.

53
Country Summaries
Appendix 2: Country Summaries

54
Australia Half Year Comparison
Financial Results
80.0
21.5
1.8
3.2
9.6
72.4
4.1
59.9
24.2
1.5
3.1
10.0
61.6
7.0
74.7
17.2
20.4
1.8
11.8
67.8
4.4
56.5
16.3
35.3
0.9
12.6
63.9
2.5
71.0
18.3
38.8
1.4
13.7
71.9
3.2
55.7
14.1
39.2
0.8
12.9
64.5
1.9
0
10
20
30
40
50
60
70
80
90
RegisterMaintenance
CorporateActions
BusinessServices
StakeholderRelationship
M'ment
EmployeeShare Plans
CommunicationServices
Tech & OtherRevenue
AU
D M
Revenue Breakdown
1H11 2H11 1H12 2H12 1H13 2H13
192.6
167.4
198.1
187.9
218.3
189.0
0
50
100
150
200
250
1H11 2H11 1H12 2H12 1H13 2H13
AU
D M
Total Revenue

55
Hong Kong Half Year Comparison
Financial Results
147.9
172.0
0.6
7.1
0.0
153.8
62.4
0.4
3.0
14.5
157.7
72.5
3.3
4.4
16.0
159.4
46.2
3.8
1.3
16.1
156.6
40.3
2.9
4.5
20.8
160.8
36.5
4.3
2.0
28.0
0
20
40
60
80
100
120
140
160
180
200
Register Maintenance Corporate Actions Business Services StakeholderRelationship M'ment
Employee Share Plans
HK
D M
Revenue Breakdown
1H11 2H11 1H12 2H12 1H13 2H13
327.6
234.1
253.9
226.8
225.0
231.7
0
50
100
150
200
250
300
350
400
1H11 2H11 1H12 2H12 1H13 2H13
HK
D M
Total Revenue
56
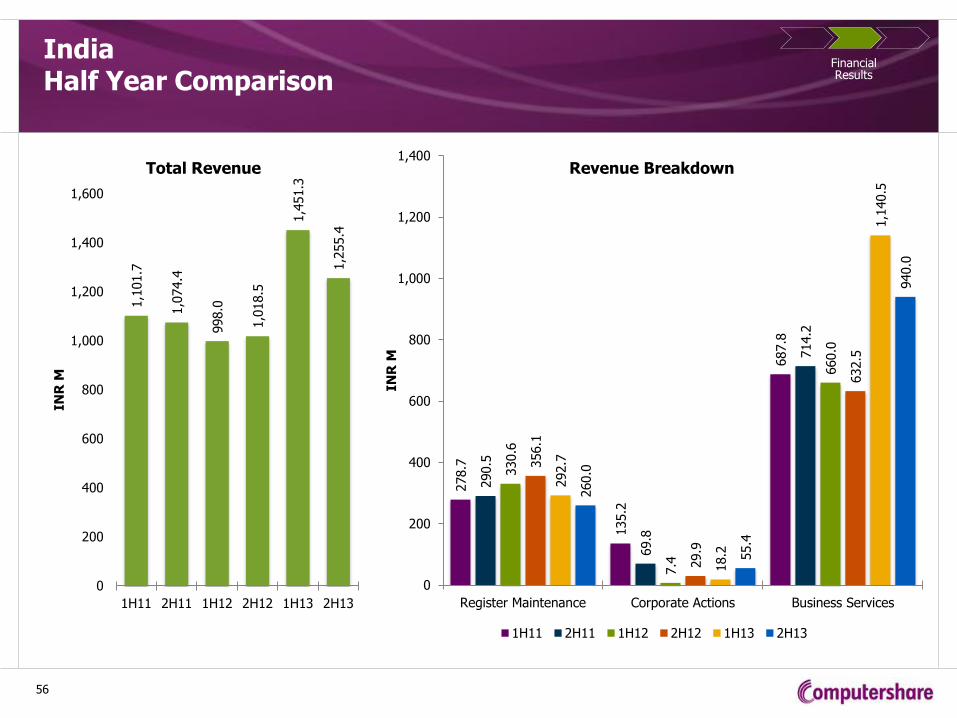
India Half Year Comparison
Financial Results
278.7
135.2
687.8
290.5
69.8
714.2
330.6
7.4
660.0
356.1
29.9
632.5
292.7
18.2
1,1
40.5
260.0
55.4
940.0
0
200
400
600
800
1,000
1,200
1,400
Register Maintenance Corporate Actions Business Services
INR
M
Revenue Breakdown
1H11 2H11 1H12 2H12 1H13 2H13
1,1
01.7
1,0
74.4
998.0
1,0
18.5
1,4
51.3
1,2
55.4
0
200
400
600
800
1,000
1,200
1,400
1,600
1H11 2H11 1H12 2H12 1H13 2H13
INR
M
Total Revenue
57
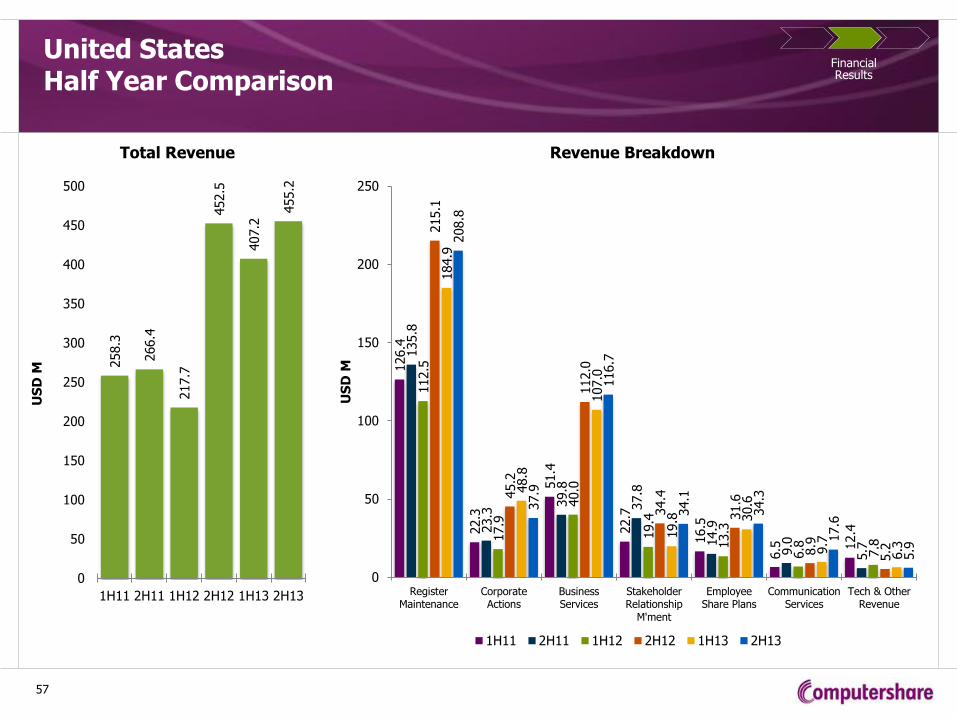
United States Half Year Comparison
Financial Results
126.4
22.3
51.4
22.7
16.5
6.5
12.4
135.8
23.3
39.8
37.8
14.9
9.0
5.7
112.5
17.9
40.0
19.4
13.3
6.8
7.8
215.1
45.2
112.0
34.4
31.6
8.9
5.2
184.9
48.8
107.0
19.8
30.6
9.7
6.3
208.8
37.9
116.7
34.1
34.3
17.6
5.9
0
50
100
150
200
250
RegisterMaintenance
CorporateActions
BusinessServices
StakeholderRelationship
M'ment
EmployeeShare Plans
CommunicationServices
Tech & OtherRevenue
US
D M
Revenue Breakdown
1H11 2H11 1H12 2H12 1H13 2H13
258.3
266.4
217.7
452.5
407.2
455.2
0
50
100
150
200
250
300
350
400
450
500
1H11 2H11 1H12 2H12 1H13 2H13
US
D M
Total Revenue

58
Canada Half Year Comparison
Financial Results
37.0
13.0
36.3
1.5
7.2
1.7
1.1
48.3
12.2
36.1
1.6
8.5
1.9
0.5
37.8
12.3
36.8
1.1
7.6
2.0
1.0
46.7
11.0
38.1
2.2
8.6
2.3
1.3
34.8
10.6
38.7
1.0
7.8
2.6
1.4
43.2
9.5
37.2
1.0
8.5
2.7
1.4
0
10
20
30
40
50
60
RegisterMaintenance
CorporateActions
BusinessServices
StakeholderRelationship
M'ment
Employee SharePlans
CommunicationServices
Tech & OtherRevenue
CA
D M
Revenue Breakdown
1H11 2H11 1H12 2H12 1H13 2H13
97.7
109.0
98.6
110.2
96.9
103.5
90
95
100
105
110
115
1H11 2H11 1H12 2H12 1H13 2H13
CA
D M
Total Revenue

59
United Kingdom & Channel Islands Half Year Comparison
Financial Results
20.2
7.1
17.2
1.7
24.2
1.1
1.9
19.9
5.8
23.2
2.6
27.0
1.5
1.9
19.7
2.5
20.7
1.4
28.7
1.1
2.0
21.0
2.8
19.2
2.2
33.6
1.6
2.1
20.1
2.3
20.5
0.6
33.7
1.4
1.3
21.5
2.4
20.5
0.9
39.6
1.7
1.3
0
5
10
15
20
25
30
35
40
45
RegisterMaintenance
CorporateActions
BusinessServices
StakeholderRelationship
M'ment
Employee SharePlans
CommunicationServices
Tech & OtherRevenue
GB
P M
Revenue Breakdown
1H11 2H11 1H12 2H12 1H13 2H13
73.5
82.0
76.1
82.5
79.8
87.8
0
10
20
30
40
50
60
70
80
90
100
1H11 2H11 1H12 2H12 1H13 2H13
GB
P M
Total Revenue

60
South Africa Half Year Comparison
Financial Results
109.9
6.3
3.3
0.4
7.8
118.4
2.5
2.4
0.3
9.0
117.7
2.6
2.3
0.5
7.2
123.6
3.8
2.6
0.4
7.5
128.1
3.5
2.9
0.3
7.8
121.7
5.4
3.4
0.3
7.1
0
20
40
60
80
100
120
140
RegisterMaintenance
CorporateActions
BusinessServices
StakeholderRelationship
M'ment
EmployeeShare Plans
RA
ND
M
Revenue Breakdown
1H11 2H11 1H12 2H12 1H13 2H13
127.7
132.6
130.3
138.0
142.5
144.5
115
120
125
130
135
140
145
150
1H11 2H11 1H12 2H12 1H13 2H13
RA
ND
M
Total Revenue

61
Germany Half Year Comparison
Financial Results
2.2
1.7
0.0
5.5
0.2
6.0
1.3
10.9
1.2
0.3
3.0
0.2
7.0
1.7
2.1
1.4
0.3
3.5
0.1
6.2
1.2
10.4
2.2
0.4
4.8
0.2
8.4
0.8
2.3
1.7
0.3
3.4
0.1
7.4
0.8
11.6
2.1
0.4
2.0
0.1
8.4
1.1
0
2
4
6
8
10
12
14
RegisterMaintenance
CorporateActions
BusinessServices
StakeholderRelationship
M'ment
EmployeeShare Plans
CommunicationServices
Tech & OtherRevenue
EU
R M
Revenue Breakdown
1H11 2H11 1H12 2H12 1H13 2H13
16.8
24.2
14.8
27.1
16.0
25.7
0
5
10
15
20
25
30
1H11 2H11 1H12 2H12 1H13 2H13
EU
R M
Total Revenue

62
Russia Half Year Comparison
Financial Results
29
3.2
17
.7
1.2
37
1.3
26
.8
4.0
39
3.5
25
.0
0.0
34
0.1
23
.3
0.0
35
3.3
20
.5
0.0
36
7.2
17
.7
0.0
0
50
100
150
200
250
300
350
400
450
Register Maintenance Business Services Stakeholder
Relationship M'ment
RU
B M
Revenue Breakdown
1H11 2H11 1H12 2H12 1H13 2H13
312.1
402.1
418.5
363.4
373.8
421.2
0
100
200
300
400
500
600
1H11 2H11 1H12 2H12 1H13 2H13
RU
B M
Total Revenue

63
Assumptions
Appendix 3: Assumptions Financial Results

64
Assumptions: FY 2013 Exchange Rates
Average exchange rates used to translate profit and loss to US dollars
USD 1.0000
AUD 0.9712
HKD 7.7561
NZD 1.2180
INR 54.6508
CAD 1.0063
GBP 0.6372
EUR 0.7752
RAND 8.7774
RUB 31.2246
AED 3.6730
DKK 5.7777
SEK 6.6043
Financial Results