computer usage questionnaire: structure, correlates, and gender differences
TRANSCRIPT
Computers in Human Behavior 27 (2011) 899–904
Contents lists available at ScienceDirect
Computers in Human Behavior
journal homepage: www.elsevier .com/locate /comphumbeh
Computer usage questionnaire: Structure, correlates, and gender differences
Ulrich Schroeders ⇑, Oliver WilhelmHumboldt-Universität zu Berlin, 10099 Berlin, Germany
a r t i c l e i n f o
Article history:Available online 18 December 2010
Keywords:Computer usageComputer experienceQuestionnaireGender differences
0747-5632/$ - see front matter � 2010 Elsevier Ltd. Adoi:10.1016/j.chb.2010.11.015
⇑ Corresponding author. Address: Institute of PsychoEssen, Berliner Platz 6-8, 45127 Essen, Germany. Tel+49 (0)201 183 7021.
E-mail addresses: [email protected], ulin.de (U. Schroeders).
a b s t r a c t
Computer usage, computer experience, computer familiarity, and computer anxiety are often discussedas constructs potentially compromising computer-based ability assessment. After presenting and dis-cussing these constructs and associated measures we introduce a brief new questionnaire assessing com-puter usage. The self-report measure consists of 18 questions asking for the frequency of differentcomputer activities and software usage. Participants were N = 976 high school students who completedthe questionnaire and several covariates. Based on theoretical considerations and data driven adjust-ments a model with a general computer usage factor and three nested content factors (Office, Internet,and Games) is established for a subsample (n = 379) and cross-validated with the remaining sample(n = 597). Weak measurement invariance across gender groups could be established using multi-groupconfirmatory factor analysis. Differential relations between the questionnaire factors and self-reportscales of computer usage, self-concept, and evaluation are reported separately for females and males.It is concluded that computer usage is distinct from other behavior oriented measurement approachesand that it shows a diverging, gender-specific pattern of relations with fluid and crystallized intelligence.
� 2010 Elsevier Ltd. All rights reserved.
1. Introduction
In order to capitalize on the promising possibilities of computer-based ability measurement, such as enriching test material with vid-eos and interactive elements (Drasgow & Mattern, 2006), there is atrend to transfer paper-based ability measures to computers. Inthe course of this transition, a major concern is to ensure compara-bility of data gathered on different test media. In the last decades,several factors contributing to differences in performance across testmedia have been discussed and identified (Leeson, 2006). Some ofthese factors primarily deal with the specific hardware or softwarerealization such as screen size and resolution (Bridgeman, Lennon,& Jackenthal, 2003). Other factors of performance differences acrosstest media are person centered. For example, the individual differ-ences in coping with the demands of computerized testing have beeninvestigated intensely (McDonald, 2002).
Examples of such persons’ characteristics are computer anxiety(see Chua, Chen, & Wong, 1999; LaLomia & Sidowski, 1993), com-puter-related attitudes (see LaLomia & Sidowski, 1991), computerexperience (see Potosky & Bobko, 1998) or computer usage.
In this paper, we want to focus on computer usage (CU) definedas the frequency and duration of specific computer activities. CU is
ll rights reserved.
logy, University of Duisburg-.: +49 (0)201 183 7023; fax:
of particular interest, because different concepts such as computer-related cognitions, emotions, and situational factors will all be re-flected in the use of computers. For example, a person with limitedaccess to computers may be at a disadvantage in computerizedtesting, while another person’s negative attitudes towards comput-ers could worsen or invalidate performance data. However, on abehavioral level both persons will scarcely engage with computerseven though the reasons are quite different. This conceptualizationof CU is closely correlated to the concept of computer experience asa conglomerate of motor skills, technology-related knowledge andaptitude, and motivational aspects (Potosky & Bobko, 1998). In ouropinion, the lack of experience – caused by a lack of computerusage – can be conceived as a mediating and decisive constructin explaining differences in performance data across test media.
A further reason to investigate CU is that some of the abovementioned computer-related constructs are difficult to defineand to measure. For instance, which construct is tapped by degreesof endorsement to a statement such as ‘‘I feel like a fool when I amusing a computer and others are around’’? The ambiguity exempli-fied by this item taken from the CAAFI (Computer Aversion, Atti-tudes, and Familiarity Index; Schulenberg, Yutrzenka, & Gohm,2006) is not unique and similar items can be found in other ques-tionnaires easily. Endorsement to the above statement could beconsidered to indicate computer aversion, negative attitudes to-wards computers, low computer-self-esteem, or high fear of com-puter-related social evaluation. Accordingly, measures assessingsuch constructs lack convergent and discriminant validity. One ini-tial empirical step in establishing construct validity is to show that
900 U. Schroeders, O. Wilhelm / Computers in Human Behavior 27 (2011) 899–904
a new measure actually reflects a new construct. Testing for nov-elty of a construct requires evidence showing that a construct isboth different from a single established construct and from combi-nations of various established constructs as well. Losing sight ofthe possibility that a supposedly new construct is actually a famil-iar one under disguise is known as Jangle fallacy (Kelley, 1927;Wilhelm, 2009). The construct CU – operationalized as the extendsomeone is engaged with specific computer programs and activi-ties – is clearly defined and could easily be assessed. This concep-tualization of CU is neither a prototypical self-report becauseparticipants are not asked to express their agreement or disagree-ment. Nor is the CU questionnaire a prototypical ability measurewhere participants are asked to do their best on a cognitive taskto reach a well-specified response standard (Cronbach, 1949). In-stead CU is behavior-based by asking how frequently computersare used for specific purposes. Obviously, such behavior-basedmeasures do not ask about perceived causes of a specific behavior.
1.1. Research questions
The new questionnaire focuses on the behavioral aspect of com-puter usage. More precisely, it relies on how frequently specificsoftware packages are used and how often specific computer activ-ities are carried out. We hypothesize that CU is not a unidimen-sional construct, and that salient groups (notably, females vs.males) might use computer technology for different purposes.Therefore, a description of factors of computer usage might varyacross gender groups. Bearing in mind the potentially qualitativedifference of CU across gender it is relevant to examine how CUis related to measures inquiring about computer-related attitudesor self-concept. Furthermore, the relationship to biographical factsof CU such as the overall time spent with computers is of interest.
More formally, our research questions are as follows: First, canwe establish a measurement model of the computer usage ques-tionnaire (CUQ) with a general CU factor and a variety of nestedfactors assessing special content domains? Second, are there qual-itative differences between gender groups? The answer to thisquestion includes testing the established model for measurementinvariance across gender groups as tested by multi-group confir-matory factor analysis. Third, we claim that the general CU factorcannot be explained through variables such as (a) time of computerusage (both as hours per week and years since first use of a com-puter), (b) access to computers (at school, at home, etc.), (c) num-ber of electronic devices at one’s disposal, (d) self-perceivedcomputer expertise, and (e) a cognitive appraisal of computers.Fourth, we want to check for differential relations between factorsof the CU questionnaire and both fluid and crystallized intelligence– if necessary separately for females and males – to gain further in-sight into the measured concept.
2. Method
2.1. Participants
Participants were 976 German high school students (intermedi-ate-track Realschule and academic-track Gymnasium, 9th and 10thgrade) who worked on a German version of the CUQ and all covar-iates. The mean age of participants was 15.9 years (SD = .71) and493 were females.
2.2. Measures
The CUQ (see Appendix A) is composed of two sets of questionsasking for the frequency of usage of applications (‘‘How often doyou use word processing software (e.g., Word)’’?) or the frequency
of special activities (‘‘How often do you surf the Internet?’’). Theanswer had to be given on a five-point rating scale with the cate-gories never, rarely, sometimes, often, and very often.
Additional information about the average number of hours perweek and overall years of computer experience, access to comput-ers (e.g., in school or at home), and the number of different com-puter devices used (e.g., Playstation/X-Box/Wii or Computer/Laptop) is inquired. Participants were also asked to express theirdegree of consent with ten statements covering self-concept ofcomputer skills (e.g., ‘‘In comparison to my contemporaries mycomputer skills are superior’’) and evaluation of computers (e.g.,‘‘The significance of computers is nowadays heavily overrated’’).
A newly developed measure for fluid and crystallized intelli-gence was implemented as well (BEFKI; Wilhelm, Schroeders, &Schipolowski, 2009). To assess fluid intelligence we used Char-kow-style items because the figural content has been postulatedto be a prototypical fluid intelligence task (Horn & Cattell, 1966).The test for crystallized intelligence is a test of declarative knowl-edge covering three broad content domains (natural sciences,humanities, and civics) with a total of 64 multiple-choice items.
2.3. Design/procedure
The questionnaire and all covariates were included in two com-puter-based studies assessing language proficiency in English as aforeign language. In study 1, all participants (n = 379) worked on acomputerized version of the questionnaire, whereas in study 2 thetest medium was randomly assigned to participants (n = 597). Thetwo studies were different with respect to the tasks assessing lan-guage proficiency but identical with respect to all the covariatesconsidered here. Given the fact that we had no prior experiencewith the CUQ we allowed for data driven modifications in the mea-surement model we proposed. These modifications were intro-duced for study 1 and replicated with the second sample. Allanalyses subsequent to establishing the measurement model arebased on the total sample of N = 976 participants. Missing valueswere imputed with an Expectation–Maximization algorithm.
3. Results
This results section has four parts corresponding to our researchquestions. First, we look at competing measurement models for theCU self-reports. Second, we test for qualitative differences betweengender groups using multi-group confirmatory factor analysis.Third, we explore how the CUQ correlates with related constructs.Fourth, we check for differential relations between the factors ofthe CUQ and intelligence.
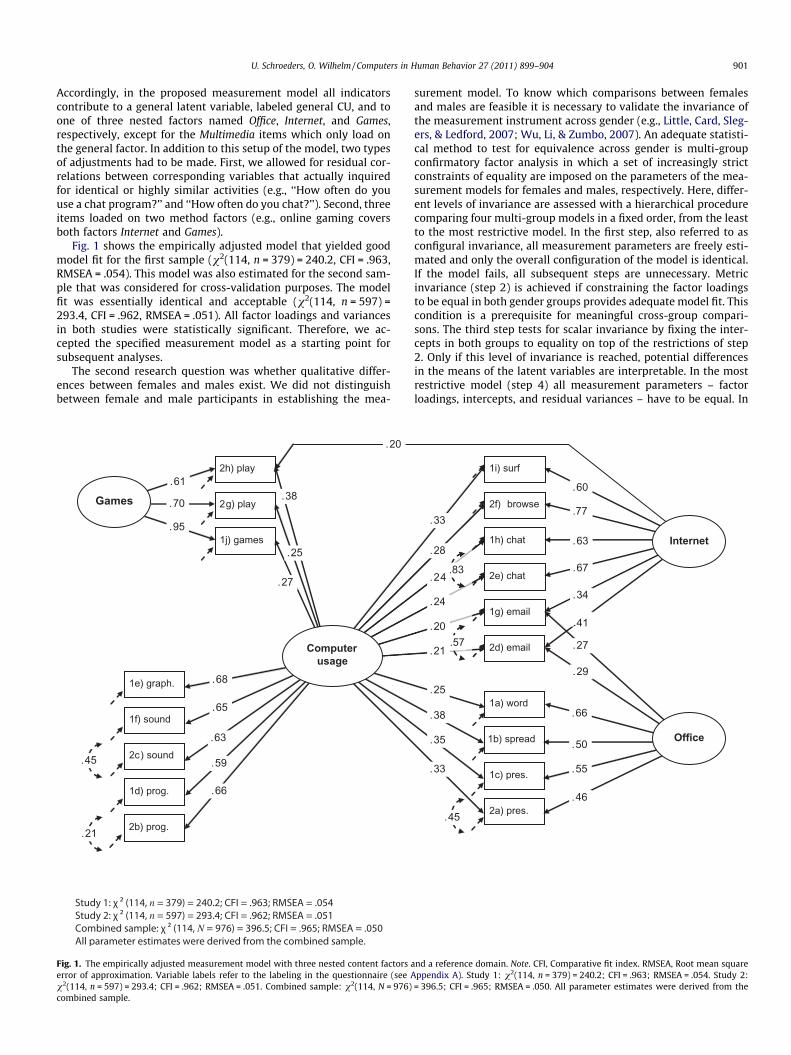
Let us now turn to the competing measurement models. We ex-pected that the use of computers expresses the interests or obliga-tions of computer users. Some users might be obligated to workwith spreadsheets, others take an interest in editing the snapshotsof their last summer holiday. Some computer activities and thecorresponding changes in expertise may be more desirable thanothers (e.g., programming vs. gaming). Nevertheless, four broadcategories seemed sufficient to describe the scope of computeractivities inquired in the questionnaire: (a) using classical officeproducts (e.g., word and spreadsheet processing), (b) activitiesinvolving the Internet (e.g., chatting), (c) gaming, and (d) advancedcomputer activities, mostly multimedia (e.g., sound editing). Oneway to capture the expected structure of the questionnaire wasto specify a model with a general factor and three additional fac-tors, each representing a different content domain. The contentfactors – Office, Internet, and Games – were orthogonal to the gen-eral factor and to each other. The factor Multimedia was set as ref-erence because it seemed to prototypically instantiate CU.
U. Schroeders, O. Wilhelm / Computers in Human Behavior 27 (2011) 899–904 901
Accordingly, in the proposed measurement model all indicatorscontribute to a general latent variable, labeled general CU, and toone of three nested factors named Office, Internet, and Games,respectively, except for the Multimedia items which only load onthe general factor. In addition to this setup of the model, two typesof adjustments had to be made. First, we allowed for residual cor-relations between corresponding variables that actually inquiredfor identical or highly similar activities (e.g., ‘‘How often do youuse a chat program?’’ and ‘‘How often do you chat?’’). Second, threeitems loaded on two method factors (e.g., online gaming coversboth factors Internet and Games).
Fig. 1 shows the empirically adjusted model that yielded goodmodel fit for the first sample (v2(114, n = 379) = 240.2, CFI = .963,RMSEA = .054). This model was also estimated for the second sam-ple that was considered for cross-validation purposes. The modelfit was essentially identical and acceptable (v2(114, n = 597) =293.4, CFI = .962, RMSEA = .051). All factor loadings and variancesin both studies were statistically significant. Therefore, we ac-cepted the specified measurement model as a starting point forsubsequent analyses.
The second research question was whether qualitative differ-ences between females and males exist. We did not distinguishbetween female and male participants in establishing the mea-
.21
1e) graph.
1f) sound
2c) sound
1d) prog.
2b) prog.
.65
.63
.59
.68
.66
.45
2g) play
1j) games
2h) play.61
.95
.70Games .38
.25
.27
.20
Computer usage
Fig. 1. The empirically adjusted measurement model with three nested content factors aerror of approximation. Variable labels refer to the labeling in the questionnaire (see Av2(114, n = 597) = 293.4; CFI = .962; RMSEA = .051. Combined sample: v2(114, N = 976)combined sample.
surement model. To know which comparisons between femalesand males are feasible it is necessary to validate the invariance ofthe measurement instrument across gender (e.g., Little, Card, Sleg-ers, & Ledford, 2007; Wu, Li, & Zumbo, 2007). An adequate statisti-cal method to test for equivalence across gender is multi-groupconfirmatory factor analysis in which a set of increasingly strictconstraints of equality are imposed on the parameters of the mea-surement models for females and males, respectively. Here, differ-ent levels of invariance are assessed with a hierarchical procedurecomparing four multi-group models in a fixed order, from the leastto the most restrictive model. In the first step, also referred to asconfigural invariance, all measurement parameters are freely esti-mated and only the overall configuration of the model is identical.If the model fails, all subsequent steps are unnecessary. Metricinvariance (step 2) is achieved if constraining the factor loadingsto be equal in both gender groups provides adequate model fit. Thiscondition is a prerequisite for meaningful cross-group compari-sons. The third step tests for scalar invariance by fixing the inter-cepts in both groups to equality on top of the restrictions of step2. Only if this level of invariance is reached, potential differencesin the means of the latent variables are interpretable. In the mostrestrictive model (step 4) all measurement parameters – factorloadings, intercepts, and residual variances – have to be equal. In
. .57
.83
1i) surf
2f) browse
2e) chat
1h) chat
1g) email
2d) email
Internet
.60
.77
.63
.67
.34
.41
.33
.28
.24
.24
.20
.21
1a) word
1c) pres.
2a) pres.
1b) spread
.45
.27
.66
.50
.55
.46
.29
.25
.38
.35
.33
Office
nd a reference domain. Note. CFI, Comparative fit index. RMSEA, Root mean squareppendix A). Study 1: v2(114, n = 379) = 240.2; CFI = .963; RMSEA = .054. Study 2:
= 396.5; CFI = .965; RMSEA = .050. All parameter estimates were derived from the
Table 1Invariance testing across gender groups with the total sample.
Step Model v2 df CFIa RMSEAb RDRc
1 Configural invariance 517.1 229 .963 .051 –2 Metric invariance 633.1 259 .951 .054 .0543 Scalar invariance 752.1 273 .938 .060 .0884 Strict factorial invariance 910.9 295 .920 .065 .080
Note. Reported RDR values (Browne & DuToit, 1992) relate the model fit of twosuccessive models. N = 976.
a Comparative fit index.b Root mean square error of approximation.c Root deterioration per restriction ðRDR ¼
ffiffiffiffiffiffiffiffiffiffiffiffiffiffiffiDv2�Ddf
Ddf �N
qÞ.
902 U. Schroeders, O. Wilhelm / Computers in Human Behavior 27 (2011) 899–904
this case of strict factorial invariance, the measurement acrossgroups is not biased in any way and identical in terms of validityand reliability of the construct captured by the latent variables.During the computation of the configural multi-group confirma-tory factor analyses a so-called ultra-Heywood case occurred. Thisproblem was fixed by constraining the residual variance of oneitem to zero in the male group. Table 1 shows the result of theinvariance testing procedure.
All models are nested within the previous ones, so that changesin model fit can be tested with a likelihood-ratio-v2-difference-test(Bollen, 1989). There is a constant decline in model fit over the dif-ferent stages of invariance testing as evident in rising v2 values.This decline has to be evaluated with respect to the gain in degreesof freedom, requiring additional fit indices such as the root deteri-oration per restriction (RDR, Browne & DuToit, 1992). The RDR re-scales the deterioration in model fit onto an RMSEA metric whichmeans that cut-off values below .06 indicate not to reject thehypothesized model (Hu & Bentler, 1999). For the present compar-isons of model fit the RDR seems more appropriate than the samplesize sensitive likelihood-ratio-v2-difference-test because the RDRaccounts for the complexity of the model.
Measurement models for both gender groups were invariant upto the metric level (v2 = 633.1, df = 259, CFI = .951, RMSEA = .054,RDR = .054). This result has three implications (see Cheung &Rensvold, 2002; Horn & McArdle, 1992). First, because the residualvariances were different in both groups the accuracy of measure-ment was different. That is, the reliability of items, parts of the testor the whole test was unequal. Second, correlations of the ques-tionnaire with criteria could be compared between the gendergroups on a latent level. Third, comparisons of latent means be-tween groups were not admissible on this level of invariance.
Table 2Correlations of the questionnaire scales with related and unrelated constructs.
CU Internet
Female Male Female
Time .19** .25** .41**0
Opportunity to use .18** .19** .14**
Number of elec. devices .24** .20** .11*
Computer experiencea .58** .67** .18**
Cog. appraisal of PCs .28** .25** .60**#
Fluid intelligence �.25** �.07 .07Crystalized intelligenceb �.16* �.14* .08
Note. All analyses were computed with Mplus 5.21 (Muthén & Muthén, 2009). Each covfactor loading are constrained to be equal across groups. For all structure models the maxwere based on the weighted least squares estimator (WLSM) for categorical data (Finneyitalicised and additionally marked to indicate level of significance: # for p < .01 and 0 p <estimated model vs. the model in which the correlation is fixed to equality; for the gf–gc-mN = 976.
* p < .05.** p < .01.
a Self-perceived computer experience.b Gc is modeled without the content domain technology to avoid possible confoundin
The third and fourth research questions dealt with the relation-ship between the CUQ factors and the covariates. More precisely,the third research question asked to what extend individual differ-ences in CUQ factors can be accounted for by the following com-puter-related variables: (a) time of computer usage (both ashours per week and years since first use of a computer), (b) accessto computers (at school, at home, etc.), (c) number of electronic de-vices at one’s disposal, (d) self-perceived computer expertise, and(e) the cognitive appraisal of computers. The fourth research ques-tion examined the differential relations between the CUQ con-structs and both fluid (gf) and crystallized (gc) intelligence.
Table 2 shows the correlations of the general computer usagescale and the content domains, respectively, with all covariates.The general CU factor was substantially correlated with convergentconstructs such as the self-rated computer expertise (female: qCU,
comp. exp.(493) = .58, p < .01, vs. male: qCU, comp. exp.(483) = .67,p < .01). It was also moderately correlated with a positive appraisalof computers (female: qCU, pos. appraisal(493) = .28, p < .01, vs. male:qCU, pos. appraisal(483) = .25, p < .01). The moderate relation to thethree manifest variables – time of computer usage, access to com-puters, and number of electronic devices – clearly indicates that CUis more than a simple function of these environmental variables.Only about 10% of the variance in the CU factor can be explainedby regressing CU on these variables (female: R2 = .09; male:R2 = .12), that is, the linear combination of the access to computers,the number of electronic devices, and the time spent using com-puters hardly determines the level of CU. Apart from relations withthe general CU factor there was a stronger association for the con-tent factor Internet – more than 16% of the variance was explainedby the three environmental variables (female: R2 = .18; male:R2 = .16).
The fourth research question concerned the relation of the CUQscales with intelligence. We modeled crystallized intelligence asnested below fluid intelligence. Crystallized intelligence is nega-tively correlated with general CU in both groups. The negative cor-relation of fluid intelligence and CU was only significant in thefemale group (qCU, gf(493) = �.25, p < .01). Comparing the correla-tions of the content domain factors with intelligence across gendergroups, the high positive correlation between Office and fluid intel-ligence in the female group is remarkable (qOffice, gf(493) = .38,p < .01), whereas the same correlation is significantly lower andnot statistically different from zero in the male group (qOffice,
gf(483) = .10, p = .15, Satorra–Bentler adjusted Dv2(1) = 6.7,p = .01, see notes Table 2).
Office Games
Male Female Male Female Male
.32**0 .02 �.02 .11*# .34**#
.14** .28** .22** .02 .02
.20** .080 �.100 .22**# .04#
.09 .11 .09 .07 .10*
.32**# �.06 �.06 .11*# .42**#
.03 .38**# .10# .13* �.01�.03 .30** .19** .04 .08
ariate was added separately to the model that tested for metric invariance, that is,imum-likelihood estimator (ML) was used, except for the models with gf and gc that& DiStefano, 2006). Significant differences in correlation between gender groups are.05. Significance testing is based on likelihood-ratio-v2-difference-test for the freely
odel the Satorra–Bentler scaled v2-difference-test is used (Satorra & Bentler, 2001).
g effects with the questionnaire.
U. Schroeders, O. Wilhelm / Computers in Human Behavior 27 (2011) 899–904 903
4. Discussion
Based on theoretical considerations and data driven adjust-ments we established a measurement model with a general com-puter usage factor and three nested content factors – Office,Internet, and Games. Using multi-group confirmatory factor analy-sis we found that gender considerably influence the construct ofCU. In future research, the content- and gender-specificity has tobe taken into account when considering CU as covariate in com-puter-based assessment. With this article we also want to arguefor the use of CFA and multi-group CFA in the development ofnew measures in order to approach questions on validity. TheCUQ showed significant relations to self-rated computer expertise,cognitive appraisal of computers and other computer-relatedcovariates (e.g., usage time or accessibility). With respect to ourintroductory notion – that different person characteristics thatmay affect performance on a computer-based ability measure –are reflected in the usage of computers, these positive relationsmight be interpreted as evidence for the validity of the construct.
One unanswered question is how computer-related constructscausally depend on each other. Do attitudes towards computerscause the quantity and quality of CU or is it the other way around?How strong are these relations? And how do self-perceived com-puter expertise and other computer-related constructs fit intothe picture? A longitudinal study assessing different computer-re-lated constructs in combination with performance data would pro-vide valuable information about the interdependencies. One of ourpredictions is that both quantity and quality of CU are even mod-erately associated with academic success. Presumably, this relationis partly mediated through other constructs such as intellectualengagement or need for achievement.
One important and potentially controversial finding is that thegender of participants is a variable that has to be taken into consid-eration when discussing CU. Differential relations of the CUQ factorswith criteria for the female and the male group emphasize the differ-ences in construct meaning for the two groups. For instance, the cor-relations between the Office factor and intelligence divergesignificantly. While boys’ usage of computers in general and in spe-cific domains is independent of intelligence, for girls the usage of of-fice programs is associated with intelligence. Obviously, the causaldirection of this correlation is ambivalent. On the one hand, engage-ment in office products may positively affect intelligence, that is,girls who use computers only for serious purposes have a betterchance to profit intellectually. On the other hand, more intelligentgirls might be tempted or obligated to use office software more fre-quently. However, it should be kept in mind that the magnitude ofthis relation must be seen relative to the negative correlation be-tween general CU and fluid intelligence for girls.
Another potentially controversial and surprising finding dealswith the low relation of the other specific CUQ factors with intelli-gence. Correlations between the factors Internet and Games andintelligence are not distinct from zero. This means that no positiveor negative effect of gaming on the intelligence is identifiable – con-trary to the widely held, but rarely empirically tested opinion (e.g.,van Schie & Wiegman, 1997). However, in an extreme group of teen-agers that are addicted to computer gaming or extensive use of socialnetworking services these relations might be different because thespecific usage of computers interferes with scholastic development.Otherwise, CU could also support competency development in agroup of teenagers that are extremely devoted to a scholastic disci-pline and use computers accordingly and intensively. Also the gen-der-specific relationships between the content factors and positiveappraisal of computers are intriguing: For girls the correlation withInternet is higher than for boys (female: qInternet, pos. appraisal(493) =.60 vs. male: qInternet, pos. appraisal(483) = .32, p < .01, Dv2(1) = 12.4,
p < .01) whereas for boys the correlation with Games turned out tobe higher (female: qGames, pos. appraisal(493) = .11, p = .03, vs. male:qGames, pos. appraisal(483) = .42, p < .01, Dv2(1) = 15.5, p < .01). How-ever, these gender-specific relations must not be misinterpreted interms of differences in latent means.
It is necessary to keep in mind two possible limitations of thisstudy: First, new computer technologies and software productspermanently evolve and for this reason computer-related con-structs such as CU are changing rapidly, too. Consequently, mea-sures assessing these constructs are more prone to be out-datedthan measures covering more stable personality traits. On theone hand, more and more activities are carried out using comput-ers, for example, reading an online newspaper with a mobile deviceor online shopping. On the other hand, there is a change in existingcomputer activities. For instance, creating a blog entry requiresmore than simple word processing. In addition to the actual writ-ing process one surfs the web in search of topics, answers com-ments to a blog entry, and uses an FTP-client to upload thecontent. The second limitation applies to the fact that not onlythe computer-related constructs are changing but also the abilityto work with computer technology in the population. We investi-gated a homogenous sample of 15-year-old high school studentswhich limits the generalizability of the findings. For instance, rela-tive to these teenagers older persons will use computers in differ-ent ways and for other purposes. Accordingly, the underlyingstructure of CU is likely to be different, too. It is important to pointout that these differences are rooted in the construct and persisteven if we restrict the measurement instrument to survey ques-tions about the number of electronic devices, et cetera.
Taken together, the CUQ is a new, psychometrically sound, andbehavior-based measure to assess computer experience that can beused either as a covariate in computer-based measurement or asan outcome measure itself. Usually differences in performancedata gathered on different test media are explained either throughmeasures of typical behavior (e.g., rating the acceptance ofcomputer-based testing), measures of maximal behavior (e.g.,computer-related knowledge) or background variables (e.g., avail-ability of computers). Classical survey questions – comparable tothe ones we used as covariates in our study – are inappropriateto comprehensively assess CU. The construct is more complex be-cause computers are just tools to achieve specific goals such asseeking information, social networking, working or spending one’sleisure time. The CUQ is a measure that taps how teenagers actu-ally use information technology. Rather than assessing whetherthey enjoy working with computers, experience self-efficacy, orhave access to information technology it is crucial to ask teenagerswhat they do with a computer and how intense this usage is.
Appendix A. Computer usage questionnaire (CUQ)
Never
Rarely SometimesOften
Veryoften(1) How often do you use the following programs?
(a) Word processing(e.g., Word)
h h h h h(b)
Spreadsheet(e.g., Excel)h
h h h h(c)
Presentationprogram (e.g.,Powerpoint)h
h h h h(d)
Programminglanguage (e.g.,h
h h h h(continued on next page)
904 U. Schroeders, O. Wilhelm / Computers in Human Behavior 27 (2011) 899–904
Appendix A (continued)
Never
Rarely SometimesOften
VeryoftenJava)
(e) Graphicssoftware (e.g.,CorelDraw)
h
h h h h(f)
Sound or videoediting softwareh
h h h h(g)
e-mail client(e.g., Outlook)h
h h h h(h)
Chat program(e.g., IRC, Skype)h
h h h h(i)
Web browser(e.g., Firefox, IE)h
h h h h(j)
Games (e.g., TheSims)h
h h h h(2) How often do you perform the following computer activities?
(a) Creating apresentation
h h h h h(b)
Programming h h h h h(c)
Sound editing h h h h h(d)
Writing e-mails h h h h h(e)
Chatting h h h h h(f)
Surfing the web h h h h h(g)
Playing alone h h h h h(h)
Playing online h h h h hReferences
Bollen, K. A. (1989). Structural equations with latent variables. Oxford, England: JohnWiley and Sons.
Bridgeman, B., Lennon, M. L., & Jackenthal, A. (2003). Effects of screen size, screenresolution and display rate on computer-based test performance. AppliedMeasurement in Education, 16, 191–205.
Browne, M. W., & DuToit, S. H. C. (1992). Automated fitting of nonstandard models.Multivariate Behavioral Research, 27, 269–300.
Cheung, G. W., & Rensvold, R. B. (2002). Evaluating goodness-of-fit indexes fortesting measurement invariance. Structural Equation Modeling, 9, 233–255.
Chua, S. L., Chen, D.-T., & Wong, A. F. L. (1999). Computer anxiety and its correlates:A meta-analysis. Computers in Human Behavior, 15, 609–623.
Cronbach, L. J. (1949). Essentials of psychological tests. New York: Harper andBrothers.
Drasgow, F., & Mattern, K. (2006). New tests and new items: Opportunities andissues. In D. Bartram & R. K. Hambleton (Eds.), Computer-based testing and theInternet (pp. 59–75). Oxford, England: John Wiley and Sons.
Finney, S. J., & DiStefano, C. (2006). Non-normal and categorical data in structuralequation modeling. In G. R. Hancock & R. O. Mueller (Eds.), Structural equationmodeling: A second course (pp. 269–314). Greenwhich, CT: Information Age.
Horn, J. L., & Cattell, R. B. (1966). Refinement and test of the theory of fluid andcrystallized general intelligences. Journal of Educational Psychology, 57, 253–270.
Horn, J. L., & McArdle, J. J. (1992). A practical and theoretical guide to measurementinvariance in aging research. Journal of Experimental Aging Research, 18,117–144.
Hu, L., & Bentler, P. M. (1999). Cutoff criteria for fit indexes in covariance structureanalysis: Conventional criteria versus new alternatives. Structural EquationModeling, 6, 1–55.
Kelley, T. L. (1927). Interpretation of educational measurement. Yonkers, NY: WorldBook.
LaLomia, M. J., & Sidowski, J. B. (1991). Measurements of computer attitudes: Areview. International Journal of Human–Computer Interaction, 3, 171–197.
LaLomia, M. J., & Sidowski, J. B. (1993). Measurements of computer anxiety: Areview. International Journal of Human–Computer Interaction, 5, 239–266.
Leeson, H. V. (2006). The mode effect: A literature review of human andtechnological issues in computerized testing. International Journal of Testing, 6,1–24.
Little, T. D., Card, N. A., Slegers, D. W., & Ledford, E. C. (2007). Representingcontextual effects in multiple-group MACS models. In T. D. Little, J. A. Bovaird, &N. A. Card (Eds.), Modeling contextual effects in longitudinal studies (pp. 121–147).Mahwah, NJ: Lawrence Erlbaum Associates Publishers.
McDonald, R. P. (2002). The impact of individual differences on the equivalence ofcomputer-based and paper-and-pencil educational assessments. Computers andEducation, 39, 299–312.
Muthén, L. K., & Muthén, B. O. (2009). Mplus (version 5.21) [computer software]. LosAngeles: Muthén and Muthén.
Potosky, D., & Bobko, P. (1998). The computer understanding and experience scale:A self-report measure of computer experience. Computers in Human Behavior,14, 337–348.
Satorra, A., & Bentler, P. M. (2001). A scaled difference chi-square test statistic formoment structure analysis. Psychometrika, 66, 507–514.
Schulenberg, S. E., Yutrzenka, B. A., & Gohm, C. L. (2006). The computer aversion,attitudes, and familiarity index (CAAFI): A measure for the study of computer-related constructs. Journal of Educational Computing Research, 34, 129–146.
van Schie, E. G., & Wiegman, O. (1997). Children and videogames: Leisure activities,aggression, social integration, and school performance. Journal of Applied SocialPsychology, 27, 1175–1194.
Wilhelm, O. (2009). Issues in computerized ability measurement: Getting out of thejingle and jangle jungle. In F. Scheuermann & J. Björnsson (Eds.), The transition tocomputer-based assessment (pp. 145–150). JRC Scientific and Technical Reports.<http://crell.jrc.it/RP/reporttransition.pdf> Retrieved 01.03.10..
Wilhelm, O., Schroeders, U., & Schipolowski, S. (2009). BEFKI. Berliner Test zurErfassung fluider und kristalliner Intelligenz (Berlin test of fluid and crystallizedintelligence). Unpublished manuscript.
Wu, A. D., Li, Z., & Zumbo, B. D. (2007). Decoding the meaning of factorial invarianceand updating the practice of multi-group confirmatory factor analysis: Ademonstration with TIMSS data. Practical Assessment, Research, and Evaluation,12(3), 22. <http://pareonline.net/pdf/v12n3.pdf> Retrieved 01.03.10..