computer-aided pre-clinical trials for implantable medical ... · computer-aided pre-clinical...
TRANSCRIPT

Computer-aided Pre-clinical Trials for Implantable Medical Devices:
Test Automation Platform
NSF Summer Undergraduate Fellowship in Sensor Technologies
Kevin Volkel, Sunfest Fellow
(Electrical Engineering) – Wilkes University
Advisers: Dr. Rahul Mangharam (Electrical and Systems Engineering), Dr. Marco Beccani (Electrical and Systems Engineering)

1
Abstract:
Ensuring that medical devices, such as pacemakers and implantable cardioverter defibrillators
(ICDs), deliver the appropriate therapy only when necessary is made difficult by complex
software and variability conditions between patients. Because of patient condition variability,
safety recalls have affected over 600,000 devices between 1990 and 2000 [1]. Of these recalled
devices, 200,000 were recalled due to firmware issues [1]. The current standard for validation of
these devices is a clinical trial. These trials test the new device against the current standard of
care by comparing their performances on real patients. To prevent poorly performing devices
from being used in clinical trials—in which millions of dollars are spent, four to six years are
wasted, and patients’ lives are put at risk—computer-aided pre-clinical trials that use virtual
heart models, rather than real patient hearts, to test ICD devices can be useful. These computer-
aided pre-clinical trials will be able to test ICDs over a large group of 11,000 synthetic patients.
Measuring the ICD’s performance against these 11,000 synthetic patients exposes an ICD to a
large range of patient variability, and provides insight into the performance of an ICD before a
clinical trial. Due to the large size of the synthetic group, a test automation platform is needed. In
this paper, we propose a test automation platform that is able to test real ICD devices over a wide
range of heart conditions. The platform can send stored synthetic electrogram (EGM) signals
(recordings of electric potential over time for heart tissue) to an ICD device, or an ICD algorithm
on a PC, and monitor the performance of both the ICD device and the algorithm. In the following
sections of this paper, the hardware and software designs for the platform will be discussed in
detail along with results of the platform.

2
Background and Introduction:
Implantable cardioverter defibrillators are medical devices that are placed inside a patient’s chest
with the purpose of treating potentially fatal ventricular tachyarrhythmia caused by an
abnormally high rate of ventricle contraction [2]. These devices form a closed-loop cyber-
physical system in which the cyber component is the ICD and the physical component is the
heart. Because these devices alter physiological functions of the heart, the cyber-physical system
is a safety-critical system, meaning that the patient’s well-being depends heavily on the correct
functioning of the device.
ICDs work by monitoring two different aspects of the heart’s electrical events, the timing of
these events and the morphology of the EGMs. Unfortunately, ICDs suffer from an efficacy issue
due to their high rate of inappropriate therapy [3]. This inappropriate therapy usually presents
itself as a shock to the heart that should not have been applied because of a problem with the
ICD’s discrimination algorithm [3]. A discrimination algorithm is a part of the ICD software that
decides if an arrhythmia is super ventricular tachycardia (SVT) or ventricular tachycardia (VT)
[2]. The difference between SVT and VT is that SVT originates in heart tissue above the
ventricles and is not usually fatal, whereas VT originates in the ventricles, and if sustained,
results in death within seconds [3]. If an ICD wrongly classifies a SVT episode as VT, then the
patient will receive an inappropriate shock.
The software for an ICD is not reviewed at any time during the FDA’s screening process prior to
the device being placed on the market [1]. The FDA is satisfied as long as the medical devices
perform well in a clinical trial in which the new devices are compared against the current
standard of care [3]. These trials are performed by giving one group of patients the new device
and giving another group of patients the current standard device with the objective of
determining if the new device provides significant improvement [3]. A clinical trial is a complex
and extensive process that requires participation from patients, physicians, statisticians, clinical
centers, and companies, and can run for several years and cost millions of dollars [3]. For
example a clinical trial that aimed to prove the safety of a coronary guidewire enrolled 800
patients, took 2 years to perform and cost $10 to $12 million dollars [4]. The cost of both time
and money that is required during a clinical trial can result in a large loss to a company’s
resources if the device does not prove to be safe. Therefore, insight into the performance of a

3
medical device prior to a clinical trial can be highly valuable to companies. We propose
computer-aided pre-clinical trials that use test automation platforms to provide such insight into
an ICD’s performance.
A computer-aided pre-clinical trial requires a series of steps to give information. First, real
patient EGM recordings are adjudicated to create a table of various tachyarrhythmia EGM
morphologies [3]. Then subsets of morphologies are taken from this table and are combined with
a synthetic heart model with accurate timing properties of the heart [3]. After combining with the
heart model, parameters are altered to generate a synthetic group of 11,000 patients [3]. This
group is then simulated, producing synthetic EGM signals that can be used for device testing [3].
The test automation platform fits into this computer-aided pre-clinical trial by providing a bridge
in between the computer generated EGMs and the ICD device. This platform is able to take these
stored synthetic EGMs and send them to a real ICD device or an ICD algorithm that is
implemented on a PC. Testing both the ICD device and the ICD algorithm allows testing of both
the real device and the software that is in the ICD. Figure 1 below shows the process of a
computer-aided pre-clinical trial that was discussed before.
Figure 1: The process of a computer-aided pre-clinical trial [3]. The test automation platform
described in this paper fits into this process at stage 4 by providing an interface between
synthetic heart electrograms and ICD devices.
It should be noted that this platform is not a final design, currently this design is open-loop. It is
open-loop because the system just streams a predetermined set of EGM data from a text file, and
since it is predetermined, the ICD outputs cannot change the values of the EGM data. Ultimately,

4
the goal of this project is to convert this open-loop system to a closed-loop system that uses a
heart model to generate EGM data in real time. The following sections go into more detail about
the design of the platform and how it works.
Test Automation Platform:
Overview of the Platform:
The test automation platform consists of two PCs (PC1 and PC2) and a hardware component. PC1
interfaces with a user and sends EGM data to PC2. This EGM data is generated by a heart model
and is stored in a text file with the possible voltage values of -1V to 1V. PC1 also has a program
that performs the software algorithm of the real ICD device, which allows the test platform to
evaluate the performance of the algorithm and the real ICD. Two PCs are needed to explicitly
show that the ICD algorithm program can receive and process EGM signals like an ICD device.
PC2 receives the EGM data and shifts the voltage range from -1-1V to 0-2V with the purpose of
making the process of sending the data to the hardware section easier. PC2 also receives and logs
shock information given from the real ICD device. The hardware component takes the data from
PC2 and turns it into electrical signals that can be used as inputs to an ICD device and an ICD
algorithm on PC1. A general block diagram for this platform is shown below in Figure 2. The
arrows labeled AS, VS, and SS in the block diagram represent the EGM signals that are sent to
the device. AS is the EGM from the atrium, VS is the EGM from the ventricles, and SS is the
shock signal. The shock signal is a signal that represents the electrical activity of the whole heart,
contrary to the AS and VS signals which give information of local heart electrical activity [2].
The following sections go into detail about each block of Figure 2.
Figure 2: Block diagram for the test plat form.
PC2
Hardware
ICD
AS VS
AS VS
SS SS
AS VS SS
PC1
EGM Data
ICD Shock ICD Shock

5
PC2 Software:
The software on PC2 is responsible for sending EGM data to the hardware section, and creating
log files that give information about the output of the ICD. This program is a C++ application
that first receives the text file containing the EGM data from PC1. The EGM data consists of
30,000 voltage samples for each channel AS, VS and SS, and these samples are in the range of -1
to 1V. After PC2 acquires the text file, the values in the text file are extracted, and once they are
extracted, they are shifted to a voltage range of 0-2V. After shifting the values to 0-2V, the
program converts these sample values into a 16 bit number that is appropriate for the digital to
analog converter (DAC) in the hardware section. Once all 90,000 samples are converted into 16
bit numbers, the 16 bit numbers are sent to a microcontroller using serial communications. While
the C++ application sends the data, it also checks to see if there is a message from the
microcontroller that says if a shock was delivered by the real ICD device. After a text file has
been sent to the microcontroller, PC2 receives voltage samples from the microcontroller that give
details about the ICD’s shock output. These voltages are then put into log files which also
contain the EGM data from the text file that was just sent. These log files, which are in the form
of a text file, are then sent to PC1 so the ICD shock data can be further processed. The EGM
data for a single text file is actually sent twice, one time for the real ICD and one time for the
ICD algorithm. After this whole process is done for one text file, the program resets so that
another text file can be received and processed.
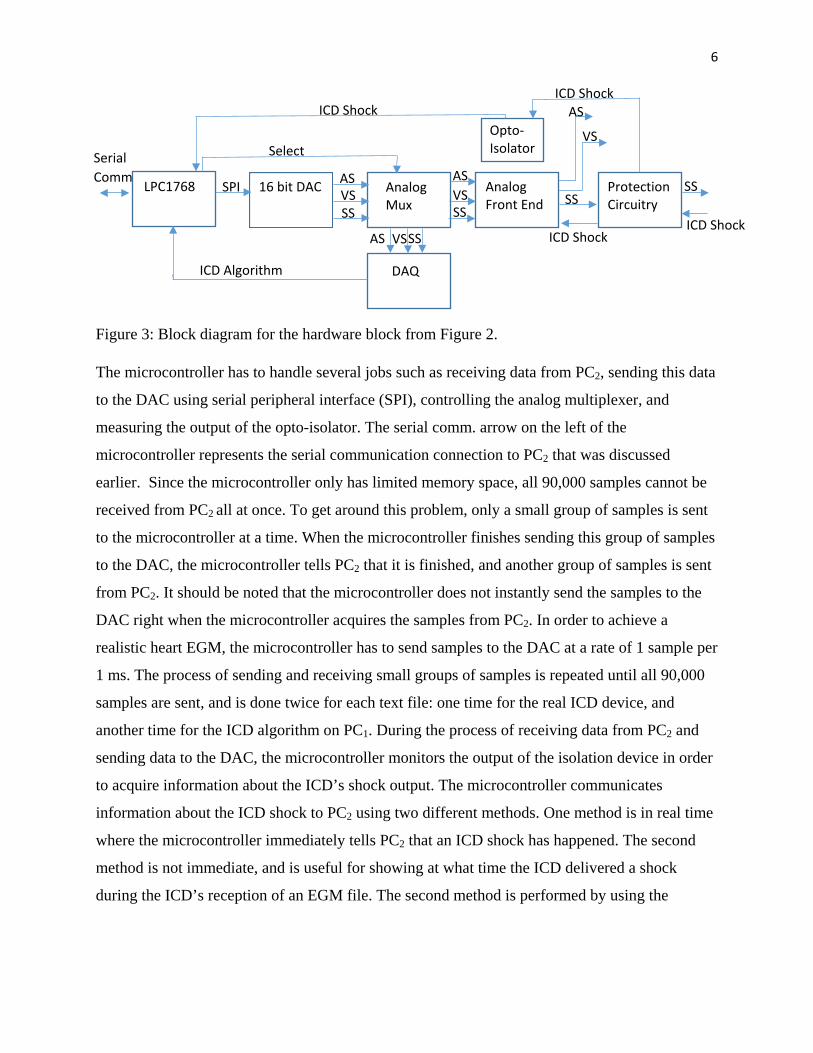
Hardware:
Figure 3 below shows a block diagram of the hardware block from Figure 2. The hardware
section consists of an mbed LPC1768 micro controller, a Maxim 16 bit DAC, an analog
multiplexer (mux), an analog frontend, a National Instruments data acquisition board (DAQ), a
digital opto-isolator and protection circuitry.
6
Figure 3: Block diagram for the hardware block from Figure 2.
The microcontroller has to handle several jobs such as receiving data from PC2, sending this data
to the DAC using serial peripheral interface (SPI), controlling the analog multiplexer, and
measuring the output of the opto-isolator. The serial comm. arrow on the left of the
microcontroller represents the serial communication connection to PC2 that was discussed
earlier. Since the microcontroller only has limited memory space, all 90,000 samples cannot be
received from PC2 all at once. To get around this problem, only a small group of samples is sent
to the microcontroller at a time. When the microcontroller finishes sending this group of samples
to the DAC, the microcontroller tells PC2 that it is finished, and another group of samples is sent
from PC2. It should be noted that the microcontroller does not instantly send the samples to the
DAC right when the microcontroller acquires the samples from PC2. In order to achieve a
realistic heart EGM, the microcontroller has to send samples to the DAC at a rate of 1 sample per
1 ms. The process of sending and receiving small groups of samples is repeated until all 90,000
samples are sent, and is done twice for each text file: one time for the real ICD device, and
another time for the ICD algorithm on PC1. During the process of receiving data from PC2 and
sending data to the DAC, the microcontroller monitors the output of the isolation device in order
to acquire information about the ICD’s shock output. The microcontroller communicates
information about the ICD shock to PC2 using two different methods. One method is in real time
where the microcontroller immediately tells PC2 that an ICD shock has happened. The second
method is not immediate, and is useful for showing at what time the ICD delivered a shock
during the ICD’s reception of an EGM file. The second method is performed by using the
LPC1768
16 bit DAC
Analog Mux
Analog Front End
DAQ
Protection Circuitry
Serial Comm
Select
SS
ICD Shock
VS SPI
SS
AS AS
AS
VS
VS SS
ICD Algorithm
AS
VS
SS SS
ICD Shock ICD Shock
Opto-Isolator
ICD Shock

7
microcontroller’s analog-to-digital converter to take continuous samples of the isolation device’s
output every 1 ms. These samples are then sent back to PC2 after the completion of a text file.
The DAC used in this system is a quad output DAC, but only three of the outputs are needed for
the AS, VS, and SS channels. When the DAC receives a 16 bit number from the microcontroller,
it converts the number to a voltage and outputs the voltage. The value of this voltage is equal to
the voltage value of the sample before it was converted to a 16 bit number in the PC2 software.
The three outputs of the digital-to-analog converter are inputs to the analog multiplexer which is
used to choose where the AS, VS, and SS signals go. If the analog multiplexer is selected for the
real ICD, then the EGM signals will go to the analog front end, and if the multiplexer is selected
for the ICD algorithm, then the signals will go to the DAQ. The DAQ is used to convert the
analog outputs of the multiplexer to digital signals that can be used by PC2.
The analog front end has two different jobs, one is to convert the 0-2V range EGM signals to a
range suitable for the ICD, and the second job is to provide isolation between the DAC and the
analog front end. Isolation is needed so that the power supply for the microcontroller and the
DAC does not create a ground loop with the power supply of the analog front end. Figure 4
below is a block diagram of the analog front end for the AS channel. Originally, the idea was to
bring the 0-2V signal range to a -15-15mV range, but when the system was tested, there was
instability in the atrial channel and saturation in the shock channel. The atrial channel was
attenuated to -10-10mV, the shock channel was attenuated to -5-5mV, and the ventricle channel
was attenuated to -15-15 mV.
Figure 4: Block diagram for processing the 0-2V signal. The two other EGMs go through the
same process, the last block changes for VS and SS according to their attenuation.
The circuitry that was used to realize the process in Figure 4 consists of a differential isolation
amplifier for the isolation, and basic operational amplifier circuit configurations for the three
other operations. Since the operational amplifiers in this analog front end have differential
outputs, the attenuated outputs are differential, rather than single ended.
AS (0-2V) (0-0.25V)
x0.125
Attenuation
Isolation
x8
Subtract 1V (0-2V) (-1-1V) (-10-10mV) x0.01
Attenuation

8
Originally, the plan was to connect these differential outputs directly to the connector for the
ICD, but due to the VS+ and the SS- wires in the connector being connected together, the SS and
VS signals needed to be processed more. Figure 5 shows a block diagram of the continued
processing. The goal of this extra conditioning was to make the VS+ and SS- both ground
potential in order to eliminate interference in between the signals.
Figure 5: Extra processing needed for VS and SS signals (also part of the analog front end).
After the analog front end, the AS and VS signals are fed directly to the ICD device and the SS
signal is fed into the protection circuitry. The protection circuitry is only needed for the SS signal
because the ICD delivers shocks through the same leads that the ICD measures the SS signal.
This circuit is rather simple and is shown below in Figure 6. The main component that provides
protection is the TVS diode, which is designed to provide protection by clamping high voltage
spikes to manageable levels. The diode in this circuit clamps the 800V output of the ICD to
about 9V, and this 9V signal (labeled Clamped ICD shock in Figure 6) is sent to the optical
isolation device. The output of the isolation device is the signal that the microcontroller monitors
for ICD shock data.
Figure 6: Protection circuitry used to protect the analog front end.
(-15-15mV) VS
(-15-15mV) VS Unipolar Unity gain
Difference Amplifier
(-5-5mV) SS
Unity gain Difference Amplifier
Unity gain Inverter
(-5-5mV) SS Inverted
+
-
Clamped ICD Shock

9
PC1 Software:
This application is responsible for sending the EGM text file data to PC2, interacting with the
data acquisition board, running an ICD algorithm, monitoring the performance of the algorithm
and receiving and analyzing log files sent from PC2. Since the communication between PCs, and
the interaction with the DAQ needs to happen simultaneously, multiple threads are used in this
application. One thread is PC to PC communication specific, and the other thread is used to
receive data from the DAQ and put this data into the ICD algorithm. The PC to PC
communication is performed by using sockets which are PC to PC communication mechanisms
that use transmission control protocol (TCP). PC1 sends an EGM text file to PC2 and then waits
for a log file to come back from PC2. This log file provides the information needed for analyzing
the real ICD’s behavior. After the log file is received, PC1 starts receiving data from the DAQ so
that the second transmisson of EGM data from PC1 can be captured. Samples are recorded by the
DAQ at a rate of 1 sample per 1 ms. When the PC receives data at this rate, the sample has to be
stored in a buffer since the ICD algorithm cannot analyze data at 1 sample per 1 ms. While
receiving data from the DAQ, PC1 creates a log file that contains the performance information of
the algorithm. After receiving the EGM data intended for the algorithm, the DAQ sampling is
shut down until it is needed again. This whole process is continued until the list of EGM files
that the user provides is complete, and after completion, the user can user end the program or
enter another file that has a list of EGM files. If the user enters ‘done’, the log files for both the
ICD and the algorithm are analyzed and another text file is created to show if any shocks were
applied during each EGM file. After creating and filling the final text file, the program shuts
down.

10
Hardware Setup:
Figure 7 below shows the current prototype of the test automation platform that is being used to
verify that the design of the system is working properly
Figure 7: Current prototype of the test automation platform.
In Figure 7, the laptop is simultaneously running the programs for PC1 and PC2. The two
prototype boards in the middle contain all of the hardware and the blue computer-like machine
on the far right is an ICD programmer. This programmer is used for changing parameters of an
ICD and monitoring the inputs of an ICD, which are usually too small of a voltage for an
oscilloscope. Currently the hardware for the system is being transferred to a printed circuit board
(PCB) which is shown below in Figure 8. This PCB will be able to reduce the noise in the
hardware by eliminating the loose wires that overlap each other in the current set up. Reducing
noise helps ensure that the integrity of the small voltage signals is preserved, which is important
when the ICD measures these small voltages. After this PCB is assembled and tested, a rack is
going to be constructed with the purpose of being able to house multiple PCBs that are connected
to ICD devices. With this rack, multiple ICD devices can be tested at the same time.

11
Figure 8: Picture of the PCB that is being assembled.
Results:
With a real-time heart model, computer-aided pre-clinical trials could be conducted, providing
results on the performance of an ICD. But for now, the result is a functioning system that
successfully provides accurate EGM waveforms to an ICD device, and successfully monitors and
records the output of an ICD.
To make sure that the platform is creating accurate EGMs, waveforms were measured using an
oscilloscope and compared to ideal waveforms. These ideal waveforms were generated by
plotting the voltage samples from a text file in MATLAB. Figures 9, 10, and 11 below compare
the platform generated EGMs and the ideal EGMs. The top waveform in each figure is the
MATLAB waveform and the second waveform is the signal acquired by the oscilloscope. The
-1V to 1V range signals had to be used because an oscilloscope cannot measure voltages as low
as -15-15mV accurately.

12
Figure 9: Atrial MATLAB waveform and oscilloscope waveform. Time scale for the
oscilloscope is 200 ms/division and voltage scale is 1 V/division.
Figure 10: Ventricle MATLAB waveform and oscilloscope waveform. Time scale for the
oscilloscope is 200 ms/division and voltage scale is 1 V/division.
Figure 11: Shock MATLAB waveform and oscilloscope waveform. Time scale for the
oscilloscope is 200 ms/division and voltage scale is 1 V/division.

13
Through the comparison of these EGMs, the platform was confirmed to send proper EGM
signals to an ICD device.
To verify that the platform could log ICD shock data correctly, a voltage of 20 V was applied
twice to the part of the protection circuitry where an ICD would apply its shock to. The text file
that the platform generated for this test is shown below in Figure 12, and Figure 13 shows a plot
of the sampled opto-ioslator output over time.
Figure 12: Sample of an example of a log file produced by the test automation platform.
Figure 13: Plot of the opto-isolator’s output over time.
From Figure 12 it can be seen that the test automation platform was successful in generating a
log file with an ICD shock sample for every EGM sample. The ICD Shock column is plotted in
Figure 13 in order to show all of the data that was acquired over the whole 30 second duration of

14
the text file. The two square waves represent the measured test “shocks”, and the two peaks on
the right and left side of the square waves are spurious measurements from the microcontroller’s
ADC. These spurious results are ignored when analyzing data in order to find out how many
shocks an ICD applies.
Discussion and Conclusions:
So far, most of the test automation platform that can be used for ICD testing has been built and
tested. The remaining work includes assembling a printed circuit board for the hardware,
assembling a rack for multiple PCB and device testing, replacing the text files with a heart model
that can generate real-time heart signals, and testing real ICD devices to monitor their
performances. A printed circuit board is needed in order reduce noise in the hardware. The
current hardware is assembled on two breadboards with wires overlapping each other, which can
introduce noise into the signals that can be especially detrimental to the integrity of the millivolt-
range signals at the input of the ICD. Having the circuitry on a printed circuit board reduces
noise in the circuit by eliminating the noise caused by overlapping signals and wires. Also,
switching the platform from a static, text file based system, to a platform that uses a real-time
heart model is necessary to achieve a closed-loop test platform. With this real-time heart model,
outputs of an ICD device would not only just be logged, but they would also be able to change
the behavior of the real-time heart model.
Both goals of integrating a real-time heart model, and testing real ICD devices may not be
reached soon due to a new heart model being currently constructed. Although these goals may
not be reached, the platform will be constructed in a way that will make the process of switching
from a text file system to a heart model system easy. The goals of assembling the printed circuit
board, and creating a test rack will be pursued as the next top priority.

15
Acknowledgements:
I would like to thank Dr. Marco Beccani for providing me with professional guidance during the
course of this project. I would also like to thank Dr. Rahul Mangharam for allowing me to be a
part of his research group for the summer, and Dr. Zhihao Jiang for providing me with useful
feedback on my report and providing me with the figures that I used in my introduction. Finally,
I would like to thank the National Science Foundation for funding this program that has provided
me with invaluable experience in the world of research.
References
1. Z. Jiang, M. Pajic, R. Mangharam, “Cyber-Physical Modeling of Implantable Cardiac
Medical Devices,” Proc. IEEE vol. 100, pp. 122-137, Jan. 2012.
2. R. X. Stroobandt, S. S. Barold, A. F. Sinnaeve, Implantable Cardioverter-Defibrillators
Step by Step. Wiley Blackwell, 2009.
3. H. Abbas, Z. Jiang, K. J. Jang, M. Beccani, J. Liang, S. Dixit, R. Mangharam, “Model-
Based Clinical Trials for Medical Devices,” in Annual International Conference of the
IEEE Engineering in Medicine and Biology Science., Orlando., FL.
4. A.V. Kaplan, D. S. Baim, J. J. Smith, D. A. Feigal, M. Simmons, D. Jeffereys, T. J.
Fogarty, R. E. Kuntz, M. B. Leon, “Medical Device Development: From Prototype to
Regulatory Approval,” Circulation, vol. 109, no.25, p.3068, Jun., 2004.