computational fluid dynamics (cfd) evaluation of non
TRANSCRIPT

Computational Fluid Dynamics (CFD) Evaluation of Non-Planar Stent Graft Configurations in Endovascular Aneurysm Repair (EVAR)
by
Lok Ting Tina Shek
A thesis submitted in conformity with the requirements for the degree of Master of Health Science (MHSc) in Clinical Engineering
Institute of Biomaterials and Biomedical Engineering University of Toronto
© Copyright by Lok Ting Tina Shek 2011

ii
Computational Fluid Dynamics (CFD) Evaluation of
Non-Planar Stent Graft Configurations in
Endovascular Aneurysm Repair (EVAR)
Lok Ting Tina Shek
Master of Health Science in Clinical Engineering
Institute of Biomaterials and Biomedical Engineering
University of Toronto
2011
Abstract
Crossing of stent graft limbs during endovascular aneurysm repair (EVAR) is often used to assist
cannulation and prevent graft kinking when the aortic bifurcation is widely splayed. Little has
been reported about the implications of cross-limb EVAR, especially in comparison to
conventional EVAR. Using computational fluid dynamics, this work numerically examines the
hemodynamic differences between these two out-of-plane stent graft configurations against a
planar configuration commonly found in literature. Predicted values of displacement force, wall
shear stress, and oscillatory shear index were similar between the out-of-plane configurations.
The planar configuration predicted similar wall shear stress values, but significantly lower
displacement forces than the out-of-plane configurations. These results suggest that the
hemodynamic safety of cross-limb EVAR is comparable to conventional EVAR. However, a
study of clinical outcomes may reveal reduced thrombosis incidence and long-term structural
implications for the stent graft in cross-limb EVAR.

iii
Acknowledgments
The completion of this thesis would not have been possible without the invaluable guidance and
mentorship of Dr. Cristina Amon. Much gratitude is owed to Dr. Leonard Tse and Dr. Aydin
Nabovati for their respective clinical, technical, and engineering expertise, in addition to their
continual support.
I would also like to thank my committee members, Dr. David Steinman and Dr. Tony Easty, for
their suggestions, encouragement, and advice throughout the completion of this thesis. I am very
grateful to Dr. Thomas Lindsay for his participation in my thesis.
Finally, I would like to thank my fellow Clinical Engineering peers, and the past and present
members of the ATOMS lab (formerly the ATFS lab), for their understanding, unrelenting
support, and camaraderie over these past two years.

iv
Table of Contents
Acknowledgments.......................................................................................................................... iii Table of Contents ........................................................................................................................... iv
List of Abbreviations ..................................................................................................................... vi List of Tables ................................................................................................................................ vii List of Figures .............................................................................................................................. viii List of Appendices ......................................................................................................................... xi
Chapter 1 Introduction .....................................................................................................................1 1 Introduction .................................................................................................................................1
1.1 Endovascular Aneurysm Repair (EVAR) ............................................................................1
1.2 Computational Fluid Dynamics (CFD) ................................................................................3 1.3 Post-Operative Problems .....................................................................................................4 1.4 Objectives ............................................................................................................................6 1.5 Chapter Roadmap.................................................................................................................6
Chapter 2 Methods ...........................................................................................................................7
2 Methods .......................................................................................................................................7 2.1 Geometry and Grid Creation ................................................................................................7
2.1.1 Segmentation............................................................................................................7
2.1.2 Geometry Construction ............................................................................................8 2.1.3 Meshing..................................................................................................................11
2.2 Solver Validation ...............................................................................................................11
2.3 Grid-Independence Study ..................................................................................................12
2.4 Time-Periodicity Study ......................................................................................................14
Chapter 3 The Predicted Safety of Cross-Limb EVAR .................................................................15 3 Computational Fluid Dynamics Evaluation of the Cross-Limb Stent Graft Configuration
for Endovascular Aneurysm Repair ..........................................................................................15
3.1 Abstract ..............................................................................................................................15 3.2 Introduction ........................................................................................................................16 3.3 Methods..............................................................................................................................18
3.3.1 Geometry................................................................................................................18 3.3.2 Meshing..................................................................................................................20 3.3.3 Simulation Setup ....................................................................................................20
3.3.4 Normalized Directional Contribution to Displacement Force ...............................22 3.3.5 Helicity ...................................................................................................................22 3.3.6 Oscillatory Shear Index..........................................................................................22
3.4 Results ................................................................................................................................23
3.4.1 Steady-State Simulations .......................................................................................23 3.4.2 Transient (Physiologic/Pulsatile) Simulations .......................................................25
3.5 Discussion ..........................................................................................................................31 3.6 Conclusion .........................................................................................................................38

v
Chapter 4 Conclusion .....................................................................................................................39
4 Conclusion ................................................................................................................................39 4.1 Summary ............................................................................................................................39 4.2 Future Work .......................................................................................................................39
4.2.1 Comparison of Clinical Outcomes .........................................................................39 4.2.2 Dislodgement Experiments of Out-of-Plane Grafts ...............................................39 4.2.3 Fluid-Structure Interactions (FSI) ..........................................................................40 4.2.4 Transitional Turbulence Modeling ........................................................................40
References ......................................................................................................................................41 Appendices .....................................................................................................................................49

vi
List of Abbreviations
AAA Abdominal aortic aneurysm
AAWSS Area-averaged wall shear stress
AP Anterior-posterior
CFD Computational fluid dynamics
CIA Common iliac artery
DICOM Digital imaging and communications in medicine
EVAR Endovascular aneurysm repair
Fi,n Normalized directional contribution to displacement force (in the direction i)
FSI Fluid-structure interaction
H Helicity
NS Navier-Stokes
OSI Oscillatory shear index
SG Stent graft
TAAWSS Time- and area-averaged wall shear stress
WSS Wall shear stress

vii
List of Tables
Table 1. Mesh sizes used for the direct stent graft configuration grid-independence study. ........ 50
Table 2. Mesh sizes used for the cross stent graft configuration grid-independence study. ......... 54
Table 3. Mesh sizes used for the planar stent graft configuration grid-independence study. ....... 58
Table 4. Figueroa et al. [56] found the AP directional force contribution to be the largest for
different variations of graft configurations constructed based on one patient‟s medical images. 81
Table 5. This set of results from Figueroa et al. [81] shows that the AP and axial directional force
contributions were the largest for 5 different patient-specific graft geometries. .......................... 82
Table 6. This set of results from Molony et al. [24] shows that the AP and axial directional force
contributions were, overall, the largest for 10 different patient-specific graft geometries. .......... 83

viii
List of Figures
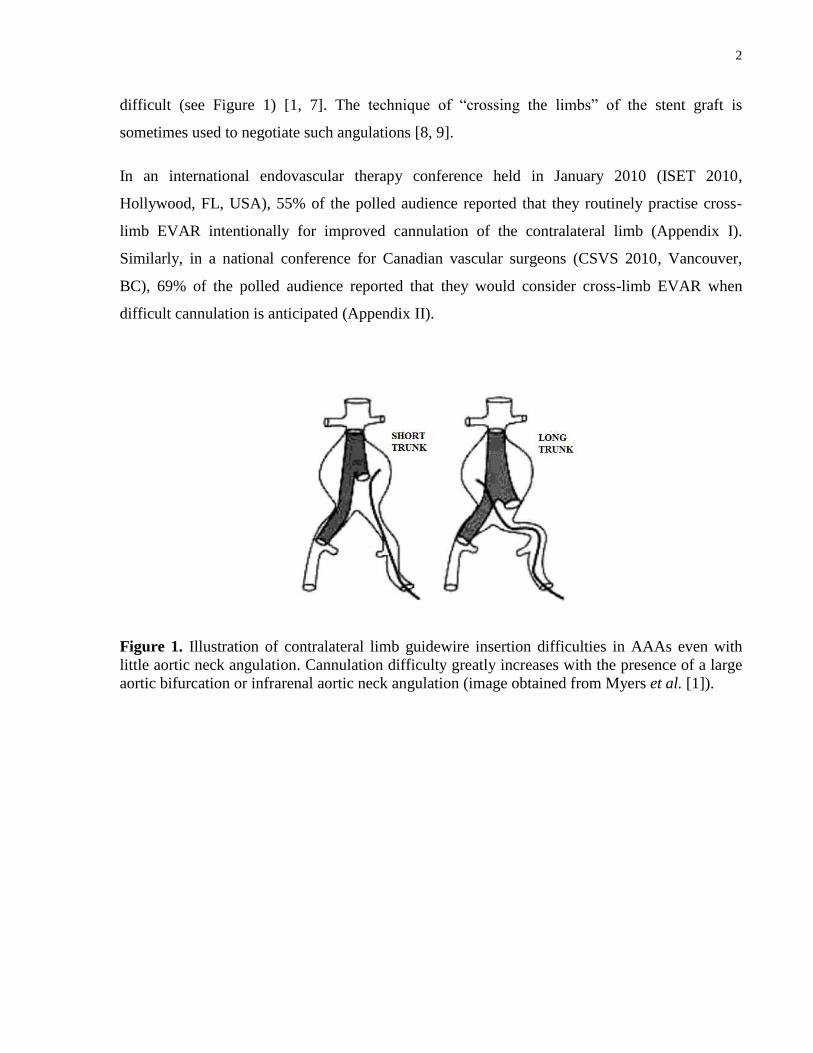
Figure 1. Illustration of contralateral limb guidewire insertion difficulties in AAAs even with
little aortic neck angulation. Cannulation difficulty greatly increases with the presence of a large
aortic bifurcation or infrarenal aortic neck angulation (image obtained from Myers et al. [1]). .... 2
Figure 2. The left shows the frontal (upper) and side (lower) views of a representative cross-limb
EVAR patient‟s implanted stent graft using CT images in Mimics software. The right shows the
manual segmentation of the cross-limb stent graft configuration. .................................................. 8
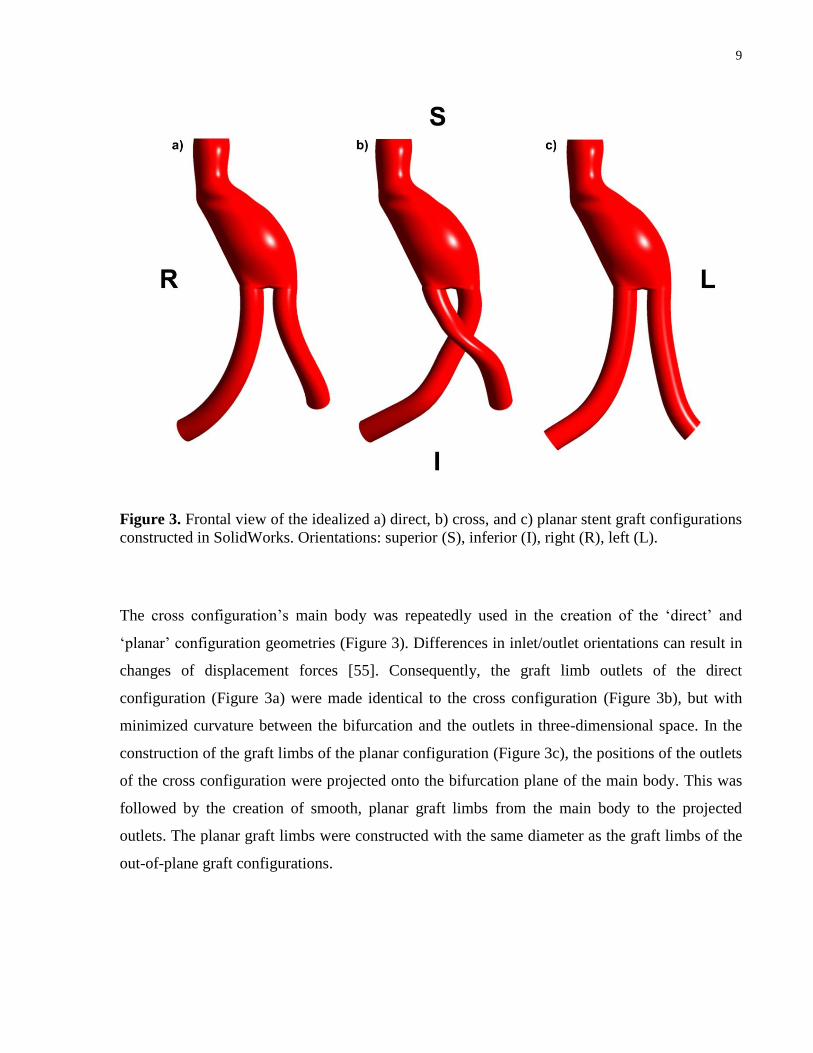
Figure 3. Frontal view of the idealized a) direct, b) cross, and c) planar stent graft configurations
constructed in SolidWorks. Orientations: superior (S), inferior (I), right (R), left (L). .................. 9
Figure 4. Side view of the idealized a) direct, b) cross, and c) planar stent graft configurations
constructed in SolidWorks. Orientations: superior (S), inferior (I), posterior (P), anterior (A). .. 10
Figure 5. Variation of axial displacement force predictions with mesh sizes of the planar graft
configuration in steady-state simulations as part of the grid-independence study. ...................... 13
Figure 6. Variation of total displacement force predictions from the transient simulation of the
cross graft configuration over four pulsatile cycles as part of the time-periodicity study. ........... 14
Figure 7. Computed tomography (CT) image of the representative cross-limb EVAR patient. .. 19
Figure 8. Side view of the idealized a) direct, b) cross, and c) planar stent graft configurations
constructed in SolidWorks. Orientations: superior (S), inferior (I), posterior (P), anterior (A). .. 19
Figure 9. Predicted total and directional displacement forces for the three graft configurations in
steady-state conditions. ................................................................................................................. 24
Figure 10. Steady-state streamlines superimposed on velocity contours at the left iliac artery graft
outlet of the direct, cross, and planar graft configurations (listed from left to right). .................. 25
Figure 11. Steady-state streamlines superimposed on velocity contours at the right iliac artery
graft outlet of the direct, cross, and planar graft configurations (listed from left to right). .......... 25
Figure 12. Total displacement force through one cardiac cycle predicted for the three graft
configurations. .............................................................................................................................. 26
Figure 13. Streamlines superimposed on velocity contours at the left iliac artery graft outlet of
the direct, cross, and planar configurations (listed from left to right) in late systole (t = 0.39 s). 27
Figure 14. Streamlines superimposed on velocity contours at the right iliac artery graft outlet of
the direct, cross, and planar configurations (listed from left to right) in late systole (t = 0.39 s). 27
Figure 15. Absolute area-averaged helicity in the left and right CIA graft outlets of the three graft
configurations. Peak helicity lagged behind peak systole of the inlet velocity profile. ................ 28

ix
Figure 16. Three-dimensional streamlines within the a) direct, b) cross, and c) planar graft
configurations. A dense recirculation zone is prominent in all the graft main bodies.................. 29
Figure 17. Transient area-averaged wall shear stress (AAWSS) comparison between the three
graft configurations. ...................................................................................................................... 30
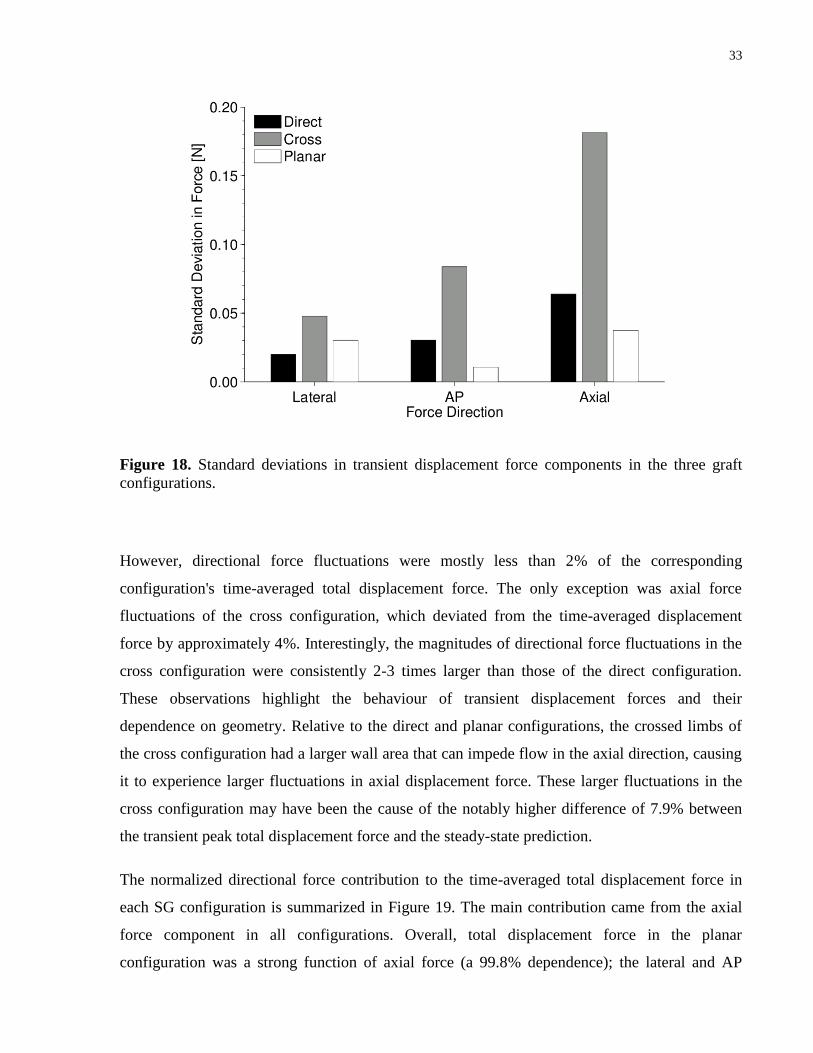
Figure 18. Standard deviations in transient displacement force components in the three graft
configurations. .............................................................................................................................. 33
Figure 19. Normalized directional force contributions to the overall, time-averaged displacement
force in the three graft configurations. Contribution of the axial force component is almost triple
the contribution of the lateral or AP component in the out-of-plane configurations. ................... 34
Figure 20. Variation of lateral displacement force with mesh sizes of the direct configuration. . 50
Figure 21. Variation of anterior-posterior displacement force with mesh sizes of the direct
configuration. ................................................................................................................................ 51
Figure 22. Variation of axial displacement force with mesh sizes of the direct configuration. ... 51
Figure 23. Variation of lateral area-averaged wall shear stress with mesh sizes of the direct
configuration. ................................................................................................................................ 52
Figure 24. Variation of anterior-posterior area-averaged wall shear stress with mesh sizes of the
direct configuration. ...................................................................................................................... 52
Figure 25. Variation of axial area-averaged wall shear stress with mesh sizes of the direct
configuration. ................................................................................................................................ 53
Figure 26. Variation of lateral displacement force with mesh sizes of the cross configuration. .. 54
Figure 27. Variation of anterior-posterior displacement force with mesh sizes of the cross
configuration. ................................................................................................................................ 55
Figure 28. Variation of axial displacement force with mesh sizes of the cross configuration. .... 55
Figure 29. Variation of lateral area-averaged wall shear stress with mesh sizes of the cross
configuration. ................................................................................................................................ 56
Figure 30. Variation of anterior-posterior area-averaged wall shear stress with mesh sizes of the
cross configuration. ....................................................................................................................... 56
Figure 31. Variation of axial area-averaged wall shear stress with mesh sizes of the cross
configuration. ................................................................................................................................ 57
Figure 32. Variation of lateral displacement force with mesh sizes of the planar configuration. 58
Figure 33. Variation of anterior-posterior displacement force with mesh sizes of the planar
configuration. ................................................................................................................................ 59

x
Figure 34. Variation of axial displacement force with mesh sizes of the planar configuration. .. 59
Figure 35. Variation of lateral area-averaged wall shear stress with mesh sizes of the planar
configuration. ................................................................................................................................ 60
Figure 36. Variation of anterior-posterior area-averaged wall shear stress with mesh sizes of the
planar configuration. ..................................................................................................................... 60
Figure 37. Variation of axial area-averaged wall shear stress with mesh sizes of the planar
configuration. ................................................................................................................................ 61
Figure 38. Time-periodicity of area-averaged wall shear stress in the direct configuration. ....... 62
Figure 39. Time-periodicity of total displacement force in the direct configuration. ................... 62
Figure 40. Time-periodicity of the imposed inlet boundary condition of the direct configuration.
....................................................................................................................................................... 63
Figure 41. Time-periodicity of area-averaged wall shear stress in the cross configuration. ........ 64
Figure 42. Time-periodicity of total displacement force in the cross configuration. ................... 64
Figure 43. Time-periodicity of the imposed inlet boundary condition of the cross configuration.
....................................................................................................................................................... 65

xi
List of Appendices
Appendix I – ISET 2010 Audience Poll Results ...........................................................................49
Appendix II – CSVS 2011 Audience Poll Results.........................................................................49
Appendix III – Direct Configuration Grid-Independence Study ...................................................50
Appendix IV – Cross Configuration Grid-Independence Study ....................................................54
Appendix V – Planar Configuration Grid-Independence Study ....................................................58
Appendix VI –Direct Configuration Time-Periodicity Study .......................................................62
Appendix VII – Cross Configuration Time-Periodicity Study ......................................................64
Appendix VIII – Contour Plots of Steady-State Total Pressure ....................................................66
Appendix IX – Contour Plots of Steady-State Wall Shear Stress .................................................67
Appendix X – Contour Plots of Transient Total Pressure (Front View) .......................................68
Appendix XI – Contour Plots of Transient Total Pressure (Back View) ......................................71
Appendix XII – Contour Plots of Transient Wall Shear Stress (Front View) ...............................74
Appendix XIII – Contour Plots of Transient Wall Shear Stress (Back View) ..............................77
Appendix XIV – Contour Plots of Oscillatory Shear Index ..........................................................80
Appendix XV – Normalized Directional Force Contributions of Other Patient-Specific
Geometries .....................................................................................................................................81

1
Chapter 1 Introduction
1 Introduction
1.1 Endovascular Aneurysm Repair (EVAR)
Abdominal aortic aneurysms (AAA) are local pathogenic dilations of the abdominal aorta to 1.5
times its nominal diameter, typically distal to the renal arteries. The disease is usually
asymptomatic. If left untreated, the aneurysm will continue to grow until rupture due to the
pressure and flow of blood acting on the weakened aortic wall. The rate of growth of AAAs is
dependent on its size: 0.2–0.4 cm/yr for AAA diameters of less than 4 cm, 0.2–0.5 cm/yr for
diameters of 4–5 cm, and 0.3–0.7 cm/yr for diameters greater than 5 cm [2]. When an AAA
ruptures, the overall mortality rate is approximately 85% [3-5]. For the patients who are fortunate
enough to make it to the operating room, the mortality rate of surgical treatment of ruptured
AAAs ranges between 40–50% [4].
The most common AAA stent graft devices employed today are bifurcated and comprised of
modular components that allow the graft to direct blood flow to the two iliac arteries. The stent
portion of the graft device is a self-expanding (or balloon-expandable) structure made of Nitinol
(an alloy of nickel and titanium) or stainless steel. The graft portion is commonly made of the
woven fabric, polyester Dacron. The stent structure helps the graft appose the aorta to achieve a
seal, in order to maintain adequate blood flow to the distal arterial system without exposing the
aneurysm sac to high pressures.
The deployment of the bifurcated stent graft is often a two-part (two-step) process. The proximal
neck (with an attached ipsilateral iliac limb) is first deployed, followed by insertion of a second
guidewire for the deployment of the contralateral iliac limb. Due to graft design and the
variability of infrarenal anchorage area available for the proximal neck of the stent graft, the
success rate of EVAR is highly dependent on patient anatomy [6]. The complexity of the
conventional EVAR procedure is also increased when a patient has notable aortic neck
angulation or widely splayed common iliac arteries. Specifically, insertion of the second
guidewire into the target aortic region (for deployment of the contralateral limb) may become
2
difficult (see Figure 1) [1, 7]. The technique of “crossing the limbs” of the stent graft is
sometimes used to negotiate such angulations [8, 9].
In an international endovascular therapy conference held in January 2010 (ISET 2010,
Hollywood, FL, USA), 55% of the polled audience reported that they routinely practise cross-
limb EVAR intentionally for improved cannulation of the contralateral limb (Appendix I).
Similarly, in a national conference for Canadian vascular surgeons (CSVS 2010, Vancouver,
BC), 69% of the polled audience reported that they would consider cross-limb EVAR when
difficult cannulation is anticipated (Appendix II).
Figure 1. Illustration of contralateral limb guidewire insertion difficulties in AAAs even with
little aortic neck angulation. Cannulation difficulty greatly increases with the presence of a large
aortic bifurcation or infrarenal aortic neck angulation (image obtained from Myers et al. [1]).

3
1.2 Computational Fluid Dynamics (CFD)
Currently, the use of computational fluid dynamics (CFD) is widespread across many industrial
and biomedical applications. CFD resolves flow fields in time and space by numerically solving
the Navier-Stokes (NS) equations in Cartesian coordinates. For trivial flow geometries and
boundary conditions, such as straight pipes and bends, the NS equations can be solved
analytically. However, complicated flow geometries and boundary conditions are frequently
encountered in practical and clinical applications, prohibiting analytical solution of the NS
equations. The use of CFD facilitates the solution of physical flow by discretizing the NS
equations at nodes that, collectively, represent the flow geometry. A large system of discrete
equations must then be solved using iterative numerical methods. The converged solution
provides values of velocity and pressure on each node at each time step. Two of the main
advantages to using numerical methods include the ease of revisiting the simulation solution for
a more detailed examination of the flow field, and the ability to update or adjust its setup.
In biomedical AAA applications, CFD has been widely used to study the etiology and prognosis
of the disease [10-12]. It has also been used to predict the hemodynamics of stent graft flow to
improve graft design and clinical efficacy [13-15]. The focus of earlier studies by Finol et al.
[12] and Liffman et al. [16, 17] was the hemodynamic flow field created by planar graft
geometries due to its simplicity and ease of comparison to analytical solutions [18]. Later studies
by Li and Kleinstreuer [19] used idealized three-dimensional geometries in attempts to
understand three-dimensional flow phenomena. The large influence of geometry on
hemodynamics has been previously described [14, 20-22], such that magnitudes of migration
forces and thrombogenic risks may be drastically altered as a result of practising cross-limb
EVAR. Morris et al. [14], Howell et al. [25], and Molony et al. [23, 24] further created patient-
specific geometries to predict patient-specific hemodynamics, and to test the feasibility of these
analyses in clinical workflow. More recently, CFD was jointly employed with structural
mechanics simulations for fluid-structure interaction (FSI) investigations to identify the effects
on AAAs due to the presence of implanted stent grafts [26-28].

4
1.3 Post-Operative Problems
Despite EVAR‟s relative success compared to open surgery [6], EVAR has multiple commonly
recognized post-operative problems. These include graft migration, endoleak development,
progressive loss of device integrity in the fabric or stent, component separation, biological
responses, progressive dilation of the proximal neck and/or aneurysm, thrombosis (blood clot),
and aneurysm rupture [6, 29].
In particular, graft migration has been the primary focus of CFD studies of EVAR stent grafts.
The diagnosis of clinical graft migration typically warrants endovascular re-intervention to
improve graft fixation [6]. These CFD studies attributed graft dislodgement to high magnitudes
of displacement forces acting on stent grafts mainly due to pressure and inertial forces [25],
which are related to high blood pressure, large abdominal aortic diameter, and large graft size
[30]. The tendency of graft migration is also increased with increased aortic neck and aortic
bifurcation angles [6]. Numerically obtained displacement forces are often compared to
dislodgement force magnitudes collected from bench top “pull-out” studies that test different
active fixation mechanisms added to stent grafts (e.g., barbs, hooks, etc.) [31-33]. However, most
pull-out studies investigated only unidirectional (axial) dislodgement of planar graft
configurations. To the best of our knowledge, there are currently no experimental studies of
dislodgement of out-of-plane graft configurations in literature.
Another post-operative problem that has not received much attention in CFD research is that of
EVAR graft thrombosis. Thrombosis in the graft can occur as a result of stent graft stenosis, graft
kinking, or thrombo-emboli, and can lead to graft limb occlusion (blockage) and lower-extremity
ischemia [35, 36]. Ischemic complications can occur in 3-10% of EVAR patients [35, 36]. Fifty
percent of ischemic patients show signs of lower-limb ischemia within 30 days after EVAR [36,
37]. Management options of graft limb occlusion include, but are not limited to, thrombectomy,
thrombolysis, stent placement, and bypass of the blocked artery [38].
Graft thrombosis is most commonly observed in small-calibre arterial bypass and peripheral
prosthetic grafts (e.g., for hemodialysis). Due to the high notoriety of the diseases which use
these grafts in treatment, most CFD research related to graft thrombosis has been conducted
based on the clinical conditions of their recipient vessel [39, 40]. Peripheral and small-calibre
grafts are different from EVAR stent grafts in three main ways. Firstly, their diameters are

5
significantly smaller (<6 mm) [41]. Secondly, their recipient vessels mainly experience steady
flow conditions [39, 42]. Lastly, they are not supported by stent structures.
Caro et al. [43] first proposed the use of helical flow (also known as swirling or spiral flow) to
improve wall shear stress magnitudes and distribution, and to reduce oscillatory flow in vascular
grafts to prevent thrombogenesis. The difference in cross-sectional flow patterns between the
commonly observed Dean flow and helical flow is easy to visualize. Dean flow typically arises
in curved pipes and bends, and its characteristic flow field consists of two semi-circular vortices
that are similar in size. In contrast, the flow field observed in the presence of helical flow
consists of one circular, dominating vortex, possibly accompanied by a smaller vortex.
Stonebridge et al. [44] had previously observed natural helical flow at various locations in the
human body; most prominently in the aortic arch [45, 46], and even in infrainguinal (below the
groin) vessels. Steady-state helical flow has also been demonstrated in vitro to reduce platelet
adhesion [47] and plaque deposition [48], both of which contribute to the thrombosis process
[49, 50]. The presence of helical flow results in more uniform, and thus, lower peak wall shear
stress [51, 52]. Its presence also facilitates endothelial cell repair by reducing flow separation
[44].
Diminishing device structural integrity is yet another documented complication during post-
operative follow-up. This complication commonly takes the form of stent fracture and fabric
fatigue [53]. Structural fatigue is influenced by graft and aneurysm sac morphology and
tortuosity changes over time, as well as the cyclic loading nature of physiologic pulsatile flow
[53]. The incidence of stent fracture at 1 year is 4.6% [36], and 12-15% at 5 to 10 years [36, 54].
Fabric fatigue is usually observed between 10-20 years after EVAR. Fabric fatigue can create
graft holes due to wear against stent structures, and subsequently lead to re-pressurization of the
aneurysm sac [53].
Of the CFD literature that study device migration and graft thrombosis, common numerical
quantities of interest in steady-state and transient simulation include: stent graft geometric
parameters, wall shear stress (WSS) magnitudes and distribution, downward (axial) displacement
forces, and radially-acting forces [12, 14-16, 25, 26].

6
1.4 Objectives
This research aims to use CFD to elucidate whether the cross-limb stent graft configuration is
less likely to fail from a hemodynamic perspective in comparison to the stent graft configuration
resulting from traditional EVAR. Failure modes of interest include device migration and graft
thrombosis. We use numerical methods to investigate the hemodynamics involved in steady-state
and pulsatile flow through these two graft configurations.
We also study the flow field of a corresponding planar stent graft configuration. This
configuration was inspired by previous analytical and CFD studies of stent graft hemodynamics
using planar geometries. We aim to identify and quantify how its predictions differ from
simulations that utilize its counterpart out-of-plane geometries.
1.5 Chapter Roadmap
This thesis consists of four chapters. Relevant background information and the objectives of this
study are described in Chapter 1. Chapter 2 details the methods used in our study and the
proactive investigations carried out to ensure simulation accuracy. Chapter 3 is the manuscript
intended for journal submission. It begins with a summary of the origin of the cross-limb EVAR
technique, common complications of EVAR, and CFD literature that have sought to provide
insight on the hemodynamics of grafting to reduce the occurrence of complications. This chapter
continues to describe and report a CFD analysis comparing the flow fields of three stent graft
configuration geometries originating from: i) traditional EVAR, ii) cross-limb EVAR, and iii)
previous numerical and analytical studies. The likelihood of graft migration, graft thrombosis,
and the ability to generate helical flow in these three graft configurations are contrasted in this
chapter. Chapter 4 summarizes the contributions of this thesis and relevant ideas for future work.

7
Chapter 2 Methods
2 Methods
2.1 Geometry and Grid Creation
2.1.1 Segmentation
The patient imaging database of the University Health Network (UHN) was surveyed for patients
with an implanted cross-limb EVAR stent graft. A representative patient's CT (computed
tomography) images in DICOM (Digital Imaging and Communications in Medicine) format
were selected for import into Mimics software (Materialise Ltd., Belgium). Although Mimics
offers an automatic segmentation algorithm using contrast thresholding, several preliminary
attempts at eliciting a smooth, accurate, representative geometry of the cross-limb graft
configuration (i.e., the lumen within the stent graft) were unsuccessful. A manual segmentation
process was thus employed (Figure 2). Afterwards, a series of points representing the graft
centerline, in addition to lines for ellipse construction at multiple axial locations along the graft,
were generated and exported as a point cloud file to be used in SolidWorks (Dassault Systèmes
S.A., France).

8
Figure 2. The left shows the frontal (upper) and side (lower) views of a representative cross-limb
EVAR patient‟s implanted stent graft using CT images in Mimics software. The right shows the
manual segmentation of the cross-limb stent graft configuration.
2.1.2 Geometry Construction
The point cloud file was imported into SolidWorks to create a smooth, ideal geometry of the
„cross‟ graft configuration. A series of ellipses were constructed from the point cloud that were
lofted together to create the main body of the stent graft. Also created from the point cloud were
two symmetrical circles (with diameters of 13 mm) located at the bottom of the graft‟s main
body, and two three-dimensional paths. Starting from the two circles of the main body, the
sweeping feature was applied across these paths for the generation of the iliac graft limbs of the
cross configuration.
9
Figure 3. Frontal view of the idealized a) direct, b) cross, and c) planar stent graft configurations
constructed in SolidWorks. Orientations: superior (S), inferior (I), right (R), left (L).
The cross configuration‟s main body was repeatedly used in the creation of the „direct‟ and
„planar‟ configuration geometries (Figure 3). Differences in inlet/outlet orientations can result in
changes of displacement forces [55]. Consequently, the graft limb outlets of the direct
configuration (Figure 3a) were made identical to the cross configuration (Figure 3b), but with
minimized curvature between the bifurcation and the outlets in three-dimensional space. In the
construction of the graft limbs of the planar configuration (Figure 3c), the positions of the outlets
of the cross configuration were projected onto the bifurcation plane of the main body. This was
followed by the creation of smooth, planar graft limbs from the main body to the projected
outlets. The planar graft limbs were constructed with the same diameter as the graft limbs of the
out-of-plane graft configurations.

10
Figure 4. Side view of the idealized a) direct, b) cross, and c) planar stent graft configurations
constructed in SolidWorks. Orientations: superior (S), inferior (I), posterior (P), anterior (A).
The graft limb outlets of all three graft configurations were extended by a straight length
equivalent to 10 times the limb diameter to help stabilize simulations (the extensions are not
shown in Figures 3 and 4). Differences in graft limb length between all three graft configurations
were tolerated because shear forces were not expected to largely influence displacement force
[16, 19, 56]. Pressure boundary conditions were not used at the outlets of our simulations. As a
result, pressure drop differences due to limb length and configuration between the three graft
geometries were not expected to largely affect simulation results. The graft limbs were also not
constructed with stent imprints and tapering. The impact of stent struts on the overall
hemodynamic flow field of the graft configurations was assumed to be negligible [57]. While
tapered graft limbs experience larger pressure drops than non-tapered grafts [58], tapering was
found to have negligible effects on displacement force and wall shear stress magnitudes in
comparison to out-of-plane curvature features of three-dimensional geometries [23].

11
2.1.3 Meshing
Due to the irregular geometric shapes of the planar and out-of-plane graft configurations, an
automatic mesh generation algorithm was employed within ANSYS ICEM CFD (ANSYS, Inc.,
Canonsburg, PA, USA). A minimum of six „original‟ meshes for each graft configuration (and
their extensions) were initially constructed based on different manually-inputted mesh settings
(e.g., maximum tetrahedron sizes on the different faces of geometry, number of prism layers,
prism thicknesses, element growth ratios, etc.). Local refinement of the meshes was applied as
necessary to improve mesh quality, particularly in regions near the graft bifurcation and walls,
where large velocity gradients were expected to occur in a small spatial region. The resulting
meshes were comprised of tetrahedrons and prisms. Afterwards, two „duplicate‟ meshes for each
configuration were generated based on two sets of previously applied mesh settings to identify
the variability the automatic mesh generation algorithm can impart on the monitored results
(please see details of the grid-independence study in Section 2.3). Despite using identical mesh
settings, the meshing process did not appear to be entirely reproducible. We commonly observed
a mesh size difference of approximately 1000 nodes (less than 0.1% of the overall mesh size)
between the original mesh and its duplicate.
While the fundamental elements of these meshes were tetrahedrons, prisms were extruded from
the tetrahedral faces near the boundaries of the geometries to capture any flow boundary layer
separation activity. Mesh integrity was checked by inspecting various measures of mesh quality
in ICEM (e.g., orthogonality angles greater than 18°, elemental aspect ratios greater than 0.2
away from walls, quality greater than 0.3, determinant ratios greater than 0.5, etc.). Cyclic
smoothing and quality checks were repeatedly performed in attempts to achieve satisfactory
measures of mesh quality.
2.2 Solver Validation
Our methodology and problem set-up were previously validated against the analytical solution of
laminar Poiseuille flow, under steady-state conditions and the use of grid-independent, three-
dimensional, tetrahedral and hexahedral meshes. Using the solver ANSYS CFX, the simulation

12
of the direct configuration in another study also provided results that were consistent with
simplified, two-dimensional analytical solutions for stent graft displacement force [55].
2.3 Grid-Independence Study
All the tetrahedral meshes previously constructed for the three graft configurations (Section
2.1.3) were imported into ANSYS CFX-Pre for steady-state simulation setup for individual grid-
independence studies. A grid-independence study can illustrate the sensitivity of predicted values
to the size and resolution of the mesh of a geometry. Since computational time, memory usage,
and processing power required for simulation convergence generally increase with mesh size
(i.e., increasing resolution or node count), the aim of this study was to identify the lowest node
count for each graft configuration that would yield repeatable results of interest in the shortest
simulation time.
The converged steady-state simulations were post-processed in ANSYS CFX-Post. Predicted
values of directional graft displacement forces and area-averaged wall shear stress (AAWSS)
from each graft configuration were monitored across different mesh sizes. Details of the mesh
sizes and results from their converged steady-state simulations can be found in Appendices III,
IV, and V.
Since Prakash and Ethier suggested that WSS is a highly sensitive hemodynamic parameter [59],
we used boundary layer refinement to help reduce this sensitivity. The directional AAWSS in the
anterior-posterior (AP) and axial (caudal) directions were less than 3% different in larger meshes
in comparison to the so-considered grid-independent mesh across all three graft configurations.
However, we found the most sensitive WSS monitored parameter to be lateral AAWSS, which
deviated from the so-considered grid-independent mesh by 5 – 26% across the three graft
configurations. This high sensitivity may be due to round-off error, since the lateral AAWSS is
of the lowest magnitude out of all the monitored AAWSS values in our grid study. It should be
noted that we had already taken precautions for round-off error by using double precision and
64-bit processors in carrying out our simulations.
For each configuration, one original mesh was deemed grid-independent when larger original
meshes predicted total and directional displacement forces and AAWSS values with a change of

13
less than 3% from the so-considered original grid-independent mesh. The changes in predictions
of lateral AAWSS with node count were disregarded in choosing the grid-independent mesh due
to the inconsistency we observed. It was assumed that even larger mesh sizes of the same graft
configuration beyond those studied would result in a deviation of less than 3% from the grid-
independent mesh. The grid-independent meshes for the direct, cross, and planar configurations
were thus deemed to be 1.64 million, 1.74 million, and 1.62 million nodes, respectively.
We observed a higher degree of mesh sensitivity in directional displacement forces than
directional AAWSS. Agreement in directional AAWSS values was much better than agreement
in directional displacement force values between original and duplicate meshes (please refer to
Appendices III, IV, and V). For example, a maximum difference of 0.3% in directional AAWSS
was observed between the 2.8 million node original mesh of the planar configuration and its
duplicate. The differences in directional displacement forces observed between these two meshes
varied from 3.8 – 4.8%, however (Figure 5).
Figure 5. Variation of axial displacement force predictions with mesh sizes of the planar graft
configuration in steady-state simulations as part of the grid-independence study.

14
2.4 Time-Periodicity Study
A time-periodicity study was conducted by submitting the direct and cross configurations under
transient simulation for an extended number of four pulsatile cycles. Extended transient
simulations, such as these, can reveal the impact of the initial condition used, which may take
several cycles to numerically stabilize. The total simulation time of these two extended
simulations was 4.8 seconds. We observed excellent inter-cycle repeatability (<0.5% difference)
in the direct configuration‟s predictions of total displacement force and AAWSS. Please see
Appendices VI and VII for plots of these variables in each cycle. With the exception of one
cycle, we also observed excellent inter-cycle repeatability of results in the cross configuration.
The difference in the outlying cycle is shown in Figure 6. The extended results of both
configurations also contained slight deviations between the start of the first cycle and subsequent
cycles, likely due to differences in the initial condition between the first and subsequent cycles.
Since we observed highly repeatable results through our time-periodicity study, we carried out
transient simulation of the planar graft configuration for only one pulsatile cycle.
Figure 6. Variation of total displacement force predictions from the transient simulation of the
cross graft configuration over four pulsatile cycles as part of the time-periodicity study.

15
Chapter 3 The Predicted Safety of Cross-Limb EVAR
3 Computational Fluid Dynamics Evaluation of the Cross-Limb Stent Graft Configuration for Endovascular Aneurysm Repair
3.1 Abstract
The technique of crossing the limbs of bifurcated modular stent grafts for endovascular
aneurysm repair (EVAR) is often employed in the face of splayed aortic bifurcations to facilitate
cannulation and prevent device kinking. However, little has been reported about the implications
of cross-limb EVAR, especially in comparison to conventional EVAR. Previous computational
fluid dynamics (CFD) studies of conventional EVAR grafts have mostly utilized simplified
planar stent graft geometries. We herein examined the differences between conventional and
cross-limb EVAR by comparing their hemodynamic flow fields (i.e., in the „direct‟ and „cross‟
configurations, respectively). We also added a „planar‟ configuration, which is commonly found
in literature, to identify how well this configuration compares to out-of-plane stent graft
configurations from a hemodynamic perspective. A representative patient‟s cross-limb stent graft
geometry was segmented using computed tomography (CT) imaging in Mimics software. The
cross-limb graft geometry was used to build its direct and planar counterparts in SolidWorks.
Grid-independent meshes were constructed from these three idealized graft geometries.
Physiologic velocity and mass boundary conditions and blood properties were applied to these
meshes for steady-state and pulsatile transient simulations in ANSYS CFX. Displacement forces,
wall shear stress (WSS), and oscillatory shear index (OSI) were all similar between the direct
and cross configurations. The planar geometry yielded very different predictions of
hemodynamics compared to the out-of-plane stent graft configurations, particularly in
displacement forces. This study suggests that the hemodynamics involved in crossing the limbs
is as safe as conventional EVAR. While the higher helicity and improved WSS magnitudes and
distribution found in the cross-limb configuration suggest improved thrombosis resistance, there
may be long-term structural implications to stent graft use in the cross configuration. Clinical
validation of this study‟s results should be pursued.

16
3.2 Introduction
Current workflow for endovascular aneurysm repair (EVAR) of abdominal aortic aneurysms
(AAAs) deploys a bifurcated, modular stent graft (SG) system in a two-part process. First, the
graft main body and an associated iliac graft limb on the ipsilateral (current) side are deployed
using one guidewire. Then, another guidewire is inserted (cannulated) into the graft main body
for the deployment of the contralateral (opposite) iliac graft limb. When a patient has significant
aortic neck angulation or widely splayed common iliac arteries (CIAs), cannulation can become
difficult and time-consuming [1, 7]. Successful cannulation can take up to 41 minutes and is
currently an operative bottleneck in emergency EVAR [60]. The likelihood of poor clinical
outcomes (e.g., graft kinking) and technical complexity of traditional EVAR significantly
increase with splayed bifurcations [3, 61, 62]. To reduce cannulation time in the face of adverse
anatomy, the technique of crossing or balleting the limbs of the SG is sometimes intentionally
employed [9, 63].
Although successful compared to its open surgical counterpart, EVAR has several noteworthy
post-operative problems, such as graft migration and endoleak development (inadvertent leakage
into the AAA); both of which can lead to aneurysm rupture [6, 29]. Graft migration typically
manifests as a slippage of the SG proximal neck to a distal location. Graft migration is currently
a frequent cause of graft device failure and often requires re-intervention [6, 25, 64]. While
proximal active fixation devices (e.g., barbs and hooks, and uncovered proximal stents) have
been added by manufacturers to newer generations of SGs to offer uni-axial, non-pulsatile
fixation strengths of 6.5-16.8 N [31-33], graft migration is still known to occur. Graft migration
has also been clinically linked to large graft inlet diameters and angulated or tortuous patient
anatomy, which reduces the available infrarenal anchorage area [3, 6, 25, 29, 64, 65].
The cause of EVAR SG failure (e.g., migration) has been studied widely from a hemodynamic
perspective using analytical methods and computational fluid dynamics (CFD) simulations.
Older studies considered steady-state and pulsatile (physiologic) flow in mainly two-dimensional
(planar symmetric) SG configurations [10, 16, 18]. More recently, three-dimensional (out-of-
plane) SG configurations have also been studied [14, 16-19, 23-25]. These studies found that
displacement forces (the main cause of graft migration) generally increase with high blood
pressure and non-planarity of the SG configuration.

17
Thrombosis (blood clot) inside the SG is another mode of SG failure [64, 66, 67]. Incidence of
iliac graft limb occlusion (blockage) have been reported to occur in 3 to 10% of EVAR patients,
often occurring within 6 months after EVAR and more frequently in first generation SGs [35, 54,
68, 69]. Previous studies have associated thrombosis development and resistance to different
wall shear stress (WSS) spatial distributions and temporal behaviour [43]. While regions that
experience high-magnitude, unidirectional WSS are most resistant to thrombosis [71-74], regions
that experience low-magnitude, oscillatory WSS favour thrombosis [75, 76]. Further, WSS can
be enhanced (increased) by helical (spiral or swirling) flow to reduce the risk of thrombosis, due
to the presence of centrifugal and centripetal forces [43, 44, 51, 52]. Helical flow has long been
observed in the human arterial system (e.g., thoracic aorta, femoral arteries, infrainguinal
arteries, etc.) [44, 45, 77]. The associated centrifugal force can help flush lumen walls to prevent
deposit accumulation, flow separation and stagnation, while centripetal force can improve mass
transport to reduce flow residence times.
The clinical outcomes of cross-limb EVAR patients have not been well-documented, especially
in comparison to patients of conventional, non-crossed, EVAR. The goal of this research was to
identify hemodynamic consequences of cross-limb EVAR practice that may or may not
encourage its clinical use for improved patient safety and outcome. Three idealized EVAR stent-
graft configurations were used in our CFD study. While the direct and cross configurations were
derived from clinical practice, the planar configuration was designed to reflect the simplified
geometry commonly found in literature. We predicted the flow fields of these three
configurations to compare their risks of graft migration and graft thrombosis.

18
3.3 Methods
3.3.1 Geometry
In this study, we used a representative patient‟s post-EVAR CT (computed tomography) images
as the primary geometry (see Figure 7). This patient was implanted with a bifurcated modular SG
in the cross-limb configuration with inlet and outlet diameters of 21.4 mm and 13.0 mm,
respectively. Using Mimics software (Materialise Ltd., Belgium), the artificial lumen created by
the deployed SG was segmented using simple thresholding. Artifactual abnormalities were then
manually trimmed away, and the walls of the aorta and CIA were smoothed. This idealized
geometry, representative of the flow domain created by the cross-limb EVAR technique, was
then imported into SolidWorks (Dassault Systèmes S.A., France).
Two other idealized SG configurations, the „direct‟ and „planar‟ configurations, were then
constructed using significant landmarks of the primary cross-limb SG geometry (i.e., the inlet,
outlets, and the bifurcation region). The direct configuration is representative of the SG geometry
that would be created from traditional, non-crossed, EVAR practice on the same patient.
Meanwhile, the planar configuration imitates the SG geometry commonly used in previous CFD
studies. The flow fields of these two additional configurations help illustrate and quantify key
hemodynamic differences created by cross-limb EVAR.
All three graft configurations share an identical graft inlet, graft body and bifurcation region
(Figure 8). The cross and direct configurations also share identical graft outlet orientations.
These outlet orientations were projected onto the plane of the graft bifurcation to create the
outlets of the planar configuration.
A straight extension graft piece (not shown in figures) was added to the outlets of all three
geometries to help stabilize the simulations. These extensions were ten times the outlet diameter
in length. The outlets were orthogonal to the respective CIA and circular in shape to simulate
ideal apposition of the SG limbs to patient vessels. Graft limbs were not tapered. Graft roughness
and stent strut patterns were not incorporated.

19
Figure 7. Computed tomography (CT) image of the representative cross-limb EVAR patient.
Figure 8. Side view of the idealized a) direct, b) cross, and c) planar stent graft configurations
constructed in SolidWorks. Orientations: superior (S), inferior (I), posterior (P), anterior (A).
20
3.3.2 Meshing
The idealized graft geometries were imported into ANSYS ICEM CFD for tetrahedral meshing
with prism boundary layers. Cyclic smoothing and quality checks were performed until mesh
qualities were satisfactory. A minimum of six progressively larger meshes were created for each
configuration.
Grid-independence for each graft configuration was studied by applying steady-state boundary
conditions and blood properties in the commercial flow solver, ANSYS CFX (Canonsburg, PA,
USA). This flow solver was previously validated by our group against laminar Poiseuille flow
[55]. Predicted values of graft displacement forces and WSS from each graft configuration were
monitored across the six different meshes. The grid-independent meshes for the direct, cross, and
planar configurations contained 1.64 million, 1.74 million, and 1.62 million nodes, respectively.
For each graft configuration, predictions of displacement forces and WSS values using larger
mesh sizes differed by less than 3% from the so-considered grid-independent mesh predictions. It
was assumed that further increases in mesh size would continue to yield similar variability in
these predicted values.
3.3.3 Simulation Setup
While blood is a non-Newtonian fluid, blood flowing through the abdominal aorta behaves as a
Newtonian fluid [13, 50]. The blood flowing inside the SG configurations was therefore modeled
as an incompressible fluid with a density of 1050 kg/m3 and a dynamic viscosity of 0.0035 Pa·s.
Both steady-state and pulsatile simulations were carried out. While steady-state simulations can
provide us with a long-term overview of the hemodynamic flow field within each SG
configuration, transient simulations can demonstrate the evolution of intricate flow patterns that
occur over each cardiac cycle. Transient simulations were conducted over one cardiac cycle (1.2
seconds) with time steps of 0.01 seconds, as we found the results to be repeatable (with changes
of less than 1%) after simulation of multiple cardiac cycles (please refer to Section 2.4).
Simulation convergence was deemed achieved when all normalized mass and momentum
equation residuals fell below 10-6
.

21
An inlet velocity to the SG of 0.5269 m/s was imposed for steady-state simulations.
Consequently, the bulk Reynolds number remained in the range of turbulent flow, and so the
Shear Stress Transport (SST) turbulent flow model in CFX was used. This velocity is the peak
systolic velocity reached in the physiologic abdominal aorta velocity waveform reported in
Morris et al. [18]. This waveform represents one cardiac cycle over a period of 1.2 seconds and
was experimentally captured using colour Doppler ultrasound by Di Martino et al. [78]. The
pulsatile waveform was implemented as the inlet boundary condition for transient simulations. In
steady-state and transient simulations, the inlet velocity boundary condition was spatially-
uniform, since variations in the inlet profile were not expected to significantly alter displacement
force or outlet velocity contour predictions [14]. The use of a spatially-uniform inlet velocity
was, however, expected to cause predictions of higher shear stress magnitudes than the use of a
spatially-parabolic inlet velocity boundary condition. Since the graft configurations are short
(axial length: 0.17 m) and contain out-of-planar features, it is difficult for the spatially-uniform
inlet velocity profile to establish a parabolic spatial distribution.
We assumed that laminar flow would dominate over the pulsatile cycle. Even though the
Reynolds number exceeds the range for laminar flow during peak systole and is followed by a
deceleration phase, these destabilizing attributes are relatively short-term. They are also preceded
by acceleration during systole and followed by a lengthy, low-velocity diastole; both of which
can help re-stabilize flow [18].
The CIA graft outlets were assigned an equal outlet mass flow condition to simulate a clinically
realistic (equal) supply of blood into the CIAs of each SG configuration. This condition is based
on similarly negligible graft limb impedances in comparison to downstream impedances present
in the arteries of both legs [79].
After simulation convergence, streamlines and critical variables were post-processed. These
variables included magnitudes of directional and total displacement (drag) force, area-averaged
wall shear stress (AAWSS), time- and area-averaged wall shear stress (TAAWSS), helicity, and
oscillatory shear index (OSI).

22
3.3.4 Normalized Directional Contribution to Displacement Force
Normalized directional contribution to displacement force, Fi,n, was used to facilitate the
comparison of directional displacement forces among the different graft configurations. It is
defined as follows in Eq. 1, where Fi is the magnitude of displacement force in the direction i.
Direction i can be any of the lateral (x), anterior-posterior or „AP‟ (y), or axial (z) directions.
(1)
3.3.5 Helicity
To quantify the presence of secondary flow patterns, the Dean number or helicity are commonly
used quantities based on the formation of Dean flow (with two semi-circular vortices) or helical
flow (with only one dominating circular vortex), respectively. To illustrate the extent of helical
flow generation by the cross configuration, we chose helicity as one comparison parameter
among the three SG configurations. Helicity is defined in Eq. 2.
(2)
3.3.6 Oscillatory Shear Index
While the absolute magnitude of WSS was used to view its distribution along the SG walls, we
used the oscillatory shear index (OSI) to characterize the temporal behaviour of WSS. It was
introduced by Ku et al. [50] to quantify the directional changes of WSS through time. It is
defined in Eq. 3.
(3)

23
where t is time in the cardiac cycle of length T seconds, and τ is the WSS vector. OSI, as defined
above, varies in the range of 0 to 0.5. A magnitude of zero indicates no change in the direction of
WSS over period T (unidirectional flow). A magnitude of 0.5 indicates highly oscillating flow.
The magnitude of OSI is correlated to the propensity for intimal thickening. Higher OSI also
suggests a higher risk of local thrombogenesis [50, 80].
3.4 Results
3.4.1 Steady-State Simulations
The directional and total displacement forces due to blood flow in steady-state simulation
through all three graft configurations are compared in Figure 9. The total displacement forces for
the direct, cross, and planar configurations were 4.81 N, 4.90 N, and 3.22 N, respectively. The
cross and direct configurations experienced comparable displacement forces, with a difference of
less than 2%. These force predictions were higher than the planar configuration by 40%, on
average.
The directional displacement forces of the planar configuration were noticeably lower than both
the direct and cross (the out-of-plane) graft configurations in the lateral and AP directions
(Figure 9). The axial displacement force of the planar configuration was lower than the out-of-
plane configurations by an average of 15%. The axial displacement forces were predicted to be
3.70 N, 3.77 N, and 3.22 N for the direct, cross, and planar configurations, respectively. For
detailed contours of total pressure (i.e., the sum of static and dynamic pressure), which represents
the force acting on the surface of each graft configuration, refer to Appendix VIII.

24
Figure 9. Predicted total and directional displacement forces for the three graft configurations in
steady-state conditions.
The simulated AAWSS for the direct, cross, and planar configurations were 4.17 Pa, 4.85 Pa,
and 4.07 Pa, respectively. We observed a 15% increase in the predicted AAWSS from the direct
to the cross configuration. Surprisingly, the planar configuration predicted a very similar steady-
state AAWSS magnitude to the direct configuration, but its predicted value was 17% different
from that of the cross configuration. Detailed contours of wall shear stress for each graft
configuration can be found in Appendix IX.
Steady-state streamlines are superimposed on velocity contours of the left and right graft outlets
of the three SG configurations in Figure 10 and Figure 11, respectively. Firstly, the direct
configuration shows developing helical flow and Dean flow in its left and right outlets,
respectively. Secondly, the cross-limb configuration exhibits developed and developing helical
flow in the left and right outlets, respectively. Finally, the planar configuration exhibits the
expected Dean flow pattern in the right outlet, but displays developing helical flow in the left
outlet. We also observed consistently higher velocities and better-developed flow patterns at the
left graft outlet of the three SG configurations. This may be related to the graft main body
geometry, which orients bulk flow from the patient‟s right posterior to their left anterior.

25
Figure 10. Steady-state streamlines superimposed on velocity contours at the left iliac artery
graft outlet of the direct, cross, and planar graft configurations (listed from left to right).
Figure 11. Steady-state streamlines superimposed on velocity contours at the right iliac artery
graft outlet of the direct, cross, and planar graft configurations (listed from left to right).
3.4.2 Transient (Physiologic/Pulsatile) Simulations
The total displacement force predictions from our transient simulations are summarized in Figure
12. On average, the total displacement forces of the direct and cross configurations were similar
in magnitude with less than 1% difference, and significantly higher than the planar configuration
by almost 40%. Figure 12 also illustrates that from a temporal point of view, transient
displacement force fluctuations behave similarly between the cross and direct configurations, but
differently for the planar configuration. However, the amplitude of the fluctuations differs, with
the cross configuration showing greater changes in displacement force. For contours of total
pressure acting on the surface of each graft configuration at different time points in the pulsatile
cycle, refer to Appendices X and XI.

26
Figure 12. Total displacement force through one cardiac cycle predicted for the three graft
configurations.
Graft outlet streamlines and velocity contours at a moment after peak systole (t = 0.39 s) in
transient simulation of the three SG configurations are displayed in Figure 13 and Figure 14.
This time point was chosen because it yielded the highest helicity value amongst the three
configurations. Similar to the corresponding steady-state streamlines, flow patterns in the left
graft outlets appear more developed and consist of higher velocities than in the right outlets.
Consistent with our steady-state results, the cross and direct configurations illustrate developing
helical flow, while the planar configuration demonstrates Dean flow at both outlets.

27
Figure 13. Streamlines superimposed on velocity contours at the left iliac artery graft outlet of
the direct, cross, and planar configurations (listed from left to right) in late systole (t = 0.39 s).
Figure 14. Streamlines superimposed on velocity contours at the right iliac artery graft outlet of
the direct, cross, and planar configurations (listed from left to right) in late systole (t = 0.39 s).
A plot of absolute area-averaged helicity among the three SG configurations illustrates that in the
out-of-plane configurations, the graft outlet of the left CIA shows greater helicity (see Figure
15). One can see that the absolute helicity for the cross configuration is greater than for the direct
configuration. Peak helicity (H = 7.7 m/s2) lagged behind peak systole (t = 0.30 s), but occurred
prior to inlet flow reversal (t = 0.50 s).

28
Figure 15. Absolute area-averaged helicity in the left and right CIA graft outlets of the three
graft configurations. Peak helicity lagged behind peak systole of the inlet velocity profile.
These helicity results can also be visualized as three-dimensional streamlines in the three graft
configurations, as shown in Figure 16. The brighter and darker colours on the streamlines
represent higher and lower magnitudes of velocity, respectively. A large recirculation zone is
prominent in the graft body in all three configurations. Recirculating flow is also more apparent
in the left CIA graft limb of the direct and cross configurations. Compared to its out-of-plane
counterparts, the planar configuration shows a smaller recirculation zone in the main body.

29
Figure 16. Three-dimensional streamlines within the a) direct, b) cross, and c) planar graft
configurations. A dense recirculation zone is prominent in all the graft main bodies.
A plot of the predicted transient AAWSS values in the three configurations is shown in Figure
17. The cross configuration predicted higher transient AAWSS than the direct configuration
throughout systole. However, in diastole, transient AAWSS between the direct and cross
configurations remained similar. Estimates of transient AAWSS from the planar configuration
were in surprisingly good agreement with predictions from the out-of-plane configurations. The
TAAWSS values for the direct, cross, and planar configurations were 0.71 Pa, 0.80 Pa, and 0.66
Pa, respectively. Contours of wall shear stress of each graft configuration at different time points
in the pulsatile cycle can be found in Appendices XII and XIII. The area-averaged OSI values for
the direct, cross, and planar configurations were 0.237, 0.227, and 0.231. Detailed contours of
OSI can be found in Appendix XIV for the three stent graft configurations studied.

30
Figure 17. Transient area-averaged wall shear stress (AAWSS) comparison between the three
graft configurations.

31
3.5 Discussion
The graft inlet diameter estimated from the CT images of our representative patient is smaller
than the range of 24 – 30 mm diameters used in most CFD studies of SGs [14, 16-19, 23-25], but
still within the range reported for AAA patients from the EUROSTAR registry [67]. As a result,
the displacement forces predicted from our study were lower than those commonly reported in
literature.
Good agreement was generally found between our steady-state and transient peak total
displacement force predictions. Our force results were substantiated by contour plots of total
pressure on graft walls post-processed from our steady-state and transient simulations (see
Appendix VIII for steady-state results, and Appendices X and XI for transient results). Under
both steady-state conditions and peak transient (i.e., when maximum inlet velocity occurs, t ≈
0.30 s) conditions, the magnitudes of total pressure of the cross configuration were generally
larger than those observed to be acting on the direct and planar configurations. The main body of
the cross configuration experienced the highest total pressures. Although total pressure
magnitudes in the direct and planar configurations were largely similar at steady-state, the direct
configuration generally showed higher magnitudes than the planar configuration in transient
simulation. Furthermore, the graft limbs of the cross configuration displayed localized regions of
higher total pressure under steady-state conditions that were absent in the direct and planar
configurations, likely due to the steady formation of flow helices. These regions of high pressure
were absent in all transient contours of total pressure. For the direct, cross, and planar
configurations, the difference between the steady-state and the peak total displacement force
predictions was 1.4%, 7.9%, and 0.4%, respectively. This agreement allowed us to proceed with
analyses of transient hemodynamics.
In comparison, the difference in predictions of peak force between the direct (4.28 N) and cross
(5.30 N) configurations was 8%. Meanwhile, the discrepancy in peak force between the planar
(3.22 N) and direct configurations was 41%. The planar configuration estimated significantly
lower peak and time-averaged total displacement forces in comparison to the out-of-plane
configurations. These peak force estimates corresponded to changes of 5%, 14%, and 6% from
the time-averaged magnitude of total displacement force for the direct, cross, and planar
configurations, respectively.

32
Our steady-state and transient displacement force results were in agreement with previous CFD
studies that illustrated strong similarities in steady-state and time-averaged predictions of force
values [16, 25]. However, these force predictions tend to be lower in magnitude than the
migration resistance offered by active fixation (e.g., hooks, barbs, radial force, columnar
strength, etc.) [31, 32]; leading us to believe that the cause of graft migration must be dependent
on other factors in addition to displacement forces. Our finding of lower predictions of axial
displacement force in the planar configuration relative to the out-of-plane configurations agreed
with a recent experimental study by Corbett et al. [34]. They demonstrated that increases in out-
of-planarity (tortuosity) were associated with increases in axial migration forces.
A plot of the standard deviations from the time-averaged directional displacement forces is
shown in Figure 18 to illustrate the fluctuations that are expected to contribute to SG failure due
to probable creep, fatigue, wear, or fracture [1, 29]. These force fluctuations can similarly be
observed in the evolution of total pressure contours of each graft configuration through time
(Appendices X and XI). The distribution of total pressure, and thus, the magnitude of total
displacement force, of the cross configuration experienced the largest fluctuations during the
pulsatile cycle relative to other graft configurations. Out of all the SG configurations studied, the
reduced curvature of the planar configuration resulted in the least axial, AP, and total
displacement force fluctuations over time (see Figure 18). It was also observed that axial force,
which contributes the most to total displacement force across all configurations, demonstrated
the largest fluctuations. Because SGs are designed with columnar rigidity and radial
expandability, axial force fluctuations are more likely to contribute to graft migration and other
failure modes than lateral or AP (radial) force fluctuations.
33
Figure 18. Standard deviations in transient displacement force components in the three graft
configurations.
However, directional force fluctuations were mostly less than 2% of the corresponding
configuration's time-averaged total displacement force. The only exception was axial force
fluctuations of the cross configuration, which deviated from the time-averaged displacement
force by approximately 4%. Interestingly, the magnitudes of directional force fluctuations in the
cross configuration were consistently 2-3 times larger than those of the direct configuration.
These observations highlight the behaviour of transient displacement forces and their
dependence on geometry. Relative to the direct and planar configurations, the crossed limbs of
the cross configuration had a larger wall area that can impede flow in the axial direction, causing
it to experience larger fluctuations in axial displacement force. These larger fluctuations in the
cross configuration may have been the cause of the notably higher difference of 7.9% between
the transient peak total displacement force and the steady-state prediction.
The normalized directional force contribution to the time-averaged total displacement force in
each SG configuration is summarized in Figure 19. The main contribution came from the axial
force component in all configurations. Overall, total displacement force in the planar
configuration was a strong function of axial force (a 99.8% dependence); the lateral and AP

34
component contributions were negligible. These results substantiate many early EVAR CFD and
analytical studies that modeled planar SGs, which our planar configuration was based on [10,
16].
Figure 19. Normalized directional force contributions to the overall, time-averaged displacement
force in the three graft configurations. Contribution of the axial force component is almost triple
the contribution of the lateral or AP component in the out-of-plane configurations.
The results from our out-of-plane configurations suggested that the total displacement force (and
consequently, in vivo graft migration) is dependent on multiple directional force contributions.
The normalized directional contributions of all components to displacement force (Eq. 1) were
highly similar between the two out-of-plane SG configurations. We attribute this similarity to the
identical orientations of their inlet and outlets. In these two SG configurations, the axial
component contributed almost three times more force than the AP or lateral components.
Several studies [24, 81] on out-of-plane SG displacement forces have also found the axial and
AP force components to be the largest contributors to total displacement force. However, they
did not find the high similarity between lateral and AP force contributions that we have

35
observed. These studies looked at a variety of patient-specific SG geometries using different
boundary conditions from our investigation. It was also interpreted from the results of Figueroa
et al. [56, 81] that directional displacement forces are highly sensitive to the locations of inlets
and outlets of SG geometries (see Appendix XV).
Unlike displacement force, the predicted TAAWSS values were different from those predicted
from steady-state simulations since shear forces are largely dependent on inlet velocity and SG
geometry [82]. While a steady-state inlet velocity of 0.5269 m/s was used to predict the largest
displacement forces experienced by each SG configuration, the time-averaged magnitude of our
transient inlet velocity profile was only one-tenth the steady-state velocity. As a result, our
steady-state AAWSS predictions were significantly higher than our TAAWSS predictions.
Furthermore, we observed that shear forces that acted on the SG were orders of magnitude lower
than displacement force contributions from pressure, inertia and momentum, which is in
agreement with previous studies [16, 56, 83].
The contour plots of WSS from our steady-state and transient simulations demonstrated that the
distribution of WSS were highly similar between the main bodies of the three SG configurations
(see Appendix IX for steady-state results, and Appendices XII and XIII for transient results). Our
steady-state WSS contours showed multiple regions of enhanced WSS magnitudes in the graft
limbs of the cross configuration. These regions resembled the pathway of helices. Such regions
were also observed in the transient WSS contours of the cross configuration, shortly after the
peak systolic inlet velocity (t ≥ 0.3 s). While the direct configuration also demonstrated similar
areas of enhanced WSS in steady-state and transient conditions, these areas of high WSS, which
suggests the presence of flow helices, were less prominent than in the cross configuration.
The change in the predicted steady-state AAWSS from the direct to the cross configuration was
an increase of 15%. Meanwhile, TAAWSS increased by 12% from the direct to the cross
configuration in transient simulation. Relative to the direct configuration, our results consistently
suggested that the cross configuration may improve resistance to graft thrombosis by increasing
WSS.
When considering TAAWSS (see Figure 17), the differences between the planar configuration
and the direct and cross configurations were 8% and 19%, respectively. When considering
steady-state AAWSS, the differences between the planar configuration and the direct and cross

36
configurations were 2% and 17%, respectively. Interestingly, predictions of transient AAWSS by
the planar configuration was highly similar to the direct and cross configurations throughout the
pulsatile cycle. This suggested that the identical main body of all the stent graft configurations
must have accounted for the regions of highest shear stress magnitudes (i.e., the bifurcation
region).
We hypothesized that helical flow can help reduce the documented incidence of graft limb
occlusion in literature. Since the outlets were identical among the out-of-plane graft
configurations, we chose the graft outlets for comparing helicity. We observed that the cross
configuration generated better-developed helical flow than the direct configuration, especially
visible at the left graft limb outlet. The higher transient magnitudes of helicity in the cross
configuration were reflected by enhanced and higher transient AAWSS when compared to the
direct configuration at those time points (0.3 ≤ t ≤ 0.6 s). This improvement in WSS was largely
due to the washing of the graft limb walls by the centrifugal forces of helical flow. The helicity
observed in the out-of-plane graft configurations were not sustained due to the lengthy damping
action of diastole in the physiologic inlet velocity profile used. Due to the presence of a large
recirculation zone in the main body of the graft, a delay was also observed between the surge in
inlet velocity to peak systole and the onset of helical flow at the outlets. Higher velocities (i.e.,
greater than the temporal mean velocity: 0.05 m/s) in the pulsatile inlet profile occur for
approximately 0.4 seconds (0.2 ≤ t ≤ 0.6 s, see Figure 15). However, the effective duration of
any helical flow across the graft configurations studied was only approximately 0.3 seconds (0.3
≤ t ≤ 0.6 s). The duration of effective helical flow was shortened due to a large dependence on
velocity in the calculation of helicity, such that low-magnitude inlet velocities would result in
near-zero helicity in the outlets. The large recirculation zone observed in all the graft bodies
agreed well with clinical reports of intraprosthetic thrombus observed shortly post-EVAR [54,
70, 84]. The geometry of the graft main bodies involved an expansion that led to convective flow
deceleration, which created regions demonstrating flow recirculation, low shear, and increased
residence times.
The cross configuration was able to generate a peak helicity value approximately 6 times greater
than that of the direct configuration at the left CIA outlet. Simultaneously, peak helicity at the
right CIA of the cross configuration was approximately double that of the direct configuration.
Also notable in Figure 15 were higher helicity values in the left graft outlets of the out-of-plane
37
configurations than the right, likely inherited from the natural posteriority of the left CIA [60].
Higher helicity is associated with improved WSS magnitudes and distribution [39, 42, 43].
Animal and clinical studies by Caro et al. [43] and Huijbregts et al. [85] have shown that
sustained helical flow can significantly reduce the occurrence of thrombosis inside vascular
grafts, particularly under steady-state conditions. To the best of our knowledge, there are no
numerical studies describing the benefits of helical flow to combat thrombosis in vascular grafts
under transient conditions. However, relative to the direct configuration, we did observe better-
developed helical flow in conjunction with enhanced wall shear stress in the cross configuration.
Thus, we believe that crossing the limbs may increase resistance to thrombosis.
Improved wall shear stress is a benefit of helical flow. The ability of helical flow to reduce flow
stagnation and separation can also potentially lower OSI. Since higher helicity values and helical
flow patterns were observed, it was unsurprising to find that the cross configuration predicted a
lower area-averaged OSI than the direct configuration. However, this difference was small
(about 4%), despite predictions of higher steady-state AAWSS and TAAWSS values in the cross
configuration by more than 10%. Likewise, in comparison to the planar configuration, steady-
state AAWSS and TAAWSS values of the cross configuration were improved by almost 20%,
yet the resulting area-averaged OSI of the cross configuration was lower by less than 2%. These
small differences in OSI between the three graft configurations resonated with observations from
our OSI contours (see Appendix XIV). Similar to our findings from steady-state and transient
contour plots of WSS, our OSI contours illustrated highly similar OSI patterns in the main bodies
of the three graft configurations. All three graft configurations also demonstrated localized
regions of high OSI values in their graft limbs. Nevertheless, our OSI results suggested that
thrombosis may occur similarly in the direct and cross SG configurations, but the cross
configuration may have a minute advantage in resistance to thrombosis due to a slightly lower
value of area-averaged OSI.
We believe the observed higher fluctuations of transient forces temporally in the cross
configuration may be cause for concern. Fluid-structure interaction (FSI) studies of different
graft configurations using pulsatile blood flow can help reveal differences in stent strut integrity
changes due to cyclic fatigue [6].

38
3.6 Conclusion
Our study has demonstrated that stent graft hemodynamic studies cannot be conducted with only
planar graft geometries, as their predictions of total and directional displacement forces are much
lower than those modeled using out-of-plane geometries. From a hemodynamic standpoint, we
showed that crossing the limbs in EVAR is as safe as traditional, non-crossed, EVAR practice.
The predicted values of displacement force, wall shear stress, helicity, and the oscillatory shear
index for the direct and cross configurations supported this claim. While cross-limb EVAR can
potentially reduce procedure time and prolong graft patency through helical flow generation,
higher magnitudes of force fluctuations predicted for the cross configuration may have long-term
implications. Differences in the clinical outcomes of the direct and cross-limb EVAR graft
configurations should be studied to validate our conclusions.

39
Chapter 4 Conclusion
4 Conclusion
4.1 Summary
This research has demonstrated that cross-limb EVAR practice creates a similar hemodynamic
flow field in the stent graft in relation to conventional, non-crossed, EVAR. We found these two
out-of-plane stent graft configurations yielded comparable magnitudes of directional
displacement forces, indicating that crossing the limbs is unlikely to increase the incidence of
clinical graft migration. Our results suggested that the cross-limb configuration may be more
resistant to thrombosis to some extent, due to helical flow generation. However, the larger
fluctuations in displacement force in the cross configuration may have potential impacts on the
long-term performance of the stent graft device with respect to creep, wear, and fatigue.
Meanwhile, the planar graft configuration predicted significantly lower total displacement force
values than its out-of-plane counterpart configurations, due to force discrepancies in all
directions. Comparisons of displacement forces between planar and out-of-plane geometries
should be done with caution.
4.2 Future Work
4.2.1 Comparison of Clinical Outcomes
Our study highlighted several hemodynamic performance differences in the stent graft
configurations representative of traditional and cross-limb EVAR. The clinical outcomes of
patients with either graft configuration can be followed to validate the results of our study.
4.2.2 Dislodgement Experiments of Out-of-Plane Grafts
Most experiments investigating migration resistance offered by different active fixation
mechanisms were conducted using planar graft configurations being pulled in one (axial)
direction. As our study demonstrated, there can be significant discrepancies in directional and

40
total displacement forces between planar and out-of-plane stent graft geometries. This finding
agrees with a recent study that showed increases in out-of-planarity (tortuosity) in non-rigid
grafts are related to axial migration force increases [34]. Since the aorto-iliac region is naturally
tortuous, future experiments should involve out-of-plane graft configurations being pulled in
multiple directions and angulations to test active fixation methods. Results from these
experiments, combined with displacement force predictions from numerical studies of patient-
specific geometries, would make for an ideal comparison to assess the likelihood of clinical graft
migration.
4.2.3 Fluid-Structure Interactions (FSI)
The larger displacement force fluctuations observed in the cross-limb configuration may cause
earlier stent strut fractures relative to the other configurations as time progresses, due to
repetition of the pulsatile cycle and metal fatigue. A graft hole can be created by the fractured
fragment, causing re-pressurization of the aneurysm sac [66]. With knowledge of the mechanical
properties of the stent graft, FSI studies can help identify when and where the stent structure may
be weakened in different graft configurations.
4.2.4 Transitional Turbulence Modeling
In the transient simulations of this and previous numerical studies, the assumption that blood
flow is laminar throughout the pulsatile cycle was made [18]. However, there are brief periods in
the pulsatile cycle where the flow may become turbulent (e.g., after peak systole and during flow
deceleration). Despite the availability of models for transitional modeling of turbulence in the
CFD software we have used, these models have yet to be validated thoroughly against
experiments for applications such as the aforementioned study [86]. After they have been
validated, follow-up numerical studies of EVAR graft configurations employing these models
can help identify the suitability of the laminar pulsatile flow assumption.

41
References
[1] Myers, K., Devine, T., Barras, C., 2001, "Endoluminal Versus Open Repair for Abdominal
Aortic Aneurysms," 2nd
Virtual Congress of Cardiology,
[http://www.fac.org.ar/scvc/llave/interven/myers/myersi.htm].
[2] Hallin, A., Bergqvist, D., and Holmberg, L., 2001, "Literature Review of Surgical
Management of Abdominal Aortic Aneurysm," European Journal of Vascular and
Endovascular Surgery, 22(3) pp. 197-204.
[3] Sternbergh III, W. C., Carter, G., York, J. W., 2002, "Aortic Neck Angulation Predicts
Adverse Outcome with Endovascular Abdominal Aortic Aneurysm Repair," Journal of
Vascular Surgery, 35(3) pp. 482-486.
[4] Mastracci, T. M., Cinà, C. S., and Canadian Society for Vascular Surgery, 2007, "Screening
for Abdominal Aortic Aneurysm in Canada: Review and Position Statement of the
Canadian Society for Vascular Surgery," Journal of Vascular Surgery, 45(6) pp. 1268-
1276.
[5] Bengtsson, H., and Bergqvist, D., 1993, "Ruptured Abdominal Aortic-Aneurysm - a
Population-Based Study," Journal of Vascular Surgery, 18(1) pp. 74-80.
[6] Kleinstreuer, C., Li, Z., and Farber, M. A., 2007, "Fluid-Structure Interaction Analyses of
Stented Abdominal Aortic Aneurysms," Annual Review of Biomedical Engineering, 9 pp.
169-204.
[7] Overbeck, K., Jackson, R., and Rose, J., 2005, "Complications and Bail-Out Situations
during AAA Endovascular Repair," Techniques in Vascular and Interventional Radiology,
8(1 SPEC. ISS.) pp. 22-29.
[8] Henretta, J. P., Karch, L. A., Hodgson, K. J., 1999, "Special Iliac Artery Considerations
during Aneurysm Endografting," American Journal of Surgery, 178(3) pp. 212-218.
[9] Ramaiah, V. G., Thompson, C. S., Shafique, S., 2002, "Crossing the Limbs: A Useful
Adjunct for Successful Deployment of the AneuRx Stent-Graft," Journal of Endovascular
Therapy, 9(5) pp. 583-586.
[10] Finol, E. A., Keyhani, K., and Amon, C. H., 2003, "The Effect of Asymmetry in Abdominal
Aortic Aneurysms Under Physiologically Realistic Pulsatile Flow Conditions," Journal of
Biomechanical Engineering, 125 pp. 207-217.
[11] Finol, E. A., and Amon, C. H., 2002, "Flow-Induced Wall Shear Stress in Abdominal
Aortic Aneurysms: Part II--Pulsatile Flow Hemodynamics." Computer Methods in
Biomechanics and Biomedical Engineering, 5(4) pp. 319-328.

42
[12] Finol, E. A., Marra, K. G., and Amon, C. H., 2003, "Analytical estimation of flow-induced
forces in endovascular grafts and design methodology for a tissue-engineered endovascular
attachment mechanism," Advances in Computational Bioengineering, 7 pp. 231-241.
[13] Taylor, C. A., and Figueroa, C. A., 2009, "Patient-Specific Modeling of Cardiovascular
Mechanics," Annual Review of Biomedical Engineering, 11 pp. 109-134.
[14] Morris, L., Delassus, P., Grace, P., 2006, "Effects of Flat, Parabolic and Realistic Steady
Flow Inlet Profiles on Idealised and Realistic Stent Graft Fits through Abdominal Aortic
Aneurysms (AAA)," Medical Engineering & Physics, 28(1 SPEC. ISS.) pp. 19-26.
[15] Glor, F. P., Long, Q., Hughes, A. D., 2003, "Reproducibility Study of Magnetic Resonance
Image-Based Computational Fluid Dynamics Prediction of Carotid Bifurcation Flow,"
Annals of Biomedical Engineering, 31(2) pp. 142-151.
[16] Liffman, K., Lawrence-Brown, M. M. D., Semmens, J. B., 2001, "Analytical Modeling and
Numerical Simulation of Forces in an Endoluminal Graft," Journal of Endovascular
Therapy, 8(4) pp. 358-371.
[17] Liffman, K., Sutalo, I. D., Bui, A., 2009, "Experimental Measurement and Mathematical
Modeling of Pulsatile Forces on a Symmetric, Bifurcated Endoluminal Stent Graft Model,"
Vascular, 17(4) pp. 201-209.
[18] Morris, L., Delassus, P., Walsh, M., 2004, "A Mathematical Model to Predict the in Vivo
Pulsatile Drag Forces Acting on Bifurcated Stent Grafts used in Endovascular Treatment of
Abdominal Aortic Aneurysms (AAA)," Journal of Biomechanics, 37(7) pp. 1087-1095.
[19] Li, Z., and Kleinstreuer, C., 2006, "Analysis of Biomechanical Factors Affecting Stent-
Graft Migration in an Abdominal Aortic Aneurysm Model," Journal of Biomechanics,
39(12) pp. 2264-2273.
[20] Li, Z., and Kleinstreuer, C., 2007, "A Comparison between Different Asymmetric
Abdominal Aortic Aneurysm Morphologies Employing Computational Fluid-Structure
Interaction Analysis," European Journal of Mechanics, B/Fluids, 26(5) pp. 615-631.
[21] Papaharilaou, Y., Doorly, D. J., and Sherwin, S. J., 2002, "The Influence of Out-of-Plane
Geometry on Pulsatile Flow within a Distal End-to-Side Anastomosis," Journal of
Biomechanics, 35(9) pp. 1225-1239.
[22] Tambasco, M., and Steinman, D. A., 2003, "Path-Dependent Hemodynamics of the
Stenosed Carotid Bifurcation," Annals of Biomedical Engineering, 31(9) pp. 1054-1065.
[23] Molony, D. S., Callanan, A., Morris, L. G., 2008, "Geometrical Enhancements for
Abdominal Aortic Stent-Grafts," Journal of Endovascular Therapy, 15(5) pp. 518-529.
[24] Molony, D. S., Kavanagh, E. G., Madhavan, P., 2010, "A Computational Study of the
Magnitude and Direction of Migration Forces in Patient-Specific Abdominal Aortic

43
Aneurysm Stent-Grafts," European Journal of Vascular and Endovascular Surgery, 40(3)
pp. 332-339.
[25] Howell, B. A., Kim, T., Cheer, A., 2007, "Computational Fluid Dynamics within Bifurcated
Abdominal Aortic Stent-Grafts," Journal of Endovascular Therapy, 14(2) pp. 138-143.
[26] Li, Z., Kleinstreuer, C., and Farber, M., 2005, "Computational Analysis of Biomechanical
Contributors to Possible Endovascular Graft Failure," Biomechanics and Modeling in
Mechanobiology, 4(4) pp. 221-234.
[27] Scotti, C. M., and Finol, E. A., 2007, "Compliant Biomechanics of Abdominal Aortic
Aneurysms: A Fluid-Structure Interaction Study," Computers and Structures, 85(11-14) pp.
1097-1113.
[28] Figueroa, C. A., Baek, S., Vignon-Clementel, I. E., 2006, "Towards patient-specific
modeling I: Hemodynamics in a growing aneurysm," Medical Imaging 2006: Physiology,
Function, and Structure from Medical Images, Proc. SPIE 6143 pp. 186-196.
[29] Chuter, T. A. M., 2009, "Durability of Endovascular Infrarenal Aneurysm Repair: When
does Late Failure Occur and Why?" Seminars in Vascular Surgery, 22(2) pp. 102-110.
[30] Mohan, I. V., Harris, P. L., Van Marrewijk, C. J., 2002, "Factors and Forces Influencing
Stent-Graft Migration After Endovascular Aortic Aneurysm Repair," Journal of
Endovascular Therapy, 9(6) pp. 748-755.
[31] Malina, M., Lindblad, B., Ivancev, K., 1998, "Endovascular AAA Exclusion: Will Stents
with Hooks and Barbs Prevent Stent-Graft Migration?" Journal of Endovascular Surgery,
5(4) pp. 310-317.
[32] Bosman, W. M. P. F., Steenhoven, T. J. v. d., Suárez, D. R., 2010, "The Proximal Fixation
Strength of Modern EVAR Grafts in a Short Aneurysm Neck. An in Vitro Study,"
European Journal of Vascular and Endovascular Surgery, 39(2) pp. 187-192.
[33] Zhou, S. N., How, T. V., Black, R. A., 2008, "Measurement of Pulsatile Haemodynamic
Forces in a Model of a Bifurcated Stent Graft for Abdominal Aortic Aneurysm Repair,"
Proceedings of the Institution of Mechanical Engineers Part H-Journal of Engineering in
Medicine, 222(H4) pp. 543-549.
[34] Corbett, T. J., Callanan, A., and McGloughlin, T. M., 2011, "In Vitro Measurement of the
Axial Migration Force on the Proximal End of a Bifurcated Abdominal Aortic Aneurysm
Stent-Graft Model," Proceedings of the Institution of Mechanical Engineers, Part H:
Journal of Engineering in Medicine, 225(4) pp. 401-409.
[35] Maldonado, T., Ranson, M., Rockman, C., 2007, "Decreased Ischemic Complications After
Endovascular Aortic Aneurysm Repair with Newer Devices," Vascular and Endovascular
Surgery, 41(3) pp. 192-199.

44
[36] Liaw, J. V. P., Clark, M., Gibbs, R., 2009, "Update: Complications and Management of
Infrarenal EVAR," European Journal of Radiology, 71(3) pp. 541-551.
[37] Carroccio, A., Faries, P. L., Morrissey, N. J., 2002, "Predicting Iliac Limb Occlusions After
Bifurcated Aortic Stent Grafting: Anatomic and Device-Related Causes," Journal of
Vascular Surgery, 36(4) pp. 679-684.
[38] Maldonado, T. S., Rockman, C. B., Riles, E., 2004, "Ischemic Complications After
Endovascular Abdominal Aortic Aneurysm Repair," Journal of Vascular Surgery, 40(4) pp.
703-709.
[39] Lee, K. E., Lee, J. S., and Yoo, J. Y., 2011, "A Numerical Study on Steady Flow in
Helically Sinuous Vascular Prostheses," Medical Engineering & Physics, 33(1) pp. 38-46.
[40] Sun, A., Fan, Y., and Deng, X., 2009, "Numerical Investigation of Blood Flow in the Distal
End of an Axis-Deviated Arterial Bypass Model," Biorheology, 46(2) pp. 83-92.
[41] Wang, X., Lin, P., Yao, Q., 2007, "Development of Small-Diameter Vascular Grafts,"
World Journal of Surgery, 31(4) pp. 682-689.
[42] Cookson, A. N., Doorly, D. J., and Sherwin, S. J., 2009, "Mixing through Stirring of Steady
Flow in Small Amplitude Helical Tubes," Annals of Biomedical Engineering, 37(4) pp.
710-721.
[43] Caro, C. G., Cheshire, N. J., and Watkins, N., 2005, "Preliminary Comparative Study of
Small Amplitude Helical and Conventional ePTFE Arteriovenous Shunts in Pigs," Journal
of the Royal Society Interface, 2(3) pp. 261-266.
[44] Stonebridge, P. A., and Brophy, C. M., 1991, "Spiral Laminar Flow in Arteries?" Lancet,
338(8779) pp. 1360-1361.
[45] Kilner, P. J., Yang, G. Z., Mohiaddin, R. H., 1993, "Helical and Retrograde Secondary
Flow Patterns in the Aortic-Arch Studied by 3-Directional Magnetic-Resonance Velocity
Mapping," Circulation, 88(5) pp. 2235-2247.
[46] Morbiducci, U., Ponzini, R., Rizzo, G., 2009, "In Vivo Quantification of Helical Blood
Flow in Human Aorta by Time-Resolved Three-Dimensional Cine Phase Contrast
Magnetic Resonance Imaging," Annals of Biomedical Engineering, 37(3) pp. 516-531.
[47] Zhan, F., Fan, Y., and Deng, X., 2010, "Swirling Flow Created in a Glass Tube Suppressed
Platelet Adhesion to the Surface of the Tube: Its Implication in the Design of Small-Caliber
Arterial Grafts," Thrombosis Research, 125(5) pp. 413-418.
[48] Liu, X., Pu, F., Fan, Y., 2009, "A Numerical Study on the Flow of Blood and the Transport
of LDL in the Human Aorta: The Physiological Significance of the Helical Flow in the
Aortic Arch," American Journal of Physiology - Heart and Circulatory Physiology, 297(1)
pp. H163-H170.

45
[49] Wootton, D. M., and Ku, D. N., 1999, "Fluid Mechanics of Vascular Systems, Diseases,
and Thrombosis," Annual Review of Biomedical Engineering, 1 pp. 299-329.
[50] Ku, D. N., Giddens, D. P., Zarins, C. K., 1985, "Pulsatile Flow and Atherosclerosis in the
Human Carotid Bifurcation - Positive Correlation between Plaque Location and Low and
Oscillating Shear-Stress," Arteriosclerosis, 5(3) pp. 293-302.
[51] Caro, C. G., Doorly, O. J., Tarnawski, M., 1996, "Non-Planar Curvature and Branching of
Arteries and Non-Planar-Type Flow," Proceedings of the Royal Society A: Mathematical,
Physical and Engineering Sciences, 452(1944) pp. 185-197.
[52] Morbiducci, U., Ponzini, R., Grigioni, M., 2007, "Helical Flow as Fluid Dynamic Signature
for Atherogenesis Risk in Aortocoronary Bypass. A Numeric Study," Journal of
Biomechanics, 40(3) pp. 519-534.
[53] Jacobs, T. S., Won, J., Gravereaux, E. C., 2003, "Mechanical Failure of Prosthetic Human
Implants: A 10-Year Experience with Aortic Stent Graft Devices," Journal of Vascular
Surgery, 37(1) pp. 16-26.
[54] Mestres, G., Maeso, J., Fernandez, V., 2009, "Incidence and Evolution of Mural Thrombus
in Abdominal Aortic Endografts," Annals of Vascular Surgery, 23(5) pp. 627-633.
[55] Tse, L. W., 2010, "Computational Fluid Dynamics Modeling of Redundant Stent-Graft
Configurations in Endovascular Aneurysm Repair: MASc Thesis". University of Toronto,
Toronto, Canada.
[56] Figueroa, C. A., Taylor, C. A., Yeh, V., 2009, "Effect of Curvature on Displacement Forces
Acting on Aortic Endografts: A 3-Dimensional Computational Analysis," Journal of
Endovascular Therapy, 16(3) pp. 284-294.
[57] Chong, C. K., and How, T. V., 2004, "Flow Patterns in an Endovascular Stent-Graft for
Abdominal Aortic Aneurysm Repair," Journal of Biomechanics, 37(1) pp. 89-97.
[58] How, T. V., Black, R. A., and Annis, D., 1988, "Comparison of Pressure Losses in Steady
Non-Newtonian Flow through Experimental Tapered and Cylindrical Arterial Prostheses,"
Journal of Biomedical Engineering, 10(3) pp. 225-230.
[59] Prakash, S., and Ethier, C. R., 2001, "Requirements for Mesh Resolution in 3D
Computational Hemodynamics," Journal of Biomechanical Engineering, 123(2) pp. 134-
144.
[60] Dang, W., Kilian, M., Peterson, M. D., 2010, "Relationship between Access Side used to
Deliver the Main Body of Bifurcated Prostheses for Endovascular Aneurysm Repair and
Speed of Cannulation of the Contralateral Limb," Journal of Vascular Surgery, 51(1) pp.
33-37.e1.
46
[61] Hobo, R., Kievit, J., Leurs, L. J., 2007, "Influence of Severe Infrarenal Aortic Neck
Angulation on Complications at the Proximal Neck Following Endovascular AAA Repair:
A EUROSTAR Study," Journal of Endovascular Therapy, 14(1) pp. 1-11.
[62] Bastos Gonçalves, F., de Vries, J. -. P. M., van Keulen, J. W., 2011, "Severe Proximal
Aneurysm Neck Angulation: Early Results using the Endurant Stentgraft System,"
European Journal of Vascular and Endovascular Surgery, 41(2) pp. 193-200.
[63] Cronenwett, J.L., and Johnston, K.W., 2010, "Rutherford's Vascular Surgery," 7th
edition,
Saunders: Philadelphia, Pennsylvania.
[64] Zarins, C. K., Bloch, D. A., Crabtree, T., 2003, "Stent Graft Migration After Endovascular
Aneurysm Repair: Importance of Proximal Fixation," Journal of Vascular Surgery, 38(6)
pp. 1264-1272.
[65] Albertini, J. N., Macierewicz, J. A., Yusuf, S. W., 2001, "Pathophysiology of Proximal
Perigraft Endoleak Following Endovascular Repair of Abdominal Aortic Aneurysms: A
Study using a Flow Model," European Journal of Vascular and Endovascular Surgery,
22(1) pp. 53-56.
[66] Desai, M., Eaton-Evans, J., Hillery, C., 2010, "AAA Stent-Grafts: Past Problems and
Future Prospects," Annals of Biomedical Engineering, 38(4) pp. 1259-1275.
[67] Hobo, R., Sybrandy, J. E. M., Harris, P. L., 2008, "Endovascular Repair of Abdominal
Aortic Aneurysms with Concomitant Common Iliac Artery Aneurysm: Outcome Analysis
of the EUROSTAR Experience," Journal of Endovascular Therapy, 15(1) pp. 12-22.
[68] Cochennec, F., Becquemin, J. P., Desgranges, P., 2007, "Limb Graft Occlusion Following
EVAR: Clinical Pattern, Outcomes and Predictive Factors of Occurrence," European
Journal of Vascular and Endovascular Surgery, 34(1) pp. 59-65.
[69] Sivamurthy, N., Schneider, D. B., Reilly, L. M., 2006, "Adjunctive Primary Stenting of
Zenith Endograft Limbs during Endovascular Abdominal Aortic Aneurysm Repair:
Implications for Limb Patency," Journal of Vascular Surgery, 43(4) pp. 662-668.
[70] Wu, I. H., Liang, P. C., Huang, S. C., 2009, "The Significance of Endograft Geometry on
the Incidence of Intraprosthetic Thrombus Deposits After Abdominal Endovascular
Grafting," European Journal of Vascular and Endovascular Surgery, 38(6) pp. 741-747.
[71] Chiu, J., and Chien, S., 2011, "Effects of Disturbed Flow on Vascular Endothelium:
Pathophysiological Basis and Clinical Perspectives," Physiological Reviews, 91(1) pp. 327-
387.
[72] Caro, C. G., 2009, "Discovery of the Role of Wall Shear in Atherosclerosis,"
Arteriosclerosis Thrombosis and Vascular Biology, 29(2) pp. 158-161.
[73] Shaaban, A. M., and Duerinckx, A. J., 2000, "Wall Shear Stress and Early Atherosclerosis:
A Review," American Journal of Roentgenology, 174(6) pp. 1657-1665.

47
[74] Malek, A. M., Alper, S. L., and Izumo, S., 1999, "Hemodynamic Shear Stress and its Role
in Atherosclerosis," Journal of the American Medical Association, 282(21) pp. 2035-2042.
[75] Ku, D. N., 1997, "Blood Flow in Arteries," Annual Review of Fluid Mechanics, 29 pp. 399-
434.
[76] Zarins, C. K., Giddens, D. P., Bharadvaj, B. K., 1983, "Carotid Bifurcation Atherosclerosis
Quantitative Correlation of Plaque Localization with Flow Velocity Profiles and Wall
Shear-Stress," Circulation Research, 53(4) pp. 502-514.
[77] Stonebridge, P. A., Hoskins, P. R., Allan, P. L., 1996, "Spiral Laminar Flow in Vivo,"
Clinical Science, 91(1) pp. 17-21.
[78] Di Martino, E. S., Guadagni, G., Fumero, A., 2001, "Fluid–structure Interaction within
Realistic Three-Dimensional Models of the Aneurysmatic Aorta as a Guidance to Assess
the Risk of Rupture of the Aneurysm," Medical Engineering & Physics, 23(9) pp. 647-655.
[79] Vignon-Clementel, I. E., Figueroa, C. A., Jansen, K. E., 2006, "Outflow Boundary
Conditions for Three-Dimensional Finite Element Modeling of Blood Flow and Pressure in
Arteries," Computer Methods in Applied Mechanics and Engineering, 195(29-32) pp. 3776-
3796.
[80] Taylor, C. A., Cheng, C. P., Espinosa, L. A., 2002, "In Vivo Quantification of Blood Flow
and Wall Shear Stress in the Human Abdominal Aorta during Lower Limb Exercise,"
Annals of Biomedical Engineering, 30(3) pp. 402-408.
[81] Figueroa, C. A., Taylor, C. A., Yeh, V., 2010, "Preliminary 3D Computational Analysis of
the Relationship between Aortic Displacement Force and Direction of Endograft
Movement," Journal of Vascular Surgery, 51(6) pp. 1488-1497.
[82] Myers, J. G., Moore, J. A., Ojha, M., 2001, "Factors Influencing Blood Flow Patterns in the
Human Right Coronary Artery," Annals of Biomedical Engineering, 29(2) pp. 109-120.
[83] Liffman, K., Sutalo, I. D., Lawrence-Brown, M. M. D., 2006, "Movement and Dislocation
of Modular Stent-Grafts due to Pulsatile Flow and the Pressure Difference between the
Stent-Graft and the Aneurysm Sac," Journal of Endovascular Therapy, 13(1) pp. 51-61.
[84] Maleux, G., Koolen, M., Heye, S., 2008, "Mural Thrombotic Deposits in Abdominal Aortic
Endografts are Common and do Not Require Additional Treatment at Short-Term and
Midterm Follow-Up," Journal of Vascular and Interventional Radiology, 19(11) pp. 1558-
1562.
[85] Huijbregts, H. J. T. A. M., Blankestijn, P. J., Caro, C. G., 2007, "A Helical PTFE
Arteriovenous Access Graft to Swirl Flow Across the Distal Anastomosis: Results of a
Preliminary Clinical Study," European Journal of Vascular and Endovascular Surgery,
33(4) pp. 472-475.
48
[86] Tan, F. P. P., Soloperto, G., Bashford, S., 2008, "Analysis of Flow Disturbance in a
Stenosed Carotid Artery Bifurcation using Two-Equation Transitional and Turbulence
Models," Journal of Biomechanical Engineering, 130(6) pp. 061008-1–061008-12.

49
Appendices
Appendix I – ISET 2010 Audience Poll Results
International Symposium on Endovascular Therapy (ISET 2010). January 17-21, 2010.
Hollywood, Florida, USA.
Question 219:
Appendix II – CSVS 2011 Audience Poll Results
Canadian Society for Vascular Surgery Annual Meeting (CSVS 2011). September 21-23, 2011.
Vancouver, British Columbia, Canada.
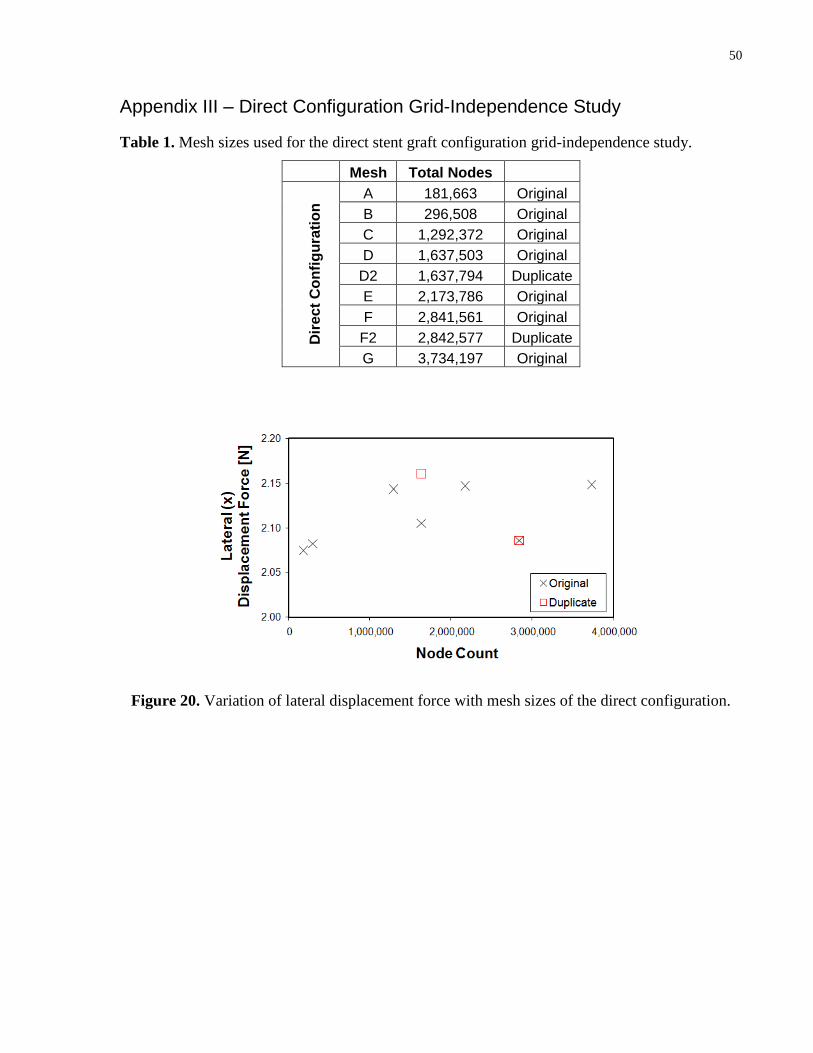
50
Appendix III – Direct Configuration Grid-Independence Study
Table 1. Mesh sizes used for the direct stent graft configuration grid-independence study.
Mesh Total Nodes
Dir
ec
t C
on
fig
ura
tio
n A 181,663 Original
B 296,508 Original
C 1,292,372 Original
D 1,637,503 Original
D2 1,637,794 Duplicate
E 2,173,786 Original
F 2,841,561 Original
F2 2,842,577 Duplicate
G 3,734,197 Original
Figure 20. Variation of lateral displacement force with mesh sizes of the direct configuration.

51
Figure 21. Variation of anterior-posterior displacement force with mesh sizes of the direct
configuration.
Figure 22. Variation of axial displacement force with mesh sizes of the direct configuration.

52
Figure 23. Variation of lateral area-averaged wall shear stress with mesh sizes of the direct
configuration.
Figure 24. Variation of anterior-posterior area-averaged wall shear stress with mesh sizes of the
direct configuration.

53
Figure 25. Variation of axial area-averaged wall shear stress with mesh sizes of the direct
configuration.

54
Appendix IV – Cross Configuration Grid-Independence Study
Table 2. Mesh sizes used for the cross stent graft configuration grid-independence study.
Mesh Total Nodes
Cro
ss C
on
fig
ura
tio
n A 630,576 Original
B 860,671 Original
C 1,113,339 Original
D 1,741,303 Original
D2 1,742,746 Duplicate
E 3,093,509 Original
E2 3,097,755 Duplicate
F 3,986,802 Original
Figure 26. Variation of lateral displacement force with mesh sizes of the cross configuration.

55
Figure 27. Variation of anterior-posterior displacement force with mesh sizes of the cross
configuration.
Figure 28. Variation of axial displacement force with mesh sizes of the cross configuration.

56
Figure 29. Variation of lateral area-averaged wall shear stress with mesh sizes of the cross
configuration.
Figure 30. Variation of anterior-posterior area-averaged wall shear stress with mesh sizes of the
cross configuration.

57
Figure 31. Variation of axial area-averaged wall shear stress with mesh sizes of the cross
configuration.

58
Appendix V – Planar Configuration Grid-Independence Study
Table 3. Mesh sizes used for the planar stent graft configuration grid-independence study.
Mesh Total Nodes
Pla
na
r C
on
fig
ura
tio
n
A 181,021 Original
B 371,754 Original
C 1,061,182 Original
D 1,616,066 Original
D2 1,615,701 Duplicate
E 2,834,245 Original
E2 2,832,853 Duplicate
F 3,641,102 Original
Figure 32. Variation of lateral displacement force with mesh sizes of the planar configuration.

59
Figure 33. Variation of anterior-posterior displacement force with mesh sizes of the planar
configuration.
Figure 34. Variation of axial displacement force with mesh sizes of the planar configuration.
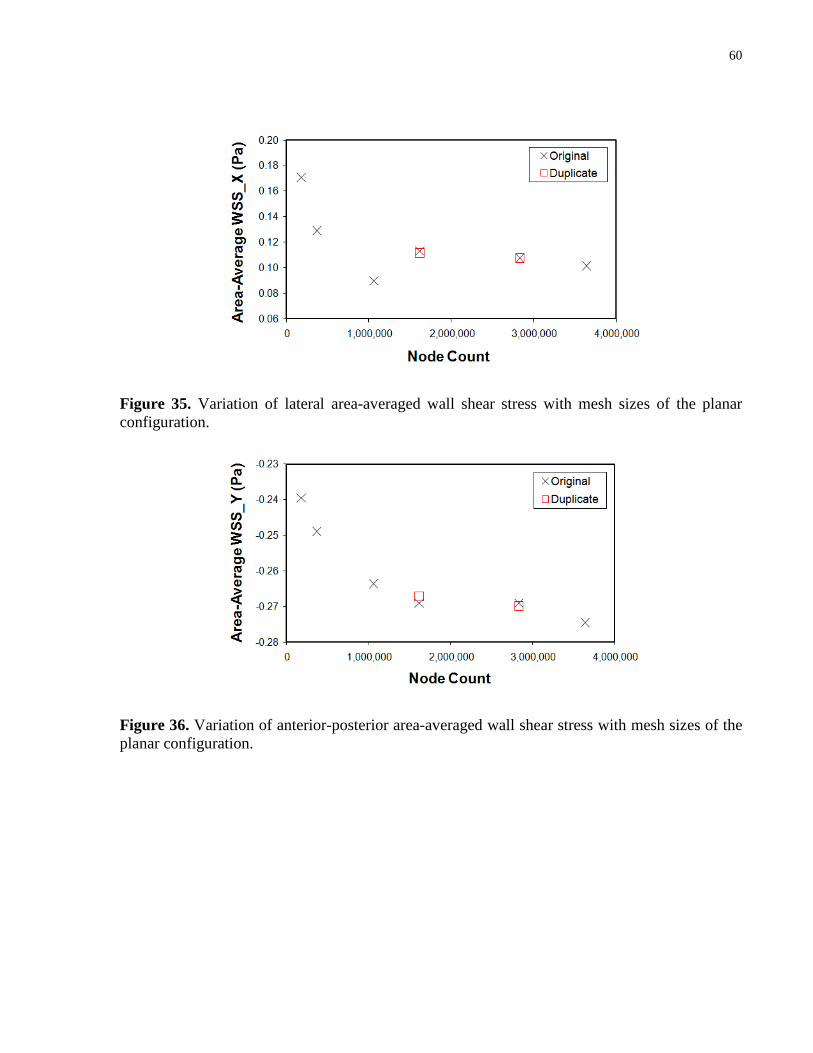
60
Figure 35. Variation of lateral area-averaged wall shear stress with mesh sizes of the planar
configuration.
Figure 36. Variation of anterior-posterior area-averaged wall shear stress with mesh sizes of the
planar configuration.

61
Figure 37. Variation of axial area-averaged wall shear stress with mesh sizes of the planar
configuration.

62
Appendix VI –Direct Configuration Time-Periodicity Study
Figure 38. Time-periodicity of area-averaged wall shear stress in the direct configuration.
Figure 39. Time-periodicity of total displacement force in the direct configuration.

63
Figure 40. Time-periodicity of the imposed inlet boundary condition of the direct configuration.

64
Appendix VII – Cross Configuration Time-Periodicity Study
Figure 41. Time-periodicity of area-averaged wall shear stress in the cross configuration.
Figure 42. Time-periodicity of total displacement force in the cross configuration.

65
Figure 43. Time-periodicity of the imposed inlet boundary condition of the cross configuration.

66
Appendix VIII – Contour Plots of Steady-State Total Pressure
Front view:
Back view:

67
Appendix IX – Contour Plots of Steady-State Wall Shear Stress
Front view:
Back view:

68
Appendix X – Contour Plots of Transient Total Pressure (Front View)

69

70
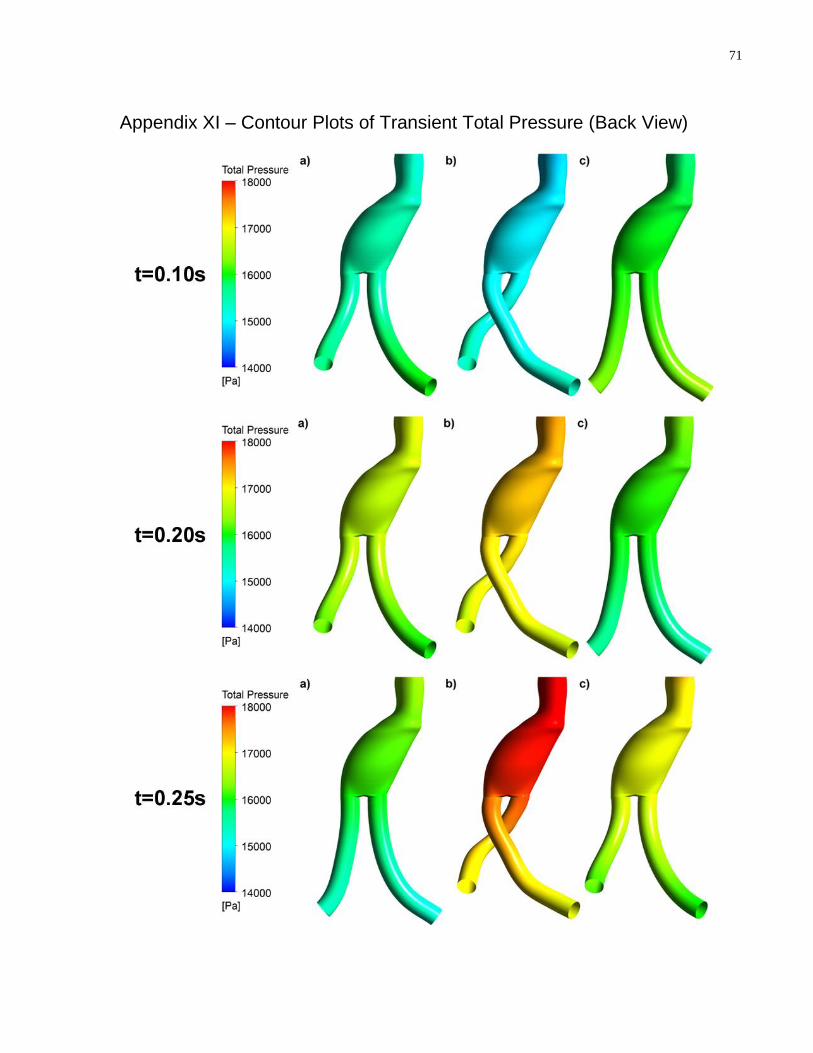
71
Appendix XI – Contour Plots of Transient Total Pressure (Back View)

72

73

74
Appendix XII – Contour Plots of Transient Wall Shear Stress (Front View)
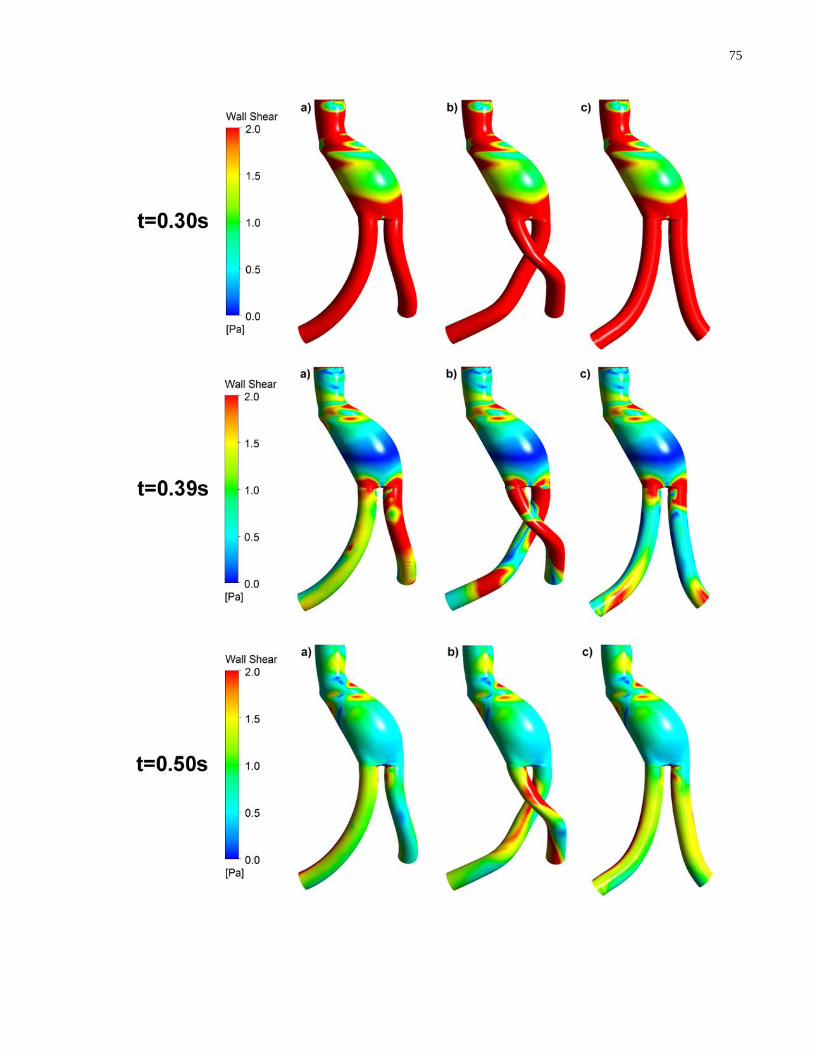
75

76

77
Appendix XIII – Contour Plots of Transient Wall Shear Stress (Back View)

78

79

80
Appendix XIV – Contour Plots of Oscillatory Shear Index
Front View:
Back view:

81
Appendix XV – Normalized Directional Force Contributions of Other Patient-Specific Geometries
Table 4. Figueroa et al. [56] found the AP directional force contribution to be the largest for
different variations of graft configurations constructed based on one patient‟s medical images.
Geometry
Mean ± st.dev.*
Curved Endograft (Patient)
Straight Neck
Straight Iliacs
Reduced Curvature (Planar)
Dis
pla
cem
en
t
Forc
e
Fx (lateral)
[N] -2.22 -1.48 0.28 -0.29
Fy (anterior)
[N] 4.26 3.43 2.09 0.72
Fz (axial)
[N] -1.42 -1.87 -0.19 -0.24
Total Force
[N] 5.01 4.18 2.12 0.81
No
rmal
ize
d F
orc
e C
on
trib
uti
on
Lateral 19.6% 12.6% 1.7% 12.7% 11.7 ± 7.4%
AP 72.3% 67.4% 97.4% 78.5% 78.9 ± 13.2%
Axial 8.0% 20.0% 0.8% 8.7% 9.4 ± 7.9%
* Note that the standard deviations in this study, particularly in the AP and axial directions, are
lower than those reported by Figueroa et al. [81] and Molony et al. [24] (in the tables
immediately following). This is because only one geometric parameter was varied from the
patient-specific geometry in the construction of each of the 3 geometries additionally studied.

82
Table 5. This set of results from Figueroa et al. [81] shows that the AP and axial directional
force contributions were the largest for 5 different patient-specific graft geometries.
Patient
Mean ± st.dev. 1 2 3 4 5
Dis
pla
cem
en
t
Forc
e
Fx (lateral)
[N] -2.4 -0.4 -0.7 1.1 -0.6
Fy (anterior)
[N] 2.6 8.5 5 0.8 3.9
Fz (axial)
[N] -3.3 -4.2 -2.3 -3.3 -3.4
Total Force
[N] 4.84 9.49 5.55 3.57 5.21
No
rmal
ize
d F
orc
e C
on
trib
uti
on
Lateral 24.6% 0.2% 1.6% 9.5% 1.3% 7.4 ± 10.3%
AP 28.9% 80.2% 81.2% 5.0% 56.1% 50.3 ± 33.1%
Axial 46.5% 19.6% 17.2% 85.5% 42.6% 42.3 ± 27.5%

83
Table 6. This set of results from Molony et al. [24] shows that the AP and axial directional force
contributions were, overall, the largest for 10 different patient-specific graft geometries.
Patient Mean ± st.dev. 1 2 3 4 5
Dis
pla
cem
en
t
Forc
e
Fx (lateral)
[N] -0.76 2.09 0.76 0.96 0.49
Fy (anterior)
[N] 10.78 0.36 1.54 2.34 0.68
Fz (axial)
[N] -0.85 3.4 2 4.67 4.4
Total Force
[N] 10.84 4.01 2.64 5.31 4.48
No
rmal
ize
d F
orc
e C
on
trib
uti
on
Lateral 0.5% 27.2% 8.3% 3.3% 1.2%
AP 98.9% 0.8% 34.1% 19.4% 2.3%
Axial 0.6% 72.0% 57.6% 77.3% 96.5%
Patient Mean ± st.dev. (of 10 patients) 6 7 8 9 10
Dis
pla
cem
en
t
Forc
e
Fx (lateral)
[N] -0.72 -2.9 -2.41 1.7 -0.31
Fy (anterior)
[N] 5.65 3.68 4.99 8.73 0.53
Fz (axial)
[N] 2.89 2.62 -0.39 5.2 6.67
Total Force
[N] 6.39 5.37 5.56 10.3 6.7
No
rmal
ized
Fo
rce
Co
ntr
ibu
tio
n Lateral 1.3% 29.2% 18.8% 2.7% 0.2% 9.3 ± 11.4%
AP 78.3% 47.0% 80.7% 71.8% 0.63% 43.4 ± 37.3%
Axial 20.5% 23.8% 0.5% 25.5% 99.2% 4.3 ± 37.8%