computational experience with a three-dimensional … · computational experience with a...
TRANSCRIPT
NASA Technical Memorandum 103104
Computational Experience Witha Three-Dimensional Rotary
Engine Combustion Model
M.S. Raju
Sverdrup Technology, Inc.
Lewis Research Center GroupBrook Park, Ohio
and
E.A. Willis
National Aeronautics and Space AdministrationLewis Research Center
Cleveland, Ohio
Prepared for the
Joint Symposium on General Aviation Systems
cosponsored by the AIAA and FAA
Ocean City, New Jersey, April 11-12, 1990
c, 3l_a
https://ntrs.nasa.gov/search.jsp?R=19900016959 2018-08-28T07:56:50+00:00Z

COMPUTATIONAL EXPERIENCE WITH A THREE-DIMENSIONAL ROTARY
ENGINE COMBUSTION MODEL
M.S. Raju*Sverdrup Technology, Inc.
Lewis Research Center GroupBrook Park, Ohio 44142
and
E.A. Willist
National Aeronautics and Space AdministrationLewis Research CenterCleveland, Ohio 44135
SUMMARY
A new computer code has been developed to analyze the chemically reactiveflow and spray combustion processes occurring inside a stratified-charge rotaryengine. Mathematical and numerical details of the new code were recentlydescribed by the present authors. This paper presents the results of limited,initial computational trials as a first step in a long-term assessment/validation process. The engine configuration studied was chosen to approximateexisting rotary engine flow-visualization and hot-firing test rigs. Typicalresults include (1) pressure and temperature histories, (2) torque generatedby the nonuniform pressure distribution within the chamber, (3) energy releaserates, and (4) various flow-related phenomena. These are discussed and com-pared with other predictions reported in the literature. The adequacy or needfor improvement in the spray/combustion models and the need for incorporatingan appropriate turbulence model are also discussed.
INTRODUCTION
The rotary combustion engine (RCE) would be a desirable powerplant forlight aircraft, drones, auxiliary and ground power units, and marine and indus-trial applications if its efficiency could be made closer to that of dieselengines. It has inherent advantages over reciprocating engines such as higherairflow capacity, higher power-to-weight ratio, low frontal area, and lessvibration. An initial attempt to introduce a gasoline-fueled rotary engineinto the general aviation market in the mid 1970's was unsuccessful, however,because of poor fuel economy, uncertain availability of avgas, and marginalweight advantage over contemporary reciprocating engines. Subsequent researchsponsored by industry, NASA, and the Navy has led to the development of thestratified-charge rotary engine (SCRE) concept. This work has already demon-strated a substantial improvement in specific power, multifuel capability, anda reduction of cruise brake specific fuel consumption (BSFC) from over0.5 lb/bhp-hr to a value approaching 0.41 lb/bhp-hr. A major factor in thisimprovement was the use of Computational Fluid Dynamics (CFD) methods to
*Senior Research Engineer, Member AIAA.tChief Engineer, Propulsion Systems Division, Member AIAA.

analyze the airflow, spray, and combustion events of the RCE. Continuing
research and development sponsored by NASA is aimed at further reducing the
cruise BSFC, from the current value to 0.35 or less, by the end of 1992. Much
of the expected improvement will be enabled by further CFD-driven fuel injec-
tion, spray and nozzle optimization, rotor pocket reshaping and relocation,and related changes. Thus, the availability of accurate, reliable, and fast
operating CFD simulations of the RCE internal processes is clearly a key ele-
ment in the future development of this promising engine concept.
Early modeling efforts on the Wankel engine were based on thermodynamicmodels (refs. 1 and 2) and also on one-dimensional modeling of premixed-chargecombustion (ref. 3). Multidimensional models of the Wankel engine are of morerecent origin. Grasso et al. (ref. 4) presented the first three-dimensionalcomputations of an SCRE during the early stages of flame propagation. Subse-quent computations performed by Abraham and Bracco (refs. 5 and 6) led to someimportant design changes in the rotary engine development at Deere and Co.,especially in the fuel injector configuration. Their code, REC-3D-FSC-86, is amodified version of the KIVA code developed at Los Alamos National Laboratory(ref. 7) for the modeling of reciprocating engines. KIVA makes use of a condi-tionally stable algorithm, and the stability of the KIVA scheme is improved bymaking use of an acoustic subcycling step in order to alleviate the stiffness
problems arising from compressibility effects. There appears to be consider-able room for improvement in the code, since it neglects the spatial gradientswhenever the grid spacing becomes smaller than some predefined value and alsorequires excessive CPU time when the engine speed becomes small. Shih et al.(ref. 8) presented the first two-dimensional computations of a motored Wankelengine in the absence of combustion. Their code, LEWIS-2D, is based on theBeam-Warming type of alternating-direction implicit (ADI) method. Their compu-tations were subsequently extended to three dimensions in Steinthorsson et al.(ref. 9). Linear stability analysis has shown that the ADI method is uncondi-tionally stable in two dimensions but is unconditionally unstable in threedimensions. Although artificial dissipation has some stabilizing effect, anexcessive amount can impair stability and reduce accuracy and convergence.Recently, Li et al. (ref. 10) modified their LEWIS-3D code based on upwindschemes together with the incorporation of a k-¢ turbulence model.
The present solution procedure differs from the above in terms of the num-
erics and the submodels used for turbulence, combustion, and sprays. Mathemat-ical and numerical details of the new code were recently described by thepresent authors (ref. 11). This paper presents the results of limited, initial
computational trials as a first step in a long-term assessment/validation proc-ess. The engine configuration studied was chosen to approximate existingrotary engine test rigs. Representative results - in terms of pressure andtemperature histories, torque generated due to the nonuniform pressure distri-bution within the chamber, energy release rates, and various flaw-related phe-nomena - are discussed in comparison with other predictions reported to datein the literature. The objective is to evaluate the adequacy or need forimprovement in the spray/combustion models and to assess the need for incorpo-rating an appropriate turbulence model.
PHYSICAL DESCRIPTION
A schematic of the Wankel engine is shown in figure 1. The Wankel engineis composed of a trochoid housing (ref. 1) with peripheral intake and exhaust
ports, fuel injector and spark igniter, a three-flank rotor, and a crankshaft.The contour of the inner surface of the outer casing of the Wankel engine is atwo-lobe peritrochoid. The contour of a rotor revolving along an outer housingis a peritrochoid inner envelope. The rotor surface is modified to includerotor pockets (refs. 2 to 4). The presence of the rotor pockets not onlyalters the expansion and compression ratio of the engine, but also plays animportant role in modifying its internal flowfield, mixing, and combustioncharacteristics.
The present rotor configuration is adopted from Steinthorsson et al.(ref. 9). In its other dimensions, the engine has a generating radius, R, af
0.1064 m; eccentricity, E, of 0.01542 m; clearance, C, of 0.004 m; chamber
width, W, of 0.07 m; and port width, WD, of 0.05 m. These dimensions give riseto maximum and minimum volumes of 750 hnd 115 cm3, respectively, thereby yield-
ing a compression ratio of about 6.5.
The rotor turns eccentrically at one third of the crankshaft speed. The
three combustion chambers of the Wankel engine are the three regions enclosedbetween the three rotor faces and the peritrochoid housing, two side housings,two side seals, and lead and lag apex seals. In the present calculations, onlyone of the three combustion chambers is considered, since leakage through theseals is assumed to be negligible. As the rotor revolves around the crank-shaft, each of the combustion chambers is continually deformed. This producesthe necessary compression and expansion of the fluid for the required engineperformance during each cyclic operation.
It should be noted that each combustion chamber has two minimum and maxi-
mum volume positions. Hence, the top-dead-center (TDC) and bottom-dead-center(BDC) positions are defined differently than would be the case in a reciprocat-ing engine, and it will be important to keep the following conventions in mind.In this study, a crank angle of zero radians corresponds with the minimum vol-ume that occurs near the ports. This position is referred to as the BDC. Theother position, corresponding with the minimum volume near the fuel injectorlocation, is referred to as the TBC. Thus, combustion occurs near TDC as in a
reciprocating engine, but the BDC position has a different meaning.
The exhaust port opens at a crank angle of 5.96 rod before BDC and closesat 1.07 rod after BBC, and the exhaust back-pressure is maintained at 0.85 atm.The intake port opens at 1.26 rod before BDC and closes at 5.96 rod after BDC.Fresh air enters through the intake while the intake stagnation temperatureTs,in t and static pressure Pint are maintained at 400 K and 1.25 atm,respectively. The fuel injector has eight holes and is located near the middleof the trochoid housing as shown in figure 1. The fuel emerges in a fan-shaped
pattern consisting of eight sprays. The initial spray distribution is givenby a Rosen-Ramler distribution with the initial droplet sizes ranging from
10 _ _ rk, i £ 30 1._a. The initial droplet velocity and temperature are takento be 100 m/s and 300 K, respectively. The fuel injection begins at 8.6 rodafter BDC and ends at 9.25 rod after BDC. The liquid fuel injection is simu-lated by injecting a specified number of discretized parcels of fixed massassociated with a given droplet-size group at uniform intervals correspondingwith the fuel-injection time step. The ignition process begins at 8.65 rodafter BI)C and ends at 8.75 rod after BDC. The ignition spark is simulated byraising the temperature of a few nodes of the computational domain on the wall

at the spark ignitor location from 400 to 1500 K. h complete physical descrip-tion of the engine is provided in our earlier paper (ref. 11).
RESULTS AND DISCUSSION
Numerical solutions were obtained .for the engine flowfield under motoringconditions for a single case with all of the ports closed; they were alsoobtained under firing conditions for two cases, with equivalence ratios of0.45 and 0.75. For all cases, the computations were initiated before the open-ing of the exhaust port for only one of the three chambers (formed with thesecond rotor flank as shown in fig. 1). Here we present the results obtainedfor the three different cases for an engine speed of 4000 rpm. The tempera-tures of the rotor and housing surfaces were maintained at 300 K for the caseconsidered under motoring conditions and at 400 K for the firing conditions.The initial conditions correspond to the conditions of quiescent air at a pres-sure, Pin, of 1 atm and a temperature, Tin, of 300 K for the motoring engineand at 1 atm and 400 K for the firing engine.
All of the computations were performed with a uniform time-step size suchthat 15 000 time-steps span the 6_ radians of one entire rotor cyclic-rotation.The calculations were performed on a grid with a mesh size of i _ 31, j = 16,and k _ 20, where i, j, and k represent the coordinate surfaces in thedirection extending from the trailing-edge surface to the leading-edge surfaceof the combustor, from the rotor to the housing surface, and from the side wallto the symmetry plane of the domain between the end-to-end side walls,respectively.
Motoring Results
The usefulness of any numerical scheme lies in its ability to generatemeaningful predictions for a wide variety of engine operating conditions. Boththe numerics and the models used for turbulence, combustion, and sprays deter-mine the accuracy of the predictions. The selection of a finite-differenceformulation is mainly dictated by a careful balance between the numerical sta-bility, efficiency, and accuracy considerations for the problem under consider-ation. Stability is often achieved at the expense of accuracy and efficiency.It is also instructive to note that a numerical scheme is often made stable
either by explicitly adding some amount of artificial dissipation, or by thenumerical dissipation that inherently arises from a given finite differenceformulation. For the predictions to be meaningful, the numerical dissipationrequired for stability considerations should be small compared with the dissi-pation arising from the actual physical processes governing the flowfield.
The best way to assess the accuracy of a numerical scheme is to comparethe predictions with experimental data. In our previous paper (ref. 11) a goodmeasure of qualitative agreement was noted between the predictions and anexperimental flow-visualization pattern during the intake process. In theabsence of applicable experimental data on the average pressure and temperaturevariation versus crank angle, a numerical experiment was performed for a motor-ing engine with all of the ports closed. This allowed comparisons between thepredictions and the corresponding isentropic results to be made.

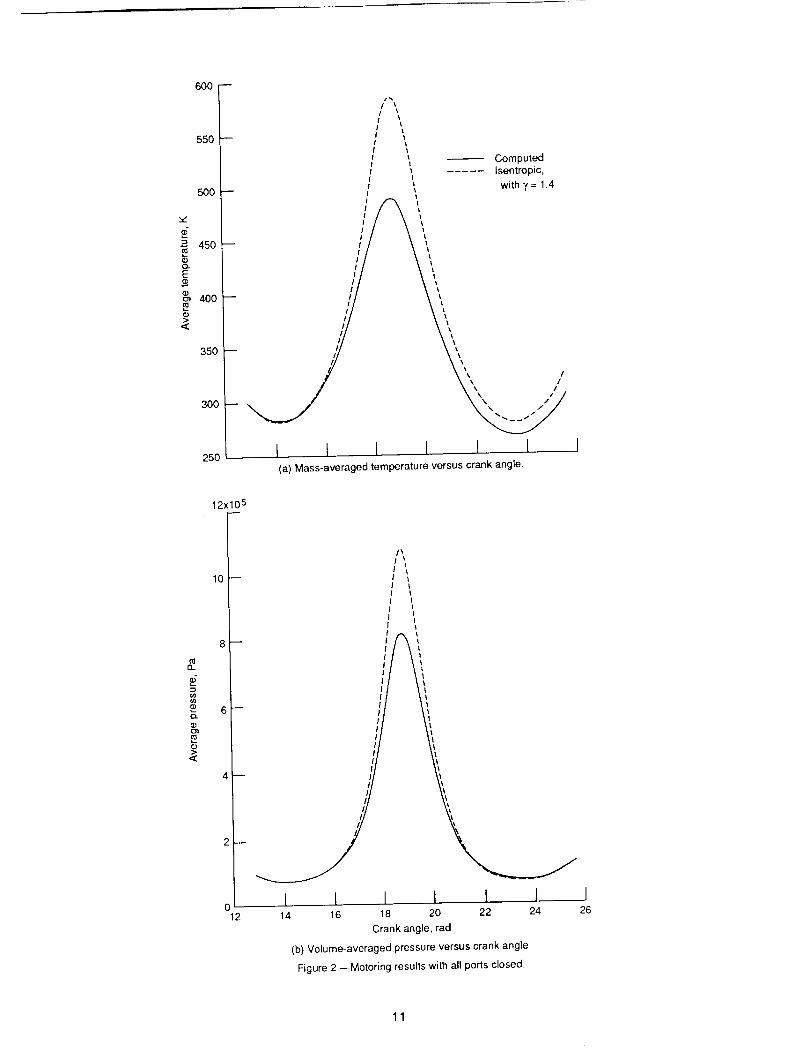
Figure 2 shows the computed mass-averaged temperature and volume-averagedpressure versus crank angle. Also shown in the figure are the correspondingresults obtained from isentropic conditions, with an exponent of 1.4. The com-putations predicted a temperature of 490 K and a pressure of 8.4 atm at TDC.The corresponding differences from the isentropic conditions are 15.8 and23 percent, respectively. Although it is hard to ascertain the validity ofthe predictions in the absence of any experimental data, the observed differ-ences between the isentropic conditions and the predictions can be explainedby the following reasons:
(1) Both the stagnation pressure and temperature would be slightly higherthan the corresponding static conditions near TDC, since the flow velocities atthis position approach 50 m/sec.
(2) Viscous effects become increasingly significant near TDC since thesurface area to volume ratio becomes very large near the clearance regions of
the apex seals and also because of a strong squish flow resulting from the non-uniform pressure distribution, The squish flow is a unique feature of therotary engines that has no counterpart in reciprocating engines.
(3) The heat losses to the walls also contribute to the observed differ-ences since the temperature of the walls is maintained at 300 K.
(4) Because of the shape of the combustion chamber, all the gas within itmay not undergo the same degree of expansion or compression simultaneously.In fact, while some gas undergoes compression other gas is likely to undergoexpansion as the rotor moves around TDC. This process enhances the convectiveheat transfer to the walls.
(5) Numerical dissipation is also likely to contribute to the observeddifferences. Li et al. (ref. 10) made similar comparisons between the variousnumerical schemes studied for a two-dimensional motoring engine. We have notattempted to make any direct comparisons with their predictions because of thedifferent engine configurations used in the respective studies. At the end ofthe computations the predictions indicate there is an accumulation of mass byabout 3 percent. Even though our governing equations are formulated in astrong-conservation law farm (ref. 11), the way in which the boundary condi-tions are implemented makes the finite-difference formulation weakly conserva-tive. However, the observed discrepancy in mass could be reduced further by
increasing the number of grid points in the computational domain.
Figure 3 shows the computed torque about the center of the rotor (asopposed to output torque about the center of the crankshaft). This is gener-ated in part by the nonuniform pressure distribution on the rotor surface andin part by a difference of the pressure forces acting on the trailing and lead-ing apex seals. If a uniform pressure prevailed throughout the combustionchamber, the resulting torque would be zero. However, the effect of pressurenonuniformity clearly results in a negative torque contribution opposing therotor motion. Hence, work needs to be performed to overcome this torqueinduced by the nonuniform pressure distribution. From the predictions, it isevident that the pressure becomes more nonuniform near TDC and, in fact, thetorque has a maximum negative value at this location. The corresponding valuesof the torque averaged over one cyclic period is found to be -0.9357 Nm (rotor)and -0.1259 Nm (seals).
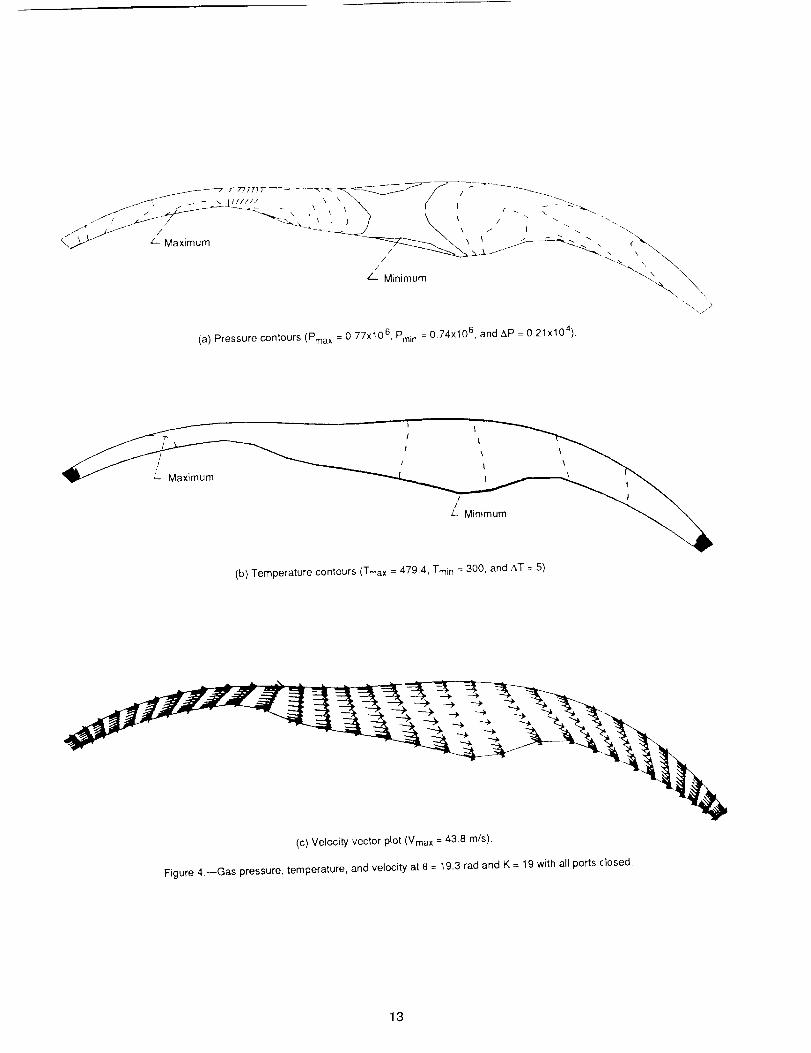
To provide a better understanding of the observed nonuniformities in theflowfield, the pressure and temperature contours together with the flow veloc-ity at the symmetric plane k = 19 and crank angle of 19.3 rad are shown infigure 4. In the isocontour plots, the isocontour lines near the maximum areshown as dotted lines and near the minimum are shown as solid lines. In the
velocity vector plot, only three different sizes of arrow symbols are used todistinguish the variation between the maximum and minimum values. Both thepressure and temperature have a maximum value in the region near the trailingapex seal, and the flow velocity is essentially determined by the rotormovement.
Firing Results
In this section we present the results for two other cases that were con-ducted under firing conditions, for which the operating parameters weredescribed earlier in the paper. The fuel/air equivalence ratio, _, is taken tobe 0.45 for one case and 0.75 for the other.
Here we first present the results of the three-dimensional computationsdescribing the overall behavior of the combustor in terms of the volume-averaged pressure versus combustor volume (p-v diagrams). This includes thevariation of mass-averaged temperature, the torque due to pressure nonuniform-ity, and vaporization and combustion rates versus crank angle. Then we pro-ceed to examine the flowfield in detail during the fuel vaporization andcombustion processes. The details of the flowfield during the opening of theexhaust and/or intake are presented in detail in our earlier paper (ref. 11).
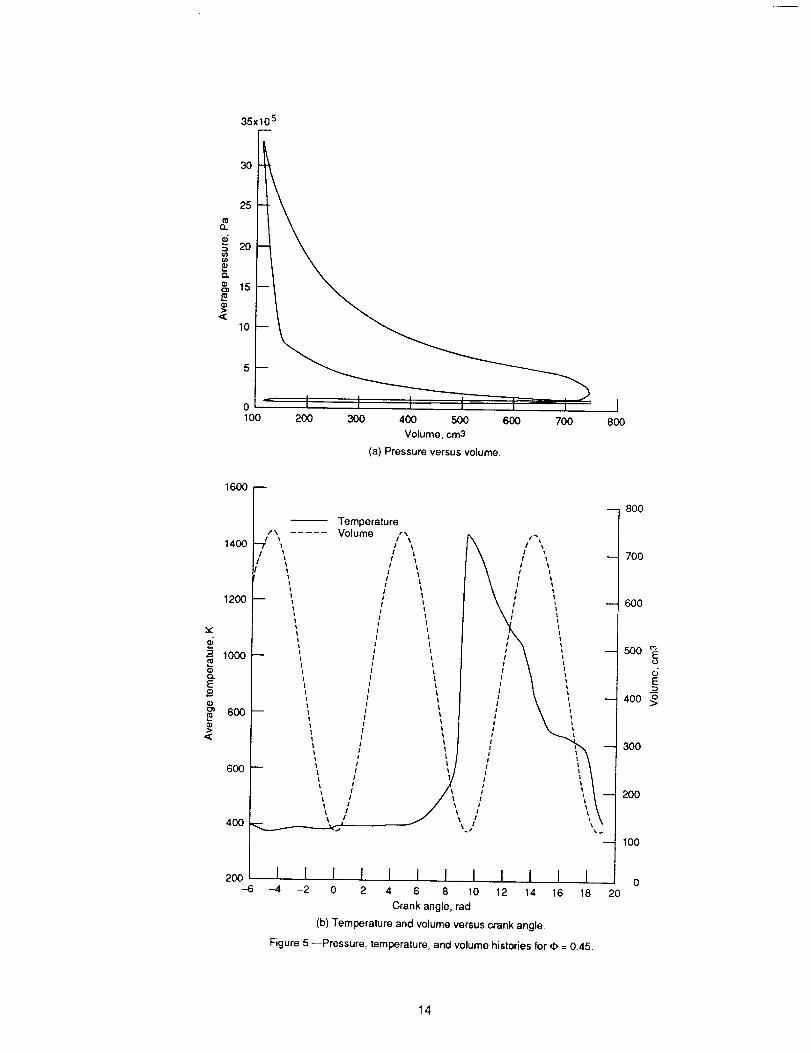
The computations are initiated just before the exhaust port opens. Theinitial pressure and temperature of the gas are taken to be 1 atm and 400 K,respectively. After the exhaust port opens the residual gas moves out of thecombustion chamber, since the imposed pressure of 0.85 atm in the exhaustremains lower than the interior engine pressure during most of the compressioncycle. Both the engine pressure and temperature remain fairly uniform duringthe exhaust process, as shown in figure 5. As the rotor moves farther, theintake port opens and fresh air moves into the combustion chamber. Most of the
intake process occurs during the expansion stroke of the engine. The slightrise in the pressure during the intake process merely reflects the intake pres-sure, which is maintained at 1.25 arm.
After the intake port closes, the gas undergoes nearly isentropic compres-sion until combustion begins. Buring the combustion process, both the pressureand temperature rise sharply to about 33 atm and 1450 K, reaching their maximumvalues near TBC. Buring the expansion stroke, the gas undergoes nearly isen-tropic expansion until the exhaust port opens again. Both the pressure andtemperature fail off sharply until the interior pressure near the exhaust portreduces to a value below the imposed exhaust back-pressure of 0.85 atm. Whenthis condition is reached near a crank angle of 16 tad, the temperature remainsfairly uniform at 650 K for a brief period before the intake charge at 400 Kenters the chamber. The temperature falls to 400 K during the remainder ofthe opening of the intake port.
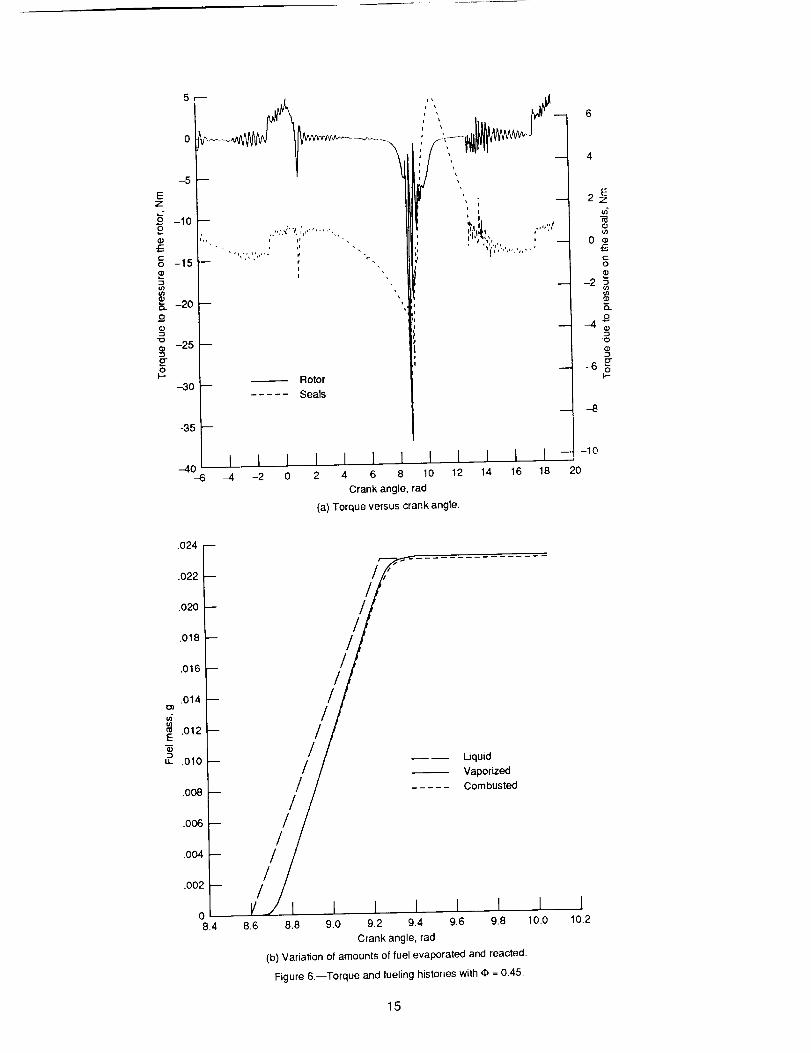
The torque variation versus crank angle in figure 6(a) shows that thepressure distribution on the rotor surface undergoes a kind of beating phenome-non associated with acoustic resonance during the intake and/or exhaust port
6
opening period. It is also noteworthy that positive torque is generated duringthe overlapping period in which both the exhaust and intake ports are opensimultaneously. Once again, the maximum negative torque is generated near theminimum volume as in the motoring case. The corresponding values of thetorque, averaged over one cycle, are found to be -0.817 Nm (rotor) and0.508 Nm (seals). Comparison with the previous case shows that the averagerotor torque due to the pressure nonuniformity under both motoring and firingcases has a similar value. This indicates that the resulting pressure gradienton the rotor surface is a result of the fluid motion associated with the rotor
raovement. However, the average torque due to pressure acting on the seals fora firing engine is found to be positive whereas it had a negative value for themotoring case.
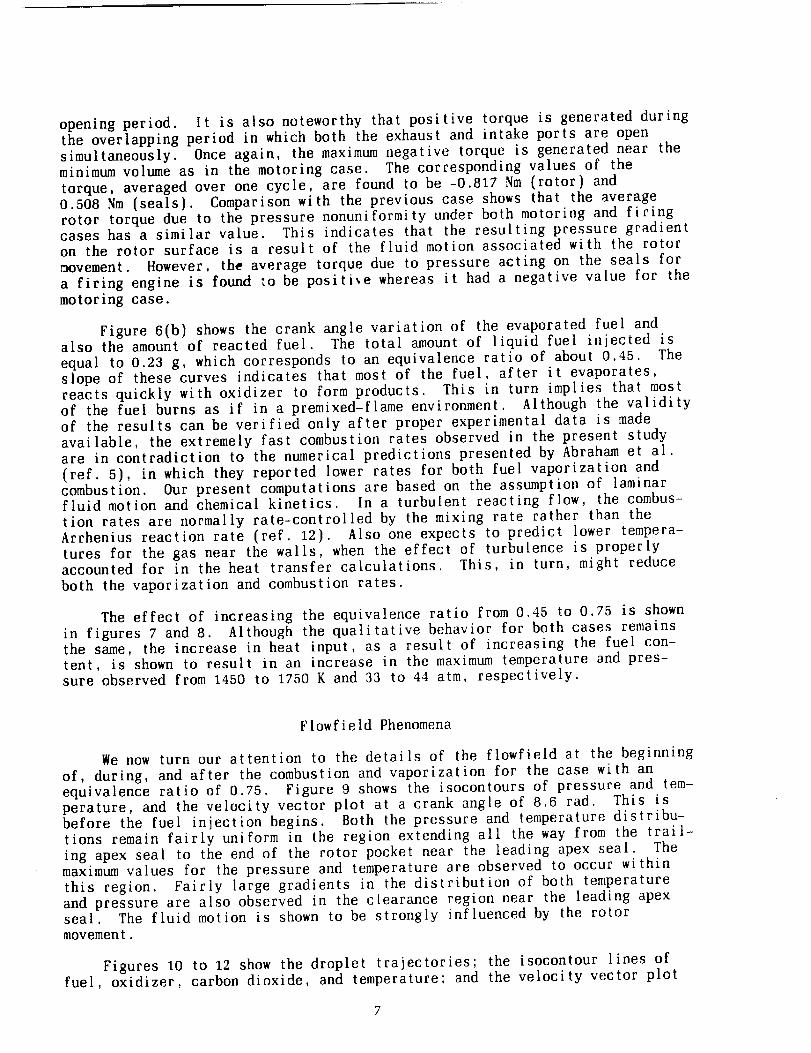
Figure 6(b) shows the crank angle variation of the evaporated fuel andalso the amount of reacted fuel. The total amount of liquid fuel injected isequal to 0.23 g, which corresponds to an equivalence ratio of about 0.45. Theslope of these curves indicates that most of the fuel, after it evaporates,
reacts quickly with oxidizer to form products. This in turn implies that mostof the fuel burns as if in a premixed-flame environment. Although the validityof the results can be verified only after proper experimental data is madeavailable, the extremely fast combustion rates observed in the present studyare in contradiction to the numerical predictions presented by Abraham et al.(ref. 5), in which they reported lower rates for both fuel vaporization andcombustion. Our present computations are based on the assumption of laminarfluid motion and chemical kinetics. In a turbulent reacting flow, the combus-tion rates are normally rate-controlled by the mixing rate rather than theArrhenius reaction rate (ref. 12). Also one expects to predict lower tempera-
tures for the gas near the walls, when the effect of turbulence is properlyaccounted for in the heat transfer calculations. This, in turn, might reduceboth the vaporization and combustion rates.
The effect of increasing the equivalence ratio from 0.45 to 0.75 is shownin figures 7 and 8. Although the qualitative behavior for both cases remainsthe same, the increase in heat input, as a result of increasing the fuel con-tent, is shown to result in an increase in the maximum temperature and pres-sure observed from 1450 to 1750 K and 33 to 44 atm, respectively.
Flowfield Phenomena
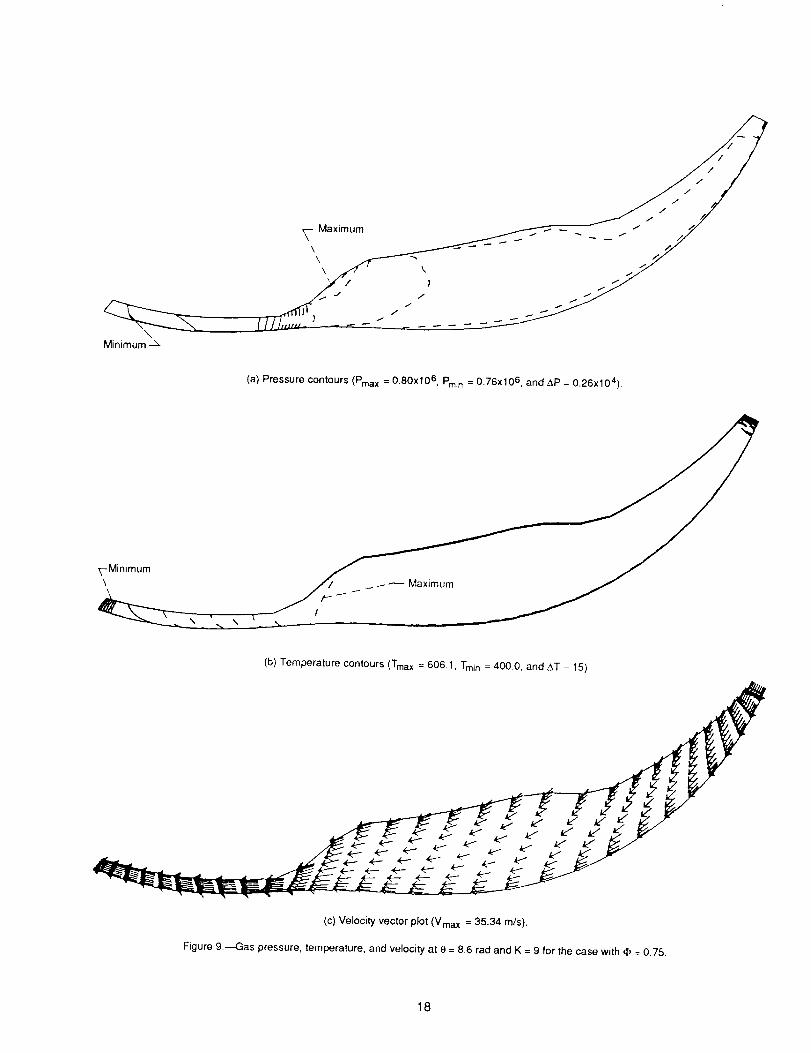
We now turn our attention to the details of the flowfield at the beginningof, during, and after the combustion and vaporization for the case with anequivalence ratio of 0.75. Figure 9 shows the isocontours of pressure and tem-perature, and the velocity vector plot at a crank angle of 8.6 rad. This isbefore the fuel injection begins. Both the pressure and temperature distribu-tions remain fairly uniform in the region extending all the way from the trail-ing apex seal to the end of the rotor pocket near the leading apex seal. Themaximum values for the pressure and temperature are observed to occur withinthis region. Fairly large gradients in the distribution of both temperatureand pressure are also observed in the clearance region near the leading apexseal. The fluid motion is shown to be strongly influenced by the rotormovement.
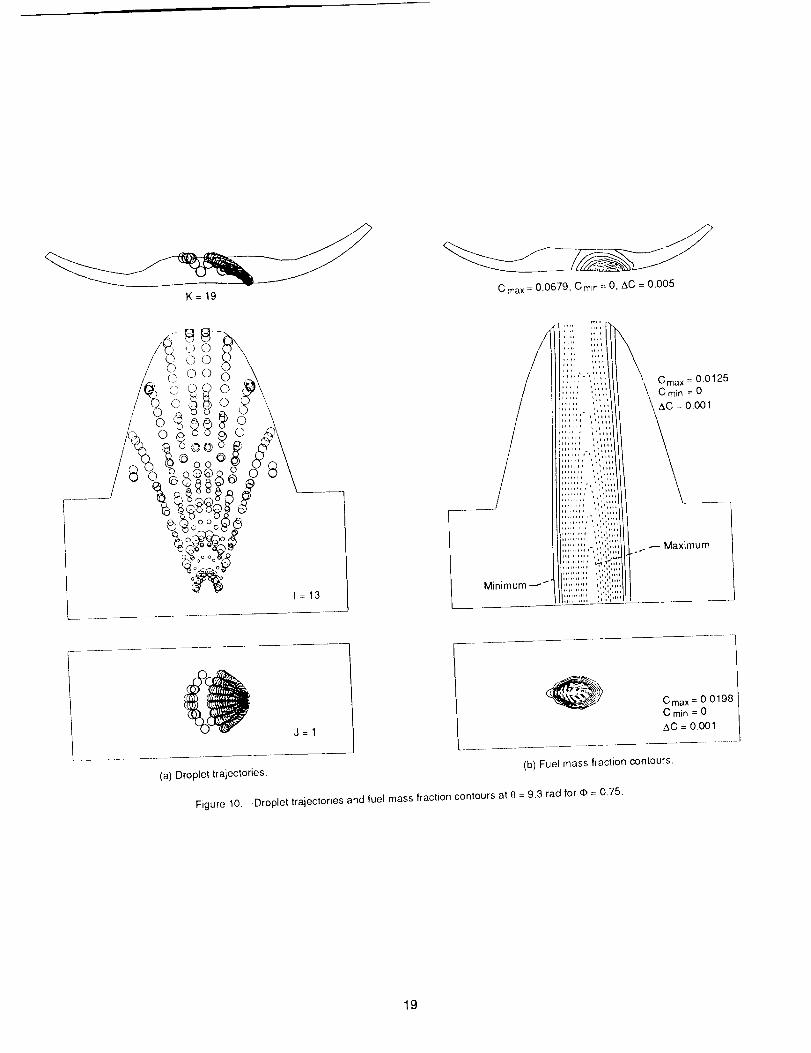
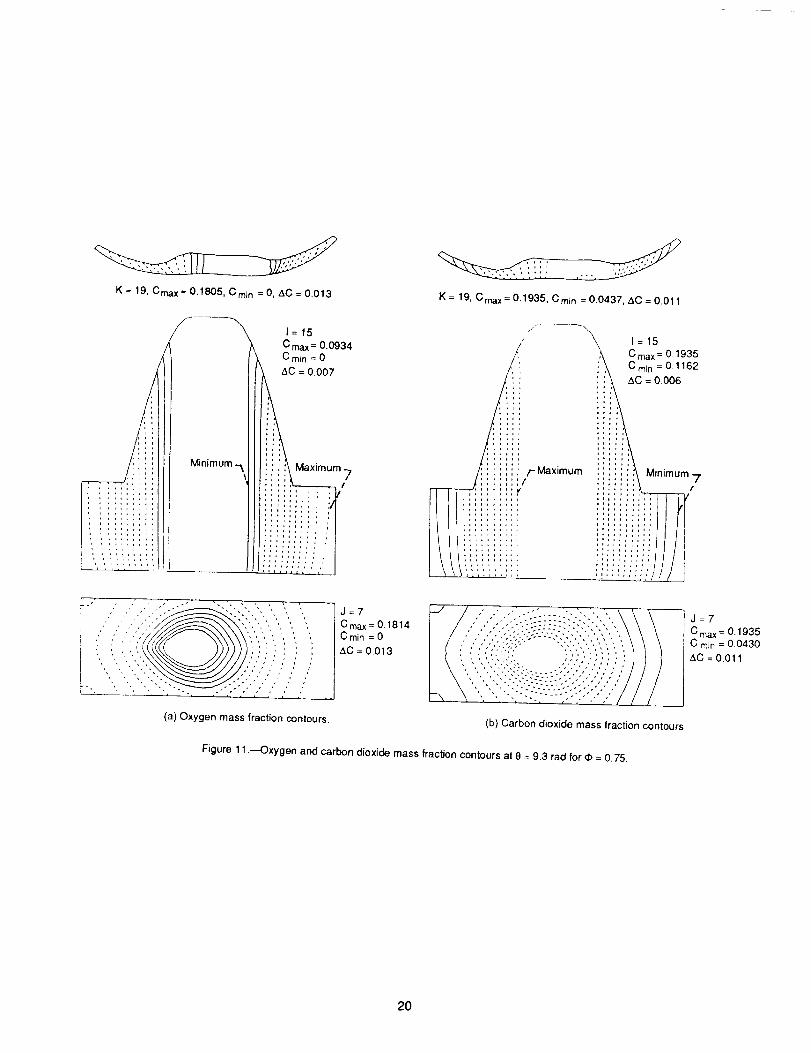
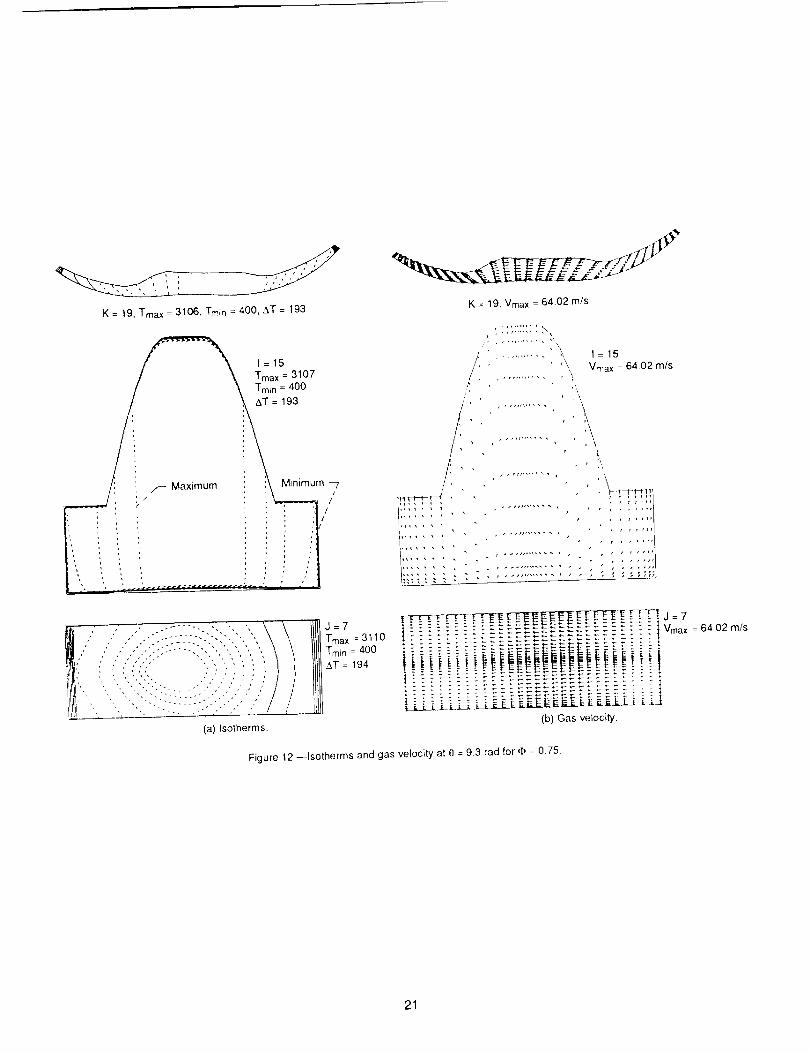
Figures 10 to 12 show the droplet trajectories; the isocontour lines offuel, oxidizer, carbon dioxide, and temperature; and the velocity vector plot

at a crank angle of 9.3. The figures showing the rotor pocket cross sectionare drawn in an elongated scale compared with the others in order to provide abetter graphic illustration of the results. The polydisperse character of thespray is represented by different sized circles which are indicative of the
size of the initial droplets. Although the particles retain the fan-shape con-figuration during this later part of the fuel vaporization process, the deflec-tion of the particles in the direction of the gaseous flow is evident from thepath originally dictated by the particle initial conditions.
A very small region near the fuel injector location is found to be fuel
rich. Whereas stratified charge gives rise to a gaseous diffusion flame, acareful examination of figure 10 also reveals an absence of fuel concentrationin the region near the rotor pocket surface where fuel concentration is
expected otherwise from the presence of liquid fuel in that region. It ismore likely that the combustion characteristics in that region are influencedby an isolated combusting droplet behavior. The oxygen concentration is foundto be lower near the high temperature region than in the regions near theseals. An opposite trend is observed for the carbon dioxide distribution.The temperature in the flame region is around 3106 K and on the walls is 400 K.Again the fluid motion is found to be essentially dictated by the rotor motion.
During the expansion stroke, after the combustion is completed, the dis-tributions of temperature and of oxidizer and carbon dioxide concentrations are
found to become fairly uniform throughout the chamber as shown in figure 13.
CONCLUDING REMARKS
We have presented preliminary results for a Wankel engine under bothmotoring and firing conditions, obtained from the solution of unsteady, three-dimensional Navier-Stokes equations. These results are based on the assumptionof laminar fluid motion and chemical kinetics, with the use of appropriate sub-models for combustion and sprays.
The results show the average rotor torque generated by the nonuniformpressure distribution is nearly the same for the different cases considered
under both motoring and firing conditions. This indicates that the pressurenonuniformity is determined mostly by the rotor-induced fluid motion. The
pressure is higher near the trailing apex region than near the leading apexregion.
One indication of our study is that, under the present assumptions, vapor-ization appears to be more rate-controlling than mixing during the combustionprocess. This finding is contrary to the numerical predictions reported byAbraham et al. (ref. 5). While considering the fact that the present engineconfiguration is somewhat different from the one used in their studies, itshould be noted again that the present computations are performed withoutattempting to describe the turbulent aspect of the fluid motion. Both the heat
transfer, fluid mechanics, and combustion characteristics in a engine flowfieldwill be influenced strongly by the turbulent fluid motion. Our solution proce-dure is currently being modified to include an appropriate turbulence model.
The code takes about 10 CPU hours on a CRAY Y-MP, when the calculationsare performed on a 31 by 16 by 20 grid. This covers one entire cyclic period
8
of 6_ rads for a firing case. It appears that we are the first to havereported numerical predictions obtained from three-dimensional computationsin terms of pressure, temperature, and torque histories far an entire cyclicperiod. The code appears to be potentially very efficient compared with theother schemes used in modeling Wankel engines.
REFERENCES
1. Danieli, G.A.; Keck, J.C.; and Heywood, J.B.: Experimental andTheoretical Analysis of Wankel Engine Performance. SAE Paper 780416, 1978.
2. Roberts, J.A.; Norman, T.J.; Ekchian, J.A.; and Heywood, J.B.: Computer
Models for Evaluating Premixed and DISC Wankel Engine Performance. SAEPaper 860613, 1986.
3. Bracco, F.V.; and Sirignano, W.A.: Theoretical Analysis of Wankel EngineCombustion. Combustion Science and Technology, vol. 7, no. 3, 1973,pp. 109-123.
4. Grasso, F.; Wey, M-J.; Bracco, F.V.; and Abraham, J.: Three-DimensionalComputations of Flows in a Stratified-Charge Rotary Engine. SAE Paper870409, 1987.
5. Abraham, J.; Wey, M-J.; and Bracco, F.V.: Pressure Non-Uniformity and
Mixing Characteristics in a Stratified Charge Rotary Engine Combustion.SAE Paper 880624, 1988.
6. Abraham, J.; and Bracco, F.V.: Comparison of Computed and MeasuredPressure in a Premixed-Charge Natural-Gas-Fueled Rotary Engine. RotaryEngine Design: Analysis and Developments, SAE SP-768, SAE, Warrendale,
PA, 1989, pp. 117-131.
7. Amsden, A.A.; Ramshaw, J.D.; O'Rourke, P.].; and Dukowicz, J.K.: KIVA: AComputer Program for Two- and Three-Dimensional Fluid Flows With ChemicalReactions and Fuel Sprays. LA-10245-MS, Los Alamos National Laboratory,Feb. 1985.
8. Shih, T.I.-P; Yang, S.-L; and Schock, H.J.: A Two-Dimensional NumericalStudy of the Flow Inside the Combustion Chamber of a Motored RotaryEngine. SAE Paper 860615, 1986.
9. Steinthorsson, E.; Shih, T.I-P.; Schock, H.J.; and Stegeman, J.:Calculations of the Unsteady, Three-Dimensional Flow Field Inside a
Motored Wankel Engine. SAD Paper 880625, 1988.
10. Li, Z.; Steinthorsson, E.; Shih, T.I.-P.; and Nguyen, H.L.: Modelling andSimulation of Wankel Engine Flow Fields. SAE Paper 900029, 1990.
11. Raju, M.S.; and Willis, E.A.: Analysis of Rotary Engine CombustionProcesses Based on Unsteady, Three-Dimensional Computations. AIAA Paper90-0643, 1990.
12. Raju, M.S.; and Sirignano, W.A.: Multicomponent Spray Computations in aModified Centerbody Combustor. AIAA Paper 88-0638, 1988.
9

W
J_
/-- Side housing/
i ii i
, _ ,, ! i
, Wp Exhaust Wp Intake ,i, _ port i _ port ,, ,'i
_z "-- Side housing
,ID-- X
Rotor housing
Y ,,,-- Bottom dead center/ (BDC), e = O, 67(
Exhaust port _"""-._.-._--j_-_._.___ Intake port
Apexr /.,-/__sealJ//
r
Apex _..seal _ _
f _ _/-- Rotor housing
X
Top dead center / L "-- Fuel iniector
(TDC), 0 = 3x J (also spark ignitor)
Figure 1.---Schematic of the Wankel engine that was studied.
10
600
55O
5OO
v
d 450
_ lO0
350
3O0
25O
m
/,I
I!
I ;' Computed
I Isentropic,
_ with ? = 1.4
/I \_/I \_
il \''!
/I \,/i \'
L
11
\\ /
I I I I I I(a) Mass-averaged temperature versus crank angle.
13_
12x105
10--
8--
6--
4--
2--
ot12
i\I
lIIII
// ),/1 _,
/ t,,,
I I I I I I14 16 18 20 22 24
Crank angle, rad
(b) Volume-averaged pressure versus crank angle.
Figure 2.--Motoring results with all ports closed.
Jz6
11

-.5
-1.0Ezt_
9 -1.5o
-2.00
_ -2.s
e_
N -3.0
• --,3.523O"
--4.0
--4.5
-50
'\\
\__ \
\
\
I14
\\
\
\\
\
\\
I16
RotorSeals
\\
\\
I I18 20 22
Crank angle, rad
Figure 3.--Torque versus crank angle with all ports dosed.
\
\\
15
1.0
-2.524
12
Maximum _ \ ,, I /, _ _ . "_
/
L Minimum _"-.._ . "_
"\ /x
(a) Pressure contours (Pmax =077xlO6, Pmin =0.74x10⁶ and _P = O.21x104),
# \ _
,, -...< \
L Minimum _,_
(b) Temperature contours (Tmax = 479.4, Tmir_ = 300, and AT = 5).
(c) Velocity vector plot (Vrna× = 43.8 m/s).
Figure 4.--Gas pressure, temperature, and velocity at 8 = 19.3 rad and K = 19 with all ports closed.
13
35x105
30
f,n
Ci.
,<
0
1O0 200 300 400 500 600 700 800
Volume, cm3
(a) Pressure versus volume.
1600 --
I I I I2 4 6 8 10 12 14 16 18 20
Crank angle, rad
(b) Temperature and volume versus crank angle.
Figure 5--Pressure, temperature, and volume histories for • = 0.45.
800
7OO
6OO
(5
E_.=
400 :_
300
20O
100
14
-5
EZ
o -100
-15
__ -20o
-25
0I--
-30
-40-6
Rotor
..... Seals
r
I I I I I I2 4 6 8 10 12
Crank angle, rad
(a) Torque versus crank angle.
2_
0¢-
-2
0
-47O
O"
-6_F-
-8
I I I - -lO14 16 18 zO
,024 --
.022 --
.020 --
,018 --
.016 --
.014 --
.o12 -E
" .010 --
.008 --
.006 --
.004 --
.002 --
08,4
//
//
//
//
//
/
8.6
//
//
//
/
Liquid
VaporizedCombusted
I I I I I I8.8 9.0 9.2 9.4 9.6 9.8 10.0
Crank angle, rad
(b) Variation of amounts of fuel evaporated and reacted.
Figure &--Torque and fueling histories with • = 0.45.
110,2
15

45x105
13..
:3u')
(3L
(3
(3
<
40-
35
30
25
2O
15
10
5
0
1oo 200 300 400 500 600 700 800
Volume, cm3
(a) Pressure versus volume.
18oo --
?/
1600 u
1400 --
1200 --
(3
E 1000 --
(3
(3• 800 --<
600 --
40O
2oo I I-6 -4 -2
TemperatureVolume /"\
//I
II/
III
II/I
II
II
III
I II II II I
II
/\ /L-.,
f/
III
III
6OO
I3O0
l
_, 200
\
I I I I 1 I I I0 2 4 6 8 10 12 14 16 18 20
Crank angle, rad
(b) Temperature and volume versus crank angle.
Figure 7.--Pressure, temperature, and volume histories for _ = 0.75.
100
16

5
0
-5
-10
g -15
-20
c
o -25P
-3Oo.
9q-35
e= -40or"
o
I- -45
- /_, _,_ ,I :'"', ,.,hLLI,,,,,..._/'%
i
Rotor
Seals-50 --
-55 --
-6O I I I I I I I I I I-4 -2 0 2 4 6 8 10 12 14 16
Crank angle, rad
(a) Torque versus crank angle.
8
6
4
2 _
0__ -2 g
__ --4 _e-i
o.
__ -_ _
_ -g f0
F--
-- -10
__ -12
I -14
18 20
.O35
.030
.040 --
.025 --
,015 --
.010 --
.005 --
.020E
g_
08.4
//
8.6
//
//
//
//
//
//
/
Liquid
Vaporized
..... Combusted
I I I I I I I8.8 9.0 9.2 9.4 96 9.8 10.0 10.2
Crank angle, red
(b) Variation of amounts of fuel evaporated and reacted.
Figure 8.--Torque and fueling histories with • = 0.75.
17
(a) Pressure contours (Pmax = 0.80x10⁶, Pmin = 0.76x10⁶, and z_P = 0.26x10⁴).
Maximum
(b) Temperature contours (Tma × = 606.1, Tmi n = 400.0, and z&T = 15).
(c) Velocity vector plot (Vma x = 35.34 m/s).
Figure 9.-_3as pressure, temperature, and velocity at e = 8.6 rad and K = 9 for the case with _ = 0.75.
18
K=19
/___ oo _d/o - 'J o ,._\
.t_, o _ _ o _\o_ _c'
/5o S ;°IA\
=13
Cmax= 0.0679, Cmin =_0, AC = 0.005
125
P Maximum
J=l
Cmax = 0.0198
C min = 0
AC = 0.001
(a) Droplet trajectories. (b) Fuel mass fiaction contours.
Figure 10.--Droplet trajectories and fuel mass fraction contours at 0 = 9.3 rad for @ = 0.75.
19
K = 19, Gmax = 0.1805, Cm[ n = O, &C = 0.013 K = 19, Cma x = 0.1935, Cmi n = 0.0437, AC = 0.011
------_ I= 15
)_ C max = 0.0934
cm,.=o
C= 0.007
t t i Minimum_ [ i i , : : ,\ Maximum
/ 1=15
,\ Cmax = 0.1935
" i,_ C rain = 0"1162
i_C = 0.006
::::::i / ::!::i!, ,
:;,,:;;,, ]
(a) Oxygen mass fraction contours.
J=7
Cmax = 0.1814C min = 0
AC = 0.013
J=7
C max = O.1935C rain = 0.0430
AC = 0.011
(b) Carbon dioxide mass fraction contours
Figure 11 .--Oxygen and carbon dioxide mass fraction contours at 6 = 9.3 rad for _ = 0.75.
2O
K = 19, Tmax = 3106, Train : 400, AT = 193
/ \ m ,o=4oo
K = 19, Vmax = 64.02 m/s
.............. , 1=15/ , , \
,/' ............ ', , Vmax = 64.02 m/s
r!
;'\
,' ,'" ,'" .-'_-'i:iL--'-'.'."-".j ", ', ", Tma x = 3110
;" " ,'" .".';".;'" ..... "'"'"' " ", '" " Tm n = 400
', t " ;" ,",",'" """, ", ",' ! : AT= 194
., ,, ', ,,,',,',::.. .',' ,' ,' , ,, ,:
(a) Isotherms.
!i!!ii!!!!i!i!!!!!!i!!iiLLLLLL._[t_.LLL _L_.
(b) Gas velocity.
Figure |2.--Isotherms and gas velocity at e = 93 rad for • = 0,75
J=7
Vmax = 64.02 m/s
21

'\\\
t '\'i
\
_-Maxlmum
. ', ,,\ Minimum
Minimum --_
(a) Oxygen concentration contours (C max = 0.0923, C min = 0.0895,
and AC = 0).
(c) Temperature contours (Tmax = 2017, Tmin = 400, and AT = 116).
_'\\ Minimum - -...
\\\ _ _ \ \\. Maximum --I
"N \ \£_-- -_ I
\
(b) Carbon dioxide concentration (C max = 0.1194, C rain = 0.1171,
and AC = 0).
(d) Velocity vector plot (Vrnax = 21 85 m/s).
Figure 13--Oxygen, carbon dioxide, and temperature contours and gas velocity at e = 11 rad and K = 19 for ¢, = 0.75
22

National Ae ..... t..... cl Report Documentation PageSpace Admmislration
1. Report No. 2. Government Accession No. 3. Recipient's Catalog No.
NASA TM-103104
5. Report Date4. Title and Subtitle
Computational Experience With a Three-Dimensional Rotary
Engine Combustion Model
7. Author(s)
M.S. Raju and E.A. Willis
9. Performing Organization Name and Address
National Aeronautics and Space Administration
Lewis Research Center
Cleveland, Ohio 44135-3191
12. Sponsoring Agency Name and Address
National Aeronautics and Space Administration
Washington, D.C. 20546-0001
6. Performing Organization Code
8. Performing Organization Report No.
E-5249
10. Work Unit No,
505-62-11
11. Contract or Grant No.
13. Type of-Report and Period Covered
Technical Memorandum
14. Sponsoring Agency Code
15. Supplementary Notes
Prepared for the Joint Symposium on General Aviation Systems cosponsored by the AIAA and FAA, Ocean City,
New Jersey, April 11-12, 1990. M.S. Rain, Sverdrup Technology, Inc., Lewis Research Center Group,
2001 Aerospace Parkway, Brook Park, Ohio 44142. (Work funded by NASA Contract NAS3-25266.)
E.A. Willis, NASA Lewis Research Center.
16. Abstract
A new computer code has been developed to analyze the chemically reactive flow and spray combustion processes
occurring inside a stratified-charge rotary engine. Mathematical and numerical details of the new code were
recently described by the present authors. This paper presents the results of limited, initial computational trials as
a first step in a long-term assessment/validation process. The engine configuration studied was chosen to approxi-
mate existing rotary engine flow-visualization and hot-firing test rigs. Typical results include (1) pressure and
temperature histories, (2) torque generated by the nonuniform pressure distribution within the chamber, (3) energy
release rates, and (4) various flow-related phenomena. These are discussed and compared with other predictions
reported in the literature. The adequacy or need for improvement in the spray/combustion models and the need
for incorporating an appropriate turbulence model are also discussed.
17. Key Words (Suggested by Author(s))
Rotary engine
Combustion
Fuel injection
Computational fluid mechanics
18. Distribution Statement
Unclassified - Unlimited
Subject Category 34
19. Security Classif, (of this report) 20. Security Classif. (of this page) 21, No. of pages
Unclassified Unclassified 24
NASAFORM1626oc'r 86 *For sale by the National Technical Information Service, Springfield, Virginia 22161
22, Price*
A03