comprehensive operational review of the connecticut
TRANSCRIPT
Comprehensive Operational Review
of the
Connecticut Resources Recovery Authority
Prepared for the
Connecticut Department of Energy & Environmental Protection
November 7, 2013

Table of Contents
Disclaimer ......................................................................................................................................................................... 1
Purpose .............................................................................................................................................................................. 2
Project Summary ............................................................................................................................................................ 2
Executive Summary....................................................................................................................................................... 3 Revenue ............................................................................................................................................................................. 3
Options ............................................................................................................................................................................... 4
Approach to Budgeting ................................................................................................................................................ 4
Operational Efficiencies .............................................................................................................................................. 4
Market Trends ................................................................................................................................................................. 5
Absence of the CSWS Facility .................................................................................................................................... 5
Summary of Projections .............................................................................................................................................. 6
Liabilities ........................................................................................................................................................................... 7
Equity .................................................................................................................................................................................. 7
Southeast Project ........................................................................................................................................................... 8
Contingencies .................................................................................................................................................................. 8
Operations ........................................................................................................................................................................ 9
Asset Valuation ............................................................................................................................................................... 9
Review of Business Transactions .......................................................................................................................... 10
Task I ................................................................................................................................................................................ 11 Activities Performed ................................................................................................................................................... 11
Findings............................................................................................................................................................................ 11
Background .................................................................................................................................................................... 12
External Auditor Reports ............................................................................................................................................... 12
Compliance Reports .......................................................................................................................................................... 14
Strategic Reports................................................................................................................................................................ 15
Operations Reports ........................................................................................................................................................... 20
Management Communications .................................................................................................................................... 20
Task II .............................................................................................................................................................................. 25 Activities Performed ................................................................................................................................................... 25
Findings............................................................................................................................................................................ 26
Background .................................................................................................................................................................... 29

Analysis of Authorities Financial Data..................................................................................................................... 29
Methodology for Development of CRRAs Projection .......................................................................................... 30
Projected Cash Flows ........................................................................................................................................................ 33
Revenues ................................................................................................................................................................................. 34
Expenses ................................................................................................................................................................................. 35
Task III ............................................................................................................................................................................. 37 Activities Performed .................................................................................................................................................................. 37 Findings .......................................................................................................................................................................................... 37 Background ................................................................................................................................................................................... 39
Owned and Leased Real Property ......................................................................................................................... 39
Contracts to Which the CRRA Is a Party ............................................................................................................. 39
Civil or Criminal Actions Involving CRRA .......................................................................................................... 40
Current or Potential Environmental Liabilities ............................................................................................... 40
Short and Long-Term Liabilities ............................................................................................................................ 41
Accounts Payable ............................................................................................................................................................... 42
Due to Other Funds ........................................................................................................................................................... 42
Accrued Expenses – Professional Fees ...................................................................................................................... 43
Recycling Rebates Due to Towns ................................................................................................................................ 43
Accrued Payroll and Related Payroll Tax Liabilities ......................................................................................... 44
Accrued Sick and Vacation Pay ................................................................................................................................... 44
Customer Advance Payments ....................................................................................................................................... 44
Unearned Revenue ............................................................................................................................................................. 45
Customer Guarantee Payment Deposits .................................................................................................................. 45
Montville Landfill Closure and Post-Closure Escrow (Southeast Project) ............................................... 45
Landfill Closure and Post-Closure Liability............................................................................................................ 46
Contract Termination Payment .................................................................................................................................. 47
Claims Payable .................................................................................................................................................................... 48
Coal Pond Cleaning ........................................................................................................................................................... 48
Mid-Connecticut Administrative and Salaries – Closeout ............................................................................... 48
Accrued Mid-Connecticut Project Closeout Estimated Cost ........................................................................... 48
Potential Worker Compensation Claims Retro Premium Adjustment ...................................................... 49
Due to the City of Hartford for Recycling Education ......................................................................................... 49
Due to SCRRRA for Montville Landfill Closure and Post Closure Costs ..................................................... 49
Due to SWEROC Member Towns (Southwest) ...................................................................................................... 50
Bonds ....................................................................................................................................................................................... 51
Other Amounts Considered Liabilities ................................................................................................................ 52

Southeast Equity................................................................................................................................................................. 52
Mid CT Equity....................................................................................................................................................................... 52
Commitments ....................................................................................................................................................................... 52
Task IV ............................................................................................................................................................................. 78 Operational Assessment .......................................................................................................................................................... 78
Background .................................................................................................................................................................... 78
Organization Assessment ........................................................................................................................................................ 78 Activities Performed ................................................................................................................................................... 79
Findings............................................................................................................................................................................ 79
Background .................................................................................................................................................................... 81
Overview of CRRA’s Employee Organization ......................................................................................................... 81
Compensation, Adjustments, and Promotions ...................................................................................................... 84
Fringe Benefits and Insurance ..................................................................................................................................... 85
Time Off .................................................................................................................................................................................. 88
Assessment of Key Skills/Experience......................................................................................................................... 90
Overview of CRRA’s Executive Organization ......................................................................................................... 91
Senior Management’s Effectiveness .......................................................................................................................... 94
Valuation ........................................................................................................................................................................................ 97 Activities Performed ................................................................................................................................................... 97
Findings............................................................................................................................................................................ 98
Background ................................................................................................................................................................. 100
CRRA Property Owned .................................................................................................................................................. 100
Property Encroachments ............................................................................................................................................. 124
Machinery and equipment owned, leased or used ........................................................................................... 124
Equipment appraisals, engineering, and maintenance reports ................................................................ 124
Technology Assessment ........................................................................................................................................................ 124 Activities Performed ................................................................................................................................................ 125
Findings......................................................................................................................................................................... 125
Background ................................................................................................................................................................. 127
Overview of CRRA’s Information Technology .................................................................................................... 127
Task V ............................................................................................................................................................................ 135 Findings......................................................................................................................................................................... 135
Market Overview ............................................................................................................................................................. 137
Market Drivers ................................................................................................................................................................. 148
Market Barriers ............................................................................................................................................................... 161
Waste to Energy Competitors ................................................................................................................................... 165
CRRA Analysis ................................................................................................................................................................... 169

Task VI ........................................................................................................................................................................... 181 Control Assessment ................................................................................................................................................................ 181
Activities Performed ................................................................................................................................................ 181
Findings......................................................................................................................................................................... 182
Background ................................................................................................................................................................. 183
Policies and Procedures ............................................................................................................................................... 183
Internal Control Assessment ...................................................................................................................................... 184
Banking Relationships .................................................................................................................................................. 186
Cost Reduction Efforts .................................................................................................................................................. 186
Insurance Assessment ........................................................................................................................................................... 188 Activities Performed ................................................................................................................................................ 188
Findings......................................................................................................................................................................... 188
Background ................................................................................................................................................................. 189
Due Diligence Outcome –Material Issues ............................................................................................................. 189
Comments and Recommended Coverages and Enhancements .................................................................. 190
General Liability Comments ....................................................................................................................................... 191
Summary of Insurance Structure, Comments, and Program Costs .......................................................... 192
Insurer Solvency .............................................................................................................................................................. 196
Task VII ......................................................................................................................................................................... 197 Activities Performed ................................................................................................................................................ 197
Findings......................................................................................................................................................................... 198
Background ................................................................................................................................................................. 198
Review of Business Transactions ............................................................................................................................. 198
Assessment of CRRA’s Compliance with Competitive Bid Policy ............................................................... 201
Appendix A .................................................................................................................................................................. 203
Appendix B .................................................................................................................................................................. 212
Appendix C ................................................................................................................................................................... 226 Technology .................................................................................................................................................................. 226
Appendix D .................................................................................................................................................................. 231

Comprehensive Operational Review of CRRA October 30, 2013
The information contained herein is subject to the disclaimer presented on page 1 of this document.
Page 1
Disclaimer CohnReznick LLP prepared this report for the State of Connecticut. CohnReznick LLP was not engaged to and did not conduct an audit with the objective of expressing an opinion on the information included in this report. Additional facts and circumstances may have been discovered and addressed in this report had an audit been performed. Accordingly, CohnReznick LLP does not express an opinion as part of this report. CohnReznick LLP did not independently verify the information provided to it to prepare this report. CohnReznick LLP makes no warranties or representations of any kind, express or implied, about the accuracy, completeness, reliability, suitability or availability with respect to such information. This report is based on the facts and circumstances as they existed at the time CohnReznick LLP performed the work. Any changes in the facts and circumstances upon which this report is based could materially impact the findings contained in this report. CohnReznick LLP assumes no responsibility to update this report for changes in the facts and circumstances that occur after October 30, 2013. The findings contained in this report do not represent legal, tax, investment or other similar advice and should not be relied upon for such purposes.

Comprehensive Operational Review of CRRA October 30, 2013
The information contained herein is subject to the disclaimer presented on page 1 of this document.
Page 2
Purpose To provide the State of Connecticut with a comprehensive operational review of the Connecticut Resources Recovery Authority (CRRA or the Authority), and to make available, on an ongoing basis, information developed during the course of the review that may assist the State of Connecticut and the Resources Recovery Task Force in forming policy recommendations concerning the future status of CRRA.
Project Summary As mandated by Section 7 of Public Act 13-285 (SB 1081), the Connecticut Department of Energy and Environmental Protection (DEEP)1, in consultation with the Office of Policy Management, initiated an audit of the Connecticut Resources Recovery Authority. The Act enumerates eight areas to be covered in the audit. Those eight areas have been addressed in the seven task areas addressed in this document. On or before October 30, 2013, CT DEEP, in conjunction with the Office of Policy and Management, must provide a summary of the findings of such audits to the Governor and the joint standing committee of the General Assembly having cognizance of matters relating to the environment, appropriations, and government administration. To address the varied requirements of the CRRA operational review efficiently and effectively, CohnReznick leveraged our depth of expertise in several key areas of particular relevance to this project, including:
Government advisory
Renewable energy
Insurance consulting
Governance, risk, and compliance
Internal controls – financial and operational
Due diligence
Management and technology consulting
Information technology audit
Valuation advisory
1 P.A. 11-80 created the Department of Energy and Environmental Protection (DEP and the former DPUC)

Comprehensive Operational Review of CRRA October 30, 2013
The information contained herein is subject to the disclaimer presented on page 1 of this document.
Page 3
Executive Summary This document was constructed, and should be viewed, as an analysis of the operation of the CRRA, not as an examination, audit, or proposal for the Waste and/or Energy policies of the State of Connecticut. The revenues generated from CRRA’s various sources have been lower and both the Authority and this report project ongoing near term revenue shortfalls; of $3.547 million and $9.188 million respectively for fiscal year 2015 (where $5.564 million of the gap is due to a lower energy price being used in this report for fiscal year 2015). These projected revenue shortfalls can be substantially attributed to economic factors such as a drop in energy prices, increased competition (where Mid-CT has experienced a decrease in the number of contracting municipalities from 70 to 51), and a projected increase in capital replacement needs ($13 million for fiscal year 2015). It should be noted that the Authority could take advantage of its bonding authority to reduce the amount needed annually to fund its capital replacement needs. It should also be noted there are opportunities to consider that could set the Authority on a more financially viable path and benefit not just CRRA but also the solid waste and renewable energy markets in Connecticut. Although not inclusive, all stakeholders should focus on the following in an effort to mitigate the net projected revenue shortfalls:
The development of new revenue sources,
The capital replacement needs,
A maximization of operational efficiencies,
Possible change in public policy,
The authority’s plans on leveraging existing and future technologies.
Revenue
Based on current and projected market conditions, CRRA will need to identify new and / or expanded sources of revenue to maintain a competitive position in the waste-to-energy (WTE) and municipal solid waste (MSW) markets.
The following trends are most likely not expected to change for the better in the near-term, and likewise CRRA’s sources of revenue most likely will not experience positive change either:
MSW generation per capita is down considerably from pre-economic recession levels. While this trend is positive in terms of the state’s sustainability goals, it has resulted in reduced revenue to the resource recovery facilities in the state.
CRRA’s sale of electricity in the wholesale market has experienced a decrease in price, due to an oversupply of cheap natural gas in the Northeast region.
Prices for Class II renewable energy credits (RECs), that help Connecticut meet its renewable portfolio standards (RPS), are relatively low compared to Class I and III RECs.
Currently prices for most recyclable materials are at 25% to 50% of the high price over the past five year period that began in mid-2008.

Comprehensive Operational Review of CRRA October 30, 2013
The information contained herein is subject to the disclaimer presented on page 1 of this document.
Page 4
Options
CRRA could continue to explore options similar to its competitors, such as anaerobic digestion or composting, to mitigate the declines in revenue that the Authority is currently experiencing.
The strategic options private WTE companies are putting into place have two underlying similarities (the level of initiative and state support):
Covanta – Representatives foresee an increase in organic waste recovery, and have recently announced plans for an anaerobic digester facility in Bristol. Representatives of Covanta expressed confidence in their decision due in part to their perceived support from the State of Connecticut.
Wheelabrator – Is in the process of developing a bilateral contract that could allow the company to sell power to municipalities with whom they have an MSW contract. The company is in coordination with the Connecticut DEEP to bring the bilateral contracting structure to fruition with the aim to create a pricing structure that will be mutually beneficial for Wheelabrator as well as the municipalities it services.
Approach to Budgeting
CRRA’s current method for fiscal planning could make it dependent on attaining revenue to mitigate its projected budgetary shortfall.
According to the Authority’s forecast for fiscal years 2014 –2018, a budgetary shortfall of $3.547 million is expected in 2015. The Authority’s forecasting method is referred to as a bottom up approach where they calculate the tipping fee they charge to municipalities to ensure the costs of running the facility are met, but do not generate a profit. To mitigate the budgetary gap, the forecast identifies five overall options. Of these five overall options, four are revenue based with one addressing a reduction of expenditures. One revenue option is to increase tipping fees, which would have downstream implications on municipal budgets for which a further analysis should be performed.
Operational Efficiencies
CRRA could consider evaluating non-core activities that could allow the Authority to meet the operational efficiencies of its competitors.
The ability to leverage an economy of scale, in addition to maintaining an economical organizational structure, is significant to achieve the maximum level of operational efficiency. The Authority’s competitors, private WTE facilities, are afforded advantages derived from establishing economies of scale due to their size and resources as national companies. Private WTE facilities in Connecticut:
Can benefit from large purchase discounts of materials such as lime and urea, thereby reducing their cost of goods sold.
Due to the size of their parent companies, could allow them to coordinate between facilities outside of the state to ensure their capacity for waste is met in Connecticut.

Comprehensive Operational Review of CRRA October 30, 2013
The information contained herein is subject to the disclaimer presented on page 1 of this document.
Page 5
Can leverage their ability to coordinate administrative tasks (i.e. human resources, finance, public relations, etc.) across a region such as the Northeast
It is estimated that CRRA employs 17.865 individuals to administer non-direct labor functions for the Authority’s operations (not including the trash museum or landfills). In comparison, Wheelabrator employs nine administrative staff to support the operations of an equally sized WTE facility (Bridgeport) and two transfer stations.
Market Trends
CRRA’s ability to meet and address current market trends is vital to determining the likelihood that the Authority will remain competitive in the waste market over the next ten years.
Public sentiment of the Authority has been either neutral or negative according to discussions with municipalities. CRRA could strengthen its position in the community, while also strengthening its financial prospectus by:
The enhanced promotion of recycling and educational programs;
Providing municipalities long-term municipal service agreements (MSAs) whose price can be effectively forecasted year over year in municipal budgets;
CRRA could consider a recycling program similar to its competitors where the competitor shares with the municipalities a percentage of the profit. CRRA currently offers up to a $10 per ton rebate to municipalities tipping fees in all but one of the MSAs available. In theory, this establishes an incentive ceiling to municipalities; and
Further analyzing enacting a contractual structure between the Authority and other WTE facilities that utilize transfer station(s) closest to each facility which could aid facilities in meeting their capacity needs in addition to lowering transportation costs.
Absence of the CSWS Facility
The absence of CRRA’s mid-Connecticut WTE facility in its current form could have a significant impact on Connecticut’s management of solid waste.
In the case that the mid-Connecticut facility is no longer active in its current form, Connecticut may be in a position where it must weigh the benefits of CRRA as a policy tool versus the risks of no longer having a quasi-governmental entity that acts as a market leader (i.e. sets market rates and drives strategic deployments of technology). Connecticut could lose the economic benefits it gains in the forms of employment, indirect and induced revenue derived from the WTE facility, and supporting MSW infrastructure. The Connecticut market could be saturated with an estimated 710,000 tons of MSW as most private WTE facilities are currently near capacity. Municipal tipping fees will most likely increase due to an oversupply of MSW, and a decrease in competition to maintain levels of capacity at facilities. Out of state disposal is currently on the incline, and could increase significantly. Disposal out of state would most likely be in the form of landfilling due to its more economical pricing which could run contrary to the priorities established by Connecticut in its hierarchy of solid waste management.

Comprehensive Operational Review of CRRA October 30, 2013
The information contained herein is subject to the disclaimer presented on page 1 of this document.
Page 6
Summary of Projections
As illustrated below, this analysis projects budget deficits for the fiscal years 2014 -2016. The items in the projection that are the major cause for the deficits are the different electricity prices used by CRRA versus the ones used in this analysis, as well as the funding of reserves and the significant capital replacement expenses. The following are possible solutions to eliminate the projected deficits. A combination of solutions may also be appropriate.
Increase the municipal tipping fees above the opt-out amount. This is not recommended as it would ultimately result in a reduction of MSW to the Authority.
Increase the contracted waste and/or spot tipping fees where possible or attempt to convert spot tons to MSA tons. The impact of converting spot to MSA at an average rate tipping fee of $62 per ton would be $2.457 million additional revenue.
Evaluate the ability to reduce or eliminate the funding of certain reserves.
Reduce the amount of current funding included in the annual budgets for capital expenses by postponing certain projects or by issuing bonds to fund these items. The bonding authority granted to CRRA may be the most useful tool in addressing the Authority’s capital needs.
Supporting schedules for the below can be found in Appendix B.
CRRA FY 2014
Forecast FY 2014 FY 2015 FY 2016
Revenues
Service Charges Solid Waste - Participating Towns 23,686,000$ 23,700,000$ 24,082,000$ 24,437,000$
Service Charges Solid Waste - Contracts 9,570,000 9,537,500 9,537,500 9,537,500
Service Charges Solid Waste - Hauler 3,720,000 3,716,000 3,776,000 3,832,000
Service Charges Solid Waste - Spot 3,635,000 3,635,000 3,635,000 3,635,000
Electricity 20,780,000 16,336,691 17,481,585 18,377,710
Other 3,201,000 3,201,000 3,205,500 3,205,500
Transfers from other Divisions 3,019,810 3,218,310 3,147,894 2,561,836
Total Revenues 67,611,810 63,344,501 64,865,479 65,586,546
Total Expenses 58,130,000 58,052,054 59,646,789 61,871,856
Net Operations before contributions to reserves and nonrecurring
expenses 9,481,810 5,292,447 5,218,691 3,714,690
Contribution to Capital Expense Reserve 5,909,000 5,909,000 13,000,000 12,000,000
Net Operations before contributions to reserves and nonrecurring
expenses 3,572,810 (616,553) (7,781,309) (8,285,310)
Less:
Non-Recurring Expenses - 900,000 - -
Other contributions to Reserves 2,795,500 2,795,000 1,407,500 1,277,500
Net Cash Generated - After Reserve Contributions and
Nonrecurring Expenses 777,310$ (4,311,553)$ (9,188,809)$ (9,562,810)$
Connecticut Resources Recovery Authority
Summary Revenue and Expenses for the Fiscal Years 2014-2016
Forecasted Operating Budget

Comprehensive Operational Review of CRRA October 30, 2013
The information contained herein is subject to the disclaimer presented on page 1 of this document.
Page 7
Revenue Projections
For the year-ended June 30, 2013, boiler efficiency was approximately 75%. The Authority projects that the efficiency will be increased to 85%. There was no data provided to support that assumption and as such, the 2014 fiscal year electricity revenue projection was prepared based upon the historical efficiency rating of 75%. The impact on the electricity revenue projection for the assumption from the Authority’s forecast is approximately $941,000. The Authority’s fixed rate electricity contracts have expired. Since wholesale electricity prices and the related revenues are now market driven, they are essentially unpredictable. For the forecast included in this report an electricity rate of $0.0375 was used for fiscal year 2014 with an electricity rate increase of 2% for fiscal years 2015 and 2016.
Expense Projections
Expenses are projected based on contractual agreements and / or a 2% per year increase from 2014 through 2016. The variable expenses included in the projections are the amount of contributions to reserves. The most significant contribution to reserves is for capital expense where the Authority has budgeted $5,909,000 for the fiscal year 2014. For fiscal years 2015 and 2016, the estimated contribution increases to $13,000,000 and $12,000,000, respectively. Contributions to other reserves for severance payments, legal fee reserve and other items included in the projections totaled $2,795,000, $1,407,000 and $1,277,000 for the fiscal years 2014, 2015 and 2016, respectively.
Liabilities
Total landfill closure and post closure liabilities recorded at June 30, 2013, totaled $49,276,042 (Exhibit 5A). The Authority has accumulated sufficient assets to pay for the estimated liability.
The total estimated landfill closure and post-closure liabilities as of June 30, 2013, totaled $49,276,042; with $11, 919,000 for closure costs for the Hartford landfill and $37,357,072 for the post closure monitoring of all 5 landfills including Hartford (Exhibits 5A and 5B). The Authority has executed a contract for the closure of the Hartford landfill for $11,600,000 which is expected to be completed by January 1, 2014. The total assets available for the closure and post closure costs total $54,208,000 ($11,919,000 in the Mid CT Division and $42,289,000 in the Landfill Division), net of non-landfill closure and post closure related liabilities. Of the $42,289,000 of asset available in the Landfill Division, $7,881,000 was loaned to the Connecticut Solid Waste System Division and therefore only $34,408,000 is available in the form of cash and investments as of June 30, 2013.
Equity
The MID-CT project could have a liability of approximately $18.8 million.
The Mid-CT project for accounting purposes was completed when the bonds were paid off in November 2012. The Authority has recorded estimates for the costs that will be incurred to finalize the project. Past

Comprehensive Operational Review of CRRA October 30, 2013
The information contained herein is subject to the disclaimer presented on page 1 of this document.
Page 8
practice was that this amount will be returned to the member towns as the final accounting is completed as approved by the Authority’s Board. As of June 30, 2013, the project reflects an equity balance of $18,847,000.
Southeast Project
Currently, the project from inception until June 30, 2013 has generated revenues in excess of expenses of $9,049,000. It would appear that this amount could be classified as a liability being due to Southeastern Regional Resources Recovery Authority (SCRRRA).
The SE project generated revenues in excess of expenses of $9,049,000. Based upon discussions with the Authority, it appears that the Authority is functioning as an agent for the SCRRRA. This amount that was reported as unrestricted net position could be classified as a liability being due to SCRRRA. The only revenue that the Authority is entitled to from this division is the $225,000 administrative fee the Authority charges the project (SCRRRA) to perform administrative functions as defined by the contract. Conduit bonds have been issued by the Authority to assist the operator in financing the construction of this facility. Repayment of the bonds is NOT the responsibility of the Authority or the State, rather it is the responsibility of the operator of the facility.
Contingencies
The most significant claims against the Authority are as follows:
MDC arbitration claim for $47,000,000 for certain post-employment benefits and other costs that MDC may incur due to the expiration of its contract for operations of a portion of the former Mid-CT project.
MDC has also included in its invoices to the Authority an amount for certain legal and consulting fees. The Authority has disputed these charges based upon the grounds those costs are not related to the operations based upon the MDC and Authority agreement.
Insurance carrier claim by American International Specialty Lines Insurance Company (AISLIC) attempts to recoup the claim paid under the Authority’s policy for claims from numerous commercial and residential neighbors of the Hartford Landfill.
Comprehensive Operational Review of CRRA October 30, 2013
The information contained herein is subject to the disclaimer presented on page 1 of this document.
Page 9
Operations
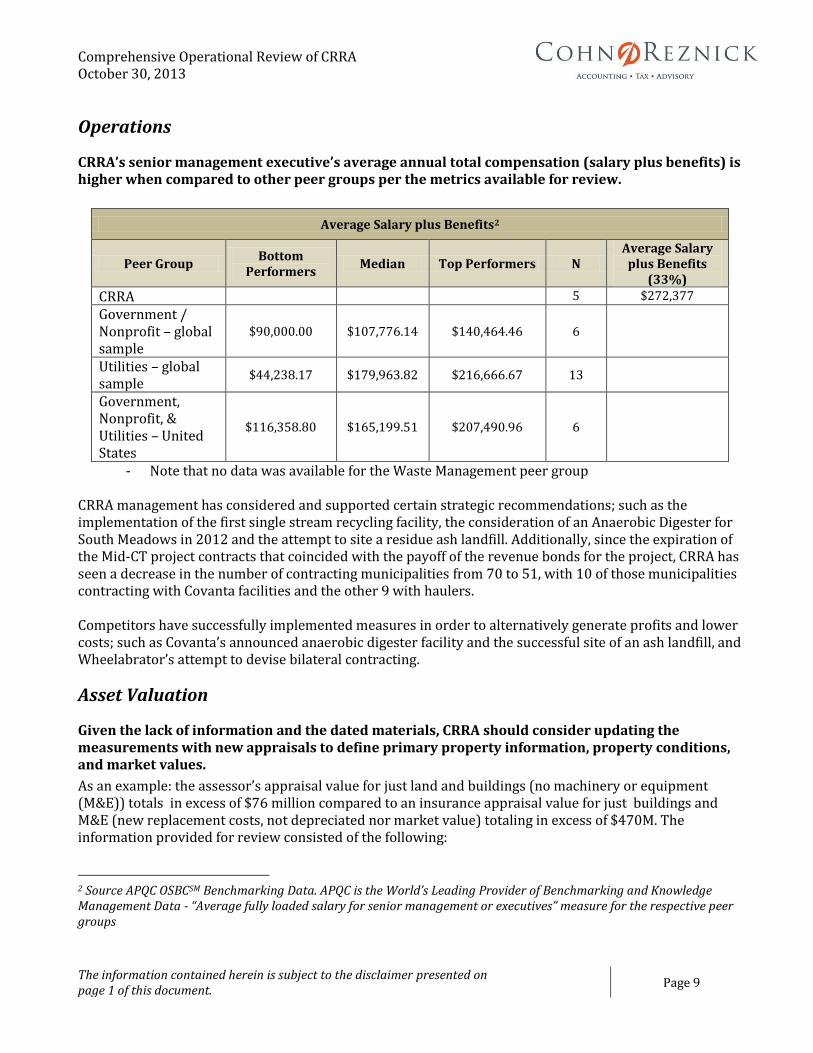
CRRA’s senior management executive’s average annual total compensation (salary plus benefits) is higher when compared to other peer groups per the metrics available for review.
Average Salary plus Benefits2
Peer Group Bottom
Performers Median Top Performers N
Average Salary plus Benefits
(33%)
CRRA 5 $272,377
Government / Nonprofit – global sample
$90,000.00 $107,776.14 $140,464.46 6
Utilities – global sample
$44,238.17 $179,963.82 $216,666.67 13
Government, Nonprofit, & Utilities – United States
$116,358.80 $165,199.51 $207,490.96 6
- Note that no data was available for the Waste Management peer group CRRA management has considered and supported certain strategic recommendations; such as the implementation of the first single stream recycling facility, the consideration of an Anaerobic Digester for South Meadows in 2012 and the attempt to site a residue ash landfill. Additionally, since the expiration of the Mid-CT project contracts that coincided with the payoff of the revenue bonds for the project, CRRA has seen a decrease in the number of contracting municipalities from 70 to 51, with 10 of those municipalities contracting with Covanta facilities and the other 9 with haulers. Competitors have successfully implemented measures in order to alternatively generate profits and lower costs; such as Covanta’s announced anaerobic digester facility and the successful site of an ash landfill, and Wheelabrator’s attempt to devise bilateral contracting.
Asset Valuation
Given the lack of information and the dated materials, CRRA should consider updating the measurements with new appraisals to define primary property information, property conditions, and market values.
As an example: the assessor’s appraisal value for just land and buildings (no machinery or equipment (M&E)) totals in excess of $76 million compared to an insurance appraisal value for just buildings and M&E (new replacement costs, not depreciated nor market value) totaling in excess of $470M. The information provided for review consisted of the following:
2 Source APQC OSBCSM Benchmarking Data. APQC is the World’s Leading Provider of Benchmarking and Knowledge Management Data - “Average fully loaded salary for senior management or executives” measure for the respective peer groups

Comprehensive Operational Review of CRRA October 30, 2013
The information contained herein is subject to the disclaimer presented on page 1 of this document.
Page 10
Assessor’s appraised market values that assess the market values of land and buildings, but does not include M&E
An insured value of the new replacement costs of buildings and M&E only. It does not include land valuations, nor does it reflect market value, nor depreciated values
GES appraised values of the Mid-Connecticut WTE facility. GES performed both a tax assessment appeal appraisal and a market valuation report with conflicting land value opinions between the reports, which impacts the credibility of the reports
An engineer’s depreciated replacements cost which is dated (7 years old) and excludes land values
Review of Business Transactions
No exceptions to CRRA’s competitive bid policy were noted during the review.
A sample of 25 transactions was selected from the general ledger crossing all vendor types and geographies, with a heavier focus on Government and Municipality and Legal and Professional Services vendor types. From that initial testing, it appears that the Authority is following its competitive bid policy for purchases of goods and services costing more than $50,000 in a fiscal year. While there were some samples that did not have associated purchase orders (e.g., payroll withholding, general utilities, et al), these activities carried out by the Authority are considered legitimate, as well as best practice in the municipal industry, and should not need to follow a formal purchase order approval process. However, these exceptions should be documented in the Procurement Policy to reflect current practice.

Comprehensive Operational Review of CRRA October 30, 2013
The information contained herein is subject to the disclaimer presented on page 1 of this document.
Page 11
Task I A review of all audits, investigations, management consulting engagements, and strategic planning exercises over the past 10 fiscal years, including, but not limited to, the following:
a) A review for any inconsistencies amongst the audits and associated findings and compare the results of these audits to the results of similar Authority internal audit reports.
b) A summary of any issues noted, any recommendations made, the status of any remediation efforts, and any inconsistencies amongst audits and associated findings.
c) An assessment of the governance infrastructure in place to determine the Authority‘s ability to support audit-like efforts and effectively deal with, remediate, and interpret the results of any such effort.
Activities Performed
Reports from prior audits, investigations, consulting engagements, and strategic planning exercises for the past 10 years were received by the Authority, including:
External Auditor Reports, including Management Letters of Internal Controls over Financial Reporting
Compliance Reports
Strategic Reports
Operations Reports
Management Correspondences
The purpose, results, and any findings noted on the reports were reviewed to determine the adequacy and effectiveness of the relative engagements as well as the degree of any issues that have not been completely resolved. In conjunction with the assessment of Management Effectiveness (Task IV, Sec M) Information Technology (Task V) and Internal Controls (Task VI), the data within these documents was analyzed and interviews with key stakeholders were conducted, including discussions with:
Thomas Kirk, CEO
Peter Egan, Director of Operations
Mark Daley, CFO
Nhan Vo-Le, Director of Accounting
Virginia Raymond, Operations Manager
Findings
As displayed in the External Auditor Reports table below, the Internal Controls over Financial Reporting (ICFR) issues noted in the auditors’ previous reports were discussed with management. The status of any past or current remediation efforts was considered during the concurrent assessments in IT, management effectiveness, and internal controls. Substantial efforts by the Authority have been undertaken to
Comprehensive Operational Review of CRRA October 30, 2013
The information contained herein is subject to the disclaimer presented on page 1 of this document.
Page 12
remediate the majority of these findings. However, of the 32 issues reviewed, three (3) were unresolved (i.e., not completely mitigated whereby an increased level of residual risk remains), as follows:
Vendor Master File
In 2009, the external auditors noted the absence of a review process of the vendor change report to verify that the vendor master file is populated with legitimate vendors. This issue was discussed with the CFO and the Director of Accounting in conjunction with the internal control testing and this issue remains open. It was noted that a management review of vendor changes to the Epicor system are not being reviewed; this review would verify that the vendor master file is populated with legitimate vendors with proper and correct information such as names, tax identification numbers, addresses, common telephone numbers and bank account information.
Non-Standard Journal Entries
In 2011, the external auditors noted an issue regarding the review and approval of non-standard journal entries. Specifically, year-end entries were initiated and approved by the same senior accounting officer without an independent review. During the internal control testing, no journal entries were initiated and approved by the same individual. However, it appears that there was a timeframe in 2013 where not all material year-end non-standard journal entries were reviewed and initialed by a CFO or designee to document approval. The implementation of this control mechanism can improve controls over adjustments to the general ledger and ultimately provide the Authority with a stronger system of internal control.
Realignment of Accounting Responsibilities
In 2012, the external auditors noted an issue with respect to the realignment of duties within the Finance and Accounting Department. No staff members were added as part of this realignment, and it made use of personnel not previously involved in the accounting or reporting process. The external auditors suggested the Authority perform a retrospective review of the reassigned duties over cash, payroll, reconciliations, et al, to ensure that policies and procedures are performed in an efficient, timely, and effective manner and that proper segregation of duties are maintained. Based on discussions with management, a review of policies and procedures, and internal control testing carried out in Task VI, it appears that the duties and responsibilities of the Accounting Department remained intact since 2012. Specifically, the Director of Accounting has permission for the following activities:
Perform or oversee transaction initiation, approval, execution and reconciliation
Submit and/or oversee all financial, regulatory and management reporting
Responsible for administering the Epicor general ledger system
Approves all disbursements
In addition, there did not appear to be adequate senior management oversight of these activities.
Background
External Auditor Reports
The external auditor reports of the financial statements of the Authority for the past 10 years uncovered the following results.

Comprehensive Operational Review of CRRA October 30, 2013
The information contained herein is subject to the disclaimer presented on page 1 of this document.
Page 13
Year Auditor Auditor Opinion
Material Weaknesses
Noted
Internal Control
Deficiencies Noted
Unresolved External
Audit Issues Noted
2003 Carlin, Chardon & Rosen LLP Unqualified 0 6 0
2004 Carlin, Chardon & Rosen LLP Unqualified 0 4 0
2005 Carlin, Chardon & Rosen LLP Unqualified 0 3 0
2006 Carlin, Chardon & Rosen LLP Unqualified 0 4 0
2007 Carlin, Chardon & Rosen LLP Unqualified 0 3 0
2008 Carlin, Chardon & Rosen LLP Unqualified 0 3 0
2009 Bollam, Sheedy, Torani & Co. LLP Unqualified 0 6 1
2010 Bollam, Sheedy, Torani & Co. LLP Unqualified 0 0 0
2011 Bollam, Sheedy, Torani & Co. LLP Unqualified 0 2 1
2012 Bollam, Sheedy, Torani & Co. LLP Unqualified 0 1 1
Each external auditor’s report noted an “unqualified” opinion, which generally means that the company’s records and financial statements are fairly and appropriately presented in accordance with Generally Accepted Accounting Principles (GAAP). Additionally, the associated Management Letters for Internal Controls over Financial Reporting (ICFR) identified 32 issues noted by the external auditors, including repeated issues. These findings were discussed with management to confirm their remediation efforts and analyzed for adequate internal control design in conjunction with the concurrent assessments.. The table below summarizes the findings noted by the external auditors as well as if the issue appears to be unresolved at the time of the assessment.

Comprehensive Operational Review of CRRA October 30, 2013
The information contained herein is subject to the disclaimer presented on page 1 of this document.
Page 14
Compliance Reports
Pursuant to annual reporting requirements under Sections 123(a) and 22(a)-268e of the Connecticut General Statutes, the Authority’s Comprehensive Annual Financial Reports for the past 10 years were reviewed to determine any inconsistencies between the submissions to any concurring audits, management reports, or governing documentation. The following content in each submission included: CGS Section 1-123(a):
1. New Bond Issued - A list of all bond issues for the preceding fiscal year, for each such issue, the financial advisor and underwriters, whether the issue was competitive, negotiated or privately placed, and the issue’s face value and net proceeds;
2. Financial Assistance Provided - A list of all projects other than those pertaining to owner-occupied housing or student loans receiving financial assistance during the preceding fiscal year, including each project’s purpose, location, and the amount of funds provided by the agency;
3. Vendors Paid Over $5K - A list of all outside individuals and firms receiving in excess of five thousand dollars in the form of loans, grants or payments for services, except for individuals receiving loans for owner-occupied housing and education;
4. Financial Statements - Showing all revenues and expenditures;
5. Bond Status - The cumulative value of all bonds issued, the value of outstanding bonds, and the amount of the state’s contingent liability;
Year# of
IssuesNew Repeat Description of New Issue
Repeated
Issue?'03 '04 '05 '06 '07 '08 '09 '10 '11 '12
CR
Comments
2003 6 6 -- (1) Accounting of Fixed Assets Yes x x(2) Monitoring of Inventory Yes x x(3) Monitoring of Bond Covenants No x(4) Accounts Receivable Management No x(5) Minimum Commitment Bid - MidConn Project No x
(6) Employee Personnel Policies No x
2004 4 2 2 (1) Unrestricted Net Assets - MidConn & Bridgeport Yes x x x x
(2) Mid-Conn Internal Control over Revenue and Cash Yes x x x x
2005 3 1 2 (1) MDC Inventory Yes x x
2006 4 1 3 (1) IFCR Management Tracking Process No x
2007 3 1 2 (1) Closure/Post Closure Accounting of Liabilities No x
2008 3 3 -- (1) Change Management Controls No x(2) IT Testing Backup Files Yes x x(3) Vulnerability Assessment No x
2009 6 5 1 (1) Contract Repository and Process No x
(2) IT User Access No x(3) Epicor Process/System Improvements No x(4) Vendor Master File Process and Review No x Issue 1(5) Reviewing Bank Statements No x
2010 0 -- -- No letter was issued; no findings noted -- --
2011 2 2 -- (1) Segregating restricted net assets No x(2) Review/Approval of Non-standard Journal Entries No x Issue 2
2012 1 1 -- (1) Realignment of Duties within Finance/Accounting N/A x Issue 3
32
Comprehensive Operational Review of CRRA October 30, 2013
The information contained herein is subject to the disclaimer presented on page 1 of this document.
Page 15
6. Affirmative Action - The affirmative action policy statement, a description of the composition of the agency’s work force by race, sex, and occupation and a description of the agency’s affirmative action efforts;
7. Planned Activities - A description of planned activities for the fiscal year; and
8. Enron-Related Matters - A description of efforts to mitigate the effects of Authority-Enron-Connecticut Light and Power Company transaction.
Strategic Reports
Reports from various strategic engagements carried out by external parties were reviewed to any concurring audits, management reports, and governing documentation. Management’s effectiveness to carry out recommendations set forth in the strategy reports is described in Task 4, Section (m). Also, please note that reports produced by CRRA are included in the subsequent section “Management Communications.” The name of the study or examination and its associated purpose, results, and report recommendations are as follows:
1. CRRA Sludge Co-Disposal Study and Report, Halcyon Technologies, March 2002
CRRA and Halcyon Technologies LLC conducted a cursory review of two WTE facilities to evaluate their suitability for a co-disposal of municipal wastewater treatment residual biosolids ("sludge") at one or both facilities each in Wallingford, CT and Hartford, CT. Specifically, successful testing would allow observation of:
a) Impacts on boiler operation (i.e., does sludge add significantly to boiler fouling or furnace slagging?).
b) Burn-out observation (i.e., sludge should be completely burnt out from the ash, requiring proper atomization and dispersion as well as nozzle location).
c) Impact of elevated gas volumes.
d) Any effect on emissions performance by collecting environmental data.
Test recommendations are summarized as follows for the Wallingford facility:
e) Testing liquid sludge should be relatively straightforward; use of liquid injection is appropriate in this situation; a final design would be needed.
f) Sludge cake injection directly in the primary combustor or possibly onto the refuse in the feed-lock area by applying the Von Roll nozzle ; a final design would be needed.
For the Mid-Conn facility:
g) For liquid sludge, same as the Wallingford recommendation.
h) For firing sludge cake, the following should be considered:
Mix the cake on top of belt at the RDF storage building.
Set-up receiving/feeding/pumping at grade in the boiler building, pump up under pressure and size reduce at point of discharge to one of the RDF air swept chutes.
Comprehensive Operational Review of CRRA October 30, 2013
The information contained herein is subject to the disclaimer presented on page 1 of this document.
Page 16
Set-up receiving/feeding/pumping at grade in the boiler building and pump up and ribbon discharge to the RDF surge bin.
Directly inject the sludge cake with the dual-fluid injection nozzle, same as Wallingford recommendation.
Cost estimates for each recommendation as well as charts, illustrations, and diagrams for conducting a test were provided in this study.
2. DEP Solid Waste Management Bulletin to Townships, CRRA, August 2006
Main verbiage from the bulletin to townships included “Connecticut should control its own destiny for managing its trash. Yet under current operating agreements, five of the state’s six trash-to-energy facilities could be privately controlled – with that disposal capacity sold to the highest bidder, even if those bidders are from Massachusetts or New York or Rhode Island – by 2015. That could force towns to export trash to other states, putting even more trucks on our highways and leaving us at the mercy of out-of-state entities. The SWMP should advocate for more disposal capacity that benefits the public interest.”
3. State of Connecticut Solid Waste Management Plan, July 2006 (Amended December 2006)
In this plan, “The Connecticut Department of Environmental Protection (the Department or CT DEP) has amended the State Solid Waste Management Plan in accordance with Section 22a-228 of the Connecticut General Statutes (CGS). It replaces the State Solid Waste Management Plan that was adopted in 1991. This new Plan will now serve as the basis for Connecticut’s solid waste management planning and decision making for the period fiscal year 2005 through fiscal year 2024. The Plan addresses a wide range of solid wastes, focusing primarily on MSW (i.e., waste that is commonly considered household and commercial trash) and debris resulting from construction and/or demolition activities (C&D waste). Though some other special wastes are addressed, hazardous wastes are not covered. The Plan examines the existing state of solid waste management in Connecticut, identifies the problems that exist and the barriers to solving those problems, sets out a vision and goals and presents strategies to help achieve those goals and realize the vision. Within the immediate five-year period, Connecticut will focus on implementing the higher priority strategies listed in the Plan.”
The Plan summarizes the proposed implementation strategies in order for each of the nine “roles” outlined as responsible parties (US EPA, CT DEP, State Agencies, Agency SWM Advisory Committee, CRRA, Regional Entities, Municipalities, Private Sector, Residents/Consumers/ Commercial Waste Generators) to achieve the State’s long-term solid waste management goals.
In the Executive Summary, critical issues or decisions to be addressed by “Regional Waste Authorities” include:
a. Continue to play an active role in the proper and efficient management of solid waste in their communities
b. Expand recycling/source reduction programs and efforts
c. Increase enforcement of local recycling ordinances
d. Enact or amend ordinances to reflect new State Programs
e. Change purchasing practices to create less waste and purchase environmentally preferable products

Comprehensive Operational Review of CRRA October 30, 2013
The information contained herein is subject to the disclaimer presented on page 1 of this document.
Page 17
Further, the report stated major recommendations to be addressed by all stakeholders; the following points, which include those impacting CRRA in some capacity, are outlined and summarized below:
a. MSW Disposal Diversion Rate
b. Target of 58% MSW disposal diversion by fiscal year 2024, to be executed by intermittent studies by State, new technology research and evaluation, and elimination of institutional barriers.
c. Source Reduction, Recycling, Composting
d. Reduce per capita disposal rate from 0.8 tons/person/year in fiscal year 2005 to 0.6 in fiscal year 2024; executed by adequate funding to adopt MSW DDR rate recommendation, achieve significant greenhouse gas reductions via 2005 Conn Climate Change Action Plan, and increase efforts to compost source separated commercial and institutional food waste.
e. Disposal Capacity
f. Attain self-sufficiency in managing solid waste and ash residue
g. Ownership of RRF Ash landfill - Decision over private versus public ownership
h. Decision for private versus public ownership over MSW and RRF ash residue disposal capacity
i. Statutory Impacted Changes
j. Establish a recycling program for electronics
k. Prohibit disposal of unprocessed construction and demolition waste
l. Add Plastics #1 and #2 and magazines as mandated recyclables
m. Require liners for new C&D/oversized MSW/bulky waste landfills
4. Management Comments on the August 2006 Proposed Plan, CRRA, September 2006
This report included comments on the July 2006 Proposed Plan by Peter W. Egan, Director of Environment Affairs & Development of CRRA. Comments from Mr. Egan addressed four key policy areas: 1) solid waste capacity assurance, 2) public versus private control of the solid waste management infrastructure in the State, 3) diversion and beneficial use of solid waste, and 4) funding.
5. DEP Solid Waste Management Advisory Committee Presentation, CRRA, February 2010
CRRA presented its current state and future plans to the DEP Solid Waste Management Advisory Committee, including Mid-Conn operations, CCSWA governance, and MDC expiration,
6. Study and Review of New and Emerging Technologies for Municipal Solid Waste Disposal, Alternative Resources Inc., May 2010
This study outlines the new and emerging technologies that are commercially viable and could potentially replace the current waste processing facility located in Hartford, CT. The report addresses technologies that are now or will be commercially available in the near future, have the capability of reliable and cost effective waste disposal, and are otherwise appropriate for consideration as alternatives to traditional WTE technology for the management of mixed,
Comprehensive Operational Review of CRRA October 30, 2013
The information contained herein is subject to the disclaimer presented on page 1 of this document.
Page 18
unsorted mass solid waste. Technologies considered include those that use biological, thermal, hydrolysis, chemical, and mechanical processes, whereas traditional technologies were not the subject of the report. The following considerations were noted while assessing the possible application of new and emerging technologies to the Mid-Connecticut Project:
New and emerging technologies have not been demonstrated at any facility worldwide at a size large enough to process 850,000 tons per year of MSW.
Technology transfer risk including that for performance, environmental impacts, marketability of products, and cost should be considered in both allocation of risk in preparing contract documents and in assessing availability of alternatives for MSW should a facility not perform as expected.
Any replacement facility utilizing either traditional technology or new and emerging technology would not be ready to process waste in 2012. It would require five to seven years to develop and bring to commercial operation.
Unless the replacement facility were eligible for and received one or more economic incentives (federal or state funding) and/or renewable energy credits or greenhouse gas emissions credits, the tipping fee would likely exceed $65 per ton in 2012.
Further, per the report, a consideration was made to CRRA to consider such technology on a “demonstration” basis, initially developing a smaller sized facility that could be expanded to process 850,000 tons per year if the initial “demonstration” units were successful. Also, per the report, a “transition” is being considered and implemented elsewhere in the U.S.
7. Presentation to the Governor, Modernizing Recycling Working Group, October 2012
Presentation by CRRA to the Governor's Modernizing Recycling Working Group analyzes the statutory and funding requirements of CRRA with respect to Planning, Implementing SWMP, Development and Operations of Facilities, Recycling, and Education. The presentation also covers the DEEP and CRRA functional relationship.
8. Report of Recommendations to the Governor, Modernizing Recycling Working Group, December 2012
The Governor’s Modernizing Recycling Working Group (“Working Group”) was established to modernize the state’s solid waste and materials management policies to recover more value from discards and step up our efforts to reduce, reuse, and recycle. The Working Group has developed recommendations for ways that Connecticut can capture the value of these commodities and to promote a stronger waste and materials management system. Building on Connecticut’s leadership role in fostering a unified solid waste management system, dating back almost 40 years, the Working Group seeks to position Connecticut for continued leadership for future generations.
This report re-imagines a further integrated approach to sustainable materials management in Connecticut. A list of the following recommendations which should drive environmental and economic benefits was documented by the Working Group members who felt that warrant consideration by the Governor, legislature, DEEP, and/or the State’s SWM Advisory Committee:
a) Promote an environmentally beneficial infrastructure that balances the need for both stability and responsiveness under market conditions and includes a diversity of systems and facilities to collect, process, and recover material and energy value, and to support the development of stronger markets for recovered commodities. Specifically:

Comprehensive Operational Review of CRRA October 30, 2013
The information contained herein is subject to the disclaimer presented on page 1 of this document.
Page 19
• Expand capacity and performance of construction and demolition facilities
• Regionalize construction and demolition infrastructure development
• Incentivize and/or finance organics composting and/or anaerobic digestion facilities
• Implement separation of residential organic waste
• Update solid waste assessment
• Clean new Infrastructure Development Bank or expand existing funding mechanism such as the Clean Energy Investment and Finance Authority to assist in financing new recycling businesses
• Address difficult waste systems and repurpose closed landfills
• Evaluate bottle bill
• Provide greater processing flexibility for municipal transfer stations
• Assure the sustainability of the state’s waste to energy infrastructure to manage non-recyclable wastes, while continuing to prioritize source reduction, reuse and recycling
b) Foster economic development and job creation through increased materials recovery that make raw materials available to in-state manufacturers. Specifically:
• Align economic development incentives
• Improve procurement activities to increase demand for materials - have the state lead by example
• Form recycling market development council or similar group led by industry
• Conduct a Recycling Economic Information study to quantify industry value to Connecticut’s economy
c) Reduce economic, operational, and administrative burdens on municipalities and individuals by encouraging modernization of pricing systems, data systems, and phasing in the potential for regional services; specifically:
• Promote product stewardship
• Implement unit-based pricing
• Register collectors at regional or state level
• Simplify and improve data reporting requirements
• Save money through more efficient collection
• Develop statewide recycling education and enforcement campaign
• Reiterate state, regional, and municipal planning
• Reinvigorate Solid Waste Management Advisory Committee

Comprehensive Operational Review of CRRA October 30, 2013
The information contained herein is subject to the disclaimer presented on page 1 of this document.
Page 20
d) Redefine the role of the CRRA and the role and value of multiple Regional Solid Waste Authorities in governance, responsibilities, and operations and provide recommendations for improvement. Specifically:
• Analyze the role of CRRA in its governance, responsibilities, and operations and provide recommendations for improvement
• It is no longer appropriate for CRRA to have a statewide role in the areas of bonding, education and development. A transition plan is needed to evaluate the functions of the organization and manage this changed role, with time and considerations of the operational requirements of the regional transfer stations, landfills, and other functional roles. It would be appropriate to manage this transition with advisory input from affected towns impacted by changes. Some options include:
o Remove CRRA statewide responsibilities and simplify into a regional role
o Privatize assets and liabilities in a three- to five-year plan
o Distribute CRRA’s key statutory capabilities
o Relieve CRRA of post-closure obligations at landfills and have another entity assume the role and control post-closure funding reserves
Operations Reports
The Annual Report of Connecticut Resource Recovery Authority Operations for the years 2005 through 2012 were received from management. As required by Connecticut General Statute 22a-263, the Authority provides an annual report of operations of the Authority to the Connecticut General Assembly for the fiscal years ending June 30. Statutory requirements are reported separately for each project and the content of these reports included:
A summary of active and expired projects throughout the state
A listing of the number and type of waste management service contracts entered with local government units and persons and the associated charges.
A map showing the location of all facilities owned or leased by the Authority
A schedule of the amounts of waste received and processed in such facilities
A listing of outstanding issues of notes and bonds of the Authority and the payment status thereof
A budget showing the administrative expenses of the Authority
A report of revenues of the Authority from all sources and of the redistribution of any surplus revenues
Management Communications
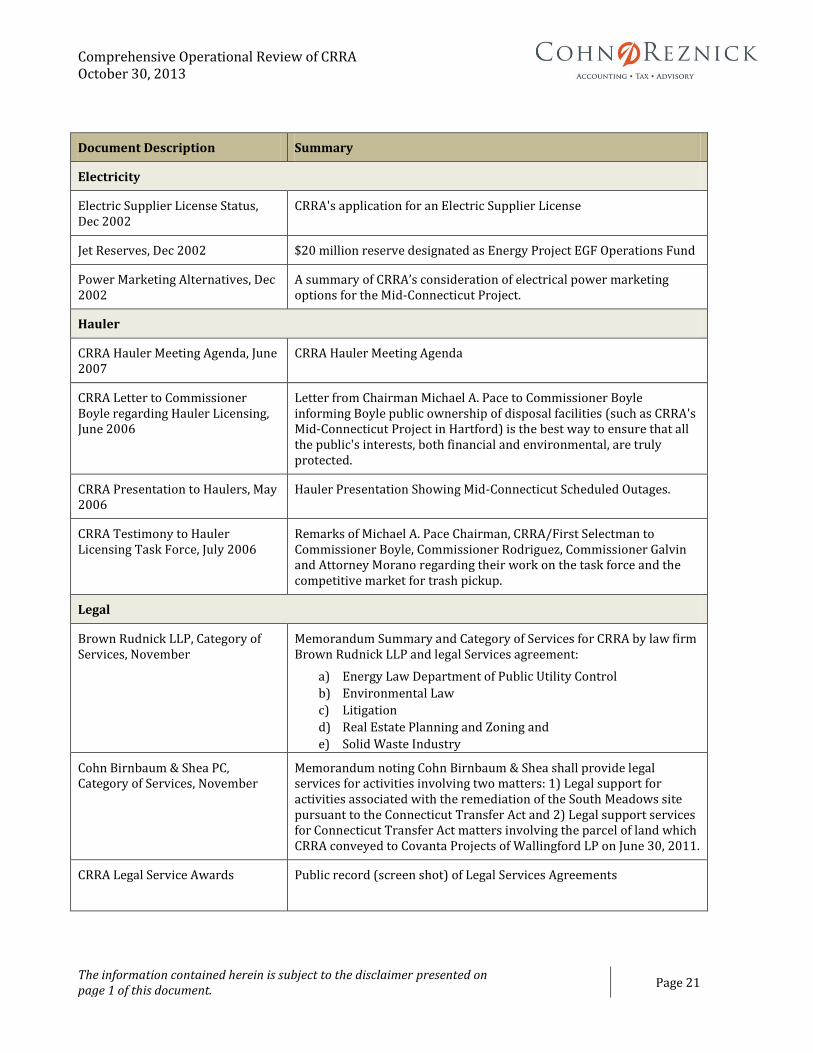
Various correspondences addressed to or from CRRA management with respect to electricity, hauler, legal, legislature, and operations were provided. The description of the documents and associated summaries of each are as follows:
Comprehensive Operational Review of CRRA October 30, 2013
The information contained herein is subject to the disclaimer presented on page 1 of this document.
Page 21
Document Description Summary
Electricity
Electric Supplier License Status, Dec 2002
CRRA's application for an Electric Supplier License
Jet Reserves, Dec 2002 $20 million reserve designated as Energy Project EGF Operations Fund
Power Marketing Alternatives, Dec 2002
A summary of CRRA’s consideration of electrical power marketing options for the Mid-Connecticut Project.
Hauler
CRRA Hauler Meeting Agenda, June 2007
CRRA Hauler Meeting Agenda
CRRA Letter to Commissioner Boyle regarding Hauler Licensing, June 2006
Letter from Chairman Michael A. Pace to Commissioner Boyle informing Boyle public ownership of disposal facilities (such as CRRA's Mid-Connecticut Project in Hartford) is the best way to ensure that all the public's interests, both financial and environmental, are truly protected.
CRRA Presentation to Haulers, May 2006
Hauler Presentation Showing Mid-Connecticut Scheduled Outages.
CRRA Testimony to Hauler Licensing Task Force, July 2006
Remarks of Michael A. Pace Chairman, CRRA/First Selectman to Commissioner Boyle, Commissioner Rodriguez, Commissioner Galvin and Attorney Morano regarding their work on the task force and the competitive market for trash pickup.
Legal
Brown Rudnick LLP, Category of Services, November
Memorandum Summary and Category of Services for CRRA by law firm Brown Rudnick LLP and legal Services agreement:
a) Energy Law Department of Public Utility Control
b) Environmental Law
c) Litigation
d) Real Estate Planning and Zoning and
e) Solid Waste Industry
Cohn Birnbaum & Shea PC, Category of Services, November
Memorandum noting Cohn Birnbaum & Shea shall provide legal services for activities involving two matters: 1) Legal support for activities associated with the remediation of the South Meadows site pursuant to the Connecticut Transfer Act and 2) Legal support services for Connecticut Transfer Act matters involving the parcel of land which CRRA conveyed to Covanta Projects of Wallingford LP on June 30, 2011.
CRRA Legal Service Awards Public record (screen shot) of Legal Services Agreements

Comprehensive Operational Review of CRRA October 30, 2013
The information contained herein is subject to the disclaimer presented on page 1 of this document.
Page 22
Document Description Summary
CRRA Hartford Landfill Host Agreement
Agreement stating CRRA holds all permits and approvals for the operation of the Landfill. The Landfill is reaching its maximum capacity for both solid waste and ash residue and must be closed, and thereafter monitored and maintained for at least thirty (30) years (for purposes of this Agreement, "Closure" and "Post-Closure Care and Monitoring"). CRRA is requesting the City's cooperation in obtaining an approval from the Department of Environmental Protection (the "DEP") for the application to modify the Solid Waste "Permit to Operate" for the Hartford Landfill, as revised, dated July.
Memorandum of Decision: MDC v CRRA, November 2010
Dismissed all counts for lack of standing, or, in the alternative, judgment enters in favor of the defendant, CRRA, on those counts for substantive reasons.
Legislative Legal
Blumenthal to CRRA on Board Members Dual Roles, November 2006
From Richard Blumenthal, Attorney General to Laurie Hunt, Director of Legal Services; Confirming the legislature intended that there is no conflict of interest or duties when municipal officials serve as both CRRA board members and municipal officials, and decide matters affecting the CRRA and their municipalities.
Legislative Summary, 2013 Require the Connecticut Department of Energy & Environmental Protection to “initiate one or more audits” of CRRA in consultation with OPM to examine subjects “including but not limited to” any or all previous audits of CRRA.
SB 1167 Legislative Bulletin Bulletin relating to The REAL Facts about SB 1167
Mid-Conn Operations and Fees
Letter to Mid-Conn Towns regarding MDC and New Hartford Suit, August 2005
This letter covers two issues: 1) CRRA and major contractor, the Metropolitan District Commission (MDC). On August 5 the Arbitration panel ruled that MDC has overcharged CRRA by more than $12.7 million since 1996 and must reduce the price it charges CRRA for the remainder of the contract term, 2) Not able to return the full amount back to the towns. This is due to the continuing legal proceedings against CRRA by two member towns.
Alert to Towns regarding Schuman Decision
Town of New Hartford sued CRRA and numerous other parties over the Mid-Connecticut Project’s loss in the Enron bankruptcy. The town of Barkhamsted later joined onto those actions, which were combined with the town of West Hartford’s Enron-related suit against CRRA. This suit has already cost significant amounts of money – close to $500,000 in legal fees, staff time and other costs. The next step will be to determine the suit’s class status. New Hartford and Barkhamsted have asked that this action become a class-action suit, which would require another ruling from the bench.
CRRA Advisory Panel Report, The report reviews the existing situation at CRRA, makes non-Financial Recommendations, explains the constraints on proposed financial

Comprehensive Operational Review of CRRA October 30, 2013
The information contained herein is subject to the disclaimer presented on page 1 of this document.
Page 23
Document Description Summary
March 2002 strategies and makes specific financial recommendations for immediate adoption. It also identifies some potential long-term strategies for further relief.
Fiscal Year 2003 Budget Reductions for Mid-Conn, Dec 2002
A worksheet which sets forth a total of $628,512 in reductions to the General Fund budget.
Letter to Mid-Conn Towns, Aug 2007
Summary includes:
a) New recycling revenue opportunity for the member towns.
b) The ruling and subsequent appeal of a lawsuit by member towns against CRRA,
c) The $14.8-million cash distribution to 70 member towns approved in January but suspended by the court, and
d) Costs due to the closing of the Hartford landfill.
Mid-Conn MSA Comparison Table Mid-Connecticut System Municipal Service Agreements - Summary and Comparison of Key Terms
Mid-Conn Revenue Fund Analysis, Dec 2002
Summary of Mid-Conn Revenue in Excel format
Letter to Mid-Conn Towns on Cost Initiative, April 2004
A memo discussing the fees that are charged by MDC and concerns that MDC will not work with the Mid-Connecticut Project:
• MDC has for years been charging CRRA amounts far in excess of MDC’s actual costs of providing services to CRRA. This overcharging was accomplished principally through billing CRRA for “indirect costs” or overhead. Three years ago, a three-person arbitration panel found this billing of indirect costs to be “unfair” to CRRA. Despite the arbitrators’ directive to change this unfair system, MDC continues to charge indirect costs, albeit with a unilaterally imposed “cap” on the fee.
• CRRA has concluded that even if MDC were charging only its actual costs to CRRA, MDC’s price for providing these services to CRRA would still far exceed what private contractors would charge to provide the same, or in many cases a greater, level of service than MDC provides.
Letter to Mid-Conn Towns Status Report on Enron, July 2003
In the spring of 2001, the old CRRA entered into a complicated business agreement with Enron and Connecticut Light and Power (CL&P). That agreement, simply stated, took 220 million dollars of value associated with a favorable electric power contract that ran through 2012 and transferred it to Enron in return for 11 years of monthly energy payments ($26,000,000/year). With the failure and bankruptcy of Enron, those hundreds of millions of dollars in monthly payments, necessary for debt service and operations through 2012, were lost.
Steps to Mitigate include:
• Continuing to pursue additional cost reduction and revenue initiatives, some of which show substantial promise. Most important, pursuing the renegotiation of contracts with all of the

Comprehensive Operational Review of CRRA October 30, 2013
The information contained herein is subject to the disclaimer presented on page 1 of this document.
Page 24
Document Description Summary
project’s major vendors — including the largest single contractor, the Metropolitan District. Goal to reduce future tipping fees by as much as $5/ton.
• Negotiated a new Electricity Purchase Agreement (EPA) to increase the revenues from the sale of electricity, which is projected to provide another $2.5/ton in additional revenues over the next two years.
• The bonds on the Mid-Connecticut Project will be paid off in 2012. The facility’s design life will extend at least a decade beyond that date. After 2012 the project will be debt-free, significantly reducing the facility tipping fee revenue requirements.
• Continue, with the Attorney General, to doggedly pursue legal action to recover damages from those responsible for the Enron failure and bankruptcy.
Letter to Mid-Conn Towns on Enron Litigation, March 2004
Letter to Mid-Connecticut towns regarding the Enron debacle. Following the Enron bankruptcy, the state put into place a completely new board and senior management team charged with cleaning up the mess. Also a letter discussing the possible consequences of suing such as New Hartford whereby CRRA's insurance policy has an Absolute Enron Exclusion, if the insurer denies a claim any legal fees, penalties or damages incurred because of this action would be paid out of Mid-Connecticut Project revenues, namely the tipping fees paid to CRRA by those same cities and towns.
AG Report on Truck Transfer Deal Review of the transfer deal
CRRA MDC Arbitration Ruling Summary of CRRA-MDC Arbitration Ruling

Comprehensive Operational Review of CRRA October 30, 2013
The information contained herein is subject to the disclaimer presented on page 1 of this document.
Page 25
Task II An analysis of the financial condition of CRRA, including, but not limited to, the following:
a) A detailed analysis of the Authority‘s financial data including available balance sheets, income statements, and internal budget projections from the past 7 years.
b) A detailed accounting of CRRA’s revenue streams for the current fiscal year, including the amount, source and expected duration of such revenue.
c) A projection of CRRA’s expected revenue for the next 3 years and a detailed description and explanation for all changes to the amount of such revenue streams over the duration of such projection or compared to the current fiscal year.
d) An accounting of CRRA’s expected cash flow for calendar years 2013, 2014, and 2015, taking into account all known contractual or legal liabilities and revenue projections.
e) An explanation of all assumptions made in deriving such projections and all variables that, if changed, could affect such projections.
Activities Performed
The following activities were performed during this analysis:
Reviewed the contracts that were in place to collect solid waste.
Compared actual tipping fees to tipping fees needed to recover all expenses.
Reviewed historic tonnage of metal scraps taken from garbage collected.
Discussed with management the future expectations of recovered metals, including pricing.
Reviewed historic tonnage of bulky and municipal waste taken from garbage collected.
Discussed with management the process of collecting bulky waste.
Discussed with management the reduction in towns and the related recycling revenues.
Reviewed various internal and external engineering reports and CRRA calculations to verify that inputs were correct for forecasted electricity revenue.
Discussed current and future employment needs with Management.
Reviewed current payroll figures for accuracy to budget.
Discussions with management relating to the operational expenses of CSWS. Compared the CRRA prepared budget to the prior year expenses and discussed differences with Budget Director Jeff Duvall.
Reviewed Solid Waste Assessment agreement with the CT DEEP.
Discussed future fees with management.
Reviewed the Ash Residue Transportation and Disposal Services Agreement.
Discussed with management procedures and policies for waste transportation.

Comprehensive Operational Review of CRRA October 30, 2013
The information contained herein is subject to the disclaimer presented on page 1 of this document.
Page 26
Discussed with management and reviewed the Operating and Maintenance Agreement between NAES Corporation and CRRA to determine the expenses related to Waste Processing and the Power Block Facility.
Reviewed the operations and maintenance contracts in place for each transfer station.
Discussed the operations with management.
A complete and detailed list of the documents reviewed during the assessment is provided in Appendix A.
Findings
CRRA’s fiscal year is July 1 through June 30; therefore, the projections prepared are for the fiscal years ending June 30, 2014-2016. The budget construction used by CRRA is one in which the detailed cost of operations is determined first. Once cash outflows are determined, CRRA establishes revenue charges to equal cash outflows. The majority of expenses for June 30, 2014, can be estimated as many of the cash outflows are fixed by operating and maintenance contracts. CRRA has two major sources of income: Power generation and refuse/recycling income. Electricity revenue is forecasted by kWh production. The gap between expenses and power production revenue and all other miscellaneous revenues is covered by tipping fees from the collection of refuse. The current tipping fees for year-ended 6/30/2014 ranges between $61 and $62 per ton. CRRA collects a total of 720,000 tons of refuse each year, including 10,000 ton of ferrous residue, which is used to run four electricity producing turbines. Waste is collected from participating towns (382,000 tons), participating garbage haulers (60,000 tons), contracts with waste collection companies (175,000), bulky waste (2,000) and the remaining refuse is collected from the spot market (91,000). For purposes of this forecast, it was assumed tipping fees and related revenues for the hauler waste, spot market waste and contract waste are fixed. The tipping fees from the remaining tonnage (382,000) are determined after an operating budget is calculated to match total revenues with total expenses. A summary of the projected cash flows for the 2014-2016 fiscal years is presented below:

Comprehensive Operational Review of CRRA October 30, 2013
The information contained herein is subject to the disclaimer presented on page 1 of this document.
Page 27
The projections above present the projected budget deficits for the fiscal years 2014-2016. The significant items that are the major contributing factors to the deficit are the conservative estimates for electricity prices and resultant revenue and the significant capital replacement expenses. Other revenue pressures are as a result of increased competition and loss of contracting municipalities and related tipping fee revenue after the municipal contract expired as a result of the Mid-CT bonds were paid off in November 2012. Since any increase in the municipal tipping fees to the above opt out price will most like cause some municipalities to opt out of the current contract to avoid local budget pressure, this is the least likely solution to address the projected deficit. The other revenue side solution that may need to be considered is increasing the contracted waste and spot tipping fees where possible. Eliminating the need for spot by converting it to MSA at an average price of $62 per ton would increase revenue by $2,457,000. Expense side solutions would include the postponing of certain capital expenses and/or using the Authority’s bonding ability to issue bonds to fund these capital improvements reducing the pressure on the annual operating budget and eliminating certain reserves funds included in the projected operating budget.
CRRA FY 2014
Forecast FY 2014 FY 2015 FY 2016
Revenues
Service Charges Solid Waste - Participating Towns 23,686,000$ 23,700,000$ 24,082,000$ 24,437,000$
Service Charges Solid Waste - Contracts 9,570,000 9,537,500 9,537,500 9,537,500
Service Charges Solid Waste - Hauler 3,720,000 3,716,000 3,776,000 3,832,000
Service Charges Solid Waste - Spot 3,635,000 3,635,000 3,635,000 3,635,000
Electricity 20,780,000 16,336,691 17,481,585 18,377,710
Other 3,201,000 3,201,000 3,205,500 3,205,500
Transfers from other Divisions 3,019,810 3,218,310 3,147,894 2,561,836
Total Revenues 67,611,810 63,344,501 64,865,479 65,586,546
Total Expenses 58,130,000 58,052,054 59,646,789 61,871,856
Net Operations before contributions to reserves and nonrecurring
expenses 9,481,810 5,292,447 5,218,691 3,714,690
Contribution to Capital Expense Reserve 5,909,000 5,909,000 13,000,000 12,000,000
Net Operations before contributions to reserves and nonrecurring
expenses 3,572,810 (616,553) (7,781,309) (8,285,310)
Less:
Non-Recurring Expenses - 900,000 - -
Other contributions to Reserves 2,795,500 2,795,000 1,407,500 1,277,500
Net Cash Generated - After Reserve Contributions and
Nonrecurring Expenses 777,310$ (4,311,553)$ (9,188,809)$ (9,562,810)$
Connecticut Resources Recovery Authority
Summary Revenue and Expenses for the Fiscal Years 2014-2016
Forecasted Operating Budget

Comprehensive Operational Review of CRRA October 30, 2013
The information contained herein is subject to the disclaimer presented on page 1 of this document.
Page 28
The most significant risk area in the projection is the electricity revenue. The variables that determine electricity revenue are tonnage, boiler efficiency, refuse derived fuel (RDF) units produced and electricity prices. Total tonnage and RDF units produced are relatively fixed variables. The electricity prices used in the forecast were provided by energy consultants and are subject to change depending on market rates. CRRA’s reports regarding its price and production are based on consultant’s reports. Complete copies of these reports were not provided. The consultant’s reports estimate an average electricity price of $0.0461.
Min Max Expected
2015
KWh Rate 0.0338$ 0.0461$ 0.0383$
KWh Production 369,917,280 468,561,888 416,773,469
2016
KWh Rate 0.0338$ 0.0461$ 0.0390$
KWh Production 369,917,280 468,561,888 431,570,160
Electricity Production
For the Years Ended June 30, 2015 and 2016
Kilowatt hours (KWh) and Rate per KWh
For purposes of the projections above, an electricity price of $0.0375 for 2014 was used and that amount was increased by 2% each year for fiscal years 2015 and 2016. These prices are more in line with the actual rates that CRRA has received in the 2013 fiscal year. Management has also projected a higher kWh production based upon anticipated increased boiler efficiency as a result of repairs that were just recently completed and that are currently being made. Since there is no recent data to support the increased efficiency perspective estimated by management over the actual amount generated in the prior year, for fiscal year 2014 a lower boiler efficiency rating was used and therefore a lower amount of kWh produced (394,578,000) This is more in line with the actual amount produced in fiscal year 2013. For fiscal years 2015 and 2016, CRRA-consultant projected kWh was used for the electricity revenue calculation, which includes the impact of the increased boiler efficiency. The variance between the electricity forecast and the fiscal year 2014 CRRA budget is $4,443,000. Forecasted revenue fiscal year 2014 per the forecast in this report is $16,336,000 compared to 2014 CRRA budgeted revenues of $20,780,000. The variance is due to the use of more conservative assumptions for both the wholesale electric rate and kWh production amounts.

Comprehensive Operational Review of CRRA October 30, 2013
The information contained herein is subject to the disclaimer presented on page 1 of this document.
Page 29
The projection is also based upon the assumption that the net change in operations before contributions to reserves from the property division will be used to supplement the Connecticut Solid Waste System budget. This does not take into account the available equity balance that may also be used to support the budget if necessary. The plant operator contract includes a project increase in payroll rates of at least 1% up to a maximum of 2.5%. An estimated 1.75% increase was included for the plant and Jets operating costs in this projection. For fiscal year 2013, it was noted that CRRA paid the operator approximately $28,879,000 to operate both plant and power block facilities. This is approximately $755,000 more than the management’s projected 2014 budget. Based upon the contract, there were provisions that addressed additional cost for the transition of the operations. Inquiry was made with management to confirm that there were amounts paid to the vendor transitional costs during fiscal year 2013, but confirmation was not received before the issuance of this report.
Background
Analysis of Authorities Financial Data
The nature of the Authority’s operations is complex due to the various divisions and the related activities and contracts of each of the divisions. Although the Authority presents one balance sheet and one income statement, it is the equivalent of a consolidation of multiple projects (funds) which are accounted for as if they were separate companies (funds). Each projects revenues, expenses, assets, liabilities and equity is accounted for separately. The Authority has also historically prepared budgets for each of the divisions. The June 30, 2013, audit report, pages 47-50 presents the financial statements (balance sheets and statement of changes in net position) for each of the Authority’s divisions as of June 30, 2013. Although the divisions generally have had similar purposes and objectives, each division has unique characteristics and life cycles. In addition to the different characteristics and life cycles of the four main divisions, the Authority also established additional divisions over the years to maintain separate accountability for certain activities or to provide separate accountability for closed projects/divisions. Because of the complexity of the Authority’s operations, the closing and disposition of certain projects/divisions, and the establishment of new divisions, comparison and analysis of the Authority’s balance sheets and income statements over the past seven-year period does not provide meaningful information. Significant analysis would need to be performed of each division’s stage of operations and any new divisions/activities of the Authority. The Authority’s balance sheets, income statements and adopted budgets for the past seven years were used to gain an understanding of the historical data that was relevant to evaluating the Authority’s 2014 budget and related assumptions and to develop the projections for fiscal year 2015 and 2016. As noted in the background for the projections, the Authority has had and expects significant changes in certain divisions. In those instances the balance sheets and income statements for the past seven years did not provide any perspective or useful information in developing the projections.
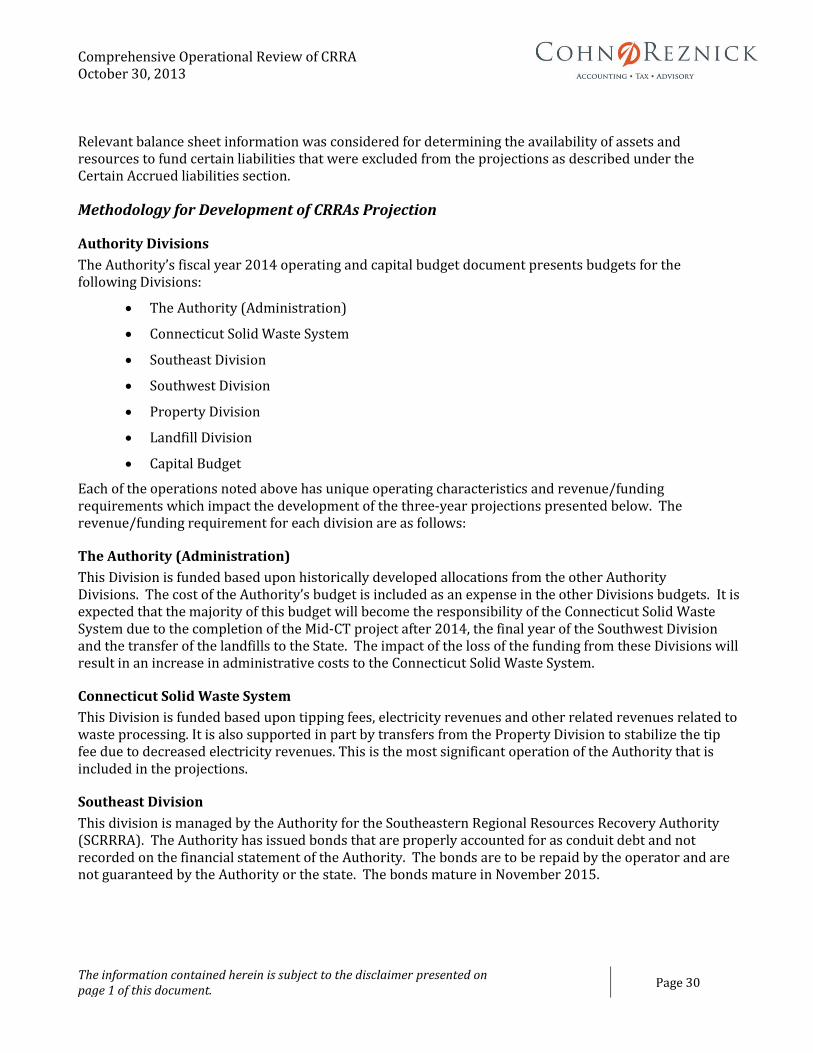
Comprehensive Operational Review of CRRA October 30, 2013
The information contained herein is subject to the disclaimer presented on page 1 of this document.
Page 30
Relevant balance sheet information was considered for determining the availability of assets and resources to fund certain liabilities that were excluded from the projections as described under the Certain Accrued liabilities section.
Methodology for Development of CRRAs Projection
Authority Divisions
The Authority’s fiscal year 2014 operating and capital budget document presents budgets for the following Divisions:
The Authority (Administration)
Connecticut Solid Waste System
Southeast Division
Southwest Division
Property Division
Landfill Division
Capital Budget
Each of the operations noted above has unique operating characteristics and revenue/funding requirements which impact the development of the three-year projections presented below. The revenue/funding requirement for each division are as follows:
The Authority (Administration)
This Division is funded based upon historically developed allocations from the other Authority Divisions. The cost of the Authority’s budget is included as an expense in the other Divisions budgets. It is expected that the majority of this budget will become the responsibility of the Connecticut Solid Waste System due to the completion of the Mid-CT project after 2014, the final year of the Southwest Division and the transfer of the landfills to the State. The impact of the loss of the funding from these Divisions will result in an increase in administrative costs to the Connecticut Solid Waste System.
Connecticut Solid Waste System
This Division is funded based upon tipping fees, electricity revenues and other related revenues related to waste processing. It is also supported in part by transfers from the Property Division to stabilize the tip fee due to decreased electricity revenues. This is the most significant operation of the Authority that is included in the projections.
Southeast Division
This division is managed by the Authority for the Southeastern Regional Resources Recovery Authority (SCRRRA). The Authority has issued bonds that are properly accounted for as conduit debt and not recorded on the financial statement of the Authority. The bonds are to be repaid by the operator and are not guaranteed by the Authority or the state. The bonds mature in November 2015.

Comprehensive Operational Review of CRRA October 30, 2013
The information contained herein is subject to the disclaimer presented on page 1 of this document.
Page 31
Due to the fact the Authority issued the bonds and the agreement signed with SCRRRA, the Authority manages the financial activity of this project by receiving the revenues and paying the contractor operating the plant. The Authority charges a fee for this activity of $225,000 and all other monies collected are due to SCRRRA. Therefore, for the purposes of the projections, the only amount that it is necessary to consider is the $225,000 that charged to this Division which supports the Authority (Administrative budget).
Southwest Division
This division’s operation is managed by the Authority for its member towns. The Authority contracts with Wheelabrator for disposal of MSW for these towns. For the administration, the Authority receives $2.21 per ton. For the 2014 budget this amount is estimated at $576,810. Therefore, for the purposes of the 2014 projections, the only amount that it is necessary to consider is the $576,810 that charged is to this Division which supports the Authority (Administrative budget). The Authority’s contract with the Southwest member towns for the administrative arrangement expires on June 30, 2014 and is not expected to be renewed. It is expected the Southwest member towns will contract directly with Wheelabrator for fiscal year 2015. Therefore, this operation is not projected to fiscal years 2015 and 2016.
Property Division
This division is used to account for the non-landfill assets of the Authority that are not part of another division. This division includes the jet engines and related electricity revenues, leased property revenue and the CRRA Trash Museum. This division also accumulated resources for board approved reserves such as for severance payment and development reserves. As noted above, the division also provides support to the Connecticut Solid Waste System budget. It also accumulates resources that are raised for capital replacement. The capital budget will be discussed in more detail in the below.
Landfill Division
This division is used to account for the assets and liabilities related to the Authority’s responsibilities for landfill closure and post closure costs liabilities. While the landfills were operating, the Authority accumulated resources that are necessary to pay for the closure and post closure liabilities. Therefore the projections below do not include any activity from this division since there are no additional resources required.
Recycling Division
This division ended as of June 30, 2013; therefore, it is not included in the projections.
Capital Budget
As is common practice for government entities, the Authority attempts to fund its capital replacement program with level contributions to the capital reserve from the operating budget. This allows the Authority to avoid year to year erratic increases and decreases in tipping fees and ensure that there are adequate assets available when capital replacement is necessary. Since the Authority has accumulated assets in prior years based upon this practice, for purposes of projections, the amount that will be included in the projection for capital replacement will be the amount estimated by the Authority as a contribution to the capital replacement reserve and not the amount expected to be expended.

Comprehensive Operational Review of CRRA October 30, 2013
The information contained herein is subject to the disclaimer presented on page 1 of this document.
Page 32
Certain Accrued Liabilities
For certain accrued liabilities related to the Mid-CT project, resources have been accumulated by the operations of that project and therefore are excluded from the projections. The most significant accrued liabilities that are excludes are as follow:
Hartford landfill closure cost $11,919,000
Contract termination charge $2,916,000
Mid-CT end of project transition costs $3,500,000
Other costs that have been accrued related to the Mid-CT project are included on Exhibit 4A in Task III section
Nonrecurring Expenses
The costs of the completion of this project and the Authority’s self-assessment under State Statute 13-285 are nonrecurring and included in the projection as additions to the Authority’s 2014 budget. It is possible that the Authority will be able to absorb a portion of these costs in the 2014 operations. For purposes of these projections, these related costs are shown after the results of operations.
Reserves
In the Authority’s 2014 adopted budget, there are line items that are included to fund certain reserves that may have been approved by the Board. These amounts do not represent third party disbursements, but rather the accumulation of assets by the Authority for future use. The accumulation of assets for future contingencies or projects is common and useful budget strategy. For purposes of this projection, these items have been segregated and are shown separately since these items are discretionary and are not actual disbursements.

Comprehensive Operational Review of CRRA October 30, 2013
The information contained herein is subject to the disclaimer presented on page 1 of this document.
Page 33
Projected Cash Flows
The two significant variances between the CRRA 2014 budget and the 2014 forecast are the assumptions used in electricity revenue and the inclusion of non-recurring consulting expenses. The electricity revenue is forecasted lower than the CRRA budget due to two factors: 1) CRRA management has completed repairs to the boilers but has not demonstrated any increases in efficiency; and 2) the non-recurring consulting expenses relate to fees to complete the reports required by the Public Act by the outside consultants and CRRA internal self-assessment.
CRRA FY 2014
Forecast FY 2014 FY 2015 FY 2016
Revenues
Service Charges Solid Waste - Participating Town 23,686,000$ 23,700,000$ 24,082,000$ 24,437,000$
Service Charges Solid Waste - Contracts 9,570,000 9,537,500 9,537,500 9,537,500
Service Charges Solid Waste - Hauler 3,720,000 3,716,000 3,776,000 3,832,000
Service Charges Solid Waste - Spot 3,635,000 3,635,000 3,635,000 3,635,000
Metal Sales 1,725,000 1,725,000 1,725,000 1,725,000
Municipal Bulky Waste & Mattresses/Box Spring 179,000 179,000 183,500 183,500
Recycling Facility 1,287,000 1,287,000 1,287,000 1,287,000
Electricity 20,780,000 16,336,691 17,481,585 18,377,710
Interest Income 10,000 10,000 10,000 10,000
Transfer From Southwest Division 576,810 576,810 - -
Transfer From Southeast Division 225,000 225,000 231,750 238,703
Transfer From Property Division 2,218,000 2,416,500 2,916,144 2,323,133
Total Revenues 67,611,810$ 63,344,501$ 64,865,479$ 65,586,546$
Expenses
Administrative Expenses 2,827,000$ 2,827,000$ 3,495,820$ 3,699,416$
Operational Expenses 3,808,000 3,808,000 3,882,960 3,959,419
Assessment, Fees, Subsides, & Pilots 3,358,000 3,303,104 3,357,504 3,393,770
Waste Transport 14,486,000 14,486,000 14,775,720 15,071,234
Waste Processing 12,145,000 12,144,900 12,354,638 13,665,572
Power Block Facility 17,361,000 17,361,000 17,643,433 17,930,808
Facility Contractor Transfer Stations 1,167,000 1,167,000 1,181,665 1,196,587
Transfer Stations 1,691,000 1,667,800 1,667,800 1,667,800
Recycling Center 1,287,000 1,287,250 1,287,250 1,287,250
Total Expenditures 58,130,000 58,052,054 59,646,789 61,871,856
Net Operations before contributions to reserves and nonrecurring
expenses 9,481,810 5,292,447 5,218,691 3,714,690
Less Contributions to Reserves/Nonrecurring Expenses
Contribution to Capital Expenditure Reserve 5,909,000 5,909,000 13,000,000 12,000,000
Non-Recurring Expenses - 900,000 - -
Other contributions to Reserves 2,795,500 2,795,000 1,407,500 1,277,500
Net Cash Generated - After Reserve Contributions and
Nonrecurring Expenses 777,310$ (4,311,553)$ (9,188,809)$ (9,562,810)$
Connecticut Resources Recovery Authority
Revenue and Expense Summary For the Fiscal Years 2014-2016
Forecasted Operating Budget

Comprehensive Operational Review of CRRA October 30, 2013
The information contained herein is subject to the disclaimer presented on page 1 of this document.
Page 34
Additionally the following schedules were developed to support the above three year budget projections. See Appendix B for the following supporting schedules.
Revenues
The revenue sections below represent the various forms of revenue that CRRA receives. The majority of revenue comes from contract waste collection or electricity sales from waste.
Summary of Revenue from Refuse Collection and Recycle Sales
Service Charges – Solid Waste $40,500,000
Metal Sales $1,700,000
Municipal Bulky Waste $180,000
Recycling Facility $1,300,000
Service Charges Solid Waste
Actual tonnage that is projected to be collected is part of various service contracts with participating towns and waste haulers throughout the State of Connecticut. Revenue from service charges solid waste is dependent upon tipping fees. The tipping fee is the cost charges per ton of waste collected. Tipping fees are adjusted up or down to generate enough revenues to cover all necessary expenditures. Revenue for year ended June 30, 2013 was approximately $45,000,000. For the forecast period, tipping fees will need to average $62 per ton, which translates to revenue of $42,500,000 to cover expenses. This will need to be increased if electricity prices do not meet expectations (See Electricity Revenue below).
Metal Sales
The historic rate of inbound metal scrap is 3% of the total tonnage of waste collected. It is Management’s best estimate that metal scrap will be the same throughout the forecast period. The fees generated are based on contracts in place. Metal sales are forecasted to approximately $1,700,000.
Bulky Waste
The historic total tonnage of bulky waste collected is 2,300 tons. It is Management’s estimate guess that bulky waste will be the same throughout the forecast period. The fees generated are based on contracts in place.
Recycling Center
The recycle center revenue is forecasted to decrease by $600,000 from $1,900,000 to $1,300,000. The participating towns that use the recycling center have decreased from 70 to 51 towns. The related estimated tonnage decreased from 75,800 to 41,500 tons with approximately $5.50 estimated increase in the average sales price. The $1,300,000 amount was used for the forecast period.
Electricity Revenue
The kWh sold during the forecast period was verified through analysis. The boilers can process 710,000 tons of waste per year. CRRA’s efficiency rating is estimated to be 84.50%, improving from last year, and should reach 87.50% by the end of the forecast period. The increased efficiency could not be verified by

Comprehensive Operational Review of CRRA October 30, 2013
The information contained herein is subject to the disclaimer presented on page 1 of this document.
Page 35
comparing prior year’s efficiency reports to the current year through 9/30/2013. Looking at historical production records, it was found that production over the last five years was relatively consistent. Using these figures, it is estimated that fiscal year 2014 could generate 395,000,000 kWh with an increase to 416,000,000 kWh by 2015. The biggest variable with the electricity revenue is the cost per kWh. CRRA’s consultant report presents a wide range of possible prices and uses a median value of $0.0461 per kWh. An analysis of energy prices found that electricity prices in the coming year would be $0.0375 per kWh. For purposes of the forecast, this figure was used because it’s more in line with historical rates; for year ended 2013 the average rate for CRRA was $0.0338. For years ending 2014 and 2015, it was assumed that wholesale electricity prices would increase by 2% per year. It should be noted that the cost of electricity is market driven and very unpredictable.
Expenses
The expense sections below represent the various operational and administrative expenses that CRRA has.
Administrative Expenses
Through discussion with management, the analysis concluded that payroll would increase by 3% per year during the forecast period. Management said that six full-time positions will be cut fiscal year 2015. Three will be positions that are not filled and three will be as a result of the transfer of the responsibility for the landfill operations to the State.
Operating Expenses
The operating expenses budget seems reasonable. The insurance premiums are based on insurance contracts, and the legal expense is based on conversations with the legal department. It is believed that a 3% annual growth rate for operating expenses is reasonable.
Assessment, Fees, Subsidies, and PILOTs
The current PILOT program with the City of Hartford expired during fiscal year 2013. CRRA has budgeted $2,200,000 fiscal year 2014 and, per discussions with management, estimates the agreement will be finalized during fiscal year 2014 for approximately the budgeted amount. This is not expected to change during the forecast period. The solid waste assessment is $1.50 per RDF to the CT DEEP. The fee is directly tied to the RDF produced (see Schedule 7).
Waste Transport
Waste transport expenses are based on contracts already in place. The forecast was based on the current contracts in place.

Comprehensive Operational Review of CRRA October 30, 2013
The information contained herein is subject to the disclaimer presented on page 1 of this document.
Page 36
Waste Processing
The operating and maintenance expenses paid to NAES Corporation are based on a service contract in place during the entire forecast period. For the purposes of the analysis, the amounts estimated based upon the contract were used and increased 1.75% per year.
Power Block Facility
The operating and maintenance expenses paid to NAES Corporation are based on a service contract in place during the entire forecast period. For the purposes of the analysis, the amounts estimated based upon the contract were used and increased 1.75% per year.
Facility Contractor Transfer Stations
The management fee expenses paid to NAES Corporation are based on a service contract in place during the entire forecast period. For the purposes of the analysis, the amounts estimated based upon the contract were used and increased 1.75% per year.
Transfer Stations
Contract operating charges are based on the contract agreements with Copes Rubbish Removal (City of Torrington) and CWPM (City of Essex; City of Watertown). These agreements are in place for the duration of the forecast period.
Recycling Facility
The recycling facility budget is offset by recycling revenues. The current contract has been terminated and the expected resultant contract will be provide net revenues equal to the amount budgeted.

Comprehensive Operational Review of CRRA October 30, 2013
The information contained herein is subject to the disclaimer presented on page 1 of this document.
Page 37
Task III A review and analysis of CRRA’s short and long-term liabilities, including, but not limited to, such liabilities to bond holders, employees, former employees, environmental liabilities, and such liabilities from lawsuits, leases, contractual obligations and any other matter (Exhibit A #3), including, but not limited to, the following:
a) An accounting of all leases or mortgages for real property.
b) An accounting of all contracts to which the CRRA is a party, including, but not limited to, any and all contracts for waste disposal, energy generation, and any and all goods and/or service contracts (including contracts for services on retainer).
c) A review of all current or threatened civil or criminal actions involving CRRA, including any such actions resolved in the past 7 years.
d) A review of all current or potential environmental liabilities, including, but not limited to, current or potential liability under the Comprehensive Environmental Response, Compensation, and Liability Act, the Resource Conservation and Recovery Act, the Clean Air Act, or the Clean Water Act.
Activities Performed See individual sections for activities performed.
Findings Based upon the reviews performed, the most significant items that were noted are as follows:
Landfill Closure and Post-Closure Liabilities
The total estimated landfill closure and post-closure liabilities as of June 30, 2013, totaled $49,276,042 ($11,919,000 for closure costs for the Hartford landfill and $37,357,072 for the post closure monitoring of all five landfills including Hartford). See exhibits 5A and 5B. The Authority has executed a contract for the closure of the Hartford landfill for $11,600,000, which is expected to be completed by January 1, 2014. The total assets available for the closure and post closure costs total $54,208,000 ($11,919,000 in the Mid CT Division and $42,289,000 in the Landfill Division), net of non-landfill closure and post closure related liabilities. Of the $42,289,000 of assets available in the Landfill Division, $7,881,000 was loaned to the Connecticut Solid Waste System Division and therefore only $34,408,000 is available in the form of cash and investments as of June 30, 2013.

Comprehensive Operational Review of CRRA October 30, 2013
The information contained herein is subject to the disclaimer presented on page 1 of this document.
Page 38
Mid CT Project Completion
For accounting purposes, the Mid-CT project was completed when the bonds were paid off in November 2012. The completion of the project requires a final accounting of all project related costs before there can be any consideration/calculation of the amounts that should be returned to the member towns. Therefore, the Authority has recorded estimates (accrued liabilities) for the costs that will be incurred to finalize the project. After recording the estimated amounts that will be necessary to close the project, the project reflects an equity balance of $18,847,000 at June 30, 2013. Past practice has been that this amount will be returned to the member towns once the final amounts related to the project have been determined and paid and the distributions is approved by the Authority Board. It should be noted that the amount may change as a result of the actual costs to for the final closing of the project. Based upon the past practice, the equity balance can be characterized as a liability at June 30, 2013.
Southeast Project Equity
Based upon discussions with the Authority, it appears that the Authority is functioning as an agent for the Southeastern Regional Resources Recovery Authority (SCRRRA). As an agent and not owner of the project, the only amount that the Authority is entitled to from this division is the $225,000 administrative fee that the Authority charges the project (SCRRRA) to perform the budgeting, accounting and other administrative functions as defined by the contract. Based upon that understanding, any monies that have been generated by the activities of this project would be owed to SCRRRA. Currently, the project from inception until June 30, 2103 has generated revenues in excess of expenses of $9,049,000. Therefore, the amount that was reported as an unrestricted net position could be classified as a liability being due to SCRRRA.
Contingencies
Based upon review of the Authority’s currently known legal claims, the most significant claims against the Authority are as follows:
Employment benefits and other costs that MDC may incur due to the expiration of its contract for operations of a portion of the former Mid-CT project.
MDC has also included in its invoices to the Authority amounts for certain legal and consulting fees. The Authority has disputed these charges based upon the grounds that they are not related to the operations as per the MDC and Authority agreement.
Insurance carrier claim by American International Specialty Lines Insurance Company (AISLIC) attempting to recoup the claim paid under the Authority’s policy for claims from numerous commercial and residential neighbors of the Hartford Landfill that the Authority negligently maintained and operated the landfill, which created a public nuisance.

Comprehensive Operational Review of CRRA October 30, 2013
The information contained herein is subject to the disclaimer presented on page 1 of this document.
Page 39
Background
Owned and Leased Real Property
During this review, the following procedures were performed:
Obtained from the Authority a listing of all owned and leased real property
For leased property, the lease agreements were reviewed to determine the annual rent and lease expiration date. The lease payment amounts were then agreed to the June 30, 2013, audit report.
For property owned, the property was agreed to the Authority’s capital asset listing and agreed the total cost amount to the June 30, 2013, audit report.
Please refer to the following exhibits, which are provided at the end of this section:
Exhibit 1 – Schedule of Leased Property
Exhibit 2 – Schedule of Authority Owned Property and Related Historical Cost (Book Value)
As a result of the procedures performed, the following was noted:
All of the properties from the listing provided by the Authority to the Authority’s capital asset records (accounting records) were reconciled except for the following properties:
o Ellington landfill - 58 acres former - Thompson Family Land Trust property
o Ellington landfill – 1.3 acres - former Charette property
o Ellington landfill – 5.3 acres – former B&L Development Corp property
o At the time of this report, the Authority was still researching these properties.
Contracts to Which the CRRA Is a Party
During this review, the following procedures were performed:
Obtained from the Authority a listing of all active contracts.
Reviewed the list against other information obtained from other reports and analysis performed in Task VII.
Please refer to the following exhibits, which are provided at the end of this section:
Exhibit 3A – Schedule of Authority Contracts
Exhibit 3B – Schedule of Connecticut Solid Waste Systems Municipal Contracts
As a result of the procedures performed, the following were noted:
Based upon the procedures performed above, no changes to the list provided by the Authority were noted.
It should be noted that list maintained by the Authority is based upon the named vendor in the signed agreement, therefore vendor names listed may not agree to the vendor current name.

Comprehensive Operational Review of CRRA October 30, 2013
The information contained herein is subject to the disclaimer presented on page 1 of this document.
Page 40
Civil or Criminal Actions Involving CRRA
A review was performed of the legal letters prepared at the request of the Authority’s auditor for the fiscal year 2012 and the fiscal year 2013 audits. The legal letters discuss both ongoing claims and claims that have been resolved during the fiscal year. The legal letters for fiscal year 2007 through 2011 were requested and ultimately not received before the issuance of this report. Based upon the review of the legal letters, the significant claims/contingencies are as follows:
MDC arbitration claim for $47,000,000 for certain post-employment benefits and other costs that MDC may incur due to the expiration of its contract for operations of a portion of the former Mid-CT project.
The Authority has sent letters to the Mid CT project towns advising them that if there are any amounts due to MDC based upon this claim, that each member town will be responsible for its prorated share of the costs.
MDC has also included in its invoices to the Authority amount for certain legal and consulting fees. The Authority has disputed these charges based upon the grounds that are not related to the operations based upon the MDC and Authority agreement.
Insurance carrier claim by American International Specialty Lines Insurance Company (AISLIC) attempting to recoup the claim paid under the Authority’s policy for claims from numerous commercial and residential neighbors of the Hartford Landfill that the Authority negligently maintained and operated the landfill creating a public nuisance.
Tremont Public Advisors filed a claim against the Authority alleging that the Authority illegally awarded a contract and is seeking damages. The Authority ultimately did not award the contract and therefore does not believe there is any merit to the claim.
The Authority was previously named as a potentially responsible party related to trash disposed in a New Jersey landfill from the Bridgeport project. The Authority’s was previously removed from the suit as part of a mediated settlement. One of the settling parties is pursuing a contribution action against non-settling entities to contribute to the settlement. The case is still pending.
Based upon the preliminary or uncertain nature of these claims, no estimate of potential exposure can be made. Certain amounts are recorded as noted below in the “Claims Payable” section have been recorded for insurance deductibles related to defense costs for certain pending claims.
Pages 43-44 of the June 30, 2013, audit report has additional details related to these claims
Current or Potential Environmental Liabilities
During this review, the following procedures were performed:
Reviewed legal letters that were prepared at the request of the Authority’s auditor for the fiscal year 2012 and fiscal year 2013 audits.
Conducted discussions with the Authority personnel regarding their evaluation of potential pollution and other remediation related liabilities.

Comprehensive Operational Review of CRRA October 30, 2013
The information contained herein is subject to the disclaimer presented on page 1 of this document.
Page 41
Reviewed the latest available monitoring reports for each of the five landfills.
Conducted discussions with certain CT DEEP employees regarding any known issues with each landfill.
Reviewed the open and closed enforcement actions report activity for the past five years provided by CT DEEP. There were two air enforcement actions, one hazardous waste enforcement action and one solid waste enforcement action listed. All enforcement actions had been closed.
Reviewed the Authority slides regarding the remediation of the South Meadows exit strategy contract. The contract’s purpose was to transfer the risk for all environmental remediation liability from CRRA to TRC. The contract was funded and secured by an insurance policy from AIG.
Based upon the review of documents noted above and discussions with Authority and DEEP personnel, other than the South Meadows remediation, no information indicated that there is any currently known environmental/pollution related liabilities. As noted above, the risk has been transferred via an insurance policy from CRRA to TRC. The insurance policy covers up to $60,000,000 for cleanup of pre-existing pollution at the site.
Short and Long-Term Liabilities
Overview
The liabilities reported in the financial statements of the Authority are comprised of many different types of balances and transactions. Based upon industry knowledge and experience, certain liability amounts were selected to review supporting documentation as was determined necessary to obtain an understanding of the amounts reported. The procedures performed were not at the level necessary to issue an opinion on the liability balances. During this review, the following procedures were performed:
Reviewed the Authority’s general ledger and agreed the liability amounts to the amounts reported in the June 30, 2013 audit.
Prepared a schedule based upon the general ledger detailing the types of liabilities reported in the June 30, 2013 audit.
Reviewed the June 30, 2012, and June 30, 2013, audit report supporting documentation as necessary.
Interviewed CRRA staff as necessary to obtain any additional information or background on the nature and purpose of the liability account balances, as necessary.
Based upon the nature of each liability presented on Exhibit 4A – Schedule of Liabilities, certain procedures were performed as considered necessary on each account to obtain an understanding of the nature of the account balance. If available, supporting documentation for certain liability balances was also reviewed. Testing of the supporting documentation provided was not performed.
Please refer to the following exhibits, which are provided at the end of this section:

Comprehensive Operational Review of CRRA October 30, 2013
The information contained herein is subject to the disclaimer presented on page 1 of this document.
Page 42
Exhibit 4A – Schedule of Liabilities as of June 30, 2013
Exhibit 4B – Schedule of Liabilities – Adjusted as of June 30, 2013
Please see below for the specific procedures, procedures performed and documents review for each liability account balance detailed on Exhibit 4A.
Accounts Payable
Accounts Payable – Trade $4,481,162 This account balance represents routine vendor accounts payable amounts as of June 30, 2013.
Account Payable – Contract / Operations
$7,986,729 This account balance represents amounts due to vendors or member towns based upon active contracts.
During this review, the following procedures were performed:
Reviewed the detailed listing of accounts payable and agreed the total amounts to the general ledger and June 30, 2013, audit report.
Reviewed the supporting calculations for amounts due to vendors based on contracts.
Reviewed other amounts due to vendors and contractors including certain amounts that are disputed by the Authority or are waiting for requested documentation.
Based upon the procedures performed above, the accounts payable amounts were properly supported by detailed listings (trade) or supporting schedules and other documentation (contract/operations). No detailed testing was performed of the amounts on the detailed listings or schedules.
Due to Other Funds
Due to Other Funds $9,965,275
This account balance represents interfund fund payables amounts. These amounts are offset by interfund receivable amounts and therefore have no financial impact on the Authority. These amounts are eliminated for reporting purposes in the financial statements presented on pages 47 and 48 of the June 30, 2013, audit report.
During this review, the following procedures were performed:
Since the due to other funds amounts are offset by due from other funds, resulting in no financial impact on the Authority, no further review was performed
As a result of the procedures performed, it was noted that the due to other funds account is an intercompany payable account offset by a due from other funds (receivable amount). These amounts net to $0 and therefore have no impact on the financial condition of the Authority. The due to and due from account are eliminated for financial reporting purposes as presented on pages 47 and 48 of the June 30, 2013, audit report.

Comprehensive Operational Review of CRRA October 30, 2013
The information contained herein is subject to the disclaimer presented on page 1 of this document.
Page 43
Accrued Expenses – Professional Fees
Accrued Expenses – Professional Fees
$604,305
This account balance represents estimated professional fees that have been incurred or are applicable to the period ended June 30, 2013. They include the June 30, 2013 audit fee, engineering fees and estimates for incurred but unbilled legal fees.
During this review, the following procedures were performed:
Agreed the total amounts to the general ledger and June 30, 2013 audit
Reviewed the supporting schedule totaling the amount recorded.
Reviewed supporting documentation for the accrued legal fees for the Mid CT project.
As a result of the procedures performed, it was noted that accrued expenses are recorded when an organization is aware that goods or services have been received, but the vendor has not submitted an invoice for payment. This allows an organization to record the expense in the proper period in accordance with Generally Accepted Accounting Principles. Since an invoice was not provided to the Authority, it is common practice to estimate the amount of the expense in order to complete the financial statement in a timely manner and adjust any differences in the subsequent period.
Based upon a review of the supporting schedule for the accrued professional fees, they appear to be reasonable and for expected types of services.
Based upon the review of the vendor invoices, it was noted that of the total of $98,875 accrued, $37,479 was paid. The balance of $61,396 will be reversed in fiscal year 2014.
The review was only performed for the supporting documentation of legal invoices as noted above.
Recycling Rebates Due to Towns
Recycling Rebates Due to Member Towns
$654,691
This account balance represents amount due to member towns for their contractual share of the recycling revenues collected by the Authority. Towns are provided a rebate of $10 per ton of recyclables delivered.
During this review, the following procedures were performed:
For the Mid-CT project, a review was performed of the report that listed by town the amount of recycling tons delivered by town. The estimate is based upon the number of tons that were accepted across the scale multiplied by $10 per ton. A recalculation was performed of the estimated total rebate amount payable.
Based upon the procedure performed above, it was noted that the amount accrued for the Mid-CT rebate was adequately supported.

Comprehensive Operational Review of CRRA October 30, 2013
The information contained herein is subject to the disclaimer presented on page 1 of this document.
Page 44
Accrued Payroll and Related Payroll Tax Liabilities
Accrued Payroll and Related Payroll Tax Liabilities
$74,153 This account balance represents the amount of earned salaries and benefits as of June 30, 2013 that were not paid until July 2013 and the related payroll tax liability withholding.
A review of the supporting calculation for this amount was performed. Since this type of accrual is normal and customary and in accordance with Generally Accepted Accounting Principles, detailed testing of this amount was not performed. Only a review of the supporting calculation was performed.
Accrued Sick and Vacation Pay
Accrued Sick and Vacation Pay
$327,950
This account balance represents the balance of accrued sick and vacation time and related payroll taxes and benefits due to employees as June 30, 2013. The Authority uses a calendar year to account for sick and vacation time benefits.
A review was performed of the detailed listing by employee calculation for sick and vacation time and agreed the amount to the general ledger.
Since this type of accrual is normal and customary and in accordance with Generally Accepted Accounting Principles, detailed testing of this amount was not performed. The review consisted only of review of the supporting calculation.
Customer Advance Payments
Customer Advance Payments $1,679,897
This account balance represents amounts that have been received by the Authority by vendors in excess of the amount due. The payments were not requested by the Authority. As amounts that become due from these customers, the balance is reduced on a monthly basis.
During this review, the following procedures were performed:
Reviewed the audit work papers supporting schedule for the advance payment amounts
Reviewed the customer accounts receivable summary reports and agreed the overpayment balance to the general ledger.
Based upon the procedures performed above, it was noted that the customer advance payments were properly recorded as based upon review of the customer account receivable reports. This balance is substantially due to a single customer with an advance payment balance of $1,626,642. Two other customers account for the remaining balance.

Comprehensive Operational Review of CRRA October 30, 2013
The information contained herein is subject to the disclaimer presented on page 1 of this document.
Page 45
Unearned Revenue
Unearned Revenue $425,000 This account balance represents an amount received by the Authority, but not earned as of June 30, 2013.
A review was performed of the supporting documentation for the unearned amount. The amount was agreed to the general ledger and supporting audit schedules. Based upon the review of the supporting documentation, the amount is properly recorded as unearned revenue. If and when the earning process is completed, the amount would either be returned to the payer or recorded as revenue.
Customer Guarantee Payment Deposits
Customer Guarantee Payment Deposits
$357,075
This account balance represents amounts required by the Authority policies and procedures from customers to ensure payment of amounts billed. Customers can also meet this requirement by providing the Authority a performance bond. This account balance represents amounts paid by customers via a cash (check) deposit in accordance with the Authority requirements.
A review was performed of the detailed customer listing supporting the account balance at June 30, 2013. Based upon the procedures performed above, it was noted that the customer guarantee payment deposits were properly recorded as reflected in the customer account receivable reports.
Montville Landfill Closure and Post-Closure Escrow (Southeast Project)
Montville Landfill Closure and Post-Closure Escrow (Southeast Project)
$828,644
This account balance represents the balance of amounts that were provided to the Authority from Southeast Connecticut Regional Resource Recovery Authority (SCRRRA) in fiscal year 1997 and 1998 as a result of agreements entered into between SCRRRA and private entities. These amounts are held in escrow by the Authority on behalf of SCRRRA for closure and post closure costs for the Montville landfill. The Authority does not own and is not responsible for the closure and post closure obligations of the Montville landfill. SCRRRA submit invoices to the Authority for payment of closure and post closure related costs from this escrow amount.
During this review, the following procedures were performed:
Reviewed the June 30, 1997 and 1998 audits that disclosed that settlement income amounts were received by the Authority from SCRRRA from agreements entered into with private

Comprehensive Operational Review of CRRA October 30, 2013
The information contained herein is subject to the disclaimer presented on page 1 of this document.
Page 46
entities totaling $3,210,000 for the purpose of holding these funds in escrow for the benefit of SCRRRA.
Reviewed the June 30, 2003 audit report where the amount was re-classed from equity to a liability account.
Inquired about the existence of a formal written agreement with respect to this amount but it does not appear that there was any separate agreement for these monies.
As a result of the procedures performed, it was noted that this amount represents the unspent balance of the funds which the Authority has held on behalf of SCRRRA to be used for closure and post closure cost related to the Montville landfill. Based upon discussion with the Authority, it was noted that SCRRRA will be requesting the return of these monies at July 1, 2014.
Landfill Closure and Post-Closure Liability
Landfill Closure and Post-Closure Liability
$49,276,042 This account balance represents the estimated cost amount for closure and post closure responsibilities of the Authority.
During this review, the following procedures were performed:
Reviewed the Authority’s annual Landfill Closure and Post-Closure Care Evaluation Report for GASB 18 Costs – Status as of June 30, 2012 and 2013.
Conducted interviews with the Authority employee who is primarily responsible to prepare the Evaluation report, to obtain an understanding of the methodology used to prepare the estimates and the anticipated nonrecurring items (construction) included in the estimate.
Compared the actual costs for the prior years with the amount reported in the draft June 30, 2013 audit report. For any significant differences, explanations for the variances were requested.
Compared the actual 2013 expense amount to the prior year current liability (the amount expected to be spent with the next year).
Please refer to the following exhibits, which are provided at the end of this section:
Exhibit 5A – Schedule of Closure and Post Closure Care of Landfills by Location
Exhibit 5B – Comparison of Closure and Post Closure Care of Landfill Liabilities to Asset Available
Based upon the review of the GASB 18 report and discussion, the following were noted:
The actual costs that are reported in the GASB 18 report are for the period June 1 through May 31 instead of July 1 through June 30. This is period is used to ensure that there is adequate time to prepare the estimate to complete the annual audit. Therefore the cost paid as reported in the audit (July 1 through June 30) may not agree to status report.
Based upon the review, the differences noted were not significant considering the different reporting periods.

Comprehensive Operational Review of CRRA October 30, 2013
The information contained herein is subject to the disclaimer presented on page 1 of this document.
Page 47
Estimates for large one-time items such as construction or certain maintenance items are often planned for a certain fiscal year. If that item is not completed during that period, the estimate is moved to the next period.
This accounts for the majority of variances between what was recorded as a current liability versus what was actually spent during a particular fiscal year.
The majority of the categories of expenses related to the post closure monitoring were consistent with the prior year’s costs. For the insurance and electricity cost expense amounts, it was noted that the projected cost was more than the actual costs for the past two years by about 50%. For the electricity expense line, the estimate was not adjusted to address the recent decrease electric rates. Since electricity rates are not predictable, the projection to return to previously levels is reasonable.
Insurance estimates also have not been adjusted down to reflect the recent actual costs. For both the electricity and insurance expense estimates, the difference totaled approximately $100,000 per year and is not significant to the total estimate.
Ground maintenance also has showed some reasonable variances in both directions as would be expected for this type of account.
Shelton future use monies are recorded as part of the Shelton landfill post closure liability to be completed in fiscal year 2015. This is also recorded as part of restricted net position as shown in the June 30, 2013, audit report as part of the $701,000 restricted net position for Shelton future use. The amount recorded as a liability should reduce the restricted net position by the $530,000 and increase the unrestricted net position by the same amount. See Exhibit 5B.
Contract Termination Payment
Contract Termination Payment
$2,916,000
This account balance represents the contractual amount due to a recycling operator because the Authority exercised its option to terminate the contract before an agreed upon date. The contract is being terminated since the Authority cannot meet the minimum commitments agreed upon in the contract and therefore would incur costs greater than if the contract was terminated. The Authority put the contract out to bid and is in the process of negotiating a new contract for the recycling operation with the selected vendor (current vendor).
A review was performed of the contract termination payment schedule and agreed the amount recorded to the schedule and the general ledger. Based upon the review performed, it was noted that the contract termination payment is properly recorded as a liability at June 30, 2013.

Comprehensive Operational Review of CRRA October 30, 2013
The information contained herein is subject to the disclaimer presented on page 1 of this document.
Page 48
Claims Payable
Claims Payable $200,000 This account balance represents the amount that is accrued for the estimated deductibles for claims covered by insurance.
A review was performed of deductibles recorded and agreed to current claims reported in the legal representation letters obtained for the June 30, 2013, audit report by the independent auditors. Based upon the review performed, it was noted that these amounts were for actual claims being defended. A review of the related insurance policies to verify the deductible amount was not performed.
Coal Pond Cleaning
Accrued Maintenance Expense – Coal Pond Cleaning
$350,000 This account balance represents the amount that is accrued for the cleaning of the former Mid-CT coal pond.
A review was performed of the vendor estimate for the cleaning/maintenance of the coal pond. Based upon the review performed, it was noted that the amount recorded for this expense is supported by the vendor estimate.
Mid-Connecticut Administrative and Salaries – Closeout
Mid-Connecticut Administrative and Salaries – Closeout
$417,520
This account balance represents the Authority’s estimate of the amount of administrative costs and related salaries that will be required to close out the project. Based upon past experience, the Authority estimates that it will take approximately two years before the project can be closed.
This amount is an Authority estimate for which there is no supporting calculation. Therefore, no procedures were performed with respect to this amount. Any amounts not needed for the close out of the project should be returned to the member towns.
Accrued Mid-Connecticut Project Closeout Estimated Cost
Accrued Mid-Connecticut Project Closeout Estimated Cost
$3,500,000 This account balance represents the Authority’s estimate of the contingency amount for the costs that are expected to be incurred to affect the final close out of the Mid- Connecticut project.
This amount is an Authority estimate and there was no supporting calculation for this amount. Therefore, no procedures were performed with respect to this amount.
Any amounts not necessary for the close out of the project should be returned to the member towns in accordance with the municipal service agreements.
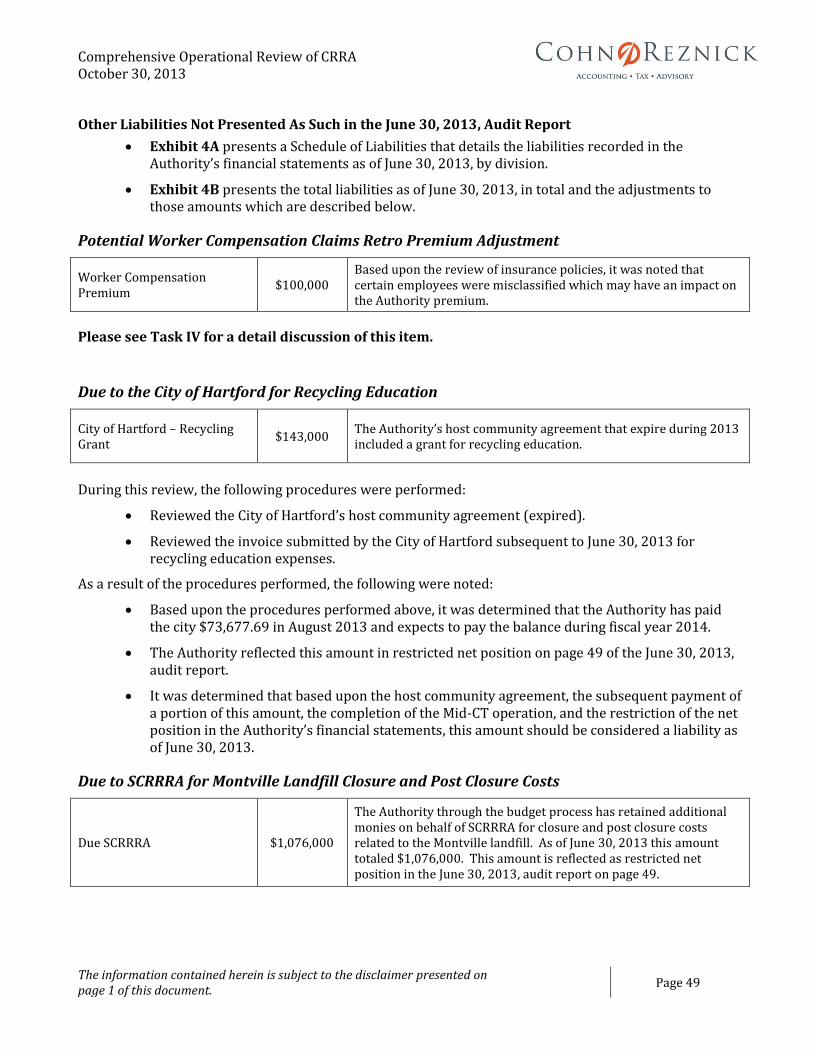
Comprehensive Operational Review of CRRA October 30, 2013
The information contained herein is subject to the disclaimer presented on page 1 of this document.
Page 49
Other Liabilities Not Presented As Such in the June 30, 2013, Audit Report
Exhibit 4A presents a Schedule of Liabilities that details the liabilities recorded in the Authority’s financial statements as of June 30, 2013, by division.
Exhibit 4B presents the total liabilities as of June 30, 2013, in total and the adjustments to those amounts which are described below.
Potential Worker Compensation Claims Retro Premium Adjustment
Worker Compensation Premium
$100,000 Based upon the review of insurance policies, it was noted that certain employees were misclassified which may have an impact on the Authority premium.
Please see Task IV for a detail discussion of this item.
Due to the City of Hartford for Recycling Education
City of Hartford – Recycling Grant
$143,000 The Authority’s host community agreement that expire during 2013 included a grant for recycling education.
During this review, the following procedures were performed:
Reviewed the City of Hartford’s host community agreement (expired).
Reviewed the invoice submitted by the City of Hartford subsequent to June 30, 2013 for recycling education expenses.
As a result of the procedures performed, the following were noted:
Based upon the procedures performed above, it was determined that the Authority has paid the city $73,677.69 in August 2013 and expects to pay the balance during fiscal year 2014.
The Authority reflected this amount in restricted net position on page 49 of the June 30, 2013, audit report.
It was determined that based upon the host community agreement, the subsequent payment of a portion of this amount, the completion of the Mid-CT operation, and the restriction of the net position in the Authority’s financial statements, this amount should be considered a liability as of June 30, 2013.
Due to SCRRRA for Montville Landfill Closure and Post Closure Costs
Due SCRRRA $1,076,000
The Authority through the budget process has retained additional monies on behalf of SCRRRA for closure and post closure costs related to the Montville landfill. As of June 30, 2013 this amount totaled $1,076,000. This amount is reflected as restricted net position in the June 30, 2013, audit report on page 49.

Comprehensive Operational Review of CRRA October 30, 2013
The information contained herein is subject to the disclaimer presented on page 1 of this document.
Page 50
During this review, the following procedures were performed:
Discussed the nature and purpose of this amount with the Authority.
Reviewed the 2009, 2010, 2011, 2011, 2012, 2013 and 2014 budgets and noted the amount included in each budget for additional amounts for the Montville landfill closure and post closure costs.
Reviewed the June 30, 2013 audit.
As a result of the procedures performed, the following were noted:
It was noted that approximately $350,000 has been budgeted annually since 2009 for Montville landfill post closure costs. It would appear that these monies belong to SCRRRA to be used for the closure and post closure cost related to the Montville landfill.
This restricted equity balance represents the restricted cash amount at June 30, 2013 for this purpose $1,854,644 less the amount recorded as a liability $828,644 as discussed in the “Montville Landfill Closure and Post Closure Escrow (Southeast Project)” section above.
This amount is due to SCRRRA to be used for its obligation to closure and post closure costs for the Montville landfill and therefore should be considered a liability at June 30, 2013.
Due to SWEROC Member Towns (Southwest)
Due to SWEROC member Towns
$568,000
SWEROC was a separate entity created by the certain Southwest member towns. The Authority has originally funded the operation of the Stratford recycling facility when the Bridgeport Project was operational. After the sale of that operation, the Authority assumed the accounting and reporting for the entity. The entity closed operation as of June 30, 2013 and the remaining assets are to be returned to the member towns.
During this review, the following procedures were performed:
Discussed the termination of the entity and the disposition of the remaining assets
Reviewed the June 30, 2013 audit.
As a result of the procedures performed, the following were noted:
Based upon discussions with the Authority, it was determined that SWEROC has terminated operations effective June 30, 2013, and therefore the remaining assets will be returned to SWEROC and then the member towns.
The Authority accounts for this project separately and it is presented on pages 47-49 of the June 30, 2013, audit report. Page 49 presents the remaining net position (equity) balance at June 30, 2013 as $568,000.
This balance will be used to pay any remaining expenses and then the balance will be returned to SWEROC.
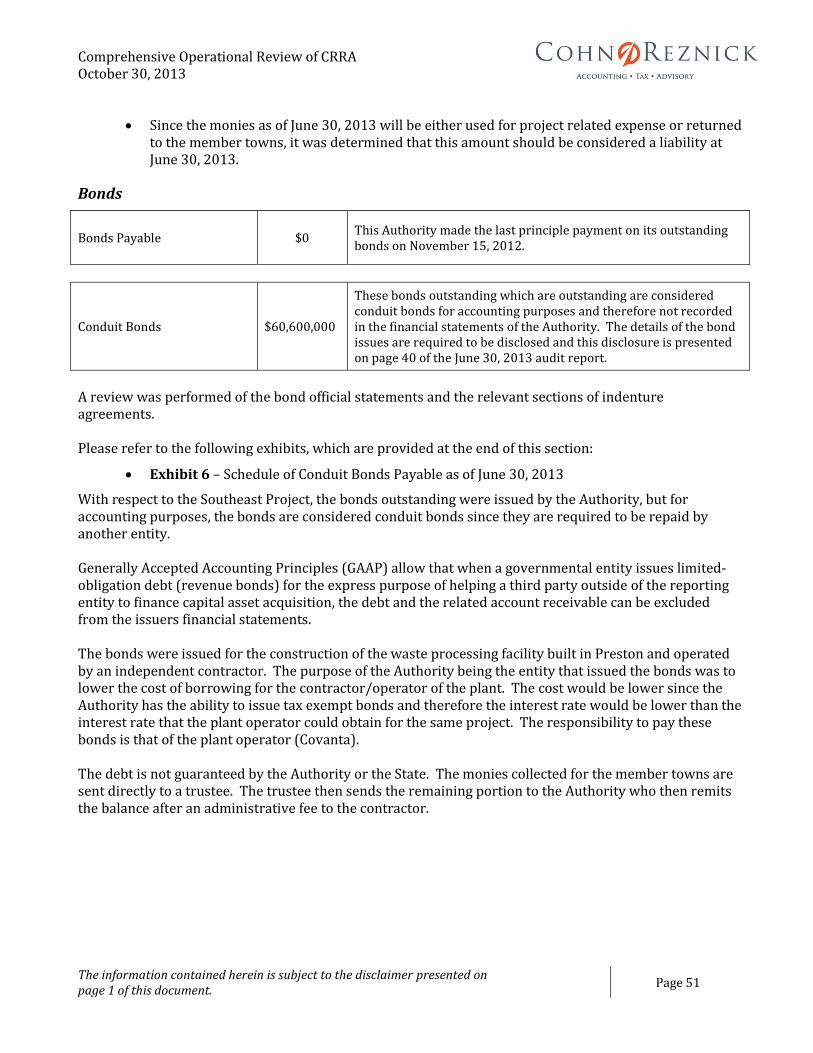
Comprehensive Operational Review of CRRA October 30, 2013
The information contained herein is subject to the disclaimer presented on page 1 of this document.
Page 51
Since the monies as of June 30, 2013 will be either used for project related expense or returned to the member towns, it was determined that this amount should be considered a liability at June 30, 2013.
Bonds
Bonds Payable $0 This Authority made the last principle payment on its outstanding bonds on November 15, 2012.
Conduit Bonds $60,600,000
These bonds outstanding which are outstanding are considered conduit bonds for accounting purposes and therefore not recorded in the financial statements of the Authority. The details of the bond issues are required to be disclosed and this disclosure is presented on page 40 of the June 30, 2013 audit report.
A review was performed of the bond official statements and the relevant sections of indenture agreements. Please refer to the following exhibits, which are provided at the end of this section:
Exhibit 6 – Schedule of Conduit Bonds Payable as of June 30, 2013
With respect to the Southeast Project, the bonds outstanding were issued by the Authority, but for accounting purposes, the bonds are considered conduit bonds since they are required to be repaid by another entity. Generally Accepted Accounting Principles (GAAP) allow that when a governmental entity issues limited-obligation debt (revenue bonds) for the express purpose of helping a third party outside of the reporting entity to finance capital asset acquisition, the debt and the related account receivable can be excluded from the issuers financial statements. The bonds were issued for the construction of the waste processing facility built in Preston and operated by an independent contractor. The purpose of the Authority being the entity that issued the bonds was to lower the cost of borrowing for the contractor/operator of the plant. The cost would be lower since the Authority has the ability to issue tax exempt bonds and therefore the interest rate would be lower than the interest rate that the plant operator could obtain for the same project. The responsibility to pay these bonds is that of the plant operator (Covanta). The debt is not guaranteed by the Authority or the State. The monies collected for the member towns are sent directly to a trustee. The trustee then sends the remaining portion to the Authority who then remits the balance after an administrative fee to the contractor.

Comprehensive Operational Review of CRRA October 30, 2013
The information contained herein is subject to the disclaimer presented on page 1 of this document.
Page 52
Other Amounts Considered Liabilities
Southeast Equity
Unrestricted Net Position $9,049,000 Unrestricted net position as of June 30, 2013, as presented on page 49 of the June 30, 2013, audit report.
Based upon discussions with the Authority, it is understood that the Authority is functioning as
an agent for the Southeastern Regional Resources Recovery Authority (SCRRRA). This was established by contract with SCRRRA since the Authority issued the bonds (conduit debt) for construction of the project. As an agent and not owner of the project, the only amount that the Authority is entitled to from this division is the $225,000 administrative fee that the Authority charges the project (SCRRRA) to perform the budgeting, accounting and other administrative functions as defined by the contract.
Based upon that understanding, any monies that have been generated by the activities of this project would be owed to SCRRRA.
Currently, the project from inception until June 30, 2103 appears to have generated revenues in excess of expenses of $9,049,000 (excluding the amount discussed above in the “Due to SWEROC Member Towns (Southwest)” section for the Montville landfill closure and post closure liability).
Therefore, the amount that was reported as unrestricted net position could be classified as a liability being due to SCRRRA as of June 30, 2013.
Mid CT Equity
Unrestricted Net Position $18,704,000 Unrestricted net position as of June 30, 2013 as presented on page 49 of the June 30, 2013, audit report.
Based upon discussions with the Authority, past practice, and certain other analyses that have performed during the analysis of the Authority’s liabilities at June 30, 2013, it is understood that the remaining monies that from the Mid-CT project will be returned to the member towns once the project close out is completed and it approved by the Board.
This was the practice that was followed for both the Bridgeport and Wallingford projects.
Therefore, the amount that was reported as unrestricted net position could be classified as a liability due back to the Mid-CT towns as of June 30, 2013.
Commitments
In addition to the liabilities that are recorded on the financial statements, it is important to note that the Authority has contractual commitments to pay certain amounts in future periods. The types of items that the Authority is committed to pay include lease payments and host community payments.

Comprehensive Operational Review of CRRA October 30, 2013
The information contained herein is subject to the disclaimer presented on page 1 of this document.
Page 53
Leased Property
The leased property commitment totals $1,170,000 and is detailed in Exhibit 1.
PILOT Payments
The PILOT payment commitments total $4,706,000 and are detailed in Exhibit 7. It should be noted that this amount excludes the City of Hartford PILOT payment as the current PILOT agreement expired during the June 30, 2013 fiscal year. As of October 2013, there has not been a PILOT agreement completed with the City of Hartford. The Authority has included $2,200,000 in its 2014 budget for the City of Hartford PILOT payment. This amount is not currently based upon a signed agreement, but the Authority expects it to be signed by June 30, 2014. The amount is not expected to vary from this amount. The Authority has used this amount in its five-year projection.
Please refer to the following exhibits, which are provided at the end of this section:
Exhibit 7 - Presents the impact on the Authority commitment if that amount is the amount in the future host community agreement
Construction Commitments
The Authority executed a contract for the final cap and solar electric generation facility at the Hartford landfill. The contract executed at in June 2013 and was for $11,614, 875. The Authority has accumulated the monies for this contract over the life of the Mid-CT project and therefore this commitment will not require any future cash flows. This cost has been recorded in the Mid-CT project as Hartford landfill closure cost and is part of the recorded $11,919,000 liability as presented on page 48 of the June 30, 2013, audit report. This amount is also disclosed as a commitment on page 39 of the June 30, 2013, audit report.

Comprehensive Operational Review of CRRA October 30, 2013
The information contained herein is subject to the disclaimer presented on page 1 of this document.
Page 54
EXHIBIT 1
Property Lease
Description Expires Property Use 2014 2015 2016 Thereafter TOTAL
REAL ESTATE
Essex Transfer Station 6/30/2027 Transfer Station 15,000$ 15,000$ 15,000$ 165,000$ 210,000$
Constitution Plaza 12/31/2015 Office Space 374,699 382,913 191,457 949,069
EQUIPMENT
Pitney Bowes - 60 Months 4/30/2015 Mail machine 5,879.00 4,900.00 - 10,779.00
TOTALS 395,578$ 402,813$ 206,457$ 165,000$ 1,169,848$
Per page 39 of the draft June 30, 2013 audit 396,000$ 403,000$ 206,000$ 165,000$ 1,170,000$
Source: Based upon review of the lease agreement
AS OF JUNE 30, 2013
CONNECTICUT RESOURCES RECOVERY AUTHORITY
SCHEDULE OF LEASED PROPERTY
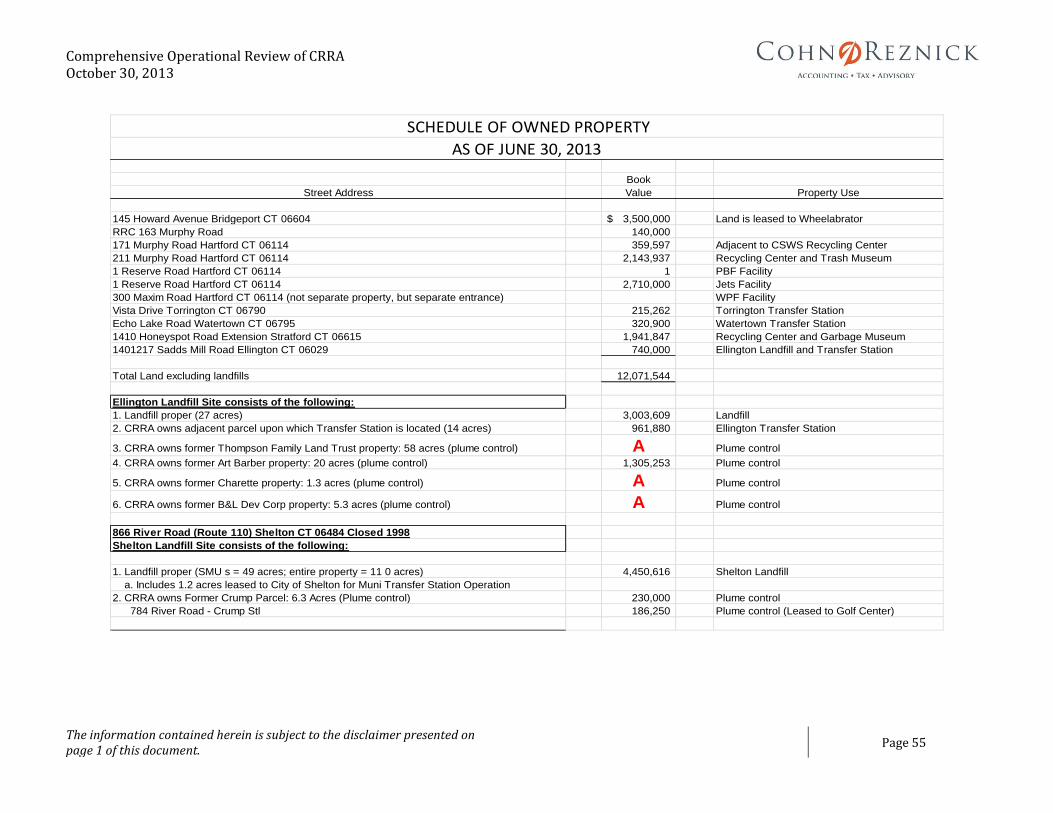
Comprehensive Operational Review of CRRA October 30, 2013
The information contained herein is subject to the disclaimer presented on page 1 of this document.
Page 55
Book
Street Address Value Property Use
145 Howard Avenue Bridgeport CT 06604 3,500,000$ Land is leased to Wheelabrator
RRC 163 Murphy Road 140,000
171 Murphy Road Hartford CT 06114 359,597 Adjacent to CSWS Recycling Center
211 Murphy Road Hartford CT 06114 2,143,937 Recycling Center and Trash Museum
1 Reserve Road Hartford CT 06114 1 PBF Facility
1 Reserve Road Hartford CT 06114 2,710,000 Jets Facility
300 Maxim Road Hartford CT 06114 (not separate property, but separate entrance) WPF Facility
Vista Drive Torrington CT 06790 215,262 Torrington Transfer Station
Echo Lake Road Watertown CT 06795 320,900 Watertown Transfer Station
1410 Honeyspot Road Extension Stratford CT 06615 1,941,847 Recycling Center and Garbage Museum
1401217 Sadds Mill Road Ellington CT 06029 740,000 Ellington Landfill and Transfer Station
Total Land excluding landfills 12,071,544
Ellington Landfill Site consists of the following:
1. Landfill proper (27 acres) 3,003,609 Landfill
2. CRRA owns adjacent parcel upon which Transfer Station is located (14 acres) 961,880 Ellington Transfer Station
3. CRRA owns former Thompson Family Land Trust property: 58 acres (plume control) A Plume control
4. CRRA owns former Art Barber property: 20 acres (plume control) 1,305,253 Plume control
5. CRRA owns former Charette property: 1.3 acres (plume control) A Plume control
6. CRRA owns former B&L Dev Corp property: 5.3 acres (plume control) A Plume control
866 River Road (Route 110) Shelton CT 06484 Closed 1998
Shelton Landfill Site consists of the following:
1. Landfill proper (SMU s = 49 acres; entire property = 11 0 acres) 4,450,616 Shelton Landfill
a. Includes 1.2 acres leased to City of Shelton for Muni Transfer Station Operation
2. CRRA owns Former Crump Parcel: 6.3 Acres (Plume control) 230,000 Plume control
784 River Road - Crump Stl 186,250 Plume control (Leased to Golf Center)
SCHEDULE OF OWNED PROPERTY
AS OF JUNE 30, 2013

Comprehensive Operational Review of CRRA October 30, 2013
The information contained herein is subject to the disclaimer presented on page 1 of this document.
Page 56
Exhibit 2 (continued) 109 Nichols Drive Waterbury Ct 06708 Closed November, 2009
1. Landfill is owned by CRRA (5.2 acres) Waterbury Landfill
Adjacent Property (11.8 acres) CRRA retains the property for the benefit of the SWAB
Municipalities Part of landfill purchase
25 Pent Road Wallingford CT 06492 Closed February 2006
Wallingford Landfill Site includes the following:
1. Former Barbarino Property: 45 Acres (Plume control) (Algonquin Gas Line Easement)
Adjacent to the Wallingford Landfill 1,948,961 Adjacent to the Wallingford Landfill
Barbarino Property 10,350 Plume control
Barbarino Property 20,124 Plume control
Total Landfill Land 16,109,102
Grand Total 28,180,646
Per June 30, 2013 Audit 28,181,000
Notes:
Listing provided by the Authority
Book Value is the amount the Authority paid for the property and not the appraised value
A - Authority is researching
3,992,059

Comprehensive Operational Review of CRRA October 30, 2013
The information contained herein is subject to the disclaimer presented on page 1 of this document.
Page 57
EXHIBIT 3A
THROUGH
MUNICIPALITY JUNE 30
1 Avon 2027
2 Barkhamsted 2027
3 Beacon Falls 2017
4 Bethlehem 2027
5 Bloomfield 2017
6 Canaan 2027
7 Canton 2027
8 Chester 2027
9 Clinton 2027
10 Colebrook 2027
11 Cromwell 2027
12 Deep River 2027
13 Durham 2017
14 East Granby 2027
15 East Hampton 2027
16 Ellington 2027
17 Essex 2027
18 Farmington 2027
19 Glastonbury 2027
20 Goshen 2027
21 Granby 2027
22 Haddam 2017
23 Hartford 2017
24 Harwinton 2027
25 Killingworth 2027
CONNECTICUT RESOURCES RECOVERY AUTHORITY
SCHEDULE OF CONTRACTED MUNICIPALTIES
AS OF JUNE 30, 2013
CONNECTICUT SOILD WASTE SYSTEM

Comprehensive Operational Review of CRRA October 30, 2013
The information contained herein is subject to the disclaimer presented on page 1 of this document.
Page 58
Exhibit 3A (continued)
26 Litchfield 2015
27 Lyme 2027
28 Manchester 2015
29 Marlborough 2027
30 Middlebury 2017
31 Middlefield 2017
32 Naugatuck 2017
33 New Hartford 2027
34 Norfolk 2027
35 North Canaan 2027
36 Old Lyme 2027
37 Old Saybrook 2027
38 Oxford 2017
39 Portland 2027
40 Rocky Hill 2027
41 Roxbury 2027
42 Salisbury 2017
43 Sharon 2017
44 Simsbury 2017
45 South Windsor 2015
46 Thomaston 2027
47 Torrington 2027
48 Watertown 2027
49 Wethersfield 2027
50 Winchester 2027
51 Woodbury 2017

Comprehensive Operational Review of CRRA October 30, 2013
The information contained herein is subject to the disclaimer presented on page 1 of this document.
Page 59
EXHIBIT 3B
Vendor Description Effective Date Termination
Professional Agreements (some require RFS, RFW and/or Change Orders)
r.c. knox and company health and welfare broker of records services 2/1/2011 1/31/2014
pitney bowes global financial services
multi-state postage and mail processing equipment, etal equipment
confirmation form 3/31/2009 2/28/2014
brown rudnick, llp 11-14 legal services agreement 7/1/2011 6/30/2014
halloran and sage, llp 11-14 legal services agreement 7/1/2011 6/30/2014
hinckley, allen & snyder, llp 11-14 legal services agreement 7/1/2011 6/30/2014
kainen, escalera and mchale, pc 11-14 legal services agreement 7/1/2011 6/30/2014
mccarter & english, llp 11-14 legal services agreement 7/1/2011 6/30/2014
mcelroy, deutsch, mulvaney & etal 11-14 legal services agreement 7/1/2011 6/30/2014
pullman & comley 11-14 legal services agreement 7/1/2011 6/30/2014
sidley austin llp 11-14 legal services agreement 7/1/2011 6/30/2014
willinger, willinger & bucci, pc 11-14 legal services agreement 7/1/2011 6/30/2014
day pitney llp 11-14 legal services agreement 7/1/2011 6/30/2014
cohn birnbaum shea 11-14 legal services agreement 7/1/2011 6/30/2014
walker systems support 11-14 computer information management consulting service agreement 10/1/2011 6/30/2014aon risk services northeast, inc. 12-14 insurance consulting and broker services agreement 1/1/2012 12/31/2014yates, steven e. 13-14 personal services agreement 7/1/2013 6/30/2014strategic persuasion group 2012-14 public relations services agreement 1/1/2012 6/30/2014connecticut economic resources center, inc. 2012-14 public relations services agreement 1/1/2012 6/30/2014duby mcdowell communications, llc 2012-14 public relations services agreement 1/1/2012 6/30/2014
WeRecycle! 2012-14 electronic recycling service agreement 2/16/2012 12/31/2014
bollam, sheedy, torani & company, llp 2012-15 independent auditing services agreement 5/1/2012 3/31/2015
horton international, llc 13-15 human resources consulting services agreement 5/29/2013 6/30/2015
rutherford associates dba the executive suite 12-15 human resources consulting services agreement 7/1/2012 6/30/2015
22nd century technologies 12-15 human resources consulting services agreement 7/1/2012 6/30/2015
linium staffing 12-15 human resources consulting services agreement 7/1/2012 6/30/2015
sni companies 12-15 human resources consulting services agreement 7/1/2012 6/30/2015
george e. sansoucy, pe llc 12-15 property appraisal services 7/1/2012 6/30/2015
mr. valuation consulting, llc 12-15 property appraisal services 7/1/2012 6/30/2015
vimini associates 12-15 property appraisal services 7/1/2012 6/30/2015
CONNECTICUT RESOURCES RECOVERY AUTHORITY
SCHEDULE OF CURRENT CONTRACTS INCLUDING MSA, HAULER , AND RESOURCE RECOVERY AGREEMENTS
AS OF JUNE 30, 2013
(EXCLUDING MSA CONTRACT FOR CONNECTICUT SOILD WASTE SYSTEM)

Comprehensive Operational Review of CRRA October 30, 2013
The information contained herein is subject to the disclaimer presented on page 1 of this document.
Page 60
Exhibit 3B (continued)
connecticut constitution associates office lease for 5/6th floor, 100 Constitution Plaza, Hartford 2/18/2004 1231/2015
ct. dept of energy/environmental protection completed NetDMR subscriber agreement 3/4/2012 undetermined
alternative resources, inc. 13-16 economic advisory services agreement 3/1/2013 2/28/2016
gershman, brickner & bratton, inc. 13-16 economic advisory services agreement 3/1/2013 2/28/2016
connecticut economic resources center, inc.(the) 13-16 economic advisory services agreement 3/1/2013 2/28/2016
environmental capital,llc 13-16 economic advisory services agreement 3/1/2013 2/28/2016
diversified technology consultants general engineering services 7/1/2013 6/30/2016
enercon services, inc general engineering services 7/1/2013 6/30/2016
fuss & o'neill, inc general engineering and landfill consulting services 7/1/2013 6/30/2016
hdr engineering, inc.
general engineering, environmental consulting, engineering and solid
waste consulting services 7/1/2013 6/30/2016
trc environmental corp
general engineering, environmental and landfill consulting, engineering
services 7/1/2013 6/30/2016
urs corporation aes general engineering, environmental consulting & engineering services 7/1/2013 6/30/2016
arcadis, us, inc.
environmental, engineering, resource recovery, recycling and landfill
consulting services 7/1/2013 6/30/2016
blue river engineerings, llc environmental and engineering consulting services 7/1/2013 6/30/2016
burns and mcdonnell
environmental, engineering, electric marketing, procurement and
consulting services 7/1/2013 6/30/2016
hrp associates, inc. environmental and engineering consulting services 7/1/2013 6/30/2016
kleinschmidt associates environmental and engineering consulting services 7/1/2013 6/30/2016
leggette, brashears & graham, inc. environmental and engineering consulting services 7/1/2013 6/30/2016
m.i. holzman & associates environmental and engineering consulting services 7/1/2013 6/30/2016
zuvic, carr associates, inc environmental and engineering consulting services 7/1/2013 6/30/2016
calrecovery, inc environmental and engineering consulting services 7/1/2013 6/30/2016
dvirka and bartilucci consulting engineers resource recovery, recycling and solid waste consulting services 7/1/2013 6/30/2016grillo engineering co environmental and engineering consulting services 7/1/2013 6/30/2016project management associates environmental consulting/engineering services 7/1/2013 6/30/2016van zelm, heywood & shadford, inc. environmental consulting/engineering services 7/1/2013 6/30/2016hatch mott macdonald landfill consulting & engineering services 7/1/2013 6/30/2016langan engineering and environmental services landfill consulting & engineering services 7/1/2013 6/30/2016

Comprehensive Operational Review of CRRA October 30, 2013
The information contained herein is subject to the disclaimer presented on page 1 of this document.
Page 61
Exhibit 3B (continued)
lockwood, kessler & bartlett,inc. landfill consulting & engineering services 7/1/2013 6/30/2016scs engineers, pc landfill consulting & engineering services 7/1/2013 6/30/2016design professionals land surveying services 7/1/2013 6/30/2016lrc engineering and surveying, llc land surveying services 7/1/2013 6/30/2016alternative resources, inc. solid waste consulting services 7/1/2013 6/30/2016
gershman, brickner & bratton, inc. solid waste consulting services 7/1/2013 6/30/2016power advisory llc electric marketing, procurement and consulting services 7/1/2013 6/30/2016hooker & holcombe investment advisors, inc. 401k plan services agreement 7/1/2013 6/30/2016
MID-CONNECTICUT HAULER AGREEMENTS
Solid Waste, Spot Waste
state of connecticut, dep grant-in aid hartford landfill closure 9/23/2010 9/22/2013usa hauling&recycling, inc. somers sanitation service, inc, all
american waste, llc all waste, inc, murphy road recycling, llc
shoham road transfer center, f&g recycling, llc, f&g, llc, f&g
realty, llc, municipal road transfer center, ll, airline avenue 10-12 waste disposal system solid waste/recyclables delivery agreement 7/1/2010 12/31/2013usa hauling&recycling, inc. somers sanitation service, inc, all
american waste, llc all waste, inc, murphy road recycling, llc
shoham road transfer center, f&g recycling, llc, f&g, llc, f&g
realty, llc, municipal road transfer center, ll, airline avenue waste bypass agreement 7/1/2010 12/31/2013
element markets, llc sale of nox discrete emissions reduction credits 7/14/2010 12/31/2013
pratt & whitney sale of nox discrete emissions reduction credits 7/15/2010 12/31/2013usa hauling&recycling, inc. somers sanitation service, inc, all
american waste, llc all waste, inc, murphy road recycling, llc
shoham road transfer center, f&g recycling, llc, f&g, llc, f&g
realty, llc, municipal road transfer center, ll, airline avenue spot waste agreement 7/1/2010 12/31/2014cwpm, llc 09-14 solid waste delivery agreement(new haven) 1/1/2009 12/31/2014
usphis, ws 13-14 cooperative services agreement 7/1/2013 6/30/2014
hq dumpsters and recycling llc 13-14 solid waste and recyclables delivery agreement 7/1/2013 6/30/2014
hometown waste, llc 13-14 solid waste and recyclables delivery agreement 7/1/2013 6/30/2014
dainty rubbish services, inc. 13-14 solid waste and recyclables delivery agreement 7/1/2013 6/30/2014
johns refuse & recycling, inc. 13-14 solid waste and recyclables delivery agreement 7/1/2013 6/30/2014
winter brothers hauling of ct, inc. 13-14 solid waste and recyclables delivery agreement 7/1/2013 6/30/2014

Comprehensive Operational Review of CRRA October 30, 2013
The information contained herein is subject to the disclaimer presented on page 1 of this document.
Page 62
Exhibit 3B (continued) lockwood, kessler & bartlett,inc. landfill consulting & engineering services 7/1/2013 6/30/2016scs engineers, pc landfill consulting & engineering services 7/1/2013 6/30/2016design professionals land surveying services 7/1/2013 6/30/2016lrc engineering and surveying, llc land surveying services 7/1/2013 6/30/2016alternative resources, inc. solid waste consulting services 7/1/2013 6/30/2016
gershman, brickner & bratton, inc. solid waste consulting services 7/1/2013 6/30/2016power advisory llc electric marketing, procurement and consulting services 7/1/2013 6/30/2016hooker & holcombe investment advisors, inc. 401k plan services agreement 7/1/2013 6/30/2016
MID-CONNECTICUT HAULER AGREEMENTS
Solid Waste, Spot Waste
state of connecticut, dep grant-in aid hartford landfill closure 9/23/2010 9/22/2013usa hauling&recycling, inc. somers sanitation service, inc, all
american waste, llc all waste, inc, murphy road recycling, llc
shoham road transfer center, f&g recycling, llc, f&g, llc, f&g
realty, llc, municipal road transfer center, ll, airline avenue 10-12 waste disposal system solid waste/recyclables delivery agreement 7/1/2010 12/31/2013usa hauling&recycling, inc. somers sanitation service, inc, all
american waste, llc all waste, inc, murphy road recycling, llc
shoham road transfer center, f&g recycling, llc, f&g, llc, f&g
realty, llc, municipal road transfer center, ll, airline avenue waste bypass agreement 7/1/2010 12/31/2013
element markets, llc sale of nox discrete emissions reduction credits 7/14/2010 12/31/2013
pratt & whitney sale of nox discrete emissions reduction credits 7/15/2010 12/31/2013usa hauling&recycling, inc. somers sanitation service, inc, all
american waste, llc all waste, inc, murphy road recycling, llc
shoham road transfer center, f&g recycling, llc, f&g, llc, f&g
realty, llc, municipal road transfer center, ll, airline avenue spot waste agreement 7/1/2010 12/31/2014cwpm, llc 09-14 solid waste delivery agreement(new haven) 1/1/2009 12/31/2014
usphis, ws 13-14 cooperative services agreement 7/1/2013 6/30/2014
hq dumpsters and recycling llc 13-14 solid waste and recyclables delivery agreement 7/1/2013 6/30/2014
hometown waste, llc 13-14 solid waste and recyclables delivery agreement 7/1/2013 6/30/2014
dainty rubbish services, inc. 13-14 solid waste and recyclables delivery agreement 7/1/2013 6/30/2014
johns refuse & recycling, inc. 13-14 solid waste and recyclables delivery agreement 7/1/2013 6/30/2014
winter brothers hauling of ct, inc. 13-14 solid waste and recyclables delivery agreement 7/1/2013 6/30/2014

Comprehensive Operational Review of CRRA October 30, 2013
The information contained herein is subject to the disclaimer presented on page 1 of this document.
Page 63
Exhibit 3B (continued)
all american waste, all wzste, somers sanitation, usa
hauling 13-14 solid waste and recyclables delivery agreement 7/1/2013 6/30/2014
all american , all waste, somers sanitation, usa hauling
and recycling 13-14 solid waste and recyclables delivery agreement(spot) 7/1/2013 6/30/2014
grillo services, llc 13-14 solid waste and recyclables delivery agreement 7/1/2013 6/30/2014
dainty rubbish services, inc. 10-15 waste disposal system solid waste/recycables delivery agreement 10/15/2010 4/30/2015
cwpm, llc on-call msw diversion transportation/disposal work 7/1/2012 6/30/2015Albreada Refuse & Sweeping, LLC 10-15 waste disposal system solid waste/recycables delivery agreement 7/1/2010 6/30/2015all about service, S&P Carting, inc. 10-15 waste disposal system solid waste/recycables delivery agreement 7/1/2010 6/30/2015Allied Sanitation, Inc 10-15 waste disposal system solid waste/recycables delivery agreement 7/1/2010 6/30/2015A.J. Waste System 10-15 waste disposal system solid waste/recycables delivery agreement 7/1/2010 6/30/2015all-ways dumpsters inc. 10-15 waste disposal system solid waste/recycables delivery agreement 7/1/2010 6/30/2015Bergeron Trucking Inc 10-15 waste disposal system solid waste/recycables delivery agreement 7/1/2010 6/30/2015
Capitol Sweeping Services, inc. 10-15 waste disposal system solid waste/recycables delivery agreement 7/1/2010 6/30/2015
Canton Village Construction Co 10-15 waste disposal system solid waste/recycables delivery agreement 7/1/2010 6/30/2015
can-it llc 10-15 waste disposal system solid waste/recycables delivery agreement 7/1/2010 6/30/2015
Copes Rubbish Removal Inc 10-15 waste disposal system solid waste/recycables delivery agreement 7/1/2010 6/30/2015
connecticut waste transfer, llc 10-15 waste disposal system solid waste/recycables delivery agreement 7/1/2010 6/30/2015
cwpm, llc 10-15 waste disposal system solid waste/recycables delivery agreement 7/1/2010 6/30/2015
disposal plus llc 10-15 waste disposal system solid waste/recycables delivery agreement 7/1/2010 6/30/2015
finkeldey-bmj, inc 10-15 waste disposal system solid waste/recycables delivery agreement 7/1/2010 6/30/2015
Hanna Paper Recycling Inc. 10-15 waste disposal system solid waste/recycables delivery agreement 7/1/2010 6/30/2015

Comprehensive Operational Review of CRRA October 30, 2013
The information contained herein is subject to the disclaimer presented on page 1 of this document.
Page 64
Exhibit 3B (continued)
H.I. Stone & Son, Inc. 10-15 waste disposal system solid waste/recycables delivery agreement 7/1/2010 6/30/2015
Hometown Waste Inc. 10-15 waste disposal system solid waste/recycables delivery agreement 7/1/2010 6/30/2015
janskys rubbish removal company 10-15 waste disposal system solid waste/recycables delivery agreement 7/1/2010 6/30/2015
latella rubbish removal 10-15 waste disposal system solid waste/recycables delivery agreement 7/1/2010 6/30/2015
Mr.Canman Hauling & Recycling LLc 10-15 waste disposal system solid waste/recycables delivery agreement 7/1/2010 6/30/2015
Oliver Rubbish Removal LLC 10-15 waste disposal system solid waste/recycables delivery agreement 7/1/2010 6/30/2015
Paine's Inc. 10-15 waste disposal system solid waste/recycables delivery agreement 7/1/2010 6/30/2015
patterson enterprises,inc 10-15 waste disposal system solid waste/recycables delivery agreement 7/1/2010 6/30/2015
Petes Waste Removal 10-15 waste disposal system solid waste/recycables delivery agreement 7/1/2010 6/30/2015
pj trucking, inc. 10-15 waste disposal system solid waste/recycables delivery agreement 7/1/2010 6/30/2015
recycle rescue, llc 10-15 waste disposal system solid waste/recycables delivery agreement 7/1/2010 6/30/2015
rich's waste removal 10-15 waste disposal system solid waste/recycables delivery agreement 7/1/2010 6/30/2015
Shoreline Sanitation Inc 10-15 waste disposal system solid waste/recycables delivery agreement 7/1/2010 6/30/2015
trash away, inc. 10-15 waste disposal system solid waste/recycables delivery agreement 7/1/2010 6/30/2015
trash master 10-15 waste disposal system solid waste/recycables delivery agreement 7/1/2010 6/30/2015
Springers Sanitation Inc. 10-15 waste disposal system solid waste/recycables delivery agreement 7/1/2010 6/30/2015
Stone Construction Co., Inc. (the) 10-15 waste disposal system solid waste/recycables delivery agreement 7/1/2010 6/30/2015

Comprehensive Operational Review of CRRA October 30, 2013
The information contained herein is subject to the disclaimer presented on page 1 of this document.
Page 65
Exhibit 3B (continued)
waste material trucking co., inc. 10-15 waste disposal system solid waste/recycables delivery agreement 7/1/2010 6/30/2015
waste resources inc 10-15 waste disposal system solid waste/recycables delivery agreement 7/1/2010 6/30/2015
waste tech llc 10-15 waste disposal system solid waste/recycables delivery agreement 7/1/2010 6/30/2015
valley 82 corp dba welsh sanitation service 10-15 waste disposal system solid waste/recycables delivery agreement 7/1/2010 6/30/2015
Tidy Services LLC 10-15 waste disposal system solid waste/recycables delivery agreement 7/1/2010 6/30/2015
windsor sanitation inc. 10-15 waste disposal system solid waste/recycables delivery agreement 7/1/2010 6/30/2015
winter brothers hauling of ct, inc. 10-15 waste disposal system solid waste/recycables delivery agreement 7/1/2010 6/30/2013
joe rocco rubbish removal, inc 10-15 waste disposal system solid waste/recycables delivery agreement 7/1/2010 6/30/2015
team energy
12-15 waste disposal system solid waste /recyclables delivery
agreement 7/1/2012 6/30/2015
a-1 waste disposal 10-15 waste disposal system solid waste/recyclables delivery agreement 4/5/2011 6/30/2015
artic trucking services, inc. 10-15 waste disposal system solid waste/recyclables delivery agreement 7/1/2010 6/30/2015
richard riggio and sons inc 10-15 waste disposal system solid waste/recyclables delivery agreement 7/1/2010 6/30/2015
hq dumpsters and recycling 10-15 waste disposal system solid waste/recyclables delivery agreement 7/1/2010 6/30/2015
valley shore waste and recycling, llc 12-15 waste disposal system solid waste/recyclables delivery agreement 7/1/2012 6/30/2015

Comprehensive Operational Review of CRRA October 30, 2013
The information contained herein is subject to the disclaimer presented on page 1 of this document.
Page 66
Exhibit 3B (continued)
Non Municipal Mid-Connecticut Municipal
Services Agreements
central connecticut solid waste authority master coordination agreement 7/28/2011 6/30/2027
coventry resource recovery authority municipal solid waste management services agreement 10/4/2011 6/30/2027regional refuse disposal district #1, winchester, new
hartford and barkhamsted
tier 1 long term mswsa provision of acceptable solid waste/recyclables
services 12/12/2011 6/30/2027
Other Mid-CT contractshartford, city of 2nd amendment, PILOT 2/10/2011
hartford, city of
4th amendment - lease agreement - to construct a transfer station -
hartford landfill 4/3/2009 tbdhartford, city of agreement, hartford, city of and crra 2/2/2007 tbd
ct dept of transportation memorandum of understanding - lf cap soils - 180 leibert road 4/21/2008 tbd
connecticut light and power interconnection agreement 5/30/2000 tbd
trc environmental corporation/crra
exit strategy contract, environmental remediation of south meadow
station 12/22/2000 tbdnew york community bank trust agreement and memorandum of understanding; south meadows site 12/8/2009 tbdtrc environmental corporation environmental remediation of south meadow station 12/22/2000 tbdwTe metal recovery and marketing services
la carpa associates incl electric power sales consulting services 3/8/2013 12/31/2013
corporate environmental advisors, inc. I&M-hartford landfill ash leachate collection & treatment System 7/1/2011 6/30/2014
ck environmental air emissions testing @mid-ct power block facility 9/6/2011 8/31/2014
nextera energy power marketing jet turbine facility energy management services agreement 4/9/2012 6/30/2015
NAES Corporation
electric generation facility -operation, maintenance and maintenance
services 5/31/2012 6/30/2015
waste management-massachusetts
waste transportation and disposal services; mid-ct rrf and transfer
stations: ellington, essex, torrington and watertown, ct 1/1/2009 6/30/2015Re-community/FCR design, upgrade & retrofit - Operation & Maintenance - RRCF 8/1/2005 10/31/2015
NAES Corporation operation and maintenance - jet turbine facility 6/1/2012 6/30/2016
NAES Corporation operation and maintenance - RRF agreement 12/16/2010 6/30/2016
wheelabrator technologies inc
acceptable ash residue transportation/disposal services-mid-ct-rrf and
ash residue disp service 1/1/2009 12/31/2016
connecticut light and power purchase and sale of Connecticut Class 1 renewable energy credits low or zero emission projects9/12/2012 8/31/2029

Comprehensive Operational Review of CRRA October 30, 2013
The information contained herein is subject to the disclaimer presented on page 1 of this document.
Page 67
Exhibit 3B (continued) HARTFORD, ELLINGTON LANDFILLS ETAL AND
TRANSFER STATIONS
contract by crra lawyers
3rd amendment - settlement agreement, thompson land family trust
rachael derham and sally bissell 9/1/2010 tbd
mettler toledo autoscale upgrade 3/28/2012 undetermined
Hartford, City landfill lease(amendments 1-4) 7/1/1982 tbd
capital restoration, inc. cover soils letter agreement 9/9/2013 10/31/2013
connecticut light and power purchase and sale, CT class I renewable energy credits 9/11/2012 10/31/2013
knapp engineering
inspection and maintenance, ash leachate collection and treatment
system 3/4/2013 6/30/2014
botticello, inc. on-call operation and maintenance work agreement 3/1/2012 2/28/2015
beebe landscaping services inc. landscaping, mowing, and snowplow work - ellington 7/1/2012 6/30/2015
primary landscaping, llc landscape, mowing and snowplowing - Hartford 7/1/2012 6/30/2015
e.t.&l corporation phase 2 area closure and photovoltiac system project, hartford landfill 6/13/2013 6/30/2015
foristar methane group (neo hartford) gas collection methane system 12/1/1995 11/30/2015
DOT, State of Connecticut lease agreement, hartford landfill 3/10/1994 11/30/2015
gza geoenvironmental
13-16 environmental monitoring, laboratory analysis and reporting
services, hartford landfill 7/1/2013 6/30/2016
groundwater and environmental services, inc.
13-16 environmental monitoring, laboratory analysis and reporting
services, hartford landfill 7/1/2013 6/30/2016
wte recycling 13-16 metals recovery and marketing services 7/1/2013 6/30/2016cwpm, inc agreement for waste transportation & transfer station operation & 7/1/2013 6/30/2018copes agreement for waste transportation & transfer station operation & 7/1/2013 6/30/2018scs field services 13-18 oper/maint gas collection and control system 7/1/2013 6/30/2018lamar central outdoor, llc billboard advertising license agreement 8/1/2006 7/31/2021

Comprehensive Operational Review of CRRA October 30, 2013
The information contained herein is subject to the disclaimer presented on page 1 of this document.
Page 68
Exhibit 3B (continued)
SOUTHEAST
Municipal Services Agreement
salem, town of
municipal solid waste management services agreement- 1&2nd
Amendments 3/29/1994 6/30/2008
east lyme town of municipal solid waste management services agreement 11/13/1985 12/15/2015
griswold, town of municipal solid waste management services agreement 7/3/1986 12/15/2015
groton, town of municipal solid waste management services agreement 11/13/1985 12/15/2015
guilford/madison, towns of municipal solid waste management services agreement 11/1/1987 12/15/2015
ledyard, town of municipal solid waste management services agreement 11/13/1985 12/15/2015
madison/guilford use of transfer station agreement municipal solid waste management services agreement 8/15/1997 12/15/2015
montville, town of municipal solid waste management services agreement 11/12/1985 12/15/2015
new london, city of municipal solid waste management services agreement 11/13/1985 12/15/2015
north stonington, town of municipal solid waste management services agreement 11/13/1985 12/15/2015
norwich, city of municipal solid waste management services agreement 11/13/1985 12/15/2015
sprague, town of municipal solid waste management services agreement 11/13/1985 12/15/2015
stonington, town of municipal solid waste management services agreement 11/13/1985 12/15/2015
waterford, town of municipal solid waste management services agreement 11/13/1985 12/15/2015
scrrra/crra southeast pilot agreement 9/16/1992 6/30/2017
Resource Recovery Facility
wheelabrator technologies ash disposal agreement 1/1/2009 6/30/2015
american ref-fuel of southeastern connecticut lease agreement-1-3 amendments 12/1/1988 11/15/2015
southeastern connecticut regional resources recovery
authority bridge and management agreement 12/1/1988 11/15/2015
american ref-fuel of southeastern connecticut facility services agreement- 1-6 amendments 12/1/1987 11/15/2015
scrrra/southeastern amer ref-fuel site lease 12/1/1988 11/15/2015
scrrra/southeastern amer ref-fuel/cl&p amendment no. 1 electrical energy purchase/settlement 9/1/1998 2/1/2017
northeast utilities system/scrrra/crra energy curtailments 4/6/2013 11/10/2013

Comprehensive Operational Review of CRRA October 30, 2013
The information contained herein is subject to the disclaimer presented on page 1 of this document.
Page 69
Exhibit 3B (continued)
SOUTHWEST DIVISION
Greater Bridgeport Regional Solid Waste Interlocal
Easton, Town of Greater Bridgeport Regional Solid Waste Interlocal Agreement Summary 1/1/2009 1/1/2019
Stratford Intermediate Processing Center
City Carting, Inc Operation, Maintenance and Transportation Services 7/1/2011 6/30/2014SWEROC service agreement, transfer station operation, transport services and 7/1/2011 6/30/2014
crra/wheelabrator bridgeport, lp amended and restated solid waste disposal agreement 12/1/2008 6/30/2014wheelabrator 2008 amended and restated solid waste disposal agreement 12/1/2008 6/30/2014woodbridge, town municipal solid waste management services agreement 1/1/2009 6/30/2015westport, town municipal solid waste management services agreement 1/1/2009 6/30/2015monroe, town municipal solid waste management services agreement 1/1/2009 6/30/2015stratford, town municipal solid waste management services agreement 1/1/2009 6/30/2015fairfied, town municipal solid waste management services agreement 1/1/2009 6/30/2015trumbull, town municipal solid waste management services agreement 1/1/2009 6/30/2015milford, city municpal solid waste management services agreement 1/1/2009 6/30/2015bethany, town municipal solid waste management services agreement 1/1/2009 6/30/2015easton, town municipal solid waste management services agreement 1/1/2009 6/30/2015orange, town municipal solid waste management services agreement 1/1/2009 6/30/2015bridgeport, city municipal solid waste management services agreement 1/1/2009 6/30/2015stratford, town 13-17 IPC host community agreement upon signature 6/30/2017
Shelton, Waterbury Landfills
state of Connecticut, DEP grant in aid 9/23/2010 9/23/2013
shelton, city of storage agreement 1/1/2010 12/13/2014
sebben's lawn service 13-15 landscape, mowing and snowplowing, shelton landfill 7/23/2013 6/30/2015
bci, butler company landscape, mowing and snowplowing - waterbury landfill 7/1/2012 6/30/2015
facilities support services, llc landfill environmental monitoring, lab analysis & reporting services 7/1/2013 6/30/2016
sterns, conrad, and schmidt consulting engineers, inc.
o&m gas landfill gas collection system and thermal oxidizer station
agreement - shelton 7/1/2013 6/30/2018ultimate family golf center lease agreement, shelton 5/1/1998 4/30/2020

Comprehensive Operational Review of CRRA October 30, 2013
The information contained herein is subject to the disclaimer presented on page 1 of this document.
Page 70
Exhibit 3B (continued)
Wallingford Landfill
crra and us bank national association
hazardous waste management facility; trust agreement for RCRA
corrective action 6/28/2011 tbd
crra and us bank national association wallingford landfill trust agreement, ct dep 6/28/2011 tbd
sovereign consulting inc. 13-16 environmental monitoring, lab analysis and reporting services 7/1/2013 6/30/2016
t&t complete landscaing landscape, mowing and snowplowing work 7/1/2012 6/30/2015
Listing provided by Connecticut Resources Recovery Authority

Comprehensive Operational Review of CRRA October 30, 2013
The information contained herein is subject to the disclaimer presented on page 1 of this document.
Page 71
EXHIBIT 4A
General SE SW Property Landfill Recycling
Fund CSWS Mid CT Project Division Division Division Division Total
Accounts payable - Trade 112,705$ 1,900,156$ 711,670$ 281,326$ 1,222,719$ 76,085$ 87,276$ 89,225$ 4,481,162$
Account payable - operators - 1,885,584 3,269,980 2,761,632 - 69,533 - - 7,986,729
Due to other funds 12,600 8,953,528 124,815 6,262 723,964 139,406 4,700 9,965,275
Accrued expenses - professional fees
(audit, legal, other) 119,240 80,000 443,742 75,000 717,982
Recycling rebates due to Towns 298,880 342,000 13,811 654,691
Accrued payroll and payroll tax liabilities 74,153 - - - - - - - 74,153
Accrued sick and vacation pay 327,950 327,950
Customer advance payments 1,626,842 53,055 1,679,897
Unearned revenue 425,000 425,000
Customer guarantee of payment deposits 157,075 200,000 357,075
Montville landfill closure and post closure escrow 828,644 828,644
Closure and post closure care of landfills - current 11,919,000 2,294,580 14,213,580
Closure and post closure care of landfills - long-term 35,062,492 35,062,492
Contract termination payment 2,916,000 2,916,000
Claims payable 200,000 200,000
Coal pond cleaning 365,000 365,000
Mid CT project transition costs - admin and salaries 417,520 417,520
Mid-CT end of project transition costs 3,500,000 3,500,000
TOTAL LIABILITIES 646,648 14,902,065 24,887,782 3,877,864 1,222,719 944,582 37,583,754 107,736 84,173,150
PER JUNE 30, 2013 AUDIT - PAGE 48 646,000 14,903,000 24,887,000 3,878,000 1,222,000 945,000 37,584,000 108,000 84,173,000
ADDITIONAL LIABILITIES OR CONTINGENCIES
Potential Worker Compensation premium adjustment 100,000 100,000
Due to City of Hartford for recycling education 143,000 143,000
Due to SCRRRA for Montville landfill closure and -
post closure costs 1,076,000 1,076,000
Due to SWEROC member Towns 568,000 568,000
ADJUSTED TOTAL LIABILITIES 646,000$ 14,903,000$ 25,130,000$ 4,954,000$ 1,222,000$ 945,000$ 37,584,000$ 676,000$ 86,060,000$
Source - Review of Authority general ledger and supporting schedules
CONNECTICUT RESOURCES RECOVERY AUTHORITY
SCHEDULE OF LIABILITIES
AS OF JUNE 30, 2013

Comprehensive Operational Review of CRRA October 30, 2013
The information contained herein is subject to the disclaimer presented on page 1 of this document.
Page 72
EXHIBIT 4B
Exhibit 4A
Total Adjusted
Report in Additional Total
Audit Liabilities Liabilities
Accounts payable - Trade 4,481,162$ 4,481,162
Account payable - operators 7,986,729 7,986,729
Due to other funds 9,965,275 9,965,275
Accrued expenses - professional fees
(audit, legal, other) 717,982 717,982
Recycling rebates due to Towns 654,691 143,000 797,691
Due to SWEROC member Towns (Southwest) 568,000 568,000
Accrued payroll and payroll tax liabilities 74,153 74,153
Accrued sick and vacation pay 327,950 327,950
Customer advance payments 1,679,897 1,679,897
Unearned revenue 425,000 425,000
Customer guarantee of payment deposits 357,075 357,075
Montville landfill closure and post closure escrow 828,644 1,076,000 1,904,644
Closure and post closure care of landfills - current 14,213,580 14,213,580
Closure and post closure care of landfills - long-term 35,062,492 35,062,492
Contract termination payment 2,916,000 2,916,000
Claims payable 200,000 100,000 300,000
Coal pond cleaning 365,000 365,000
Mid CT project transition costs - admin and salaries 417,520 417,520
Mid-CT end of project transition costs 3,500,000 3,500,000
TOTAL LIABILITIES 84,173,150$ 1,887,000$ 86,060,150$
PER JUNE 30, 2013 AUDIT - PAGE 48
CONNECTICUT RESOURCES RECOVERY AUTHORITY
SCHEDULE OF LIABILITIES - ADJUSTED
AS OF JUNE 30, 2013

Comprehensive Operational Review of CRRA October 30, 2013
The information contained herein is subject to the disclaimer presented on page 1 of this document.
Page 73
EXHIBIT 5A
Amount Paid
Landfill Fiscal year
Mid CT Division Total 2013
CURRENT LIABILITIES
Payable unrestricted assets
Closure and post closure care of landfills
Hartford 11,919,000$ (1) 874,500$ 12,793,500$ 1,205,000$
Ellington 382,000 382,000 150,000
Shelton 625,400 625,400 251,000
Waterbury 48,080 48,080 27,000
Wallingford 364,600 364,600 153,000
Total Closure and post closure care of landfills 11,919,000 2,294,580 14,213,580 1,786,000
LONG-TERM LIABILITIES
Payable unrestricted assets
Closure and post closure care of landfills
Hartford 17,814,234 17,814,234
Ellington 2,917,963 2,917,963
Shelton 3,818,183 3,818,183
Waterbury 893,992 893,992
Wallingford 2,251,271 2,251,271
Total Closure and post closure care of landfills - 27,695,643 27,695,643
Notes:
(2) Amount spent is fiscal 2013 is less than estimated current portion due to the timing of certain maintenance or construction projects.
(3) Based upon certain contracts or agreements, certain assets were restricted for specific projects closure and post closure cost. Other assets
accumulated for the same purpose by the Authority are presented as unrestricted
(1) During fiscal year 2013 the Authority executed a contract for the final cap and solar electricity generation facility at the Hartford landfill.
See June 30, 2013 audit page 41
CONNECTICUT RESOURCES RECOVERY AUTHORITY
SCHEDULE OF CLOSURE AND POST CLOSURE CARE OF LANDFILLS - BY LOCATION
JUNE 30, 2013
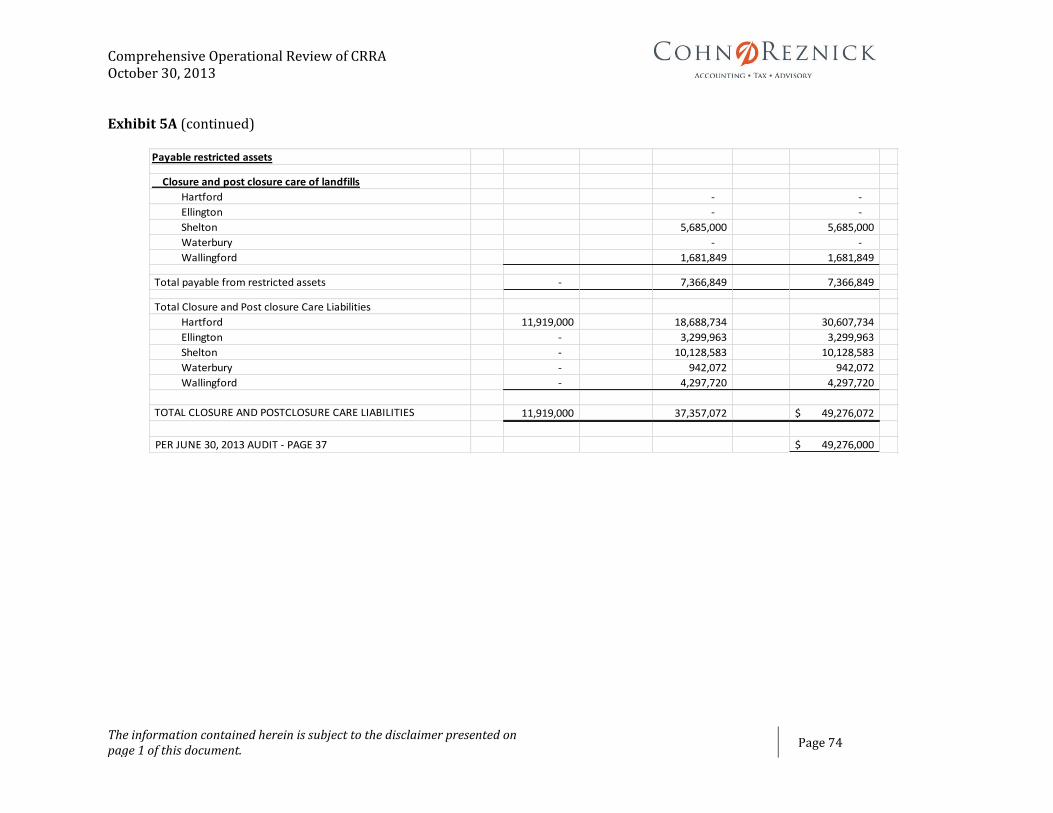
Comprehensive Operational Review of CRRA October 30, 2013
The information contained herein is subject to the disclaimer presented on page 1 of this document.
Page 74
Exhibit 5A (continued)
Payable restricted assets
Closure and post closure care of landfills
Hartford - -
Ellington - -
Shelton 5,685,000 5,685,000
Waterbury - -
Wallingford 1,681,849 1,681,849
Total payable from restricted assets - 7,366,849 7,366,849
Total Closure and Post closure Care Liabilities
Hartford 11,919,000 18,688,734 30,607,734
Ellington - 3,299,963 3,299,963
Shelton - 10,128,583 10,128,583
Waterbury - 942,072 942,072
Wallingford - 4,297,720 4,297,720
TOTAL CLOSURE AND POSTCLOSURE CARE LIABILITIES 11,919,000 37,357,072 49,276,072$
PER JUNE 30, 2013 AUDIT - PAGE 37 49,276,000$

Comprehensive Operational Review of CRRA October 30, 2013
The information contained herein is subject to the disclaimer presented on page 1 of this document.
Page 75
EXHIBIT 5B
Landfill
Mid CT Division Total
TOTAL CLOSURE AND POST CLOSURE LIABILITIES
Closure and post closure care of landfills
Hartford 11,919,000$ (1) 18,688,734$ 30,607,734$
Ellington 3,299,963 3,299,963
Shelton 10,128,583 10,128,583
Waterbury 942,072 942,072
Wallingford 4,297,720 4,297,720
Total Closure and post closure care of landfills liabilities 11,919,000 37,357,072 49,276,072
TOTAL ASSETS AVAILABLE TO FUND THE CLOSURE AND POST CLOSURE LIABILITIES
Cash and cash equivalents 11,919,000 (2) 26,451,000 38,370,000
Due from other funds (Connecticut Solid Waste System) 7,881,000 7,881,000
Restricted Cash and cash equivalents (Shelton Future use) 701,000 701,000
Investments 8,184,000 8,184,000
Total noncapital assets of Landfill division 11,919,000 43,217,000 55,136,000
Less
Restricted Cash and cash equivalents (Shelton Future use) (701,000) (701,000)
Accounts payable (68,000) (68,000)
Accrued expenses (20,000) (20,000)
Due to other funds (139,000) (139,000)
Net amount available to pay closure and post closure costs 11,919,000 42,289,000 54,208,000
Amount of assets in excess of current closure and post closure liabilities -$ 4,931,928$ 4,931,928$
Amount restricted net position that is also recorded as part of post closure liability 530,000
Adjusted amount of unrestricted net position (equity) 5,461,928$
(2) The Mid CT project has adequate assets to fund the landfill closure costs. The remaining assets in the Mid-CT project fund are to liquidate
the remaining liabilities and close out the project.
See June 30, 2013 audit page 41
CONNECTICUT RESOURCES RECOVERY AUTHORITY
COMPARISON OF CLOSURE AND POSTCLOSURE CARE OF LANDFILLS LIABILITIES TO ASSETS AVAILABLE
AS OF JUNE 30, 2013
(1) During fiscal year 2013 the Authority executed a contract for the final cap and solar electricity generation facility at the Hartford landfill.
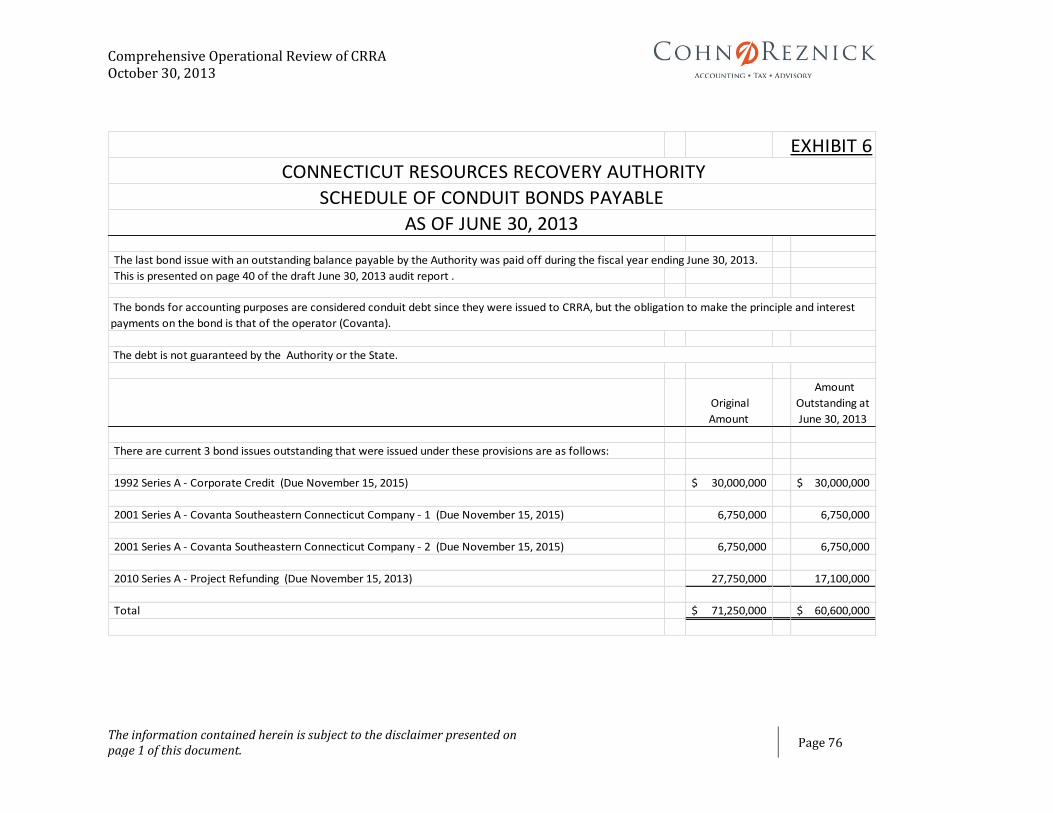
Comprehensive Operational Review of CRRA October 30, 2013
The information contained herein is subject to the disclaimer presented on page 1 of this document.
Page 76
EXHIBIT 6
The last bond issue with an outstanding balance payable by the Authority was paid off during the fiscal year ending June 30, 2013.
This is presented on page 40 of the draft June 30, 2013 audit report .
Original
Amount
Amount
Outstanding at
June 30, 2013
There are current 3 bond issues outstanding that were issued under these provisions are as follows:
1992 Series A - Corporate Credit (Due November 15, 2015) 30,000,000$ 30,000,000$
2001 Series A - Covanta Southeastern Connecticut Company - 1 (Due November 15, 2015) 6,750,000 6,750,000
2001 Series A - Covanta Southeastern Connecticut Company - 2 (Due November 15, 2015) 6,750,000 6,750,000
2010 Series A - Project Refunding (Due November 15, 2013) 27,750,000 17,100,000
Total 71,250,000$ 60,600,000$
CONNECTICUT RESOURCES RECOVERY AUTHORITY
AS OF JUNE 30, 2013
The bonds for accounting purposes are considered conduit debt since they were issued to CRRA, but the obligation to make the principle and interest
payments on the bond is that of the operator (Covanta).
The debt is not guaranteed by the Authority or the State.
SCHEDULE OF CONDUIT BONDS PAYABLE

Comprehensive Operational Review of CRRA October 30, 2013
The information contained herein is subject to the disclaimer presented on page 1 of this document.
Page 77
EXHIBIT 7
Per
Agreement Paid June 2013
Street Address Expires 2013 2014 2015 2016 2017 Thereafter TOTAL Audit
Town of Preston 42,916$ 845,734$ 885,022$ 926,272$ 969,586$ 1,015,066$ -$ 3,795,946$ 3,796,000$
City of Hartford 6/30/2013 (1) 1,472,126 - -
Town of Stratford 6/30/2017 27,377 27,000 27,000 27,000 27,000 108,000 108,000.00
Town of Ellington 6/30/2017 9,597 10,000 10,000 10,000 10,000 40,000 40,000.00
Town of Essex 6/30/2027 23,002 23,000 23,000 23,000 23,000 230,000 322,000 322,000.00
City of Torrington 6/30/2017 35,050 35,000 35,000 35,000 35,000 140,000 140,000.00
Town of Watertown 6/30/2017 74,648 75,000 75,000 75,000 75,000 300,000 300,000.00
TOTALS 2,487,534$ 1,055,022$ 1,096,272$ 1,139,586$ 1,185,066$ 230,000$ 4,705,946$ 4,706,000$
City of Hartford
No current
signed
agreement (1) 2,200,000 (2) 2,200,000 2,200,000 2,200,000 2,200,000 10,999,998
3,255,022$ 3,296,272$ 3,339,586$ 3,385,066$ 2,430,000$ 15,705,944$
Notes:
PILOT payments are based upon a percentage of estimate taxes that would be due based upon annual assessed value
Based upon review of the Host Community agreement
(1) PILOT agreement has expired as of June 30, 2013 and a new agreement has not been signed
(2) Amount budgeted for fiscal year 2014. No changes projected out for next 5 years
CONNECTICUT RESOURCES RECOVERY AUTHORITY
JUNE 30, 2013
SCHEDULE OF PILOT PAYMENTS DUE TO HOST COMMUNITIES

Comprehensive Operational Review of CRRA October 30, 2013
The information contained herein is subject to the disclaimer presented on page 1 of this document.
Page 78
Task IV A review and analysis of CRRA’s operations, including, but not limited to, human resources, facilities use, information technology services, and identification of potential operating efficiencies, including, but not limited to, the following:
Operational Assessment
a) A description of each service provided by the Authority (waste-to-energy, waste collection, etc.), including information regarding the income generated by each service, each service’s contribution to the total income of the Authority, and the change in earnings over the past five years.
b) A description of its projects, recent developments and future plans.
c) A description of pertinent cyclical factors, major business problems it faces, or relevant government regulations and restrictions (both federal and state).
d) A description of major external factors that could affect the Authority.
Background
See the narrative included in section for Task V for the report related to the above activities.
Organization Assessment
e) A list of employees by department, including skills, time with the Authority, absentee rates, and turnover rates.
f) A description of CRRA’s compensation-wage structure including the formal salary plan with pay grades, salary guidelines, and policies related to any pay increases, promotions, or bonuses.
g) A description of all fringe benefits, vacation policies, and group life and health insurance plans.
h) An assessment of whether lost employees can easily be replaced from the local labor pool or if specialized skills and training are required; and any specific training or apprenticeship programs provided by the Authority.
i) A description of the Authority’s key executives, including names, positions, duties, and responsibilities, years with the Authority and in the position, career path at the Authority, compensation package, and expenses.
j) An accounting of all employment contracts between executives and the Authority.
k) A description of the Authority’s policies for insurance, holidays, vacations, sick leave and any other benefit for management.
l) The identification of any backup personnel for key executive positions and what qualifications are required to hold those positions.

Comprehensive Operational Review of CRRA October 30, 2013
The information contained herein is subject to the disclaimer presented on page 1 of this document.
Page 79
m) An assessment of the effectiveness of the management team as a whole when compared to management of other resources recovery facilities operating in this state, to the extent possible.
Activities Performed
As part of the Organizational assessment, the following people were interviewed:
Erik Womack, Director of HR & Administration
Virginia Raymond, Operations Manager
Donald Stein, Chairman CRRA Board
Additionally, the Director of HR and Administration provided documentation including, the employee handbook, applicable policies, organization charts, position descriptions, job descriptions, etc. that were reviewed as part of the assessment. A detailed list of these documents is provided in Appendix A.
Findings
The following items were noted during the assessment of CRRA’s organization and the applicable policies.
While CRRA management has considered and supported certain strategic recommendations (e.g., implementation of the first single stream recycling facility, consideration of an anaerobic digester for South Meadows, attempt to site a residue ash landfill), competitors have successfully implemented measures in order to alternatively generate profits and lower costs.
The following are a few of the strategic recommendations that CRRA has implemented or supported:
Considered Anaerobic Digester for South Meadows facility in 2012 and had previously planned to deploy in Waterbury in 2007-2008.
Implemented first single stream recycling facility, which included replacing 15 year old machinery.
Attempted to site a residue ash landfill as the shift in control of RRF ash residue disposal capacity went from public to private entities.
Provides $10 ton rebate off tipping fees as an incentive to expand recycling and source reduction programs.
Supports legislation to compost source separated commercial and institutional food waste.
Plan to bond funds or investment alternatives in private equity or manufacturer equity for future projects.

Comprehensive Operational Review of CRRA October 30, 2013
The information contained herein is subject to the disclaimer presented on page 1 of this document.
Page 80
The following are a few of the strategic recommendations that some of CRRA’s competitors have implemented or supported:
Covanta representatives foresaw an increase in organic waste recovery and recently announced plans for an anaerobic digester facility in Bristol, CT.
Covanta representatives deployed the opportunity to successfully site an ash landfill.
Wheelabrator is in the process of devising a bilateral contract that will sell power from its waste to energy plants directly to the towns that supply MSW. This could create pricing which will improve the current revenue position of its facilities.
CRRA was offered a contractual situation from a private competitor where each facility utilizes the transfer station(s) that is closest and establishes terms so that both facilities can meet their capacity requirements while reducing transportation costs.
Additionally, since the expiration of the Mid-CT project contracts (which coincided with the payoff of the revenue bonds for the project), CRRA has seen a decrease in the number of contracting municipalities from 70 to 51, with 10 of those municipalities contracting with Covanta facilities.
CRRA’s senior management executives have a higher, average, base salary plus benefits (33%) when compared to other peer groups per the metrics available for review
Average Salary plus Benefits3
Peer Group Bottom
Performers Median Top Performers N
Average Salary plus Benefits
CRRA 5 $272,377
Government / Nonprofit – global sample
$90,000.00 $107,776.14 $140,464.46 6
Utilities – global sample
$44,238.17 $179,963.82 $216,666.67 13
Government, Nonprofit, & Utilities – United States
$116,358.80 $165,199.51 $207,490.96 6
There exists a risk that an employee with substantial institutional knowledge or unique skills and experience will leave the Authority.
There exists a risk of not being able to successfully recruit for the necessary skills and experiences to fill key open positions.
CRRA has been successful in retaining employees (over 40% of the employees have been with the Authority for 10 plus years). During the interview, the Director of HR and Administration speculated the reason for such longevity with the Authority was through a combination of
3 Source APQC OSBCSM Benchmarking Data. APQC is the World’s Leading Provider of Benchmarking and Knowledge Management Data - “Average fully loaded salary for senior management or executives” measure for the respective peer groups

Comprehensive Operational Review of CRRA October 30, 2013
The information contained herein is subject to the disclaimer presented on page 1 of this document.
Page 81
competitive compensation and the fact that the employee base enjoys the work. The uncertainty within the legislature and the unknown future of the Authority results a challenge in recruiting and forced a need for the board to place a freeze on merit based increases. The Authority does not have a bonus program, which also puts a strain on recruiting. All of which result in a risk of the Authority:
Not being able to successfully recruit for unique skills and experience
Not being able to retain employees that contain a wealth of institution knowledge
Additionally CRRA does not have formal training or an apprenticeship program for employees. If a required skill could not be found through recruiting, the Authority would potentially need to hire an under qualified candidate and at a cost have that employee trained externally or via on the job training.
Background
Overview of CRRA’s Employee Organization
The below table identifies the positions by department, the base salary ranges, the number of years the employee has been with the Authority, and a description of each position’s responsibilities. Details of senior management employees and positions can be found in the subsequent sections. CRRA currently employees 41 individuals in non-Senior Management positions and is budgeted for 45 positions. The four positions not filled are not actively being recruited by the Authority. The Authority does not track absentee rates or turnover rates. None of the employees filling any of the positions documented in the below table are under an employment contract.
Position Base
Salary
Base plus
cost of
Fringe*
(33%)
Years w/
Authority Position Description
Dir. of Budgets &
Forecasting $113,655 $151,162 7
Manages all budgeting, accounts receivable, and
pro forma forecasting.
Asst. Dir. Budgets & Cash
Management $91,556 $121,770 7 Budgets and cash management responsibilities.
Billing Coordinator $66,483 $88,422 27 Coordinates all billing of haulers and
municipalities.
Billing Coordinator - PT –
vacant Vacant Vacant n/a
Dir. of Accounting &
Financial Reporting $122,510 $162,938 12
Manages all accounting functions & financial
reporting.
Sr. Financial Accountant $78,601 $104,539 7 General accounting functions.
Staff Accountant - vacant Vacant Vacant n/a
Accounting Assistant/AP $48,135 $64,020 23 Accounts payable functions.
AP Specialist - vacant Vacant Vacant n/a
Env. Engineer Sr. $117,230 $155,916 13 Manages landfill programs and environmental
compliance.
Env. Compliance Manager $114,444 $152,211 12 Manages environmental regulatory compliance

Comprehensive Operational Review of CRRA October 30, 2013
The information contained herein is subject to the disclaimer presented on page 1 of this document.
Page 82
Position Base
Salary
Base plus
cost of
Fringe*
(33%)
Years w/
Authority Position Description
for air, water, and solid waste matters.
Environmental Engineer $62,424 $83,024 2 Provides engineering support for environmental
programs.
Landfill Coordinator $54,111 $71,968 10 Coordinates landfill operations.
Dir. HR & Administration $107,572 $143,071 4 Manages all HR functions, 401(k) plan, benefits, and payroll.
Receptionist/Admin. Assistant
$53,950 $71,754 31 Administrative responsibilities for all of CRRA.
IT Manager $95,997 $127,676 15 Manages all IT infrastructures.
Risk Manager $103,485 $137,635 38 Manages insurance policies for CRRA.
Document Control
Specialist $60,746 $80,792 27
Coordinates all document control for
organization.
HR Specialist/BOD
Administrator (salary range
for the AP/Payroll Administrator)
$58,083 $77,251 6 BOD administration and compliance; payroll
processing.
Government Relations
Liaison - vacant Vacant Vacant n/a
Dir. Recycling & Enforcement
$133,645 $177,747 25
Manages all recycling operations, enforcement,
waste flow, transfer stations, contract
administration.
Field Manager $89,843 $119,492 15 Manages day-to-day field operations; vendor
investigations.
Scale/Enforcement
Specialist** $43,389 $57,707 2 Operate scales and enforces MSW agreements.
Scale/Enforcement
Specialist** $43,389 $57,707 10 Operate scales and enforces MSW agreements.
Scale/Enforcement
Specialist** $43,389 $57,707 9 Operate scales and enforces MSW agreements.
Scale/Enforcement
Specialist** $43,389 $57,707 2 Operate scales and enforces MSW agreements.
Scale/Enforcement Specialist**
$43,389 $57,707 8 Operate scales and enforces MSW agreements.
Scale/Enforcement Specialist**
$43,389 $57,707 8 Operate scales and enforces MSW agreements.
Scale/Enforcement Specialist**
$43,389 $57,707 9 Operate scales and enforces MSW agreements.
Scale/Enforcement Specialist**
$43,389 $57,707 2 Operate scales and enforces MSW agreements.
Scale/Enforcement Specialist**
$43,389 $57,707 8 Operate scales and enforces MSW agreements.
Scale/Enforcement Specialist**
$43,389 $57,707 2 Operate scales and enforces MSW agreements.
Chief Engineer $140,691 $187,119 11 Manages operations of the EGF, PBF, and WPF.

Comprehensive Operational Review of CRRA October 30, 2013
The information contained herein is subject to the disclaimer presented on page 1 of this document.
Page 83
Position Base
Salary
Base plus
cost of
Fringe*
(33%)
Years w/
Authority Position Description
Operations Engineer $95,864 $127,499 3 Coordinates and reviews engineering plans for
WPF.
Facilities Manager $94,216 $125,308 26 Manages all of CRRA's facilities.
Project Manager $110,292 $146,688 26 Manages various construction, engineering and
development projects.
Operations Manager $101,007 $134,340 21 Manages power products, contracts and
consultants.
Sr. Operations Analyst $76,407 $101,621 2 Analyzes and develops financial projections;
manages contracts.
Contract & Procurement
Manager $87,394 $116,234 2
Manages all procurement processes: RFP, RFQ,
RFB
Buyer/Administrative Asst. $56,878 $75,648 9 Administers internal procurement and assists
Ops/Env staff
Dir. of Public Relations &
Education $109,425 $145,535 10
Manages all communication and public relations
programs.
Education Supervisor $69,772 $92,796 9 Supervises all activities at the Hartford Trash
Museum.
Educators – PT*** $24,262 $32,268 15 Conducts public education at Trash Museum.
Educators – PT*** $24,262 $32,268 11 Conducts public education at Trash Museum.
Educators – PT*** $24,262 $32,268 7 Conducts public education at Trash Museum.
* CRRA estimates its fringe cost at an average of 33% of base salary. Addresses the cost associated with the insurance and the other fringe benefit plans. CRRA does not maintain a bonus program.
** Salary figures are an average for the Scale/Enforcement Specialist positions.
*** Salary figures are an average for three Educator positions.

Comprehensive Operational Review of CRRA October 30, 2013
The information contained herein is subject to the disclaimer presented on page 1 of this document.
Page 84
The below table identifies the employee tenure durations by department. As shown below, over 40% of the employee base has been with the Authority for at least ten years.
Employee Count Tenure
Department 0-10 11-20 20+ Total
Accounting 1 1 1 3
Environmental 2 2
4
Field Operations 10 1 1 12
Finance 2
1 3
General Administration 1 1 2 4
Legal Services 1
1 2
Operations 3
2 5
Plant Operations 1 1 1 3
Public Relations 3 2
5
Total 24 8 9 41
Compensation, Adjustments, and Promotions
CRRA employee's compensation rate for the first six months is at a bi-weekly rate of (Bi-Weekly, Annualized Salary). The salary is payable in regular installments in accordance with the CRRA's general payroll practices and is subjected to customary withholding. After six months of employment, Employee's compensation rate is subjected to modification as recommended by the Organizational Synergy & Human Resources Committee and by the Board of Directors.
Market Progression Adjustment (MPA)
All full-time employees employed for more than one year whose salary is below the low end of their assigned salary range, in the low- to mid-range of the matrix are eligible for a market progression adjustment. CRRA will look to move employees toward the mid-level of the salary range as warranted. These employees must have full command of the job skills, relevant experience, time in current job, and job performance that meets expectations or higher. This adjustment is also based on organizational goals, budget and retention strategy. On an annual basis CRRA will analyze its pay structure to determine if a MPA is warranted. This adjustment takes into consideration the employee's across the board (ATB) increase and the merit increase for the given year.
Across The Board (ATB) Increases
ATB is awarded annually upon the start of each fiscal year to eligible staff. It represents a cost of living adjustment made to base pay. Adjustments are set at two percent of salary, or the Hartford /Connecticut/New England cost of living index, or an amount to be determined by management. Eligible staff members include all full- and part-time regular employees of the CRRA. There was an ATB of two percent administered effective for fiscal year 2014 (7/1/13), which is reflected in the base salaries presented in the table above.

Comprehensive Operational Review of CRRA October 30, 2013
The information contained herein is subject to the disclaimer presented on page 1 of this document.
Page 85
Merit Increases
All full- and part-time CRRA employees are eligible for merit increases. Merit increases are awarded annually at the start of the calendar year from a designated budget pool established for merit increases in the given fiscal year budget. This budget pool will consist of funds, specified in the fiscal year budget that the CEO recommended to the Board of Directors through the Board's Human Resources Committee. Individual employee merit increases range from zero to eight percent and are dependent on relative employee performance as determined by the CRRA Performance Management Program. Several factors will be taken into consideration when awarding merit increases, including: salary within salary range and overall performance levels.
Internal Pay Equity Increases
Internal equity issues occur when two or more people with similar qualifications, experience and tenure in the same position have a substantial salary difference. Internal pay equity increases should not exceed ten percent and must be approved by the CEO and reported to the Board of Directors Human Resource Committee.
Promotional Increases
A promotional increase is warranted when an employee moves to a new position with greater responsibility than the employee's previous position. Promotional increases may not exceed the second quartile of the new salary range, except in cases where the market or employee experience dictates otherwise. Employees receiving promotional increases during the year are still eligible for ATB and merit increases.
Temporary Promotions
Employees serving in positions with greater responsibility are eligible, but not entitled to a temporary promotional increase during the term of service. This increase is not to exceed the second quartile level of the higher salary range, except in cases where the market or employee experience dictates otherwise. Temporary pay is awarded at the discretion of the CEO.
Downgrades/Demotions
A downgrade or a demotion occurs when an employee moves to a position that has a lower salary range than the incumbent's previous position. This move is either due to performance issues or an organizational / administrative change not under the employee's control. In both cases if the employee's current salary is 25% above the maximum level of the new range, they will forgo ATB and merit increases until the salary is at the maximum level or lower. In some cases, at the discretion of the CEO, the affected employee's salary may be reduced.
Bonus
CRRA does not have a bonus payout.
Fringe Benefits and Insurance
CRRA employees are entitled to participate in such employee benefits, plans or arrangements as are generally made available by CRRA to its Senior Management employees. CRRA estimates its fringe cost at an average of 33% of base salary. The fringe cost will vary depending on the employees 401k and benefits elections.
Comprehensive Operational Review of CRRA October 30, 2013
The information contained herein is subject to the disclaimer presented on page 1 of this document.
Page 86
Medical Coverage
CRRA provides a plan or choice of plans which covers basic and major medical costs (including prescription drugs) for employees and their dependents, including civil union partners. A separate vision plan is available. Part-time employees scheduled for 20 hours or more a week are eligible for medical coverage only.
Medical Coverage Opt-Out
The CRRA offers its employees a cash incentive to waive health care coverage. These arrangements, known as opt-out plans, are usually aimed at employees with working spouses who have group-health coverage through another employer, or pension plan with retiree medical coverage. CRRA provides employees with a cash incentive paid bi-weekly for exempt employees and hourly for non-exempt employees.
Dental Coverage
CRRA provides a plan, which covers dental costs incurred by each employee and the employee's enrolled dependents and civil union partners.
401(k) Plan & State of CT 4S7(b) Plan
CRRA provides a defined contribution program the first of the month after six months of continuous employment. Each pay period, CRRA will make Non-Discretionary Matching Employer Contributions to the plan on the employee’s behalf in the amount equal to 100% of the employee’s compensation contributed to the plan. However, contributions in excess of five percent of the employee’s compensation for the period in question is not matched by CRRA. In its discretion, for each pay period, CRRA will contribute Fixed Non-Elective Employer Contributions to the plan on the employee’s behalf in the amount equal to five percent of the employee’s compensation, if the employee is an active eligible participant. Employees can participate in the State of Connecticut's 457(b) Defined Contribution Plan after six months of continuous employment. CRRA does not match employee contributions to this plan. The plan is solely administered by the State of Connecticut Comptroller's Office and ING.
Workers' Compensation
Under Connecticut's Worker's Compensation Act, an employee is eligible for benefit payments for any accident, injury or occupational disease that occurs while the employee is engaged in the performance of his or her duties. Each employee must report all injuries immediately to his supervisor, if not available directly to the Risk Manager, who will make a full report to the Risk Manager. The employee will receive his normal net pay (not including overtime) during any leave of absence due to injury, not to exceed six months. An employee so disabled may be asked by their supervisor to assume "light" duty work.
Short-Term and Long-Term Disability Insurance
If a full-time employee is absent due to a non-occupational accident or illness, he is eligible for paid disability insurance benefits.
Voluntary Life Insurance
CRRA, under the group life insurance, offers employees the opportunity to purchase additional voluntary life insurance, the cost of which is the responsibility of the employee.

Comprehensive Operational Review of CRRA October 30, 2013
The information contained herein is subject to the disclaimer presented on page 1 of this document.
Page 87
Disability Insurance
CRRA provides short-term and long-term disability insurance for accidents or illnesses not covered by worker's compensation. Disability insurance will provide a weekly payment not to exceed 66.67% of the regular weekly pay in the event of a non-occupational accident or illness.
Liability Insurance
In accordance with Connecticut General Statutes § 1-125, CRRA indemnifies employees, directors and officers who are performing within the scope of their duties of employment against financial loss and expense, legal fees and costs, if any, arising out of any claim, demand, suit or judgment by reason of alleged damage or injury, if the conduct at issue was not wanton, reckless, willful or malicious.
Life Insurance (Company Paid and Voluntary)
The current group term life and supplemental life plans, underwritten by Lincoln Financial, will continue to be offered for the plan year beginning on January 1, 2013. The group term life plan provides each covered member a benefit of two times his or her annual earnings to a maximum of $500,000. The group voluntary life plan allows employees to purchase increments of $10,000 of term life insurance up to five times the employee’s annual earnings, up to 50% of the employee’s voluntary life benefit up to $100,000 for the employee’s spouse and up to $10,000 for the employee’s children. While the group term life plan is fully paid by the CRRA, the voluntary life plan is paid by the employee via a payroll deduction.
Employee Assistance Program
CRRA has an employee assistance program to aid employees, dependents including, civil union partners, with solutions and resources to meet life's challenges.
Wellness Reimbursement
All fulltime and part-time employees are eligible for the employee Wellness Reimbursement Plan following 90 days of employment. The maximum allowable reimbursement amount per employee per fiscal year is $375.
Short-Term and Long-Term Disability Coverage
The group short- and long-term disability plans are underwritten by Lincoln. The short term disability plan provides a weekly income replacement of 66.67% up to a maximum of $2,500 per week. Benefits commence on the first day following disability due to accident and on the eighth day for disability due to illness and continue up to a maximum benefit period of 26 weeks. The long-term disability plan provides a monthly income replacement of 70% up to a maximum of $10,000 per month. Benefits commence upon the exhaustion of the short-term disability benefit and continue up to a maximum benefit period of the normal social security retirement age. This plan is fully paid by CRRA and is at no cost to the employee and all benefits received under these plans are treated as taxable income.
Training and Tuition Reimbursement
CRRA offers of training and educational opportunities for employees who wish to improve their job efficiency and quality of work, including payment of fees for work -related conferences or seminars and a tuition reimbursement.

Comprehensive Operational Review of CRRA October 30, 2013
The information contained herein is subject to the disclaimer presented on page 1 of this document.
Page 88
CRRA employees are eligible to take training seminars appropriate to their area of responsibility or to solid waste management generally. Training can include seminars and short courses in such areas as administrative skills, word processing, computer operation, governmental accounting and finance, and project management. Although CRRA does not require or request that any employee further their education or that they take particular courses or receive specific training for a job, CRRA provides its employees with the means to voluntarily further one’s education. CRRA will consider requests for financial assistance from employees interested in furthering their education and improving their job effectiveness. Total calendar year reimbursement per employee shall not exceed $5,000.
Time Off
CRRA employees are entitled to participate in such employee time off plans or arrangements as are generally made available by CRRA to its Senior Management employees.
Vacation
Full-time employees accumulate vacation leave at the rate two times their normal monthly accrual. Employees are eligible to start accruing the first of the month following their date of hire. Part-time employees are eligible the first of the month following their date of hire and if they are scheduled to work a minimum of 20 hours per week. Part-time employees accumulate vacation leave at a rate of 3/4 days per month. Part-time employee's December accrual happens one month in advance to account for the "no carry over" provision. Employees scheduled for less than 20 hours per week are not eligible for paid vacation time. After ten years of service with CRRA, full-time employees will receive an additional vacation day for each year of service up to fifteen years, as follows:
Calendar Years of Total Vacation Days
Calendar Years of Total Vacation Days
1st Up to 15
2nd -10th 15
11th 16
12th 17
13th 18
14th 19
15th and up 20
Vacation time will not accrue during any period of time in which, for more than one week the employee is on any type of leave and CRRA is not paying the employee's normal wages. Vacation time cannot run a negative balance. If an employee resigns from CRRA, and follows the Notice of Resignation Policy (Sec. 11.1) they will be paid their vacation balance as it stands up to the resignation date based on a single monthly accrual. Employees who have a negative vacation balance at their date of resignation will have their final paycheck adjusted. Full-time employees may carry over vacation days from year to year with a

Comprehensive Operational Review of CRRA October 30, 2013
The information contained herein is subject to the disclaimer presented on page 1 of this document.
Page 89
maximum accumulation of sixty (60) days. Full-time employees can rollover a maximum of two weeks of vacation time per year. Full-time employees can continue to accrue additional vacation days in any calendar year in which they have reached the maximum accumulation of 60 days. However, any such additional accrued vacation days above the maximum accumulation of 60 days will be lost if not used by the ending date of the pay period which includes the last pay period of each such calendar year. Any vacation days not used by part -time employees will be lost if not used by the ending date of the pay period, which includes the last pay period of each calendar year. Holidays occurring during vacation are not charged against vacation leave. For full time employees, any unused paid vacation at the end of a calendar year shall be carried over, in full, for use in the next calendar year. As of January 1, 2013, Employee received fourteen personal days for calendar year 2013. As of June 30, 2013, employees earned four weeks of vacation for calendar year 2013.
Holidays
CRRA observes 12 paid holidays per calendar year, including one floating holiday to be used at the employee's discretion. If a CRRA observed holiday falls during an employee's vacation period, the holiday will not count as a vacation. Part-time employees are eligible to receive holiday pay only for regularly scheduled hours on the particular holiday. Paid holidays are not available to employees who, for more than one week, are on any type of leave for which CRRA is not paying the employee's normal wages as of the workday before or after the holiday. Employees, who are required by the CEO or by virtue of their job that works on a holiday, will receive another day off with pay at a mutually agreeable time, as approved by their supervisor.
Personal Leave
Ten paid personal leave days are granted to each full-time employee of CRRA per calendar year. Four paid personal leave days are granted to each part-time employee of CRRA per calendar year, provided that such employee is scheduled to work a minimum of 20 hours per week. Fourteen personal leave days are granted to each Senior Management employee of CRRA per calendar year. Personal leave days may be used for any purpose designated by the employee and must be used within the calendar year. Employees may rollover any accrued but unused personal time to any subsequent year; personal time rollover days are a part of the 60-day maximum accumulation of rollover time. An employee can request a personal leave balance payout at the conclusion of the calendar year. The balance of Personal Leave days are paid out upon termination in accordance with the Notice of Resignation Policy.
Bereavement Leave
All employees are eligible for this benefit from their date of hire. If there is a death in the immediate family, all employees will be eligible for an appropriate period of paid bereavement leave up to three regularly scheduled working days. Immediate family includes spouse, including civil union partners, child, parent, grandparent, brother, sister, significant other, mother in-law, father in-law, sister-in-law, brother-in-law or other relative living in the same household. Supervisors will give favorable consideration to eligible employees for requests for vacation leave or leave without pay for deaths of relatives or friends other than those listed above, or for extension of the paid bereavement leave provided. CRRA reserves the right to request verification of the death and the person's relationship to the employee.

Comprehensive Operational Review of CRRA October 30, 2013
The information contained herein is subject to the disclaimer presented on page 1 of this document.
Page 90
Jury Duty
Employees summoned for jury duty or any other civic duty which by law requires the employee's appearance before a court or other public body will receive their regular salary for days that attendance is required. Jury pay or other fees paid by the court will be signed over to CRRA because the employee received their regular pay.
Training
With the approval of the President, a leave of absence with pay may be granted for the purpose of allowing a regular employee to participate in conferences, seminars, training courses and other official activities which enhance the employee's performance.
Military Training/Duty
Any regular full-time employee participating in required field training in the National Guard is entitled to a leave of absence with pay for the period of such field training up to a maximum of one month per calendar year. The amount of compensation paid to such employee for such leave of absence is the difference between the compensation for military and the total amount of the employee's regular salary at CRRA. If the compensation for military service is equal to or greater than the employee's salary at CRRA for the period covered by such military leave, then no payment will be made, except that normal payroll deductions for 401 (k) and insurance purposes will be paid during such leave. Additional leaves for required training are granted without pay. An employee called to active military duty, or any employee who volunteers for the same will be granted a military leave of absence without pay for the period of military service in accordance with applicable state and federal laws. Employees must submit copies of military orders to their supervisors with as much advance notice as possible prior to taking military leave. Eligibility for reinstatement at CRRA after military duty is completed will be determined in accordance with applicable laws.
Assessment of Key Skills/Experience
Per discussions with the Director HR & Administration and the Operations Manager, the following positions have been identified as positions that require unique skills or experience or that are currently filled by employees that contain knowledge the Authority would be inhibited by if the employee were to leave:

Comprehensive Operational Review of CRRA October 30, 2013
The information contained herein is subject to the disclaimer presented on page 1 of this document.
Page 91
Department Position Factor
Finance Dir. of Budgets & Forecasting
Asst. Dir. of Budgets & Cash Management
Billing Coordinator
Positions require public sector experience and background
Environmental Sr. Environmental Engineer
Environmental Compliance Manager
Landfill Operations Coordinator
Environmental Engineer
Experience with landfill operations and compliance
Air, water and solid waste regulations
Experience with landfill operations
Environmental engineering experience
Each of these positions requires skill of multiple facets that only come through experience. There is a small market for that experience
Field Operations Dir Recycling & Enforcement Experience in recycling and contract administration. Relationships and knowledge of existing contracts would be lost
Plant Operations Chief Engineer
Operations Engineer
Facilities Manager
Positions require adequate experience with:
Operation of a solid waste management program or facility
Boiler and air pollution control equipment and operations
Engineering experience preferably in the resource recovery industry
Strong relationship management skills required
Institutional knowledge
Operations Project Manager
Operations Manager
Institutional knowledge
Overview of CRRA’s Executive Organization
CRRA currently employs four full-time individuals in Senior Management positions and one individual as a part time employee of CRRA that is considered as a Senior Management position. Only the CEO, CFO and the Strategic Financial Advisor have employment contracts. The CEO signed a contract in July 2005 that contained an expiration date of June 30, 2008. This contact contains a two-year automatic renewal clause, effective post the June 30, 2008 date, which the agreement remains in effect under. CRRA may cancel the contract by providing written notice to the CEO at least twelve months prior to the end of any renewal term.

Comprehensive Operational Review of CRRA October 30, 2013
The information contained herein is subject to the disclaimer presented on page 1 of this document.
Page 92
The Senior Management positions are:
Position Years w/ Authority
Base Salary
Base plus cost of
Fringe* (33%)
Responsibilities Comments
CEO 11 $292,586 $389,139 Oversight of all CRRAs
operational matters
CFO n/a $155,000 $206,150
Oversight of all of CRRAs financial
operations and all accounting matters
Director of Operations and Environmental
Affairs
13 $188,018 $250,063 Oversight of all of
CRRA’s Environmental Affairs and Operations
Director of Legal Services
9 $175,834 $233,859 Oversight of all of
CRRA’s legal matters
Strategic Financial Advisor
11 $212,538 $282,675
Provides finance and accounting advice,
assistance to the CFO and CRRA’s
administration
Annual Salary until Feb ’14 when he
will be compensated for 12 hrs a week @ $109
an hour
* CRRA estimates its fringe cost at an average of 33% of base salary. Addresses the cost associated with the insurance and the other fringe benefit plans. CRRA does not maintain a bonus program
It should be noted that the Senior Management employee compensation programs is the same as the regular employee compensation program, where there are no additional senior executive benefits for cash bonuses, 401(k), insurances, fringe benefits, etc. The Senior Management executives are eligible for the same insurance and fringe benefits, and comply with same time-off polices as base level employees as described in the preceding sections. Senior Management executives have no pre-approved budget/expense account for travel and entertainment expenses. Travel and entertainment expenditures are either reimbursed or require prior approval through CRRA’s procurement process. The table below compares average, total compensation (total compensation plus cost of fringe benefits) of CRRA’s senior management employees to metrics for senior management or executives from the Government/Nonprofit and the Utilities peer groups per APQC benchmarking. In the table below:
Bottom Performers represents the performance level where 25 percent of all responses fall below.
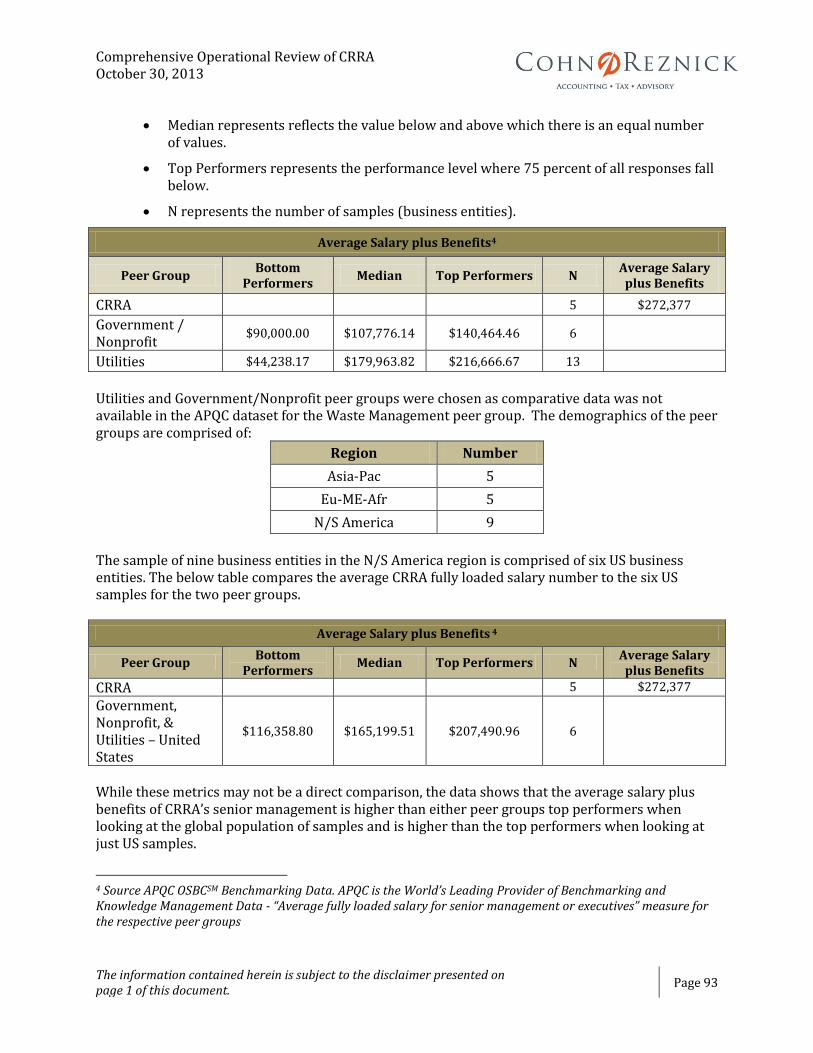
Comprehensive Operational Review of CRRA October 30, 2013
The information contained herein is subject to the disclaimer presented on page 1 of this document.
Page 93
Median represents reflects the value below and above which there is an equal number of values.
Top Performers represents the performance level where 75 percent of all responses fall below.
N represents the number of samples (business entities).
Average Salary plus Benefits4
Peer Group Bottom
Performers Median Top Performers N
Average Salary plus Benefits
CRRA 5 $272,377
Government / Nonprofit
$90,000.00 $107,776.14 $140,464.46 6
Utilities $44,238.17 $179,963.82 $216,666.67 13
Utilities and Government/Nonprofit peer groups were chosen as comparative data was not available in the APQC dataset for the Waste Management peer group. The demographics of the peer groups are comprised of:
Region Number
Asia-Pac 5
Eu-ME-Afr 5
N/S America 9
The sample of nine business entities in the N/S America region is comprised of six US business entities. The below table compares the average CRRA fully loaded salary number to the six US samples for the two peer groups.
Average Salary plus Benefits 4
Peer Group Bottom
Performers Median Top Performers N
Average Salary plus Benefits
CRRA 5 $272,377
Government, Nonprofit, & Utilities – United States
$116,358.80 $165,199.51 $207,490.96 6
While these metrics may not be a direct comparison, the data shows that the average salary plus benefits of CRRA’s senior management is higher than either peer groups top performers when looking at the global population of samples and is higher than the top performers when looking at just US samples.
4 Source APQC OSBCSM Benchmarking Data. APQC is the World’s Leading Provider of Benchmarking and Knowledge Management Data - “Average fully loaded salary for senior management or executives” measure for the respective peer groups

Comprehensive Operational Review of CRRA October 30, 2013
The information contained herein is subject to the disclaimer presented on page 1 of this document.
Page 94
From a career growth perspective the next logical step for the CFO, Director of Operations and Environmental Affairs, and the Director of Legal Operations would be the position of the CEO. They would be the internal candidates considered for an opening at the CEO position if it were to become vacant. The Strategic Financial Advisor is a part time employee, the former CFO of CRRA, working in a part time capacity to support the transition to the new CFO. If one of the Senior Management positions below CEO were to become vacant CRRA would push the responsibilities of the vacated position up to the position of the CEO until such time that a replacement could be found. Responsibilities would not be pushed down to lower level employees. If the CEO position were to be vacated the responsibilities of the position would most likely fall to the position of the Director of Operations and Environmental Affairs, as the individual holding that position currently is the most qualified to act as interim CEO. This arraignment would remain effective until such time that the Board of CRRA made a decision on the position of CEO.
Senior Management’s Effectiveness
A number of strategic recommendations were provided to CRRA during the past ten years, as outlined in Task I. In order to identify the degree of management effectiveness, the following records and facts were considered:
A review of the statute that initiated CRRA (Chapter 466e* Solid Waste Management Services Act), which provides the legislative finding as well as the purpose and powers of the Authority:
o Considering Sec 22a-258, Legislative Finding - "It is found and declared...
...that technology and methods now exist to dispose of solid wastes and recover resources with commensurate environmental benefits;
that coordinated large-scale processing of solid wastes may be necessary in order to achieve maximum environmental and economic benefits for the people of the state;
that the amounts of solid waste being produced within the state of Connecticut are adequate to sustain such large-scale processing;
that the geography and population density of the state are such as to enable and facilitate the effective and economic regional accumulation of solid wastes;
that the development of systems and facilities and the use of the technology necessary to initiate large-scale processing of solid wastes have become logical and necessary functions to be assumed by state government;
that the provision of solid waste disposal services to local governments at reasonable cost, through the use of state governmental powers and capabilities, would supply valuable assistance to such local governments..."

Comprehensive Operational Review of CRRA October 30, 2013
The information contained herein is subject to the disclaimer presented on page 1 of this document.
Page 95
o Considering Sec 22a-262, Purpose - "Assistance in the development of industries, technologies and commercial enterprises within the state of Connecticut based upon resources recovery, recycling, reuse and treatment or processing of solid waste."
o Considering Sec 22a-265, Power - “Make and enter into any contract or agreement necessary or incidental to the performance of its duties and execution of its powers;"
o Considering Sec 22a-267 Powers, fiscal- “Receive funds from the sale of the bonds or other obligations of municipal and regional authorities and from the sale of obligations of the Authority and its real and personal properties;
“… In connection with, or incidental to, the issuance or carrying of bonds, or acquisition or carrying of any investment or program of investment, the Authority may enter into any contract which the Authority determines to be necessary or appropriate to place the obligation or investment of the Authority,..."
“…In connection with, or incidental to, the issuance or carrying of bonds, notes or other obligations or entering into any of the contracts or agreement referred to in subparagraph (A) of this subdivision, the Authority may enter into credit enhancement or liquidity agreements, with payment, interest rate, currency, security, default, remedy and other terms and conditions as the Authority determines;”
A review of the strategic considerations reported to CRRA over time, as well as a concurrent analysis of similar strategic moves made by competitors in the state as well as shifts / trends in the market.
o In Task 1, the strategic report #3 “State of Connecticut Solid Waste Management Plan, State of Connecticut, July 2006 (Amended December 2006)” outlined critical issues or decisions to be addressed by “Regional Waste Authorities” as well as major recommendations to be addressed by all stakeholders, including those impacting CRRA in some capacity. These recommendations include effective and efficient MSW management, recycling and source reduction and composting programs, local recycling ordinances enforcement, MSW disposal diversion, disposal capacity and self-sufficiency, RRF ash landfill ownership, statutory changes, including others. Please note that certain recommendations are discussed in greater detail throughout the assessment and have re-surfaced and outlined in subsequent strategic reports.
o In response to the 2006 plan, outlined in subsequent strategic reports or initiatives, and governed with certain powers in Chapter 446e of the Solid Waste Management Services Act, management has explained the following strategic actions were taken and are summarized below. Please note that these objectives are discussed in greater detail throughout this report.
1) Support and actively work towards the fiscal year 2024 target disposal
diversion rate of 58%.

Comprehensive Operational Review of CRRA October 30, 2013
The information contained herein is subject to the disclaimer presented on page 1 of this document.
Page 96
2) Re-contracted with communities entering the Mid-Conn, Bridgeport and Wallingford facilities.
3) Considered Anaerobic Digester for South Meadows facility in 2012 and had previously planned to deploy in Waterbury in 2007-2008.
4) Implemented first single stream recycling facility, which included replacing 15 year old machinery.
5) Attempted to site a residue ash landfill as the shift in control of RRF ash residue disposal capacity went from public to private entities.
6) Provides $10 rebate off tipping fees as an incentive to expand recycling and source reduction programs.
7) Deployed education programs within the newly built Trash Museum.
8) Enforced local recycling ordinances, disposal procedures, and delivery standards for recyclable materials in MSW loads.
9) Supported recent C&I legislature for source-separated waste.
10) Supports legislature to compost source separated commercial and institutional food wastes.
11) Plan to bond funds or investment alternatives in private equity or manufacturer equity for future projects.
12) Promotes site ownership and state-wide reach as an advantage to the Authority for future projects.
In conjunction with the market assessment, discussion with competitors and municipality selectmen, the following initiatives have been deployed by CRRA competitors or have not been addressed by CRRA, such as:
Covanta representatives foresaw an increase in organic waste recovery and recently announced plans for an anaerobic digester facility in Bristol, CT.
Covanta representatives deployed the opportunity to successfully site an ash landfill.
Wheelabrator is in the process of devising a bilateral contract that will sell power from its waste to energy plants directly to the towns that supply MSW. This could create pricing which will improve the current revenue position of its facilities.
CRRA was offered a contractual situation from a private competitor where each facility utilizes the transfer station(s) that is closest and establishes terms so that both facilities can meet their capacity requirements while reducing transportation costs.
Through discussion with a Selectman from a local Southwest Region municipality, it was stated that “individual member communities do not recognize the need to involve CRRA any longer. Those communities have more than a few employees that have greater experience in the Project than CRRA does, and are perfectly capable of continuing (i.e. renegotiating) a successor agreement with Wheelabrator. CRRA would bring no value to the Project as its only role at this point is that of billing the respective communities.” Additionally, since the expiration of the Mid-CT project

Comprehensive Operational Review of CRRA October 30, 2013
The information contained herein is subject to the disclaimer presented on page 1 of this document.
Page 97
contracts that coincided with the payoff of the revenue bonds for the project, CRRA has seen a decrease in the number of contracting municipalities from 70 to 51, with 10 of those municipalities contracting with Covanta facilities.
Valuation
n) An identification and description of each real property owned by CRRA and property interests of CRRA, including its location and the nature of the interest held by CRRA (e.g., ownership, leasehold, licensee, etc.).
o) A description of the age, book value, depreciation method, estimated remaining life, date on which it will become obsolete, and any improvements that will be required within the next 3 years.
p) All appraisals and engineering reports regarding the facilities/properties, and a description of any maintenance or repairs performed over the last 5 years.
q) A description of the types and amount of insurance carried on buildings and land and any commitments to buy or lease other properties.
r) A description of any encroachments by CRRA onto real property owned by others and encroachments by others onto real property owned by CRRA.
s) A review of the machinery and equipment owned, leased or used by the Authority.
t) A description of each piece of equipment owned, leased or used by the Authority including its location, age, book value, depreciation method, estimated remaining life, CRRA’s interest (e.g. ownership, lease) and date on which it will become obsolete.
u) A description of each contract, lease or other agreement in place regarding such equipment, including, but not limited to, the parties, the term, and amount owed.
v) All appraisals and engineering reports regarding the equipment and description of any maintenance or repairs performed over the last 5 years.
Activities Performed
The review and analysis of all materials related to the fair value measurements for all fixed assets involved collecting and reviewing documents supplied by the CRRA including:
GES Engineers & Appraisers, LLC Replacement Cost and Depreciated Cost Analysis Worksheets dated 2006 for the 4 Waste Transfer Stations
George E. Sansoucy, PE, LLC Appraisal Report of Mid-Connecticut Waste Processing and Waste-to-Energy Facilities, Hartford, dated 2011
CBRE Land Appraisal, 80 acres Under Mid-Connecticut Waste Processing and Waste-to-Energy Facilities, Hartford, dated 2011 (for use by George E. Sansoucy in his valuation of the entire facility).
GES Engineers and Appraisers LLC Draft Appraisal of the Mid-Connecticut Jet Turbine Facility dated 2010
A Ground Lease between CRRA and Essex dated July 12, 2012

Comprehensive Operational Review of CRRA October 30, 2013
The information contained herein is subject to the disclaimer presented on page 1 of this document.
Page 98
Assessor record cards for each property
CRRA Statement of Property Values dated April 1, 2012 to April 1, 2013
Comparable Land and Improved Property Sales/listings extracted from CoStar and Loopnet
Internal CRRA memos on the condition of various components in the facilities
Independent Engineering Audit of the Mid-Connecticut Materials Recovery Facility dated December 2012 prepared by D&B Engineers and Architects, P.C.
In addition, several conversations were held with Virginia Raymond, of CRRA as well as George Carlson of CRRA, who had direct knowledge of many of the facilities and were able to describe the history and use of each property.
Findings
The information that was able to be reviewed was relatively dated in nature, and had inconsistencies with regard to building sizes, land sizes, and overall lack of descriptions, especially with regard to the machinery and equipment. Public records were used primarily as the source for property information, in addition to GIS mapping programs to identify specific property locations. The local tax assessor’s offices generally provided very good information regarding the site areas, building measurements, and date of construction and their market value appraisals of the properties were considered to be credible. The depreciated replacement cost worksheets prepared by GES Engineering were all dated from 2006, and required updates to arrive at measurements for the current period, and did not include any land valuations of the various assets. The market value appraisals prepared on the Mid-Connecticut WTE Plant and the Jet Facility were informative, although the basis for opinions of land value for the Jet Facility, and functional and economic obsolescence measurements, impacted the credibility of the final valuation conclusions. Given the lack of information and the dated materials, it is suggested that the measurements all be updated with new appraisals to help define primary property information, property conditions and market values. Of major concern is the disparity in market values for the power facilities, as the Appraised Value by the assessors is very different than the value presented in the recent appraisal report prepared by GES. Total Market Value: Wheelabrator-Bridgeport RRF (2,250 TPD) $282,453,910 (Assessor’s MV Building & Land) Mid-Connecticut RRF (2,849 TPD) $60,771,400 (Assessor’s MV Building & Land) Mid-Connecticut RRF (2,849 TPD) $30,000,000 (Assessor’s MV Building & Land)

Comprehensive Operational Review of CRRA October 30, 2013
The information contained herein is subject to the disclaimer presented on page 1 of this document.
Page 99
Summary of Available Valuation Information and Appraisals of CRRA Assets
Appraised Value (Year)
City Land Building Total M&E Building Total
Asset #
1 Wheelabrator Site Bridgeport 2,194,500$ (2) 2,194,500$ N/A N/A
2 Recycling Center & Trash Museum Hartford 1,199,870$ 3,584,620$ 4,784,490$ 616,805$ 6,529,368$ 7,146,173$
3 171 Murphy Road (Vacant Warehouse) Hartford 209,090$ 365,470$ 574,560$ -$ 597,708$ 597,708$
4 Mid-Connecticut WTE Facility/Plant Hartford 16,828,800$ 43,942,600$ 60,771,400$ 331,120,650$ 121,316,755$ 452,437,405$ $30,000,000 (3) 2011
5 Jets Facility (Reserve Road) Hartford (1) (1) (1) (1) (1) (1) $35,000,000 (4) 2010
6 Torrington WTS (Old Dump Rd) Torrington 155,510$ 202,040$ 357,550$ 455,375$ 1,748,820$ 2,204,195$ $977,416 (5) 2006
7 Watertown WTS (Echo lake Road) Watertown 572,300$ 309,900$ 882,200$ 394,633$ 1,701,521$ 2,096,154$ $1,903,310 (5) 2006
8 Recycling Center & Garbage Museum Stratford 1,206,000$ 3,445,100$ 4,651,100$ 303,304$ 6,254,433$ 6,557,737$
9 Ellington WTS (Sadds Mill Road) Ellington 1,183,850$ 529,490$ 1,713,340$ 598,092$ 970,118$ 1,568,210$ $865,239 (5) 2006
10 Essex WTS (Town Dump Road) Essex (6) 340,900$ 340,894$ 182,138$ 1,401,652$ 1,583,790$ $933,825 (5) 2006
23,549,920$ 52,720,117$ 76,270,033$ 333,670,996$ 140,520,374$ 474,191,371$
(1) The Jet's Facility was included in the Mid-Connecticut WTE Plant by the Assessor, and in the Insured Value Report
(2) Assessor's Appraised Value of Wheelabrator's Building/Plant Improvements was $280,259,410, CRRA owns land only
(3) $30,000,000 Market Value = Mid-Connecticut Plant Including 80 acres of land (valued separately at $13,000,000 or $162,500/acre).
Appraised Value of the Operating Plant (WPF, WTE, & EGF) included the land, but excludes the Twin Jet Turbine (Peaker) Facility
(4) $35,000,000 Market Value = Twin Jet Turbine Facility including 2+/- acres of land located within the 80 acre
Mid-Connecticut Plant site. The 2+/- acre Jet site was valued at $3,000,000 or $1.5M / acre by the same appraisal firm above.
(5) GES Prepared Depreciated Replacement Cost Analysis Worksheets for the WTS buildings in 2006; (Excludes land and M&E)
(6) CRRA leases land from the Town of Essex, and owns the building until the lease expires.
Assessor's Appraised Market Value Insured Values of M&E and Buildings
GES Engineers & Appraisers

Comprehensive Operational Review of CRRA October 30, 2013
The information contained herein is subject to the disclaimer presented on page 1 of this document.
Page 100
Background
CRRA Property Owned
The following property information was identified from limited information provided by CRRA, including 2006 engineer’s depreciated cost analysis worksheets of the operating waste transfer stations and two appraisals dated 2010 and 2011 involving the Mid-Connecticut WTE, and conversations with CRRA representatives. Much of the information was taken from public records; attempts were made to confirm this data with CRRA, although not all of the measurements could be verified. The following schedule of insured values obtained from CRRA entitled “Statement of Property Values - April 1, 2012- April 1, 2013”, includes 2012 measurements for Buildings, Machinery & Equipment, Contents, and EDP/Media comprising each property noted in section a). It was noted that the majority of the building valuations on the sheet were trended up by a factor of 2.15% over the 2011 values, while the machinery and equipment values were trended upward by a factor of 1.0173%. There were no supporting documents other than the following summary chart, which has been edited to include only the most recent valuations. It should be noted that since these were insured values, they do not include any consideration to the underlying land values for each property.

Comprehensive Operational Review of CRRA October 30, 2013
The information contained herein is subject to the disclaimer presented on page 1 of this document.
Page 101
CONNECTICUT RESOURCES RECOVERY AUTHORITY
Statement of Property Values - April 1, 2012- April 1, 2013
2012 2012 Total
2012 2012 2012 2012 2012 Business Extra Insured
Asset Address City Buildings M & E Contents EDP/Media Total PD Interruption Expense Value 2012-13 Occupancy
211 Murphy Rd Hartford 2,601,035 517,709 3,118,744 3,118,744
Combined
Paper/Container
Facility
211 Murphy Road Hartford 3,605,657 0 606,635 125,000 4,337,292 4,337,292 Museum/Offices
Murphy Road Hartford 322,676 99,096 3,061 10,000 434,833 434,833 Scalehouse/Scales
Warehouse 171 Murphy Rd Hartford 597,708 0 597,708 597,708 Warehouse
1 Reserve Gate 20-40 Hartford 672,421 0 672,421 672,421 Truck Wash
1 Reserve Gate 20-40 Hartford 0 0 0 0 Barge Unloader
1 Reserve Gate 20-40 Hartford 1,912,300 1,912,300 1,912,300 NEW- Jet Fuel Tank
1 Reserve-Gate 20-40 Hartford 21,021,044 187,520,403 1,860,652 210,402,099 11,575,000 66,462,600 288,439,699 PBF
1 Reserve-Gate 20-40 Hartford 1,016,239 0 1,016,239 1,016,239
Ash Loadout Bldg -
New
1 Reserve-Gate 20-40 Hartford 31,269 107,084 138,352 138,352
Scale/Scalehouse -
New
1 Reserve-Gate 20-40 Hartford 0 26,056,100 26,056,100 6,175,000 32,231,100
Twin Packs - added
2 new spare turbines
1 Reserve-Gate 20-40 Hartford 44,352,928 64,957,778 109,310,706 109,310,706 EGF
300 Maxim Rd-Gate 70 Hartford 53,085,493 50,228,568 7,723,874 1,240 111,039,175 111,039,175
WPF - New HVAC &
Inc. 41-1B
300 Maxim-Gate 70 Hartford 283,385 88,417 22,329 971,802 971,802 WPF/Scales/House
300 Maxim-Gate 70 Hartford 853,976 250,000 600,000 1,703,976 1,703,976 Admin. Building
118 Old Dump Rd Torrington 1,195,568 364,306 1,559,874 1,559,874 Transfer Station
118 Old Dump Rd Torrington 416,614 0 416,614 416,614 Recyc. Trans. Sta
118 Old Dump Rd Torrington 136,638 91,069 17,986 245,693 245,693 Scale/Scalehouse
1601 Echo Lake Rd Watertown 1,292,412 303,564 1,595,976 1,595,976 Transfer Station
1601 Echo Lake Rd Watertown 374,952 0 374,952 374,952 Recyc. Trans. Sta.
1601 Echo Lake Rd Watertown 34,157 91,069 6,202 131,428 131,428 Scale/Scalehouse
1410 Honeyspot Stratford 3,137,967 0 3,137,967 3,137,967 Museum/Offices
1410 Honeyspot Stratford 52,115 95,304 4,135 17,986 169,540 169,540
Scales/Scalehouse -
Added: New
1410 Honeyspot Stratford 3,064,351 208,000 3,272,351 3,272,351 NEW-IPC **
140 & 217 Sadds Mill Rd Ellington 30,744 91,069 4,135 17,986 143,934 143,934 Scale/Scalehouse
140 & 217 Sadds Mill Rd Ellington 939,375 303,564 12,536 1,255,475 1,255,475 Transfer Station
140 & 217 Sadds Mill Rd Ellington 0 203,459 203,459 203,459
Thermal Oxidizer &
Controls for LF
Gas_NEW-
10 Dump Rd Essex 883,976 91,069 975,045 975,045 Transfer Station
10 Dump Rd Essex 136,638 91,069 17,986 245,693 245,693 Scale/Scalehouse
10 Dump Rd Essex 381,039 0 381,039 381,039 Recyc. Trans. Sta
Totals (including Museum Exhibits) 140,520,375 333,670,996 8,354,376 2,697,367 485,820,785 17,750,000 66,462,600 570,033,385
Essex WTS
Hartford
Recycling
Center & Trash
Museum
Mid-Connecticut
WPF, WTE, EGF
& Jets Facility
Torrington WTS
Watertown WTS
Recycling
Center &
Garbage
Museum
Ellington WTS
Comprehensive Operational Review of CRRA October 30, 2013
The information contained herein is subject to the disclaimer presented on page 1 of this document.
Page 102
6 Howard Avenue Bridgeport, CT This is a large WTE plant owned by Wheelabrator Bridgeport, L.P. with CRRA retaining interest in the underlying 6.27 acres of land. Wheelabrator leases the land from CRRA, based on the terms of a Site Lease dated as of December 1, 1986. The original lease term expired, and the tenant has 6 renewal options, with the first renewal period expiring June 30, 2014. They have already exercised their second option period, of 4.5 more years starting July 1, 2014. With options, the lease can run until 2032. The original rental rate was $180,000 per year, which according to the terms of the lease is adjusted, based on the Consumer Price Index, and is currently reported to be $380,000 per year. The tenant is responsible for payment of all insurance and tax assessments on the property, and for the maintenance of the site. Wheelabrator’s improvements: According to Public Assessor Records, two buildings on the property were constructed in 1987 and have a combined gross building area (“GBA”) of 158,240 square feet. The property is assessed at $280,259,410 for improvements and $2,194,500 for land for a total assessment of $282,453,910. The property has frontage along the Burr Creak waterway, but does not appear to have a seawall. The Assessor states that this property contains 6.27 acres of land, reflecting an assessor’s market value of $350,000 per acre ($2,194,500). While slightly higher than industrial land sales in this market for parcels of this size, its location along Cedar Creek Inlet in Black Rock Harbor is a desirable location, and would warrant the Assessor’s Market Value estimate. It is believed to be a credible opinion of the fee simple interest in the property, as vacant land. It was noted that if the land was valued based on the lease payments and a reversion of the sale of the land at the end of the lease and all options, the present value of the site would reflect a much higher value, almost double the amount the assessor has the land valued at. This would be a reflection of the leased fee interest in the site.
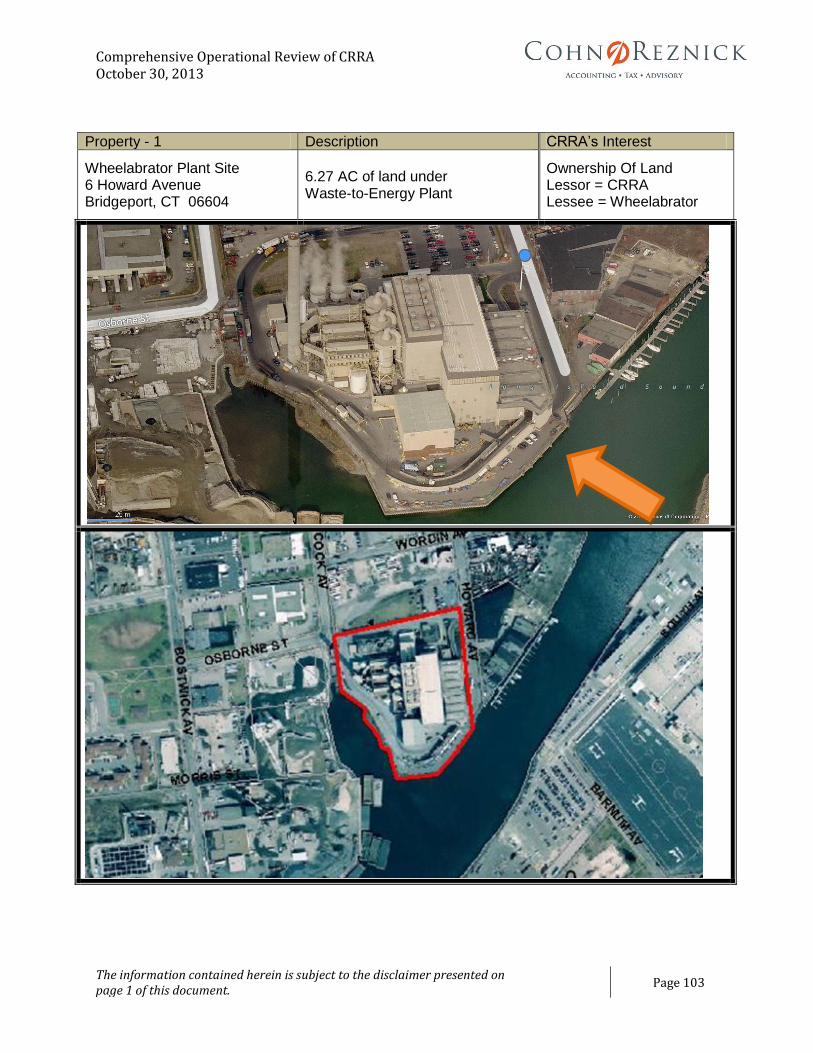
Comprehensive Operational Review of CRRA October 30, 2013
The information contained herein is subject to the disclaimer presented on page 1 of this document.
Page 103
Property - 1 Description CRRA’s Interest
Wheelabrator Plant Site 6 Howard Avenue Bridgeport, CT 06604
6.27 AC of land under Waste-to-Energy Plant
Ownership Of Land Lessor = CRRA Lessee = Wheelabrator

Comprehensive Operational Review of CRRA October 30, 2013
The information contained herein is subject to the disclaimer presented on page 1 of this document.
Page 104
211 Murphy Road Permit No. 0600734 – PC/PO
Hartford, CT This property is comprised of a Recycling Center, with an attached Trash Museum. According to Public Assessor Records, the building on the property was constructed in 1968 and has a gross building area of 92,616 square feet. According to CRRA, the buildings were acquired in 1990-1991, and retrofitted for CRRA’s use at that time. There is a sale record in 1989 reflecting a purchase price of $3,500,000. The CRRA Facilities Manager reported that the Trash Museum is situated in the front building and is composed of offices, a board room, and an amphitheater with a gross building area of about 16,000 square feet. According to Wikipedia, the Trash Museum opened in 1995, and has 6,500 square feet of educational exhibits, including a sculpture of reclaimed garbage called the “temple of trash”. Real-time recycling operations are displayed on close-circuit television in the mezzanine of the museum. The attached, rear building is a pre-fabricated, metal recycling center building that has a gross building area of 77,490 square feet. The Assessor has the buildings situated on 7.287 acres of land, which fronts along Murphy Road, and is served by a rail spur which aide in transporting the baled recyclables. The property’s market value per the assessor is $3,584,620 for buildings, $297,220 in Yard and Site Improvements and $1,199,870 for land (reflecting about $165,000 per acre or $3.78 per square foot for the land). These figures amount to a total appraised market value of $5,078,710 or $54.84 per square foot of GBA, which falls within the range of five industrial building sales within the subject’s industrial park. Given the special use design of the property, a current market value appraisal is suggested. Assessor’s Market Value: $5,078,710 (Includes Building and Land, Not M&E)
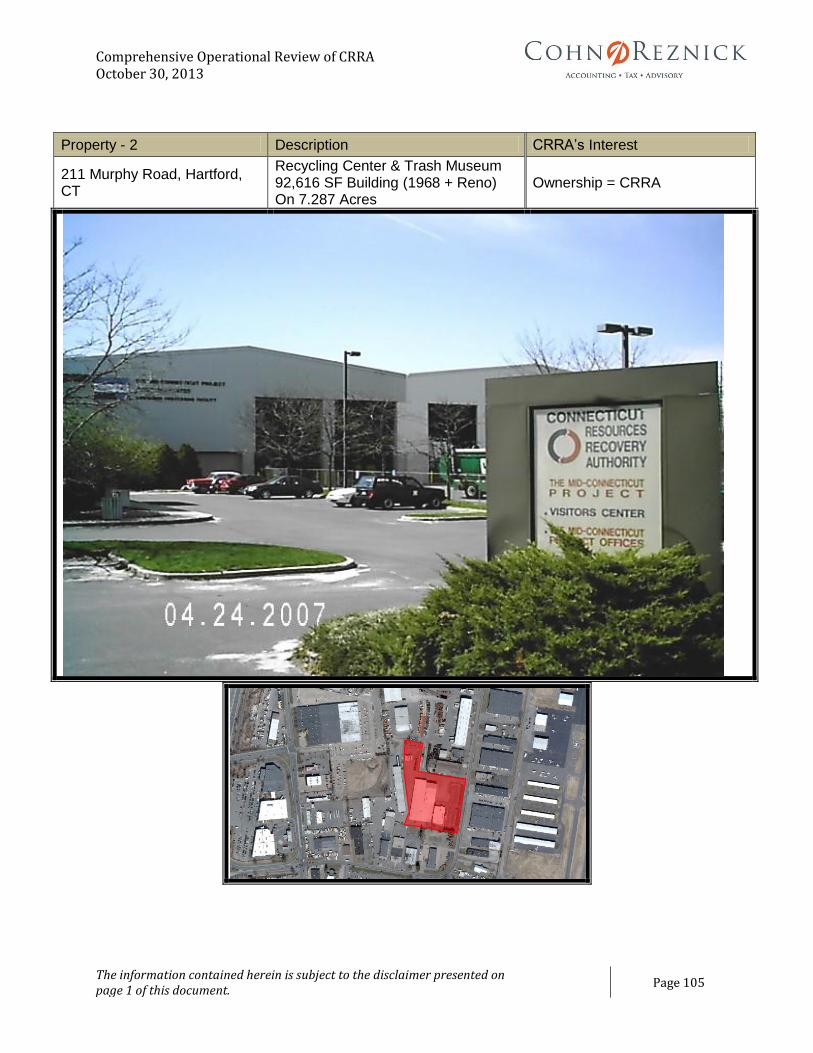
Comprehensive Operational Review of CRRA October 30, 2013
The information contained herein is subject to the disclaimer presented on page 1 of this document.
Page 105
Property - 2 Description CRRA’s Interest
211 Murphy Road, Hartford, CT
Recycling Center & Trash Museum 92,616 SF Building (1968 + Reno) On 7.287 Acres
Ownership = CRRA

Comprehensive Operational Review of CRRA October 30, 2013
The information contained herein is subject to the disclaimer presented on page 1 of this document.
Page 106
171 Murphy Road Hartford, CT This is a typical light manufacturing building that was one time built-out to house three industrial tenants. The property is vacant, but currently being used as a storage garage for CRRA vehicles. According to Public Assessor Records, the building on the property was constructed in 1970 and has a gross building area of 19,200 square feet. Public records indicate that the property was purchased in 1991 for $1,100,000. The property is appraised by the assessor at $365,470 for buildings and $209,090 for the 1.270 acres of land. These figures amount to a total market value of $574,560, although the Assessor states a total assessment of $578,900 or $30.15 per square foot of Gross Building Area (GBA). According to CRRA, the roof for this building needs to be replaced, with estimates ranging from $350,000 to $500,000; which appears excessive given the relative size of the building. This may be an indication that the building suffers from additional deferred maintenance. The appraised market value of $30.15 per square foot of GBA falls within the range of five industrial building sales within the subject’s industrial park. Given the stated substantial investment needed to cure deferred maintenance, a current market value appraisal is suggested. Assessor’s Market Value: $578,900 (Includes Building and Land)

Comprehensive Operational Review of CRRA October 30, 2013
The information contained herein is subject to the disclaimer presented on page 1 of this document.
Page 107
Property - 3 Description CRRA’s Interest
171 Murphy Road, Hartford, CT
Vacant Industrial Building adjacent to Recycling Center 2 19,200 SF Warehouse (1970) On 1.27 Acres
Ownership = CRRA

Comprehensive Operational Review of CRRA October 30, 2013
The information contained herein is subject to the disclaimer presented on page 1 of this document.
Page 108
300 Maxim Road & Gate 20, Reserve Road Hartford, CT This is the Mid-Connecticut Resource Recovery Facility (RRF). The RRF includes the Waste Processing Facility (WPF), the Power Block Facility (PBF), the Electrical Generating Facility (EGF) and the Jet Turbine Facility (JTF). The Waste Processing Facility has a permitted Design Capacity of 888,888 Tons per Year (TPY). The assessor has measured the WPF to contain 190,003 square feet of gross building area and notes that it was built in 1987. There was no building information on the older PBF or EGF. The entire Mid-Con RRF site is identified as having 79.87 acres. The 79.87 acres of land under the RRF were appraised by CBRE in February 2011 for $13,100,000, or $164,016 per acre. This is a weighted value, considering that 7.84 acres of the site is of marginal use along the River Banks, leaving 72.03 acres of land with utility. The CBRE appraisal was to be utilized by George E. Sansoucy, P.E., working on behalf of CRRA in his valuation of the whole RRF for real estate tax assessment purposes. The Assessor appraised the 2011 market value of the 79.87 acres of land at $16,828,800 or $210,702 per acre of land. The Assessor valued the buildings and plant at $43,942,600, which calculated to a total market value of the property at $60,771,400. Mid-Connecticut WTE Facility George E. Sansoucy, PE, LLC (GES), appraised the market value of the Mid-Connecticut WTE Facility Real and Personal Property, including the 80 acres of land in October 2011 for $30,000,000. The appraisal utilizes a Cost Approach and an Income Approach. Cost Approach: The Cost Approach considers on a single reported expansion of an existing facility in Lee County, Florida in 2007, at a reported cost of $120,000,000 to extrapolate a unit cost of $215,000 TPD, which is then calculated to total $435 million for the facility, as new. No actual construction costs are utilized, and there is no discussion of the building, site or plant improvement costs. From this amount, 50% is deducted for physical deterioration and an additional 92% is deducted from the remaining cost new for Functional and Economic Obsolescence to result in a depreciated replacement cost of $17 million for the buildings, plant and site improvements. When added to the underlying land value of $13 million, the cost approach resulted in a value indication of $30 million. Income Approach: In the income capitalization approach, the valuation conclusion page (page 36) was missing from the appraisal report, and the DCF in the addenda was not legible.
The Discount Rate (WACC at 10.5%) in the DCF was found to be within a reasonable
range for similar (bio mass) facilities as of a current date.
Electric energy prices used in the model appear to be low (1/3 of what US Energy Information Agency currently shows for CT/Northeastern US), and there was not enough information regarding the stated source (Ventyx) to understand the very large difference in price.

Comprehensive Operational Review of CRRA October 30, 2013
The information contained herein is subject to the disclaimer presented on page 1 of this document.
Page 109
Also the future land value at the end of the holding period would be discounted to a present value, although in this DCF the current appraised value of the land is added to the present values of the discounted cash flows.
The reconciliation indicated that the concluded value in this approach was $30 million.
Overall, this valuation would require additional analysis to determine its reliability. Jets Facility- The appraisal of the Jet Turbine Facility (“JTF”) performed by GES, as of July 1, 2010 was reviewed. In reviewing the appraisal of the JTF the cost and sales comparison approaches to value was reviewed. Cost Approach – GES began its methodology by considering reproduction cost new versus replacement cost new. GES concluded on replacement cost new instead of reproduction cost new. This conclusion was based on replacing old inefficient JTF with a new more efficient GE LM6000 Sprint. Currently the GE LM6000 Sprint has been replacing older inefficient power plants throughout the world and is a highly recognized efficient power generation station throughout the world.
In determining physical deprecation GES calculated the historical age of the JTF at 40 years but also considered routine maintenance and upgrades ultimately reaching an effective age of 20 years. The methodology utilized in determining the physical deprecation of the JTF is acceptable. GES calculated functional obsolescence inherent within the JTF by considering the high inefficient heat rate of 13,500 Btu/kWh compared to the lower more efficient heat rate of 10,000 Btu/kWh as provided by the GE LM6000 Sprint. The functional obsolescence associated with the inefficient heat rate of the JTF resulted in a $3,000,000 penalty. The methodology utilized to calculate the functional obsolescence penalty was found to be acceptable. In identifying and calculating the external obsolescence GES considered current Federal and State air pollution regulations as well as future state air pollution regulations. Research was performed on the installation of mitigating control measures for the reduction of air pollution. GES identified The Wood Group and Pratt & Whitney as two sources used to identify acceptable pollution control measures. The Wood Group and Pratt & Whitney are internationally well known for their experience in power generation plants. A $10,000,000 external obsolescence penalty was applied accounting for the addition cost to mitigate the air pollution. The sources used to identify mitigating control measures and the calculation of the external obsolescence utilized in the GES appraisal report is acceptable. The appraisal determines the replacement cost new of the JTF at $160 million, and a deduction of 50% was made of physical deterioration and an additional $13 million in functional obsolescence for a depreciated replacement cost of $67 million. An estimated land value of $3 million is added for a two acre portion of the 80 acre plant site, reflecting a unit value of $1.5 million per acre, which is not supported. The Income Capitalization Approach- The approach was performed by GES but while the analysis and assumptions were included, the final DCF was not attached to the report, so it was not possible to evaluate this approach’s conclusion of $35 million.

Comprehensive Operational Review of CRRA October 30, 2013
The information contained herein is subject to the disclaimer presented on page 1 of this document.
Page 110
The Discount Rate (WACC at 10.0%) in the DCF were found to be within the lower end
of the reasonable range for similar (bio mass) facilities as of a current date (no information was uncovered about cost of capital for peak power producers).
EBITA at 7x was found to be within the reasonable range for similar (bio mass) facilities.
The energy price assumptions were not broken out, and therefore could not be analyzed.
It appears that the two appraisals prepared by GES were to be separate, although a portion of the facilities’ evaluation overlap. The combined value of $65 million is consistent with the Assessor’s appraised value, although the M&E are not included in the assessor’s valuation. Given the various discrepancies of what is included in each valuation, a current market value appraisal is suggested.
Assessor’s Market Value: $61,000,000 (Includes Building and Land)
Property - 4 Description CRRA’s Interest
300 Maxim Road & 1 Reserve Road, Hartford, CT
Mid-Connecticut WTE Power Plant 190,000 SF Building (Built: 1987) on 80 total acres
Ownership = CRRA
Power Block Facility & Electrical Generating Facility

Comprehensive Operational Review of CRRA October 30, 2013
The information contained herein is subject to the disclaimer presented on page 1 of this document.
Page 111
Waste Processing Facility

Comprehensive Operational Review of CRRA October 30, 2013
The information contained herein is subject to the disclaimer presented on page 1 of this document.
Page 112
Property - 5 Description CRRA’s Interest
Jets Facility Reserve Road, Hartford, CT
Jet Turbine Facility located within the Mid-Connecticut Complex
Ownership = CRRA

Comprehensive Operational Review of CRRA October 30, 2013
The information contained herein is subject to the disclaimer presented on page 1 of this document.
Page 113
Torrington Waste Transfer Station Permit No. 1430666-PO
118 Old Dump Road Capacity: 650 TPD & 120 TPD Torrington, CT According to Public Assessor Records, the Torrington Waste Transfer Station (WTS) warehouse was constructed in 1988 and contains 8,269 square feet of gross building area (plus 2,100 square feet of basement area), which is a pre-fabricated metal warehouse with steel trusses, and two large drive-in-doors. An office building on the property contains 432 square feet and was also constructed in 1988. The “push-floor” is contained immediately outside the warehouse, where municipal waste is dumped, and pushed into larger trucks for hauling to the landfill. As this station is built into a slight incline, the push floor has been raised to accommodate a single line of trucks on the lower level that are filled with waste pushed from above. The WTS also serves to collect some recycling materials as an additional service. A scale house, is located near the front of the property, next to an in-ground scale, to weigh trucks entering/leaving the site. The Assessor’s market value for the land is $222,156 for approximately four acres, or $55,539 per acre. This value falls within the range of five comparable industrial land sales in the area. The Torrington location is more rural than the properties in Hartman or Bridgeport, and the site has a very irregular configuration. The Assessor’s value of the buildings was $288,623, for a total market value of $510,779 or $61.77per square foot of GBA. The GES Engineers’ notes indicate a building area of 10,360 square feet, although only 8,300 square feet is used in their Cost Analysis report. Their calculated replacement costs of the building and site improvements was $1,527,213 in 2006, and their estimated depreciated replacement cost at that time was $977,416, which did not include land. Given the building’s special purpose design, including two-level truck loading, the property may not easily be adapted for alternative uses. The assessor’s market value of $510,779 or $61.66 per square foot falls within the range of industrial building sales within the subject’s general market area. Given the special use design of the property, a current market value appraisal is recommended.

Comprehensive Operational Review of CRRA October 30, 2013
The information contained herein is subject to the disclaimer presented on page 1 of this document.
Page 114
Property - 6 Description CRRA’s Interest
Vista Drive (118 Old Dump Road), Torrington, CT
Torrington Waste Transfer Station 10,360 SF Building (Built 1988) On 4.0 Acres
Ownership = CRRA

Comprehensive Operational Review of CRRA October 30, 2013
The information contained herein is subject to the disclaimer presented on page 1 of this document.
Page 115
Watertown Waste Transfer Station Permit No. 15301123-MTSGP 1601 Echo Lake Road Daily Capacity: 550 TPD Watertown, CT According to Public Assessor Records, the Watertown Waste Transfer Station warehouse was constructed in 1990 and contains 7,108 square feet of GBA, plus 1,449 square feet in a lower level (basement). In addition there is a scale house (192 SF) and storage shed. The Assessor includes two parcels totaling 12.72 acres for the facility, although CRRA identify 10 acres, of which 4.6 acres is developed. It was noted that in the Watertown Transfer Station Host Community Agreement, that an exhibit identifies the WTS being located on 9.827 acres The GES Engineers’ Cost Analysis indicated three different buildings: 7,612 square feet, 300 square feet, and 208 square feet. The Assessor has assessments of $236,600 for buildings, $73,300 for outbuildings, and $572,300 for land. The Assessor has a total land size of 12.72 acres, and has appraised the market value of the land at $45,000 per acre, which falls within the range indicated by nearby land sales. The total market value for the property per the assessor is $882,200 reflecting a unit value of $122.52 per square foot of building area, although this higher unit value is attributed to the very large site area evaluated with the building. Given the inconsistency in the various building and site factors, and the $2.8 million replacement cost estimated seven years ago by GES Engineers, a current appraisal is suggested for this property.

Comprehensive Operational Review of CRRA October 30, 2013
The information contained herein is subject to the disclaimer presented on page 1 of this document.
Page 116
Property - 7 Description CRRA’s Interest
Town Echo Lake Road Watertown, CT
Watertown Waste Transfer Station 8,120 SF Building (Built 1990) On 12.72 Acres
Ownership = CRRA

Comprehensive Operational Review of CRRA October 30, 2013
The information contained herein is subject to the disclaimer presented on page 1 of this document.
Page 117
Stratford Recycling Center Permit No. 13801139-PO And Garbage Museum 500 TPD of Recyclables 1410 Honeyspot Road Extension Stratford, CT This recycling center and garbage museum consists of a scale house, an education center with offices and recycling operations area. The front building has a gross building area of 14,500 square feet and contains the old museum, 100 person amphitheater, offices and a board room. The rear building is a prefabricated metal warehouse with six overhead doors and contains 45,870 square feet of GBA, and therefore the total gross building area is 60,370 square feet. The museum was built by CRRA in 1993, and included a “Trash-O-Saurus” display but has recently closed for lack of funding. CRRA still has a permit to run operations on this property. A review of a property inspection dated May 31, 2013, noted numerous items of deferred maintenance that would negatively impact the marketability of the property. The Assessor had the site area containing 4.02 acres, and its current appraised value is $1,206,000 reflecting a unit value of $300,000 per acre. Land sales in the outlying areas are much lower, but there have been several land sales in the more built-up areas that support the assessor’s appraised value. The entire building was built in 1993, and the assessor’s appraised value for the entire facility, excluding M&E is $4,651,100, reflecting a unit value of $77 per square foot of GBA. Considering custom build-out, special use design, and location with rail spur and current building condition, improved property sales could not be found to support the assessor’s value. A current inspection and appraisal of the property is suggested.

Comprehensive Operational Review of CRRA October 30, 2013
The information contained herein is subject to the disclaimer presented on page 1 of this document.
Page 118
Property - 8 Description CRRA’s Interest
1410 Honeyspot Road Extension, Stratford, CT
Recycling Center & Garbage Museum 56,300 SF Building (Built 1993)
Ownership = CRRA
__

Comprehensive Operational Review of CRRA October 30, 2013
The information contained herein is subject to the disclaimer presented on page 1 of this document.
Page 119
Ellington Waste Transfer Station (CLOSED) Permit No. 04801040/PO
140/217 Sadds Mill Road Daily Capacity: 560 TPD Ellington , CT
The Ellington Waste Transfer Station is not currently in use. The property was built in 1991 and 1992. According to the Assessor, the waste transfer station is located on 34.65 acres of land. This facility was constructed next to a closed landfill; and CRRA retains ownership in the closed landfill, as well as additional land secured for plume control. The landfills are outside the scope of evaluation, given that they were all no longer receiving waste, and were in closure. The Assessor states the pre-engineered building has a gross building area of 10,280 square feet. The Assessor’s has appraised the land at $1,183,850, reflecting a unit value of $34,166 per acre. This value is supported by comparable land transaction in the area. The Assessor’s appraised value of the improvements is $390,670 for buildings and $138,820 for outbuildings, indicating a total market value for the whole property of $1,713,340 or $166.67 per SF of GBA. This high unit value is a result of the large site acreage associated with a small building. CRRA allocates only 8 acres of land to the WTS. The GES Engineering Cost Analysis from 2006 indicated that the building contained 11,300 square feet and that the replacement cost of this facility seven years ago was $1,888,243, although they reduced that value for physical and functional depreciation to a total deprecated cost of $865,239. This analysis did not include any valuation for the land.

Comprehensive Operational Review of CRRA October 30, 2013
The information contained herein is subject to the disclaimer presented on page 1 of this document.
Page 120
Property - 9 Description CRRA’s Interest
140/217 Sadds Mill Road, Ellington, CT
Closed Ellington Waste Transfer Station 11,300 SF WTS (1990) on 8+/- acres of 34.7 acre site
Ownership = CRRA

Comprehensive Operational Review of CRRA October 30, 2013
The information contained herein is subject to the disclaimer presented on page 1 of this document.
Page 121
This is the 34.65 acre site identified by the Assessor.
Plumb Control Tracks: Thompson Family Land Trust: 38.50 Acres purchased in 2007 for $888,672 ($23,082/Acre) Assessor’s Current Market Value is $352,850 ($9,165/Acre) Art Barber Excavating Inc.: 20.0 Acres purchased in 2001 for $500,000 ($25,000/Acre) Assessor’s Current Market Value is $158,550 ($7,928/Acre) B&L Development Corp: 5.29 Acres purchased in 2001 for $185,000 ($34,972/Acre) Assessor’s Current Market Value is $133,460 ($25,229/Acre) Charette Property: 1.32 Acres purchased in 2001 for $171,000 ($129,545/Acre) Assessor’s Current Market Value is $104,880 ($79,455/Acre) Given the wide range in unit values, it is recommended to have the properties assessed in order to determine their current market values.
Comprehensive Operational Review of CRRA October 30, 2013
The information contained herein is subject to the disclaimer presented on page 1 of this document.
Page 122
Essex Waste Transfer Station Permit No. #05001125-MTSGP 5 Town Dump Road Daily Capacity: 645 TPD Essex , CT CRRA leases the land from the Town of Essex, and has constructed a waste transfer station, which according to CRRA, is similar to the Torrington Waste Transfer Station. It is assumed that the improvements will become property of the Town of Essex at the expiration of the ground lease. The ground lease began in May 1987, was extended on October 15, 2015, and is set to expire on June 30, 2027. The initial lease provided for annual payments of 20% of the assessed value of the facility to the Town of Essex, and was amended to provide for annual payments of $15,000. The Assessor shows this transfer station to be on 20.52 acres of land owned by the Town of Essex, which includes other users; the 2006 GES Engineers Cost Analysis states this transfer station to be on 4.1 acres of land. Furthermore, the Assessor shows an improvement size of 7,650 square feet. The Assessor does not value the land, since it is municipally owned, but does appraise the market value of the building in 2012 at $340,900, or $44.56 per square of building area, excluding land. GES Engineering’s Replacement Cost Worksheet indicates that the metal frame and sided building was built in 1987, and contains 8,000 square feet, with a 300 square foot scale house. Seven years ago the engineers estimated the replacement cost new of the building to be $1,506,169, and have calculated the depreciated cost at $933,825 at that time. There are three frame constructed material storage sheds at the rear of the site that are not included in any of the reports reviewed. Given the terms of the lease, which was recently negotiated, there may be little need to have these improvements appraised.

Comprehensive Operational Review of CRRA October 30, 2013
The information contained herein is subject to the disclaimer presented on page 1 of this document.
Page 123
Property – 10 Description CRRA’s Interest
5 Town Dump Road, Essex, CT
Essex Waste Transfer Station 8,536 SF Building (Built 1987) On 4.1 acre site
Lessor = Town of Essex Lessee = CRRA Building and site improvements are owned by CRRA but are given to the Town of Essex at the end of the lease.
Comprehensive Operational Review of CRRA October 30, 2013
The information contained herein is subject to the disclaimer presented on page 1 of this document.
Page 124
Property Encroachments
No title reports or files identifying property ownership were provided.
Machinery and equipment owned, leased or used
The review could not properly identify any machinery and equipment owned, leased or used by the Authority. The few pieces of machinery and equipment that were able to be identified did not contain sufficient information to perform a review of the machinery and equipment. As an example, identified a backhoe and that was the only description available. A “Statement of Property Values” was not received from the Authority. However, the machinery and equipment only contained a lump sum amount for each location with no description of the assets. No appraisals of machinery and equipment or fixed asset listings were received to properly perform a review of the machinery and equipment. Numerous inspection reports were provided, and machinery surveys, although not enough information was included in these reports to perform an appraisal of the M&E owned. The total M&E insurable values reported by CRRA have been included in the previous Valuation Summary Chart. In order to perform a proper review at minimum the following information would be required:
Description of the Asset
Manufacturer
Model
Serial Number
Placed in Service Dates
Historical Cost
No contracts, lease, or other agreements were provided regarding any owned or leased equipment used by the Authority.
Equipment appraisals, engineering, and maintenance reports
There were no appraisals received by the Authority regarding any equipment in use by the Authority. Inspection reports were prepared on some of the assets, which documented deferred maintenance, including pictures. In addition, CRRA provided some weekly and monthly maintenance reports, on several assets, which included some information on the machinery and equipment, in addition to the buildings. While this information was helpful in developing valuation opinions, without the information identified above, it is insufficient to prepare valuation appraisals.
Technology Assessment
w) An analysis of the Authority’s information technology business practices relating to efficiency and the possibility of cost-cutting measures.
x) With respect to information technology, a comparison with the practices of other resources recovery facilities, to the extent information is available.
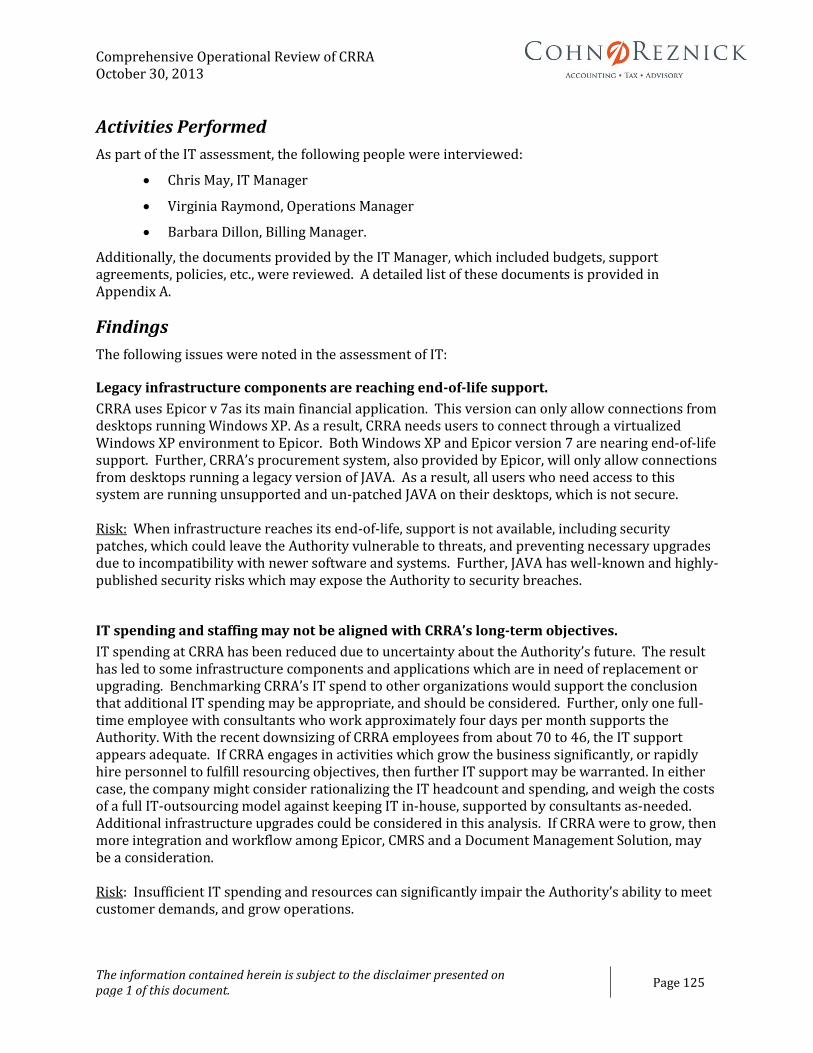
Comprehensive Operational Review of CRRA October 30, 2013
The information contained herein is subject to the disclaimer presented on page 1 of this document.
Page 125
Activities Performed
As part of the IT assessment, the following people were interviewed:
Chris May, IT Manager
Virginia Raymond, Operations Manager
Barbara Dillon, Billing Manager.
Additionally, the documents provided by the IT Manager, which included budgets, support agreements, policies, etc., were reviewed. A detailed list of these documents is provided in Appendix A.
Findings
The following issues were noted in the assessment of IT:
Legacy infrastructure components are reaching end-of-life support.
CRRA uses Epicor v 7as its main financial application. This version can only allow connections from desktops running Windows XP. As a result, CRRA needs users to connect through a virtualized Windows XP environment to Epicor. Both Windows XP and Epicor version 7 are nearing end-of-life support. Further, CRRA’s procurement system, also provided by Epicor, will only allow connections from desktops running a legacy version of JAVA. As a result, all users who need access to this system are running unsupported and un-patched JAVA on their desktops, which is not secure. Risk: When infrastructure reaches its end-of-life, support is not available, including security patches, which could leave the Authority vulnerable to threats, and preventing necessary upgrades due to incompatibility with newer software and systems. Further, JAVA has well-known and highly-published security risks which may expose the Authority to security breaches.
IT spending and staffing may not be aligned with CRRA’s long-term objectives.
IT spending at CRRA has been reduced due to uncertainty about the Authority’s future. The result has led to some infrastructure components and applications which are in need of replacement or upgrading. Benchmarking CRRA’s IT spend to other organizations would support the conclusion that additional IT spending may be appropriate, and should be considered. Further, only one full-time employee with consultants who work approximately four days per month supports the Authority. With the recent downsizing of CRRA employees from about 70 to 46, the IT support appears adequate. If CRRA engages in activities which grow the business significantly, or rapidly hire personnel to fulfill resourcing objectives, then further IT support may be warranted. In either case, the company might consider rationalizing the IT headcount and spending, and weigh the costs of a full IT-outsourcing model against keeping IT in-house, supported by consultants as-needed. Additional infrastructure upgrades could be considered in this analysis. If CRRA were to grow, then more integration and workflow among Epicor, CMRS and a Document Management Solution, may be a consideration. Risk: Insufficient IT spending and resources can significantly impair the Authority’s ability to meet customer demands, and grow operations.

Comprehensive Operational Review of CRRA October 30, 2013
The information contained herein is subject to the disclaimer presented on page 1 of this document.
Page 126
There are no comprehensive IT policies and procedures.
CRRA operates with a limited set of IT policies and procedures. A basic acceptable computer use and backup policy exists, but no other comprehensive documentation covering broader functions such as Change Management, Information Security, Disaster Recovery, etc. Given the relatively simplistic nature of CRRA’s computing environment, low rate of change, and low IT turnover, it does not appear to have hampered the Authority thus far. However, if the Authority is considering expanding the IT function or bringing on new personnel and/or vendors; then formal policies and procedures would help provide more sustainable and repeatable IT processes. Risk: A lack of IT policies and procedures could lead to inconsistent or inadequate program changes, security or system development, which may compromise the Authority’s information assets.
A security audit and network vulnerability assessment has not been performed in over three years.
CRRA had a comprehensive security audit and penetration / vulnerability assessment performed in 2010. It’s recommended that the Authority perform this at least annually to help detect vulnerabilities which could be exploited and ultimately compromise CRRA’s business functions or reputation. Risk: Security vulnerabilities might exist on CRRA’s infrastructure which could lead to data and financial loss, if exploited.
CRRA’s PC’s are no longer under warranty and require upgrading.
CRRA uses Dell Opitiplex PC’s which were purchased over seven years ago. The PC’s are no longer under warranty. Risk: When infrastructure equipment is used past its normal, useful lifespan, there is an increased risk that the system will break down and disrupt business.
The server room does not have a back-up generator or sufficient fire protection.
CRRA’s server room does not have a dri-chem fire suppression system to protect the equipment in the event of a fire. Additionally, CRRA does not have a generator that would allow the company to operate in the event of a prolonged outage. Through a contract with Walker Systems, and use of a Cloud-based backup and recovery system, CRRA does have some recovery capability. The Organization could, in theory, build servers at a separate location using the backup data and become operational within 48 hours or more. This timeframe appears consistent based on similar-sized IT organizations. In theory, while the downtime would be an inconvenience, the company would be able to function by issuing tickets to haulers and creating invoices manually. By comparison, if a power outage affecting the area occurred, and the recycling center and RRF plants could not function, there would be a far greater company exposure than not being able to automatically record waste weight and process invoices. The adequacy of redundant power to these locations is outside the scope of this review. The Organization needs to assess its recovery time objectives (RTO) with regard to its corporate infrastructure to determine if this timeframe is sufficient. A separate assessment should be considered on the IPC and RRF facilities.
Comprehensive Operational Review of CRRA October 30, 2013
The information contained herein is subject to the disclaimer presented on page 1 of this document.
Page 127
Risk: Without a fire suppression system or generator, the Organization may not be able to eliminate a fire which would damage equipment or the building. Further, a lack of a generator to provide longer-term power and recovery capabilities may hamper the Organization’s ability to conduct business in the event of a power loss.
Background
Overview of CRRA’s Information Technology
IT Organization and Personnel
Chris May, IT Manager, has been with CRRA since the early 1990s. Chris obtained a degree in Electrical Engineering, and joined CRRA after working at a large HMO. Chris is responsible for overseeing and maintaining CRRA’s IT infrastructure including firewalls, networks and routers. The IT Manager also uses part-time IT assistance from Walker Systems Support (“Walker”) to support the organizations’ IT needs. Walker provides staff augmentation, as well as maintaining the backup equipment and software. CRRA signed a three-year agreement with Walker in 2011. As part of this agreement, Walker provides support approximately four days per month, based on an hourly rate ranging from $115/hr to $225/hr, depending on the engineer’s level. The contract is on-demand and allows CRRA to ramp up Walker’s support during periods of increased maintenance, or when the IT Manager is out of the office. The Organization spends approximately $45,000 - $50,000 per year for Walker support, which includes backup services that allow CRRA to back-up data remotely, within a Cloud-based environment.
Key Applications
The organization uses four main applications:
Epicor: Epicor (v7.3.6) is used for finance, accounting and billing functions including GL, AR, AP, Asset Management, Cash Management and Procurement. The system was installed in 1999 by Epicor and runs on a Windows 2008 SP2 server with a SQL Server database v2005. CRRA upgraded the system approximately five years ago to version 7.36 using Epicor consultants. The project went significantly over-budget by $50,000, double the amount quoted). CRRA managed to reduce the amount paid from $100,000 to $60,000 through negotiations with Epicor. As a result of this experience, as well as budget cuts, and uncertainty about the future of the organization, CRRA has been reluctant to perform additional needed upgrades to the system. The current version does not support desktop connections with any PC running other than Windows XP and a legacy version of JAVA. The IT Manager has circumvented this obstacle by virtualizing users’ desktop configuration to a Windows XP instance, allowing them to run Windows 7 normally, and then connect to the virtualized XP instance when using Epicor. Nevertheless, XP, and the legacy version of JAVA have many widely known security vulnerabilities which put CRRA’s infrastructure at risk.
Epicor has little core customization (i.e. table structures and code) and does not interface directly with any of CRRA’s other applications. As a result, all sales and expense data and reports need to be reconciled and then physically entered into the system, resulting in a

Comprehensive Operational Review of CRRA October 30, 2013
The information contained herein is subject to the disclaimer presented on page 1 of this document.
Page 128
manual billing process. In the current state, the process is manageable due to a relatively small amount of invoices which are produced monthly; roughly 70, and a small user base.
It is recommended that CRRA upgrade Epicor to a newer version. The current version poses some compatibility issues with newer, more secure, versions of Windows and JAVA. Additionally, both Windows XP and Epicor v7 are nearing their end-of-life support. While Epicor has not announced a timeline for not supporting this version, it is estimated that this will occur within the next 1.5 to 3 years. Microsoft has already announced end-of-life support for XP in 2014.
CMRS/AutoScale: CMRS (Central Management Reporting System) and AutoScale are a scale management, and reporting software solution. The systems are provided by the same vendor, Mettler, and are designed to work together to allow CRRA to record the weight of trash dumped at their facility and ultimately bill haulers and municipalities for tipping fees (i.e., dumping fees). CRRA assigns trucks a unique identifier which links the vehicle to a town and also contains the trucks’ stored tare weights (i.e. the unloaded vehicle weight). As the trucks enter one of CRRA’s six scale sites, an operator manually keys in an alpha-numeric code located on the trucks into the AutoScale application. AutoScale will automatically record the vehicles’ weight, less the tare weight in the system. An internal billing table containing the price per ton for trash is how the system calculates fees for each town or hauler. AutoScale runs at each scale site on SQL Express and transmits the weight, as well as other pertinent info such as time, day, etc., to the CMRS application over wireless, DSL or a T-1 line, depending on the location. CMRS runs at CRRA’s headquarters on SQL Server 2008 and records the information generated at the scale sites, as well as contains the billing rates and details of each customer transaction. Over the years, various customizations have occurred to the system. However, Mettler packages these as part of their next release. Hence customizations for any of Mettler’s clients become part of the ‘standard’ CMRS package and are included in subsequent releases. CRRA mostly relies on standard system reports, included with CMRS, but also uses custom Crystal Reports, provide further levels of reporting granularity.
CMRS provides the historical detail for each customer that is used by the Billing Manager to prepare customer bills. CMRS produces detail similar to how a phone bill is organized (i.e. it shows transactions by time, location, customer etc.). The system was updated last year by the vendor to a newer version of AutoScale.
ADP Timesheet. ADP timesheet is a Cloud-based time sheet solution which has been used by the Organization for the past 15 years. In the current version, users log-into a webpage, hosted by ADP, and enter their time, weekly. The system has workflow approvals, which routes submitted time to the employee’s supervisor, who must approve the time.
LaserFiche: LaserFiche is a document management system (DMS) which is hosted internally and used to store all pertinent info such as contracts, etc. The information is stored securely and held indefinitely. The system was implemented in 2005 but contains contracts and other historical documents going back to the inception of CRRA.

Comprehensive Operational Review of CRRA October 30, 2013
The information contained herein is subject to the disclaimer presented on page 1 of this document.
Page 129
Secondary Applications
This section describes the ancillary applications which are used by CRRA personnel.
Microsoft Windows: CRRA uses both Windows XP and Windows 7. The desktops are Windows 7, but users who need to connect with Epicor must do so through a virtual XP environment due to the legacy version of the application.
Microsoft Office: CRRA uses the Microsoft Office 2010 suite of software for all users. There are some versions of Office 2003 in use, but these are for stand-alone PC’s not tied to any user. Accounting is the major user of Microsoft Excel and will download data from CMRS and/or Epicor for analysis and for uploading into Epicor, as needed. CRRA had previously purchased over 75 Microsoft licenses when they were a larger organization, so licenses are more than sufficient for the current staff.
Microsoft Exchange Server: The organization uses a Microsoft Exchange 2010 Server which is hosted internally.
Crystal Reports: Crystal Reports is the primary reporting tool of the Organization. It runs off of the CMRS application and Epicor and is customized as needed, by users in Accounting.
Hardware
This section discusses the key aspects of CRRA’s IT infrastructure.
Data Room: The Organization’s IT infrastructure is currently maintained in a data room located at the 100 Constitution Plaza facility in Hartford, CT. The data room is approximately 12’x10’ and hosts all of the Organization’s computer hardware and telecommunication equipment. The IT Manager has his office within the data room, in an adjoining space, for easy access to the equipment. Access to the data room is controlled via a key-locked door. The Data Room has an uninterrupted power supply system (“UPS”) that will allow for a controlled shut down, but does not have the capacity to run if the building, or surrounding area, lost power. However, the Organization has an agreement with Walker, whereby their data is stored in a Cloud-based repository, operated by Zenith Tech. Backups occur several times per day and are sent off to Zenith’s site nightly. In the event of a prolonged outage, the IT Director could obtain the backup copies and restore operations temporarily at one of the other CRRA facilities, although it may take a few days to become operational.
The data room contains an additional air cooling unit on the ceiling, which provides ample cooling of the equipment. The equipment is raised on stackable racks and cabinets. There is no Dri-Chem fire protection system in the data room.
Network Security: CRRA uses a SonicWall NSA 2400 firewall for network perimeter protection. This firewall provides the primary network protection from external threats and enables a secure connection to the network for remote users. The firewall rules are managed by the IT Manager. SonicWall also has a Spam filter and provides a first-layer of defense for email-related threats. Additionally, Trend Micro is installed on all desktops and servers and provides virus protection for CRRA’s infrastructure. CRRA has had security audits performed previously, with the latest being done in 2010. This included a network vulnerability scan. CRRA was found to be in overall ‘Good Health’
Comprehensive Operational Review of CRRA October 30, 2013
The information contained herein is subject to the disclaimer presented on page 1 of this document.
Page 130
according to the report, although several security issues were noted. According to the IT Manager, all security issues in the report were corrected within one week of receiving it.
Infrastructure: A Cisco 1841 router, terminates the Verizon 10MB Internet Connection. CRRA uses Dell for servers, laptops and PC’s (PowerEdge, Dell Latitude D630 and Dell OptiPlex 775, respectively). The PC’s are at least seven years old and are out of warranty. On the servers, CRRA uses a mix of Windows 2003 SP2 and Windows 2008 SP2. Additionally, CRRA uses VMware v5 to virtualize certain infrastructure components such as the back-end SQL database for Epicor, LaserFiche, Microsoft Exchange and several file servers. Windows systems are patched regularly.
Wireless access points are secured through WPA2 encryption and are available for laptops only. Authentication is tied to the Active Directory and the user’s individual laptops. There are no additional IDs and passwords needed and only a ‘registered’ laptop with an enabled Active Directory account will be able to access the network.
CRRA has a basic Bring Your Own Device (BYOD) policy. Employees may use Android phones and have them synched to the corporate Exchange server via ActiveSync software. The IT Director has the ability to remotely wipe all devices in the event they are lost. CRRA does not use Blackberry devices and, therefore, does not maintain a BES server.
Bandwidth and disk space are well under thresholds requiring upgrades. The IT Director monitors these periodically. A one gigabyte internet connection provides ample bandwidth for users and systems connecting the CRRA’s data room. The main production servers are running at approximately 30% capacity, according to the IT Manager.
Through the use of the virtualized software, there is a standard image for PC’s and Servers, allowing the IT Manager to quickly build new systems as needed.
IT Processes
IT operates with limited policies, procedures, or current system documentation. A policy covering back-ups and general computer use are the only formal documentation which exists. Given the small size of the IT department, and relatively simplistic system architecture, the lack of policies has not hampered IT’s ability to support CRRA. However, if the Organization is considering additional growth, staffing or vendor changes, having documentation would be advantageous.
Logical Security: Human Resources initiate user terminations or new hires through an email to the IT Director. IT gives the users basic access rights to phone, email, and the network, with an initial password that must be changed upon logon. Other access, such as to Epicor, or network directories, must be explicitly requested by a departmental manager. Active Directory Passwords configurations generally conform to Microsoft security guideless and industry ‘good practices’ for length, encryption, and history. The minimum password age is not one or more days, allowing a user to change a password back to a previous one, immediately after it being reset. While this does not conform to security ‘best practices’ it allows the Administrator to set an initial password and then forces the user to immediately change it upon logon, and is an acceptable practice, given the other password settings.
For terminations, the IT Manager will go through a formal checklist to make sure any IT equipment is turned in and disable them from Active Directory and Epicor. User ID’s are

Comprehensive Operational Review of CRRA October 30, 2013
The information contained herein is subject to the disclaimer presented on page 1 of this document.
Page 131
not removed. The IT Manager and Director of Accounting are the system admins for Epicor and the IT Manager and Walker are administrators to Active Directory.
Change Management: If and when such upgrades or enhancements are needed to CMRS or Epicor, CRRA would need to go through the Vendor. Epicor has not been upgraded since 2008 and CMRS was updated last year. Users of these systems will add or change reports through Crystal reporting packages, but is not involved with these changes. Infrastructure changes requiring purchases of new equipment must be approved through the budget process. Other changes such as virtualizing machines, changing configurations, etc., are performed by the IT Manager or Walker Systems consultants.
Continuity Management: The Organization uses a Cloud-based, third-party back-up solution which is managed by Walker Systems. Several times per day, delta back-ups are taken of the applications and servers through Walker’s Sentinel Data Backup and Disaster Recovery (BDR) Solution. The data is stored in a Cloud managed by Zenith Tech, in New Jersey. Each BDR has its own full copy of data, stored on site, as well. If a system crashed, the IT Manager could obtain a full recovery from the BDR, or restore a historical file. In the event of a major disaster that prevented access to CRRA’s Hartford location, the IT manager could request a full backup from Walker and obtain a copy within 24 hours. While CRRA does not have a formal disaster recovery plan in place, a backup file, could, in theory be loaded to another CRRA location and the Organization would be back in business. Walker performs tests on recovery periodically throughout the year.
Help Desk: CRRA does not have a formal help desk. If a user has a problem, they will email an Exchange Account called “Help Desk”, which is monitored by both the IT Manager and Walker Systems. When needed, the IT Manager can remote connect to a user’s PC through a tool called BOMGAR.
Asset Management: When new IT equipment is purchased, someone from Finance will validate the serial number against the invoice and tag the equipment. Licenses for software are current, and in ample supply, since the Organization had software licenses to support 70 employees at one time, but CRRA has been downsized to around 46 people. Accounting does a physical inventory of equipment once per year. When a computer is retired, the IT Manager notifies Accounting, who removes the tag and updates the inventory.
IT Spend
The following is a breakdown of CRRA’s IT budget and year-to-date spend for 2013. Most of the IT budget is under the General Fund, which is for Core IT (those that support the enterprise overall). There is a small IT component for each scale house (only Telco, hardware and software). Personnel costs were estimated based on a range given by CRRA, and are fully loaded.

Comprehensive Operational Review of CRRA October 30, 2013
The information contained herein is subject to the disclaimer presented on page 1 of this document.
Page 132
Some of the large discrepancies between budget and actuals are for projects CRRA postponed. For example, the Engineering and Technical Consulting budget would have been used for an Epicor upgrade. The Computer hardware budget was for PC replacements that CRRA put off for at least another year.
Comparison to Other IT Departments 5
As part of the analysis, the relevant IT spend and personnel data were compared to industry benchmarks, via a survey performed by Gartner across 9,000 public and private entities in 2012. CRRA data used for the benchmarking was obtained through 2012 – 2013 budget information provided by CRRA, as well as other documentation (2013 draft audit) and interviews. Information selected for the benchmark is shown in the table below:
5 Based on the specialized nature of CRRA’s operations, a comparison to other waste management industries was not practical in the time allotted. Therefore, Gartner’s 2012 IT Spending and Staffing Report was used to compare CRRA to relevant IT departmental data for the following industries: all industries, energy companies, and state and local governments.
Budgeted Actual
$91,000 $66,700
$14,000 $11,000
$10,000 $0
$55,000 $47,300
$82,700 $67,900
$51,000 $2,200
$86,000 $2,500
$18,000 $900
$120,000 $120,000
$527,700 $318,500
Budgeted Actual
$3,500 $1,500
$8,000 $900
$1,000 $0
$12,500 $2,400
Budgeted Actual
$540,200 $320,900
Core IT Spend
Scale House IT spend
Maintenance
2013 CRRA IT Spend
Scale House IT
Total IT Spend
Core IT
Hardware
Software
Personnel (est.)
Engineering and Tech. Consulting
Telecom
Copier
Training
IT Consultants
Scale House Telecom
Scale House Hardware
Scale House Software

Comprehensive Operational Review of CRRA October 30, 2013
The information contained herein is subject to the disclaimer presented on page 1 of this document.
Page 133
IT Spending and Staffing Analysis: Knowing where an IT department compares to other organizations is an important metric to determine if IT may be over- or under-funded and has the right amount of headcount. Key metrics used in the Gartner study compared various IT departments across the following criteria:
o IT Spend as a Percent of Total Revenue;
o IT spend as a percent of Operating Expense;
o IT FTEs as a Percent of Total Employees; and
o IT Spending Per Employee.
The following table shows CRRA’s data compared across all industries, state and local government, and energy. All figures were rounded.
CRRA is low in nearly all of the benchmark categories, particularly in IT spending as a percentage of revenue and operating expense. These metrics are a de-facto benchmark used across various industries to measure whether IT spend is appropriate for an organization. However, in the case of CRRA, the IT spend per employee may be more indicative, based on their industry specialization and size. While the IT spending per employee appears consistent with State and Local Governments (the low end of the scale), it’s important to note that CRRA had undergone downsizing from approximately 70 employees. Using 70 as the number of employees would have put the organization just over $4,500 per employee, well below the lowest average in the benchmark. Based on the above comparisons, it appears that IT has been under-funded. This is consistent with the observation that various infrastructure components are in need of upgrades (all PC’s and the Epicor system). With regard to IT staffing as a percentage of total employees, IT is comprised of one full-time employee and part-time consultants who work approximately four-days per month. For
Company Headcount 46
IT Headcount 1.2
2013 Revenues $120,000,000
2013 Operating Expenses $130,000,000
IT Spend (actual 2013) $321,000
CRRA Data Used for IT Benchmarks
Metric All Industries Energy
Gov't (State
and Local) CRRA
IT spend as a percent of total revenue 3.60% 1% - 0.27%
IT spend as a percent of Operating Expense 4% 1% 3.30% 0.25%
IT FTEs as a percent of total employees 5.30% 4.50% 3.60% 2.6%
IT spending per employee $12,700 $13,400 $7,700 $7,000
CRRA IT Spend and Staffing Benchmarking Results

Comprehensive Operational Review of CRRA October 30, 2013
The information contained herein is subject to the disclaimer presented on page 1 of this document.
Page 134
comparative purposes, 1.2 IT FTEs were used as the number to compare against total employees. Even with the reduction in CRRA’s headcount, IT staffing is lower than any industry average. This is one area which would require additional consideration, to determine the optimal blend of in-house vs. external IT support. The IT Director has been able to support the Organization thus far with no full-time staff, through the use of consultants. Yet, based on the current IT architecture and limited user base and low change rate, CRRA might also be well-served by outsourcing IT support completely. The appropriate in-sourcing / out-sourcing model lies in how much the organization needs from IT in the future state. The additional benchmarking information below may also provide some further details. The chart shows how IT departments in the benchmarking survey allocated their funding across three areas:
Running the Business: Essential costs that do not produce revenue (i.e. “keep the lights on”).
Growing the Business: Enhancing or extending existing capabilities. (i.e., does it help the organization make or save money?).
Transforming the Business: Potential for new markets.
As was expected, all of CRRA’s IT spend is allocated to running the business. This was primarily due to an uncertainty about the organization’s future, which resulted in a reluctance to spend money on higher-end IT projects or infrastructure refreshment. It is interesting to note that even State and Local governments, which are known for a lack of spending, have allocated over one third of total IT spending to growing or transforming their organization. A further analysis may be needed to understand how CRRA’s IT might provide additional value to the organization, which could be used to determine the optimal staffing mix and necessary funding.
Run Grow Transform
All Industries 63% 21% 16%
Energy 64% 22% 14%
State and Local Gov't 78% 20% 14%
CRRA 100% 0% 0%
IT Spend Allocation

Comprehensive Operational Review of CRRA October 30, 2013
The information contained herein is subject to the disclaimer presented on page 1 of this document.
Page 135
Task V An analysis of the WTE market in Connecticut and New England, how the CRRA fits into that market, and how that market fits into the larger energy generation and recycling and materials management markets in the region, including, but not limited to, the following:
a) A comparison of CRRA’s WTE operations to other WTE facilities in Connecticut.
b) A comparison of CRRA’s other recycling and materials management to other recycling and materials management providers in Connecticut.
c) A determination of the likelihood that the Authority will remain competitive in the waste market over the next ten years.
d) An analysis of the possibly of divesting some or all of the Authority’s assets and what impact, if any, such divestment would have on the WTE market and the recycling and materials management market in Connecticut.
e) An analysis of current and future opportunities, if any, CRRA might take advantage of in the WTE and/or recycling and materials management markets.
Findings
CRRA is the owner of a WTE facility and other MSW infrastructure. It is currently in a state of affairs in which it may need to identify new sources of revenue to maintain a competitive position in the WTE and MSW market. Since 2005, the Authority has received over 90% of its revenue from tipping fees under contract with municipalities in addition to the sale of electricity generated from its WTE facility. MSW generation per capita started a downward trend in 2008, which in part resulted in the lowering of tipping fees being offered to municipalities. CRRA’s sale of electricity in the wholesale market has experienced a decrease in price, due to an oversupply of cheap natural gas in the Northeast region. Likewise, other sources of revenue for CRRA have experienced similar adverse economic conditions. Prices for Class II renewable energy credits (RECs), that help Connecticut meet its renewable portfolio standards (RPS), are relatively low compared to Class I and III RECs. Lastly, prices for recyclable materials are currently at 25% to 50% of the high price over the past five year period that began in mid-2008. These trends are most likely not expected to change for the better in the near-term. Likewise, CRRA’s sources of revenue most likely will not experience positive change either. CRRA could consider options its competitors are exploring, such as anaerobic digestion or composting, to mitigate the declines in revenue that the Authority is currently experiencing. Covanta Holding Corporation and Wheelabrator Technologies, the Authority’s competitors in the WTE market, are facing similar undesirable market factors. In response these companies are attempting to identify opportunities to increase their profitability. Covanta representatives foresee an increase in organic waste recovery, and have recently announced plans for an anaerobic digester facility in Bristol. Representatives of Covanta expressed confidence in their decision due in part to their perceived support from the State of Connecticut. Wheelabrator is in the process of developing a bilateral contract that could allow the company to sell power to municipalities with whom they have an MSW contract. The company is in coordination with the Connecticut Department of Energy and Environmental Protection (DEEP) to bring the bilateral contracting structure to fruition with the aim to create a pricing structure that will be mutually beneficial for Wheelabrator as well as the

Comprehensive Operational Review of CRRA October 30, 2013
The information contained herein is subject to the disclaimer presented on page 1 of this document.
Page 136
municipalities it services. The underlying similarities among the strategic options private WTE companies are currently, or in the process of putting into place, is the level of initiative and state support to reach these objectives. The Authority’s current modality for fiscal planning could make it dependent on attaining revenue to mitigate its projected budgetary shortfall. CRRA’s forecasting method is referred to as a bottom up approach. This method calculates the tipping fee they charge to municipalities to ensure the costs of running the facility are met, but do not generate a profit. Private WTE facilities in Connecticut operate using a profit driven approach, as opposed to a revenue driven method. The major difference between these two modes of forecasting is the amount of flexibility each one may have to balance its costs and revenues. According to CRRA’s forecast for fiscal years 2014 –2018, a budgetary shortfall of $3.547 million is expected in 2015. To mitigate this budgetary gap, the forecast identifies five overall options. Of these five overall options, four are revenue based and one addresses reducing expenditures. One revenue option is to increase tipping fees, which would have downstream implications on municipal budgets for which a further analysis should be performed. Furthermore, of the total proposed expenditure reductions, $2.2 million out of a total of approximately $3.5 million pertain to the elimination of a PILOT (payment in lieu of taxes) payment for the Hartford plant. CRRA could consider evaluating non-core activities that could allow the Authority to meet the operational efficiencies of its competitors. The Authority’s competitors, private WTE facilities, are afforded advantages derived from establishing economies of scale due to their size and resources as national companies. Private WTE facilities in Connecticut can benefit from large purchase discounts of materials such as lime and urea, thereby reducing their cost of goods sold. In addition, the size of their parent companies could also allow them to coordinate between facilities outside of the state to ensure their capacity for waste is met in Connecticut. Additional economy of scale factors could be attributed to lowering overhead expenditures as well. Private WTE facilities can leverage their ability to coordinate administrative tasks (i.e. human resources, finance, public relations, etc.) across a region such as the Northeast, as opposed to just one organization as is the case with CRRA. It is estimated that CRRA employs 17.865 individuals to administer non-direct labor functions for the Authority’s operations. In comparison, Wheelabrator employs nine administrative staff to support the operations of an equally sized WTE facility (Bridgeport) and two transfer stations. The ability to leverage an economy of scale, in addition to maintaining an economical organizational structure, is significant to achieve the maximum level of operational efficiency. CRRA’s ability to meet and address current market trends is vital to determining the likelihood that the Authority will remain competitive in the waste market over the next ten years. Public sentiment of CRRA has been either neutral or negative according to discussions with municipalities. There are several ways in which CRRA could strengthen its position in the community, while also strengthening its financial prospectus:
CRRA could strengthen its position in the community through the enhanced promotion of recycling and educational programs.
Municipalities have indicated that long-term municipal service agreements (MSAs) whose price can be effectively forecasted year over year in municipal budgets is a significant contributing factor in choosing which WTE company to contract with.

Comprehensive Operational Review of CRRA October 30, 2013
The information contained herein is subject to the disclaimer presented on page 1 of this document.
Page 137
CRRA currently offers up to a $10 per ton rebate to municipalities in all but one of the MSAs available. In theory, this provides an incentive ceiling to municipalities. CRRA could adopt a recycling rebate structure similar to its competitors, who offer a profit sharing program for recyclable materials. This could additionally increase the recycling rate for the state.
CRRA could further analyze enacting a contractual structure between the Authority and other WTE facilities that utilize transfer station(s) closest to each facility. This could aid facilities in meeting their capacity needs in addition to lowering transportation costs.
CRRA could consider other options to increase its competitiveness in the near- to long-term; however, a quantitative analysis would need to be completed to analyze the viability of all options presented.
The absence of CRRA’s mid-Connecticut WTE facility in its current form could have a significant impact on Connecticut’s management of solid waste. Connecticut could lose the economic benefits it gains in the forms of revenue and employment derived from the WTE facility and supporting MSW infrastructure. The Connecticut market could be saturated with an estimated 710,000 tons of MSW. Most private WTE facilities are currently near capacity, which would lead to an oversupply of MSW. Out of state disposal is currently on the incline, and could increase significantly. Disposal out of state would most likely be in the form of landfilling due to its more economical pricing. This could run contrary to the priorities established by Connecticut in its hierarchy of solid waste management. Lastly, municipal tipping fees will most likely increase due to an oversupply of MSW, and a decrease in competition to maintain levels of capacity at facilities. In the case that the mid-Connecticut facility is no longer active in its current form, a situation may arise where Connecticut must weigh the benefits of CRRA as a policy tool versus the risks of no longer having a quasi-governmental entity that acts as a market leader (i.e. sets market rates and drives strategic deployments of technology)
Market Overview
Historical Perspective
The current waste management model for the State of Connecticut came into effect in 1973. The Connecticut state legislature passed the Solid Waste Management Service Act to establish the CRRA. The Authority was established as a means to create a statewide refuse disposal strategy that incorporated the State’s commitment to waste to energy, as a way to reduce reliance on landfills. Section 22a-259 of the Act provides the mandate to reduce, reuse, and recycle, “in order to protect, preserve, and enhance the environment of the state…” The Act established CRRA’s role in promoting the following priorities to manage solid waste in Connecticut:
1. Source reduction;
2. Recycling;
3. Composting of yard waste or vegetable matter;
4. Bulky waste recycling;
5. Resource recovery or waste to energy plants; and
6. Incineration and landfilling

Comprehensive Operational Review of CRRA October 30, 2013
The information contained herein is subject to the disclaimer presented on page 1 of this document.
Page 138
Stakeholders
The Connecticut WTE market is comprised of direct and indirect stakeholders, including not-for-profit, for-profit, quasi-governmental, and state and federal agencies. These stakeholders sustain, foster, regulate, and operate the sector on a local, state, national, and international level. Indirect stakeholders play an important role in this regulated marketplace. Their oversight, advocacy, data collection and convening powers have established best practices in the WTE market. Indirect stakeholders include the following list of entities:
The North American Electric Reliability Corporation (NERC.com)
The Northeast Recycling Council (NERC.org)
The Solid Waste Association of America (SWANA)
Northeast Waste Management Officials’ Association (NEWMOA)
The United States Environmental Protection Agency (US EPA)
The Connecticut Department of Energy and Environmental Protection (DEEP)
National Solid Waste Management Association (NSWMA)
Direct stakeholders of the WTE market include municipalities, haulers, transfer station(s), transporters, and recycling, recovery, and disposal facilities. These groups account for the daily flow and disposal of waste throughout the state of Connecticut.
Landscape
The Connecticut MSW industry is an intricate and interconnected system. The system is initiated by residents; and commercial, municipal, and state level entities that generate MSW; which is collected by contract, municipal haulers, or self-haul. Transfer entities hold MSW for hauling to WTE facilities, landfills, recycling processing facilities, volume reduction plants and other solid waste management facilities. These facilities are constructed to extract the maximum value from refuse materials before final disposal of ash or remaining waste in landfills. The waste management system in Connecticut is shown in Figure 1 below, illustrating the process from generation to disposal.
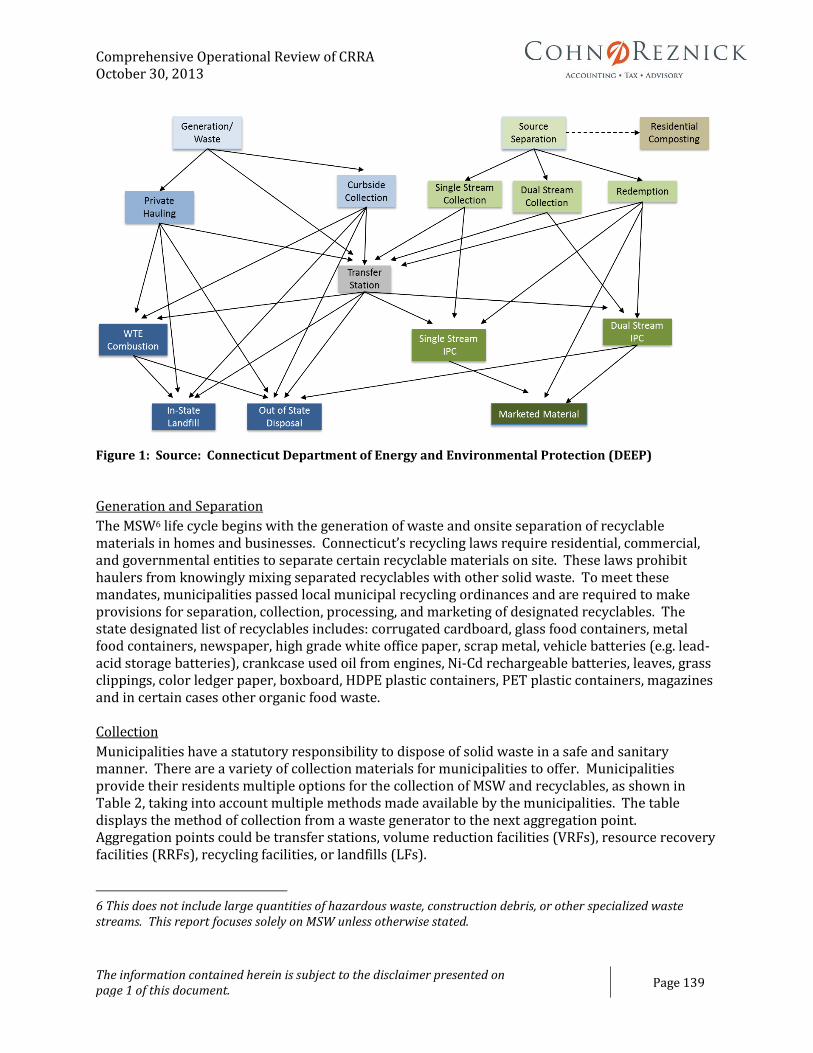
Comprehensive Operational Review of CRRA October 30, 2013
The information contained herein is subject to the disclaimer presented on page 1 of this document.
Page 139
Figure 1: Source: Connecticut Department of Energy and Environmental Protection (DEEP)
Generation and Separation
The MSW6 life cycle begins with the generation of waste and onsite separation of recyclable materials in homes and businesses. Connecticut’s recycling laws require residential, commercial, and governmental entities to separate certain recyclable materials on site. These laws prohibit haulers from knowingly mixing separated recyclables with other solid waste. To meet these mandates, municipalities passed local municipal recycling ordinances and are required to make provisions for separation, collection, processing, and marketing of designated recyclables. The state designated list of recyclables includes: corrugated cardboard, glass food containers, metal food containers, newspaper, high grade white office paper, scrap metal, vehicle batteries (e.g. lead-acid storage batteries), crankcase used oil from engines, Ni-Cd rechargeable batteries, leaves, grass clippings, color ledger paper, boxboard, HDPE plastic containers, PET plastic containers, magazines and in certain cases other organic food waste. Collection
Municipalities have a statutory responsibility to dispose of solid waste in a safe and sanitary manner. There are a variety of collection materials for municipalities to offer. Municipalities provide their residents multiple options for the collection of MSW and recyclables, as shown in Table 2, taking into account multiple methods made available by the municipalities. The table displays the method of collection from a waste generator to the next aggregation point. Aggregation points could be transfer stations, volume reduction facilities (VRFs), resource recovery facilities (RRFs), recycling facilities, or landfills (LFs). 6 This does not include large quantities of hazardous waste, construction debris, or other specialized waste streams. This report focuses solely on MSW unless otherwise stated.

Comprehensive Operational Review of CRRA October 30, 2013
The information contained herein is subject to the disclaimer presented on page 1 of this document.
Page 140
Table 2: Connecticut Department of Energy and Environmental Protection (DEEP) Solid Waste Management System Existing Infrastructure Presentation June 13, 2012
Table 2 depicts the methods municipalities have made available to residents. The table takes into account multiple methods made available by municipalities, and is not indicative of how many residents elect to use a particular service. The most selected method of disposal is hauling directly contracted between residents and private haulers. The primary concern with this method is that private haulers do not have to register with the State of Connecticut; this in turn raises issues with the management of MSW within the state and out of state leakage. Legislation adopted in 2010 requires haulers to submit an annual report to the municipalities within which they operate. This report should identify the destinations of solid waste and recyclables they collect and haul from within the borders of the municipality and to DEEP. The report should indicate the origin, amounts, and types of waste and recyclables directly hauled to out-of-state destinations or to end user destinations without first passing through a Connecticut permitted or authorized solid waste facility. The PRI - Legislative Program Review and Investigation Committee’s 2010 Municipal Solid Waste Management Services in Connecticut Report (PRI Report) illustrates a number of implications this effect can have on municipalities. A few are summarized below:
In the cases where haulers decide where waste is disposed of, municipalities could potentially be liable for damages under the Federal Comprehensive Environmental Response, Compensation, and Liability Act (CERCLA). Additionally, this method could contradict the state’s chosen solid waste management priorities.
Most municipalities have a disposal contract with a private hauler to provide a minimum amount of MSW to their facility in exchange for an agreed upon tipping fee. Furthermore, municipalities that contract with a private hauler must direct that company to dispose of waste at a certain destination. However, private haulers do not have to follow these directions, and can dispose of waste wherever they choose to do so. No system has been established to enforce the directive of the municipality, which could undermine a municipality’s ability to guarantee its MSW volume.
The state plans and permits for the waste management system in order to adequately manage the disposal of MSW generated. The loss of management over where solid waste is disposed of could be counterproductive to state’s planning process.
Collection Methods Used by Municipalities*
Recyclables MSW
Private haulers contracted by residents 71 92
Private haulers contracted by municipality for residents 58 45
Municipality providing pick-up 20 21
Self-haul to transfer stations 77 85
*This table takes into account multiple methods available in some municipalities. Total collection of
recyclables and MSW methods will equal more than 169 in each category due to this reason.

Comprehensive Operational Review of CRRA October 30, 2013
The information contained herein is subject to the disclaimer presented on page 1 of this document.
Page 141
Figure 3 illustrates the contractual status for MSW collection by municipality. Integrated into the map are the locations of each RRF, and the tires-to-energy facility in Sterling, CT.
Figure 3: Summary of MSW Collection Contracts - CT Department of Energy & Environmental Protection (DEEP), Sustainable Materials Management Planning & Implementation, 2013
Transfer and Transportation
Transfer stations are designed to reduce transportation costs and manage MSW flow. At the stations, collection vehicles unload waste into large holding areas or compactors, before transporting the waste for disposal at CT RRFs or CT LFs or out of state facilities or transporting material for recycling to recycling processing facilities or end users (paper mills, manufacturers, etc). The transfer station market, as seen in Table 4, is served by public and private entities. Station size varies depending on how much MSW the facility is permitted to handle per day. Connecticut’s waste management system uses transfer stations to ensure adequate statewide coverage and a more uniform flow of waste to disposal locations.

Comprehensive Operational Review of CRRA October 30, 2013
The information contained herein is subject to the disclaimer presented on page 1 of this document.
Page 142
Transfer Station Types Permitted in Connecticut
Owner Permit Type Description No.
Public
Individual Permits
Small ≤75 tons/day 11
Medium >75 and ≤ 150 tons/day 2
Large >150 tons/day 8
Total Individual Permits 21
General Permit Registrations
Municipal Transfer Station(s) ≤1000 tons/day 131
Recycling General Permits (Drop-site and Recyclables Transfer) 17
Total General Permits 148
Total Public 169
Private
Individual Permit
Small ≤75 tons/day 3
Medium >75 and ≤ 150 tons/day 2
Large >150 tons/day 1
Total Individual Permits 6
Recycling General Permits (Drop-site and Recyclables Transfer) 11
Total Private 17
Grand Total 186
Table 4: Data from Connecticut Department of Energy and Environmental Protection (DEEP), Office of Source Reduction and Recycling
Table 4 is a summary of the issued permits in the State of Connecticut, however, not all of these permits are active facilities. For example, during an interview with one municipal Selectman, representatives of the town identified a permitted transfer station that was currently inactive. The town is currently analyzing the market to identify what, if any options, the transfer station could be turned into. As the market evolves, these underutilized assets could become more common in the MSW market due to decreases in waste generation, new recycling strategies, and increases in out of state landfilling. Transportation
Transportation efficiency is essential to ensuring that waste disposal is cost effective. Transfer stations load commercial hauling trucks for efficient transport of MSW to processing facilities or landfills. Connecticut currently does not have water borne MSW transport; however, rail transport is an option. According to the PRI report, the City of Stamford issued a request for proposals for its

Comprehensive Operational Review of CRRA October 30, 2013
The information contained herein is subject to the disclaimer presented on page 1 of this document.
Page 143
MSW management services in 2007. As a result, Stamford received and accepted a proposal for rail hauling by Transload America. This Stamford contract has since expired, but it is important to identify this disposal option as it may affect the future of MSW disposal in Connecticut. If more municipalities begin to adopt out of state options to meet their needs, significant MSW volume leakage could impact the in state disposal market. Lowered in state volumes could negatively impact meeting the capacity requirements for RRFs, in addition to hindering the state in meeting the priorities for solid waste management outlined above in the historical perspective section. Transformation and Disposal
Transformation and disposal is the largest segment of the waste management system in Connecticut. It is currently served by six resource recovery facilities (RRFs) and seven intermediate processing facilities (IPCs) for recyclable material. According to the PRI Report, state RRFs can handle approximately 7,400 tons/day, while IPCs can handle 3,545 tons/day. In fiscal year 2013 Connecticut RRFs disposed of ash at five privately owned ash residue landfills – one located in Connecticut and the other four located in Massachusetts.
Trends of the Waste to Energy (WTE) and Recyclables Market
The Connecticut MSW market underwent a dramatic transformation from 1973 to the early 90’s in the way MSW is collected, processed, and disposed. Three major trends in the disposal market provide a baseline for the current market conditions. First, the construction of all currently operating RRF facilities occurred during the 1980’s and early 1990’s. Second, the change to incineration of MSW and more stringent EPA requirements for landfills prompted the number of permitted landfills in Connecticut to decline from 170 in the 1970’s, to 100 in the 90’s, and to just 31 in 2009. Currently only one Connecticut landfill accepts MSW. Finally, recycling saw a large upward movement in the early 1990’s, rising to the point where approximately 25% of Connecticut generated MSW is reportedly recycled (actual percent recycled is higher according to DEEP). Historic Trends
Figure 5 illustrates the waste market trends Connecticut experienced during the early 1990’s to early 2000’s. Data from 2005 through 2007 are either incomplete or unavailable, and are not included in this evaluation. This report assumes that numbers from the data gap would follow the trends of the previous years.

Comprehensive Operational Review of CRRA October 30, 2013
The information contained herein is subject to the disclaimer presented on page 1 of this document.
Page 144
Figure 5: Information obtained from Connecticut DEEP, Office of Source Reduction and Recycling. *Data
from 2005–2007 was not available.
Connecticut generated 2.88 million tons of MSW in 1992, growing to 3.48 million tons in 2004. The compounded annual growth rate (CAGR) for this period was 1.59%. Over the same time period, the population CAGR rose only 0.50%, indicating that an increase in per capita consumption resulted in greater waste generation. Increased waste generation compouned by declining landfill capacity resulted in the need for new disposal methods. RRF’s then began to take a much larger role in the market. The percentage of MSW incincerated in RRF’s rose from 53.86% in 1992 to 62.84% in 2004. The amount reported as recycled increased 5.97% from 1992 to 1998, but has stayed relatively constant at 25% of MSW generated. Out of state MSW disposal grew from zero in 1992 to a high of around 10.5% in 2002 before falling to 9.4% in 2004. These trends establish a baseline for comparison to the 2008 to 2011 time period. Table 6 illustrates that from 2004 to 2011, the market experienced an overall decline in MSW generation of approximately 1.2% (CAGR). The population growth during the same period was approximately 0.43% (CAGR). The decline in MSW generation therefore indicates a reduction in per capita waste generation. While a decline is beneficial to the state of Connecticut from a sustainability perspective, it has negative impacts on revenue for WTE facilities. Absent of additional information, it is difficult to isolate the exact reason for this decline. Several likely factors include:
The economic recession of 2008. Household median income declined considerably during the recession, lowering household consumption and resulting in reduced MSW generation.
New methods and materials for packaging consumable goods. Reductions in the amount and weight of material used to package consumable goods, as well as increased use of electronic news media in lieu of paper media, may have caused some of the stagnation in recycling percentages.
-
500,000
1,000,000
1,500,000
2,000,000
2,500,000
3,000,000
3,500,000
4,000,000
19
92
19
93
19
94
19
95
19
96
19
97
19
98
19
99
20
00
20
01
20
02
20
03
20
04
20
08
20
09
20
10
20
11
Historic Connecticut MSW Sector Trends
CT Population – US Census Bureau
CT MSW Generation (tons)
CT MSW Total Disposed(tons)
CT MSW Disposed at RRFs(tons)
CT MSW Recycled (tons)
CT MSW Disposed at CTLandfills (tons)
CT MSW Disposal Out ofState (tons)

Comprehensive Operational Review of CRRA October 30, 2013
The information contained herein is subject to the disclaimer presented on page 1 of this document.
Page 145
Estimates of Connecticut Municipal Solid Waste Generated (tons)
2004 2008 2009 2010 2011
MSW Generated 3,483,100.00 3,401,085.00 3,181,728.00 3,179,224.00 3,218,007.00
MSW Disposed in CT
Landfills 152,518.00 163,542.87 105,714.21 21,426.92 25,244.57
MSW Burned in CT RRF’s 2,188,936.00 2,110,855.49 2,106,218.76 2,150,746.78 2,076,525.39
MSW Disposed Out of State 326,489.00 261,254.79 193,415.20 237,699.77 317,589.11
Total Disposed 2,668,303.00 2,535,653.15 2,405,348.17 2,409,873.47 2,419,359.07
Recycled 814,797.00 865,431.89 776,380.23 769,353.36 798,647.93
Percent Burned in CT RRF’s
of Generation 62.84% 62.06% 66.20% 67.65% 64.53%
Percent MSW Reported
Recycled of Generation 23.39% 25.45% 24.40% 24.20% 24.82%
Percent Disposed Out of State
of Generation 9.38% 7.68% 6.08% 7.48% 9.87%
Table 6: Connecticut DEEP Estimates of Connecticut MSW Generated, Disposed, and Recycled for Fiscal Years 2008-11
Out of state MSW disposal reached a peak of 366,000 tons in 2002 before declining in 2003 and 2004. The Connecticut market experienced growth in out of state disposal from 2009 to 2011, increasing from 6.08% to 9.87%. Table 7 below shows the breakdown of the final destination for out of state MSW disposal. Nearly 75% of waste was disposed at out of state landfills, which further supports the assumption that out of state disposal could negatively impact Connecticut’s solid waste management priorities.

Comprehensive Operational Review of CRRA October 30, 2013
The information contained herein is subject to the disclaimer presented on page 1 of this document.
Page 146
Tons of MSW Disposed Out of State in Fiscal Year 2011
Total Connecticut MSW to Out of State Landfills 235,045.97
Total Connecticut MSW to Out of State Resource Recovery Facilities 77,538.62
Total Connecticut MSW to New York Transfer Station(s) 1,016.55
Added 8/23/2013 from AMRR 3,713.02
Total MSW Out of State 317,314.16
Table 7: Data from Connecticut Department of Energy and Environmental Protection (DEEP), Office of Source Reduction and Recycling
The trend illustrated in Figure 8 shows the approximate average amount of energy produced by each RRF from 1996-2011.
Figure 8: Data from tonnages burned and net energy produced from Connecticut Department of Energy and
Environmental Protection (DEEP), Office of Source Reduction and Recycling
The net energy produced per ton of waste in Figure 8 shows an average efficiency reduction of approximately 5.58% from 1996 to 2011. In terms of singular plant efficiency, the Mid-Conn facility, which is one of the two largest, degraded in performance by approximately 12.68% from 1996 to 2011. Two possible scenarios, or a combination of both, were identified as the possible source of these discrepancies. Degradation could cause the plants to be less efficient, or British thermal unit (Btu) value of waste has fallen over time. According to a representative at the Wheelabrator Bridgeport facility, plastics and cardboard in the waste stream have been decreasing over time. Plastics and cardboard have a high Btu content,
450
500
550
600
650
700
1996 1997 1998 1999 2000 2001 2002 2003 2004 2005 2006 2007 2008 2009 2010 2011
Ne
t kW
h p
er C
alcu
late
d T
on
Bu
rned
Net kilowatt hours (kWh) per Ton of Waste Burned by RRF
BRIDGEPORT RRF RESOCO. L.P.
BRISTOL RRF
LISBON RRF
MID - CT RRF
PRESTON RRF -COVANTA SECONN
Average kWh/tonsburned

Comprehensive Operational Review of CRRA October 30, 2013
The information contained herein is subject to the disclaimer presented on page 1 of this document.
Page 147
which provides evidence to the second option of what may be causing reductions in plant output. It was noted with a high-level of certainty that this could be attributed to a rise in single stream recycling. Other contributing factors could be the expansion of recycling to include other types of paper and plastics, increased market demand for corrugated cardboard, and a decrease in the amount of newspaper and magazines generated due to changes in types of media used.
Overall Value
The WTE market provides Connecticut a valuable method of reducing the end cost of MSW disposal while eliminating in state MSW landfilling. This method is considered valuable in part due to the societal benefits of job creation these markets provide, and the positive economic impact of reduced use of landfills. Furthermore the industry is able to generate revenue through it sale of electricity and recyclable materials, from materials that would otherwise have been landfilled at a cost. Waste to Energy Sector - Economic Impact
CRRA commissioned a study of the beneficial economic impacts the MSW and WTE industries have on the state of Connecticut. The report, Statewide Economic Impacts of Waste to Energy in Connecticut by Governmental Advisory Associates, Inc., estimated that aggregate revenues for waste to energy facilities in the Connecticut market was $247.8 million dollars in 2011, as shown in Table 9. In addition to the direct impact of WTE facilities, the Connecticut economy is also estimated to have gained positive indirect and induced impacts on various industry sectors (finance and insurance, real estate rental and leasing, health care and social assistance, retail trade, etc).
2011 Economic Impact Summary of the Waste to Energy Sector
Direct Impact* Indirect Impact Induced Impact Total
Total Revenue $247,877,000 $85,594,000 $94,571,000 $428,042,000
Employment** 381 209 349 939
Labor Earnings*** $32,652,000 $12,946,000 $14,434,000 $60,032,000
Value Added**** N/A $147,811,240 $104,221,000 $252,033,000
*Total Revenues, Jobs and Job Earnings of 6 WTE plants in Connecticut
**Includes 18 staff of CRRA and Bristol Resources Recovery Authority allocated to WTE
***Using average salary and benefits of $85,700 (Maine Study)
****Value added reflects taxes paid, and business and household investments, as well as earnings
Table 9: Statewide Economic Impacts of Waste to Energy; Source: Statewide Economic Benefits of Connecticut’s Waste to Energy Sector, February 2013
MSW Sector - Economic Impact
As covered previously, the process from generation to disposal is composed of numerous stakeholders. Table 10 is a summary of the estimated economic impact of the waste collection and transfer industry. Total direct revenue during 2011 is estimated to be around $332 million for the hauling industry. Total direct employment was estimated at 4000 jobs. Absent the recycling
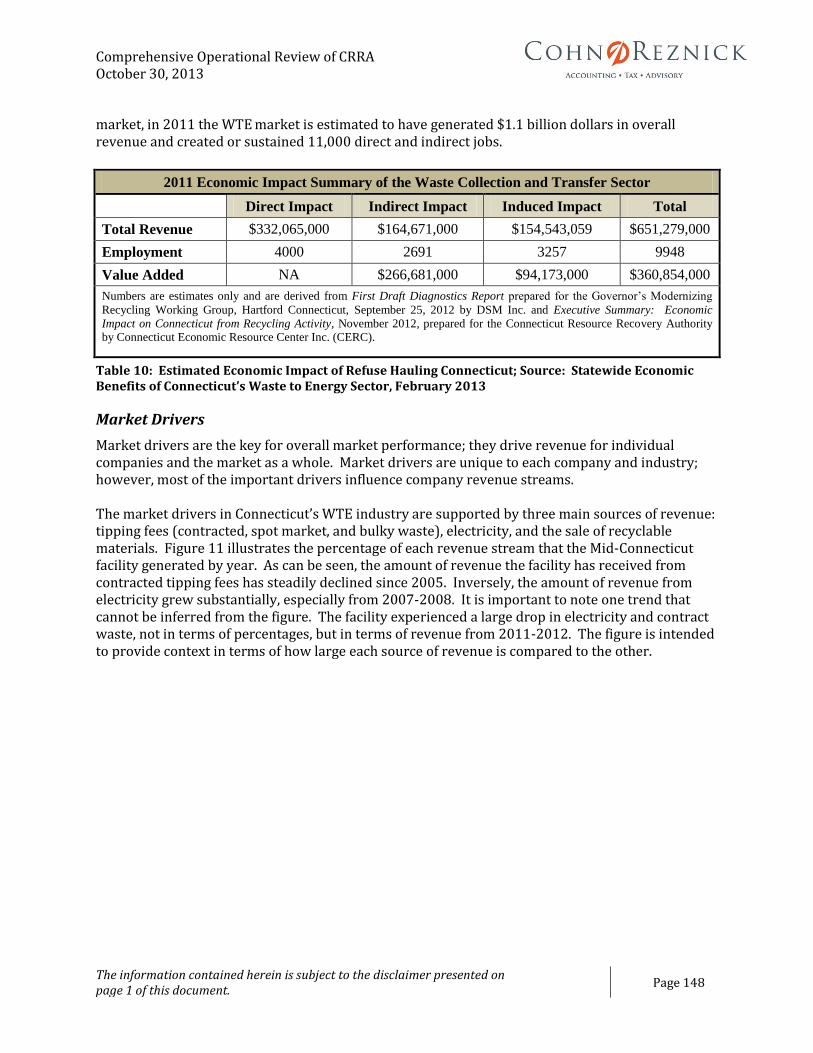
Comprehensive Operational Review of CRRA October 30, 2013
The information contained herein is subject to the disclaimer presented on page 1 of this document.
Page 148
market, in 2011 the WTE market is estimated to have generated $1.1 billion dollars in overall revenue and created or sustained 11,000 direct and indirect jobs.
2011 Economic Impact Summary of the Waste Collection and Transfer Sector
Direct Impact Indirect Impact Induced Impact Total
Total Revenue $332,065,000 $164,671,000 $154,543,059 $651,279,000
Employment 4000 2691 3257 9948
Value Added NA $266,681,000 $94,173,000 $360,854,000
Numbers are estimates only and are derived from First Draft Diagnostics Report prepared for the Governor’s Modernizing
Recycling Working Group, Hartford Connecticut, September 25, 2012 by DSM Inc. and Executive Summary: Economic
Impact on Connecticut from Recycling Activity, November 2012, prepared for the Connecticut Resource Recovery Authority by Connecticut Economic Resource Center Inc. (CERC).
Table 10: Estimated Economic Impact of Refuse Hauling Connecticut; Source: Statewide Economic Benefits of Connecticut’s Waste to Energy Sector, February 2013
Market Drivers
Market drivers are the key for overall market performance; they drive revenue for individual companies and the market as a whole. Market drivers are unique to each company and industry; however, most of the important drivers influence company revenue streams. The market drivers in Connecticut’s WTE industry are supported by three main sources of revenue: tipping fees (contracted, spot market, and bulky waste), electricity, and the sale of recyclable materials. Figure 11 illustrates the percentage of each revenue stream that the Mid-Connecticut facility generated by year. As can be seen, the amount of revenue the facility has received from contracted tipping fees has steadily declined since 2005. Inversely, the amount of revenue from electricity grew substantially, especially from 2007-2008. It is important to note one trend that cannot be inferred from the figure. The facility experienced a large drop in electricity and contract waste, not in terms of percentages, but in terms of revenue from 2011-2012. The figure is intended to provide context in terms of how large each source of revenue is compared to the other.

Comprehensive Operational Review of CRRA October 30, 2013
The information contained herein is subject to the disclaimer presented on page 1 of this document.
Page 149
Figure 11: Connecticut Resources Recovery Authority (CRRA) Revenues by Stream; Source: CRRA
Power Prices
Power prices are a primary driver for WTE power plants. Connecticut, like most of the U.S., has experienced depressed electricity prices since 2008, as seen in Table 26. Compounded by a decrease in overall electricity demand, revenue from power sales has decreased for many power generation companies across the U.S. However, power sale revenue is necessary to make WTE plants economically viable.
According to the 2012 Integrated Resource Plan for Connecticut, developed by the Department of Energy and Environmental Protection (DEEP), Connecticut’s electrical consumption will not exceed 2005 levels until 2022. Base load demand is expected to increase only 1% per year with higher growth rates expected for peak load. A key factor in future power prices will be the retirement of coal plants under the Environmental Protection Agency’s (EPA) new regulations. Power generators will have to be in compliance with these new EPA regulations starting in 2015. According to DEEP, their growth rate takes into account planned power plant retirements to meet stricter EPA air emissions rules. The primary issue with this assumption is the uncertainty regarding the exact number of retirements across the U.S. It is hard to predict just how much of an effect these new regulations will have on the U.S. power market, as the regulations are still largely unknown.
According to various industry estimates, these new regulations are expected to take offline as much as 60 to 100 gigawatts (GW) of coal-fired generation across the country. The Brattle Group estimates between 59 GW to 77 GW of coal fired generation will be taken offline. In terms of
18.0% 21.7% 21.6%
27.2% 28.7% 29.4% 27.9% 24.9%
75.1% 70.3%
70.5% 63.1%
62.8% 64.1% 63.4%
66.7%
$-
$10,000,000
$20,000,000
$30,000,000
$40,000,000
$50,000,000
$60,000,000
$70,000,000
$80,000,000
$90,000,000
$100,000,000
2005 2006 2007 2008 2009 2010 2011 2012
Tota
l Re
ven
ue
Connecitcut Resources Recovery Authority (CRRA) Revenue Stream Summary
Bulky Waste
Sale of Recovered Metals
Sale of Other Recyclables
Tipping Fee - Spot
Tipping Fee - Contracted
Electricity Sales

Comprehensive Operational Review of CRRA October 30, 2013
The information contained herein is subject to the disclaimer presented on page 1 of this document.
Page 150
current coal-fired generating capacity, The Brattle Group estimates this amount to be between 17.35% and 22.64% and between 5.64% and 7.36% of total generating capacity in 2015.
Projected Retirements by ISO/RTO Region
ISO / RTO Region Coal Retirement (GW) % of Coal Capacity % of Total Capacity
PJM 14 to 21 18-27% 8-11%
MISO 11 to 16 17-24% 9-13%
SPP 3 to 4 12-16% 4-6%
ISO-NE 0.8 33% 3%
NYISO 0.5 to 0.6 20-24% 1-2%
ERCOT 0.4 2% 0%
CAISO 0.1 to 0.2 5-10% 0%
Table 12: Projected Retirements by Independent System Operators (ISOs) and Regional Transmission Organizations (RTOs) Region; Source: The Brattle Group
While Connecticut, and more specifically the New England Independent System Operator (ISO) region, does not have a large percentage of coal capacity retiring; PJM, a neighboring ISO, does, which could affect power prices in the Northeast. These effects will likely drive up power prices across New England. If the retired capacity is between 59 GW and 77 GW, power prices will have to increase to incentivize generators to build new capacity to satisfy the gap. The current unknown is just how big the deficit will be. Another market driver affecting power prices in the Northeast is the supply of natural gas to the region. According to the 2012 Integrated Resource Plan for Connecticut, most power generators in Connecticut rely on “as-delivered,” non-firm pipeline gas, potentially causing a shortage issue during the winter. This is attributed to high natural gas demand and strained supply during winter months. Storms occasionally take supply offline, causing reserves to dwindle and forcing plants to stop running. However, Connecticut’s non-gas generation and gas generation with firm supply should be able to meet wintertime capacity required to cover this potential gap. Wintertime operational characteristics still need to be fully analyzed to assure continued reliability and affordable pricing. Figure 13 is an example of the volatility of spot natural gas prices during the winter of 2012 – 2013.

Comprehensive Operational Review of CRRA October 30, 2013
The information contained herein is subject to the disclaimer presented on page 1 of this document.
Page 151
Figure 13: Northeastern Natural Gas Market: Spot Prices and Basis; Source: Federal Energy Regulatory Commission Derived from Platts data***Basis = fixed transport cost
Satisfying demand requirements during winter climate conditions can strain gas supply to the power plants. The strain from natural events coupled with the increased residential demand for wintertime gas heat could drive power prices up in the winter months. However, barring a severe weather event, the likelihood of these events is low. Even with the volatility of spot prices during the winter of 2012 – 2013, the average annual power price still remained relatively low (Table 14). In order to take advantage of the spot electricity market, power generators would need to take on additional market risk instead of selling into the more predictable day-ahead market.
Northeast Annual Average Spot Hub Prices
Annual Average Day Ahead Prices ($/MMBtu)
2008 2009 2010 2011 2012 5-Year Avg
Algonquin Citygates $10.06 $4.80 $5.29 $4.99 $3.94 $5.82
Transco Z6 NY $10.13 $4.89 $5.41 $4.98 $3.26 $5.73
Transco Z6 non-NY $9.85 $4.64 $5.25 $4.68 $2.99 $5.48
Columbia - Appalachia $9.18 $4.11 $4.52 $4.07 $2.78 $4.93
Table 14: Northeast Natural Gas Market: Yearly Hub Prices; Source: Federal Energy Regulatory Commission Derived from Platts data

Comprehensive Operational Review of CRRA October 30, 2013
The information contained herein is subject to the disclaimer presented on page 1 of this document.
Page 152
Incentives, Subsidies, and Tariffs
Many emerging industries receive incentives to build manufacturing facilities and power projects. Several incentive programs are the Investment Tax Credit (ITC) and the Advanced Energy Manufacturing Tax Credit. However, waste and waste to energy are neither emerging technologies nor popular sectors to receive incentives. To date, applicable waste processing or landfill incentives, subsidies, or tariffs have not been identified; therefore, the focus of this section is placed on WTE incentives, subsidies, and tariffs. Federal
On the Federal level, energy derived from MSW is eligible for the Production Tax Credit (PTC) to support the development and operation of a new WTE facility. The PTC was established under the American Recovery and Reinvestment Act of 2009 (ARRA)(H.R. 1 Div. B, Section 1101 & 1102) and recently renewed under the American Taxpayer Relief Act of 2012 (H.R. 6, Sec. 407), enacted in January of 2013. The January 2013 act refined the definition of MSW to exclude paper that would be commonly recycled and has been segregated from other waste. This definitional change only applies for facilities commissioned after January 2013. For a WTE facility to qualify for the PTC, it has to be placed in service after the legislation was enacted and barring any extension of the PTC, any facility wishing to qualify for the tax credit must begin construction by December 31, 2013. The production credit is set for ten (10) years at $0.011 per kilowatt hour (kWh); except in the case of facilities commissioned between October 22, 2004 and August 8, 2005. These facilities are only eligible for a five (5) year credit. ARRA also allows facilities eligible for the PTC to take advantage of the Investment Tax Credit (ITC) instead of taking the PTC for new installations. The ITC is a fixed 30% tax credit on a facility’s eligible capital costs; however, if the PTC is allowed to expire at the end of 2013, then MSW facilities would no longer qualify for the ITC. Choosing whether to elect to utilize the PTC or ITC is an economic decision and should be thoroughly discussed with financial, tax, and legal advisors. Each tax credit has its own set of risks and nuances that must be analyzed to determine which incentive adds the most value to a project.
2012-2013 Voluntary Carbon Markets
Bid Ask
Verified Carbon Standard
Generic International Verified Carbon Units (VCU) $ 0.30 $ 0.60
Generic US-Site Verified Carbon Units (VCU) $ 0.75 $ 1.00
Climate Action Reserve
Generic Climate Reserve Tonnes (CRT) $ 0.80 $ 0.90
Table 15: Source - Karbone Renewables Research, as of October 4, 2013

Comprehensive Operational Review of CRRA October 30, 2013
The information contained herein is subject to the disclaimer presented on page 1 of this document.
Page 153
State
In 1998, the State of Connecticut established a renewable portfolio standard (RPS) under which electric suppliers, electric distribution companies, and load serving entities have to obtain at least 23% of their retail load through qualified renewable power by January 1, 2020. RPS obligations can be satisfied by purchasing electricity generated by Class I or Class II resources located within the jurisdiction of the New England ISO. To meet this requirement, each electric supplier, electric distribution company, and load serving entity has to purchase renewable energy credits (RECs), which are equal to one megawatt hour of power generated by a qualified renewable facility. RECs are traded, purchased, and tracked through the NEPOOL Generation Information System (NEPOOL-GIS). Each class of generating facilities is defined as follows:
Class I: resources include electricity produced by solar power, wind power, fuel cells, geothermal, landfill methane gas, anaerobic digestion or other biogas derived from biological sources, ocean thermal power, wave or tidal power, low-emission advanced renewable energy conversion technologies, certain run-of-the-river hydropower facilities not exceeding thirty (30) MW in capacity, and biomass facilities that use sustainable biomass fuel and meet certain emissions requirements.7
Class II: resources include trash-to-energy facilities, certain biomass facilities not included in Class I, and certain older run-of-the-river hydropower facilities.8
Class III: resources include: “combined heat and power systems with an operating efficiency level of no less than fifty (50) per cent that are part of customer-side distributed resources developed at commercial and industrial facilities in this state on or after January 1, 2006, a waste heat recovery system installed on or after April 1, 2007, that produces electrical or thermal energy by capturing preexisting waste heat or pressure from industrial or commercial processes, or the electricity savings created in this state from conservation and load management programs begun on or after January 1, 2006."9
Electricity providers are required to meet the RPS with a minimum of 20% Class I and 3% Class I or II resources by January 1, 2020, and 4% Class III sources by 2010. Table 16 outlines the compliance timeline for every electrical provider.
7 Source: Conn. Gen. Stat. §16-1(a)(45) 8 Source: Conn. Gen. Stat. §16-1(a)(27) 9 Source: Conn. Gen. Stat. §16-1(a)(44)

Comprehensive Operational Review of CRRA October 30, 2013
The information contained herein is subject to the disclaimer presented on page 1 of this document.
Page 154
Connecticut Renewable Portfolio Standard Compliance Schedule 2013 - 2020
Year Class I Class I or Class II Class III Total
2013 10.0% 3.0% 4.0% 17.0%
2014 11.0% 3.0% 4.0% 18.0%
2015 12.5% 3.0% 4.0% 19.5%
2016 14.0% 3.0% 4.0% 21.0%
2017 15.5% 3.0% 4.0% 22.5%
2018 17.0% 3.0% 4.0% 24.0%
2019 19.5% 3.0% 4.0% 26.5%
2020 20.0% 3.0% 4.0% 27.0%
Table 16: Compliance Schedule by Year for Connecticut Renewable Portfolio Standard; Source: Connecticut Department of Energy & Environmental Protection.
If electricity providers fail to comply with the above compliance schedule then they are forced to pay a penalty. The penalty equates to $0.055 per kWh or $55 per Connecticut Class I/II NEPOOL REC. This penalty is an alternative compliance payment (ACP), which is the amount that electricity providers must pay per MWh of electricity that they are unable to generate themselves or buy rights to through REC purchases in order to meet the Connecticut RPS requirement.
NEPOOL Current Pricing for Class I, II, and III RECs ($/MWh)
Bid Ask
MA Class I 47.25 – 64.00 50.00 – 65.00
MA Class II 7.50 8.50
CT Class I 37.75 – 53.75 39.00 – 55.75
CT Class II ~ 0.40 – 0.50 ~ 0.50 – 0.55
CT Class III 10.00 – 17.00 10.75 – 20.00
Table 17: Source - Karbone Renewables Research, as of October 4, 2013
Tipping Fees
Tipping fees comprise a large percentage of WTE facility revenue. Tipping fees vary across New England and the state of Connecticut, by RRF, and even within each individual RRF. Municipal waste agreements can provide additional services (such as pick-up, transportation, disposal, education, carts, arrangements for bulky waste, etc.) bundled into each contract. Bundling disposal services often alters the tipping fee offered. Table 18 provides a summary of CRRA’s municipal services agreements. The table illustrates the differences in available contracts. While the structure of each tier is different, it is evident that most municipalities have chosen the tier offering a longer term.

Comprehensive Operational Review of CRRA October 30, 2013
The information contained herein is subject to the disclaimer presented on page 1 of this document.
Page 155
Mid-Connecticut Municipal Service Agreements and Comparison of Terms
MSA
Options Town
Contract
Start Date
Contract
Duration
(Years)
Services
Covered Pricing for SW Disposal
Tier 1
Short-term Beacon Falls June 30, 2012 5
MSW and
Recycling
$62.50 with an opt-out level
of $63.00; Target recycling
rebate up to $10/ton)
Tier 1
Short-term
Durham /
Middlefield June 30, 2012 5 MSW only
$62.50 with an opt-out level
of $63.00
Tier 1
Long-Term Cornwall June 30, 2012 15
MSW and
Recycling
$60.50 with an opt-out level
of $61.00; Target recycling
rebate not to exceed
$10/ton)
Tier 2
Contract Manchester June 30, 2012 3 MSW Only $64.50
Tier 3
Renewal Chester June 30, 2012 15
MSW and
Recycling
$60.50 with an opt-out level
of $61.00; Target recycling
rebate not to exceed
$10/ton)
Table 18: Source – CRRA Website *Tier 1 Long-Term MSA (MSW without recycling) and Tier 4 MSA not included, due to no contracts signed under these options.
Comparing the figure above to what other disposal companies charge provides a broad view of the current economic options for municipalities. It should be noted that none of the agreements are standard offers. Furthermore, recycling rebates included in many contracts have a major impact on tipping fees and overall contract economics.

Comprehensive Operational Review of CRRA October 30, 2013
The information contained herein is subject to the disclaimer presented on page 1 of this document.
Page 156
Sampling of non-Mid Connecticut Municipal Service Agreements and Comparison of Terms
Town Company
Contract
Start
Date
Contract
Duration
(Years)
Services
Covered by
Contract
Pricing for SW
Disposal
West
Hartford
Bristol -
Covanta 11/16/2012
5 (MSW)
2 (Recyclables)
Processing
and disposal
$58.75 + 2.5% each
year; Recyclables -
per ton sale and/or
market driven revenue
share
Enfield Preston -
Covanta 11/16/2012 5
Processing
and disposal
$58.75 for first 2 years;
$60.22 -63.27
Vernon Preston -
Covanta 11/16/2012 5
Processing,
recycling and
disposal
1st year: $59. 2nd
year: $60.48 3rd year:
$61.99 4th Year:
$63.54 5th year: $65.12
with $20/ton recycling
rebate
Bolton
Willimantic
Waste Paper
Co., Inc.
11/15/2012 5 Accept and
process only
MSW: $60.00-
66.20/ton for 5 yr.
term; BW: $60.00-
66.20/ton for 5 yr.
Term; Recyclables: Up
to $50.00/ton based on
MPI
Suffield
USA Hauling
& Recycling
Inc
11/15/2012 3
Processing,
recycling and
disposal
$57.50 (MSW) $22.50
(recycling rebate)
Southbury Wallingford -
Covanta 1-Nov-12 4 (up to 12) Disposal only
$59/ton + annual rise of
2% each year. ;
Bethany Bridgeport -
Wheelabrator N/A 5.5 N/A
$61.00 + adjusted
consumer price index
(annually) + $2 admin
fee (to CRRA)
Table 19: Source - Data from Connecticut Department of Energy and Environmental Protection (DEEP), Office of Source Reduction and Recycling

Comprehensive Operational Review of CRRA October 30, 2013
The information contained herein is subject to the disclaimer presented on page 1 of this document.
Page 157
Table 19 provides a summary of current facility pricing terms for MSW disposal and recycling rebates. The table is not a comprehensive schedule of tipping fees, but a fair sampling of what is currently offered to the marketplace. When comparing Table 18 and Table 19, the following items stand out as relevant to municipality waste disposal decision-making based on CRTE interviews:
In most cases the tipping prices offered by CRRA are higher than others in the marketplace.
CRRA provides long-term contracts without a fixed tipping fee. Instead CRRA provides an opt-out price level that allows a municipality to cancel the contract if the price reaches or exceeds that amount for that given year.
Contrary to an opt-out price strategy, competitors in the market provide a fixed rate with an annual price escalator. Based on interviews with several municipal officials, this stability allows for a certain amount of surety from one budget year to the next.
Commodity Prices [Value of Recyclable Materials]
The recyclables market generates revenue for the waste to energy sector in two ways. The first is derived from presorted waste generated by residents, commercial, municipal, and state level entities in accordance with the state designated list of recyclable material. The second revenue source comes from the waste to energy process when ferrous and non-ferrous metals are recovered from the ash residue and sold. Sorted Metals at WTE Plants
It is challenging to account for the amount of each type of metal that is routinely recovered by WTE facilities. However, according to a three-year agreement that began July 1, 2013 between CRRA and WTE Recycling, Inc. the following estimation was made in regards to how much revenue could achieved yearly by this process: “Pre-and post-combustion ferrous metal rate paid to CRRA is tied to Philadelphia High Side Shredded Auto Scrap Index as published by American Metal Market. Scrap metal rate paid to CRRA is tied to the #1 HMS High Side Index as published by American Metal Market. Using the current market index prices and estimated volume of metal recovered, CRRA could realize approximately $2,000,000 in direct revenue from the metal sold, and approximately $120,000 in avoided landfill disposal costs each contract year.” According to CRTE interviews, CRRA currently yields approximately 1,500 tons/month of ferrous metals pre-combustion and 100-tons/month post-combustion. During one of these discussions, it was noted that CRRA had just started the process of working with its operator NAES Corp to further refine the method to yield more tons per month from the post-combustion ash. There is also an opportunity to extract non-ferrous metals from the waste stream pre-combustion and post-combustion which could increase metal recovery by an additional 100-200 tons/month. Increasing recovery yields will increase revenue and decrease landfilling costs. Residential sorting
Figure 20 shows the approximate amount of recyclable materials in MSW from 2008 to 2011. It should be noted that Connecticut recycling tonnages are conservative figures, since they do not

Comprehensive Operational Review of CRRA October 30, 2013
The information contained herein is subject to the disclaimer presented on page 1 of this document.
Page 158
include the items in the bottom of the chart and the material recycled by direct haul from generator to end market or to out-of-state destinations, since these tonnages may not be represented in the reports submitted to the DEEP.
Figure 20: Connecticut DEEP Estimates of Connecticut MSW Generated, Disposed, and Recycled for Fiscal Years 2008-11
Paper Paper comprises a large percentage of the material recycled in the state of Connecticut. Figure 21 and Figure 22 depict the historical average monthly pricing for five types of paper in the United States Northeast region as reported by Secondary Materials Market. These prices are used by recycling facilities to gauge how much of each material they will purchase from various supplier entities (haulers, RRFs, residents/commercial). Mixed paper can be comprised of junk mail, computer printer paper, magazines, and catalogs. Sorted office paper and solid white ledger is of higher grade compared to mixed paper, and #6 and #8 newspaper are of different levels of quality, #6 being the higher grade. As the graphs depict, the price for these three types of materials saw a large drop at the end of 2008. The price rose again in mid-2011 before declining later that year and settling around the lower quarter of the spread between the high and low prices.
0 200,000 400,000 600,000 800,000 1,000,000
2008
2009
2010
2011
Tons
Cal
en
dar
Ye
ar
Summary of Recycling Stream Compostion
Paper
*Organics
**Containers(bottles & cans)
***Scrap Metal
****Other
*Represents pre-compost weight- not weight of final products) **Represents tons marketed, and doesn’t include most of the material recycled through the CT bottle deposit law infrastructure, which according to DEEP is grossly under-reported. ***Represents amount collected for recycling minus 15% for residue. Tonnage does not include most of the scrap metal recycled through commercial or institutional sectors. ****Electronics, waste oil, batteries , etc. (represents tons collected for recycling mostly through municipal programs. Does not represent tons marketed)

Comprehensive Operational Review of CRRA October 30, 2013
The information contained herein is subject to the disclaimer presented on page 1 of this document.
Page 159
Figure 21: Source - Secondary Materials Market
Figure 22: Source - Secondary Materials Market
Bottle and Can Containers Plastic bottles and metal cans (steel or aluminum) are not a large percentage of the recycling market. As noted previously in Figure 20, these materials are largely under-reported due to Connecticut’s bottle bill. Passed in 1978, the bill established a five-cent charge, which can be redeemed when the container is returned to a redemption center. The five-year trends for these materials are shown in Figure 23, Figure 24, and Figure 25 and follow closely the trends as seen in the paper market. The steel and aluminum can market is mostly stable and above the low they experienced in the first quarter of 2009. Plastics pricing is comparatively higher, especially HDPE Natural which is near its previous high experienced in mid to late 2008.
$0.00
$50.00
$100.00
$150.00
$200.00
$250.00
$300.00
$350.00
$400.00M
ay-0
8
Au
g-0
8
No
v-0
8
Feb
-09
May
-09
Au
g-0
9
No
v-0
9
Feb
-10
May
-10
Au
g-1
0
No
v-1
0
Feb
-11
May
-11
Au
g-1
1
No
v-1
1
Feb
-12
May
-12
Au
g-1
2
No
v-1
2
Spot Market Price for Paper ($/ton)
Sorted Office Paper
Solid White Ledger
Mixed Paper
$0.00$20.00$40.00$60.00$80.00
$100.00$120.00$140.00$160.00$180.00
May
-08
Sep
-08
Jan
-09
May
-09
Sep
-09
Jan
-10
May
-10
Sep
-10
Jan
-11
May
-11
Sep
-11
Jan
-12
May
-12
Sep
-12
Jan
-13
May
-13
Sep
-13
Spot Market Price for Newspaper ($/ton)
Newspaper #6
Newspaper #8

Comprehensive Operational Review of CRRA October 30, 2013
The information contained herein is subject to the disclaimer presented on page 1 of this document.
Page 160
Figure 23: Source - Secondary Materials Market
Figure 24: Source - Secondary Materials Market
-
20.00
40.00
60.00
80.00
100.00
120.00M
ay-0
8
Sep
-08
Jan
-09
May
-09
Sep
-09
Jan
-10
May
-10
Sep
-10
Jan
-11
May
-11
Sep
-11
Jan
-12
May
-12
Sep
-12
Jan
-13
May
-13
Spot Market Price for Aluminum Cans (¢/lb)
Aluminum Cans (¢/lb)
-
2.00
4.00
6.00
8.00
10.00
12.00
May
-08
Sep
-08
Jan
-09
May
-09
Sep
-09
Jan
-10
May
-10
Sep
-10
Jan
-11
May
-11
Sep
-11
Jan
-12
May
-12
Sep
-12
Jan
-13
May
-13
Spot Market Price for Steel Cans (¢/lb)
Steel Cans (¢/lb)

Comprehensive Operational Review of CRRA October 30, 2013
The information contained herein is subject to the disclaimer presented on page 1 of this document.
Page 161
Figure 25: Source - Secondary Materials Market
Commodity market prices are not as high as they were in late 2008, though current prices still provide revenue support for the WTE industry in Connecticut. It is difficult to predict with any certainty where these prices will be in the next five years, based on the trends seen in the above figures. However, educating the public based on targeted promotion for specific materials could enable the state of Connecticut to increase its revenue if it can receive higher volumes of the most valuable materials.
Market Barriers
Market barriers are circumstances that block potential competitors from entering the market, or that stifle growth for companies established within specific markets. With a basically fixed supply, and fluctuating revenue streams, tipping fees and power sales, WTE is a challenging market for even the most experienced operator. Overcoming key market barriers in the waste market can be difficult due to increasing capital, operating and regulatory costs, low power prices, and increased competition.
Power Prices
At its peak in 2008, the New England power market reached an annual average of $91.55 per megawatt hour (MWh) at the Mass Hub; however, since 2008 the market has been extremely depressed. This depression is mainly due to low natural gas prices in the U.S. Table 26 shows the annual average for five years for regional power prices.
-
10.00
20.00
30.00
40.00
50.00Ju
n-0
8
Oct
-08
Feb
-09
Jun
-09
Oct
-09
Feb
-10
Jun
-10
Oct
-10
Feb
-11
Jun
-11
Oct
-11
Feb
-12
Jun
-12
Oct
-12
Feb
-13
Jun
-13
Spot Market Price for Plastics (¢/lb)
HDPE Colored (¢/lb)
HDPE Natural (¢/lb)
PET (¢/lb)

Comprehensive Operational Review of CRRA October 30, 2013
The information contained herein is subject to the disclaimer presented on page 1 of this document.
Page 162
New England Annual Average Bilateral Prices
Annual Average Day Ahead On Peak Prices ($/MWh)
2008 2009 2010 2011 2012 5-Year
Avg
Mass Hub $91.55 $46.24 $56.18 $52.64 $42.06 $57.75
NY Zone G $100.99 $49.80 $59.48 $56.41 $44.35 $62.22
NY Zone J $112.63 $55.77 $65.76 $62.71 $46.95 $68.79
NY Zone A $68.34 $35.54 $43.89 $41.52 $35.82 $45.03
PJM West $83.70 $44.60 $53.68 $51.99 $40.86 $54.98
Table 26: Annual Average Day Ahead On Peak Prices; Source: Federal Energy Regulatory Commission Derived from Platts data
Looking more closely at current data, power prices are continuing to decline with some spikes due to summer conditions. Figure 27 depicts the power prices for the New England ISO for the month of August 2013; these prices are due to lower natural gas prices, $3.66 per MMBtu on September 23, 2013.
Figure 27: Daily Average of ISO-NE Day – Ahead Prices – All Hours for August 2013; Source: Federal Energy Regulatory Commission Derived from Bloomberg data

Comprehensive Operational Review of CRRA October 30, 2013
The information contained herein is subject to the disclaimer presented on page 1 of this document.
Page 163
This drastic decline in power prices is a significant revenue shock to all power generators in the U.S. Taking into account the oversupply in the U.S. natural gas market, power prices throughout the U.S. will remain low for the foreseeable future. The decrease in power prices has resulted in waste to energy generators raising tipping fees to make up for the loss in revenue on the power sales. This has caused land-filling of the waste stream to become more economically viable. According to the 2012 Integrated Resource Plan for Connecticut, developed by the Department of Energy and Environmental Protection (DEEP), Connecticut’s electrical consumption will not exceed 2005 levels until 2022 with base load demand only increasing 1% per year with higher growth rates expected for peak load. This predicted growth rate will most likely keep power prices depressed until 2022 and possibly beyond.
Competition
Competition is what drives a market and allows the end consumer, in this case towns and municipalities, to receive the best possible price from the supplier. Competition can be easily used to price companies out of the market, and with more competition the barriers to enter any market become higher. The Connecticut waste market has many players competing for waste streams, including other WTE companies such as Covanta or Wheelabrator as well as out-of-state landfills. Tipping Fees
Due to the fact that there are no open landfills in Connecticut, any landfilled MSW has to be moved out of state. This means that any resource recovery site has to set a tipping fee lower than out-of-state landfilling plus necessary transportation costs. Currently, the Northeast has the highest landfill tipping fees in the nation, with only 128 open landfills. The most expensive states for landfills are primarily on the East Coast: Delaware, Tennessee, New Hampshire, Rhode Island, Pennsylvania, Vermont, Maine and Massachusetts. Table 28 below represents current landfill tipping fees across a few states within a reasonable distance to most municipalities in Connecticut.
Average Privately Owned Landfill Gate Rates (per ton)
Low High
Pennsylvania $56.25 $80.00
Virginia $38.00 $48.50
Table 28: Information received from a large national waste service company, as of 10/24/2013
Operational Costs
Over the past decade, operational costs—both administrative and plant operation costs—have increased; these increases have a direct effect on profit. This downward pressure on profit causes increased competition for the best contracts and rewards operational efficiency. Resource recovery facilities have to be extremely efficient to minimize operational costs or they will easily be priced out of the market.
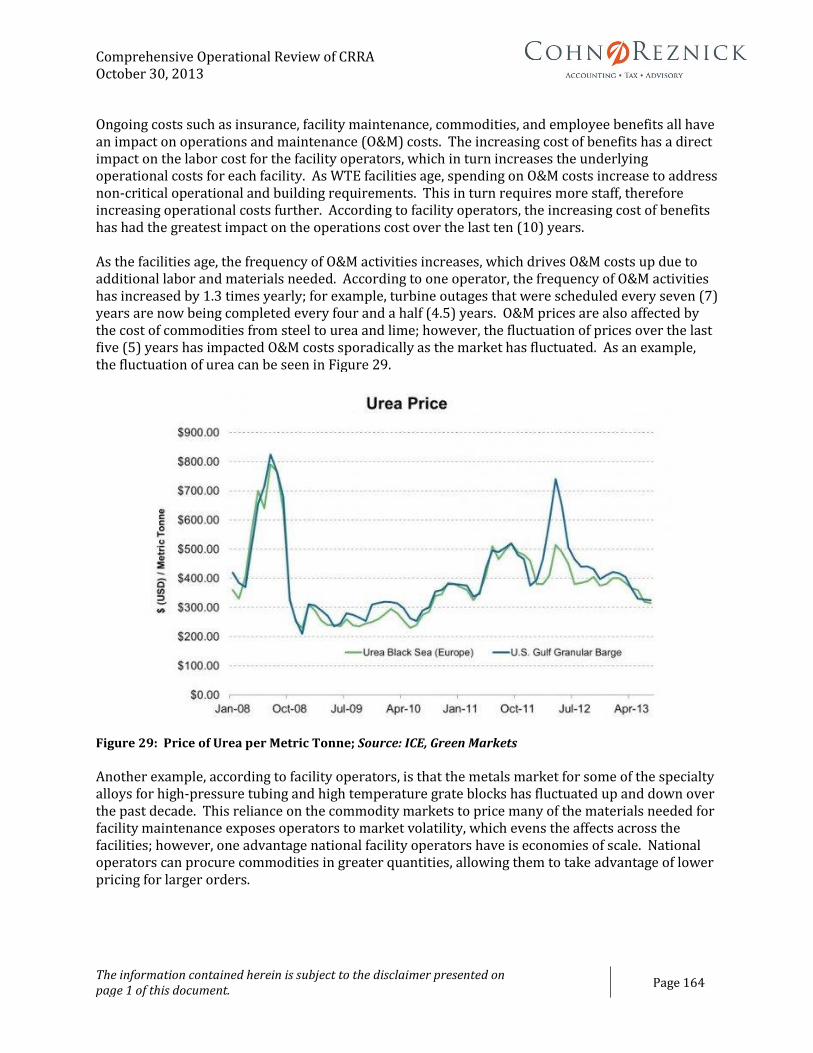
Comprehensive Operational Review of CRRA October 30, 2013
The information contained herein is subject to the disclaimer presented on page 1 of this document.
Page 164
Ongoing costs such as insurance, facility maintenance, commodities, and employee benefits all have an impact on operations and maintenance (O&M) costs. The increasing cost of benefits has a direct impact on the labor cost for the facility operators, which in turn increases the underlying operational costs for each facility. As WTE facilities age, spending on O&M costs increase to address non-critical operational and building requirements. This in turn requires more staff, therefore increasing operational costs further. According to facility operators, the increasing cost of benefits has had the greatest impact on the operations cost over the last ten (10) years. As the facilities age, the frequency of O&M activities increases, which drives O&M costs up due to additional labor and materials needed. According to one operator, the frequency of O&M activities has increased by 1.3 times yearly; for example, turbine outages that were scheduled every seven (7) years are now being completed every four and a half (4.5) years. O&M prices are also affected by the cost of commodities from steel to urea and lime; however, the fluctuation of prices over the last five (5) years has impacted O&M costs sporadically as the market has fluctuated. As an example, the fluctuation of urea can be seen in Figure 29.
Figure 29: Price of Urea per Metric Tonne; Source: ICE, Green Markets
Another example, according to facility operators, is that the metals market for some of the specialty alloys for high-pressure tubing and high temperature grate blocks has fluctuated up and down over the past decade. This reliance on the commodity markets to price many of the materials needed for facility maintenance exposes operators to market volatility, which evens the affects across the facilities; however, one advantage national facility operators have is economies of scale. National operators can procure commodities in greater quantities, allowing them to take advantage of lower pricing for larger orders.

Comprehensive Operational Review of CRRA October 30, 2013
The information contained herein is subject to the disclaimer presented on page 1 of this document.
Page 165
Aside from higher maintenance costs and the increasing cost of employee benefits, insurance premiums, according to one operator, have significantly increased since September 11, 2001. All of these cost increases have put great pressure on operators to run their facilities as efficiently as possible and acquire the best contracts in the market. All of this has significantly increased competition in an already competitive market; creating greater barriers to entry and growth in the market.
Waste to Energy Competitors
CRRA has two major competitors in the Connecticut resource recovery market: Covanta Holding Corporation and Wheelabrator Technologies, Inc. Each company privately owns and operates multiple resource recovery facilities in Connecticut and across the U.S.
Covanta Holding Corporation
Covanta Holding Corporation (Covanta) is a publicly traded company listed on the New York Stock Exchange. According to Covanta’s Annual Report, the corporation had $1.64B in total operating revenue for 2012. The corporation owns and operates 44 WTE facilities and 14 additional energy generation plants, including wood biomass and hydroelectric facilities. The company also owns and operates 13 transfer station(s) and four ash landfills in the northeast United States.
Covanta Facilities in Connecticut
Bristol Resource Recovery Facility
The Bristol Resource Recovery Facility Operating Committee (BRRFOC) oversees the Bristol Resource Recovery Facility. Covanta operates this facility under the direction of the BRRFOC staff. Sixteen towns are members of BRRFOC. The facility is bonded until 2014, at which time Covanta may purchase the plant for fair market value. Electricity produced by the project is sold to Connecticut Light and Power.
Bristol Plant Facts
Commercial Operation 1988
Type of System
(2) 325 ton per
day mass burn,
water wall
furnaces
Rated Refuse Capacity 650 tons per day
Electric Power Capacity 16.3MW

Comprehensive Operational Review of CRRA October 30, 2013
The information contained herein is subject to the disclaimer presented on page 1 of this document.
Page 166
SECONN (Preston)
The SECONN facility was originally bonded through CRRA, but is owned and controlled by Southeastern Connecticut Regional Resources Recovery Authority (SCRRRA). In 2015, the initial contract between SCRRRA, CRRA, and Covanta will expire, leaving Covanta as the full owner of the facility. The initial contract terms include the possibility of extension through 2018.10 Electricity generated on site is sold to Connecticut Light and Power.
Wallingford
The Wallingford facility was built as a joint effort between CRRA and Covanta. CRRA bonded the project and was given rights to purchase the facility, however it opted not to do so after member towns expressed a desire for Covanta to buy and operate the facility11. The project was then bought by Covanta, who remains the current owner and operator.
Covanta Perception of the CT Market
Interviews were conducted with Covanta personnel around several key topics, including the Connecticut WTE market, WTE facility operations, and the future of waste management in the state. Covanta’s representatives identified key challenges to the economic sustainability of the WTE business. Two major issues include recent power price decline and decreases in MSW volume. Both declining factors have led to a decrease in revenue across the Connecticut WTE market.
Covanta chose to address declining MSW and power prices by focusing on increasing stability of MSW streams through long term contracts with municipalities. These contracts combine price and volume stability with bundled services such as recycling, e-waste, and secured medication services. Covanta’s bundled services contracts are provided at a fixed rate per ton and an agreed upon percentage escalator. The escalator can be either fixed or floating, often matching the Consumer Price Index (CPI). Covanta employees expressed that a bundled services contract was in high demand by the community, and it was a priority to meet their customers’ needs.
10 Source: Municipal Solid Waste Management Services in Connecticut Report by Legislative Program Review and Investigations Committee January 2010 11 Source: Municipal Solid Waste Management Services in Connecticut Report by Legislative Program Review and Investigations Committee January 2010
SECONN Plant Facts
Commercial Operation 1991
Type of System
(2) 345 tons per
day mass burn,
water wall
furnaces
Rated Refuse Capacity 689 tons per day
Electric Power Capacity 18.4MW
Wallingford Plant Facts
Commercial Operation 1989
Type of System
(3) 140 ton per
day mass burn
units
Rated Refuse Capacity 420 tons per day
Electric Power Capacity 11MW

Comprehensive Operational Review of CRRA October 30, 2013
The information contained herein is subject to the disclaimer presented on page 1 of this document.
Page 167
Looking toward the future, Covanta representatives foresee an increase in organic waste recovery. This increase will be due in part to the desire to retain high in-state MSW disposal rates and the potential market opportunity posed by anaerobic digester technology. Recently, the company announced plans for an anaerobic digester facility in Bristol which will convert organic waste to compost and electrical power. The company felt the State of Connecticut was in full support of their plan, which added to their willingness to deploy a new technology. Covanta employees believe the increase in organic waste recovery will be matched by a future increase in recycling rates. They identified the following indicators that support their views: Connecticut’s recycling targets, and improvement in recycling programs such as single stream and larger bin sizes. In the recyclables market, Covanta sees its role as an aggregator that can then negotiate with third party recyclers to provide municipalities with the best rate.
Wheelabrator Technologies Inc.
Wheelabrator Technologies Inc. (Wheelabrator) is a wholly owned subsidiary of Waste Management, Inc. Wheelabrator is recognized as a pioneer in the WTE industry in the United States by designing, constructing, and operating the first commercially successful US WTE facility in Saugus, Massachusetts. Today, Wheelabrator operates 17 WTE facilities, four independent power plants, and two ash landfills. Wheelabrator Facilities in Connecticut
Wheelabrator Lisbon Inc.
The Wheelabrator Lisbon facility was created through a partnership between ECRRA (Town of Middletown), Wheelabrator, and the Town of Lisbon.12 ECRRA issued a tax exempt revenue bond package to create the facility; as part of the original agreement Wheelabrator constructed the facility in the Town of Lisbon and will operate it until 2020. When the bonds for the Lisbon facility expire, ECRRA will hold full ownership of the facility.
12 Source: Municipal Solid Waste Management Services in Connecticut Report by Legislative Program Review and Investigations Committee January 2010
Lisbon Plant Facts
Commercial Operation 1995
Type of System
(2) 250 tons per
day mass burn,
water wall
boilers
Rated Refuse Capacity 500 tons per day
Electric Power Capacity 15MW

Comprehensive Operational Review of CRRA October 30, 2013
The information contained herein is subject to the disclaimer presented on page 1 of this document.
Page 168
Wheelabrator Bridgeport, L.P.
The Bridgeport Resources Recovery Facility was funded through CRRA bonds, and was purchased outright by Wheelabrator in 2008 for $1 as per the contract stipulations. The Bridgeport facility is now owned and operated by Wheelabrator; however, some MSW processing capacity is contracted by CRRA.
Putnam Ash Residue Landfill
The Wheelabrator Putnam Ash Residue Landfill is a nine million cubic yard landfill designed to accommodate ash from the State of Connecticut’s RRF fleet. The 186-acre site contains six 10-acre ash disposal cells designed to be built sequentially throughout its 25-year life.13 Currently the site is operating on its fifth cell. The landfill will reach capacity sometime between 2024 and 2026.14 The Putnam Ash Residue landfill accepts ash from Bridgeport, Lisbon, Preston, and Hartford, providing 400,000 tons per year of ash disposal. Wheelabrator Perception of the CT Market
Wheelabrator representatives identified the same market challenges as Covanta: power price decline and lower MSW value. To mitigate these issues, the company is in the process of devising a new contract structure for member towns referred to as a bilateral contract. The new structure will sell power from their waste to energy plants directly to the towns that supply MSW. The aim is to achieve price stability in a long-term contract for both power and MSW. The representatives felt that the new agreement structure could create pricing which will improve the current revenue position of their facilities.
ReEnergy Holdings LLC
ReEnergy Holdings LLC (ReEnergy) owns and operates facilities that use forest-derived woody biomass and other wood waste residues to produce renewable energy. The company is a portfolio company of Riverstone Holdings LLC and was formed in 2008. With facilities and operations in six states, ReEnergy employs approximately 290 people in nine facilities with a total capacity of 325 megawatts of renewable energy.15
13 Source: Wheelabrator Putnam Inc. website http://www.wheelabratortechnologies.com/plants/ash-landfills/wheelabrator-putnam-inc/ 14 http://www.norwichbulletin.com/x221042493/Ash-landfill-in-Putnam-preparing-to-expand 15 Source: http://www.reenergyholdings.com/about-us/
Bridgeport Plant Facts
Commercial Operation 1988
Type of System
(3) 750 tons per
day mass burn,
water wall
boilers
Rated Refuse Capacity 2,250 tons per
day
Electric Power Capacity 67MW
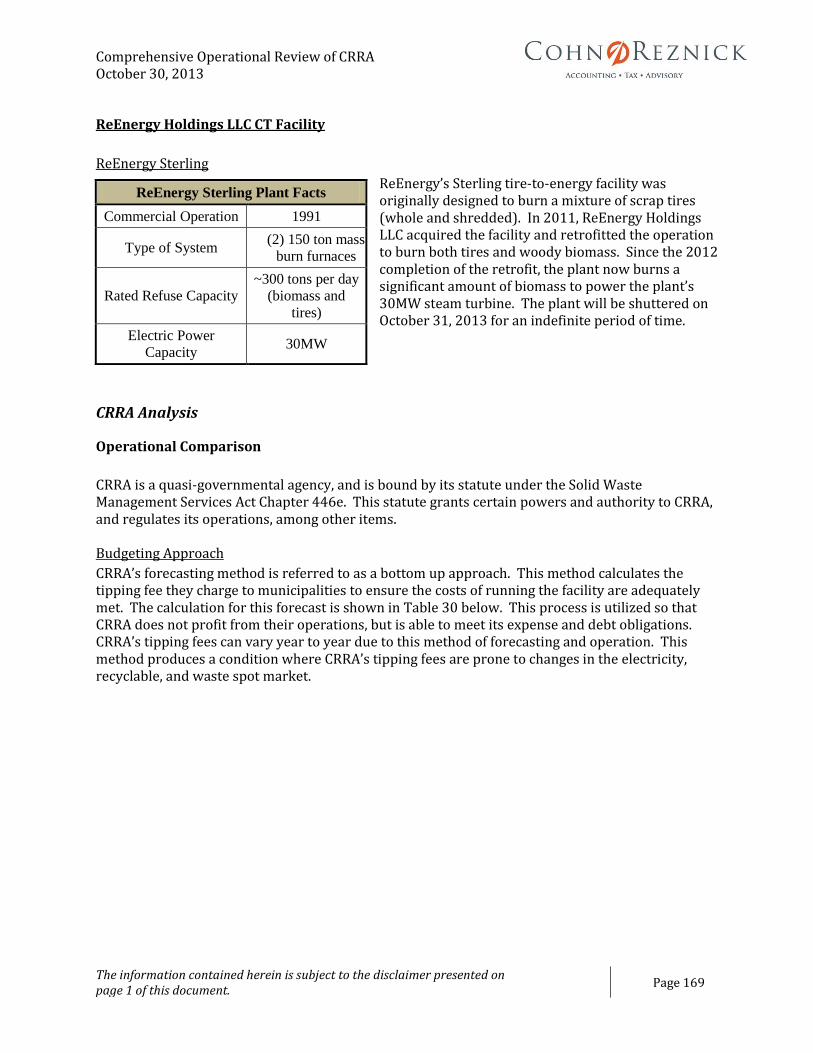
Comprehensive Operational Review of CRRA October 30, 2013
The information contained herein is subject to the disclaimer presented on page 1 of this document.
Page 169
ReEnergy Holdings LLC CT Facility
ReEnergy Sterling
ReEnergy’s Sterling tire-to-energy facility was originally designed to burn a mixture of scrap tires (whole and shredded). In 2011, ReEnergy Holdings LLC acquired the facility and retrofitted the operation to burn both tires and woody biomass. Since the 2012 completion of the retrofit, the plant now burns a significant amount of biomass to power the plant’s 30MW steam turbine. The plant will be shuttered on October 31, 2013 for an indefinite period of time.
CRRA Analysis
Operational Comparison
CRRA is a quasi-governmental agency, and is bound by its statute under the Solid Waste Management Services Act Chapter 446e. This statute grants certain powers and authority to CRRA, and regulates its operations, among other items. Budgeting Approach
CRRA’s forecasting method is referred to as a bottom up approach. This method calculates the tipping fee they charge to municipalities to ensure the costs of running the facility are adequately met. The calculation for this forecast is shown in Table 30 below. This process is utilized so that CRRA does not profit from their operations, but is able to meet its expense and debt obligations. CRRA’s tipping fees can vary year to year due to this method of forecasting and operation. This method produces a condition where CRRA’s tipping fees are prone to changes in the electricity, recyclable, and waste spot market.
ReEnergy Sterling Plant Facts
Commercial Operation 1991
Type of System (2) 150 ton mass
burn furnaces
Rated Refuse Capacity
~300 tons per day
(biomass and
tires)
Electric Power
Capacity 30MW

Comprehensive Operational Review of CRRA October 30, 2013
The information contained herein is subject to the disclaimer presented on page 1 of this document.
Page 170
CRRA Tipping Fee Calculation Summary
Projected Total Expenses
Less:
Electric Revenue
Sale of Recovered and Recycled Materials
Interest Income
Revenue from Spot and Contract Tons
Equals:
Subtotal Remaining Expenses (Net Cost)
Divided by:
Budgeted MSA Tonnage
Derives:
Fiscal Year Tipping Fee Pricing
Table 30: Data from the Connecticut Resources Recovery Authority (CRRA) Forecast for Fiscal Years 2014 –2018
According to CRRA’s forecast for fiscal years 2014-2018, a budgetary shortfall of $3.547 million has been identified in 2015. The forecast proposes five options to mitigate the revenue gap CRRA expects to face in years FY 2015 – FY 2018. Some of the options identified by CRRA carry with them unknown values in some instances, and are not included in the chart below. The list below is not exhaustive, but should serve as the general options CRRA has identified to mitigate the gap:
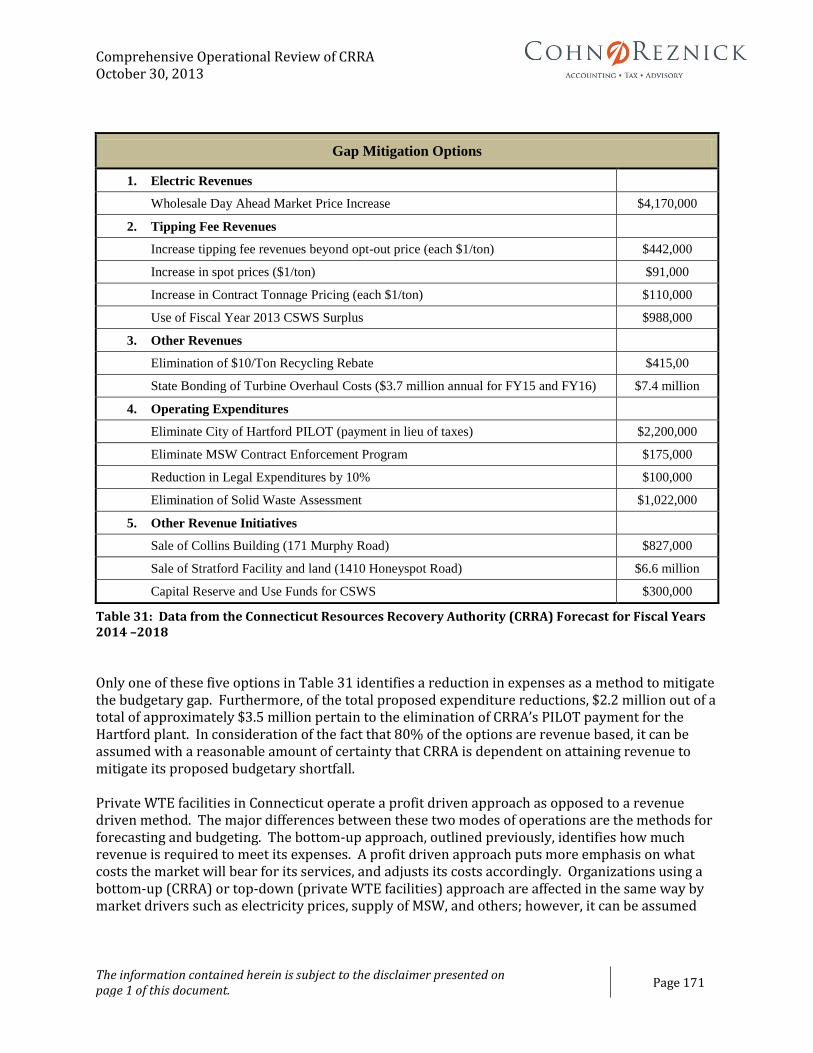
Comprehensive Operational Review of CRRA October 30, 2013
The information contained herein is subject to the disclaimer presented on page 1 of this document.
Page 171
Gap Mitigation Options
1. Electric Revenues
Wholesale Day Ahead Market Price Increase $4,170,000
2. Tipping Fee Revenues
Increase tipping fee revenues beyond opt-out price (each $1/ton) $442,000
Increase in spot prices ($1/ton) $91,000
Increase in Contract Tonnage Pricing (each $1/ton) $110,000
Use of Fiscal Year 2013 CSWS Surplus $988,000
3. Other Revenues
Elimination of $10/Ton Recycling Rebate $415,00
State Bonding of Turbine Overhaul Costs ($3.7 million annual for FY15 and FY16) $7.4 million
4. Operating Expenditures
Eliminate City of Hartford PILOT (payment in lieu of taxes) $2,200,000
Eliminate MSW Contract Enforcement Program $175,000
Reduction in Legal Expenditures by 10% $100,000
Elimination of Solid Waste Assessment $1,022,000
5. Other Revenue Initiatives
Sale of Collins Building (171 Murphy Road) $827,000
Sale of Stratford Facility and land (1410 Honeyspot Road) $6.6 million
Capital Reserve and Use Funds for CSWS $300,000
Table 31: Data from the Connecticut Resources Recovery Authority (CRRA) Forecast for Fiscal Years 2014 –2018
Only one of these five options in Table 31 identifies a reduction in expenses as a method to mitigate the budgetary gap. Furthermore, of the total proposed expenditure reductions, $2.2 million out of a total of approximately $3.5 million pertain to the elimination of CRRA’s PILOT payment for the Hartford plant. In consideration of the fact that 80% of the options are revenue based, it can be assumed with a reasonable amount of certainty that CRRA is dependent on attaining revenue to mitigate its proposed budgetary shortfall. Private WTE facilities in Connecticut operate a profit driven approach as opposed to a revenue driven method. The major differences between these two modes of operations are the methods for forecasting and budgeting. The bottom-up approach, outlined previously, identifies how much revenue is required to meet its expenses. A profit driven approach puts more emphasis on what costs the market will bear for its services, and adjusts its costs accordingly. Organizations using a bottom-up (CRRA) or top-down (private WTE facilities) approach are affected in the same way by market drivers such as electricity prices, supply of MSW, and others; however, it can be assumed

Comprehensive Operational Review of CRRA October 30, 2013
The information contained herein is subject to the disclaimer presented on page 1 of this document.
Page 172
with a reasonable amount of certainty that a top-down approach allows for a more flexible method to balance costs and revenues. Operational Efficiencies
Private WTE facilities in Connecticut have a size advantage when compared with CRRA. Size, in this instance, refers to an economy of scale that is supported by a larger parent company structure. An economy of scale is the cost advantage that a company can obtain due to the decrease in cost per unit of output when outputs are greater, in addition to the spreading of fixed costs over more units of output. Private WTE facilities, as covered in previous sections, have many more operations than CRRA. This may allow them to benefit from discounts due to large purchases of materials such as lime and urea. In addition, their size could allow them to coordinate with their facilities outside of the state to ensure their capacity for waste is met in Connecticut. Additional economy of scale factors could be attributed to lowering overhead expenditures as well. Private WTE facilities can leverage their ability to coordinate administrative tasks (human resources, finance, public relations, etc.) across a region such as the Northeast, as opposed to just one organization such as CRRA. The Authority currently employees 45 staff members who execute oversight and direct labor functions, or both16. In the cases where staff members perform both oversight and direct labor tasks, a percentage of their time is allocated to either direct or overhead labor expenses. An analysis was completed to evaluate what percentage of time employees at CRRA apply to non-direct labor functions. For all of CRRA, it was calculated that approximately 43.05% of tasks are non-direct labor expenses. If this is applied to 41.517 personnel, it is estimated that CRRA employs approximately 17.865 individuals to administer non-direct labor functions (17.865 = 41.5x43.05%) for the Authority. A plant manager at Wheelabrator identified that non-direct labor functions for Wheelabrator, which operates the Bridgeport facility (which is approximately the same size of the Mid-Conn plant) and two transfer stations, are currently served by nine administrative staff members. The smaller number of administrative staff members could allow Wheelabrator to reduce its overhead expenses and thereby charge a lower tipping fee.
Educational Activities
CRRA engages in promotion and public education of sustainability activities, by way of its trash museum. CRRA believes that they have a responsibility under The Solid Waste Management Plan to provide education on waste diversion. CRRA provides this service as a public benefit in order to aid the state in achieving its mandate of empowering the public to reduce, reuse, and recycle. The operational loss of the trash museum in FY 2011 and FY 2012 was $205,554 and $437,000, respectively. This loss is the result of the trash museum’s inability to bring in more revenue than expenses during those years. Since the CRRA Trash Museum has not produced a profit in the past two years, it is not expected to produce a profit in the near-term future if the trend continues.
16 Employment figures and labor duty allocation was provided by the Connecticut Resources Recovery Authority (CRRA) and is current as of 10/16/2013. 17 3.5 employees (2 full-time, 3 part-time employees) were removed from this number. These employees’ duties are allocated to the trash museum or landfills.

Comprehensive Operational Review of CRRA October 30, 2013
The information contained herein is subject to the disclaimer presented on page 1 of this document.
Page 173
Unlike CRRA, Connecticut’s private WTE facilities do not have a statutory responsibility to educate the public about recycling, nor do they currently operate any physical sustainability education structures. WTE facilities have autonomy from the state to determine if it is in their best interest to promote sustainability. They also have autonomy to decide how to carry out educational activities, if they choose to do so. This allows them to make decisions about activities that indirectly affect their WTE facilities absent of a governmental process. Flexibility
Private WTE companies are able to adapt, make decisions, and quickly implement agreements that best suit their customers’ needs. Furthermore, if the situation arises, private WTE companies have the option to make any necessary adjustments to a contract that would make it a better fit for a current or potential customer. Private WTE facilities can offer each municipality a contract that has different terms of services and a different pricing schedule if they consider it to be a better business strategy. According to sentiments obtained during interviews from municipal chief elected officials (CEOs), the most attractive municipal service agreements (MSA) offer a pricing schedule that clearly states what the price will be every year under the contract. This may indicate that these Selectmen do not find the type of contracts offered by CRRA to be attractive. In the same round of interviews, municipal CEOs expressed their hesitancy to continue doing business with CRRA due to the lack of clarity and price certainty in the MSA’s that were being offered. Due to CRRA’s budgetary approach, covered previously, CRRA cannot predict what its tipping price will be due to market factors in the electricity and recyclables market. CRRA’s inability to be flexible to customers’ needs in providing a set price schedule year over year, in addition to the opinions of municipal Selectmen that CRRA’s contracts are complex and out of sync with municipal and town budgets, shows a divide between CRRA and its private competitors.
Asset Divestment
CRRA plays an important role in the Connecticut MSW market, both from an infrastructure and market leader perspective. CRRA is currently facing market situations that are challenging to its operations and ability to stay fiscally sustainable. This section will identify CRRA’s major assets and the impact their divestment would have on the Connecticut MSW market. Increased Waste Supply
CRRA’s Mid-Connecticut WTE facility can process approximately 2,100 tons per day of waste from Connecticut and the surrounding New England market. In addition to its WTE facility, CRRA owns and operates a regional recycling facility, four transfer stations, and its Hartford trash museum. CRRA also owns landfills, but they are in the process of being transferred to the state of Connecticut. According to CRRA’s “Connecticut Solid Waste System Operating and Capital Budgets and Tipping Fees Report,” the Authority is expecting to process 710,000 tons of MSW, 41,500 tons of recyclable materials, and receive 195,000 tons at its transfer stations in Essex, Torrington, and Watertown (Ellington data were not available) in 2014. The Connecticut waste market would feel the greatest impact from the divestment of CRRA’s WTE facility. Discussions with private WTE facility operators in Connecticut revealed that, in their opinion, the current CRRA facility was not profitable in its current state. Furthermore, it was stated that the facility would require substantial retrofits and maintenance to realize profitability. They indicated that they were not inclined to acquire the facility and undertake the necessary financial

Comprehensive Operational Review of CRRA October 30, 2013
The information contained herein is subject to the disclaimer presented on page 1 of this document.
Page 174
commitment to upgrade the Mid-Conn facility. Additionally, municipality CEOs indicated that they would most likely not want to back a capital raising campaign to upgrade the facility either. Further research would have to be conducted to determine the market value of the CRRA mid-Connecticut facility. If the Mid-Conn asset was divested and private ownership did not take control of it, the remaining WTE facilities would have to absorb approximately 710,000 tons of MSW. Discussions with WTE facility operators indicated that most facilities in Connecticut are currently at or near capacity, but that the market would absorb the excess waste in some fashion. Depending on the amount of waste that could be utilized in the remaining Connecticut WTE facilities, the surplus waste would most likely be transported to out of state WTE facilities or landfills. It is assumed with a reasonable amount of certainty that a significant portion of MSW transferred out of state would be landfilled. This scenario would create a situation counter to the priorities the state has established to handle its MSW, in addition to increasing tipping fees at in-state WTEs, which will be covered in the next section. CRRA’s divestment of its transfer station facilities would most likely have less of an impact on the MSW market. Permitted transfer stations, as covered in the landscape section, are abundant in Connecticut. The state has 23 large, permitted, private transfer stations that can each handle over 150 tons of MSW per day. Assuming that all large permitted transfer facilities were operational, if CRRA’s transfer stations were no longer in the market, it is presumed with reasonable certainty that excess waste could be absorbed by the existing transfer station infrastructure. Increases in transportation costs could occur due to the decrease in transfer points, but it is assumed this cost would be negligible, and would not have a significant impact on the MSW and WTE sector. In the same fashion, if CRRA’s regional recycling facility was to be divested, total daily permitted capacity for intermediate processing centers (IPC) would decrease from 3,545 to 2,985 tons/day18. It is important to highlight the impact for single stream recycling capacity as well due to its increase in use by municipalities. CRRA’s Hartford IPC is permitted to process 560 tons/day of single stream recycling. It is assumed with reasonable certainty that existing infrastructure of approximately 1,815 tons/day of permitted capacity for single stream recycling could absorb a fair amount of excess, and would most likely not have a significant impact on the market as a whole. CRRA’s trash museum currently does not have a competitor in Connecticut, but would most likely have the least impact if it ceased to be owned and operated by the Authority. Increased Tipping Fees
In a competitive market environment, oversupply leads to lower costs. The Connecticut WTE market is only currently served by six RRF’s operated by only three entities. Due to this small number of firms, the market is not truly competitive. Furthermore, given the existence of a quasi-public entity that historically has been responsible for setting the ceiling for tipping fees, the market functions more akin to an oligopoly. A true oligopoly is dominated by a small number of sellers or buyers, and each oligopoly is likely to be aware of the actions of the others. The decisions of one firm influence and are influenced by the decisions of other firms. As previously covered in
18 According to the Connecticut Department of Energy and Environmental Protection (DEEP) Office of Source Reduction and Recycling - Bureau of MM&CA

Comprehensive Operational Review of CRRA October 30, 2013
The information contained herein is subject to the disclaimer presented on page 1 of this document.
Page 175
the tipping fees section of the market drivers segment, the sampling of tipping fees in private municipal service agreements (MSA) reviewed are currently lower in price than what is being offered by CRRA. Considering these facts, it is assumed with reasonable certainty that tipping fees would increase if the Mid-Conn plant ceases to exist as a buyer of MSW and WTE facility. The Connecticut MSW market would become oversupplied with approximately 710,000 tons if the Mid-Conn facility ceased to exist as a quasi-public entity. Currently RRF’s in Connecticut have to compete for waste due to the trend in lower MSW generation in the state. In the absence of Mid-Conn, it is assumed with reasonable certainty that the Connecticut MSW market would have excess waste, and WTE facilities would no longer have to reduce tipping fees to compensate for the lack of supply. As tipping fees increased, the Connecticut WTE market could experience an increase of out of state disposal in landfills. It is assumed with reasonable certainty that out of state landfilling would be the most viable option, because Connecticut currently does not have any landfill operations that are permitted to accept MSW. Although transport costs are higher to send waste out of state, municipalities could mitigate this cost with the lower tipping fee cost associated with landfilling as opposed to WTE.
CRRA Recycling Center Operational Analysis
CRRA has provided recycling services to Connecticut member towns since 1990. CRRA states that since operations began, CRRA has recycled more than 2.5 million tons, mitigated 1.5 million tons of greenhouse gases, and saved the equivalent of 186 million gallons of gasoline.19 In 2008, CRRA began providing single-stream recycling and expanded the program in 2011 after several years of growth. Table 32: Legislative Program Review and Investigations Committee - MSW Management Services in Connecticut Report, January 2010 below depicts the Intermediate Processing Centers (IPCs) that are currently operating in the state.
State of Connecticut Intermediate Processing Centers (IPCs)
Facility Type Ownership Permitted Capacity (Tons/day)
Murphy Road Recycling, LLC Hartford IPC Paper Only Private 1,170
CRRA Hartford IPC Single and Dual Public 560
Murphy Road Recycling, LLC Berlin IPC Single Private 1,000
Willimantic Waste Paper Co. IPC Single Private 815
Table 32: Legislative Program Review and Investigations Committee - MSW Management Services in Connecticut Report, January 2010
19 Source: www.crra.org

Comprehensive Operational Review of CRRA October 30, 2013
The information contained herein is subject to the disclaimer presented on page 1 of this document.
Page 176
CRRA Recycling Operations
The CRRA recycling intermediate processing center (IPC) is located in Hartford. CRRA owns the facility, which is operated by Re Community Holdings, formerly FCR. CRRA’s operation deploys a single-stream processing technology, the Connecticut market standard and a leading edge recycling technology. The Hartford facility’s single stream line became operational in 2008 and was assessed by D&B Engineers and Architects in December of 2012. The resulting independent operational assessment found the facility to be in good working order. Some maintenance activities were recommended, and according to CRRA staff interviews it was noted that action has been taken in the interim. The Hartford facility has posted a net-positive cash flow for CRRA for fiscal years 2010-2013. Despite concerns from non-member municipalities about a lower market rebate for recycling tonnage as compared to competitors (CRRA: ~$10 per ton), the facility has maintained sufficient recyclable volume throughout operations, accomplishing the goal of waste diversion for member towns. CRRA has improved the management of recycling programs since early operations in the 1990’s. Compared to initial contracts for the Hartford facility, the plant capitalization was made by Re Community Holdings and an improved revenue structure was attained. CRRA previously received a per ton payment for recycling, now the Authority receives a per ton payment in addition to a share of revenue generated by the facility. Recently, CRRA purchased the ownership rights to the single stream equipment and now owns the facility outright. These changes have improved the revenue position of the recycling operations. Single Stream Recycling Technology
Single-stream processing is the technological standard for Connecticut intermediate processing centers. Single-stream recycling technology originated as a way to increase waste diversion rates by centralizing the separation and sorting of recyclable materials at the IPC level. The implementation of this technology was deemed successful in the state of Connecticut after several years of waste diversion rate increases from 2006 to 201120. The primary concern with this approach, however, is glass contamination. Broken glass during the process significantly increases contamination of other recyclable materials, lowers their value and increases residue rates. This is a challenge to project economics for single-stream facilities; however, low impact processing techniques can improve upon this issue. For the state of Connecticut, the implementation of single-stream recycling is beneficial for meeting in-state MSW diversion goals. CRRA’s Hartford IPC facility helps to achieve increased waste diversion goals by operating their Hartford single-stream IPC. CRRA Recycling Education and Outreach
To achieve increased MSW diversion rates, it is necessary to use improved collection methods such as large container and single-stream collection. However, it is equally necessary to educate the public on the practice and benefit of recycling. CRRA uses several methods to communicate how recycling benefits the state of Connecticut and the world at large. The CRRA Trash Museum educates roughly 50,000 visitors a year. In addition to the museum, CRRA runs outreach programs for school children and provides online resources for Connecticut residents. 20 Source: www.crra.org

Comprehensive Operational Review of CRRA October 30, 2013
The information contained herein is subject to the disclaimer presented on page 1 of this document.
Page 177
Operational Options for CRRA to Remain Competitive
CRRA’s operational efficiency and ability to meet current market trends is vital to the likelihood that the Authority will remain competitive in the waste market over the next ten years. The options contained in this section are based on discussions with municipal Selectmen, WTE facility operators, and Connecticut Department of Energy and Environmental Protection (DEEP) staff members. This section is meant to provide a qualitative analysis that identifies opportunities CRRA could utilize to increase their standing in the MSW and WTE industry. These options would require a full quantitative cost/benefit analysis if CRRA chooses to implement any or all options outlined below.
Municipal and Town Engagement
Public sentiment of CRRA has been either neutral or negative according to discussions with municipalities. It was identified during these discussions that CRRA could strengthen its position in the community through the promotion of recycling and educational programs. Community engagement aimed at residents and commercial recycling programs could help CRRA position themselves as a market leader and a powerful advocate for increasing the sustainability of the state. In addition, this could increase the amount of waste recycled, which would support the State’s “Reduce, Reuse, Recycle” program, while simultaneously educating the public about the Authority’s role in the recycling market. Furthermore, CRRA could utilize this engagement as a platform to communicate its value-add to the public from the WTE sector as well. There are economic and environmental benefits that CRRA provides to Connecticut. CRRA could use the municipal and town engagement to educate the public about the history of CRRA’s role of fostering the WTE industry in Connecticut, the environmental impacts of alternatives to WTE facilities such as landfilling, and possibly future plans CRRA is considering to make the state more sustainable. Predictable Municipal Service Agreements (MSA)
CRRA does not currently have a modality to offer municipalities service agreements that provide a high level of certainty as to what year on year pricing will be over the long-term. As stated in previous sections, this aspect is in high demand by municipalities. If CRRA was able to leverage this opportunity, it could meet current customer trends. CRRA could increase its supply of MSW needed to meet the capacity of its Mid-Conn facility, and after capacity is met it could sell the excess waste to competitors. In order to implement this option, CRRA would have to accomplish one of two strategies, or both. Either CRRA could amend its budgetary approach to more similarly conform to that of its private WTE competitors, or it could acquire the necessary expertise to effectively predict both its non-tipping revenue stream and expenditures. Recycling Program
CRRA currently offers up to a $10 per ton rebate to municipalities in all but one of the MSAs available. In theory, this provides an incentive to municipalities. In following with the first option to be a market leader in promotion of recycling efforts, CRRA could institute a profit sharing program for recyclables. In this profit sharing program, CRRA could rebate municipalities’ tipping

Comprehensive Operational Review of CRRA October 30, 2013
The information contained herein is subject to the disclaimer presented on page 1 of this document.
Page 178
fee a certain percentage of what they received after the Authority sold the materials on the recyclables market. Instituting a profit sharing recyclable program could have a positive effect on CRRA’s income, in addition to aiding municipalities in their efforts to become more sustainable. Additionally, it could be aligned with CRRA’s municipal engagement. Operational Efficiencies
Operational efficiency can lead to a decrease in costs, and in turn a decrease in the tipping fees charged to municipalities. CRRA could increase its operational efficiency by interacting with the market and its competitors in a more collaborative approach. Discussions with WTE facility operators identified an option for CRRA to decrease its transport costs through mutual contracting of waste transfer station(s). During these discussions it was highlighted that certain WTE facilities own transfer station(s) that are closer to the Mid-Conn facility, and CRRA owns transfer station(s) that are closer to other WTE facilities. It was suggested that CRRA create a contractual situation where each facility utilizes the waste that is closest and establishes terms so that both facilities can meet their capacity requirements while reducing transportation costs.
Options for CRRA to Remain Competitive
CRRA’s ability to leverage current and future assets is vital to the chance that the Authority will remain competitive in the waste market over the next ten years. This section is meant to provide a qualitative analysis that identifies opportunities CRRA could utilize to increase their standing in the MSW and WTE industry. These options would require a full quantitative cost/benefit analysis if CRRA chooses to implement any or all options outlined below. Anaerobic Digester
Anaerobic Digestion (AD) is the process of breaking down organic waste using microbes in the absence of oxygen. The gases produced by the process are captured and methane is extracted as fuel and burned to create clean electricity. The remaining slurry is then processed and marketed as a soil amendment. A detailed description can be found in Appendix A. The State of Connecticut has contributed several factors to making anaerobic digestion an attractive option:
Biogas qualifies as a CT Class I renewable energy source. Under the Connecticut Renewable Portfolio Standard (RPS), biogas qualifies as a Class I source when produced from food waste and manure. CRRA currently only generates Class II RECs, which the Authority receives when it produces electricity from its WTE facility. The quota for meeting the Class II portion of the RPS is oversupplied and therefore less lucrative. If CRRA were to build an AD facility, it could allow CRRA to sell renewable energy credits at a higher price than Class II credits produced by its RRF facility (Table15).
Stable Feedstock for AD digesters. If CRRA were to develop an AD facility, securing a stable feedstock is a necessary development step. Connecticut passed Public Act No. 11-217, which requires every commercial food wholesaler or distributor, industrial food manufacturer or processor, supermarket, resort, or conference center that produces more than 104 tons/year of source separated organic material, to recycle the material if composting capacity exists within 20 miles of an organics generator. Stable access to source separated food waste creates a waste stream which could allow CRRA to finance a potential project.

Comprehensive Operational Review of CRRA October 30, 2013
The information contained herein is subject to the disclaimer presented on page 1 of this document.
Page 179
Incentive funding for AD facilities. Connecticut Clean Energy Finance and Investment Authority (CEFIA) funds an Anaerobic Digestion PILOT Program. CRRA could access these funds during the project development phase. There is a cap for facility size (3MW) and the deadline for applications is January 2015. CRRA may be eligible to apply for grants, loans, loan enhancements, or power purchase incentives for an AD facility. This additional financial support could lower CRRA’s financial burden, which may lead to lower debt expenses and a higher profitability margin. CRRA could contribute to the creation of the Connecticut organic waste recovery industry using the advantages afforded AD facilities by the state of Connecticut. This option would further reduce food waste that must be incinerated by resource recovery facilities. Diverting food waste from the MSW stream may improve emissions characteristics at the Hartford resource recovery facility. Food wastes contain sodium chloride (salt), and during the incineration process chlorine atoms are released, which in turn creates acidic hydrogen chloride HCl emissions, dioxins, and their precursors.21 Food waste diversion may also improve the BTU value of remaining MSW. Interviews with CRRA and competitor plant operators revealed that food waste does not burn as well and its removal may actually improve plant efficiency and lower maintenance costs. Constructing and operating an AD facility could be beneficial to the Authority, but could require a considerable amount of further study. Ash Landfill
The ash landfill in Putnam, CT is projected to reach capacity between 2028 and 2030. The Putnam location remains the last ash landfill in the state of Connecticut. CRRA has the legislative authority to site and construct a new ash landfill in the state (CGS § 22a-285a et. seq). Previous efforts to use this planning authority have failed; however, CRRA could create a new landfill facility if the political support existed. CRRA could lower landfilling costs and create a new revenue stream by owning and operating an ash landfill. CRRA could conduct a study to determine the economic viability of creating a new ash landfill in Connecticut. Once viability is established, the facility would have to be properly sited. Ash Recovery Pilot Facility
Many European countries process ash residue into useful construction and infrastructure materials. CRRA may find an alternative to ash landfilling in ash recovery, potentially lowering costs and generating additional revenue. In Europe and some parts of the U.S., MSW incinerator ash is used for cement making, pavement and other building applications.22 CRRA can improve landfill diversion through ash reuse by creating an ash recovery pilot facility while creating a new market in the state of Connecticut.
21 Source: http://www.geo.hunter.cuny.edu/~mclarke/IntroMSWincineration.htm 22Source:http://www.ieabioenergytask36.org/Publications/1998-2001%20Task%2023/Publications/Mangement_of_Residues_from_Thernal_Processes_-_Appendix1.PDF

Comprehensive Operational Review of CRRA October 30, 2013
The information contained herein is subject to the disclaimer presented on page 1 of this document.
Page 180
To assess the viability of an ash recovery pilot facility, CRRA could study building material markets, solicit a developer for the project, and determine if building materials produced with ash residue are legally permissible for use and sale. The facility could open a new market and alleviate ash landfilling concerns; however, new markets could have many unforeseen challenges. Plant Retrofit
The Mid-Connecticut Resource Recovery Facility (Mid-Conn) uses a refuse-derived fuel technology. CRRA’s Mid-Conn plant became operational in 1988 and will eventually need to be replaced. There is an opportunity for CRRA to retrofit this existing facility with a mass burn incineration technology. The retrofit would be aimed at reducing the costs at the facility attributed to processing the waste during the refuse derived fuel stage. To determine the benefit of this option, CRRA will need to conduct an economic analysis of the plant and how a retrofit might improve operations. Retrofitting a facility can be a costly and time consuming process, and the Authority must be certain these costs are in line with future cost reductions. Convert Mid-Conn Facility to Transfer Station(s)
As the Mid-Conn facility comes to the end of its useful life, to avoid the cost of upgrading the facility, CRRA could elect to shutter the plant and use it as a transfer station(s). The reduced operation could allow CRRA to contract waste disposal for member towns and haul waste via Mid-Conn and other CRRA transfer station(s) to in-state resource recovery facilities or out of state disposal facilities. This option would require further study to determine the impact on the CT market, as it will entail altering a fundamental function of CRRA and the MSW market. Composting of Yard Waste
The state of Connecticut prevents grass clippings and other green wastes from being incinerated by state resource recovery facilities. CRRA could generate additional revenue by owning and operating composting facilities in a centralized or decentralized model. CRRA could consider providing this as an additional service to member towns in conjunction with recycling and refuse services. This additional service may improve CRRA’s competitive position and alleviate the need for municipalities to handle yard waste. As an aggregator of composted material across the state, CRRA could negotiate bulk compost sales and ensure standardization of composted materials. To determine the viability of this option, CRRA should assess market conditions, transportation costs, centralized and decentralized models, as well as a number of other factors. MSW-to-Biofuel Facility
Using MSW as a feedstock, two companies have developed a process to turn MSW and woody biomass into drop-in ethanol or biofuels.23 CRRA could work with these technology partners to access increased revenue from fuel sales. By transitioning from incineration to fuel production, MSW is disposed of while avoiding EPA air standards for incineration plants. As of this report, several MSW-to-biofuel projects are currently under development in the US. 23 CRTE interview with Solena Fuels and Fiberight LLC

Comprehensive Operational Review of CRRA October 30, 2013
The information contained herein is subject to the disclaimer presented on page 1 of this document.
Page 181
Task VI A review and analysis of CRRA’s internal controls, financial management and risk management practices, including, but not limited to, the following:
Control Assessment
a) An analysis of the adequacy of the Authority’s internal financial controls, controllership function, and depreciation policies.
b) A detailed review and analysis of the adequacy and strength of the Authority’s internal accounting practices.
c) A description of the Authority’s credit rating, any existing lines of credit, and what factoring and banking relationships the Authority is engaged in.
d) A review of the effectiveness of any cost reduction programs, what the goals of these programs may be, and how progress is measured.
Activities Performed
Utilizing an assessment methodology, a detailed analysis was conducted of the Authority’s internal controls, financial management, and risk management practices. The following key accounting and operations individuals were interviewed:
Mark Daley, CFO
Nhan Vo-Le, Director of Accounting and Financial Reporting
Jeff, Director of Budgeting and Forecasting
Virginia Raymond, Operations Manager
Roger Guzowski, Procurement Manager
Chris May, IT Director
In addition to reviewing external auditor reports, board of directors meeting minutes, organizational charts and various other governance and management documentation, approximately 120 internal policies and procedures of the Authority were reviewed to evaluate the Authority’s financial control structure. Policies and procedures over financial controls, controllership, and depreciation were evaluated and found to be adequate from an internal control perspective.
Comprehensive Operational Review of CRRA October 30, 2013
The information contained herein is subject to the disclaimer presented on page 1 of this document.
Page 182
Findings
The following findings with respect to internal controls and internal accounting practices were disclosed during this review:
Segregation of Duties over the Accounting function
During the past year the Treasury function has been eliminated and the role of the Director of Accounting and Financial Reporting has expanded creating potential segregation of duties conflicts.. This individual:
Performs or oversees transaction initiation, approval, execution and reconciliation.
Oversees all financial, regulatory and management reporting.
Responsible for administering the Epicor general ledger system.
Approves all disbursements.
Exceptions to Policies and Procedures
Investment Policy and Regulation System of Internal Controls
As required under the Authority’s Investment Policy, the CFO should consider establishing and maintaining a system of internal controls for the operation of the investment program and to regulate the activities of subordinate officials. Following discussions with the CFO and the Director of Accounting and Financial Reporting, a system of internal controls over this program has not been established. Emergency Procurement(s) under $10,000
There is no established policy and procedure for emergency procurement(s) under $10,000. As confirmed by the Procurement Manager, an emergency situation contract for the cost of the goods or services procured at a value below $10,000, which exempts the procedures for pre-approval of procurement and contracts, does not provide procedures to be followed for post ratification measures. These procedures include minimum required documents supporting the need to necessitate the emergency procurement, review of the submitted documents, different levels of management approvals required, and escalation to obtaining board of directors’ approval if necessary.

Comprehensive Operational Review of CRRA October 30, 2013
The information contained herein is subject to the disclaimer presented on page 1 of this document.
Page 183
Governance Over Policies and Procedures
The Authority policies and procedures are required to be updated at a minimum of every three years. The President, CFO and Division Heads and Directors are to be provided with an annual report identifying any “Policies and Procedures” documents that will require updating within the twelve month period. However, no evidence was observed of the policies and procedures being re-visited or refreshed at a minimum of once every three years. Discussion with the Head of Human Resources as well as other interviews with the CFO, Director of Accounting and Financial Reporting, and Operations Manager revealed that these policies and procedures are refreshed only on an as-needed basis.
Background
Policies and Procedures
A review was performed of the following policies and procedures of the Authority, which are categorized by business cycle:
Accounting and Financial Reporting Planning & Budgeting
Accounting Procedure Policy Financial
LOANS, Grants and Other Financial Assistance Procure to Pay
Section 4-33a Reporting Procedure Board of Directors Expense Reimbursement
Accounts Receivable Cash Management Procedure
AR Write off Checks (Positive Pay) Procedure
Cash Receipts Corporate Card Use Policy
Daily Receipts Policy Distribution of Recycling Rebates Procedure
Debt Employee Awards
Bonds, Notes and Other Obligations Employee Expense Reimbursement
Entity Level Employee Service Award:
Bylaws - Board of Directors E-Procurement Policy and Procedure:
Cell Phone Usage NAES Draw Request and Invoice Review and Payment Approval
Hazard Communication Program Payments, Wire and Auto Debits Policy and Procedure
Policies and Procedures Petty Cash Procedures
Risk Reduction and Risk Finance Policy Procurement
Fixed Assets Returned Checks Procedure (Haulers)
Fixed Asset Tagging Procedure Signatory & Approval
Fixed Assets Procedure Southwest Connecticut Recycling Operating Committee Billing
HR & Payroll Travel Policy and Expense
Equal Opportunity Employer Tuition Reimbursement
Ethics Waste Diversion Pricing Procedure
Hiring, Compensation, Promotion & Dismissal Procedures Wellness Program
Inventory Revenue
Spare Parts Inventory Procedure Delinquent Tipping Fees
Spare Parts Test Count Sampling Procedure Gift Shop Sales and Inventory Policy and Procedure
Investment Remote Deposit Services (RDS) Procedure
Interest Income from STIF Policy
Investment
Comprehensive Operational Review of CRRA October 30, 2013
The information contained herein is subject to the disclaimer presented on page 1 of this document.
Page 184
In conjunction with reviewing the policies and procedures, the aforementioned individuals were interviewed to gain an understanding of key governance processes, including:
Accounting and Financial Reporting
Accounts Receivable
Cash Receipts
Debt
Entity Level
Fixed Assets
Human Resources and Payroll
Inventory
Investments
Planning and Budgeting
Procure to Pay
Revenue
Internal Control Assessment
In order to conduct a detailed review and analysis of the adequacy and strength of internal accounting practices, the following internal control, accounting and operations components were reviewed during this review:
Policies and procedures as detailed above
Job descriptions and new hire requirements
Span of authority and coverage
Segregation of duties, focusing on transaction initiation, authorization, execution and accounting/reconcilement
Depreciation charges and unusual asset write-downs
Internal accounting practices
Management forecasting and budgeting
Current and prior year budget with associated assumptions and actual monitoring
Walkthroughs of certain procedural and internal controls were performed with key personnel in accounting and business areas to assess the adequacy of internal control design and implementation as well as the present knowledge and skills of key personnel. Documentary evidence was reviewed and on-site control activity was observed to support management’s internal control assertions.

Comprehensive Operational Review of CRRA October 30, 2013
The information contained herein is subject to the disclaimer presented on page 1 of this document.
Page 185
A control activity matrix was prepared for each policy to document the adequacy of key internal controls carried out by the Authority. Internal control gaps or discrepancies between internal policies and current practice were noted in the Findings section. The external auditor’s annual reports and internal accounting documentation were reviewed and the Authority’s credit rating, lines of credit, factoring and banking relationships were noted. As of the fiscal year ending June 30, 2012, the Authority had $70.4 million of outstanding debt, comprised of:
$4.1 million issued for the Mid-Connecticut Project, Series A (Rated Aa3, Moody’s; AA, S&P)
$66.2 million of Corporate Credit Revenue Bonds
Additionally, the Authority serves as a conduit issuer for several bonds pursuant to bond resolutions whereby the Authority is not involved in the repayment of debt on these issues. As of fiscal year ending June 30, 2012, the principal amount of these bonds totaled $66.3 million, which includes:
$22.7 million issued for the Southeast Project, 2010 Series A (Rated Aa3, Moody’s; AA, S&P)
$13.5 million issued for Covanta Southeastern Connecticut Company, 2001 Series A
$30 million issued for Corporate Credit, 1992 Series A
This issue is further secured by the Special Capital Reserve Fund (“SCRF”) of the State, which is a contingent liability of the State available to replenish a debt service fund draw on bonds that have the SCRF designation. The funds used to replenish a debt service reserve draw are provided by the State’s General Fund and deemed appropriated by the Connecticut legislature. As of the fiscal year ending June 30, 2012, the Authority’s investments consisted of Short Term Investment Fund (STIF) valued at $93.1 million and US Treasuries at $8.7 million, and Money Market Funds at $1.1 million. STIF had a weighted average maturity of 31 days and US Treasuries 180-day maturities. The following table shows each security as of June 30, 2012 with the following investment ratings:
Security Fair Value ($000) Standard & Poors Moody’s Fitch
STIF $93,111 AAAm Not Rated Not Rated
U.S. Treasuries $8,711 A++ Aaa AAA
Money Market Funds $1,141 AAAm Aaa AAAmmf

Comprehensive Operational Review of CRRA October 30, 2013
The information contained herein is subject to the disclaimer presented on page 1 of this document.
Page 186
Banking Relationships
The Authority has banking relationships with Bank of America and US Bank; accounts are summarized as follows:
Bank of America
Project Account Name
Administration CRRA General Fund Checking
Connecticut Solid Waste System CSWS Clearing
Hartford Hartford Fees
Mid-Connecticut
Mid-Conn Service Project Fees
Mid-Conn Systems
Mid-Conn Customer Deposit
Trash Museum
Southeast Southeast Service Fees
Southeast Project Account
Southwest Southwest Project Service Fees
Property Division Property Division
Recycling Division Recycling Division
Other SWEROC Checking
US Bank
Project Account Name
Southeast Revenue Fund
Southeast Operating Surplus Fund
Landfill Division Ellington Landfill Post Closure
Landfill Division Waterbury Bulky Waste Landfill
Landfill Division Wallingford Landfill Post Closure
Landfill Division Shelton Landfill CT DEP Trust
Landfill Division CRRA Covanta Wallingford Escrow
Landfill Division Wallingford Landfill CT DEP Trust
Cost Reduction Efforts
Based upon discussion with Authority personnel, below is a listing of cost saving measures that have been implemented by the Authority. For any cost saving measure where the Authority prepared an analysis documenting the cost savings, the amount calculated has been noted.

Comprehensive Operational Review of CRRA October 30, 2013
The information contained herein is subject to the disclaimer presented on page 1 of this document.
Page 187
No procedures were able to be performed on the cost saving calculations.
Activity Potential Cost Reduction
1. Process reside burn option – Re-burning of fines and reduction of tonnage needed to keep plant running at full capacity
Use of this option decreases tipping fee revenue but also the process residue disposal costs. Ash disposal cost will increase. Based upon an Authority March 2011 estimate based upon current conditions and expense, the net saving was estimated at $4,699,000
2. Bidding and change in vendors for the operation and maintenance of the former Mid CT plant for both the waste processing facility and the PBF/EGF facility
Based upon the Authority’s analysis of:
The fiscal year 2010 actual costs
The 2011 budget cost for the prior operator
To the budgeted cost for fiscal year 2013 for the new vendor, a savings of $5,820,000 was determined
3. Early termination of the FCR recycling contract to avoid minimum commitment penalties
No cost savings estimate was available
4. Internal evaluation to improve customer service
In June 2010 a project team was established to improve customer service for internal and external customer and vendors. No cost savings estimate was available. Ultimately eight ideas were put forth to improve service or efficiency.
5. Operating the former Mid CT plant at off-peak hours reducing the electricity cost of the plant
No cost savings estimate was available
6. Based upon operating the plant off peak from 3 pm to 7am, rolling stock maintenance costs were reduced since the maintenance could now be down during normal business hours and not at overtime rates.
In addition, with the change in plant operators, a new maintenance program was implemented using mobile repair units versus having to ship the vehicles off site to the vendor facility.
No cost savings estimate was available
No cost savings estimate was available
7. Staff reductions The 2014 budget reflects staff reduction for 3 unfilled positions
The 2015 project staffing projects an additional reduction of three staff related to the transfer of the landfills to the State of CT at June 30, 2014.
In addition to the items noted above, it is understood that the Authority, in conducting an internal analysis, may include additional items in its self-assessment report.

Comprehensive Operational Review of CRRA October 30, 2013
The information contained herein is subject to the disclaimer presented on page 1 of this document.
Page 188
Insurance Assessment24
e) An analysis of all Authority insurance policies, including all policies covering general liability, environmental liability, director and officer liability, worker’s compensation, employee life insurance, and fire or other casualty insurance; The carrier, coverage amounts and limits, deductible/self-insured retentions, premiums, and any significant conditions or benefits for each policy; The assignability of each policy; and the adequacy of existing coverage and any problems that may arise from underinsurance in the future.
Activities Performed
Of the information provided and reviewed, an overview was compiled of the insurance program in place, noting outstanding liabilities as well as potential coverage deficiencies. The review is categorized into three main sections in order to properly classify the severity of the noted risk or liability. These sections are:
Material Issues – Items pertaining to critical coverage deficiency or clear and present liability for which CRRA may be held accountable. These material issues must be addressed as a first priority.
Peripheral Issues – These items also showcase deficiencies in the policies, as well as provide guidance in correcting inconsistencies and mistakes.
Background Information – Appendixes, Schedules of Insurance, and other supporting documentation as reviewed and analyzed.
A review of the insurance-related documentation provided by the Authority, identified in Appendix A, as well as information compiled from the CRRA Risk Manager, Lynn Martin, was performed. Additionally, there were pieces of information which could not be electronically transmitted, thus the findings on such topics are based upon the statements of the CRRA team through numerous conference calls with CRRA (Peter Egan, Virginia Raymond, Lynn Martin) and a representative from CRRA’s Insurance Broker.
Findings
The following items were noted in the Insurance review:
Coverage Adequacy
The insurance coverage that CRRA currently has in force is customary for a company of CRRA’s operation, size and scope. Coverage gaps and/or material weaknesses in coverage are identified in the “Due Diligence Outcome – Material Issues” and the “Recommended Coverages to Consider” sections below.
24 “For the purposes of the Insurance Assessment, CohnReznick assumed that all insured parties were in compliance with the terms and conditions of the applicable insurance policies, including any claims reporting requirements.”

Comprehensive Operational Review of CRRA October 30, 2013
The information contained herein is subject to the disclaimer presented on page 1 of this document.
Page 189
Cost of Insurance
The Insurance Program Costs exhibit identifies the current insurance premiums for each line of insurance. However, the current insurance policies remain auditable; therefore the ultimate insurance premium for the current policies may be more than or less than what is presented in the exhibit, once the insurer completes its annual audit.
Background
Due Diligence Outcome –Material Issues
Workers Compensation
Current audits show a large shift in payrolls from the lower rated 9410 (municipal employees – 1.55 rate) to 6217 (excavation, landfill, recycling – 10.70). CRRA confirms this shift was due to improper classification. A WC insurer has the right to audit three past years, inclusive of improper classification. If 2010, 2011, and 2012 are chosen to be audited, CRRA may be liable for an additional premium payment. The request of the historical modification worksheets is still pending in order to more accurately calculate the potential additional premium estimates. The estimate on a linear non-modified evaluation would be approximately $200,000, however this would be mitigated on the current year’s modification, as well as the two preceding modification factors would be recalculated and lowered, thereby mitigating the increase in the audit amount due. It is impossible to calculate the additional premium without the requested historical audits. The best estimate at this moment would be an additional real premium expense between $50,000 and $100,000 if the WC insurer chose to pursue such audits.
Property Business Interruption
The company’s maximum foreseeable loss (MFL) would be to the company’s largest plant in Hartford and that the plant would take a minimum of three years to rebuild, barring any setbacks such as permitting and political obstacles. In addition, certain pieces of machinery such as the turbines could take up to 18 months to rebuild. In order to mitigate the loss, CRRA would contract in-state and out-of-state haulers to bring waste to the transfer stations that, when running at capacity, would pick up most — if not all — of the lost operations at Hartford. After reviewing such, it was noted that the business interruption calculation worksheets were prepared presenting revenues and expenditures from the 2013 fiscal year. If so, there is a potential two-year gap resulting from underreported values. Further analysis should be performed as related to the adequacy of the current limit insured. It is recognized that the loss could be mitigated by a variety of factors, as discussed above, thus it will not be a 200% increase in the current annual calculation, but it will likely be another 50% to 100%.

Comprehensive Operational Review of CRRA October 30, 2013
The information contained herein is subject to the disclaimer presented on page 1 of this document.
Page 190
Pollution
Current ACE pollution policy excludes remediation costs for the following locations:
Waste to Energy Facility – 300 Maxim Rd
Waste to Energy Facility – 6 Howard Rd
Waste to Energy Facility, 132 Military Highway
Full exclusion for pollution conditions due to groundwater migration from the Ellington Landfill.
Comments and Recommended Coverages and Enhancements
Cyber Liability
Cyber liability coverage focuses on the first- and third-party risks that are associated with e-business, the Internet, networks, and informational capital. Cyber liability insurance coverage offers cutting edge protection for exposures arising out of Internet communications. The traditional liability products that have been offered do not address Internet exposures; however, the risks revolving around the Internet business have drastically increased as the Internet expands. The Internet and its technological advancements of worldwide communication and interaction have created a whole new branch of liability and become a major risk to companies. As companies and individuals publicize and release information to the entire world via a website, commercial businesses have now exposed themselves to risks such as copyright infringement, defamation and invasion of privacy, as well as Web operations.
Property Comments
Provide such coverage and remove "Excess Payments Exclusion,” which is added to any Business Interruption endorsement. This exclusion makes the company not liable for any actual loss sustained resulting from the loss or payment of Excess Payments incurred by the insured after an occurrence causing, or contributing to, such loss. Excess Payments is defined as Capacity payments or Bonus Payments that become payable to the Insured in return for attaining (Capacity Payments) or exceeding (Bonus Payments) certain production levels described in a contract between the Insured and the utility to which the Insured sells power. (Page 45 of 75 of Policy) Provide coverage and remove the coverage restriction/exclusion from the “Service Interruption” Endorsement for overhead transmission lines, electrical transmission, distribution lines, lines transformers, towers and poles, and cables. (61 of 75) Provide coverage and remove the exclusion from “Other Exclusions” Endorsement for: 1) Indirect Contingent Time Element and 2) the Cost to Purchase Replacement Power. (Page 69 of 75)
Covers against loss of earnings and necessary extra expense resulting from necessary interruption of business of the insured caused indirectly by damage to or destruction of real or personal property, by the perils insured against under this policy, of any supplier of goods or services which results in the inability of such supplier to supply an insured location
Covers the necessary expenses to restore or replace power to its original operating state during a downtime caused by the perils insured against under this policy.

Comprehensive Operational Review of CRRA October 30, 2013
The information contained herein is subject to the disclaimer presented on page 1 of this document.
Page 191
Provide coverage to include a “Partial Payment of Loss Settlement” endorsement. This coverage will allow the advancement of monies to the insured of a minimum 25% of the loss immediately after the claim loss amount has been determined and reported. Provide coverage to include “Knowledge of Occurrence” and “Notice of Occurrence” endorsements. Both endorsements need to impute to Chief Executive Officer (CEO), Chief Financial Officer (CFO), Risk Manager, or General Counsel. Provide coverage to include a Liberalization Clause with the following description, “If, during the period that insurance is in force under this Policy or within forty-five (45) days prior to the inception thereof on behalf of any Insurers, there is adopted or filed with and approved or accepted by the Insurance Supervisory Authorities, all in conformity with law, any changes in the forms attached to this Policy by increased premium charge by endorsement or substitution or form, then such extended or broadened insurance shall inure to the benefit of the Insured here under as though such endorsement or substitution of form had been made to this Policy”. The following amendments should be considered to make the policy in conformity with the standard coverages:
In Clause 6 under Property Insured section, amend 1,000 feet to 1 mile of coverage for electrical transmission lines, distribution lines located at Premises described in Declarations (page 14 of 75).
Within Debris Removal Clause under Additional Coverage, amend the number of days required to report the occurrence for coverage from 180 days to 360 days (page 14 of 75).
Within definition section, amend the definition of flood to include coverage for backup of sewage and drainage, inundations and mudflow (page 31 of 75).
Within Appraisal Clause under Conditions section, amend to include “or time necessary to rebuild, repair, or replace and/or intent, terms, definitions and interpretations of insurance contract” after “If the insured and the company fail to agree on the amount of loss”. (Page 23 of 75)
General Liability Comments
Amend broad form endorsement to include automatic coverage for subsidiaries with revenue threshold of 25%
Amend earlier notice of Cancellation – 10 days to 10 business days End’t #11
Remove/Delete Radioactive matter exclusion End’t #22
Remove/Delete the Total Pollution Exclusion End’t #29 and keep the standard pollution exclusion from the policy form only.
Amend terms and conditions – Cancellation and Nonrenewal – 60 days-Notice to 90 days-Notice
Include within policy, coverage for 10% (5%) free growth

Comprehensive Operational Review of CRRA October 30, 2013
The information contained herein is subject to the disclaimer presented on page 1 of this document.
Page 192
Provide coverage for Assault & Battery if not committed by or at the direction of the insured unless committed for the purpose of protecting persons or property.
Auto Comments
CA9916 Hired Autos Specified as Covered Autos You Own- Additional insured liability coverage is being eliminated for the owner and lessor of a covered auto for losses resulting from the negligence of said lessor or owner (page 4 of 7). CA2502 Dealers Driveway Collision Coverage – reflect language that is currently contained under the Quarterly or Monthly Reporting Premium Basis within Garage Coverage Form. The language will state if the first report is delinquent on the date of a loss, the most an insurer will pay is 75% of the Limit of Insurance shown in the Schedule for the applicable location (page 4 of 7). CA0442 Exclusion of Federal Employees Using Autos in Government Business – This endorsement excludes liability coverage for the US, any of its agencies or any US Government employee for BI or PD resulting from the operation of an auto that results while the employee is acting within the scope of duty and when Section 2679(c ) of the Deferral Tort Claims Act requires the US attorney general to defend the employee in any civil action or proceeding that may be brought for BI or PD. (page 4 of 7) CA2320 Truckers Endorsement – Within PD coverage, the “Wear and Tear” exclusion is revised to reinforce that damage due and confined to wear and tear, freezing, mechanical or electrical breakdown and blowouts, punctures, or other road damages to tires are excluded unless such loss results from the total theft of a covered auto. CA2514 Broadened Coverage – Garages – reinforced to include coverage for contents of premises rented to the named insured for a period of seven or fewer consecutive days. Additionally, the Schedule and paragraph C. are revised to specify a $100,000 standard limit for this coverage, unless another limit is shown in the schedule. CA9937 Garagekeepers Coverage – To reinforce the application of the “all perils” deductible, the Schedule in CA9937 has been revised to reference “for each customer’s auto.”
Summary of Insurance Structure, Comments, and Program Costs
Please see the exhibit below for the Schedule of Insurance for a summary of CRRA’s current insurance program and the corresponding costs.

Comprehensive Operational Review of CRRA October 30, 2013
The information contained herein is subject to the disclaimer presented on page 1 of this document.
Page 193

Comprehensive Operational Review of CRRA October 30, 2013
The information contained herein is subject to the disclaimer presented on page 1 of this document.
Page 194

Comprehensive Operational Review of CRRA October 30, 2013
The information contained herein is subject to the disclaimer presented on page 1 of this document.
Page 195

Comprehensive Operational Review of CRRA October 30, 2013
The information contained herein is subject to the disclaimer presented on page 1 of this document.
Page 196
Insurer Solvency
In order to meet a financial criteria standard comparable to a company the size of CRRA, carriers must have an AM Best minimum rating of A- (Excellent) or better. If the insurance carrier does not meet these financial criteria, the appropriate changes will be advised. The current carrier’s ratings are displayed in the below exhibit. The AM BEST rating indicates Financial Solvency, Financial Size, and Outlook of the rating.
Connecticut Resource Recovery Authority (CRRA)
Exhibit – A.M. Best Carrier Ratings & Financial Size
Policy Type Insurer AM Best Rating
Financial Size
Auto ACE USA A+ (Superior) XV ($2 Billion or Greater)
Crime Travelers A+ (Superior) XV ($2 Billion or Greater)
Fiduciary Travelers A+ (Superior) XV ($2 Billion or Greater)
Flood - XS Landmark A (Excellent) XIII ($1.25 to $1.5 Billion)
General Liability
ACE USA A+ (Superior) XV ($2 Billion or Greater)
Pollution AIG A+ (Superior) XV ($2 Billion or Greater)
Pollution ACE USA A+ (Superior) XV ($2 Billion or Greater)
Property
Westport Insurance Company A+ (Superior) XV ($2 Billion or Greater)
Zurich A+ (Superior) XV ($2 Billion or Greater)
ACE USA A+ (Superior) XV ($2 Billion or Greater)
XL Insurance America, Inc. A (Excellent) XV ($2 Billion or Greater)
EPLI - Public Officials
ACE USA A+ (Superior) XV ($2 Billion or Greater)
Umbrella ACE USA A+ (Superior) XV ($2 Billion or Greater)
Workers Compensation
Connecticut Indemnity Co.

Comprehensive Operational Review of CRRA October 30, 2013
The information contained herein is subject to the disclaimer presented on page 1 of this document.
Page 197
Task VII A review and analysis of all business transaction engaged in over the past five years over $5,000, including the name of the other contracting party, the amount of the transaction, the type of transaction, and whether such goods or services were procured through competitive bidding.
Activities Performed
Through the use of a data mining and analytics tool, detailed transaction information was reviewed. The source of the data reviewed was a back-up copy of the Authority’s general ledger database (Epicor, for information regarding Epicor see the IT Assessment section of this report). The backup database contained data dating from early 2002 but only transactions for the complete fiscal years 2009-2013 were considered for the review. The review focused on payables transactions and as such only vendor, purchase order, voucher, invoice, and general ledger transactions were reviewed. Transactions under $5,000 were excluded from the review. The vendor attributes available in the vendor data tables did not contain any elements that could be used to classify vendor types. Neither the purchasing nor invoice transitions contained elements that could be used to classify types of spend. In order to categorize the types of transactions CRRA has been procuring, a manual classification of vendor type was performed. Only a subset of the vendor list was classified. For the fiscal year periods of 2008 - 2014 the annual, cumulative voucher amounts were calculated for each vendor. For only the vendors that had a cumulative voucher total above $50,000 in at least one of the fiscal year periods reviewed was a vendor type assigned. Vendors above that threshold were classified as high profile vendors in the tool. There are 144 high profile vendors. Also calculated were potential high profile vendors which were vendors that had a fiscal year annual voucher spend of $45,000 to $49,999.99 (eight potential vendors). See Appendix D for a listing of the high profile and potential high profile vendors. The vendor type assignment was also included in the vendor data set in the data mining tool. The categories applied to the vendors were:
Engineering and Construction
Finance and Insurance
Government and Municipality
Legal and Professional Services
Miscellaneous
Supplies and Equipment
Utilities
Waste Management
To perform the assessment of the Authority’s compliance with its Competitive Bid Policy, a table linking, voucher, invoice, and purchase order transactions was built within the data mining tool. From that table, a sample of 25 transactions were identified. The sample focused on the high profile
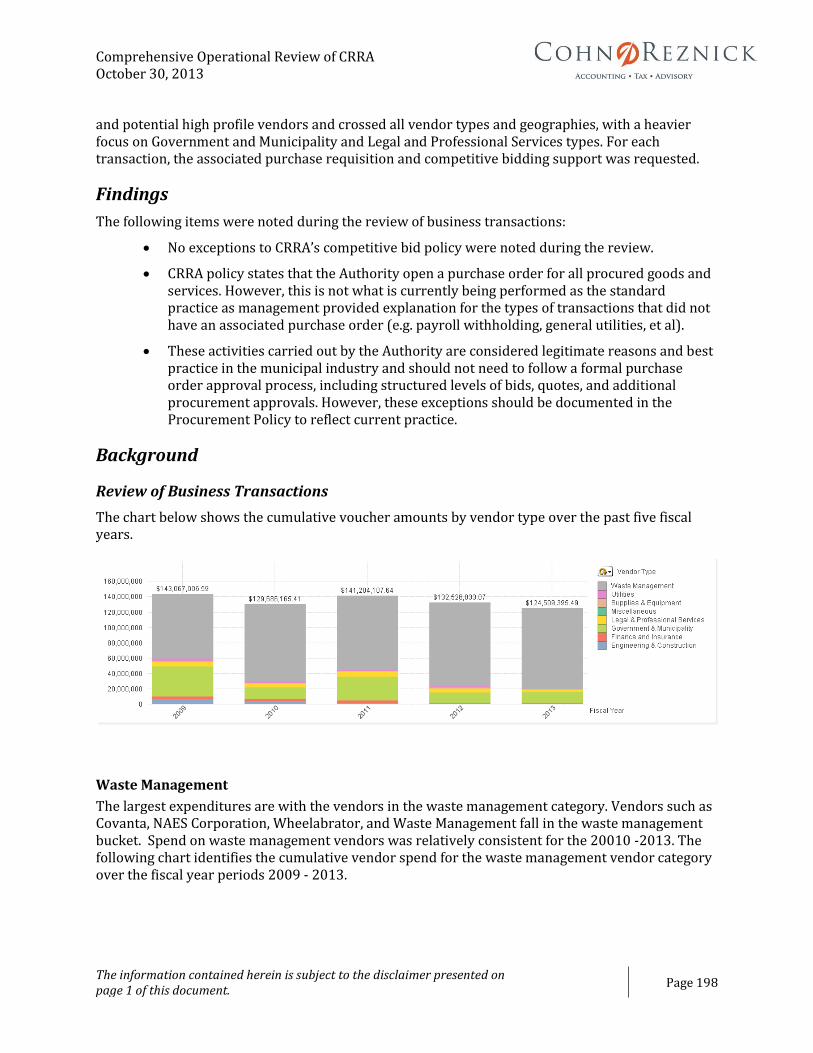
Comprehensive Operational Review of CRRA October 30, 2013
The information contained herein is subject to the disclaimer presented on page 1 of this document.
Page 198
and potential high profile vendors and crossed all vendor types and geographies, with a heavier focus on Government and Municipality and Legal and Professional Services types. For each transaction, the associated purchase requisition and competitive bidding support was requested.
Findings
The following items were noted during the review of business transactions:
No exceptions to CRRA’s competitive bid policy were noted during the review.
CRRA policy states that the Authority open a purchase order for all procured goods and services. However, this is not what is currently being performed as the standard practice as management provided explanation for the types of transactions that did not have an associated purchase order (e.g. payroll withholding, general utilities, et al).
These activities carried out by the Authority are considered legitimate reasons and best practice in the municipal industry and should not need to follow a formal purchase order approval process, including structured levels of bids, quotes, and additional procurement approvals. However, these exceptions should be documented in the Procurement Policy to reflect current practice.
Background
Review of Business Transactions
The chart below shows the cumulative voucher amounts by vendor type over the past five fiscal years.
Waste Management
The largest expenditures are with the vendors in the waste management category. Vendors such as Covanta, NAES Corporation, Wheelabrator, and Waste Management fall in the waste management bucket. Spend on waste management vendors was relatively consistent for the 20010 -2013. The following chart identifies the cumulative vendor spend for the waste management vendor category over the fiscal year periods 2009 - 2013.

Comprehensive Operational Review of CRRA October 30, 2013
The information contained herein is subject to the disclaimer presented on page 1 of this document.
Page 199
The following table identifies the top five vendors by total spend in this waste management category over the that period which comprise over 80% of the total waste management spend over the five-year period.
Other Vendors
Excluding the spend on vendors in the waste management category, the data reflects significant spikes in fiscal years 2009 and 2011 spending on government and municipality vendors. The chart below displays the cumulative voucher amounts by vendor type over the last five fiscal years, excluding the waste management vendor category. This exclusion was done to better visually depict the spending spikes.
Other Vendors – Government and Municipality
The government and municipality category is comprised of 34 towns and other government agencies. The swings in vendor spend from fiscal years 2009 through 2012 can be attributed primarily to five vendors. The table below documents the annual fiscal spending across the 34

Comprehensive Operational Review of CRRA October 30, 2013
The information contained herein is subject to the disclaimer presented on page 1 of this document.
Page 200
government agencies and state municipalities with the five vendors driving the spikes in spending highlighted.
Isolating those five vendors, it can be seen that the voucher payment spikes were made in April 2009 and November 2010 as shown in the line graph below, which displays the voucher spend in dollars for the five highlighted vendors above by month and year.

Comprehensive Operational Review of CRRA October 30, 2013
The information contained herein is subject to the disclaimer presented on page 1 of this document.
Page 201
Other Vendors – Legal and Professional Services
In fiscal year 2011, the largest voucher spend was on legal and professional services at over $6.6 million dollars. The table below documents the 29 vendors in the legal and professional services category the Authority has spent on over the five year period.
Assessment of CRRA’s Compliance with Competitive Bid Policy
CRRA competitive bid policy:
“For the purchase of goods and services costing more than $50,000 per Fiscal Year, the Competitive Process shall be utilized and Public Notice of the Solicitation is required. Pursuant to Section 3.2 of the Policies And procedures, any Contract for a period of over five (5) years in duration or a Contract for which the annual consideration is greater than $50,000 requires approval by a two-thirds (2/3) vote of CRRA's full Board of Directors. Pursuant to Section 3.3 of the Policies and Procedures, any non-budgeted expenditure in excess of $5,000 for the acquisition of real or personal property or Personal Services shall require CRRA Board approval.”
Document the results of the testing:
Review of business transactions over $5,000 in payables for the fiscal periods of 2009-2013 was performed and isolated to:
Vendors that had at least one fiscal year of cumulative voucher spend of at least $50k
Vendors that had at least one fiscal year of cumulative voucher spend of at between $45k and just below $50k

Comprehensive Operational Review of CRRA October 30, 2013
The information contained herein is subject to the disclaimer presented on page 1 of this document.
Page 202
A sample of 25 transactions was selected from the general ledger crossing all vendor types and geographies, with a heavier focus on Government & Municipality and Legal & Professional Services vendor types. The transaction review tested for compliance with the Procurement and Accounting policies, including proper sourcing, competitive bidding, and purchase order generation and approval activities. Of the 25, all transactions had adequate support based on the nature of the transaction and correctly triggered the need for competitive bidding requirements. There were instances where competitive bidding was not required (e.g. special expertise, obligations to municipalities, utilities, etc.), which is outlined in the Procurement policy. From this initial testing of 25 transactions, no exceptions were noted; adequate support was provided for the various types of transactions selected. Testing results are outlined below:
PO Ctrl No Vendor
Followed
Procurement
Policy? Bid? Procurement Description
PO0004617 Pepe Hazard Y Y Legal Services/Litigation
PO0005566 Pepe Hazard Y Y Legal Services/Litigation
PO0004356 Air Temp Mechanical Y Y HVAC improvements for Mid-Conn Waste Processing Facility
PO0004817 Pita Communications Y Y Single Stream Recycling Marketing Campaign
PO0007608 Aon Y N (Property Insurance) Property Insurance
PO0005252 Nels Consulting Y N (Special Expertise) Air Flow/Loss at Mid-Conn Power Block Facility
PO0006296 TMC Consulting Y Y Jet Fuel Storage Tank at South Meadows Jet Turbine Facility
PO0004079 TRC Environmental Y Y Engineering/Environmental Consulting for Ash Residue Landfill Development
PO0007642 Brown Rudnick Y Y Legal Services/Litigation
PO0007675 Halloran Sage Y Y Legal Services/Litigation
PO0005483 MDC Y N (Union Grievance) MDC Settlement for Red Circle Claim
PO0004101 Town of Windsor Y N (Township) Waste diversion and truck permitting fees at Bloomfield-Winsdor Landfill
PO0005444 Town of Stratford Y N (Funds Distribution) Distribution of Surplus Funds to Former Bridgeport Project Towns
PO0006419 Town of Stratford Y N (Funds Distribution) Distribution of Surplus Funds to Former Bridgeport Project Towns
PO0005877 Conn Interlocal Risk Mgmt Agency Y
N (Workers
Compensation) Workers Compensation/Employers Liability Insurance
PO0003662 New England Masonry Roofing Y Y Low Slope Roof Replacement at Norwalk Transfer Station
PO0007108 Botticello Y Y Hartford Landfill Operational and Maintenance
PO0008840 ETL Corporation Y Y Hartford Landfill Area Closure and Photovoltaic System Project
PO0004699 Woods Engineering & Consulting Y
N (Re-assignment from
prior defaulted vendor)
Re-assignment of Secondary Shredder Motors at Mid-Connecticut Waste
Processing Facility
PO0007954 Mettler Toledo Y Y Replace/Furnish/Install New Truck Scale at Essex Transfer Station
PO0007416 Chadwick-Baross Y Y New Tyrex/Fuchs Mobile Crane for Mid-Connecticut Project
PO0002936 DW Transport Leasing Y Y Ash Residue Transportation for Wallingford RRF
PO0007070 FCR Inc Y N (Shortfall) Stratford/SWEROC Contract Operating Charges/Annual Shortfall Fee
PO0007747 Nextera Energy Y Y Jet Turbine Facility Energy Management Services
PO0004955 Northeast Generation Services Y
N (Utilities; Existing
Operating Changes) Existing Contract Operating Charges

Comprehensive Operational Review of CRRA October 30, 2013
The information contained herein is subject to the disclaimer presented on page 1 of this document.
Page 203
Appendix A The below table identifies all of the documents that were considered as part of the operational review.
Task Document
Task I External Audit reports, Fiscal Years 2003-13
Management Letters for Internal Controls over Financial Reporting,
Fiscal Years 2003-13
Authority’s Comprehensive Annual Financial Reports, Fiscal Years 2003-
13
CRRA Sludge Co-Disposal Study and Report, Halcyon Technologies,
March 2002
DEP Solid Waste Management Bulletin to Townships, CRRA, August
2006
State of Connecticut Solid Waste Management Plan, July 2006 (Amended
December 2006)
Management Comments on the August 2006 Proposed Plan, CRRA,
September 2006
White Paper, Meeting the Challenge - Ensuring Capacity for
Connecticut’s Municipal Solid Waste and Recyclables in Changing
Market Conditions, Gershman, Bricker & Bratton, February 2007
DEP Solid Waste Management Advisory Committee Presentation, CRRA,
February 2010
Study and Review of New and Emerging Technologies for Municipal
Solid Waste Disposal, Alternative Resources Inc., May 2010
Presentation to the Governor, Modernizing Recycling Working Group,
October 2012
Report of Recommendations to the Governor, Modernizing Recycling
Working Group, December 2012
Annual Report of Connecticut Resource Recovery Authority Operations ,
Fiscal Years 2005-12
Management Communications: Electricity
o Electric Supplier License Status, Dec 2002
o Jet Reserves, Dec 2002
o Power Marketing Alternatives, Dec 2002
Management Communications: Hauler
o CRRA Hauler Meeting Agenda, June 2007
o CRRA Letter to Commissioner Boyle regarding Hauler Licensing,
June 2006
o CRRA Presentation to Haulers, May 2006
o CRRA Testimony to Hauler Licensing Task Force, July 2006
Management Communications: Legal
o Brown Rudnick LLP, Category of Services, November

Comprehensive Operational Review of CRRA October 30, 2013
The information contained herein is subject to the disclaimer presented on page 1 of this document.
Page 204
Task Document
o Cohn Birnbaum & Shea PC, Category of Services, November
o CRRA Legal Service Awards
o CRRA Hartford Landfill Host Agreement
o Memorandum of Decision: MDC v CRRA, November 2010
Management Communications: Legislative Legal
o Blumenthal to CRRA on Board Members Dual Roles, November
2006
o Legislative Summary, 2013
o SB 1167 Legislative Bulletin
Management Communications: Mid Conn Operations and Fees
o Letter to Mid-Conn Towns regarding MDC and New Hartford
Suit, August 2005
o Alert to Towns regarding Schuman Decision
o CRRA Advisory Panel Report, March 2002
o Fiscal Year 2003 Budget Reductions for Mid-Conn, Dec 2002
o Letter to Mid-Conn Towns, Aug 2007
o Mid-Conn MSA Comparison Table
o Mid-Conn Revenue Fund Analysis, Dec 2002
o Letter to Mid-Conn Towns on Cost Initiative, April 2004
o Letter to Mid-Conn Towns Status Report on Enron, July 2003
o Letter to Mid-Conn Towns on Enron Litigation, March 2004
o AG Report on Truck Transfer Deal
CRRA MDC Arbitration Ruling
Task II Solid Waste Collection contracts with participating towns and waste
haulers.
Capacity Assessment from ISO New England
Internal engineering report on the plants efficiency
LaCapra Associates report on future electricity costs
Current payroll statement for the two week period ending 9/27/2013
Prior year financial results
Insurance contracts
City of Hartford PILOT Program contract
Solid Waste Assessment contract with CT DEEP
Ash Residue Transportation and Disposal Services Agreement
Operating and Maintenance Agreement between NAES Corporation and
CRRA
Agreement for Waste Transportation and Transfer Station Operation
and Maintenance Services at Essex and Watertown
Task III Lease agreements for the Essex Transfer Station, Constitution Plaza
offices, and Pitney Bowes mail machine
Schedule of Authority owned and leased property provide by the

Comprehensive Operational Review of CRRA October 30, 2013
The information contained herein is subject to the disclaimer presented on page 1 of this document.
Page 205
Task Document
Authority
June 30, 2013 audit report
List of active contracts as provided by the Authority
Information about the Authority’s contractors as listed on the
Authority’s website
Legal Services Agreement Summary available on the Authority’s website
Listing of vendors paid $5,000 or more during fiscal year 2013 prepared
based upon the analysis under Task VII.
Available legal letters that were prepared at the request of the
Authority’s auditor for fiscal years 2007 through 2013 audit
Letters prepared by Authority attorneys at the request of the auditor
Memo provided by the Authority regarding any potential pollution-
related liabilities
CRRA slides – Remediation of South Meadows
Detailed general ledgers for 2013 and previous fiscal years as necessary
June 30, 2013 and June 30, 2012 work papers
Invoices from various law firms and legal fees that related to accrued
amount that were paid subsequent to June 30, 2013
Tonnage reported listing by town the amount of recycling tons delivered
Customer accounts receivable report as of June 30, 2013
Supporting documentation for the nature and purpose of the unearned
revenue amount
Detailed report from billing system listing customer deposit amounts as
of June 30, 2013
June 30, 1997, 1998, and 2003 Authority audit reports
Authority prepared Annual Landfill Closure and Post Closure Care
Evaluation for GASB 18 – Status as of June 30, 2013
Vendor contract termination clause and related termination payment
schedule
Letter of agreement with vendor extending the contract and fixing the
termination date
Supporting documentation (vendor quote) for coal pond cleaning
project
City of Hartford’s host community agreement
Invoice submitted by the City of Hartford subsequent to June 30, 2013
for recycling education expenses
2009, 2010, 2011, 2012, 2013, and 2014 budgets
Bond official statements and related indenture agreements

Comprehensive Operational Review of CRRA October 30, 2013
The information contained herein is subject to the disclaimer presented on page 1 of this document.
Page 206
Task Document
Task IV – IT Assessment Annual operations report- Fiscal Year 2012
Adopted mid Conn Budget – Fiscal Year 2012
IT Training Certificate
Summary of External IT audit – 2009
CRRA Adopted min-Conn operating and capital budget – Fiscal Year
2013
Walker systems support agreement
Epicor Maintenance agreement
Applications and Interface form
PC and laptop inventory
CRRA Server info
CRRA Network diagram – LAN
CRRA Network diagram – WAN
Backup Policy
CRRA BDR Agreement and Pricing
BDR memo
External Security Audit – 2010
Active Directory Configurations
Task IV – Organization Assessment
CRRA Policies and Procedures - Employee Compensation, Demotions,
Benefits, Insurance, Employee Leave, Wellness Program Policy
CRRA Employee Handbook
CRRA Org Chart 9_6_2013
CRRA EE Position Overview 9_6_2013
CRRA Job Descriptions effective 9_6_2013
Various Employment Agreements (James Bolduc, Mark Daley, Peter
Egan, Laurie Hunt, Thomas Kirk)
Wage Structure 9_5_2013
Minutes 3-28-13 OS & HR minutes
Benefits Package
Accounting Job Descriptions
Telephone Directory 100113

Comprehensive Operational Review of CRRA October 30, 2013
The information contained herein is subject to the disclaimer presented on page 1 of this document.
Page 207
Task Document
Task IV – Operational
Assessment, Task V – Market
Assessment
Independent Engineering Audit of the Mid-Connecticut Materials
Recovery Facility, D&B Engineers and Architects, Dec 2012
2012 Integrated Resource Plan for Connecticut, CT DEEP, June 2012
o Appendix D
o Appendix E
o Appendix H
o Appendix I
Statewide Economic Benefits of Connecticut’s Waste to Energy Sector,
Governmental Advisory Associates, Inc, February 2013
Estimates of Connecticut Municipal Solid Waste Generated (MSW),
Disposed, and Recycled, CT DEEP
o Fiscal Year 2008
o Fiscal Year 2009
o Fiscal Year 2010
o Fiscal Year 2011
Potential Coal Plant Retirements: 2012 Update, Brattle Group, Oct 2012
CT Population Data 2010-2012, US Census Bureau, Oct 2013
The Economic Impact on Connecticut from Recycling Activity, CERC, Nov
2012
Energy and Economic Value of Non-Recycled Plastics (NRP) and
Municipal Solid Wastes (MSW) That Are Currently Landfilled in the Fifty
States, Columbia University Earth Engineering Center, August 2011
Advanced Thermal Treatment of Municipal Solid Waste, defra, 2007
CT’s Solid Waste Management System Existing Infrastructure, CT DEEP,
June 2012
Transforming Solid Waste Management in Connecticut & Beyond,
NEWMOA, Dec 2012
Waste-to-Energy Facilities Provide Significant Economic Benefits White
Paper, SWANA
Waste-to-Energy in the U.S. and Trends for the Future, US EPA, August
2011
Municipal Solid Waste Management Services in Connecticut, Legislative
Program Review and Investigation Committee, Jan 2010
Anaerobic Digestion of Food Waste in New England: Summer 2013
Report, US EPA, 2013
Northeast Waste Management Officials’ Association (NEWMOA)
Municipal Solid Waste (MSW) Interstate Flow in 2008, NWMOA, Aug
2010
Resources Recovery Facility Ownership: Options and Implications,
Legislative Program Review and Investigation Committee, Sept 2008
State of Connecticut Solid Waste Management Plan, CT DEEP, Dec 2006
Where Does Your Garbage Go?, CRRA, Jan 2013
CRRA Plant Drawings, CRRA, Accessed 2013

Comprehensive Operational Review of CRRA October 30, 2013
The information contained herein is subject to the disclaimer presented on page 1 of this document.
Page 208
Task Document
Resource Recovery Facility Compliance Inspection, Bureau of Materials
Management & Compliance Assurance Waste Engineering &
Enforcement Division, Jan 2012
Alternative Proposal in Response to Request for Bids and Proposals for
Operation and Maintenance of the Mid-Connecticut Resource Recovery
Facility, Covanta Mid-Conn Inc. May 2010
Notice of Violation Number 17115, CT DEEP, June 2013
Enforcement Action Report, CT DEEP, Sept 2013
Solid Waste Transfer Station Inspection Report, Bureau of Materials
Management & Compliance Assurance Waste Engineering &
Enforcement Division, Oct 2010
Resources Recovery & Volume Reduction Facility Phase I Compliance
Inspection, Bureau of Materials Management & Compliance Assurance
Waste Engineering & Enforcement Division, Nov 2008
Compliance History for CRRA Torrington Transfer Station Interoffice
Memorandum, Bureau of Materials Management & Compliance
Assurance Waste Engineering & Enforcement Division, July 2012
CRRA Budgets, CRRA, 2007-2013
o Fiscal Years 2007-2014
Capital Improvement Plan Fiscal Years 2014-2018, CSWS, Sept 2013
Request for Proposals for REDESIGN, UPGRADE, AND OPERATION & MAINTENANCE SERVICES AT CRRA’S STRATFORD INTERMEDIATE PROCESSING CENTER, CRRA, April 2012
Request for Expressions of Interest for Source-Separated Organic Materials Facility, CRRA, April 2012
Mid-Conn Internal Energy Consumption Study, CRRA, Dec 2010 Weekly and Monthly O&M Reports, CRRA, Jan 2012 - Sept 2013 Ops Database, CRRA, July 2010 – June 2013 Tonnage Database, CRRA, 1997-2013 CRRA WPF_PBF Fiscal Year 2014 Budget Roll-Up, CRRA, 2013 Agreement for Waste Transportation and Transfer Station Operation
and Maintenance Services at Torrington, CRRA, June 2013 Agreement for Waste Transportation and Transfer Station Operation
and Maintenance Services at Essex and Watertown, CRRA, June 2013 Operation and Maintenance of the Mid-Connecticut Jet Turbine Facility,
CRRA, March 2012 Notice to Proceed with WPF, PBF/EGF Transition Services, CRRA, July
2011 First Amendment to Energy Management Services Agreement, CRRA,
May 2013 Jet Turbine Facility Energy Management Services Agreement, NextEra
Energy Power Marketing, LLC, April 2012 Ash Residue and Disposal Services for the Mid-Connecticut Resource
Recovery Facility, CRRA, Dec 2008 First Amendment to Agreement for Acceptable Ash Residue
Transportation and Disposal Services From Mid-Connecticut Resources

Comprehensive Operational Review of CRRA October 30, 2013
The information contained herein is subject to the disclaimer presented on page 1 of this document.
Page 209
Task Document
Recovery Facility and Acceptable Ash Residue Disposal Services From Preston Resource Recovery Facility, CRRA, Dec 2010
New Agreement Summary for Contract Entitled Metals Recovery and Marketing Services South Meadows Resource Recovery Facility, CRRA, Feb 2013
Environmental Compliance Calendar, CRRA, Sept 2013 Request for Proposals for Operation and Maintenance Services and
Commodity Marketing for the Connecticut Solid Waste System Recycling Facility, CRRA, May 2013
Summary of Responses to Request for Expressions of Interest, Organics Material Processing Facility, ARI, July 2012
5 Year Action Plan PowerPoint Presentation, CT DEEP, 2013 Draft Summary of CT Resource Recovery Facilities Contract Expirations
and Pricing Status, CT DEEP, Sept 2013 Presentation to the CRRA Board PowerPoint Presentation, CT DEEP,
2013 Summary of CEFIA’s Ongoing AD Project Development, CT DEEP, 2013 Transfer Station Inspection Report, Bureau of Waste Management Waste
Engineering & Enforcement Division, April 2011 Task VI - Internal Control Assessment
Accounting Procedure Policy
AR Write off Policy
Board of Directors Expense Reimbursement Policy
Bonds, Notes and Other Obligations Policy
Bylaws - Board of Directors Policy
Cash Management Procedure
Cell Phone Usage Policy
Checks (Positive Pay) Procedure Policy
Corporate Card Use Policy
Daily Receipts Policy
Delinquent Tipping Fees Policy
Distribution of Recycling Rebates Procedure
Employee Awards Policy
Employee Expense Reimbursement Policy
Employee Service Award Policy
E-Procurement Policy and Procedure
Equal Opportunity Employer Policy
Ethics Policy
Financial Forecasting and Budgeting Policy
Fixed Asset Tagging Procedure
Fixed Assets Procedure
Gift Shop Sales and Inventory Policy and Procedure
Hazard Communication Program
Hiring, Compensation, Promotion & Dismissal Procedures
Interest Income from STIF Policy
Investment Policy
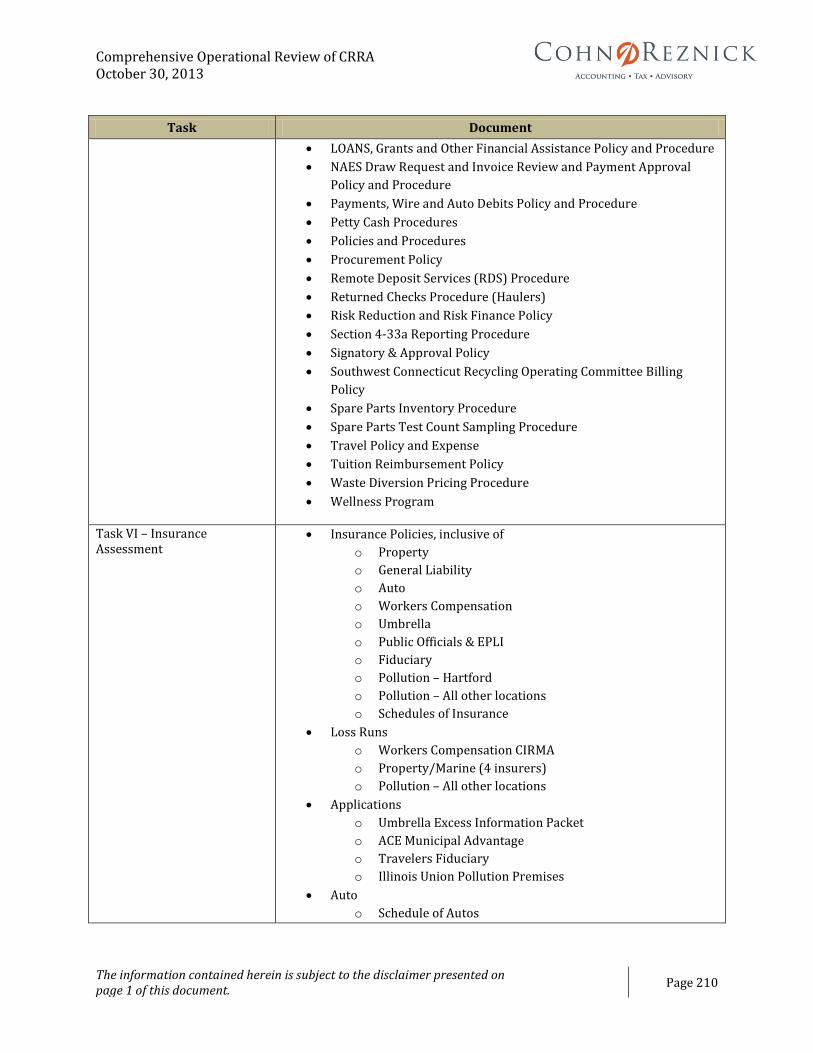
Comprehensive Operational Review of CRRA October 30, 2013
The information contained herein is subject to the disclaimer presented on page 1 of this document.
Page 210
Task Document
LOANS, Grants and Other Financial Assistance Policy and Procedure
NAES Draw Request and Invoice Review and Payment Approval
Policy and Procedure
Payments, Wire and Auto Debits Policy and Procedure
Petty Cash Procedures
Policies and Procedures
Procurement Policy
Remote Deposit Services (RDS) Procedure
Returned Checks Procedure (Haulers)
Risk Reduction and Risk Finance Policy
Section 4-33a Reporting Procedure
Signatory & Approval Policy
Southwest Connecticut Recycling Operating Committee Billing
Policy
Spare Parts Inventory Procedure
Spare Parts Test Count Sampling Procedure
Travel Policy and Expense
Tuition Reimbursement Policy
Waste Diversion Pricing Procedure
Wellness Program
Task VI – Insurance Assessment
Insurance Policies, inclusive of
o Property
o General Liability
o Auto
o Workers Compensation
o Umbrella
o Public Officials & EPLI
o Fiduciary
o Pollution – Hartford
o Pollution – All other locations
o Schedules of Insurance
Loss Runs
o Workers Compensation CIRMA
o Property/Marine (4 insurers)
o Pollution – All other locations
Applications
o Umbrella Excess Information Packet
o ACE Municipal Advantage
o Travelers Fiduciary
o Illinois Union Pollution Premises
Auto
o Schedule of Autos

Comprehensive Operational Review of CRRA October 30, 2013
The information contained herein is subject to the disclaimer presented on page 1 of this document.
Page 211
Task Document
Cyber
o Summary of external IT security
o Backup Policy
o Security Audit
Property
o Invoices
o Schedule of Values
o COPE report
o Inspection Reports
o Location Valuations
Workers Compensation
o Estimated Schedule of Class Codes
o WC Experience Rating

Comprehensive Operational Review of CRRA October 30, 2013
The information contained herein is subject to the disclaimer presented on page 1 of this document.
Page 212
Appendix B The below supporting schedules were developed to support the three year budget projections discussed in the section of
the report for Task II.
Schedule 1 – Service Charges Solid Waste – Participating Town
Service Charges Solid Waste - Participating Towns
Tonnage Unit Price Revenue Tonnage Unit Price Revenue Tonnage Unit Price Revenue
Tier 1 - Short Term 145,000 63.00$ 9,135,000$ 145,000 64.00$ 9,280,000$ 145,000 65.00$ 9,425,000$
Tier 1 - Long Term 210,000 61.00$ 12,810,000$ 210,000 62.00$ 13,020,000$ 210,000 63.00$ 13,230,000$
Tier 2 27,000 65.00$ 1,755,000$ 27,000 66.00$ 1,782,000$ 27,000 66.00$ 1,782,000$
Total 382,000 23,700,000$ 382,000 24,082,000$ 382,000 24,437,000$
FY 2014 FY 2015 FY 2016
Schedule 2 – Service Charges Solid Waste – Contracts
Tonnage
Average
Unit
Price Revenue Tonnage
Average
Unit
Price Revenue Tonnage
Average
Unit
Price Revenue
All-American 115,000 54.50$ 6,267,500$ 115,000 54.50$ 6,267,500$ 115,000 54.50$ 6,267,500$
Winters, Dainty, Hometown 20,000 54.50$ 1,090,000$ 20,000 54.50$ 1,090,000$ 20,000 54.50$ 1,090,000$
CPWM New Haven 40,000 54.50$ 2,180,000$ 40,000 54.50$ 2,180,000$ 40,000 54.50$ 2,180,000$
Total 175,000 9,537,500$ 175,000 9,537,500$ 175,000 9,537,500$
FY 2014 FY 2015 FY 2016

Comprehensive Operational Review of CRRA October 30, 2013
The information contained herein is subject to the disclaimer presented on page 1 of this document.
Page 213
Schedule 3 – Service Charges Solid Waste – Hauler
Tonnage Unit Price Revenue Tonnage Unit Price Revenue Tonnage Unit Price Revenue
Hauler Put or Pay 56,000 62.00$ 3,472,000$ 56,000 62.00$ 3,472,000$ 56,000 62.00$ 3,472,000$
CWPM Other 4,000 61.00$ 244,000$ 4,000 61.00$ 244,000$ 4,000 61.00$ 244,000$
Total 60,000 3,716,000$ 60,000 3,716,000$ 60,000 3,716,000$
FY 2014 FY 2015 FY 2016
Schedule 4 – Service Charges Solid Waste – Spot
Tonnage Unit Price Revenue Tonnage Unit Price Revenue Tonnage Unit Price Revenue
Total Tonnage 91,000 35.00$ 3,185,000$ 91,000 35.00$ 3,185,000$ 91,000 35.00$ 3,185,000$
Ferrous 10,000 45.00$ 450,000$ 10,000 45.00$ 450,000$ 10,000 45.00$ 450,000$
Total 101,000 3,635,000$ 101,000 3,635,000$ 101,000 3,635,000$
FY 2014 FY 2015 FY 2016

Comprehensive Operational Review of CRRA October 30, 2013
The information contained herein is subject to the disclaimer presented on page 1 of this document.
Page 214
Schedule 5 – Metal Sales
Tonnage Unit Price Revenue Tonnage Unit Price Revenue Tonnage Unit Price Revenue
Inbound 710,000 710,000 710,000
Historical Rate 3.00% 3.00% 3.00%
21,300 21,300 21,300
Central Inbound 1,700 1,700 1,700
Total 23,000 75.00$ 1,725,000$ 23,000 75.00$ 1,725,000$ 23,000 75.00$ 1,725,000$
FY 2014 FY 2015 FY 2016
Schedule 6 – Municipal Bulky Waste
Tonnage Unit Price Revenue Tonnage Unit Price Revenue Tonnage Unit Price Revenue
Municipal Bulky Waste 2,000 85.00$ 170,000$ 2,000 85.00$ 170,000$ 2,000 85.00$ 170,000$
Mattress/Box Springs 300 30.00$ 9,000$ 300 45.00$ 13,500$ 300 45.00$ 13,500$
Total 2,300 179,000$ 2,300 183,500$ 2,300 183,500$
FY 2014 FY 2015 FY 2016
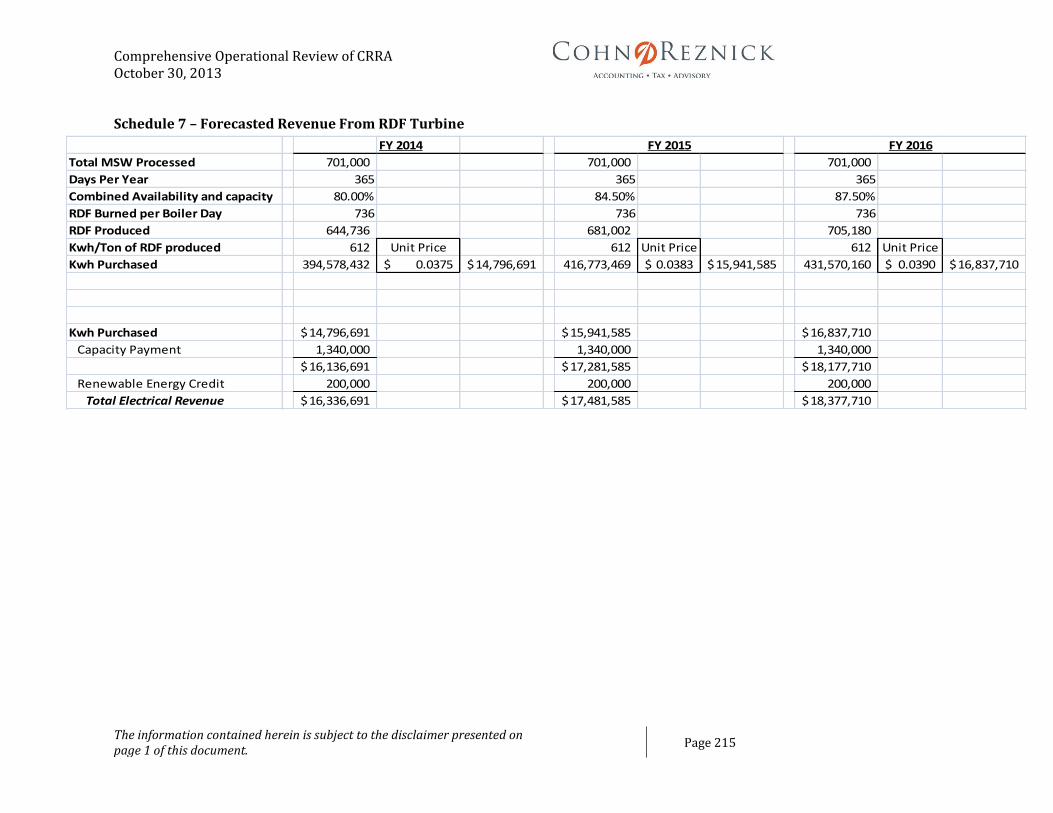
Comprehensive Operational Review of CRRA October 30, 2013
The information contained herein is subject to the disclaimer presented on page 1 of this document.
Page 215
Schedule 7 – Forecasted Revenue From RDF Turbine
FY 2014
Total MSW Processed 701,000 701,000 701,000
Days Per Year 365 365 365
Combined Availability and capacity 80.00% 84.50% 87.50%
RDF Burned per Boiler Day 736 736 736
RDF Produced 644,736 681,002 705,180
Kwh/Ton of RDF produced 612 Unit Price 612 Unit Price 612 Unit Price
Kwh Purchased 394,578,432 0.0375$ 14,796,691$ 416,773,469 0.0383$ 15,941,585$ 431,570,160 0.0390$ 16,837,710$
Kwh Purchased 14,796,691$ 15,941,585$ 16,837,710$
Capacity Payment 1,340,000 1,340,000 1,340,000
16,136,691$ 17,281,585$ 18,177,710$
Renewable Energy Credit 200,000 200,000 200,000
Total Electrical Revenue 16,336,691$ 17,481,585$ 18,377,710$
FY 2015 FY 2016

Comprehensive Operational Review of CRRA October 30, 2013
The information contained herein is subject to the disclaimer presented on page 1 of this document.
Page 216
Schedule 8 – Administrative Expenses
FY 2014 FY 2015 FY 2016
Administrative Expenses
Indirect Labor and Overhead A 2,136,000$ 2,791,000$ 2,980,500$
Direct Salaries/Labor & Benefits 691,000 704,820 718,916
Total Operational Expenses 2,827,000$ 3,495,820$ 3,699,416$
2% increase per year in salary and overhead
2015 - Six FT positions will be eliminated - $486,000
A - Per CRRA 5 year projection

Comprehensive Operational Review of CRRA October 30, 2013
The information contained herein is subject to the disclaimer presented on page 1 of this document.
Page 217
Schedule 9 – Operational Expenses
FY 2014 FY 2015 FY 2016
Operational Expenese
Direct Salaries 1,734,000$ 1,768,680$ 1,804,054$
Asset Protection & Stationary Compliance
Legal Notices 25,500 26,010 26,530
Fees/Licenses/Permits 1,000 1,020 1,040
Claims/Losses 50,000 51,000 52,020
Bad Debt Expense 500 510 520
Legal 500,000 510,000 520,200
Operational Auditing 5,000 5,100 5,202
WPF and PBF Insurance Premium 1,187,000 1,210,740 1,234,955
Insurance Broker 108,000 110,160 112,363
Subtotal 1,877,000 1,914,540 1,952,831
Engineering, Technology, & Equipment/Facility Expenses
Engineering & Technology Consulting Services 10,000 10,200 10,404
Computer Hardware 4,200 4,284 4,370
Computer Software 1,000 1,020 1,040
Operational Contingency 50,000 50,000 50,000
Subtotal 65,200 65,504 65,814
Other Operational Expenses
Postage Delivery Fees 5,000 5,100 5,202
Printing Services 5,000 5,100 5,202
Office Supplies 5,000 5,100 5,202
Protect Clothing/Safety Equipment 5,300 5,406 5,514
Miscellaneous Services 5,000 5,100 5,202
Business Meetings and Travel 1,500 1,530 1,561
Mileage Reimbursement 2,000 2,040 2,081
Vehicle Repair/Maintenance 15,000 15,300 15,606
Fuel for Vehicles 18,000 18,360 18,727
Temporary Agency Services 40,000 40,800 41,616
Financial Services 20,000 20,400 20,808
Bank Fees 10,000 10,000 10,000
Subtotal 131,800 134,236 136,721
Total Operational Expenses Before Reserves 3,808,000$ 3,882,960$ 3,959,419$
Increases based upon 2% CPI

Comprehensive Operational Review of CRRA October 30, 2013
The information contained herein is subject to the disclaimer presented on page 1 of this document.
Page 218
Schedule 10 - Assessment, Fees, Subsidies Expenses
FY 2014 FY 2015 FY 2016
Assessment, Fees, Subsidies, & Pilots
City of Hartford PILOT 2,200,000$ 2,200,000$ 2,200,000$
Subtotal Transfer Station Host Community Benefit Fees 136,000 136,000 136,000
Solid Waste Assessment 967,104 1,021,504 1,057,770
Total Assessment, Fees, Subsidies, & Pilots 3,303,104$ 3,357,504$ 3,393,770$
Schedule 11 - Waste Transport Expenses
FY 2014 FY 2015 FY 2016
Waste Transport
Subtotal Contract Operating Charges (excludes recycling transportation) 2,698,000$ 2,751,960$ 2,806,999$
Disposal Fees - Solid Waste (Bypass) (A) 614,000 626,280 638,806
Ash Disposal 11,002,000 11,222,040 11,446,481
Non-Processible Disposal Fees 172,000 175,440 178,949
Total Waste Transport 14,486,000$ 14,775,720$ 15,071,234$
Increases based upon 2% CPI

Comprehensive Operational Review of CRRA October 30, 2013
The information contained herein is subject to the disclaimer presented on page 1 of this document.
Page 219
Schedule 12 - Waste Processing Facility Expenses
FY 2014 FY 2015 FY 2016
Waste Processing Facility
Telecommunications 2,000$ 2,000$ 2,000$
Building Operations 10,000 10,000 10,000
Computer Hardware 1,000 1,000 1,000
Project Equipment Maintenance 7,000 7,000 7,000
Fees/Licenses/Permits 7,500 7,500 7,500
Subtotal Contract Operating Charges 11,985,000 12,194,738 13,505,672
Other Operating Charges 73,900 73,900 73,900
Engineering Consultants 51,000 51,000 51,000
Environmental Testing 7,500 7,500 7,500
Total Waste Processing Facility 12,144,900$ 12,354,638$ 13,665,572$
Schedule 13 - Power Block Facility Expenses
FY 2014 FY 2015 FY 2016
Power Block Facility
Fees/Licenses/Permits 456,000$ 456,000$ 456,000$
Subtotal Contract Operating Charges 16,139,000 16,421,433 16,708,808
Engineering Consultants 16,000 16,000 16,000
Environmental Testing 103,000 103,000 103,000
Electricity 245,000 245,000 245,000
Building Operations 17,000 17,000 17,000
Other Utilities 385,000 385,000 385,000
Total Power Block Facility 17,361,000$ 17,643,433$ 17,930,808$
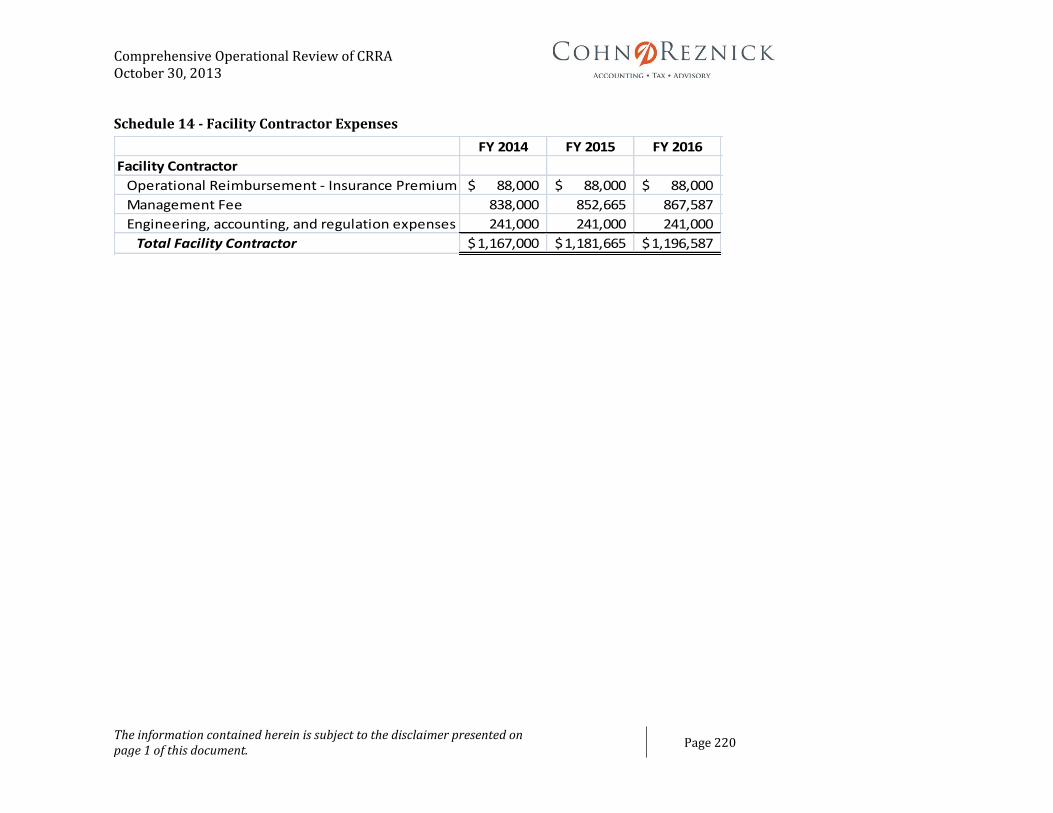
Comprehensive Operational Review of CRRA October 30, 2013
The information contained herein is subject to the disclaimer presented on page 1 of this document.
Page 220
Schedule 14 - Facility Contractor Expenses
FY 2014 FY 2015 FY 2016
Facility Contractor
Operational Reimbursement - Insurance Premium 88,000$ 88,000$ 88,000$
Management Fee 838,000 852,665 867,587
Engineering, accounting, and regulation expenses 241,000 241,000 241,000
Total Facility Contractor 1,167,000$ 1,181,665$ 1,196,587$

Comprehensive Operational Review of CRRA October 30, 2013
The information contained herein is subject to the disclaimer presented on page 1 of this document.
Page 221
Schedule 15 - Transfer Stations’ Expenses
FY 2014 FY 2015 FY 2016
Transfer Station Expenses
Transfer Station - Ellington
Telecommunications 3,000$ 3,000$ 3,000$
Building Operations 14,000 14,000 14,000
Ground Maintenance 3,500 3,500 3,500
Fees/Licenses/Permits 2,500 2,500 2,500
Subtotal 23,000 23,000 23,000
Transfer Station - Essex
Telecommunications 3,000 3,000 3,000
Building Operations 11,600 11,600 11,600
Project Equipment Maintenance 10,500 10,500 10,500
Fees/Licenses/Permits 2,750 2,750 2,750
Contract Operating Charges 520,000 520,000 520,000
Engineering Consultants 11,000 11,000 11,000
Environmental Testing 5,800 5,800 5,800
Subtotal 564,650 564,650 564,650
Transfer Station - Torrington
Telecommunications 3,500 3,500 3,500
Building Operations 11,600 11,600 11,600
Project Equipment Maintenance 10,500 10,500 10,500
Fees/Licenses/Permits 2,750 2,750 2,750
Contract Operating Charges 499,000 499,000 499,000
Engineering Consultants 11,000 11,000 11,000
Environmental Testing 4,650 4,650 4,650
Subtotal 543,000 543,000 543,000
Transfer Station - Watertown
Telecommunications 2,400 2,400 2,400
Building Operations 10,000 10,000 10,000
Project Equipment Maintenance 10,500 10,500 10,500
Fees/Licenses/Permits 2,750 2,750 2,750
Contract Operating Charges 520,000 520,000 520,000
Engineering Consultants 11,000 11,000 11,000
Environmental Testing 3,500 3,500 3,500
Subtotal 560,150 560,150 560,150
Total Transfer Stations' Expenses 1,667,800$ 1,667,800$ 1,667,800$

Comprehensive Operational Review of CRRA October 30, 2013
The information contained herein is subject to the disclaimer presented on page 1 of this document.
Page 222
Schedule 16 – Recycling Facility Expenses
FY 2014 FY 2015 FY 2016
Recycling Facility
Legal Notices 8,000$ 8,000$ 8,000$
Business Meetings & Travel 1,000 1,000 1,000
Mileage Reimbursement 1,000 1,000 1,000
Project Equipment Maintenance 35,000 35,000 35,000
Fees/Licenses/Permits 3,750 3,750 3,750
Municipal Events 16,000 16,000 16,000
Recycling Delivery Rebate 415,000 415,000 415,000
Transport Expense 436,000 436,000 436,000
Engineering Consultants 12,000 12,000 12,000
Environmental Testing 7,500 7,500 7,500
Indirect Labor & Overhaul - Admin 35,000 35,000 35,000
Direct Salaries /Labor & Benefits - Admin 47,000 47,000 47,000
Direct Salaries /Labor & Benefits - Operational 270,000 270,000 270,000
Total Recycling Facility 1,287,250$ 1,287,250$ 1,287,250$

Comprehensive Operational Review of CRRA October 30, 2013
The information contained herein is subject to the disclaimer presented on page 1 of this document.
Page 223
Schedule 17 – Property Division
Revenues FY 2014 FY 2015 FY 2016
South Central Facility Capacity 239,000$ 239,000$ 239,000$
Jets 5,822,800 6,864,800 6,376,800
Lease Income 425,000 425,000 425,000
Education & Trash Museum 235,000 - -
Total Revenues 6,721,800$ 7,528,800$ 7,040,800$
Expenditures
Telecommunications 2,500 2,550 2,601
Mileage Reimbursement 1,000 1,000 1,000
Legal 10,000 10,200 10,404
Insurance Expenditures 20,000 20,400 20,808
Other Consulting Services 200,000 204,000 208,080
Indirect Labor & Overhead - Admin A 354,000 781,000 835,000
Direct Salaries/Labor & Benefits - Admin 31,000 31,620 32,252
Direct Salaries/Labor & Benefits - Operational 25,000 25,500 26,010
Murphy Road Operations Center, Net 94,000 95,880 97,798
1410 Honey Spot Road 95,000 96,900 98,838
171 Murphy Road 45,000 45,900 46,818
Education & Trash Museum 278,300 96,500 96,500
South Central Facility Operating Charges 220,400 224,200 228,000
Jets Operating Charges 2,929,100 2,977,006 3,013,558
Total Expenditures 4,305,300 4,612,656 4,717,667
Net Cash Generated Before Reserves 2,416,500$ 2,916,144$ 2,323,133$
Contribution to Severance Reserve 430,000 - -
Contribution to Jets Capital Reserve 200,000 200,000 -
Contribution to Facilities Capital Refurb Reserve 300,000 30,000 100,000
Contribution to Solid Waste Future Devel. Res 688,000 - -
Transferred to the CSWS 798,500$ 2,686,144$ 2,223,133$
A Per CRRA 5 year projection
Projection assumes all excess cash generated will be contributed to CSWS to stabilize tip fee.

Comprehensive Operational Review of CRRA October 30, 2013
The information contained herein is subject to the disclaimer presented on page 1 of this document.
Page 224
Schedule 18 – Jets Revenue
Assumptions
K1 Fuel Price (per gallon) 3.70$ 3.70$ 3.70$
Gallons/Hr./Unit 4,200 4,200 4,200
Annual Run Hours 20 20 20
Number of Units 4 4 4
FY 2014 FY 2015 FY 2016
Jets Revenue
Capacity 4,535,200$ 6,146,000$ 5,638,000$
Blackstart 568,800 - -
VARS 75,800 75,800 75,800
Back Stop - - -
Real Time Reserve Energy 640,000 640,000 662,000
Jets Interest Income 3,000 3,000 1,000
Total Jets Revenue 5,822,800$ 6,864,800$ 6,376,800$
Schedule 19 – Jets Operating Charges
FY 2014 FY 2015 FY 2016
Jet Operating Charges
Fees/Licenses/Permits 5,000$ 5,000$ 5,000$
Jets PILOT (Pro-rata Share of $2.2 M) 175,000 175,000 175,000
Fuel 1,243,000 1,267,860 1,293,217
Discrete Emission Reduction Credit (DREC) Fee 200,000 200,000 200,000
Jets Operating Costs 785,000 800,700 816,714
Power Products Management Fee 153,800 153,800 153,800
Legal 40,000 40,800 41,616
Engineering Consulting Services 10,000 10,200 10,404
Insurance Consulting/Brokerage 6,300 6,426 6,555
Insurance Premium 80,000 81,600 83,232
Indirect Labor & Overhead - Admin Incl. Above Incl. Above Incl. Above
Direct Salaries/Labor & Benefits - Admin 50,000 51,000 52,020
Direct Salaries/Labor & Benefits - Operational 81,000 82,620 88,000
Electricity 100,000 102,000 88,000
Total Jets Operating Charges 2,929,100$ 2,977,006$ 3,013,558$
Contribution to Jets Capital Reserve 200,000 200,000 -
Total Jets Expenses 3,129,100$ 3,177,006$ 3,013,558$
Increases based upon 2% CPI

Comprehensive Operational Review of CRRA October 30, 2013
The information contained herein is subject to the disclaimer presented on page 1 of this document.
Page 225
Schedule 20 – Education and Trash Museum Revenue
FY 2014 FY 2015 FY 2016
Education and Trash Museum Revenue
Gift Shop Sales 10,000$ -$ -$
Administrative Fees/Group Tours 50,000 - -
Fundraising 5,000 - -
Facility Rental 2,000 - -
Birthday Parties/Activity Kit Rental 3,000 - -
Donations & Grants 10,000 - -
Outreach Program 5,000 - -
Use of Trash Museum Bank Account 150,000 - -
Total Education and Trash Museum Revenue 235,000$ -$ -$ Schedule 21 – Education and Trash Museum Expenses
FY 2014 FY 2015 FY 2016
Education and Trash Museum Expenses
Communications Services 10,000$ -$ -$
Office Supplies 1,000 - -
Educational Supplies 5,000 - -
Subscriptions/Publications/Ref. Material 500 - -
Dues-Professional Organizations 300 - -
Meetings and Trainings 3,500 - -
Education Exhibits Maintenance 5,000 - -
Direct Salaries /Labor & Benefits - Admin 42,000 - -
Direct Salaries /Labor & Benefits - Operational 211,000 - -
Education Expenses - 96,500 96,500
Total Education and Trash Museum Expenses 278,300$ 96,500$ 96,500$

Comprehensive Operational Review of CRRA October 30, 2013
The information contained herein is subject to the disclaimer presented on page 1 of this document.
Page 226
Appendix C
Technology
The Connecticut WTE market includes one Refuse Derived Fuel facility (Mid-Conn) and five mass burn facilities. These two technologies represent the majority of resource recovery facilities in the United States. In 2011, there were 86 operating WTE plants in the US: 63 mass burn facilities, 16 refuse derived fuel plants, and 7 modular plants to handle small volumes of MSW. WTE plants typically operate at a lower efficiency than coal plants; however, the power generated complements waste reduction. WTE plants typically reduce waste volume by ~90%. The resulting residual ash is then sent to landfills. Mass burn facilities are the most economically efficient to construct and operate due to lower processing and capital costs, in comparison to refuse derived fuel facilities or other large scale WTE technologies. The most promising emerging market is anaerobic digestion; however advanced commercial scale of these technologies has yet to be proven.
Power Generation Technologies
Mechanical Processing Mechanical processing encompasses a number of technologies, including: physical separation technologies, biological drying, steam classification (autoclaving), and others to separate the organic and inorganic portions of the MSW or reduce and compact volume. Generally speaking, these are not standalone deployments and are often used in combination with other WTE technologies. Aside from increasing recyclable and ferrous metals recovery, these technologies provide a more uniform fuel from MSW. The primary drawback of mechanical processing techniques is economic inefficiency when compared to mass burn applications, because of added labor and capital costs. Hydrolysis
Hydrolysis is a technique used to process the cellulosic organic portion of MSW into sugars to create useful fuels, such as ethanol. Once recyclables and other non-organics have been sorted and removed, an acid catalyzed reaction takes place to create sugar compounds from the organic materials. The resulting sugar is then turned into a fuel. Currently, no commercial scale hydrolysis MSW to liquid fuels plants exist in the United States.
Thermal Technologies
Encompassing several technologies, thermal processing of MSW uses or produces heat to create a useful byproduct such as electricity, steam, or fuel. These thermal methods are commonly combined with recovery of metals and aggregate. When treated, thermal processing converts most or all organic compounds into electricity or fuel, leaving inorganic compounds for recovery. During CRTE interviews with industry stakeholders, the view is that new mass burn or RDF facilities have not been constructed in Connecticut or most US states for several years due to a combination of environmental, political, and economic reasons.

Comprehensive Operational Review of CRRA October 30, 2013
The information contained herein is subject to the disclaimer presented on page 1 of this document.
Page 227
Figure 33: Waste to Energy Mass Burn Plant. RDF facilities operates similarly with an added step of preprocessing the MSW in a more uniform fuel; Source: http://media.deltaway.dnsalias.com/img/diagram.png
Incineration
The majority of global WTE plants operate on the principal of incineration to create useful steam. The steam is used to generate electricity or as a source of thermal energy for industrial applications.
Mass Burn: The incineration of untreated MSW. The process burns organic materials to create electricity or steam, or a combination of both. Major byproducts from the process include ash residue and recoverable inorganic materials, such as ferrous metals and char.
Refuse Derived Fuel: Similar to mass burn, this incineration technology processes MSW into a fuel for incineration. Processing consists of shredding and dehydrating MSW in order to create a more efficient burning fuel. Plants are designed to produce electricity, steam, or both electricity and steam together. The primary byproducts are ash residue and recoverable inorganic materials, such as ferrous metals and char.

Comprehensive Operational Review of CRRA October 30, 2013
The information contained herein is subject to the disclaimer presented on page 1 of this document.
Page 228
Advanced Thermal Combustion
Several emerging thermal technologies constitute Advanced Thermal Combustion. For the purpose of this report it is important to note that these technologies are not yet operating at commercial scale for MSW in the United States. Several pilot facilities are proposed or under development; however, low natural gas prices across the US have negatively affected project economics.
Gasification: Applying heat, typically above 650⁰C, to MSW without exposing it to enough oxygen to combust. The small amount of oxygen exposure allows the MSW to gasify into a synthetic gas (syngas) fuel. As a byproduct, a solid residue of ash is produced. Commercial scale MSW gasification has proven successful in Japan and several European countries; however, no commercial operations exist in the US. The US does have other commercial scale gasification projects for different feedstock.
Plasma Gasification: The process uses an electrical arc to gasify MSW; this technology offers high MSW volume reduction by creating extremely high temperatures, which more fully disassociates the MSW. The process results in the creation of gas and a glass-like vitrified slag.
Pyrolysis: A lower heat process (300⁰C to 850⁰C) than gasification, pyrolysis is the thermal degradation of MSW without exposure to oxygen. This process produces a syngas and solid residue char (comprised of inorganic materials and carbon). It is possible to condense the resulting syngas to create oils, waxes, and other heavy carbon products. The number of products that can be produced allows for a greater flexibility in selecting off takers, which can improve project economics.
Thermal Depolymerization: Thermal depolymerization is the use of superheated water to break down the complex carbon chains found in MSW into simple carbon chain fuels. Using MSW as a feedstock to produce useful oils with this process has not been proven commercially viable.

Comprehensive Operational Review of CRRA October 30, 2013
The information contained herein is subject to the disclaimer presented on page 1 of this document.
Page 229
Figure 34: Advanced Thermal Treatment of MSW; Defra, 2007
Biological Processing – Anaerobic Digestion, Aerobic Digestion
Biological processing of MSW, also referred to as digestion, is the use of microbes to convert solid waste into useful liquids and gases. This process converts organic materials in reactors either aerobically or anaerobically (with or without oxygen present). The primary benefit of digestion is the creation of useful gases and liquids which are collected while the wastewater and carbon dioxide are liberated from the MSW. The remaining digested material is then marketed as compost, fertilizer, or as a soil amendment.
Pre-Processing
•Sort out inorganic materials
Digestion
•Controlled production of biogas and liquids and solids
Post-Processing
•Use biogas for power
•Process liquids and solids into fertilizers

Comprehensive Operational Review of CRRA October 30, 2013
The information contained herein is subject to the disclaimer presented on page 1 of this document.
Page 230
Digesters represent an emerging market in waste management, although they require that compostable materials be separated from the general MSW stream. The technology has been employed for large-scale agricultural projects for years. The existing facilities benefit from controlled and consistent bio waste feedstock. Going forward, there is a need for greater testing of advanced anaerobic digestion systems aimed at municipal organic waste to increase reliability and economic efficiency for commercial scale applications.

Comprehensive Operational Review of CRRA October 30, 2013
The information contained herein is subject to the disclaimer presented on page 1 of this document.
Page 231
Appendix D The below is a list of the vendors that were classified as a high profile vendor (vendors that had a cumulative voucher total above $50,000 in at least one of the fiscal year periods reviewed) or classified as a potential high profile vendor (were vendors that had a fiscal year annual voucher spend of $45,000 to $49,999.99).
Vendor Name Vendor Name
R W BECK INC
KNAPP ENGINEERING PC
ANCHOR ENGINEERING SERVICES INC
BOTTICELLO INC
URS CORPORATION
DVIRKA & BARTILUCCI CONSULTING
ENGINEERS
MERRITT CONTRACTORS INC
NIRO LANDSCAPE CONTRACTORS INC
LANDSEN CONSTRUCTION CORP
HDR ENGINEERING INC
QUALITY WELDING, LLC
SCS FIELD SERVICES
INFINITY CONSTRUCTORS, INC.
C K ENVIRONMENTAL INC
FGF CONSTRUCTION NETWORK SERVICES, INC.
NEW ENGLAND MASONRY & ROOFING CO.
CME ASSOCIATES, INC.
E. T. & L. CORPORATION
I & C SYSTEMS ENGINEERING
COLONIAL PAVING CO.
GARDNER CONSTRUCTION & INDUSTRIAL
SERVIC
SIMPLICITY ENGINEERING (N.E.), INC.
AIR COMPRESSOR ENGINEERING, INC.
WOODS ENGINEERING & CONSULTING, LLC
JOHN BOYLE COMPANY
DAVID G. ROACH & SONS, INC.
EARTHCARE SERVICES
RAILWORKS TRACK SERVICES, INC.
BEAULIEU COMPANY, LLC
UNION IRONWORKS, INC.
ROADSTONE CONSTRUCTION, LLC
HANOVER INSURANCE GROUP
CONNECTICARE, INC.
LINCOLN FINANCIAL GROUP
EPICOR SOFTWARE CORPORATION
HALLORAN AND SAGE LLP
PEPE & HAZARD LLP
SIDLEY AUSTIN LLP
CARLIN CHARRON & ROSEN LLP
KAINEN ESCALERA & MCHALE PC
GERSHMAN BRICKNER BRATTON INC
AIR TEMP MECHANICAL SERVICES INC
MCCARTER & ENGLISH LLP
ENVIRONMENTAL CAPITAL LLC
GZA GEOENVIRONMENTAL, INC.
PITA COMMUNICATIONS LLC
AON RISK SERVICES INC OF WASHINGTON DC
KLEINSCHMIDT ASSOCIATES
WALKER GROUP, THE
DIVERSIFIED TECHNOLOGY CONSULTANTS
HINCKLEY, ALLEN & SNYDER, LLP
NELS CONSULTING SERVICES, INC.
ACE USA
BOLLAM, SHEEDY, TORANI AND CO, LLP, CPA
MCELROY, DEUTSCH, MULVANEY &
CARPENTER/P
POWER ADVISORY, LLC
TMC SERVICES, INC.
GUARDIAN, THE
GRAINGER
H O PENN MACHINERY CO INC
CONN CONSTITUTION ASSOCIATES LLC
METTLER TOLEDO INC
BODE EQUIPMENT COMPANY
CITY CARTING INC
WARNOCK FLEET
ROCKWELL COMMUNICATIONS
UNITED RENTALS (NORTH AMERICA), INC.
SUMMIT HANDLING SYSTEMS, INC.

Comprehensive Operational Review of CRRA October 30, 2013
The information contained herein is subject to the disclaimer presented on page 1 of this document.
Page 232
Vendor Name Vendor Name
METROPOLITAN LIFE INSURANCE COMPANY
BRIDGEPORT CITY OF
CONN INTERLOCAL RISK MGMT AGCY
COMM REVENUE SERVICES, ST OF CT
CT ST OF DEEP
GRANBY TOWN OF
HARTFORD CITY OF TREASURER
HARTFORD ENV PRGMS DIV CITY OF
MDC
NORWALK CITY OF
PRESTON TOWN OF
SIMSBURY TOWN OF
SOUTHEASTERN CT REG RESOURCES RECOV
AUTH
CONSTABLE WILLIAM B DIFEDERICO
SOUTHWEST CT REGIONAL RECYCLING OP
COMM
WATERTOWN TOWN OF
WILTON TOWN OF
WALLINGFORD TOWN OF
CHESHIRE TOWN OF
MERIDEN CITY OF
HAMDEN TOWN OF
NORTH HAVEN TOWN OF
TORRINGTON TOWN OF
ELLINGTON TOWN OF
ESSEX, TOWN OF
SOUTHBURY TOWN OF
WEST HARTFORD TOWN OF
FAIRFIELD, TOWN OF
SHELTON CITY OF
WINDSOR, TOWN OF
WESTPORT TOWN OF
DARIEN TOWN OF
TRUMBULL, TOWN OF
GREENWICH TOWN OF
MILFORD CITY OF
FUSS AND ONEILL INC
HRP ASSOCIATES INC
MALCOLM PIRNIE INC
PULLMAN AND COMLEY LLC
TRC ENVIRONMENTAL CORP
SUPREME INDUSTRIES
BOBCAT COMPANY
TYLER EQUIPMENT CORPORATION
TOCE BROTHERS, INC.
CHADWICK-BAROSS
NORTHEAST UTILITIES/CL&P
NORTHEAST GENERATION SERVICES CO
MATRIX POWER SERVICES INC
DIME OIL COMPANY
FORTISTAR METHANE GROUP LLC
NEXTERA ENERGY POWER MARKETING, LLC
FCR INC
COVANTA MID-CONN INC
COVANTA SOUTHEASTERN CT
WHEELABRATOR BRIDGEPORT LP
COVANTA ENERGY
D W TRANSPORT AND LEASING INC
WHEELABRATOR PUTNAM INC
ALL WASTE INC
CWPM LLC
SANTA BUCKLEY ENERGY INC
WASTE MANAGEMENT OF CENTRAL MASS INC
ALTERNATIVE RESOURCES, INC
WHEELABRATOR TECHNOLOGIES INC
ASSOCIATED ELECTRO-MECHANICS, INC
COPES RUBBISH REMOVAL
SELECT ENERGY, INC
AAD ASSOCIATES LLC
LYDON MILLWRIGHT SERVICES, INC.
ECO INTERNATIONAL, LLC
COMBE FILL SOUTH
NEW ENGLAND INDUSTRIAL TRUCK
COMPLETE DISPOSAL COMPANY, INC.
WASTE MANAGEMENT OF MASSACHUSETTS,
INC.
NAES CORPORATION
OREILLY TALBOT & OKUN
STANDARD INSURANCE COMPANY
TABACCO AND SON BUILDERS, INC.
VALLEY COMMUNICATIONS SYSTEMS, INC.
MONROE TOWN OF
EAST HAVEN, TOWN OF

Comprehensive Operational Review of CRRA October 30, 2013
The information contained herein is subject to the disclaimer presented on page 1 of this document.
Page 233
Vendor Name Vendor Name
BROWN RUDNICK BERLACK ISRAELS LLP A & S CONSTRUCTION SERVICES, LLC
WASTE TECH FAMILY REFUSE LLC