2013 comprehensive energy strategy for connecticut
TRANSCRIPT

2013 Comprehensive Energy Strategy
for Connecticut
PREPARED BY
The Connecticut Department of Energy
and Environmental Protection
FEBRUARY 19, 2013


2013 Connecticut
Comprehensive Energy Strategy
i
Executive Summary Connecticut‘s Comprehensive Energy Strategy gives the state a more systematic basis for addressing energy
opportunities and challenges. It provides a foundation for better informed policy, regulatory, and legislative
decisions – as well as better energy choices at the household and business level. This Strategy covers all fuels
in all sectors with a planning horizon out to 2050. It offers analysis of the state‘s current energy
circumstances and a set of recommendations designed to advance the Governor‘s agenda of moving
Connecticut toward a cheaper, cleaner, and more reliable energy future.
This Strategy was released in draft format in October 2012, and has since been refined and improved in
response to thousands of comments received from hundreds of commentators. Created in coordination with
the Connecticut Energy Advisory Board, the Strategy benefited significantly from input received from the
Public Utilities Regulatory Authority, members of the General Assembly, the Office of Consumer Counsel, the
Connecticut Siting Council, and a number of other state agencies.
At the heart of the Strategy are a series of policy proposals aimed at expanding energy choices, lowering utility
bills for Connecticut residents and businesses, improving environmental conditions, creating clean energy
jobs, and enhancing the quality of life in the state. The Strategy offers recommendations in five major priority
areas:
Energy efficiency
Industrial energy needs
Electricity supply including renewable power
Natural gas
Transportation
By integrating energy, environmental, and economic goals, the Strategy breaks new ground and advances a
broad and robust structure for thinking through energy options. It moves away from subsidizing favored
technologies or companies toward a flexible ―finance‖ model that encourages entrepreneurship and private
sector leadership in scaling up clean energy projects. Emphasis is placed not on ―picking winners‖ but on
using limited government resources to leverage private capital and increase the flow of funds into energy
efficiency, renewable power, natural gas availability, and a 21st century transportation infrastructure that
promotes mobility options, transportation-oriented development, and market-based opportunities for clean
fuels and clean vehicles.

2013 Connecticut
Comprehensive Energy Strategy
ii
This Strategy builds on the fundamental premise that the public‘s interest in and ongoing commitment to
clean energy depends on the emergence of new technologies that compete with fossil fuel alternatives. It
therefore proposes an array of economic incentives designed to drive down the cost of new energy
technologies. By harnessing market forces and competitive pressures, this policy framework promises to spur
innovation while offering support for a portfolio of renewable power generation alternatives.
The Strategy further seeks to align Connecticut‘s energy future with the emerging opportunity provided by
shale gas for a lower-cost, less-polluting, and domestically available (and thus more reliable) foundation for
society‘s energy needs. In identifying natural gas as a bridge to a truly sustainable energy future, it puts
forward a seven-year game plan for expanding access to natural gas across Connecticut with a goal of
providing nearly 300,000 Connecticut homes, businesses, and other facilities with an energy choice that
includes natural gas.
Department of Energy and Environmental Protection (DEEP) analysis suggests that the initiatives advanced
below will measurably reduce Connecticut‘s greenhouse gas emissions -- putting the state on a trajectory
toward progress on climate change. But significant additional measures and breakthrough technologies will
be required to achieve the goal of an 80% emissions reduction by 2050 as spelled out in the state‘s 2008
Global Warming Solutions Act.
The Strategy offers a structure for guiding the state‘s ongoing efforts to address its citizens‘ energy needs,
meet the challenges of protecting the environment, and build a foundation for economic prosperity and job
growth. The principles, goals, and policies spelled out below represent not just the fruits of months of effort by
dozens of people from the Governor on down, but also the formal embodiment of Connecticut‘s future energy
plans. As directed by the legislature, the Strategy will inform and guide future decisionmaking not only within
DEEP but also at the Public Utilities Regulatory Authority and other state agencies as well.
Energy Efficiency
Energy conservation offers a mechanism for reducing utility bills for every family and business in Connecticut
while creating thousands of new jobs. The Strategy calls for an expanded commitment to ―all cost-effective‖
energy efficiency through programs that:
Reach all sectors and all buildings – government, municipalities, universities, colleges, schools, hospitals, places of worship, commercial and industrial facilities, and homes including houses, apartments, condos, and senior living centers – with special focus on groups that have not been fully reached by past efficiency programs such as small businesses and the low-income community
Go beyond a traditional focus on upgraded lighting and weather stripping to deliver deeper efficiency gains in heating, air conditioning, ventilation, insulation, windows, furnaces, boilers, and other appliances such as refrigerators, as well as process efficiencies in the industrial sector

2013 Connecticut
Comprehensive Energy Strategy
iii
Leverage private capital through innovative financing mechanisms including Connecticut‘s first-in-the-nation Green Bank (the ―Clean Energy Finance and Investment Authority‖), standardized energy efficiency performance contracts, and the state‘s new Commercial Property-Assessed Clean Energy (C-PACE) program
Reinvigorate and broaden the existing Home Energy Solutions program to ensure that additional ratepayer dollars achieve maximum reach and impact with carefully established goals and metrics to ensure ongoing performance improvements
Incentivize Connecticut‘s utilities to deliver on efficiency goals through ―decoupling‖ and performance-based rates of return
Establish building efficiency standards for both new construction and retrofits as well as a mechanism for benchmarking building efficiency and disclosing efficiency scores at the time of rental or sale
Advance information technology opportunities for greater efficiency including a smart grid, advanced meters, and smart appliances on a carefully structured basis.
Industry
Connecticut‘s competitiveness and prospects for economic growth require special attention to energy needs in
the industrial sector. Thus, the Strategy proposes to:
Ensure that expanded energy efficiency programs reach all of the state‘s manufacturing companies
Provide the industrial sector with support for efficiency investments that go beyond buildings to include specialized process efficiency programs and combined heat and power projects
Prioritize factories and other industrial ―anchor loads‖ in the extension of natural gas mains
Launch a Clean Energy Business Solutions Program to be managed by CEFIA under the direction of the Department of Economic and Community Development in support of job creation and retention where energy costs are a critical factor
Electricity
Providing Connecticut‘s citizens with cheaper, cleaner, and more reliable electricity is a core focus of the
Strategy. To advance this agenda, DEEP proposes to:
Build on the analysis of the recently released Integrated Resources Plan to ensure that Connecticut has adequate power generation capacity over the next decade to match electricity supply with demand, including potentially lowering electricity costs through contracting for low-cost generation at times of peak demand
Keep both generation and transmission costs down through proper planning, infrastructure investments, and engagement in federal and regional energy decisionmaking processes including increased scrutiny of the rules and incentives established by the Federal Energy Regulatory Commission and the Independent Systems Operator (ISO – New England), which runs the wholesale electricity marketplace in our region

2013 Connecticut
Comprehensive Energy Strategy
iv
Use economic incentives (including reverse auctions, declining subsidies, Power Purchase Agreements, etc.) to bring down the cost of renewable electricity, spur innovation, and promote a portfolio of alternative energy technologies that can compete with existing fossil fuel generation over time
Focus on the deployment of renewable energy at scale using limited government resources to induce private sector investment through the Connecticut Green Bank (CEFIA), Zero (and Low) Emissions Renewable Energy Credits, and other innovative financing mechanisms
Refine Connecticut‘s Renewable Portfolio Standard (which calls for 20% renewable power by 2020) with an eye toward considering: (1) raising the target, (2) broadening what counts as ―renewable,‖ and (3) expanding in-state clean power generation
Explore opportunities for large-scale hydropower to provide low-cost, clean base-load generation as well as the potential for load-following (and thus ―peak shaving‖) electricity
Promote more ―distributed generation‖ with proposals to expand virtual net metering and submetering and to launch a pilot program of microgrids that would keep critical facilities (hospitals, prisons, sewage treatment plants, etc.) and core services (police and fire departments, warming centers, grocery stores, gas stations, pharmacies, banks, and phone charging locations) in a number of cities and towns ―up‖ when the grid is down
Ensure greater grid resilience through tree trimming, hardening of wires and poles, and funding for improved information technologies that allow outages to be tracked and restored more quickly while providing better communications with affected communities and individuals
Launch an Advanced Energy Innovation Hub at UConn‘s new Technology Park that would support basic research on topics such as: fuel cells, batteries and storage, microgrid engineering, and small-scale hydropower
Develop a cyber security strategy for Connecticut consistent with the emerging threat to the electric grid and other elements of the state‘s critical infrastructure.
Natural Gas
America‘s energy situation has been dramatically transformed by the increased availability of domestic shale
gas at prices that are now significantly lower than oil. One of the nation‘s largest reserves of this gas -- the
Marcellus Shale -- is in Pennsylvania and New York (as well as Ohio and West Virginia) less than 100 miles off
Connecticut‘s western border. Because natural gas combustion produces lower emissions than oil or coal,
conversion to natural gas promises a cheaper, cleaner, and more reliable fuel for heating, power generation,
and perhaps transportation. DEEP acknowledges that there are significant environmental and public health
issues associated with the drilling and transport of natural gas, which the state will actively address wherever
possible.
As things now stand, Connecticut is not well positioned to take advantage of the emerging natural gas
opportunity. Only 31% of Connecticut homes heat with gas today, compared with 47% in Massachusetts and

2013 Connecticut
Comprehensive Energy Strategy
v
48% in Rhode Island. The percentage of commercial and industrial entities with access to gas is only slightly
higher. The Strategy proposes to make gas available to as many as 300,000 additional Connecticut homes and
businesses, beginning with the roughly 217,00 customers who are on gas mains now but not heating with gas.
Specifically, it calls for:
Financing options for homeowners and businesses to eliminate the upfront burden of converting furnaces, boilers, and other appliances to natural gas – with the average residential cost of about $7500 being paid back over a decade through an ―on-bill repayment‖ system that would be collected by the gas companies but funded by banks and the capital markets, providing the average household with immediate cost savings of about $600 - 800 per year
Alternative financing for low-income homeowners through community banks and credit unions with the state providing incentives or financing through CEFIA
A time-limited tax credit for those who sign up for conversion to gas -- providing a means for defining the universe of potential new gas customers and creating greater clarity as to where gas infrastructure investments can most economically be made
Expansion of natural gas pipeline capacity into Connecticut to meet the anticipated rise in demand for gas as a result of expanded infrastructure and gas availability
Regulatory changes (i.e., extended payback periods) that would enable potential gas customers who are not on but are near gas mains to have their connections financed by the state‘s gas companies and repaid through the added revenues of their expanded customer base
Roughly 900 miles of gas mains to be built with a particular focus on providing ―anchor loads‖ (factories, hospitals, schools, or other facilities with significant energy consumption) with access to gas mains
Incentives for the state‘s gas companies to ramp-up the required construction quickly, which DEEP estimates will translate into as many as 7000 jobs
Utility construction projects to be linked so that the construction cost of new gas mains can be shared with those installing water or sewer pipes, fiber optic cables, or underground electric lines.
Transportation
Cars, trucks, buses, trains, and planes account for 32% of the energy consumed in Connecticut and an even
higher percentage of the fossil fuels burned. Providing the state‘s citizens with mobility options is therefore a
high priority of the Strategy, which calls for:
Expanded commitment to transport-oriented development and a broader mobility focus that encourages bikeways, walking paths, and other quality of life investments
Secure funding for transportation infrastructure in support of reduced road congestion, improved air quality, and a strengthened platform for economic growth and job creation
Investment in a clean fuels/vehicles initiative that will ensure that the basic infrastructure needed for vehicle choice will be in place including:

2013 Connecticut
Comprehensive Energy Strategy
vi
o Sufficient public electric vehicle charging stations (requiring an incremental 100 stations statewide) so that no one in the state need suffer from ―range anxiety‖
o Support for conversion of fleets (delivery vans, taxis, garbage trucks, public works vehicles,
etc.) to natural gas in conjunction with private sector-funded construction of natural gas filling stations that will be publicly available
o Establishment of a core set of Liquefied Natural Gas (LNG) stations at truck stops in support
of the growing number of long haul trucking fleets considering conversion to natural gas as their primary fuel
o Expanded hydrogen filling stations as demand for fuel cell-powered vehicles grows
o Improved fuel economy in Connecticut vehicles and development of second-generation,
advanced biofuels
Comprehensive Energy Strategy—Process for Public Comment
On October 5, 2012 DEEP issued a draft of the 2012 Comprehensive Energy Strategy for public comment.
DEEP solicited written comments from stakeholders and interested persons, with an initial filing deadline of
December 14, 2012, subsequently extended to December 21, 2012 at the request of a number of stakeholders.
All written comments received by DEEP on the draft 2012 Strategy can be accessed on the Department‘s
website1, along with other reference materials, background documents, and sources utilized in the preparation
of both the draft and final Comprehensive Energy Strategy.
DEEP also held six technical meetings2 at its New Britain Office, at which the public and stakeholders were
given the opportunity to present oral testimony and to ask DEEP staff and consultants questions about the
analyses underlying the findings and recommendations in the draft 2012 Strategy. In addition, DEEP
conducted five public hearings at locations around the state3 to receive further public comments on the draft
document. All of the comments received have been summarized in an index which can be found in Appendix
F. DEEP would like to thank all of the stakeholders who participated in the technical meetings, the public
hearings, and those who took the time to submit written comments. Robust participation throughout the
development process has contributed to an in-depth dialogue about energy policy in the state.
1 http://www.dpuc.state.ct.us/DEEPEnergy.nsf/$EnergyView?OpenForm&Start=1&Count=30&Expand=4.3&Seq=7
2 November 14, 2012 – Transportation Sector; November 15, 2012 – Electricity Sector; November 16, 2012 - Natural Gas
Sector; November 27, 2012 - Buildings Sector; and November 28, 2012 – Industry Sector. Audio recordings of these meetings are available at:
http://www.dpuc.state.ct.us/DEEPEnergy.nsf/$EnergyView?OpenForm&Start=1&Count=30&Expand=4.2&Seq=6 3 November 14, 2012, at Bridgeport City Hall; November 19, 2012, at Kennedy Mitchell Hall of Records, New Haven;
November 20, 2012, in the Phoenix Auditorium, at DEEP’s offices, Hartford; November 20, 2012, at UCONN – Center for Environmental Sciences and Engineering, Storrs; and November 26, 2012, at City Hall Auditorium, Torrington. Audio recordings of these public hearings are available at: http://www.dpuc.state.ct.us/DEEPEnergy.nsf/$EnergyView?OpenForm&Start=1&Count=30&Expand=4.2&Seq=6
2013 Connecticut
Comprehensive Energy Strategy
vii
This document will guide and direct the state‘s ongoing efforts to meet the challenges of protecting the
environment and providing safe and reasonably priced energy for the Connecticut residents and businesses.
The CES is the formal embodiment of the state‘s policies in this regard, and will inform and direct future
decisions, not only those of DEEP and PURA, but also those of other state agencies tasked with implementing
state energy policy. We are grateful for the time, effort and attention of all who have contributed to this final
product.
Next Steps: Implementation and Performance Measurement
With this document finalizing the strategy for delivering a cheaper, cleaner, and more reliable energy future
for Connecticut‘s residents and businesses, DEEP‘s attention will turn to implementing Governor Malloy‘s
vision and tracking progress on the many elements of the Strategy with a set of quantitative metrics. DEEP
will engage the Connecticut Energy Advisory Board, the Energy Efficiency Board, the Connecticut Energy
Finance and Investment Authority, the Low-Income Advisory Board, and other state agencies, as the
Department determines both how best to advance progress quickly and what metrics to measure. Among the
goals that DEEP seeks to advance:
• Lower electricity rates and reduced overall energy bills for both residents and businesses
• Reduced heating costs tracked by type of fuel
• Decline in air emissions from power generation, heating, and other energy use
• Growth in the number of megawatts of installed renewable generation capacity
• Expanded availability of demand response resources to reduce electricity needs on the power system‘s peak days
• Increased energy savings from efficiency investments
• More alternative-fuel vehicles on the roads
• Reduced electricity consumption by sector and reductions in statewide energy demand
• Private dollars leveraged per public dollar invested in renewable energy
• Rise in number of clean energy jobs created – by sector
• Decreased greenhouse gas emissions, measured against targets established by the state‘s Global Warming Solutions Act (PA 08-98)
• Further deployment of distributed generation capacity including functioning microgrids
• Improvements in energy security including: resource diversity, redundancy, modularity, preparedness and substitutability
These goals and associated metrics can provide a starting point for establishing key benchmarks that will be
used to monitor progress as well as inform policymakers about potential refinements to the Strategy that
might be needed to ensure optimal progress in Connecticut on the path to a cheaper, cleaner, and more
reliable energy future. Recommendations in the Strategy include specific legislative proposals; state agency

2013 Connecticut
Comprehensive Energy Strategy
viii
initiatives, and regulatory changes. In the months and years ahead, DEEP will engage a range of stakeholders,
including sister state agencies, regional planning agencies, academic institutions, municipalities, various
boards and commissions and other public and private entities in the swift and thorough implementation of
the Strategy.

2013 Connecticut
Comprehensive Energy Strategy
i
TABLE OF CONTENTS
Chapter 1 - Energy Efficiency Sector Strategy ............................................................................. 1 Introduction ............................................................................................................................................................................. 1 Taking Energy Efficiency to the Next Level ........................................................................................................................... 1 Overview of the Energy Efficiency Sector ............................................................................................................................. 9 Ensuring Consistent Funding to Achieve All Cost-Effective Efficiency Measures for All Fuels ....................................... 13 Reforming Efficiency Programs to Achieve Deeper Savings ............................................................................................. 15 Ensuring that Underserved Communities Can Easily Access Efficiency Benefits ............................................................. 17 Creating a Market that Values Energy Efficiency .............................................................................................................. 18 Marketing Energy Efficiency ............................................................................................................................................... 19 Reducing Upfront Capital Costs ........................................................................................................................................... 19 Building a Regulatory Environmental that Incentivizes Efficiency .................................................................................. 20 Employing Efficiency to Reduce Peak Demand .................................................................................................................. 20 Decoupling ............................................................................................................................................................................. 21 Cost-Effectiveness Screening ................................................................................................................................................ 22 Energy Efficiency Sector Strategy: Recommendations ...................................................................................................... 22 Conclusion .............................................................................................................................................................................. 32 Chapter Bibliography ........................................................................................................................................................... 33
Chapter 2 - Industry Sector Strategy ........................................................................................ 36 Overview of the Industry Sector ........................................................................................................................................... 36 Industrial Sector Energy Use ............................................................................................................................................... 40 Industrial Sector Energy Costs ............................................................................................................................................ 44 Cheaper and Cleaner Energy Opportunities For Industry ................................................................................................ 46 Reduce Electricity Rates ....................................................................................................................................................... 47 Expand Energy Efficiency Programs for Industrial Customers ........................................................................................ 47 Clean Energy Business Solutions ......................................................................................................................................... 52 Fuel-Switching Opportunities for Industry ......................................................................................................................... 54 Expanding Access to Combined Heat & Power (CHP) ........................................................................................................ 56 Addressing the Special Relationship between Energy and Water ..................................................................................... 60 Industry Sector Strategy: Recommendations ..................................................................................................................... 61 Conclusion .............................................................................................................................................................................. 65 Chapter Bibliography ........................................................................................................................................................... 66
Chapter 3 - Electricity Sector Strategy ...................................................................................... 70 Introduction ........................................................................................................................................................................... 70 Overview of the Electricity Sector ......................................................................................................................................... 71 Retail Electricity Prices Have Declined Since 2010 ............................................................................................................ 72 A Cleaner Generation Fleet is Yielding Environmental Benefits ....................................................................................... 74 Renewed Investment in Reliability ...................................................................................................................................... 78 Challenges Ahead ................................................................................................................................................................. 80 Managing and Reducing Peak Electric Demand ................................................................................................................ 82 Demand Response ................................................................................................................................................................. 82 Energy Efficiency Fund – Renew Efforts to Shave Peak Demand ..................................................................................... 84 Technology – Smart Appliances, Smart Grid, and Advanced Meters ............................................................................... 84 Dynamic Pricing .................................................................................................................................................................... 85 Developing Low-Cost Renewable Generation ..................................................................................................................... 88 Ensuring System Reliability ................................................................................................................................................. 97 Cyber Security ..................................................................................................................................................................... 100 Microgrids ............................................................................................................................................................................101 Electricity Sector Strategy: Recommendations ................................................................................................................ 102 Conclusion ............................................................................................................................................................................. 112 Chapter Bibliography .......................................................................................................................................................... 113

2013 Connecticut
Comprehensive Energy Strategy
ii
Chapter 4 - Natural Gas Sector Strategy .................................................................................. 119 Introduction .......................................................................................................................................................................... 119 The Costs and Benefits of Conversion, by Customer Segment ......................................................................................... 122 Connecticut’s Natural Gas Opportunity ............................................................................................................................ 123 Economic Benefits ............................................................................................................................................................... 126 Conversion Costs ................................................................................................................................................................. 127 The Fuel Switching Opportunity, by Customer Segment ................................................................................................. 130 Segment A: On-Main and Low-Use Customer Prospects .................................................................................................. 131 Segment B: Off-Main Customer Prospects ........................................................................................................................ 132 Segment C: Unlikely Prospects for Conversion ................................................................................................................. 134 Conversion Risks ................................................................................................................................................................. 134 Additional Costs and Benefits To Society .......................................................................................................................... 139 Planning For Expansion ..................................................................................................................................................... 142 Ensuring a Reliable Natural Gas Supply .......................................................................................................................... 145 Natural Gas Sector Strategy: Recommendations ............................................................................................................. 146 Conclusion ............................................................................................................................................................................. 157 Chapter Bibliography ......................................................................................................................................................... 158
Chapter 5 - Transportation Sector Strategy ............................................................................ 162 Introduction ......................................................................................................................................................................... 162 Overview of the Current State ............................................................................................................................................ 162 Transportation Energy Use, Costs, and Environmental Impact ..................................................................................... 163 Transportation Infrastructure and Funding Gap ............................................................................................................ 165 Alternative Vehicle Infrastructure and Use ....................................................................................................................... 168 Mobility and Consumer Transportation Costs .................................................................................................................. 170 Regional Collaboration ....................................................................................................................................................... 174 Opportunities and Challenges: Expanding Transportation Choice ................................................................................ 174 Enhancing Mobility .............................................................................................................................................................. 175 Promoting the Use of Highly Efficient Vehicles and Clean Fuels – Clean Vehicles ........................................................ 179 Transportation System Efficiencies ................................................................................................................................... 188 Sustainable Funding for an Efficient Transportation System ......................................................................................... 188 Impacts of Transportation Strategies ............................................................................................................................... 188 Transportation Sector Strategy: Recommendations ....................................................................................................... 189 Conclusion ............................................................................................................................................................................ 193 Chapter Bibliography ......................................................................................................................................................... 194

2013 Connecticut Comprehensive Energy Strategy
Chapter 1: Energy Efficiency Sector Strategy
1
Introduction
Energy efficiency stands out as a leading element in the push for cheaper, cleaner, and more reliable energy.
After all, the cheapest – and cleanest – energy is the energy that we don‘t need, and therefore never consume.
Investing in energy efficiency is one of the most cost-effective ways to reduce energy bills for Connecticut
residents and businesses. Because Connecticut‘s per capita energy expenditures for buildings rank among the
highest in the United States, we give special focus in this Strategy to improving the efficiency of Connecticut‘s
buildings.1 Connecticut‘s residents and businesses spend $8.1 billion to heat, cool, light, and provide hot water
for buildings — an amount higher than the State‘s budget for health care or education. These high energy costs
weigh on everyone‘s budgets, and are a burden to businesses that reduces their potential to create jobs and
contribute to the statewide economy.
Building-related energy consumption also harms Connecticut‘s environment, as the heat and power
consumed requires burning vast quantities of fossil fuels. Producing electricity, burning natural gas and
heating oil emits tons of air pollutants. These energy sources emit pollutants such as sulfur dioxide (SO2) and
nitrogen oxides (NOx), which reduce air quality and cause health problems, as well as greenhouse gases that
add to the risk of climate change. Reduced electric energy consumption — especially at times of peak
consumption — decreases the need for (and expense of) new power generation capacity and transmission
lines. Chapter 3 (Electricity) discusses ―peak load shaving‖ in more detail.
Spending less on energy preserves capital that Connecticut companies can invest in their core business,
allowing them to compete more effectively. Furthermore, because Connecticut has very limited in-state fuel
resources, conservation measures mean that fewer dollars are used to buy out-of-state energy, which boosts
Connecticut‘s economy and supports more jobs at home. But the benefits go far beyond the reductions in
energy costs. Energy efficiency brings substantial savings in equipment and maintenance costs, since heating
and cooling systems in efficient buildings can be smaller and operated less frequently, thereby extending the
useful life of this equipment. In addition, increasing the energy efficiency of homes improves comfort and
quality of life in these homes.2
Taking Energy Efficiency to the Next Level
This Strategy assesses the strengths and weaknesses of the State‘s existing efficiency programs, and makes
recommendations designed to expand the reach of these programs. A particular focus of these
recommendations is on increasing the participation of a broad set of ratepayers, including small businesses
1 U.S. Energy Information Administration, State Energy Data System, Connecticut, State Profile and Energy Estimates –
Rankings: Total Energy Consumed per Capita, 2010 (million BTU). Available at http://www.eia.gov/beta/state/rankings/?sid=CT#series/12.
2 Muldavin, Scott R. Green Building Finance Consortium, "Value Beyond Cost Savings: How to Underwrite Sustainable
Properties." Available at http://www.greenbuildingfc.com.

2013 Connecticut Comprehensive Energy Strategy
Chapter 1: Energy Efficiency Sector Strategy
2
and low-income citizens, in the State‘s efficiency programs.3 This Strategy also seeks to ―deepen‖ the efficiency
investments being made so as to go beyond simple measures such as changing out light bulbs and installing
weather-stripping to addressing heating systems, ventilation, insulation, appliances (such as refrigerators),
and other deeper efficiency improvements. It proposes to recalibrate the State‘s existing residential efficiency
program, the Home Energy Solutions, (HES) program, to capture the previously referenced ―deeper‖
efficiency gains, and to sharpen the incentives provided to utilities and energy service companies to fully
engage them in promoting the adoption of wider and deeper energy efficiency improvements.
At the heart of this Strategy is the recognition that energy efficiency is an investment that pays back
handsomely over time. Money has to be put up to buy insulation, a new furnace or boiler, or more efficient
appliances. While residents and businesses understand the benefits of efficiency upgrades, the upfront cost of
making these investments is a serious obstacle for many. Thus, this Strategy introduces several new financing
mechanisms designed to help Connecticut companies and citizens make the energy efficiency investments
they need to lower their bills, improve our environment, and grow the State‘s economy.
Capturing efficiency gains is also inhibited by a lack of actionable information on exactly what are the best
things a ratepayer should do in the way of cost-effective efficiency improvements. Consumer inertia, and
uncertainty about whom to trust when it comes to both energy efficiency assessments and actually getting the
work done, represent important additional obstacles. Thus, this Strategy proposes a highly visible and
coordinated new efficiency outreach effort (called Energize Connecticut or Energize CT) to help households
and businesses understand energy options available through a variety of programs as well as new business
models for delivering energy efficiency results. Energize Connecticut‘s website (EnergizeCT.com) was
launched in February 2013, and provides a one-stop catalogue of information to empower Connecticut
residents, businesses, and communities to make smart energy choices. It provides a wealth of information
about the programs, financing opportunities, and benefits of choosing to invest in efficiency and clean energy
resources. Energize CT is an initiative of the Connecticut Energy Efficiency Fund (CEEF), the Clean Energy
Finance and Investment Authority (CEFIA), the State, and our local electric and gas utilities.
To reverse the negative consequences of a number of ill-considered policy decisions (including ―raiding‖ of the
energy efficiency funds) made in the decade between 2000 and 2010 that weakened Connecticut‘s energy
efficiency programs, the State must renew and expand upon its commitment to efficiency. In 1998, the
Connecticut General Assembly showed great leadership by establishing an energy efficiency fund, supported
by a $0.003/kWh assessment on all retail electric sales, and authorizing a conservation assessment in local
3 References to the State’s energy efficiency programs in this Strategy refer to the Conservation and Load Management
Programs administered by Connecticut’s electric and gas distribution companies and funded by electric and gas ratepayers.

2013 Connecticut Comprehensive Energy Strategy
Chapter 1: Energy Efficiency Sector Strategy
3
gas distribution companies‘ (LDC‘s)4 rates to support natural gas efficiency efforts. These actions nearly
tripled the investment in electric efficiency from approximately $30 million annually in the early 1990s, to
nearly $90 million in 2000.
Investments in natural gas conservation also increased over this time period, from about $1 million in 1994-
2000, up to around $11.5 million in 2010. Beginning in 2005, ratepayer contributions to the Connecticut
Energy Efficiency Fund (the Fund) were supplemented by new revenue sources, including revenues from the
Independent System Operator Forward Capacity Market, sales of Class III Renewable Energy Credits, and
proceeds from the sale of carbon dioxide (CO2) allowances through the Regional Greenhouse Gas Initiative
(RGGI). In 2011, annual investment in electric efficiency reached $124 million, while annual investment
natural gas conservation increased to $17 million. Total program investment in 2011 was about $144 million.
These investments delivered real energy savings to Connecticut consumers. From 2007 to 2011, Connecticut
efficiency programs helped reduce the State‘s electricity consumption by more than 5% and natural gas
consumption by almost 1% (Figure 1).5 Between 2000 and 2011 more than 285,000 (or about 20%)
Connecticut homes received home energy evaluations and associated measures such as efficient lighting,
weatherization, and air sealing through residential energy efficiency programs. In addition, over 34,000
Connecticut businesses have participated in the energy efficiency programs during this same period.6 Since
2000, investments in electric energy efficiency measures have saved over 650 megawatts (MW) in peak
demand and reduced consumption by about 13%.7
Despite these very real savings, Connecticut‘s on-again off-again commitment to efficiency over the first
decade of this century meant that its leadership position in energy efficiency eroded relative to other states. By
the time Governor Malloy took office, Connecticut had dropped to 8th place in the ACEEE rankings in terms of
the strength of its energy efficiency policies. Even though the State‘s investment in energy efficiency increased
over this time period, the HES program and other efficiency investments were not structured for optimal
results. Moreover, the state‘s funding has not kept pace with the increased investments by other states nor
reached the level where all cost-effective savings are captured.
4 Connecticut Public Act 98-28, ―Act Concerning Electric Restructuring,‖ (1998). Public Act 05-01 established a
Conservation Adjustment Mechanism to collect revenues for natural gas efficiency programs in 2006. See Connecticut Public Act 05-01, ―An Act Concerning Energy Independence,‖ (2005).
5 Northeast Energy Efficiency Partnerships, "A Regional Roundup of Energy Efficiency in the Northeast and Mid-Atlantic
States." Available at http://www.neep.org/uploads/policy/2011 Regional Roundup_FINAL.pdf. 6 The Connecticut Light and Power Company, et al., ―2012 Electric and Natural Gas Conservation and Load
Management Plan.‖ Available at http://www.energizect.com/sites/default/files/2012%20CLM%20Electric%20and%20Gas%20Plan%20FINAL.pdf.
7 Ibid.

2013 Connecticut Comprehensive Energy Strategy
Chapter 1: Energy Efficiency Sector Strategy
4
FIGURE 1: Annual electric and natural gas efficiency savings as a percentage of retail sales, 2007-2011
Source: Northeast Energy Efficiency Partnerships, Regional Roundup.
In June 2012, the Department of Energy and Environmental Protection (DEEP) issued an Integrated
Resources Plan (IRP) for Connecticut‘s electricity sector which called for a ramp-up in efficiency to help
mitigate the impact of a projected increase in electricity rates after 2017. The 2012 IRP showed that by
increasing the budget for electric efficiency programs from $105 million (the current amount funded by the
conservation assessment of $0.003/kWh and other revenues such as RGGI) to $206 million annually,
Connecticut could achieve all cost-effective efficiency savings and offset expected increases in electricity
consumption, to realize a net reduction in electric usage of about 0.4%. In addition, the 2012 IRP projected
that this increased investment in electric efficiency could reduce Sulfur Dioxide (SO2) and Nitrogen Oxides
(NOx) emissions by between 5% and 10%, while supporting 5,500 in-state jobs by 2022 and growing the
State‘s economy.8 As some commenters on the Draft Strategy noted, it is critical that programs developed and
funded by the state for energy efficiency are specifically targeted to spur in-state job growth and make, and
green training programs are necessary to support the nascent home performance industry across Connecticut.
The 2012 IRP — as a plan for the electricity sector — only addressed electric efficiency; it did not analyze the
potential cost-effective efficiency savings for natural gas or fuel oil. A lack of data makes it difficult to identify
the precise amount of potential gas or oil savings for Connecticut. With respect to natural gas, a study was
prepared in 2009 of the natural gas energy efficiency potential in Connecticut‘s commercial and industrial
sectors, but no similar study has been completed recently for the state‘s residential sector. Similarly, there are
no current oil efficiency potential studies for Connecticut. In light of these data limitations, the savings
potential for natural gas and fuel oil in Connecticut was approximated by referencing gas and oil efficiency
8 Connecticut Department of Energy and Environmental Protection, ―2012 Integrated Resource Plan for Connecticut,‖ p.
35, Figure 28. Available at http://www.ct.gov/deep/lib/deep/energy/irp/2012_irp.pdf.

2013 Connecticut Comprehensive Energy Strategy
Chapter 1: Energy Efficiency Sector Strategy
5
potential studies from Massachusetts and Vermont — states whose building stock is similar in type and
vintage to Connecticut‘s. Based on the Massachusetts and Vermont studies, the comparable level of
investment needed to place natural gas and fuel oil efficiency programs on a par with all cost-effective electric
programs is estimated to be about $120 million annually. When combined with the electric savings level
identified in the 2012 IRP, the all cost-effective level of ratepayer support for energy efficiency programs for
all sectors could be expanded to approximately $327 million per year through 2022.9 It is important to note
that these figures are presented for illustrative purposes only, to highlight the possible range of ratepayer
spending levels that could be required to achieve all cost-effective savings for electric, natural gas, and fuel oil
in Connecticut, and the significant savings that could be achieved at such sustained funding levels.
Under this expanded energy efficiency scenario, as shown in Figures 2, 3, and 4, the resulting costs and
savings associated with the residential and commercial buildings sector would be significant.10 Connecticut
homes and businesses could reduce energy use by up to approximately 20% and spend roughly $13 billion less
on energy costs for net savings of $8 billion. This could result in a 14% overall reduction in energy use for
Connecticut when compared to 2012 baseline levels.
FIGURE 2: Forecasts of Primary Energy Consumption for Buildings in Connecticut in 2022
In the Expanded Energy Efficiency (EE) scenario, total primary energy consumption decreases by 20% compared to the No EE Programs scenario, with reductions in oil, natural gas and electricity. The Base Case EE scenario would result in a decrease in primary energy consumption by approximately 5% compared to the No EE Programs scenario
Source: RMI Vision Model Analysis, discussed in Appendix A (Efficiency & Industry).
9 This figure includes $290 million for residential and commercial buildings, as well as $37 million for industrial efficiency
measures. For more information about this analysis including the methodology and assumptions, see Appendix A (Efficiency & Industry).
10 Costs and savings associated with industrial efficiency measures are not included in Figures 2, 3, and 4.

2013 Connecticut Comprehensive Energy Strategy
Chapter 1: Energy Efficiency Sector Strategy
6
FIGURE 3: Present value of energy efficiency investment and savings for Connecticut buildings, 2012–2022
For the years 2012-2022, total investments — including participant costs — of $4.8 billion (in 2012 dollars) would yield gross savings of $12.8 billion realized from lower energy costs, for a net savings of $8.2 billion.
Source: RMI Vision Model Analysis, discussed in Appendix A (Efficiency & Industry).
FIGURE 4: Annual benefits and costs of energy efficiency investment, 2012-2022
Energy efficiency investments begin to show a net benefit in 2015. Columns above the x-axis indicate benefits of capturing the electricity, natural gas, and oil efficiency opportunity. Columns below the x-axis indicate the investment costs for electricity, natural gas, and oil.
Source: RMI Vision Model Analysis, discussed in Appendix A (Efficiency & Industry).

2013 Connecticut Comprehensive Energy Strategy
Chapter 1: Energy Efficiency Sector Strategy
7
As noted, capturing all cost-effective efficiency requires an upfront investment that pays for itself over some
period of time depending on the measure. While some measures, such as a new heating system, may take
several years to recoup the investment, many others have very short pay back periods. Those upfront
investments consist of both a ratepayer supported offering that subsidizes program costs, as well as the
customer share of the cost. While consistent ratepayer support at levels sufficient to leverage (or sell) the
customer investment is essential, the larger investment that will be required to take efficiency to scale will
require new sources of capital to help fund those upfront costs. In order to access new sources of capital, this
Strategy proposes that the State take steps to shift from a reliance on ratepayer funding to a much greater
focus on using existing funding to leverage private capital. As noted by several commenters, including the
Energy Efficiency Board, the development of these financing programs is critical to moderate ratepayer costs
of energy efficiency programs over time. To that end, Connecticut has among other things: established the
first-in-the-nation ―Green Bank,‖ the Clean Energy Finance and Investment Authority (CEFIA); developed a
structure for standardized energy savings performance contracts for the State and municipalities to engage
energy service companies; and launched a new statewide Commercial Property Assessed Clean Energy (C-
PACE) finance program that will enable commercial entities to pay back energy efficiency and clean energy
investments over time on their property tax bills. As noted earlier, the State has also launched a new
statewide Energize Connecticut campaign designed to make Connecticut residents and businesses more aware
of the cheaper, cleaner energy choices available to them, as well as the expanded opportunities for financing
these energy efficiency investments and clean energy alternatives. By building on these efforts the State can
provide structure and scale to the effort to bring private capital into the clean energy arena, expand access to
financing, and lower the cost of borrowing. As these sources of private capital increase over time, the reliance
upon ratepayer resources will be scaled back. A number of factors, including the ability to attract reasonable
cost capital, consumer responsiveness, and success in engaging harder to reach customer segments such as
low income and small businesses, will influence the trajectory of the relationship between ratepayer and
private investments.
The State has taken initial steps toward increasing funding to the all cost-effective level identified in the 2012
IRP, while recognizing that a gradual ramp-up of programs is needed to ensure that program quality and cost-
effectiveness are retained. In recognition of the renewed commitment to energy efficiency since 2010,
Connecticut moved from 8th to 6th place in the 2012 ACEEE ratings – getting us closer to achieving Governor
Malloy‘s goal of recapturing the number one spot. This Strategy proposes several complementary approaches
to achieving that goal and capturing the economic and environmental benefits for Connecticut citizens.
In January 2012, the Public Utility Regulatory Authority (PURA) authorized a doubling of natural gas
efficiency program budgets from $17 million to $34 million annually; however subsequent decisions have
prevented that from going forward. This Strategy recommends a reauthorization, by PURA, of the budget
proposed by the natural gas companies in that docket. In July 2012, DEEP approved an expanded budget for
electric efficiency programs that recommended PURA establish a Conservation Adjustment Mechanism

2013 Connecticut Comprehensive Energy Strategy
Chapter 1: Energy Efficiency Sector Strategy
8
(CAM) to collect additional ratepayer funds that would increase the overall budget for electric efficiency
programs by $34.2 million in 2012.11 A proceeding is underway at PURA to consider the establishment of a
CAM for this purpose.12 To ensure the ongoing availability of this funding mechanism, this Strategy
recommends strengthening PURA‘s existing authority to assess a CAM by providing explicit statutory
direction for the use of the CAM to fund efficiency investments.
The foundation for this Strategy‘s goal of transitioning programs away from government-funded grants,
rebates, and other subsidies, and towards deploying private capital to finance energy efficiency is underway.
As noted above, the enactment of Public Act 11-80 in 2011 established new institutions and policies that are
already helping to diversify funding for energy efficiency. When CEFIA was established in 2011 it was charged
with developing programs to leverage private sector capital to create long-term, sustainable financing
opportunities to support residential, commercial, and industrial sector implementation of energy efficiency
and clean energy measures. Public Act 12-2, adopted in June 0f 2012, augmented the ability to achieve these
goals by authorizing the Commercial Property Assessed Clean Energy program – in which CEFIA has already
enrolled a score of municipalities – that allows owners to tie repayment of efficiency and clean energy loans to
a property‘s tax liability. In addition, new residential loan products are being developed to meet the needs of
different customer segments and this Strategy recommends that the legislature authorize a residential PACE
program as soon as federal regulatory obstacles have been addressed.
Connecticut Leading by Example: Reducing Energy Use in State and Municipal Buildings
Connecticut’s ―Lead by Example‖ program was created in 2011 to fund energy efficiency improvements in state and local
government buildings and provide support for the State’s municipalities to achieve energy reductions in their buildings. As of
February 2013, more than $10 million in bond funds had been committed to 44 different projects. These projects have an
average pay back of 5.9 years and will achieve energy reductions that are the annual equivalent of more than 358,700 fewer
gallons of gasoline used or 1,460 homes being taken off the grid. The Lead by Example program has also developed a
standardized Energy Savings Performance Contracting (ESPC) process that can reduce energy use in state and municipal
facilities by 25% or more. This program enables state agencies and municipalities to implement multi-million dollar retrofit
projects that are paid for by future energy savings and can be structured to require no upfront capital investment. The first
municipal and state participants in the performance contracting program will be launching projects in early 2013.
These policy developments are already helping improve the efficiency of Connecticut‘s buildings, but success
in bringing them to scale and achieving the efficiency goals set forth in this chapter will require a sustained
commitment, active promotion, monitoring, and refinement. Before discussing additional challenges and
11
Connecticut Department of Energy and Environmental Protection, ―Approval of the 2012 Conservation and Load Management Plan.‖ Available at http://www.energizect.com/sites/default/files/120217%202012%20CLM%20Base%20Plan%20Final%20Approval.pdf.
12 PURA Docket 12-08-11, ―Application of The United Illuminating Company for Approval of a Conservation Adjustment Mechanism.‖ Available at http://www.ct.gov/pura/docketsearch; and PURA Docket 12-11-05, ―Application of the Connecticut Light and Power Company for Approval of A Conservation Adjustment Mechanism.‖ Available at http://www.ct.gov/pura/docketsearch.

2013 Connecticut Comprehensive Energy Strategy
Chapter 1: Energy Efficiency Sector Strategy
9
opportunities for improving building energy efficiency, it is important to explore some of the features of
Connecticut‘s buildings sector — including size, patterns of energy usage, ownership structure, age, and so on.
These features must be taken into account when considering the types of programs and incentives that will
achieve the greatest efficiency savings.
Overview of the Energy Efficiency Sector
Today, residential and commercial buildings are the largest users of energy in Connecticut, collectively
accounting for 58% of the State‘s energy usage and 87% of its electricity usage annually. These figures
represent an almost 30% increase in building energy consumption since 1980 (Figure 5), due to a modest
increase in population, an increase in the average size of buildings (particularly single-family residences), and
the increased prevalence of energy-intensive equipment, such as electronics, appliances, and air conditioning.
Over the next several decades, building energy consumption in Connecticut could grow substantially. In a
business-as-usual scenario (which assumes modest energy efficiency savings per year), consumption is
projected to grow to 550 trillion British Thermal Units (BTUs) per year in 2050, nearly 20% higher than
today's energy use of approximately 468 trillion BTUs.13 The growth in energy consumption is expected to
come from increased demand for air conditioning and appliances, which include office equipment, computers,
televisions, and video game equipment.
FIGURE 5: Historical and forecasted primary energy consumption for Connecticut buildings
Source: U.S. EIA, State Energy Data System; and U.S. EIA, Annual Energy Outlook 2012.
13
U.S. Energy Information Administration State Energy Data System, ―Annual Energy Outlook 2012.‖ Available at http://www.eia.gov/forecasts/aeo/pdf/0383(2012).pdf.

2013 Connecticut Comprehensive Energy Strategy
Chapter 1: Energy Efficiency Sector Strategy
10
Unless a much greater focus is placed on energy efficiency, this increased consumption will result in higher
energy costs for Connecticut homes and businesses. Other New England states, including Massachusetts,
Vermont, and Rhode Island, are expanding their investment in energy efficiency. In addition to lowering their
customers‘ costs, these states will shrink their electric consumption, and a greater proportion of costs
associated with regional electric consumption (which are assigned by percent of load) will be shifted to
Connecticut unless the State keeps pace by similarly limiting consumption. The U.S. Energy Information
Administration (EIA) predicts that energy costs for the state‘s buildings will rise to $10.1 billion in 2050
(Figure 6). The burden of rising energy costs could prevent businesses and individuals from maximizing their
potential to create jobs and contribute to the statewide economy. Substantial gains in energy efficiency, on the
other hand, could mitigate those rising energy costs while also limiting the need to build new power stations,
transmission lines, and other costly grid investments.
FIGURE 6: Current and projected costs of energy consumption for Connecticut buildings
Source: U.S. EIA, State Energy Data System; and U.S. EIA, Annual Energy Outlook 2012.
To understand the kinds of programs and incentives needed to support building energy efficiency, it is
important to understand the character of, and the differences between, the residential building sector and the
commercial and industrial building sector. Of the two sectors, the 1.5 million homes in the residential sector
consume nearly 70% more energy than the commercial sector. While none of the State's single-family
residences individually consume as much energy as a commercial skyscraper or an industrial facility,
residential buildings in the aggregate use almost as much energy as the commercial and industrial sectors.
Residential buildings account for 33% of the State‘s total energy usage. Most residents live in detached single-
$4.3
$6.1
$2.6
$2.5 $1.2
$1.6
$-
$3.0
$6.0
$9.0
$12.0
2012 2050
Bill
ion 2
01
2$
$8.1
$10.1
Electricity
Oil
Natural gas

2013 Connecticut Comprehensive Energy Strategy
Chapter 1: Energy Efficiency Sector Strategy
11
family structures, which (as Figure 7 shows) collectively consume nearly 75% of the energy used by the
residential sector. Other families live in mobile homes, attached single-family structures, and multifamily
apartment buildings. Thirty-one percent of Connecticut residents rent.14
FIGURE 7: Connecticut buildings’ energy use by property type, end-use energy, 2012
Source: U.S. EIA, State Energy Data System; and U.S. EIA, Annual Energy Outlook 2012.
Commercial buildings are even more varied in size and ownership structure. Commercial buildings, as the
term is used in this Strategy, include both tiny storefronts (with monthly demands of less than ten kilowatts)
and larger commercial and industrial facilities (with monthly demands of between one and fifteen
megawatts).15 Some of the largest commercial buildings use more energy than some of Connecticut‘s major
manufacturing facilities. Schools and large commercial buildings often have dedicated facility managers who
are responsible for operating heating and cooling equipment, responding to concerns about building
temperature, and replacing lights as they fail. These maintenance professionals are often stuck operating old
or inefficient heating, ventilation, and air conditioning (HVAC) systems, lack training regarding energy
efficiency, or lack the authority to improve the efficiency of these systems. By contrast, the largest customers
often have staff that is dedicated to energy management.
Ownership of commercial buildings varies. Some commercial buildings are owner-occupied, while many more
are leased. Tenants and building occupants may have little knowledge of, or control over, energy use or may
14
United States Census Bureau, "American Community Survey: 2010 Data Release." Available at http://www.census.gov/acs/www/data_documentation/2010_release/
15 The discussion of commercial buildings in this Chapter applies to buildings used for industrial processes as well, to the extent that those buildings serve similar functions in terms of lighting and space heating. Strategies for addressing the special energy needs of industry — from data center operation to manufacturing processes — are discussed in Chapter 2 (Industry).

2013 Connecticut Comprehensive Energy Strategy
Chapter 1: Energy Efficiency Sector Strategy
12
not directly pay for utilities. These realities underscore the need to develop programs and incentives that will
spur building owners to invest in efficiency improvements, even in circumstances where the tenant pays the
utility bill (and would reap the benefits of energy savings).
FIGURE 8: Breakdown of Connecticut building energy consumption by end use, end-use energy, 201216
Source: U.S. EIA, State Energy Data System; and U.S. EIA, Annual Energy Outlook 2012.
Despite their varying characteristics, commercial and residential buildings consume energy in very similar
ways. As Figure 8 demonstrates, over 60% of the energy used in buildings is for heating and cooling. The next
highest uses are water heating in residential buildings and lighting in commercial buildings, representing
about 1/6th of energy usage in each respective building type. Of the primary energy (that is, energy produced
from raw fuels or otherwise found in nature) used by buildings today, 59% comes from electricity, 21% from
oil, and 20% from natural gas. Electricity and natural gas use has increased while oil and biomass
consumption has declined. Another common feature across building types is the prevalence of existing
building stock (as opposed to new construction).17 New construction in the State over the last few years has
16
Figure 8 illustrates building energy consumption by end use. This information does not reflect the peak energy demand for these end uses.
17 An important subset of existing buildings are those that are considered historically significant. The majority of buildings in the State are over fifty years old, and many are designated historic and listed on a register of historic places, either individually or as part of a historic district. This listing may require that significant changes, particularly changes to the exterior, be reviewed by a local board. Owners may also be restricted from changing their properties by private conservation or preservation restrictions adopted by prior owners. Accordingly, some owners of historic buildings may be concerned about the way that physical changes from energy efficiency retrofits or renewable energy installations will be reviewed, or whether they will be approved at all. Balancing their concerns with the broader public policy supporting historic preservation is an increasingly important policy dilemma, particularly in Connecticut, a state with one of the richest and most diverse stocks of historic buildings in the country.

2013 Connecticut Comprehensive Energy Strategy
Chapter 1: Energy Efficiency Sector Strategy
13
been very limited and is projected to remain so over the next decade due to economic conditions and societal
trends.18 As a result, existing buildings are expected to consume 98% of total building energy consumption in
2022.19 These figures suggest that a focus on ―retrofit‖ strategies is essential.
Having discussed the State‘s legal and policy framework for supporting energy efficiency, as well as the
characteristics of Connecticut‘s building stock, we can now turn to addressing the various challenges and
opportunities that influence the State‘s ability to capture cost-effective energy savings.
Ensuring Consistent Funding to Achieve All Cost-Effective Efficiency Measures for All Fuels
Establishing and sustaining a consistent, sufficient level of investment is critical to realizing the State‘s goal of
capturing all cost-effective efficiency. While Connecticut has increased funding for natural gas and electricity
efficiency programs over the years, the levels fall short of what is needed to achieve an all cost-effective
efficiency goal. Funding also falls short of demand, meaning that in some years the program administrators
have needed to curtail activity or completely shut down some programs for the latter part of the year. The
existing investments in energy efficiency are primarily paid for by a charge on electric and gas bills, so that
those who heat with electricity or natural gas have more energy saving program options than those who use oil
and other deliverable fuels.
One of the biggest challenges to achieving greater energy savings is securing efficiency funding for all fuels.
Connecticut has no dedicated funding mechanisms to support efforts to use heating fuel oil more efficiently.
Oil efficiency is crucial, because 50% of homes and 10% of businesses use oil for heating. Because fuel oil and
associated delivery services are not regulated by the State, there is no existing public policy to ensure that oil
and propane heat customers are included in efficiency programs. Policymakers need to consider establishing a
dedicated fund supported by fuel oil and propane customers to provide robust efficiency programs to fuel oil
customers. Consistent funding for all efficiency programs is also important in order to maintain the quality
and availability of those who implement efficiency measures. In the decade prior to 2010, funding for electric
efficiency programs was reduced three separate times to help cover shortfalls in the State‘s general budget.
The resulting fluctuation and unpredictability in program budgets affected the quality and the development of
Connecticut‘s nascent energy efficiency industry. Without the assurance of a stable, sustainable market for
their products and services, contractors won‘t expand to include weatherization services, building owners
won‘t invest in more efficient equipment, companies won‘t develop new technologies, entrepreneurs won‘t
find innovative ways to bring efficiency services to more customers, and investors won‘t provide capital.
18
KEMA, "Connecticut Natural Gas Commercial and Industrial Energy-Efficiency Potential Study.‖ Available at http://energizect.com/sites/default/files/CTNGPotential090508FINAL.pdf; and KEMA, Electric Efficiency Study. Available at http://energizect.com/sites/default/files/CTElectricEEReport05032010FinalKEMAf2.doc.
19 KEMA, "Connecticut Natural Gas Commercial and Industrial Energy-Efficiency Potential Study.‖ Available at http://energizect.com/sites/default/files/CTNGPotential090508FINAL.pdf; and KEMA, Electric Efficiency Study. Available at http://energizect.com/sites/default/files/CTElectricEEReport05032010FinalKEMAf2.doc.

2013 Connecticut Comprehensive Energy Strategy
Chapter 1: Energy Efficiency Sector Strategy
14
The State‘s residential energy efficiency programs provide homeowners with measures that reduce their
electricity usage, such as the installation of efficient lighting, and measures like air sealing that improve
efficiency and comfort. All electric customers contribute to the electric efficiency fund based on their electric
usage. Natural gas customers also contribute to the natural gas efficiency programs through their natural gas
bill. While electric customers who heat with fuel oil or propane contribute to the efficiency programs through
their electric bill, they do not pay any equivalent charge on their fuel bills to support heating efficiency
measures. To the extent that they have received heating improvement measures through the State‘s energy
efficiency programs, those measures have been ―cross-subsidized‖ by electric ratepayers, or have been
dependent upon other revenues. Funding for oil efficiency has only been sporadically available through one-
time sources like the federal American Recovery and Reinvestment Act (ARRA) and the Regional Greenhouse
Gas Initiative (RGGI). ARRA funding has ceased, and RGGI revenues are not sufficient to fund programs to
fully realize the large opportunity for reducing the amount of oil or propane that homes and businesses use to
heat their buildings. Absent program support from non-regulated fuels, oil and propane heating customers
will need to be assessed higher co-pays for use of the State‘s electric efficiency programs.
The State took an important step toward providing greater predictability in program planning in September
2012, when PURA and DEEP directed the utilities to begin submitting a three-year budget and plan for
Conservation & Load Management (C&LM) programs.20 Lengthening the planning and budget horizon allows
the managers of the State‘s award-winning programs to be more creative and flexible, and provides insulation
installers, equipment suppliers, and other vendors who participate in those programs the predictability they
need to invest in efficiency services and to build their own businesses.
The best way to ensure consistent funding for energy efficiency is to diversify the revenue sources that support
efficiency and to ensure that those who are shouldering the investments costs are reaping the benefits of those
investments. Ratepayers, as a group, cannot indefinitely support the bulk of energy efficiency program
budgets. Energy efficiency is a cost-effective investment, but program investments should be no more than
that which is necessary to overcome the barriers to accessing other funding resources that can be used to cost-
effectively capture efficiency savings for an individual customer. Attractive financing is key to driving
consumers to make the more comprehensive – and costly – improvements that easily pay for themselves over
a loan term. However, to attract the capital needed to extend those loans, the State and others need to work
with financial institutions, institutional investors, and the capital markets to reach a point where efficiency
investments are understood and valued in the marketplace. In the long term, the development of a market for
20
PURA Docket 12-02-01, ―PURA Review of the Connecticut Energy Efficiency Fund's Electric Conservation and Load Management Plan for 2012.‖ Available at http://www.ct.gov/pura/docketsearch. This change brought Connecticut in line with planning and budget horizons used other New England states. Massachusetts’s statewide plans for gas and electric utilities look three years into the future, and Vermont has recently established a 12-year plan. See ―Joint Statewide Efficiency Plan,‖ Available at http://www.mass.gov/eea/docs/doer/energy-efficiency/statewide-electric-and-gas-three-year-plan.pdf; Northeast Energy Efficiency Partnerships, ―Energy Efficiency in Vermont.‖ Available at http://neep.org/public-policy/poc-states/poc-states-vt.

2013 Connecticut Comprehensive Energy Strategy
Chapter 1: Energy Efficiency Sector Strategy
15
energy efficiency is the best way to ensure that private capital can be leveraged to support and augment
programs that are currently funded by electric and gas ratepayers.
Reforming Efficiency Programs to Achieve Deeper Savings
Energy efficiency programs must become more effective at achieving ―deeper‖ savings (i.e., achieving more
savings per program participant and program dollar expended) by adding insulation, more efficient heating
and cooling systems, and installing more efficient appliances and electronic equipment. In the residential
sector about 75% of the energy savings realized through the State‘s energy efficiency programs result from air
sealing and the installation of efficient lighting.21 Data from 2007 to 2011 shows that only about 10% of the
residential customers who receive home energy services through the Home Energy Solutions (HES) program
actually install some of the recommended ―deeper‖ measures (Figure 9). In order to achieve the State‘s goals,
the percentage of customers who invest in these ―deeper‖ measures must increase.
FIGURE 9: Funnel analysis for Home Energy Solutions program in Connecticut
Source: Based on 2012 Conservation and Load Management Plan.
Although those deeper measures are still cost-effective, they generally have a higher upfront cost and longer
payback time. The Energy Efficiency Board is consulting with experts in the field to determine how to improve
the existing HES program so that it creates a stronger incentive for participating contractors to persuade
homeowners who receive energy audits to install ―deeper‖ energy efficiency measures. A field service tool that
21
Connecticut Energy Efficiency Fund, "2011 Report of the Energy Efficiency Board." Available at http://www.energizect.com/sites/default/files/Final%202012%20ALR%2020120301.pdf.
2013 Connecticut Comprehensive Energy Strategy
Chapter 1: Energy Efficiency Sector Strategy
16
clearly explains the value of investing in these measures represents a new way of illustrating the benefits of
significant energy efficiency installations to homeowners. Since 2007, HES administrators have focused on
building participation in the program, while vendors have focused on performing the initial assessment and
installed measures, commonly referred to as the Core Services. Programmatic improvements are needed to
better engage vendors in encouraging customers to install additional measures that achieve greater energy
savings. Similar challenges face programs aimed at industrial customers. As described in Chapter 2
(Industry), efficiency programs have been very effective at achieving savings by switching to more efficient
lighting, but have not been able to as effectively capture the significant potential savings from modifying or
replacing inefficient equipment used in industrial processes. A significant overhaul of the HES program is
thus required with a focus on a bigger and broader set of efficiency providers with clearly established
incentives to driver efficiency broader and deeper. Moreover, metrics need to be established to gauge the
success of this effort and to ensure that every dollar of ratepayer money is well spent.
The Home Energy Solutions Program
The Home Energy Solutions (HES) program has evolved from a pilot effort provided by a handful of vendors in 2007 to a
program that delivers comprehensive energy efficiency services to thousands of homes annually. The program is currently
delivered through a limited number of vendors (31 in 2013) that are selected through an open Request for Proposal (RFP) and
customers served by these vendors can access rebates available through ratepayer efficiency programs. However, there are
more qualified energy services companies that are capable of providing similar services.
The HES program has supported development of a robust Home Performance industry in Connecticut. The program has
created jobs, developed a structure to train energy service professionals, saved energy, and provided a cleaner, healthier
Connecticut for future generations. Delivering the current program is expensive and the Energy Efficiency Board needs to
explore ways to reduce costs and increase access to efficiency services, while maintaining customer confidence in the quality
of the services being provided. The HES program has traditionally focused on participation (i.e., the number of homes served
annually), and relied on relatively high subsidies to deliver these results. While the proposed 2013-2015 Conservation and
Load Management Plan would more than double the HES program and continue to increase the number of certified vendors
(as noted in the comments of the Energy Efficiency Board), this Strategy recognizes that efforts by the home energy
performance contractors to establish a recognized industry may be a way to provide quality services as a market based
industry outside of, and in addition to, the HES program.
Many stakeholders (such as the Energy Efficiency Board, the Housing Development Fund through its Megacommunities effort,
and others) have been engaged recently in identifying effective ways to improve this important program. Consistent with the
comments from many of these stakeholders, this Strategy recommends moving away from the current model (relatively high
subsidies delivered by a limited number of service providers) and moving to a market based industry. The pieces are in place
to achieve this goal. In addition to hundreds of trained energy service technicians, programs are in place that offer low interest
financing to support the necessary consumer investment, as well as the convenience of on-bill repayment options. Program
administrators are also developing the tools to easily gather data for tracking the State’s weatherization effort and to present
information to consumers that will empower them to make smart energy choices for a cheaper, cleaner, and more reliable
energy future. The missing piece is consumer demand for the product. Rather than driving program participation for its own
sake, the State must make an effort to increase consumer awareness of the value of these services by touting the benefits of
Home Performance, such as energy and cost savings and increased comfort and safety. This will stimulate demand for Home
Performance services in the private market, and drive consumers to invest in deeper savings.

2013 Connecticut Comprehensive Energy Strategy
Chapter 1: Energy Efficiency Sector Strategy
17
Ensuring that Underserved Communities can Easily Access Efficiency Benefits
Ensuring that the basic energy needs of all utility customers are met has long been a public policy goal in
Connecticut. Over the years, the State and federal government have instituted numerous means-tested
assistance programs. These programs include direct energy assistance benefits, federally funded state
administered weatherization assistance, conservation improvements funded through the State‘s energy
efficiency programs, and a matching payment program that helps customers pay energy bills. Despite these
efforts, many limited income individuals and households struggle to meet their energy needs. A recent
analysis of the effectiveness of these various programs suggests that more benefits could be achieved by
reforming, coordinating, and targeting the use of current resources.22
Different sub-segments of consumers face different barriers that prevent them from benefiting from programs
and incentives that could help lower their energy costs. For instance, despite the fact that a homeowner would
directly benefit from the installation of efficiency measures, trust barriers often keep owners from signing up
to have the work done, even when it is heavily subsidized or completely paid for. On the other hand, renters
face an entirely different set of barriers to improving the weatherization of their homes and apartments.
Landlords may refuse to provide access to their buildings because they fear discovery of code violations, and
they may have little incentive to invest in energy-saving improvements if their tenants are paying the utility
bills. However, a resident landlord may be more interested if upgrades and the costs can be shared with
tenants who also benefit.
Discussions with limited income consumers, service providers, advocates, and the utilities helped categorize
the following sub-segments that need energy assistance and highlight the specific challenges to lowering costs
and improving service to each. As a result, this Strategy proposes careful development of targeted strategies to
address each of the following type of customers:
Small Businesses in Low-Income Communities. The typical business in this segment has fewer
than 10 employees (more often fewer than 5). Many lease substandard business spaces and face the
landlord/tenant conundrum of who pays and who benefits. This challenge is amplified when others
live in the same building. These businesses could benefit greatly from the reduced energy costs
created by building and equipment (which they would own) upgrades. In accordance with Public Act
11-80 the Department has launched an Office of Energy Efficient Businesses (see inset box) to begin
to address some of these needs.
22
See DEEP Energy Filings, ―Public Act 11-80 - Section 112 - Low Income Discount Rate – BETP – Notice of Request for Comments and Public Comment Hearing and Draft Report.‖ Available at http://www.ct.gov/deep/energyfilings; and See PURA Docket 12-07-01, ―PURA Investigation Into The Establishment Of Low-Income Discounted Rates For Electric And Gas Services.‖ Available at http://www.ct.gov/pura/docketsearch.
2013 Connecticut Comprehensive Energy Strategy
Chapter 1: Energy Efficiency Sector Strategy
18
Rental Housing. This category has several sub-categories, such as smaller owner-occupied 1-4 unit
buildings, mid-size buildings, and very large buildings.
Single Family Owner Occupied. This category has a subcategory of senior citizens, who have
some unique issues that can largely be addressed through better education about program availability
and eligibility criteria.
Public Housing. Securing capital is one of the primary barriers to performing efficiency upgrades in
public housing.
The end goal in all of these categories is to reduce customers‘ energy bills and improve the health and comfort
of their homes. Barriers that are common for most all of these customers include a lack of capital to make
investments, troubled credit histories, transience, and in many cases the reality that the landlord rather than
the tenant holds the decisionmaking power. Health and safety issues are also a major challenge to actually
being able to work in a building. Identifying a way to fund asbestos removal and replacement of knob and tube
wiring could significantly decrease the percentage of homes that want to do upgrades but are not able to
proceed because of these or other unsafe circumstances. This work could be coordinated with workforce
development efforts to train residents in the community for skilled jobs in the trades industry.
Connecticut’s New Office of Energy Efficient Businesses
In order to spur increased participation in energy improvement programs among Connecticut’s businesses, DEEP (in
coordination with the Connecticut Center for Advanced Technologies) established the Office of Energy Efficient Businesses
(OEEB). The purpose of OEEB is to provide information to Connecticut small businesses (particularly in underserved
communities) about how they can reduce their energy bills, and to connect the business to the Connecticut Energy Efficiency
Fund (CEEF) and its relevant programs. The OEEB will allow more businesses to take advantage of any financing options or
programs offered by the CEEF. The OEEB’s initial outreach will be focused in a few pilot communities and then expanded to
engage with small businesses across the state. Trained OEEB staff will approach businesses within the targeted communities
and facilitate their participation in eligible programs. This pilot program will be evaluated after its initial year, with success
being measured through various metrics, including the number of contacted businesses that pursue energy improvements and
the amount of energy consumption reduced. Adjustments will be made as needed to improve the program’s effectiveness.
Creating a Market that Values Energy Efficiency
Despite its many benefits, energy efficiency isn‘t the easiest product to sell. There are three key market
barriers to increasing customer adoption. Customers lack information and awareness about how much energy
their buildings use and where the best opportunities to save energy are. Even if they have this information,
they may not realize the value of efficiency as compared to other competing investments. Finally, they may
lack access to financing to minimize the upfront costs of efficiency upgrades. The goal is to create a culture
that understands the value of and therefore demands energy efficiency, establishes standards that enable
consumers to easily ascertain the efficiency profile of their own homes or buildings, and makes financing for
energy efficiency measures both easily accessible and affordable.

2013 Connecticut Comprehensive Energy Strategy
Chapter 1: Energy Efficiency Sector Strategy
19
Marketing Energy Efficiency
Studies in other states have found that most people simply are not aware that energy efficiency programs — or
the opportunities for energy savings — exist. That is why the State is launching a new effort, called ―Energize
Connecticut‖ to market efficiency and clean energy programs and incentives, using everything from old media
like TV and print to social media and community outreach. It is also crucial to give people information about
their energy costs. Few energy customers examine their electricity, natural gas, or oil bills closely enough to
figure out how much energy they are actually buying. Fewer still, compare their consumption to that of their
neighbors, or to what might be possible if they invested in insulation or other efficiency measures. Without
that knowledge, it is difficult to identify opportunities for reducing costs.
Even when people are aware of the efficiency opportunities in their buildings, they don‘t always invest in
energy efficiency measures. Although investing in these measures is cost-effective, doing so competes with the
dozens of other priorities that a homeowner, renter, business, or building manager may have for use of limited
dollars. In addition to the energy cost reductions and dollar savings that result from these investments,
Connecticut‘s residents and businesses need to be made more aware of the other benefits, like healthier more
comfortable homes, staff productivity, higher tenant satisfaction, and sales increases that result from these
improvements.23
Creating the most effective programs for boosting energy efficiency in Connecticut‘s buildings requires
extensive data about the market (i.e., the state‘s buildings and building owners), a system for assessing and
responding to the needs of the occupants, and the ability to rapidly measure the success of program efforts.
Program administrators, vendors, and contractors would benefit from access to the same marketing,
operations and technology tools used by the world‘s leading brand-name companies, such as advanced
database, modeling, and customer relationship management software.
Reducing Upfront Capital Costs
Many customers who are interested in efficiency currently can‘t raise the capital necessary to make the
investment. Connecticut has already implemented innovative financing programs to address this challenge.
For instance, small business owners can get loans for efficiency upgrades from the utilities at ratepayer-
subsidized interest rates. The loans are then paid back on utility bills. Note that these ―on-bill‖ repayment
programs do not include enforcement mechanisms, such as the ability to shut off service to customers who
default on the loans, nor do they run with the meter. Financing programs must be expanded by accessing
more low-cost capital and developing different financing models designed to cost-effectively meet the needs of
different customer segments.
23
Muldavin, Scott R. Green Building Finance Consortium, "Value Beyond Cost Savings: How to Underwrite Sustainable Properties." Available at http://www.greenbuildingfc.com.

2013 Connecticut Comprehensive Energy Strategy
Chapter 1: Energy Efficiency Sector Strategy
20
To that end, the Clean Energy Finance and Investment Authority (CEFIA) was established in 2011 to develop
programs that create long-term, sustainable financing by leveraging private sector capital in the state‘s
residential, commercial, industrial, and municipal/not-for-profit sectors. CEFIA is in the process of rolling out
a number of innovative new programs that follow this model. The enactment of Public Act 12-2 established an
important mechanism for financing energy efficiency in commercial buildings by authorizing CEFIA to
administer the C-PACE program discussed earlier in this Chapter.24 The C-PACE program enables commercial
and industrial property owners in participating municipalities to access low cost, long term upfront financing
for energy-related improvements. The privately sourced capital is then repaid by the property owner through
a special ―benefit‖ assessment on their property tax bills. The same legislation also provided CEFIA bonding
authority, secured by the State‘s Special Capital Reserve Fund (SCRF), to issue up to $50 million in bonds
backed by an SCRF account.
Building a Regulatory Environment that Incentivizes Efficiency
Codes and standards are important tools that the State can use to reduce energy consumption in buildings
and appliances. Connecticut can ensure significant energy savings by adopting building codes that require
contractors to achieve higher energy efficiency levels when they renovate or upgrade existing buildings.
Connecticut law requires that the State adopt the newest International Energy Conservation Code (IECC)
within 18 months of its publication, or by July 1, 2103. Standards in the newest IECC edition will improve the
energy efficiency of new construction by about 15% over the existing code.25 It is equally important to develop
measures that will better ensure that building inspectors understand and enforce the energy portion of the
building code. Energy auditors and energy service providers also need to be appropriately trained and
conform to best practices in their field.
Although appliance standards are primarily set at the federal level, states can adopt standards for products for
which no federal standard has been set. Connecticut should continue to work closely with the Northeast
Energy Efficiency Partnership to promote higher efficiency standards for appliances. Promptly adopting newly
promulgated standards can bring substantial savings to consumers, particularly as electronics become a larger
part of people‘s lives.
Employing Efficiency to Reduce Peak Demand
Even if Connecticut captures all cost-effective energy efficiency, electric rates could still increase. The reason
for this anomaly is that the overall use of electricity that is higher than average supply conditions could still
rise, despite decreasing the overall consumption of electricity. The installation of equipment like air
24
See Connecticut Public Act 12-2, ―An Act Implementing Certain Provisions Concerning Government Administration,‖ (2012).
25 New Buildings Institute, "2012 IECC Development & Resources." Available at http://www.newbuildings.org/comprehensive-iecc-proposal.

2013 Connecticut Comprehensive Energy Strategy
Chapter 1: Energy Efficiency Sector Strategy
21
conditioning, that drives peak demand conditions, is expected to increase in the coming years. As a result,
Connecticut must find ways to expand its peak demand reduction efforts. In addition to maintaining support
for existing demand response programs, the State should take the following measures: (1) expand the
installation of peak-load-following renewable energy (especially solar), (2) incorporate measures that reduce
peak demand in the State‘s energy efficiency programs, (3) support behavioral change that helps to shave the
peak load through advanced technologies like smart meters and appliances, (4) issue a Request for Proposals
to allow the State to determine if it should contract for a block of clean power that might include peak load
electricity, and (5) implement dynamic pricing mechanisms that reflect the real cost of providing electricity
throughout the day to encourage customers to reduce their consumption during the expensive periods of peak
demand.26 Advanced meters can display real-time energy use, allowing customers to see how much energy
they are using at any given time and with dynamic pricing, what they are paying for it. Such meters can also
transmit information to online Internet portals, where consumers can log in and check their usage in real
time. Combined with electricity rates that vary depending on demand or the time of day, this information will
enable consumers to adjust their energy use to minimize overall costs. This information would also provide a
powerful market incentive to increase the efficiency of energy use. Chapter 3 (Electricity) addresses these
opportunities in more detail.
Decoupling
Regulatory changes are also needed if the State is to make the utilities full partners in capturing all cost-
effective energy efficiency and to incentivize the utilities to optimize their efficiency efforts. This is best done
by establishing clear economic rewards for the electric and gas distribution companies to achieve greater
levels of energy efficiency. In the traditional utility business model, utilities make more money the more
electricity or gas that they sell. As a result, they want customers to use more energy, not less. A better
approach is to ‗decouple‘ revenue from energy sales, adjusting rates to cover the utilities‘ allowed costs and a
reasonable return even if their sales drop due to efficiency gains. Allowing utilities to share in the savings from
lower energy use gives decoupled companies an even stronger incentive to help conserve.27 PA 07-242
directed the utility commission to decouple electric natural gas and electric revenues from the volume of sales
and United Illuminating (UI) has a pilot decoupling rate structure in effect. However PURA denied a
decoupling proposal from Connecticut Light and Power (CL&P), and no decoupling mechanism has been
implemented for the state‘s three regulated natural gas utilities. This must change.
26
Connecticut Department of Energy and Environmental Protection, ―2012 Integrated Resource Plan for Connecticut.‖ Available at http://www.ct.gov/deep/lib/deep/energy/irp/2012_irp.pdf.
27 Satchwell, Andrew, Peter Cappers, and Charles Goldman. Ernest Orlando Lawrence Berkeley National Laboratory, "Carrots and Sticks: A Comprehensive Business Model for the Successful Achievement of Energy Efficiency Resource Standards." Available at http://eetd.lbl.gov/ea/emp/reports/lbnl-4399e.pdf.

2013 Connecticut Comprehensive Energy Strategy
Chapter 1: Energy Efficiency Sector Strategy
22
Beyond decoupling, the State should establish additional incentives for its utilities to invest in all cost-
effective efficiency including a ―decoupling plus ―structure of performance bonuses for meeting efficiency
targets and/or an enhanced rate of return for meeting policy targets including efficiency goals.
Cost-Effectiveness Screening
Connecticut statute states that electric ―resource needs shall first be met through all available energy efficiency
and demand resources that are cost-effective, reliable and feasible.‖ However, there has been no similarly
clear statement as to how cost-effectiveness should be determined other than that the ―projected customer
cost impact of any demand-side resources‖ shall be ―reviewed on an equitable basis with non-demand-side
resources‖. As commenters such as the Office of Consumer Counsel have noted, clear standards for cost-
effectiveness testing are essential, particularly with the changes in federal lighting standards that will affect
the cost and savings associated with those measures in the next few years. There are numerous cost-
effectiveness tests that can be applied and a survey of states across the nation shows that a majority use a
Total Resource Cost test while numerous others use a Societal Cost Test and many use a combination of these
and others including a Participant Test, Ratepayer Impact Test, and a Program Administrator Cost Test. Each
of these tests has value and helps policymakers and regulators more fully understand the benefits and impacts
of energy choices, such as efficiency and demand-side measures. As the State seeks to transition to a 21st
century energy model, a more comprehensive approach to evaluating energy choices is also called for. While
electricity, natural gas, water, and other regulated utility services are distinct commodities, providing them
and using them have effects that impact things not directly associated with the service they are intended to
provide. Creation of the Department of Energy and Environmental Protection (DEEP) reflected the
understanding that energy and the environment are integrally related and need to be viewed and addressed in
ways that recognize that relationship. Similarly, it is clear that generating, delivering, and using electricity has
a varied set of economic, health, and environmental impacts. To that end, this Strategy recommends that
policy development and regulatory decisions reflect these interconnected impacts, benefits, and costs.
Energy Efficiency Strategy: Recommendations
Optimizing the economic, environmental, and public health gains that can be achieved through energy
efficiency efforts requires increased investments, better services that yield greater savings, broader customer
engagement, and a clear, consistent commitment through policy and regulation to an energy framework that
prioritizes the use of energy efficiency to meet the state‘s energy needs. The following recommendations are
important components for establishing that framework:

2013 Connecticut Comprehensive Energy Strategy
Chapter 1: Energy Efficiency Sector Strategy
23
Improve Conservation and Load Management Programs to Ensure Maximum Impact for Each
Ratepayer Dollar Spent
1. Provide Sufficient and Consistent Long-Term Funding for Efficiency Programs
Consistent with the recommendations of the 2012 IRP, in order to capture the energy efficiency gains in
buildings, this Strategy recommends increasing the funding for electric efficiency programs to the all cost-
effective level of $206 million, and sustained funding for natural gas efficiency at the increased level of $34
million approved by PURA in January 2012 but later rescinded. Natural gas efficiency should then ramp up to
$75 million annually over the next few years. This increase in funding should be implemented in a gradual
way, to ensure that the quality and cost-effectiveness of the State‘s energy efficiency programs are maintained
during the period of expansion. At the same time, efforts to increase private financing of energy efficiency —
discussed below — should be expanded quickly, to shift from the current heavy reliance on ratepayer funding
to a much greater focus on private capital leveraged by limited government funding. DEEP supports adoption
of legislation that further clarifies PURA‘s existing authority to increase funding for energy efficiency
investments determined to be cost-effective and in the public interest beyond the current 3 mil charge.
This Strategy also recommends that the State ensure that its energy efficiency programs address ―all fuels‖
and provide the levels of investment needed to include all homes using oil and other deliverable fuels for
heating. The most logical way to achieve this result might be for the fuel oil and propane dealers to establish a
voluntary efficiency fund that they would contribute to at levels commensurate with the efficiency funding
provided by natural gas and electric-heated homes. In the alternative and to ensure equity across heating
sources, the General Assembly might choose to levy a surcharge on fuel oil and propane to support efficiency
measures for customers heating with these fuels. This commitment to ―fuel equity‖ in the funding of efficiency
was supported by many commentators on the draft Strategy. While cost-effective efficiency investments are
beneficial to all customers, ensuring access to efficiency upgrades for oil and propane customers in areas of
the state where it will not be economically feasible to convert to natural gas will be especially important.
Indeed, helping those who will continue to heat with fuel oil and propane obtain the most efficient furnaces
possible is fundamental to this Strategy‘s ―no furnace left behind‖ commitment.
2. Revamp Existing Efficiency Fund Programs to Ensure Maximum Impact for Each Ratepayer Dollar Spent
To support innovation, this Strategy recommends that existing and new efficiency programs be evaluated
using consistent metrics that drive innovation to reduce costs, spur participation, and extend the reach of the
efficiency investments undertaken. Those metrics should include total cost – ratepayer and participant - per
unit of energy saved, customer acquisition costs, and material costs. In addition, incentives should be
continually reviewed and adjusted to provide the minimal incentive necessary to overcome barriers to
participation in order to lower the cost per unit of saved energy while increasing participation.
The HES residential efficiency program should evolve to ensure deployment of the maximum level of
residential efficiency by driving implementation of ―deeper‖ follow-up efficiency measures. Ratepayers — and

2013 Connecticut Comprehensive Energy Strategy
Chapter 1: Energy Efficiency Sector Strategy
24
customers who have had audits — would reap far greater benefits if more customers opted to undertake the
more comprehensive efficiency upgrades such as insulation or heating system upgrades identified in the audit.
Evaluating the relative cost and benefits of energy efficiency upgrades and demand response should also be a
part of evaluating options for any given customer.
Capturing these deeper efficiency benefits will require a concerted effort on the part of the State, the utilities,
the Energy Efficiency Board, the Clean Energy Finance and Investment Authority (CEFIA), and the vendor
community. While building public awareness of the benefits of efficiency and offering attractive financing
options are central to the State‘s strategy for advancing efficiency gains, different programmatic approaches
should also be explored. These might include using a ―scorecard‖ that evaluates contractors and vendors on
the basis of sales conversions or number of deeper efficiency measures installed. Higher scores would earn
contractors and vendors financial rewards. Such a scorecard would need to be developed, tested, and refined
to make it as effective as possible.
Another option that should be considered would be the development of a licensing standard for HES home
performance contractors to promote growth in the sector and provide confidence to customers that enlist the
service of these professionals. This standard could be similar to the standards established for Home
Improvement Contractors, and could be tied to different levels of the Building Performance Institute‘s
certification programs.
Leverage Private Capital to Support Energy Efficiency Investments
The capital investment that will be required for Connecticut to reach its energy efficiency and clean energy
goals will be substantial. Financing programs currently available from the utilities and the Connecticut Energy
Efficiency Fund are inadequate to meet this need as they rely on the use of limited ratepayer funds. As
discussed above, CEFIA is developing new financing programs designed to attract private capital investment
to support efficiency and clean energy investments for both homeowners and businesses. Advancing these
programs, as described below, is critical to developing consistent, sustainable funding for energy efficiency
that then, over time, would require lower levels of ratepayers support. New innovative financing tools like C-
PACE, on-bill financing, and performance contracting will further help customers pay for energy efficiency.
Taking these programs to scale will require increasing customer awareness and driving demand to ensure that
a higher number of customers participate in these programs.
3. Develop Financing Programs to Make Residential Clean Energy Investments More Affordable
As noted above, current Energy Efficiency Fund program options for financing more expensive efficiency
improvements are inadequate to drive the customer adoption rates needed to achieve the 80% weatherization
goal set by the legislature in PA 11-80. To make it easier for customers to invest in energy efficiency
improvements, DEEP is working with the utilities, CEFIA, and other organizations to better coordinate
existing financing and incentive programs and to significantly expand the availability of financing. Legislation
enacted in 2011 and 2012 authorizes use of two important tools to provide financing options to Connecticut

2013 Connecticut Comprehensive Energy Strategy
Chapter 1: Energy Efficiency Sector Strategy
25
residents and businesses. Section 99 of Public Act 11-80, directs CEFIA to attract additional private capital
investment to help achieve Connecticut‘s energy efficiency and clean energy goals, and specifically authorizes
it to offer financing for 100 percent of the cost of energy efficiency projects and up to eighty percent of clean
energy projects. Section 116 of the same act directed DEEP to establish a residential heating equipment
financing program through on-bill financing or other mechanisms. DEEP piggybacked on an existing ―on-bill‖
financing program that enables qualified homeowners to make more extensive upgrades with little or no up-
front cost and pay for them over time on their monthly utility bills. However, since participation in the
program has been far short of that needed to meet the State‘s goals, this Strategy proposes that the State
explore alternative mechanisms for financing energy efficiency upgrades for the residential sector, to
determine which are most effective in driving residential efficiency and clean energy investments — including
those needed to upgrade or replace inefficient furnaces and boilers.
―On-bill‖ financing opportunities have been available to varying degrees but have usually been structured so
that monthly savings from the efficiency or clean energy improvements are greater than the loan repayment
cost. As a result, the homeowner has no increase in their monthly utility bill and ideally gets some portion of
the savings from day one. However, in order to keep default rates – and therefore program costs – low, on-
bill financed loans have utility shutoff provisions for failure to make loan repayments. Since a large segment
of customers that stand to benefit from efficiency upgrades may have a higher risk of missing a given
payment, DEEP has worked with the Energy Efficiency Board, CEFIA and the utilities to develop a ―low or no‖
interest rate loan program modeled on the zero interest HEAT loan offered by Mass Save (Massachusetts‘
utility-administered efficiency program) for financing residential energy efficiency measures. The HEAT loan
program is administered directly by community banks and credit unions, with Mass Save providing a subsidy
in the form of an upfront buy-down of the interest rate to 0%.
CEFIA has now developed a similar program with Connecticut banks and credit unions that will be available
in February 2013. This Smart-E pilot program will offer affordable interest rates and enable a five to twelve
year payback period for the homeowner.28 Participating lending institutions will provide unsecured loans of
up to $25,000 to qualifying residential borrowers to finance comprehensive energy assessments and
efficiency retrofits, in addition to qualifying renewable energy improvements and fuel and equipment
conversions.29 All contractors qualified under CEFIA, the utilities, or CEEF are eligible to participate.
Customers can finance all measures that qualify for a rebate under CEFIA, CEEF, or the utilities, as well as
other measures that increase the energy efficiency or renewable energy production of a home. Additionally,
related home improvements that do not contribute directly to enhanced energy efficiency (i.e., asbestos
removal, lead abatement, etc.) will be allowed under the program, so long as they do not exceed 20% of a
given loan‘s value.
28
This may be modeled on the HEAT loan offered by Mass Save (Massachusetts’ utility administered efficiency program). 29
$25,000 is a mini-max that is it is the lowest maximum amount a lender can offer in the program. Other lenders may choose to offer a higher maximum loan amount.

2013 Connecticut Comprehensive Energy Strategy
Chapter 1: Energy Efficiency Sector Strategy
26
This financing program is attractive to community and local banks because of: (1) CEFIA‘s credit
enhancement, (2) potential access to new customers, (3) improvements to the local community building stock
in underserved markets, and (4) the possibility of federal Community Reinvestment Act benefits for the
participating banks.
From the lender‘s perspective, a key advantage of an on-bill repayment program is that homeowners generally
have a good track record of paying their utility bills which reduces the risk of default and enables more
attractive borrowing terms, thereby driving higher loan volumes and lower interest rates, and generating
greater levels of private capital investment in clean energy and efficiency. Extensions of credit for energy
efficiency measures are unsecured obligations of the borrower. To be attractive to lenders such an on-bill
financing program must have enforcement mechanisms that lower lenders‘ risk enough to be able to get
lower-cost capital so as to provide lower interest rates and longer term loan repayment periods.
Mechanisms that allow service to be terminated or allow the debt obligation to remain ―with the meter‖ (so
that the loan obligation, as well as the benefits from the energy efficiency measures, transfers to the new
owner if a property is sold) would make this possible. Without an enforcement mechanism, the cost of raising
this capital will be high when compared to other financing options, such as mortgage debt and home equity
lines of credit. Without ―buying down‖ the interest rate, such loans may not be attractive or affordable for the
majority of consumers. Enforcement mechanisms can have uncertain consequences for households, and
therefore eligibility for this type of on-bill financing may need to be limited to customers who have stable
credit scores. On-bill repayment has already received PURA‘s approval.30
This Strategy recommends that PURA consider authorizing an enforcement mechanism for the CEFIA on-bill
residential pilot program and establish appropriate eligibility criteria, as described above.31 This program
could be managed by CEFIA and funded primarily through third party financing, such as local, regional or
money-center banks rather than ratepayers. A sufficient period of homeowner repayment history should
enable CEFIA to access the bond market and secure even lower cost financing for hundreds of millions of
dollars of energy improvements. In launching this program, CEFIA could utilize credit enhancements for
capital sourced from banks as well as other financing tools such as the Special Capital Reserve Fund to
support funds raised in the bond market.
4. Establish Commercial Property Assessed Clean Energy Districts in Municipalities Across the State
As described earlier in this Chapter, in June 2012, the Connecticut General Assembly passed Public Act 12-2,
which authorized the creation of a financing program that enables commercial, industrial, and multi-family
property owners in Connecticut to access upfront financing for energy improvements. C-PACE is a tax-lien
30
See PURA Docket 09-10-03, ―DPUC Review of the Connecticut Energy Efficiency Fund’s 2010 Conservation and Load Management Plan for 2010,‖ Decision, p. 31. Available at http://www.ct.gov/pura/docketsearch.
31 Such an enforcement mechanism is authorized under Section 14 of Connecticut Public Act 07-242, ―An Act Concerning Electricity and Energy Efficiency,‖ (2007).

2013 Connecticut Comprehensive Energy Strategy
Chapter 1: Energy Efficiency Sector Strategy
27
financing program that allows interested property owners to finance qualifying energy efficiency and clean
energy improvements on their properties through an additional charge (―assessment‖) on their property tax.
Similar to a sewer tax assessment, capital provided under the C-PACE program is secured by a lien on the
owner‘s property tax bill. Property owners pay the improvements back over time, based on the voluntary
assessment placed on the property tax bill. The PACE lien takes first priority over mortgage-holders, and the
repayment obligation transfers automatically to the next property owner if the property is sold. Because the
payment is tied to the property tax, a secure payment stream, low interest capital can be raised from the
private sector with no government financing required. This arrangement spreads the cost of clean energy
improvements – such as energy efficient boilers, upgraded insulation, new windows, or solar installations –
over the expected life of the measure.
Across the country, this financing model has enabled property owners to access capital for energy
improvements. Connecticut‘s C-PACE program is administered by CEFIA. While the program is statewide,
municipalities interested in extending this type of financing to their property owners must opt-in through an
agreement with CEFIA. As of January 2013 about a dozen municipalities had opted in and numerous others
have indicated interest in making this program available to their property owners. This Strategy recommends
that: (1) municipalities work with CEFIA to pass resolutions through their legislative bodies that will enable
their business and commercial residential property owners to access this attractive way to finance building
improvements, and (2) the General Assembly consider authorizing municipalities to provide property tax
exemptions for the increased value of properties resulting from efficiency upgrades and clean energy projects
for all property owners.
Low-Income Strategy to Ensure that Low-Income Communities Benefit from Energy-Efficiency
Programs
In addition to developing financing models for residential customers with low incomes or poor credit, this
Strategy provides several recommendations to ensure that low-income customers participate more fully in,
and benefit from, the State‘s energy efficiency programs.
5. Develop Programs to Address Health and Safety Pre-Weatherization Measures
Landlords may be reluctant to participate in the State‘s energy efficiency programs if their properties have
health- and safety-related code violations, such as asbestos, mold, or ―knob-and-tube‖ electric wiring, which
would have to be remedied before a home energy audit can be performed. Limited amounts of this work can
be done under existing efficiency program funding and the soon to be launched Smart-E loans will also allow
up to 20% of a loan to be directed toward health and safety issues. However, this Strategy recommends that
DEEP work with the Energy Efficiency Board, the utilities and low-income advocates to develop additional
approaches to addressing or incentivizing these ―pre-weatherization‖ measures so that owners of older
housing stock – much of it in distressed communities – are able to more fully participate in the State‘s energy
efficiency programs.

2013 Connecticut Comprehensive Energy Strategy
Chapter 1: Energy Efficiency Sector Strategy
28
6. Incorporate Energy Efficiency Measures into Upgrades of State-Administered Housing
Governor Malloy has made a strong commitment to upgrading and expanding state-administered housing
units across Connecticut. At the same time, DEEP, CEEF and CEFIA will work to promote enforcement of
energy efficiency standards (e.g., a weatherization standard) in conjunction with Section 8 Housing Quality
Standards (HQS) unit inspections. Doing so will ensure that building occupants are afforded a higher quality
living environment, and that owners of the units can save on energy costs and pass these savings on to their
tenants. The best way to do this is to use financing mechanisms to support improvements. Accordingly, DEEP,
CEEF, and CEFIA should work with the Connecticut Housing Finance Authority to ensure that the State‘s
$300 million commitment to upgrading public housing captures efficiency upgrades and leverages available
funding to advance these efforts.
7. Improve Existing Means-Tested Energy Assistance Programs
DEEP‘s analysis of the effectiveness of various State energy assistance programs, discussed above, suggests
that more benefits could be achieved by reforming, coordinating and better targeting the use of currently
allocated resources. For example, the Matching Payment Program (MPP) for low income utility customers has
worthy attributes and goals, but may be underperforming in terms of reducing utility uncollectible expenses,
improving customer payment habits, and other desired outcomes. Consideration should be given to modifying
the program to build on the MPP‘s best attributes, such as its arrearage/debt forgiveness component, timely
payment incentives, and counseling elements. Additional consideration should be given to redesigning the
program into one based upon twelve month regular and required percentage of income payments.32
8. Target Funding to Address Split Incentives
DEEP will work to develop program tools that promote efficiency and alternative energy improvements in
multifamily properties while equitably managing the split of benefits between the owners and tenants. The
State could work to provide incentives to the owners of the 2-4 unit multifamily properties where the owner
does not pay for utilities. Such incentives could be tied to implementation of a set level of efficiency, natural
gas heating conversions, and/or alternative energy improvements. This approach would require some level of
owner contribution and include limits on raising rents.
9. Expand Outreach and Financing Options for Businesses in Low-Income Communities to Achieve Energy Efficiency
Pursuant to Section 119 of Public Act 11-80, DEEP has engaged the Office of Energy Efficient Business and the
Connecticut Center for Advanced Technology to provide outreach to small businesses in low income urban
communities (see text box earlier in this Chapter). Going forward, these efforts should be coordinated with
those of Operation Fuel‘s BEST program and other similar programs and services aimed at the targeted
32
See DEEP Energy Filings, ―Public Act 11-80 - Section 112 - Low Income Discount Rate – BETP – Notice of Request for Comments and Public Comment Hearing and Draft Report.‖ Available at http://www.ct.gov/deep/energyfilings; and See PURA Docket 12-07-01, ―PURA Investigation Into The Establishment Of Low-Income Discounted Rates For Electric And Gas Services.‖ Available at http://www.ct.gov/pura/docketsearch.

2013 Connecticut Comprehensive Energy Strategy
Chapter 1: Energy Efficiency Sector Strategy
29
communities. This would better ensure that small, largely minority owned, businesses in our urban centers
avail themselves of the energy efficiency opportunities that can economically benefit them.
Enact Regulatory Changes to Expand Efficiency Opportunities
10. Implement Decoupling to Align Utility Incentives with Energy Efficiency
Utilities traditionally have made more money when they sell more electricity or gas, creating a powerful
incentive to push for less efficient uses of energy or to avoid promoting energy efficiency measures. Flipping
this incentive around requires separating utilities‘ revenues from their sales volume, a process known as
―decoupling.‖ While instituting basic decoupling (as required, but only partially implemented, by Sec 16-19tt
of the CT General Statutes) would remove the disincentive for utilities to promote efficiency, expanded
performance incentives (beyond those currently in place) or a performance-based return on equity would give
utilities an even stronger incentive to work with customers to optimize energy efficiency and save their
customers money. For a more detailed discussion of this Strategy‘s recommendations with respect to
instituting decoupling and providing incentives, refer to Chapter 3 (Electricity).
11. Adopt and Enforce the Latest Codes and Standards to Ensure High-Performing Buildings
Though market-based approaches to promoting efficiency are important, many energy consumers may not
respond to market signals. As a result, more stringent building codes and appliance standards are an
important driver of higher efficiency. In the summer of 2013, Connecticut must adopt and enforce the latest
International Energy Conservation Code for residential buildings and the American Society of Heating,
Refrigerating and Air Conditioning Engineers (ASHRAE) Standard 90.1 for commercial buildings, as required
by statute.33
Just as importantly, the State must provide adequate resources to train local building inspectors about the
new codes on a regular basis to ensure that enforcement is uniform across the state. Efforts should also be
made to educate property assessors as to the value of more efficient buildings. The State should also continue
to adopt improved appliance standards, and coordinate with other states in the region to harmonize standards
and thus increase market power. It should also explore options that would provide incentives to large
commercial users to upgrade to high-efficiency appliances and encourage equipment suppliers to primarily
stock the most energy efficient equipment.
12. Work with Regional Organizations to Support Stricter Federal Product Efficiency Standards
The U.S. Department of Energy is engaged in an ongoing effort to develop efficiency standards for various
appliances, equipment, and consumer products. The Northeast Energy Efficiency Partnerships has taken an
active role in reviewing proposed Federal standards and organizing northeastern states to make a coordinated
33
Conn. Gen. Stat. § 29-256a.

2013 Connecticut Comprehensive Energy Strategy
Chapter 1: Energy Efficiency Sector Strategy
30
recommendation for the strictest practicable efficiency standard. DEEP will take a more active role in this
regional effort.
13. Empower Consumers with Information about Efficiency Benefits
Several strategies may help consumers better obtain the information they need to make informed decisions
about the ways they consume energy. New educational materials explaining the benefits of energy efficiency
should be included in energy bills and some state and local government mailings such as those related to
income and property taxes.
This Strategy recommends that residential marketing efforts focus on increasing awareness about the Home
Energy Solutions (HES) program, other options for engaging home performance contractors, the benefits
these services provide, the available programs and contractor networks, and low cost options for financing
these investments while reaping savings. These efforts must be undertaken in a way that tracks and supports
the State‘s goal to weatherize 80% of Connecticut homes by 2030.34 The residential Home Performance
industry should engage with the Energy Efficiency Board to track progress towards the achieving the goal of
weatherizing 80% of homes by 2030. This effort will require the gathering and compilation of a substantial
amount of information about the efficiency attributes of each home that is visited. Data from the HES
program and other weatherization efforts should be used to populate a database of Connecticut homes with
energy related information. This information should be shared with homeowners, landlords, and tenants, to
inform them about the relative efficiency of their home and cost-effective opportunities to improve the
efficiency of these properties. In addition to traditional marketing channels, local, trusted grassroots groups
must be engaged to spread the word about these programs and Connecticut‘s goals as these organizations are
an important link in promoting a comprehensive energy strategy. The role of these groups must not be
overlooked or underestimated.
To the extent possible, any State administered refinancing, rehab or upgrade, health and safety, and home
buyer programs should be coordinated with CEFIA and the Energy Efficiency Board programs so that
whatever the focus of a particular program, each is coordinated in a way where all measures and
improvements are funded and/or financed as a single package. The State could also encourage consumers to
educate other consumers. For example, building owners whose energy efficiency or renewable energy
upgrades are supported by public funds could be given the option to display some type of on-site education
(e.g., a sign or smart-phone Quick Response ―QR‖ scannable code) about the upgrades.
14. Train Professionals on Code Compliance and Efficient Building Design and Construction
The State‘s energy efficiency programs have funded efforts to train building inspectors, architects, engineers
and the building design community, as well as building trade professionals, to meet the most recent building
code standards, and to design and build to standards that exceed the current code and incorporate ―green‖
34
Conn. Gen. Stat. § 16-245m.

2013 Connecticut Comprehensive Energy Strategy
Chapter 1: Energy Efficiency Sector Strategy
31
building design. The Strategy supports the funding of these educational efforts and will work with the State‘s
higher education institutions and regional organizations to assure that building code training is
comprehensive and reaches a wide audience of building professionals.
15. Empower Building Owners to Market their Energy Efficiency Improvements
Investments in energy efficiency measures are clearly effective in bringing down a building‘s energy costs, but
this information is not readily apparent to prospective tenants or buyers. As a result, rents and home prices do
not necessarily reflect or reward the efficiency investments that have been made in a home or apartment
building, even though those investments provide real economic value in terms of lower energy costs and
comfort. Approximately 5% of the residential housing stock in Connecticut changes hands each year. This
turnover represents a golden opportunity for assessing a property‘s ―efficiency profile‖ and for improving its
efficiency. The State needs to engage commercial and residential real estate professionals who are on the
―front lines‖ of these transactions and encourage their participation in understanding the benefits of efficient
buildings. Buyers have often included the costs of cosmetic or redecorating upgrades in mortgages. Promoting
inclusion of insulation, heating/cooling system upgrades, along with other measures, into financing at the
time of purchase could yield significant savings for the new owner, making it even easier to meet whatever
increased mortgage payment might be incurred.
This Strategy recommends the development of a residential building energy use labeling program on a
voluntary, pilot basis. Homeowners interested in participating could be provided a label or information sheet
that summarizes a building‘s energy efficiency performance that could be included as part of the seller
disclosure form when the building is on the market. Such a labeling program would help buyers make
informed decisions and would reward homeowners who invest in efficiency, by increasing the value of their
homes in the real estate market. By establishing a uniform metric for evaluating the efficiency of all occupied
spaces, the labeling program could also help the State meet the requirements of part of the 80%
weatherization goal in Public Act 11-80.
At the same time, this Strategy suggests that the General Assembly consider legislation to require that
landlords of commercial and residential buildings provide energy cost data to tenants, for rental units where
the tenant directly pays the bills. This rental energy disclosure could be modeled on the building label
described above, and could be included routinely as part of every lease agreement. This Strategy also
recommends the adoption of energy performance labels for both residential and commercial buildings.
Further Actions
The location of buildings can have a significant ancillary impact on levels of air and water pollution. Since the
mid-twentieth century, Connecticut‘s new building activity has occurred primarily in suburban and rural
areas. The dispersion of buildings, and consequent disinvestment in many of the State‘s central cities, has
increased Connecticut‘s reliance on the automobile and gasoline imported from other regions. The increased
use of the automobile has had significant effects on the environment, as discussed further in Chapter 5

2013 Connecticut Comprehensive Energy Strategy
Chapter 1: Energy Efficiency Sector Strategy
32
(Transportation), and on the health of regional economies that depend on strong central cities. Strategies and
accompanying policy decisions that promote building developments and redevelopments in ways that take
advantage of existing or proposed transportation and utility infrastructures can do much to address the
pressing environmental and economic challenges that are only peripherally addressed in this Strategy.
Conclusion
Because the building sector consumes nearly 60% of the State‘s energy, it offers the largest single opportunity
to use energy efficiency to reduce energy use, ratepayer expenses, and greenhouse gas emissions. That is why
the State has already set ambitious targets, developed innovative programs, financed a range of pilot and
longer-term projects, begun efforts to align utilities‘ and consumers‘ incentives and needs, and focused on
developing policies to ensure economic and environmental sustainability.
This Strategy charts a path to advancing these initiatives even further by: proposing steps to create stronger
incentives for utilities to invest in efficiency; making it easier for customers to choose to switch to natural gas,
and other cleaner, cheaper heating alternatives; developing new financing options to fund deep efficiency
measures; and launching new efforts to use oil and propane more efficiently. Lower energy costs also make
the State‘s businesses more competitive and keep Connecticut‘s dollars at home. An aggressive effort to
improve building efficiency is the single most important tool that we have — and control — to ensure a
cheaper, cleaner, and more reliable energy future for Connecticut.

2013 Connecticut Comprehensive Energy Strategy
Chapter 1: Energy Efficiency Sector Strategy
33
Bibliography
An Act Concerning Electric Restructuring (1998). 2012. Index to Connecticut Public and Special Acts. PA 98-
28. http://www.cga.ct.gov/ps98/Act/pa/1998PA-00028-R00HB-05005-PA.htm.
Bell, Catherine J., Steven Nadel, and Sara Hayes. On-Bill Financing for Energy Efficiency Improvements.
Report no. E118. Washington DC: American Council for An Energy Efficient Economy, 2011.
http://psb.vermont.gov/sites/psb/files/orders/2012/2012-3/6c.%20Exh.%20Pet.-JJP-3.pdf.
Center on Budget and Policy Priorities. Connecticut: Federal Rental Assistance Facts. Washington DC: Center
on Budget and Policy Priorities, 2011. www.cbpp.org/files/4-13-11hous-CT.pdf.
Connecticut Department of Economic and Community Development. The Economic Impact of Expanding
Natural Gas Use in Connecticut. By Stanley McMillen and Nandika Prakash. Hartford, CT, 2011.
http://www.ct.gov/deep/lib/deep/energy/decd_nat_gas.pdf
Connecticut Department of Energy and Environmental Protection. 2012 Integrated Resource Plan for
Connecticut. New Britain, CT, 2012. http://www.ct.gov/deep/lib/deep/energy/irp/2012_irp.pdf.
———. Public Utilities Regulatory Authority (PURA). 2012 Electric and Natural Gas Conservation and Load
Management Plan. By The Connecticut Light and Power Company, The United Illuminating
Company, Yankee Gas Services Company, Connecticut Natural Gas Corporation, and Southern
Connecticut Gas Company. PURA Docket 11-10-03. New Britain, CT, 2011.
http://www.ct.gov/pura/docketsearch.
———. Public Utilities Regulatory Authority (PURA). Application of the Connecticut Light and Power
Company to Amend Its Rate Schedules: Final Decision, June 30, 2010. PURA Docket 09-12-05. New
Britain, CT, 2010. http://www.ct.gov/pura/docketsearch.
Connecticut Energy Efficiency Fund. 2011 Report of the Energy Efficiency Board. New Britain, CT:
Connecticut Energy Efficiency Fund, 2012.
http://www.energizect.com/sites/default/files/Final%202012%20ALR%2020120301.pdf.
Connecticut Light and Power. 2012. ―Connecticut‘s Roadmap to ACEEE Best in Class: A Gap Analysis and
Approach.‖ Presentation to the Connecticut Energy Efficiency Board, 2012.
Cooper, Adam, and Lisa Wood. Summary of Ratepayer-Funded Electric Efficiency Impacts, Budgets, and
Expenditures. Washington DC: Institute for Electric Efficiency, 2012.
Ehrhardt-Martinez, Karen, and John A. ―Skip‖ Laitner. The Size of the U.S. Energy Efficiency Market:
Generating a More Complete Picture. Report no. E083. Washington DC: American Council for An
Energy Efficient Economy, 2008.
Emrath, Paul. How Long Buyers Remain in Their Homes. Washington DC: National Association of Home
Builders, 2009.

2013 Connecticut Comprehensive Energy Strategy
Chapter 1: Energy Efficiency Sector Strategy
34
Energy and Environmental Analysis. Introduction to CHP Technologies. Washington DC: U.S. Environmental
Protection Agency Combined Heat and Power Partnership, 2008.
GDS Associates, Inc. Massachusetts Natural Gas Energy Efficiency Potential Study for Residential Sector.
Marietta, GA: GDS Associates, Inc., 2009.
———. Vermont Energy Efficiency Potential Study for Oil, Propane, Kerosene, and Wood Fuels. Marietta,
GA: GDS Associates, Inc., 2007.
KEMA. Connecticut Electric Residential, Commercial, and Industrial Energy-Efficiency Potential Study.
Burlington, MA: KEMA, 2010.
http://energizect.com/sites/default/files/CTElectricEEReport05032010FinalKEMAf2.doc.
———. Connecticut Natural Gas Commercial and Industrial Energy-Efficiency Potential Study. Burlington,
MA: KEMA, 2009. http://energizect.com/sites/default/files/CTNGPotential090508FINAL.pdf.
Muldavin, Scott M. Value Beyond Cost Savings: How to Underwrite Sustainable Properties. San Rafael, CA:
Green Building Finance Consortium, 2010.
http://www.greenbuildingfc.com/Home/ValueBeyondCostSavings.aspx.
National Grid, NSTAR, Columbia Gas of Massachusetts, Western Massachusetts Electric, Cape Light
Compact, Berkshire Gas, New England Gas Company, Unitil, and Blackstone Gas Company.
Massachusetts Joint Statewide Three-Year Electric and Gas Energy Efficiency Plan. Boston:
Massachusetts Energy Efficiency Advisory Council, 2012. http://www.ma-eeac.org/docs/DPU-
filing/ElectricPlanFinalOct09.pdf.
Navigant Consulting and SAIC. ―EIA – Technology Forecast Updates – Residential and Commercial Building
Technologies – Reference Case.‖ Presented to the U.S. Energy Information Administration,
September 22, 2011. http://wpui.wisc.edu/news/EIA%20Posts/EIA%20Reference%20Case%2009-
2007%20Second%20Edition%20Final.pdf.
New Buildings Institute. ―2012 IECC is Released with Efficiency Gains of up to 30 Percent.‖ Last modified
July 28, 2011. http://newbuildings.org/news/new-2012-iecc-represents-significant-advances-high-
performance-commercial-buildings.
Northeast Energy Efficiency Partnerships. A Regional Roundup of Energy Efficiency Policy in the Northeast
and Mid-Atlantic States. Lexington, MA: Northeast Energy Efficiency Partnerships, 2011.
http://neep.org/uploads/policy/2011%20Regional%20Roundup_FINAL.pdf.
———. ―Energy Efficiency Policy in Vermont.‖ Accessed April, 2012. http://neep.org/public-policy/poc-
states/poc-states-vt.
Satchwell, Andrew, Peter Cappers, and Charles Goldman. ―Carrots and Sticks: A Comprehensive Business
Model for Successful Achievement of Energy Efficiency Resource Standards.‖ Utilities Policy 19, no. 4
(2011): 218–225. http://eetd.lbl.gov/ea/emp/reports/lbnl-4399e.pdf.

2013 Connecticut Comprehensive Energy Strategy
Chapter 1: Energy Efficiency Sector Strategy
35
Sciortino, Michael, Max Neubauer, Shruti Vaidyanathan, Anna Chittum, Sara Hayes, Seth Nowak, and Maggie
Molina. The 2011 State Energy Efficiency Scorecard. Report no. E115. Washington DC: American
Council for An Energy Efficient Economy, 2011.
U.S. Census Bureau. 2010 American Community Survey. Washington DC: U.S. Census Bureau, 2011.
http://www.census.gov/acs/www/data_documentation/2010_release/
———. United States Summary: 2000. Population and Housing Unit Counts. Washington DC: U.S. Census
Bureau, 2004.
U.S. Energy Information Administration. Annual Energy Outlook 2012: with Projections to 2035. DOE/EIA-
0383(2012). Washington DC: U.S. Energy Information Administration, 2012.
http://www.eia.gov/forecasts/aeo/pdf/0383(2012).pdf.
———. June 2012 Electric Power Monthly. Washington DC: U.S. Energy Information Administration, 2012.
———. Natural Gas Weekly Update. Various release dates April–June, 2012. Washington DC: U.S. Energy
Information Administration, 2012.
———. State Energy Data System. Washington DC: U.S. Energy Information Administration, 2012.
http://www.eia.gov/state/seds/.
U.S. Environmental Protection Agency. ―State Inventory and Projection Tool.‖ [Downloadable spreadsheet
model]. Accessed April, 2012. http://www.epa.gov/statelocalclimate/resources/tool.html.
U.S. Office of Management and Budget (OMB). Guidelines and Discount Rates for Benefit-Cost Analysis of
Federal Programs, Appendix C: Discount Rates for Cost-Effectiveness, Lease-Purchase, and Related
Analyses. OMB Circular no. A-94. Washington DC: Government Printing Office, 2011.

2013 Connecticut Comprehensive Energy Strategy
Chapter 2: Industry Sector Strategy
36
Overview of the Industry Sector
Connecticut‘s industrial sector serves as a powerful economic engine in the state. Providing low-cost energy
options for the industrial sector is an essential factor in Connecticut‘s economic competitiveness. Innovation
in policymaking and new technologies are fundamental to achieving this goal. The state‘s manufacturing
businesses are diverse, ranging from high-tech components to metal finishing — with a growing focus on
precision manufacturing. The industrial sector contributes over $30 billion per year to Connecticut‘s Gross
State Product (GSP), comprising 14% of the total GSP. That makes it the third largest sector in the state in
terms of GSP, ranking behind only the finance and insurance sector, and the real estate sector (Figure 1).1
FIGURE 1: Gross State Product and economic multiplier by sector
Source: U.S. BEA, Gross Domestic Product by State.
Eighty percent of the State‘s industrial GSP is from manufacturing, with construction providing nearly the
entire remaining portion (19%).2 Overall, the manufacturing sector has the highest economic multiplier effect
(1.35) in the state, meaning that every dollar in manufacturing output generates another $1.35 in economic
1 U.S. Department of Commerce Bureau of Economic Analysis, "Advance 2011 and Revised 1997–2010 GDP-by-State
Statistics." Available at http://www.bea.gov/newsreleases/regional/gdp_state/2012/pdf/gsp0612.pdf. 2 Ibid.
$0
$50
$100
$150
$200
$250
1997 1998 1999 2000 2001 2002 2003 2004 2005 2006 2007 2008 2009 2010
Bill
ion
20
12
$
Finance and insurance (19%)
Real estate (14%)
Industry (14%)
Government
Health care
Professional services
Wholesale trade
Retail trade
Other
Information
1.35 (Manufacturing) 1.20 (Agriculture) 0.97 (Construction)
0.63
0.74
0.66
0.58
0.55 0.88
0.55
0.84 – 0.55
Economic multiplier, 2010

2013 Connecticut Comprehensive Energy Strategy
Chapter 2: Industry Sector Strategy
37
activity in other sectors to supply parts, materials and technical and business services.3 Agriculture and
construction also have high economic multiplier effects.
Today, more than 220,000 people are employed in skilled industrial jobs in Connecticut. The workers in this
sector earn the State‘s second highest average wages (Table 1) after finance and insurance.4 The majority of
workers (75%) in the industrial sector are employed in manufacturing, with most of the remainder (23%)
employed in construction.5
TABLE 1: Total employment, average wages for Connecticut’s largest employment sectors, 2011
Sector CT Total Sector
Employment 2011 CT Average Annual
Wage (2012$) US Average Annual
Wage (2012$)
Health Care 250,782 $48,242 $48,026
Government 237,498 $56,616 $51,853
Industry 223,333 $72,274 $47,631
Manufacturing 166,279 $77,717 $47,086
Construction 51,493 $58,917 $48,874
Agriculture 5,019 $29,255 $25,937
Mining 542 $69,977 $58,418
Retail 180,203 $31,446 $29,633
Finance & Insurance 114,561 $155,798 $60,752
Hospitality/Food Services 113,309 $18,826 $22,957
Total State/U.S. 1,612,373 $61,751 $45,682
Source: Connecticut Department of Labor, Quarterly Census; and U.S. Bureau of Labor Statistics, Employment and Wage Estimates.
Connecticut, along with the rest of the nation, has experienced a steady loss of industrial sector jobs over the
past several decades. Manufacturing accounted for 15% of non-farm employment in Connecticut in 1997 but
only 10% of employment in 2010. While manufacturing employment has decreased, output has increased due
to gains in productivity (Figure 2).6 Indeed, the productivity of Connecticut‘s workers ranks near the very top
of the nation. Despite this strong position in terms of production output, Connecticut‘s relatively high energy
and electricity costs have been a drag on this sector and have been heightened by the recent economic
recession.
3 U.S. Department of Commerce Bureau of Economic Analysis, Industry-by-Industry Total Requirements after
Redefinitions (1998 to 2010). Washington DC: U.S. Bureau of Economic Analysis, 2010. Data available at http://www.bea.gov/iTable/iTable.cfm?ReqID=5&step=1#reqid=5&step=1&isuri=1
4 Connecticut Department of Labor, "Employment & Wages by Industry - Quarterly Census of Employment and Wages -
State of Connecticut." Available at http://www1.ctdol.state.ct.us/lmi/202_minorareas_lma.asp. 5 Ibid.
6 Connecticut Department of Economic and Community Development, "Connecticut Economic Strategic Plan." p. 37.
Available at http://www.ct.gov/ecd/lib/ecd/connecticut_esp-final.pdf.

2013 Connecticut Comprehensive Energy Strategy
Chapter 2: Industry Sector Strategy
38
FIGURE 2: Connecticut manufacturing employment and productivity, 1997-2010
Source: U.S. BEA, Annual Survey of Manufacturers; and Connecticut Department of Labor, Quarterly Census.
Fortunately, the price of electricity for industrial customers has come down significantly in the last several
years (Figure 3). As Figure 4 shows, industrial electric rates in Connecticut have been dropping at a faster rate
than neighboring states, or even states in more traditionally low-cost electricity regions (Figure 4). This trend
reflects the fact that Connecticut has invested in cleaner electric generation (such as replacing coal-fired
generation with natural gas-fired generation) over the past decade while many other states, especially in the
Midwest and South, face rising electricity rates as they are forced to retire old fossil fuel generating plants
because of tightening environmental standards and discouraging fuel economics.
$0
$20,000
$40,000
$60,000
$80,000
$100,000
$120,000
$140,000
0
50,000
100,000
150,000
200,000
250,000
300,000
1997
1998
1999
2000
2001
2002
2003
2004
2005
2006
2007
2008
2009
2010
Pro
du
ctivity (
20
12
$ g
ross s
tate
pro
du
ct
per
em
plo
ye
e)
Nu
mb
er
of e
mplo
ye
es
Employment
Productivity
15%
10%
14%
13%
12% 11%
Percent total state employment

2013 Connecticut Comprehensive Energy Strategy
Chapter 2: Industry Sector Strategy
39
FIGURE 3: Connecticut Average Electricity Prices for the Industrial Sector, January 2010-May 2012
Source: EIA Monthly, January 2010 – August 2012.
FIGURE 4: Percent Change in Average Electricity Prices in the Industrial Sector Among Selected States, May 2010-May 2012
Source: EIA Monthly, May 2010 – May 2012.
Connecticut manufacturers have remained competitive regionally and globally because many of them make
high-value products in an energy efficient manner supported by a highly skilled labor force. Connecticut ranks
third in the nation in the percentage of masters, professional, or doctoral degrees held, second in industrial
research and development per $100,000 of sales, and fifth in the percentage of scientists and engineers in the

2013 Connecticut Comprehensive Energy Strategy
Chapter 2: Industry Sector Strategy
40
workforce.7 Given this foundation for highly productive manufacturing, the State is well-positioned to expand
its industrial base as electricity and other energy costs decline.
These advantages explain why companies that manufacture high-value products — such as helicopters,
aircraft engines, office equipment, drugs, chemicals, and fuel cells — have increased their share of the State‘s
GSP, while primary metals and electronics production have shifted to lower-wage states or countries. One
example of how these high value products benefit the state is the hydrogen and fuel cell industry. In 2010 that
industry contributed $267 million to the gross state product and more than $22 million in state and local tax
revenue, while supporting about 1,000 jobs scattered among approximately 600 companies that play some
supporting role to the hydrogen and fuel cell industry in the State.8 As is the case with manufacturing, the
agricultural sector has similarly turned to high-value products. Nearly half of the agricultural subsector‘s
revenue comes from greenhouse produce and flowers, and from nursery plant operations.9
Industrial Sector Energy Use
Understanding how the industrial sector uses energy and the types of energy upon which it relies, is important
to developing strategies that can increase efficiency and lower costs. The industrial sector currently consumes
76 trillion British Thermal Units (BTUs) of electricity, natural gas, oil, and biomass per year to power the
state‘s thousands of factories, data centers, research facilities, farms, construction sites, water and wastewater
utilities, and other industrial operations.10 This represents 10% of Connecticut‘s overall energy consumption.
Overall, electricity accounts for nearly half of the primary energy expenditures attributed to the industrial
sector, while representing only 17% of primary energy used (Figure 5).11 In other words, companies expend
more than half of their energy dollars for electricity, which only supplies 17% of their energy needs. Reducing
industrial electricity consumption would be one of the most productive ways to lower costs for Connecticut
companies. Natural gas accounts for a third of industrial energy consumption, while oil represents 16% and
biomass the remaining 5%.12
7 Northeast Utilities, On Course. Connecticut Economic Review. Hartford, CT: Northeast Utilities, 2012. Available at
http://www.cl-p.com/Business/EconomicDevelopment/Economic_Review/ 8 Connecticut Center for Advanced Technology, ―Hydrogen and Fuel Cell Industry Development Plan‖ (2012), p. 2.
Available at http://neesc.org/uploads/documents/CT_H2_Dev_Plan_041012.pdf 9 U.S. Department of Agriculture, Economic Research Service, "State Fact Sheets: Connecticut." Available at
http://www.ers.usda.gov/data-products/state-fact-sheets/state-data.aspx?StateFIPS=09&StateName=Connecticut 10
U.S. Energy Information Administration State Energy Data System, "Industrial Sector Energy Consumption Estimates, 2009." Available at http://www.eia.gov/state/seds/hf.jsp?incfile=sep_sum/plain_html/sum_btu_ind.html
11 Ibid.
12 Ibid.

2013 Connecticut Comprehensive Energy Strategy
Chapter 2: Industry Sector Strategy
41
FIGURE 5: Connecticut industrial primary energy consumption and expenditure by fuel type, 2010
Electricity accounts for 17% of primary energy used but over half of industry’s energy expenditures; the rest comes from natural gas and oil.
Source: U.S. EIA, Industrial Energy Price and Expenditures Estimates; and U.S. EIA, Industrial Sector Energy Consumption Estimates.
The majority of these fuels are consumed in the manufacturing subsector, which is responsible for 88% of
industrial sector electricity use.13 Within manufacturing, electricity and natural gas consumption varies across
different subsectors, depending on the size of the subsector and the energy intensity of the manufacturing
processes. Manufacturing aerospace parts and transportation equipment, along with the fabricated metals
needed for those parts, are two of the state‘s biggest manufacturing businesses, and also some of the largest
consumers of electricity (Table 2).
13
Microsoft Excel file shared with Connecticut Department of Energy and Environmental Protection. April, 2012; Connecticut Department of Labor, "Employment & Wages by Industry - Quarterly Census of Employment and Wages - State of Connecticut." Available at http://www1.ctdol.state.ct.us/lmi/202_minorareas_lma.asp.; and U.S. Department of Commerce Bureau of Economic Analysis, "Advance 2011 and Revised 1997–2010 GDP-by-State Statistics." Available at http://www.bea.gov/newsreleases/regional/gdp_state/2012/pdf/gsp0612.pdf.

2013 Connecticut Comprehensive Energy Strategy
Chapter 2: Industry Sector Strategy
42
TABLE 2: Annual delivered industrial electricity consumption in Connecticut, by sub-sector, 2011
Industry Subsector* Electricity Sales, 2011 (GWh)
Number of Facilities (2011)
% of GSP (2010)
Total Manufacturing 2,375 4,808 10.5
Misc. Manufacturing 478 334 1.0
Fabricated Metals 432 1,259 1.4
Transportation Equipment 236 253 2.4
Chemicals 167 183 1.8
Industrial Machinery 158 497 0.8
Computer and Electronics 153 329 0.8
Food and Beverage 138 351 0.5
Rubber/Plastics 133 181 0.3
Primary Metals 121 78 0.2
Electrical Equip. 98 174 0.7
Printing 91 373 0.2
Paper 55 82 0.2
Non-Metallic Minerals 43 155 0.1
Textiles & Apparel 42 142 0.1
Lumber/Furniture 23 396 0.1
Petroleum/Coal Products 8 n/a 0.1
Construction 288 9,385 2.6
Agriculture 29 368 0.1
Mining 16 61 0.0
Total Industry 2,707 14,622 13.8
Source: Connecticut Light and Power, ―Electricity Sales‖; Connecticut Department of Labor, Quarterly Census; and U.S. BEA, Gross Domestic Product by State. *Sales data does not include municipal utilities, which account for 6% of electricity sales in the state.
Connecticut‘s paper and primary metals industries are a relatively small percentage of GSP, but papermaking
and metal forming are energy-intensive processes. As a consequence, paper and metal forming subsectors are
the state‘s largest consumers of natural gas, accounting for over 60% of total manufacturing natural gas use.14
Construction (which includes residential and commercial new construction plus significant remodels) comes
in second as the largest user of energy within the industry sector, accounting for about a fifth of the total
energy used by industry. The State has already begun to address the end products of construction — for
example, imposing requirements that large State-funded buildings meet rigorous ―green building‖ standards,
and establishing a tax credit for comparable privately-developed green buildings. But the construction process
itself, and specifically the energy use related to it, are concerns that this Strategy seeks to address more fully
14
KEMA, "Connecticut Natural Gas Commercial and Industrial Energy-Efficiency Potential Study.‖ Available at http://energizect.com/sites/default/files/CTNGPotential090508FINAL.pdf

2013 Connecticut Comprehensive Energy Strategy
Chapter 2: Industry Sector Strategy
43
than has been done to date. Although construction has lagged somewhat in recent years due to the economic
downturn, this Strategy recommends addressing the numerous opportunities for improvement in this
subsector.
Data centers are another large electricity user in the state. Though national and state statistics do not track
their energy use as a separate sector, one researcher has estimated that data centers consume 2% of U.S.
electricity. If replicated in Connecticut‘s growing data center industry, this industry would be the second
largest industrial consumer of electricity in the state.15 In many ways, data centers can be considered an
industrial process (producing information technology from energy inputs), but since most data centers are
housed within commercial buildings, they also have some commonalities with other buildings in the
commercial sector. Because of the way they cut across sectors, data centers are not easily classified, but their
large and growing energy use — as well as their need for high quality reliable power — merits developing
policies aimed specifically at improving their efficiency. Data centers are also prime targets for expansion and
addition of distributed generation and microgrid capacity in the state.
Within the industrial sector, different subsectors utilize energy for different purposes (Figure 6). Half of the
energy used in industry powers the equipment used in industrial processes, from compressed air to motors,
pumps, boilers and dryers. This is a low percentage for energy use in industrial processes compared to other
states which is an indicator that Connecticut‘s mix of manufacturing is not very energy-intensive. Heating and
cooling the buildings that house these processes account for nearly one quarter of the sector‘s energy use. The
remaining portion powers lighting and fuels CHP systems, and transport equipment.
15
Koomey, Jonathan G. Analytics Press, "Growth in Data Center Electricity Use 2005-2010." Available at http://www.mediafire.com/file/zzqna34282frr2f/koomeydatacenterelectuse2011finalversion.pdf.

2013 Connecticut Comprehensive Energy Strategy
Chapter 2: Industry Sector Strategy
44
FIGURE 6: Connecticut industrial delivered energy consumption by end use, 2010
Source: U.S. EIA, Industrial Sector Energy Consumption; KEMA, Electric Efficiency Study; and KEMA, Natural Gas Efficiency Study.
Industrial Sector Energy Costs
In 2010, the latest year for which data are available, the industrial sector spent $1.1 billion on energy, 7% of
the state‘s total energy expenditures.16 Electricity is responsible for over half of this expenditure, even though
it represents only 24% of delivered energy. One reason industrial electricity costs are a high percentage of
total costs is that wholesale electricity prices in New England are relatively high.17,18 But note that despite high
electricity rates, Connecticut‘s average electricity bills for industrial consumers rank twenty-fifth in the
country both because of investments in efficiency and the sector‘s mix of less energy intensive industries
relative to other states.19 The good news for industrial customers, as shown in Figure 3, is that Connecticut‘s
overall electricity rates are dropping rapidly (17% since January 2009), largely due to recent declines in
natural gas prices, which forecasters suggest will continue to stay low for the next several years.20
Natural gas use accounts for 22% of total costs in the industrial sector. Although Connecticut‘s industrial
natural gas prices are also high compared to other regions, they are lower than prices in other states within
16
U.S. Energy Information Administration, "State Energy Price and Expenditure Estimates 1970-2010." Available at http://www.eia.gov/state/seds/sep_prices/notes/pr_print.pdf.
17 U.S. Energy Information Administration, "Electric Power Monthly March 2012." Available at www.eia.gov/electricity/monthly/current_year/march2012.pdf.
18 U.S. Energy Information Administration, "Industrial Average Monthly Bill by Census Division, and State." Available at http://www.eia.gov/electricity/sales_revenue_price/pdf/table5_c.pdf.
19 U.S. Energy Information Administration, "Electricity Monthly Update April 2012." Available at http://www.eia.gov/electricity/monthly/update/archive/april2012/.
20 U.S. Energy Information Administration, "Electric Power Monthly January 2011." Available at http://www.eia.gov/ftproot/electricity/epm/02261101.pdf.
7
3
1 1
15
3
3 3
3
7
0
5
10
15
20
25
Process HVAC Transportation Other CHP Lighting
Tri
llio
n B
TU
Oil
Elec-tricity
Natural gas
Percent of total:
48% 21% 3% 7% 14% 7%

2013 Connecticut Comprehensive Energy Strategy
Chapter 2: Industry Sector Strategy
45
New England and the Northeast.21 Natural gas prices, therefore, provide Connecticut with a regional
competitive advantage.
Oil accounts for the remaining 27% of the industrial sector‘s energy costs. Oil prices in real terms have nearly
tripled since 2004 (Figure 7).22 Like natural gas prices, oil prices show regional and state-by-state variation
due to differing transportation costs and infrastructure constraints that can restrict supply. But, recent oil
price increases and volatility have had a much larger impact on costs than regional price differences. The U.S.
Energy Information Administration‘s (EIA) forecast of high oil prices means that even electric resistance
heating, traditionally the highest cost form of heat, will compete on cost with oil heat within three years.
Neither oil nor electric heat is likely to match the cost-effectiveness of natural gas over the next ten to twenty
years though.
FIGURE 7: Electricity, natural gas and oil industrial prices, Connecticut historical and New England forecast
Source: U.S. EIA, Industrial Energy Price and Expenditures; and U.S. EIA, Annual Energy Outlook 2012.
As a percentage of total operating costs, total energy costs vary across manufacturing sub-sectors, but on
average represent a small percentage of total operating costs. Designing and fabricating a jet turbine blade or
a gene sequencer requires far less energy than making raw steel in giant blast furnaces, for instance. Within
common manufacturing subsectors in Connecticut, energy costs range from 1% of total costs for aircraft
engine manufacturing to 16% for paper mills. Across all of Connecticut‘s manufacturers, energy averages 2.3%
21
U.S. Energy Information Administration, "Natural Gas Prices: Connecticut." Available at http://www.eia.gov/dnav/ng/ng_pri_sum_dcu_SCT_m.htm.
22 U.S. Energy Information Administration, "State Energy Price and Expenditure Estimates 1970-2010." Available at http://www.eia.gov/state/seds/sep_prices/notes/pr_print.pdf.
0
5
10
15
20
25
30
35
40
45
50
1990 1995 2000 2005 2010 2015 2020 2025 2030 2035
20
12
$ p
er
mill
ion
BT
U
New England forecast Connecticut historical data
Natural gas
Oil
Electricity

2013 Connecticut Comprehensive Energy Strategy
Chapter 2: Industry Sector Strategy
46
of total costs (Figure 8). This number is in line with states like Massachusetts (2.4%), which has a similar mix
of non-energy-intensive industries, but much lower than a state like Maine (6.6%), with its large, energy-
intensive pulp and paper industry.23
FIGURE 8: Manufacturing expenditures by category, Connecticut average and U.S. by sub-sector, 2010
Source: U.S. BEA, Annual Survey of Manufacturers; and NBER-CES Manufacturing Industry Database.
While energy costs at manufacturing firms are a minor component of overall costs, profit margins for a typical
manufacturing company are slim (often about 6–8% of revenues), and competition is fierce.24 Selling an extra
$100 of products will increase net profits by only $6 to $8. Cutting energy costs by $100, however, drops
straight to the bottom line. That extra money can be used to hire more workers, or to invest in innovation and
new products. An effective industrial energy strategy for Connecticut must improve economic competitiveness
by bringing down the cost of energy supplied to the industrial sector by increasing the efficiency of industrial
energy consumption and by using the least expensive energy resources.
Cheaper and Cleaner Energy Opportunities for Industry
This Strategy proposes six approaches to help Connecticut‘s industrial companies use less energy and develop
cheaper energy sources. These include: (1) reducing electricity rates, (2) expanding energy efficiency
23
U.S. Department of Commerce, Bureau of Economic Analysis, Annual Survey of Manufacturers. Available at http://www.census.gov/manufacturing/asm/; and NBER-CES Manufacturing Industry Database. Available at http://www.nber.org/data/nbprod2005.html.
24 Yahoo Finance, ―Industry Browser - Industrial Goods Sector - Industry List.‖ Available at: http://biz.yahoo.com/p/6conameu.html.
Labor
Capital exp.
Energy Other
$0
$5
$10
$15
$20
$25
$30
$35
$40
2010
Bill
ion
201
2$
66%
28%
3.4%
2.3% 2.4%
Sub-sector Energy costs
Aircraft engine manufacturing
1.2%
Hand tool manufacturing 2.3%
Paper manufacturing 1.3–4.2%
Metal forging 5.3%
Pulp/paper/newsprint/paperboard mills
9.9–15.9% Materials
CT manufacturing US manufacturing

2013 Connecticut Comprehensive Energy Strategy
Chapter 2: Industry Sector Strategy
47
programs, (3) encouraging fuel switching to cheaper and cleaner sources, (4) promoting CHP systems, (5)
addressing the significant role that water plays in energy production and use, and (6) launching an advanced
energy innovation hub at the University of Connecticut. These strategies will reduce energy costs today, help
keep them stable in the future, improve the industrial sector‘s competitiveness, spur innovation and reduce
the environmental impacts of the sector‘s energy use. Although Chapter 1 (Efficiency) and Chapter 3
(Electricity) provide a broader discussion of some of these recommendations, the discussion below focuses on
how these strategies could benefit the industrial sector.
Reduce Electricity Rates
Creating policies that ensure that electricity costs continue to decrease for industrial customers will provide
large positive economic benefits to the state. While the general strategies and rationale for reducing electricity
rates and costs are covered in Chapter 3 (Electricity), it is important that these strategies also be structured to
ensure that the state‘s industrial customers enjoy the benefits of falling electricity prices. One industry-
specific opportunity to reduce rates is fully within the control of industrial consumers. Any industrial
customers served by the utilities through the standard service would currently see decreases in their electricity
costs if they switched to using a competitive retail electric supplier. More than 90% of large industrial
customers have switched off of the standard offer and are now paying anywhere between 5 and 14 ¢/kWh for
electric generation. This significant price range is due in part to the fact that some companies locked into
long-term contracts at a time when electric generation rates were higher than they are today. Many firms will
have an opportunity over the next year or two to purchase power from less expensive electric retail suppliers.25
Expand Energy Efficiency Programs for Industrial Customers
One of the cheapest, most cost-effective ways to reduce industrial energy costs is by improving efficiency. This
means not only investing in process efficiency for manufacturers, but also total system efficiency. Upfront
investment in efficient equipment or streamlined manufacturing practices typically pays back within a few
years, and the investment then continues to bring savings over the equipment‘s useful life.
Despite the often short payback periods offered by efficiency investments, there are still many barriers to
investing in efficiency. For example, companies may not have the in-house expertise to spot efficiency
opportunities. Also, efficiency improvements must compete with other investment opportunities for scarce
capital. The primary rationale for establishing Connecticut‘s energy efficiency programs was to provide
incentives and expertise that could help overcome these barriers. Annual funding for commercial and
industrial electric efficiency programs has averaged $49 million since 2003 (Figure 9).26 This efficiency
25
A complete listing of the generation rates currently offered by Connecticut licensed competitive suppliers is maintained as part of the Energize Connecticut initiative at http://www.energizect.com/compare-energy-suppliers/
26 The Connecticut Light and Power Company, et al., ―2012 Electric and Natural Gas Conservation and Load Management Plan.‖ Available at http://www.energizect.com/sites/default/files/2012%20CLM%20Electric%20and%20Gas%20Plan%20FINAL.pdf.

2013 Connecticut Comprehensive Energy Strategy
Chapter 2: Industry Sector Strategy
48
funding has yielded large reductions in energy use that have brought down costs and created significant
environmental and public health benefits. In 2011 alone, industrial efficiency programs reduced electricity use
by 300 megawatt-hours and natural gas use by 186,157 million cubic feet (MCF).
FIGURE 9: Annual spending (pre 2011) and budget (2011-12) for commercial and industrial electric energy efficiency programs
Source: 2012 Conservation and Load Management Plan.
There is also a substantial opportunity to further increase natural gas and electric savings. According to 2011
data, Connecticut‘s energy efficiency programs have helped customers save 41 gigawatt-hours in electricity
and 3 MCF of natural gas. However, these savings represent less than half of the potential cost-effective
efficiency gains in electricity and only one-eighth of those in natural gas available in that year (Figure 10).27
27
Northeast Utilities, "Energy Efficiency Programs 2011." Available at http://www.nu.com/responsible_energy/our-business/Energy-Efficiency-Programs-2011.html; KEMA, "Connecticut Natural Gas Commercial and Industrial Energy-Efficiency Potential Study.‖ Available at http://energizect.com/sites/default/files/CTNGPotential090508FINAL.pdf; and KEMA, Electric Efficiency Study. Available at http://energizect.com/sites/default/files/CTElectricEEReport05032010FinalKEMAf2.doc.
$28 M
$43 M
$48 M
$39 M
$65 M
$74 M
$36 M
$55 M $57 M
$46 M
$0
$10
$20
$30
$40
$50
$60
$70
$80
2003 2004 2005 2006 2007 2008 2009 2010 2011 2012
Mili
on
20
12
$
Avg. = $49 M
Actu
al sp
en
din
g
201
2 C
&L
M P
lan B
udg
et

2013 Connecticut Comprehensive Energy Strategy
Chapter 2: Industry Sector Strategy
49
FIGURE 10: Efficiency program achieved industrial energy savings for industry compared to potential cost-effective industrial energy savings, 2011
Source: Northeast Utilities, ―2011 Efficiency Program‖; KEMA, Natural Gas Efficiency Study; and KEMA, Electric Efficiency Study.
Achieving these additional savings requires a higher level of program funding as well as additional sources of
funding and financing. The 2012 Integrated Resources Plan (IRP) released by DEEP in June 2012
recommended an increase in funding for Connecticut‘s energy efficiency programs to help achieve all cost-
effective efficiency savings. Fully scaling up the efficiency investment will require a much greater emphasis on
using limited ratepayer funds to leverage private capital.28
While increased funding is essential, some improvements in efficiency program design are also needed to
capture potential cost-effective industrial energy savings. Historically, commercial and industrial
Conservation and Load Management (C&LM) programs have been focused on measures that provide rapid,
low-cost ways to achieve savings, such as installing more efficient lights and upgrading heating, ventilation,
and air conditioning (HVAC) systems. Some companies have now been through two or three rounds of
lighting upgrades, but these measures only achieve a fraction of the possible energy savings. According to 2011
data, lighting measures represent 39% of the savings achieved for electric customers, but only 13% of the
potential savings (Figure 11).29 HVAC programs have also had a significant impact, especially for natural gas
customers. Although HVAC improvements account for 74% of achieved energy savings for natural gas users,
those savings represent only 9%30 of the remaining potential savings for natural gas customers (Figure 12).31
28
For more discussion on this topic, see Chapter 1 (Efficiency). 29
Northeast Utilities, "Energy Efficiency Programs 2011." Available at http://www.nu.com/responsible_energy/our-business/Energy-Efficiency-Programs-2011.html; KEMA, Electric Efficiency Study. Available at http://energizect.com/sites/default/files/CTElectricEEReport05032010FinalKEMAf2.doc.
30 Northeast Utilities, "Energy Efficiency Programs 2011." Available at http://www.nu.com/responsible_energy/our-business/Energy-Efficiency-Programs-2011.html.
3
-
5
10
15
20
25
Potential savings
Actual energy savings
Remaining potential
Mill
ion
cf
41
-
10
20
30
40
50
60
70
80
90
100
Potential savings
Actual energy savings
Remaining potential
GW
h
91
50
23
20
Electric Natural gas

2013 Connecticut Comprehensive Energy Strategy
Chapter 2: Industry Sector Strategy
50
Almost all of the remaining potential savings for industrial customers will come from improving the efficiency
of industrial processes.
FIGURE 11: Electric and natural gas achieved efficiency savings captured compared to available savings by end-use, 2011
The biggest potential for energy savings now comes from improving the efficiency of industrial processes.
Source: Northeast Utilities, ―2011 Efficiency Program‖; and KEMA, Electric Efficiency Study.
31
KEMA, "Connecticut Natural Gas Commercial and Industrial Energy-Efficiency Potential Study.‖ Available at http://energizect.com/sites/default/files/CTNGPotential090508FINAL.pdf; and KEMA, Electric Efficiency Study. Available at http://energizect.com/sites/default/files/CTElectricEEReport05032010FinalKEMAf2.doc.

2013 Connecticut Comprehensive Energy Strategy
Chapter 2: Industry Sector Strategy
51
FIGURE 12: Natural gas efficiency savings captured compared to available potential by end-use, 2011
Source: Northeast Utilities, ―2011 Efficiency Program‖; and KEMA, Natural Gas Efficiency Study.
These process savings have been largely unaddressed for several reasons. First, much of the energy used for
manufacturing processes in Connecticut is consumed by a diverse landscape of companies and types of
products. Realizing process savings on a large scale therefore requires either expertise on many types of
processes, or finding efficiency improvements that can be applied to a variety of common processes and
companies.
Second, as shown in Table 3, nearly all of Connecticut‘s C&LM programs for industrial customers also serve
the commercial sector. As a result, program managers focus on efficiency savings common to both commercial
and industrial customers, which include very little of the process savings found solely in industry. Only 1% of
the proposed 2012 budget for commercial and industrial programs goes exclusively to the industrial sector for
a Process Re-engineering for Increased Manufacturing Efficiency (PRIME program, which concentrates on
energy savings through ―lean‖ manufacturing productivity improvements.32 Expansion of funding for the
PRIME program and implementation of other cost-effective measures directed toward industrial processes
offer significant opportunities to improve energy efficiency for Connecticut businesses.
32
The Connecticut Light and Power Company, et al., ―2012 Electric and Natural Gas Conservation and Load Management Plan.‖ Available at http://www.energizect.com/sites/default/files/2012%20CLM%20Electric%20and%20Gas%20Plan%20FINAL.pdf.
0%
10%
20%
30%
40%
50%
60%
70%
80%
90%
100%
Savings Potential
Process
HVAC
91%
74%
9%
26%

2013 Connecticut Comprehensive Energy Strategy
Chapter 2: Industry Sector Strategy
52
TABLE 3: Commercial and Industrial efficiency programs and budget, 2012 proposed
C&LM Program Name
Program Description
Proposed Program Budget ‘000s of 2012$)
Eligible Customers
Small Business Energy Advantage
Serves electric customers up to 200-kilowatt and firm gas customers with incentives, turn-key vendor driven solutions and 0% financing options.
$13,868 Commercial & Industrial
Business and Energy Sustainability (formerly O & M)
Focused on capturing energy savings through controls, operational improvements, behavior change and information.
$4,918 Commercial & Industrial
Energy Opportunities A retrofit program providing prescriptive and custom incentives.
$16,249 Commercial & Industrial
Energy Conscious Blueprint
Provides incentives for new construction, major renovations, and equipment replacement at end of life.
$10,889 Commercial & Industrial
PRIME Provides lean manufacturing training to drive energy savings through productivity increases.
$485 Industrial only
Source: 2012 Conservation and Load Management Plan.
Third, the current efficiency program planning and delivery timeframes are not well matched to the time
horizons and risk profiles found in process energy efficiency upgrades. These upgrades generally take longer,
must be timed to match processing line downtime, and carry the risk of slowing or shutting down assembly
lines if equipment fails. These are challenges that lighting and HVAC projects do not face. Those same factors
make process savings difficult to accommodate within the one-year C&LM program planning and budget
approval cycles currently used in Connecticut. The time lags involved in the program approval process and the
historical year-to-year uncertainty about program funding levels also create administrative barriers to
capturing process energy savings from projects that often take over a year to develop and implement. The
proposed 2013 C&LM Plan contains multi-year budget commitments for the distribution of the Connecticut
Energy Efficiency Fund dollars which would improve the performance of many of the Fund‘s programs.
Clean Energy Business Solutions
To support continued economic development and job creation and retention, the Clean Energy Finance and
Investment Authority (CEFIA), working with the Department of Economic and Community Development
(DECD), is launching a Clean Energy Business Solutions program, designed to strategically address energy
cost challenges for existing Connecticut businesses or potential new arrivals. This program will provide
financing to targeted companies of strategic importance for economic development in Connecticut with the
goal of improving a company‘s competitiveness by delivering cleaner, cheaper, and more reliable sources of
energy to their operations. This program will supplement long-standing commercial and industrial efficiency
programs, such as the PRIME, supported by the Connecticut Energy Efficiency Fund (show in Table 3).

2013 Connecticut Comprehensive Energy Strategy
Chapter 2: Industry Sector Strategy
53
Models of Successful Industrial Efficiency Programs from Across the Country
A number of different states have successful efficiency programs targeting industrial subsectors and energy end-uses.
Wisconsin succeeded in capturing savings from the pulp and paper industry only after funding an energy manager to
identify efficiency opportunities. California achieved strong program participation from oil refineries by contracting for a
program administrator knowledgeable in that sector. Connecticut’s industrial sector mix will necessitate a different focus
than those states. Significant opportunities exist in data centers and water/wastewater utilities.
The Pacific Gas & Electric Company (PG&E) has created a High Tech energy efficiency program to serve the many data
centers located in northern California. This approach has allowed PG&E to address the challenges specific to that sector,
including the overarching concern of equipment reliability, the barriers created by the divide between facilities’ staff who
manage data center operations and the IT staff who make equipment purchasing decisions, and the unique nature of data
center efficiency measures. Connecticut’s high concentration of finance and insurance firms, and the prevalence of
dedicated data centers for those sectors, could make this approach a fruitful one for achieving process energy savings in
data centers.
Similarly, the water and wastewater utility sector, which consumes 4% of U.S. electricity, represents a sizeable energy
saving target for efficiency programs. Many of the approaches used to save energy in water systems can also
simultaneously save water, improving the resiliency of water supplies and wastewater treatment systems. Connecticut can
focus its programs on tailored approaches like improving pump efficiency and control, and reducing leaks to achieve
savings from this subsector.
In summary, there is tremendous potential to achieve additional efficiency savings for electric and natural gas
customers in the industrial sector, primarily through expanding the State‘s energy efficiency programs to
serve more customers and expanding opportunities for improving the efficiency of specific industrial
processes. Investing in the expanded efficiency scenario outlined in the 2012 IRP in order to capture all cost-
effective electric, natural gas, and oil savings would reduce energy use in the industrial sector by 7% by 2022
beyond current levels of efficiency capture (Figure 13).33
33
See RMI Vision Model Analysis, discussed in Appendix A (Efficiency & Industry).

2013 Connecticut Comprehensive Energy Strategy
Chapter 2: Industry Sector Strategy
54
FIGURE 13: Industrial energy use in 2012 and 2022 (projected) – base efficiency programs and expanded efficiency programs
Investing in all cost-effective electric, natural gas, and oil efficiency (expanded efficiency) can keep energy use flat in 2022 from today and reduce use 7% compared to base efficiency savings. No fuel switching is assumed.
Source: RMI Vision Model Analysis, discussed in Appendix A (Efficiency & Industry).
Energy efficiency must be understood to be an investment — with the funds expended paying savings back
over time. Cumulative industrial energy efficiency investments of $600 million over the next decade would
generate present value savings of $1 billion by 2022, for a $400 million net savings over this period.34 Because
efficiency savings accumulate over time, this efficiency investment would take six years to return annual
savings in excess of the annual investment, but would bring increasing net benefits in each successive year.35
Fuel-Switching Opportunities for Industry
Industrial companies in Connecticut use 12 trillion BTUs of fuel oil. More than 70% of that oil is used for
heating warehouses, factories, greenhouses, and other facilities.36 The high price of oil in recent years means
that Connecticut companies on average spend 27% of their energy budget on oil, even though oil provides only
16% of their energy.37 Historically, oil and natural gas prices have moved in tandem, since natural gas
34
See RMI Vision Model Analysis, discussed in Appendix A (Efficiency & Industry). 35
Cumulative efficiency program and customer costs and cumulative customer energy cost savings, each discounted at 5% back to the present value.
36 U.S. Energy Information Administration State Energy Data System, Industrial Sector Energy Consumption Estimates, 2009." Available at http://www.eia.gov/state/seds/hf.jsp?incfile=sep_sum/plain_html/sum_btu_ind.html.
37 U.S. Energy Information Administration, "State Energy Price and Expenditure Estimates 1970-2010." Available at http://www.eia.gov/state/seds/sep_prices/notes/pr_print.pdf.

2013 Connecticut Comprehensive Energy Strategy
Chapter 2: Industry Sector Strategy
55
production was typically a byproduct of oil production. As detailed in Chapter 4 (Natural Gas), large increases
in shale gas production have caused oil prices to decouple from natural gas prices, and current forecasts
predict prices for natural gas to be comparably lower than oil. Oil that is used for heating could be cost-
effectively replaced by natural gas in locations where this switch is an option.
The average industrial customer using fuel oil spends nearly $40,000 annually to purchase over 1.1 billion
BTUs of heating oil. Delivering the same amount of heat using natural gas would cost less than $9,000
annually at current prices. Switching to gas will, of course, require a large up-front investment, but the
payback time in energy savings on that investment ranges from one to five years.
Replacing oil with natural gas would deliver significant cost and environmental benefits. A transition to
natural gas would reduce SOx emissions by more than 99% and NOx emissions by 29% in Connecticut (Figure
14). On a per unit of energy delivered basis, natural gas provides a 32% reduction in greenhouse gases.
FIGURE 14: Greenhouse gas emissions factors for heating fuels
Source: U.S. EPA, ―State Inventory and Projection Tool.‖
Currently, about 53% of industrial and 35% of commercial businesses have access to natural gas.
As detailed in Chapter 4 (Natural Gas), another 22% of industrial firms and 40% of commercial businesses
could cost-effectively switch to natural gas under current price projections. The volume of fuel used and the
distance away from an existing main determine the targets for a favorable switch to natural gas. If the most
cost-effective customers chose to convert, the cumulative savings to 2022 from those 1,000 customers
0.00
0.01
0.02
0.03
0.04
0.05
0.06
0.07
0.08
0.09
Oil Natural gas Electricity (current fuel mix)
Electricity (80% renewable, 20%
gas)
Biodiesel
Me
tric
to
ns C
O2e
/mill
ion
btu
0.08
0.05
0.03
0.01
0

2013 Connecticut Comprehensive Energy Strategy
Chapter 2: Industry Sector Strategy
56
switching to natural gas amounts to approximately $400 million in present value, or $300 million net. For
more information on this topic, see the Chapter 4 (Natural Gas).38
If the gas system were expanded to connect these additional 1,000 industrial facilities, natural gas would
reach 75% of facilities, leaving a quarter of industry with high-cost fuel oil, propane, or electric resistance as
the most probable heating option.39 The State should target increased efficiency efforts toward these
customers by helping them upgrade to new higher efficiency oil or high efficiency propane heating systems as
well as by continuing to explore energy alternatives, such as ground source heat pumps. Indeed, where natural
gas cannot be made available cost-effectively ground source electric heat pumps, also known as geothermal
heat pumps, might provide a good way to reduce heating costs for some customers.
Strategic use of ground source heat pumps would cost less over the lifetime of the equipment than continuing
to use heating oil.40 If the industrial oil customers not converting to natural gas were to install heat pumps at a
cumulative cost of $40 million, they could reap $100 million in cumulative benefits, or $60 million net by
2022.41 For an industrial company to change from oil to ground source heat pumps, it must overcome the first
cost investment barrier. Innovative financing options would be needed to support these installations.
Financing options targeted at the portion of the market with the most promising economics would grow the
heat pump installation market and help drive down capital costs. While the total cost savings available to
industry from converting to heat pumps from oil are small relative to the other components of this strategy,
heat pumps offer a long-term economic strategy for significant criteria pollutant42 and greenhouse gas
emissions reductions.
Expanding Access to Combined Heat & Power (CHP)
Connecticut‘s industrial sector uses a large amount of energy for heat to dry paper, make chemicals, and run a
myriad of other processes. Traditionally, most of that heat is produced by burning fuel in a boiler. However,
that heat can also be produced by a combined heat and power (CHP) system that burns fuel to produce
38
See RMI Vision Model Analysis, discussed in Appendix A (Efficiency & Industry). This natural gas NPV is based upon a 10-year phased implementation for direct comparison to the expanded efficiency, combined heat and power, and other fuel switching opportunities. The benefits from each annual investment are calculated for twenty years and discounted back to present value. The phased approach provides slightly different costs and benefits than the analysis in the Chapter 4 (Natural Gas), which shows all investment in year one in order to size the overall opportunity without consideration of the implementation period.
39 Connecticut Department of Economic and Community Development. The Economic Impact of Expanding Natural Gas Use in Connecticut. By Stanley McMillen and Nandika Prakash. Hartford, CT, 2011. Available at http://www.ct.gov/deep/lib/deep/energy/decd_nat_gas.pdf
40 See RMI Vision Model Analysis, discussed in Appendix A (Efficiency & Industry).
41 Ibid.
42 Criteria pollutants are according to the Clean Air Act National Ambient Air Quality Standards (see http://www.epa.gov/air/criteria.html) set by EPA for six common air pollutants. These commonly found air pollutants (also known as "criteria pollutants") are found all over the United States. They are particle pollution (often referred to as particulate matter), ground-level ozone, carbon monoxide, sulfur oxides, nitrogen oxides, and lead. See http://www.epa.gov/air/urbanair/.

2013 Connecticut Comprehensive Energy Strategy
Chapter 2: Industry Sector Strategy
57
electricity and useful heat at a lower cost than purchasing both separately. Of the subsectors described earlier,
data centers (whose large computing systems themselves are a source of heat) and water and wastewater
facilities could utilize CHP most effectively.
There are several barriers to realizing the benefits of CHP systems. Industrial firms face a large upfront
investment cost, since an average seven megawatt CHP system costs about $14 million.43 Electric utilities
often charge CHP systems a monthly standby fee to hold electric capacity in reserve for planned or unplanned
CHP system outages. The size and structure of this standby charge can have a large impact on project
economics. Administrative barriers such as lengthy and convoluted interconnection processes and additional
insurance requirements can add cost and uncertainty to a CHP project.
Connecticut has made significant progress reducing many of these barriers. In 2005, the Connecticut General
Assembly directed the former Department of Public Utility Control (DPUC) to set up a grant program to spur
the adoption of CHP, and to remove technical and regulatory barriers that stood in the way of installing these
systems. The DPUC established standardized procedures for connecting CHP to gas lines and to the electricity
grid, reduced the extra charges that utilities typically require for electric backup capacity, and eliminated
natural gas delivery charges. The legislature also authorized grants and low interest loans that significantly
reduced the capital costs of the systems and created a new Class III renewable energy credit for CHP and
efficiency that brings in additional revenue to support these systems. These efforts created a boon to CHP, and
Connecticut industry added 91 megawatts of CHP capacity — more than any state in the region — between
2005 and 2011 (Figure 15).44 That increase in installed CHP capacity increased industrial CHP as a percent of
total statewide electric generating capacity from 1.9% to 2.9%.
43
$2,000 per kilowatt for a 7-megawatt system, the average size of industrial CHP operating in Connecticut. 44
Combined Heat and Power Installation Database. Combined Heat and Power Units located in Connecticut. ICF International and U.S. Department of Energy. Available at http://www.eea-inc.com/chpdata/States/CT.html.

2013 Connecticut Comprehensive Energy Strategy
Chapter 2: Industry Sector Strategy
58
FIGURE 15: Industrial CHP capacity additions and share of total generation capacity, 2005-2011
Source: Combined Heat and Power Database; and U.S. EIA, Existing Capacity.
Connecticut‘s energy policies continue to encourage the adoption of additional CHP capacity. Public Act 11-80
recently reauthorized two CHP incentive programs that are similar to the 2005 grant program. These new
programs are administered by DEEP and CEFIA. The CEFIA CHP program provides up to $450 per kilowatt
for projects up to 5 megawatts, while the DEEP program offers up to $200 per kilowatt for projects up to 1
megawatt. The 2012 IRP recommends that Class III renewable energy credits be revised to focus on CHP
systems and third party energy efficiency projects that do not have a dedicated source of funding.45 DEEP is
launching a comprehensive review of the Renewable Portfolio Standard (RPS) that will include an evaluation
of whether further changes to Class III renewable energy credits are warranted.46
A 2004 study of statewide CHP potential concluded that there is nearly 700 megawatts of technical potential
— meaning that even after counting all CHP systems currently operating, 400 megawatts of technical
potential remain in the industrial sector today (Figure 16).47 Not all of that technical potential is cost-effective,
however. Many individual companies would find that the savings from CHP are insufficient to justify the up-
front investment. Across buildings and industry, only 40% of technical potential is estimated to be cost-
effective.48 If Connecticut industry installed 10 megawatts of CHP annually – less than the pace of installation
45
Connecticut Department of Energy and Environmental Protection, ―2012 Integrated Resource Plan for Connecticut,‖ pp. iii, 21 and 50. Available at http://www.ct.gov/deep/lib/deep/energy/irp/2012_irp.pdf.
46 For more discussion of the DEEP RPS Study, see Chapter 3 (Electricity).
47 Institute for Sustainable Energy, Distributed Generation Market Potential. Available at http://www.easternct.edu/sustainenergy/publication/reports/Report%203-04%20Final%20(3-15).pdf.Technical potential refers to sites that have the characteristics necessary, such as simultaneous demand for electricity and heat, to allow a CHP system to operate.
48 Ibid.
0
10
20
30
40
50
60
70
80
90
100
CT NY MA
MW
1.9%
8.0%
6.9%
2.9%
8.0%
7.0%
0%
1%
2%
3%
4%
5%
6%
7%
8%
9%
CT NY MA
20
05 2
011
Industrial capacity additions
Share of total generation capacity
93
15 19
Pulp
and
paper
Transportation
equipment
Food processing
Chemicals
Other
Food processing
Agriculture
Other
Other
Chemicals
Pulp and
paper

2013 Connecticut Comprehensive Energy Strategy
Chapter 2: Industry Sector Strategy
59
since 2005 – it would result in annual energy cost savings of $87 million.49 Installing CHP at that rate through
2022 would result in 100 megawatts of capacity added and require a cumulative investment of nearly $175
million, resulting in cumulative savings of nearly $475 million, or net savings of over $300 million (present
value).50 There may be further potential to develop multiple-facility CHP projects where a single CHP system
would provide heat and electricity to multiple adjacent facilities that could not economically support
individual CHP systems. Industrial parks are particularly good candidates for this approach.
FIGURE 16: Industrial CHP technical potential
Source: Combined Heat and Power Database; and Institute for Sustainable Energy, Distributed Generation Market Potential.
However, there is some uncertainty about the size of the remaining economic potential and the incentives
needed to capture it. The industrial sector has changed significantly since the State conducted its last CHP
study in 2004. As discussed earlier in this Chapter, the sector has contracted and also shifted in composition;
both changes affect the size of the remaining CHP potential. Natural gas and electricity prices have also
changed markedly since 2004, which also alters CHP system economics. An issue related to increasing the use
of CHP is the degree to which CHP promotion can also benefit Connecticut‘s fuel cell manufacturers and
multiply the benefits to the state‘s economy. Thanks to the help of firms and researchers all over the state, fuel
cells provide users with an increasingly efficient way to capture waste heat. While Connecticut has more than
six years of experience to help guide new CHP program development, it should also follow the example of
many other states and regularly update a CHP potential study in order to better understand, and therefore
target efforts to capture the remaining CHP opportunity. To more fully capture the economic CHP potential,
49
See RMI Vision Model Analysis, discussed in Appendix A (Efficiency & Industry). 50
Ibid.
259
0
100
200
300
400
500
600
700
800
CHP technical potential, 2004 CHP operating, 2012 Remaining CHP technical potential
MW
692
433

2013 Connecticut Comprehensive Energy Strategy
Chapter 2: Industry Sector Strategy
60
the General Assembly should consider allowing larger projects to participate in the DEEP CHP program, as
well as flexibility to offer larger grants if participation is low and such grants are in the interest of ratepayers.
Addressing the Special Relationship between Energy and Water
The interface between energy and water crosses so many sectors that it is difficult to fit a discussion of the
relationships, challenges, and opportunities in these areas entirely into this Chapter. The water industry itself
includes public and private water companies that maintain water sources, treatment facilities, and delivery
infrastructure and the wastewater treatment plants that collect, treat and discharge the water after its use.
New drinking water regulations also require the use of more energy-intensive treatment technologies. Water
is heavy (weighing 8.3 pounds per gallon), and pumping, extracting, treating, conveying and discharging it
through its use cycle require enormous amounts of energy. A 2009 EPA report on water utilities found that
globally, water utilities‘ biggest cost is energy, and that those costs can represent as much as 65% of a utility‘s
annual budget.51 As a result, the rewards for reducing those costs through efficiency process and motor
upgrades are large in terms of a water utility‘s overall economics. Conserving water means pumping less of it,
thereby saving energy. Similarly, using less hot water and heating it more efficiently also saves energy.52
Water and wastewater utilities seeking to make water efficiency upgrades face many of the same barriers that
other industries must overcome to implement energy efficiency measures, such as: availability of capital for
up-front investments; operational challenges and understanding; and regulatory practices that can provide a
disincentive to conserve or that do not adequately support infrastructure improvements that would save water
and energy. Numerous reports indicate that frequently 10-20% of water extracted from a source never reaches
an end user and in some instances the losses are much higher. 53,54
EPA has set a water industry goal of no more than 10%, for what is termed unaccounted-for-water. Reductions
in losses will yield a commensurate reduction in the energy used to extract, treat, and convey that water to the
point that it is lost. Water is also essential to producing most of the electricity generation in Connecticut that
in turn powers all that pumping, treating, and heating of water. Natural gas-fired boilers and combined cycle
power plant systems require water for cooling, and water is heated to make steam to run the turbines to
generate electricity. A 2005 U.S. Geological Survey report found that thermoelectric production accounts for
51
U.S. Environmental Protection Agency, ―Drinking Water Infrastructure Needs Survey and Assessment: Fourth Report to Congress.‖ Available at http://water.epa.gov/infrastructure/drinkingwater/dwns/upload/2009_03_26_needssurvey_2007_report_needssurvey_2007.pdf. 2009b. ―U.S. Water Utilities: Market Overview.‖ March 2010. DWSRF Annual Allotments, available at http://water.epa.gov/grants_funding/dwsrf/allotments/.
52 U.S. Environmental Protection Agency, ―Using Water Efficiently: Ideas for Utilities.‖ Available at http://epa.gov/watersense/pubs/utilities.html
53 National Drinking Water Clearing House. Available at http://www.nesc.wvu.edu/ndwc/pdf/ot/tb/tb_leakdetection.pdf
54 Allan Lambert, International Water Data Comparisons Ltd, UK, Dale Huntington, Huntington & Associates, Fallbrook State, California Timothy G. Brown, Heath Consultants Incorporated, Houston, Texas. Available at http://www.findmoreleaks.com/downloads/AOL_Paper_061.pdf. Paper presented at the AWWA Distribution Systems Symposium, New Orleans, September 2000.

2013 Connecticut Comprehensive Energy Strategy
Chapter 2: Industry Sector Strategy
61
about 40% of the freshwater withdrawals in the United States, and, while most of that water is returned, the
transfers consume significant amounts of energy.
In addition to the significant energy and economic savings that could be realized through water utility
efficiency upgrades and conservation, there are important environmental benefits. Connecticut recently
adopted stream flow regulations that impose increasingly stringent requirements on the amount of water that
utilities may withdraw in order to meet customer demand. These limitations aim to ensure the aquatic health
of the state‘s surface water resources and because groundwater supplies are integrally related to surface water,
reducing these withdrawals also helps support adequate levels in surface waters. Changing weather patterns
that have resulted in more serious droughts, combined with the increased demand for water to serve growing
populations, irrigate crops and provide cooling for power generation and industry, are making it increasingly
difficult for much of the country and world to meet those needs. Connecticut is fortunate to have good water
resources that, if well managed, can provide for future needs and would favorably position the state in
comparison to other regions of the country as their resources become even more severely challenged. Hence,
taking the steps recommended in this Strategy to conserve and protect the state‘s water resources will have
economic as well as public health and environmental benefits.
DEEP has jurisdiction over two of the three major categories of regulation relating to water resources and
shares jurisdiction over the third with the Department of Public Health. Specifically, DEEP‘s Environmental
Quality branch regulates the quality and quantity of the water resource itself in order to protect public health
and aquatic habitat as well as coastal and inland wetlands. PURA establishes customer rates and assigns other
responsibilities to the regulated investor-owned water utilities that serve about a third of the state‘s
customers. While municipal and quasi-public water authorities are not regulated by PURA, additional
efficiency investments by these entities will be important to achieving the benefits outlined in this Chapter on
a statewide basis. It is also worth noting that municipal water and wastewater utilities are usually the
municipalities‘ largest consumers of water. Therefore, conservation and efficiency improvements can reduce a
municipality‘s energy costs, saving them money that can then be used to meet other critical needs.
Industry Sector Strategy: Recommendations
By focusing on the six key areas described above, the State can help the industrial sector save energy and
money, create jobs, improve competitiveness, boost the overall economy, and cut criteria pollutants and
greenhouse gas emissions.

2013 Connecticut Comprehensive Energy Strategy
Chapter 2: Industry Sector Strategy
62
1. Continue Efforts to Reduce Electricity Rates and Costs
As discussed above and in Chapter 3 (Electricity), DEEP will, in coordination with the utilities and others,
continue to work to reduce electricity rates and bills for industrial consumers. Specifically, DEEP plans to (a)
propose expanded efficiency funding as required to achieve all cost-effective efficiency savings; and (b) ensure
that industrial customers who are not currently being served by competitive suppliers are informed of the
potential savings they could achieve.
2. Reconfigure Energy Efficiency Programs to Meet the Needs of Industry
The State should expand funding for efficiency programs and adopt multi-year program plans that meet the
time horizons needed for most industries, so as to capture all cost-effective savings. Additional efficiency
program funding should, in part be dedicated to developing additional programs to capture process energy
savings that are tailored to the needs of specific industries including, but not limited to, data processing
centers, water utilities, agriculture, construction, and manufacturing processes. Energy efficiency program
delivery has typically addressed commercial and industrial customers as a single customer class. Expanding
the PRIME program, which is aimed squarely at improving industrial processes, will be a first priority.
Administering other commercial and industrial programs will require a tailored approach in program design,
customer engagement, and program incentives to address specific needs of different types of industrial
customers.
3. Enable Fuel Switching to Cheaper and Cleaner Fuels
As Chapter 4 (Natural Gas) proposes, the State should advance opportunities for commercial and industrial
customers on existing gas mains to switch to natural gas. DEEP further proposes that the utilities be
authorized to extend the system to those ―off main‖ facilities where the cost benefit of conversion creates a
positive return. With respect to industrial customers, Chapter 4 (Natural Gas) recommends a focus on
converting on-main or near-main customers as well as extending the gas main infrastructure to potential new
commercial and industry customers as a way to ensure fuel choice and business competitiveness. In addition
to the recommendations in Chapter 4 (Natural Gas), Connecticut‘s gas companies should look for
opportunities to combine off-main extension projects with CHP projects. Installation of CHP may make main
extension projects more economically feasible from the customer‘s perspective.
This Strategy also recommends special consideration be given to expanded fuel cell applications insofar as
they provide a potential triple benefit: offering clean energy (including heat) for customers, promoting
reliability as they can operate in island mode during power outages, and enhancing the State‘s capacity for
economic growth to the extent that in-state fuel cell manufacturers compete successfully for new projects.
4. Remove Known Barriers and Refine Combined Heat & Power Strategy to Capture Remaining Potential
DEEP recommends that in order to more fully capture the economic CHP potential, legislative changes should
be considered that would allow larger projects to participate in the DEEP program and provide flexibility to
2013 Connecticut Comprehensive Energy Strategy
Chapter 2: Industry Sector Strategy
63
offer larger grants if participation is low and such grants are cost-effective and in the interest of ratepayers.
Furthermore, as described in Chapter 3 (Electricity), a review of current submetering and net metering laws is
needed, and should include any changes necessary to encourage CHP development. DEEP will also update its
assessment of current CHP potential to understand how much is economic and to ensure that programs
address other barriers to realizing that potential.
5. Encourage Water Conservation
This Strategy makes three recommendations related to water and wastewater utilities, focused on promoting
efficiency and conservation, which in turn leads to a reduction in energy use.
First, the Strategy recommends that PURA establish water rates that encourage, rather than penalize, water
utilities for promoting and achieving conservation. Current rates are largely established on a per-gallon basis,
which means that working to help customers conserve and thereby reduce a water company‘s withdrawals (in
accordance with the stream flow regulations), lowers the utility‘s sales and hence the revenues needed to
sustain the infrastructure and business. Beyond helping ensure adequate supply levels in the state‘s water
bodies, water conservation reduces costs, conserves energy and helps ensure the State‘s valuable water assets
for future generations.
Second, the State should expand the Water Infrastructure Conservation Adjustment (WICA) surcharge
mechanism, authorized by the legislature in 2007 from 5% to 10% to better provide support for water utilities
to repair and replace an aging water infrastructure. Many of the state‘s water pipes are over 100 years old,
and in 2007 it was estimated that at the time the WICA charge was being considered the Connecticut Water
Planning Council estimated that it would take 240 years to completely replace the aging system.55 The age of
the state‘s water main infrastructure is evidenced by the increasing frequency of water main breaks which
result in service disruption for customers, often create traffic problems, and increase utility costs to cover one
or more of the following: digging under streets and then repaving, overtime wages, and frequently providing
potable water to customers during the disruption.
Water companies should also work with the Energy Efficiency Board to plan and implement water
conservation programs that are coordinated with the gas and electric conservation programs and funded, in
part, through water rates. The gas and electric utilities should enable the regional and municipal water
companies to participate in their efficiency programs on the same basis as private, regulated water companies.
Third, C&LM plans submitted by the electric and natural gas distribution companies should be revised to
include water conservation measures in general, rather than just those that reduce energy use related to
55
Water Planning Council Advisory Group, ―Final Report of the Water Infrastructure Workgroup.‖ Available at http://www.dpuc.state.ct.us/DPUCINFO.nsf/4d7534dff7a2413c85256b7500697b32/ab12750098cf99ca85257352003e27bf?OpenDocument

2013 Connecticut Comprehensive Energy Strategy
Chapter 2: Industry Sector Strategy
64
heating water. As noted above, the plans should also include specific efficiency programs for water and
wastewater utilities and agricultural uses.
6. Launch an Advanced Energy Innovation Hub
DEEP and the University of Connecticut (under the leadership of the Engineering Department) are poised to
launch an Advanced Energy Innovation Hub at UConn‘s new Tech Park, which will aim to develop
breakthrough energy technologies. Initial research efforts will focus on: (1) fuel cells, (2) microgrid
engineering, (3) batteries and storage (building off of the University‘s leading role in advanced materials), and
(4) small-scale hydropower. DEEP is providing a portion of the funding for an initial period of four years. The
University will match this support and has partnered with the Fraunhofer Institute, which is providing
additional funding. DECD will facilitate these efforts by providing further support aimed at commercialization
of technology breakthroughs that emerge.
An additional recommendation is to ensure more consistent collaboration between the research arm of the
University of Connecticut and other government partners so as to develop strategies and provide assistance
that will address the large-scale needs of industry and support clean technology development and
manufacturing in the state. Some of the world‘s leading experts conduct research at the University‘s Center for
Clean Energy Engineering, focusing on fuels and fuel processing, advanced energy conversion, energy storage,
smart grids, and renewable energy, among other areas. DEEP and DECD will engage with these experts, as
well as others in different university units, to further involve them in the discussion about advancing the
state‘s clean energy future.
Further Actions
Implementation of these six recommendations will reduce the cost of energy for industry, helping to realize
the vision of a more efficient and competitive industrial sector that will, in turn, strengthen the state‘s
economy. These recommendations simultaneously provide significant greenhouse gas and criteria pollutant
emission reductions, lessening the public health and climate impacts associated with those emissions.
Going forward, it is in the state‘s interest to further explore how distributed generation (DG) and microgrids
could benefit industrial customers in addition to other facilities. As discussed in detail Chapter 3 (Electricity),
the State is already at work on developing a pilot DG and microgrid program to ensure that critical facilities,
such as hospitals, wastewater treatment plants, emergency centers, and prisons have power during outage
events. Such microgrids could also be used for private entities to ensure reliability for industry, ensure that
data centers remain operational, aerospace parts can be manufactured, and crops can be processed even when
the grid loses power.
The recommendations in this Chapter are ambitious and when implemented will dramatically improve the
economics and environmental impact of energy use within this sector, but this Strategy also recognizes that
additional measures will be needed to meet the State‘s long term energy and environmental goals.

2013 Connecticut Comprehensive Energy Strategy
Chapter 2: Industry Sector Strategy
65
Conclusion
Connecticut can strengthen its industrial sector through energy efficiency and the use of cleaner supplies of
energy. The largest and lowest risk opportunity is through investing in efficiency. Efficiency is the lowest cost
alternative to new energy supply, and there are very few plausible scenarios that would turn this investment
negative. Similarly, investing in additional CHP capacity brings strong economic benefits to industry, but the
costs of incentives and other public support needed to capture it must be evaluated relative to the benefits it
provides. Encouraging fuel switching may also help industrial customers reduce their energy bills, making
businesses more competitive, providing significant additional economic and environmental benefits to the
citizens of Connecticut.
Seizing the opportunities outlined in this industrial sector strategy will boost the profits and competitiveness
of thousands of companies and construction and agricultural operations. It will preserve and grow
Connecticut‘s vital industrial base by making the state more attractive as an industrial location. It will create
jobs, keep more dollars in state, and improve the state‘s economy. It will also improve air quality and reduce
greenhouse gas emissions. These efforts are essential elements of the Governor‘s vision of a cheaper, cleaner,
and more reliable energy future for an economically prosperous state.

2013 Connecticut Comprehensive Energy Strategy
Chapter 2: Industry Sector Strategy
66
Bibliography
Assessment for Conservation and Load Management Programs. Disbursement of Funds Raised Pursuant to
Financing Orders. Establishment of Energy Conservation and Load Management Fund. Energy
Conservation Management Board. 2011. General Statutes of Connecticut. Chap. 283, §16-245m.
Combined Heat and Power Installation Database. Combined Heat and Power Units located in Connecticut.
ICF International and U.S. Department of Energy. http://www.eea-inc.com/chpdata/States/CT.html.
(accessed July 21, 2012).
Connecticut Center for Advanced Technology, Hydrogen and Fuel Cell Industry Development Plan. 2012.
http://neesc.org/uploads/documents/CT_H2_Dev_Plan_041012.pdf.
Connecticut Department of Economic and Community Development. Connecticut Economic Strategic Plan
2009. Hartford, CT, 2009. http://www.ct.gov/edc/lib/ecd/connecticut_esp-final.pdf.
Connecticut Department of Economic and Community Development. The Economic Impact of Expanding
Natural Gas Use in Connecticut. By Stanley McMillen and Nandika Prakash. Hartford, CT, 2011.
http://www.ct.gov/deep/lib/deep/energy/decd_nat_gas.pdf
Connecticut Department of Energy and Environmental Protection. 2012 Integrated Resource Plan for
Connecticut. New Britain, CT, 2012. http://www.ct.gov/deep/lib/deep/energy/irp/2012_irp.pdf.
———. Public Utilities Regulatory Authority (PURA). 2012 Electric and Natural Gas Conservation and Load
Management Plan. By The Connecticut Light and Power Company, The United Illuminating
Company, Yankee Gas Services Company, Connecticut Natural Gas Corporation, and Southern
Connecticut Gas Company. PURA Docket 11-10-03. New Britain, CT, 2011.
http://www.ct.gov/pura/docketsearch.
Connecticut Department of Labor. Quarterly Census of Employment and Wages. Wethersfield, CT, 2011.
http://www1.ctdol.state.ct.us/lmi/202/202_annualaverage.asp
Connecticut Energy Efficiency Fund. 2001 Report of the Energy Efficiency Board. New Britain, CT:
Connecticut Energy Efficiency Fund, 2002. http://energizect.com/sites/default/files/ALR2002.pdf.
———. 2011 Report of the Energy Efficiency Board. New Britain, CT: Connecticut Energy Efficiency Fund,
2012. http://www.energizect.com/sites/default/files/Final%202012%20ALR%2020120301.pdf.
Connecticut Light and Power and United Illuminating. ―2011 Electricity Sales by NAICS Code.‖ Microsoft
Excel file shared with Connecticut Department of Energy and Environmental Protection. April, 2012.
Energy and Environmental Analysis. Introduction to CHP Technologies. Washington DC: U.S. Environmental
Protection Agency Combined Heat and Power Partnership, 2008.
http://www.epa.gov/chp/documents/catalog_chptech_full.pdf

2013 Connecticut Comprehensive Energy Strategy
Chapter 2: Industry Sector Strategy
67
Electric Power Research Institute. Water & Sustainability. Vol. 4, U.S. Electricity Consumption for Water
Supply & Treatment – The Next Half Century. Palo Alto, CA: Electric Power Research Institute, 2000.
http://www.rivernetwork.org/resource-library/water-sustainability-volume-4-us-electricity-
consumption-water-supply-and-treatment
GDS Associates, Inc. Massachusetts Natural Gas Energy Efficiency Potential Study for Residential Sector.
Marietta, GA: GDS Associates, Inc., 2009. http://www.ma-eeac.org/docs/PAcites/GDS_Report.pdf
———. Vermont Energy Efficiency Potential Study for Oil, Propane, Kerosene, and Wood Fuels. Marietta, GA:
GDS Associates, Inc., 2007. http://publicservice.vermont.gov/pub/other/allfuelstudyfinalreport.pdf
Institute for Sustainable Energy. Distributed Generation Market Potential: 2004 Update / Connecticut and
Southwest Connecticut. Willimantic, CT: Eastern Connecticut State University, 2004.
http://www.easternct.edu/sustainenergy/publication/reports/Report%203-04%20Final%20(3-
15).pdf.
KEMA. Connecticut Electric Residential, Commercial, and Industrial Energy-Efficiency Potential Study.
Burlington, MA: KEMA, 2010.
http://energizect.com/sites/default/files/CTElectricEEReport05032010FinalKEMAf2.doc.
———. Connecticut Natural Gas Commercial and Industrial Energy-Efficiency Potential Study. Burlington,
MA: KEMA, 2009. http://energizect.com/sites/default/files/CTNGPotential090508FINAL.pdf.
Koomey, Jonathan. Growth in Data Center Electricity Use 2005 to 2010. Oakland, CA: Analytics Press, 2011.
http://www.analyticspress.com/datacenters.html.
Navigant Consulting and SAIC. ―EIA – Technology Forecast Updates – Residential and Commercial Building
Technologies – Reference Case.‖ Presented to the U.S. Energy Information Administration,
September 22, 2011. http://wpui.wisc.edu/news/EIA%20Posts/EIA%20Reference%20Case%2009-
2007%20Second%20Edition%20Final.pdf.
NBER-CES Manufacturing Industry Database. Randy A. Becker and Wayne B. Gray. National Bureau of
Economic Research. http://www.nber.org/data/nbprod2005.html. Last modified May 6, 2009.
Northeast Utilities. On Course: Connecticut Economic Review. Hartford, CT: Northeast Utilities, 2012.
http://www.cl-p.com/Business/EconomicDevelopment/Economic_Review/
Northeast Utilities and UIL Holdings Corporation. ―2011 Efficiency Program Savings Data.‖ Microsoft Excel
file shared with Connecticut Department of Energy and Environmental Protection. April, 2012.
State of Connecticut. ―About Connecticut.‖ Accessed July 20, 2012.
http://www.ct.gov/ctportal/cwp/view.asp?a=843&q=246434
U.S. Bureau of Economic Analysis. Annual Survey of Manufacturers. Washington DC: U.S. Bureau of
Economic Analysis, 2010. http://www.census.gov/manufacturing/asm/

2013 Connecticut Comprehensive Energy Strategy
Chapter 2: Industry Sector Strategy
68
——— Gross Domestic Product by State. Washington DC: U.S. Bureau of Economic Analysis, 2010.
——— Industry-by-Industry Total Requirements after Redefinitions (1998 to 2010). Washington DC: U.S.
Bureau of Economic Analysis, 2010.
U.S. Bureau of Labor Statistics. National Industry-Specific Occupational Employment and Wage Estimates.
Washington DC: U.S. Bureau of Labor Statistics, 2011. http://www.bls.gov/oes/current/oes_ind.htm
U.S. Department of Agriculture. ―State Fact Sheets: Connecticut.‖ Accessed July 21, 2012.
http://www.ers.usda.gov/data-products/state-fact-sheets/state-
data.aspx?StateFIPS=09&StateName=Connecticut.
U.S. Energy Information Administration. Annual Energy Outlook 2012: with Projections to 2035.
Washington DC: U.S. Energy Information Administration, 2012.
http://www.eia.gov/forecasts/aeo/pdf/0383(2012).pdf.
———. ―Average Retail Price of Electricity to Ultimate Customers by End-Use Sector, by State.‖ In January
2010 Electric Power Monthly, Table 5.6.A. Washington DC: U.S. Energy Information Administration,
2010. http://www.eia.gov/electricity/monthly/
———. ―Average Retail Price of Electricity to Ultimate Customers by End-Use Sector, by State.‖ In March 2012
Electric Power Monthly, Table 5.6.A. Washington DC: U.S. Energy Information Administration,
2012.
———. ―Average Retail Price of Electricity to Ultimate Customers by End-Use Sector, by State.‖ In April 2012
Electric Power Monthly, Table 5.6.A. Washington DC: U.S. Energy Information Administration,
2012.
———. Class of Ownership, Number of Consumers, Sales, Revenue, and Average Price by State and Utility: All
Sectors. Washington DC: U.S. Energy Information Administration. 2010.
———Existing Capacity by Energy Source, by Producer, by St ate back to 2000. Washington DC: U.S.
Energy Information Administration, 2010. http://www.eia.gov/electricity/data.cfm#gencapacity.
———. ―Industrial Average Monthly Bill by Census Dvision, and State, 2010.‖ In Electric Sales, Revenue, and
Average Price. Table 5C. Washington DC: U.S. Energy Information Administration, 2010.
http://www.eia.gov/electricity/sales_revenue_price/.
———. Industrial Sector Energy Consumption Estimates, Selected Years, 1960-2010, Connecticut — State
Energy Data System. Table CT6. Washington DC: U.S. Energy Information Administration, 2010.
——— Industrial Sector Energy Price and Expenditures Estimates, 1970-2010, Connecticut — State Energy
Data System. Table ET5. Washington DC: U.S. Energy Information Administration, 2010.
http://www.eia.gov/state/seds/hf.jsp?incfile=sep_prices/ind/pr_ind_CT.html&mstate=Connecticut

2013 Connecticut Comprehensive Energy Strategy
Chapter 2: Industry Sector Strategy
69
———. ―Natural Gas Prices.‖ Last modified June 29, 2012.
http://www.eia.gov/dnav/ng/ng_pri_sum_dcu_SCT_m.htm.
——— Natural Gas Weekly Update. Various release dates April–June, 2012. Washington DC: U.S. Energy
Information Administration, 2012. http://www.eia.gov/naturalgas/weekly/
——— Primary Energy Consumption Estimates, Selected Years, 1960–2010, Connecticut — State Energy
Data System. Table CT2. Washington DC: U.S. Energy Information Administration, 2010.
http://www.eia.gov/state/seds/hf.jsp?incfile=sep_use/total/use_tot_CTcb.html&mstate=Connecticut
———. State Energy Data System. Washington DC: U.S. Energy Information Administration, 2012.
http://www.eia.gov/state/seds/.
U.S. Environmental Protection Agency. ―State Inventory and Projection Tool.‖ [Downloadable spreadsheet
model]. Accessed April, 2012. http://www.epa.gov/statelocalclimate/resources/tool.html.
U.S. Office of Management and Budget (OMB). Guidelines and Discount Rates for Benefit-Cost Analysis of
Federal Programs, Appendix C: Discount Rates for Cost-Effectiveness, Lease-Purchase, and Related
Analyses. OMB Circular no. A-94. Washington DC: Government Printing Office, 2011.
http://www.whitehouse.gov/sites/default/files/omb/memoranda/2012/m-12-06.pdf
Yahoo Finance. ―Industry Browser – Industrial Goods Sector – Industry List.‖ Accessed May 18, 2012.
http://biz.yahoo.com/p/6conameu.html.

2013 Connecticut Comprehensive Energy Strategy
Chapter 3: Electricity Sector Strategy
70
Introduction
No technological system is more complex or affects our society more profoundly than the electricity
sector. Cheap, clean, reliable electricity is critical to Connecticut‘s economic strength and the quality of life
of its citizens.
The electricity Connecticut residents consume is generated by a variety of sources — from the Millstone
nuclear generation facility, to natural gas-fired power plants, to solar cells located on rooftops around the
state. The electricity from these sources is delivered to all corners of Connecticut through more than 1,800
miles of high-voltage transmission lines, which feed into a much larger, lower-voltage network of more
than 17,000 miles of power lines that distribute power to every home, business, and other facility on the
Connecticut grid. This electricity keeps the lights on, runs our smart phones and TVs, cools our offices and
homes, and powers production lines and countless other industrial processes in hundreds of locations
across the state.
For too long, Connecticut‘s residents and businesses have paid some of the highest electric rates in the
country. This Strategy addresses this problem in a variety of ways. In doing so, it seeks to balance the
impact that power generation and distribution have on Connecticut‘s business climate and the potential
for job growth with the recognition that how electricity is generated also profoundly affects our air quality,
water resources, and the climate.
A successful strategy for Connecticut‘s electricity sector must center on the triple goals of making
Connecticut electricity cheaper, cleaner, and more reliable. Although average electricity rates across the
state have decreased by 12% since 2010, the State has more work to do. To ease the strain of energy bills
on Connecticut households and to ensure that Connecticut businesses gain a competitive edge, this
Strategy proposes several policy actions to further reduce the cost of electricity.
At the same time, Connecticut has suffered from some of the country‘s worst air pollution, in part due to
its geographic location downwind of out-of-state coal- and oil-burning power plants. A cleaner energy
future requires support for electricity generation from low- or no-emission sources, as well as regional
coordination and federal regulation to phase out dirty power plants beyond the state‘s borders. As this
Strategy demonstrates, Connecticut under Governor Malloy‘s guidance intends to be a leader in the push
for cleaner power generation across our entire airshed. It should also be noted that issues relating to a re-
evaluation of the State‘s Renewable Portfolio Standard (RPS) will be discussed and considered in the
Department of Energy and Environmental Protection‘s (DEEP) separate RPS study, which will be
completed in the first quarter of 2013.
Ensuring the reliability of the electric sector must also be a priority. Connecticut‘s economy, public health
systems, and even basic social interactions depend on an uninterrupted flow of electricity from power
plants across vast networks of poles and wires. As recent storms have made clear, disruptions of that flow,

2013 Connecticut Comprehensive Energy Strategy
Chapter 3: Electricity Sector Strategy
71
however brief, can have catastrophic implications. This Strategy therefore proposes further investments in
grid reliability, including: tree trimming, hardening of wires and poles, investments in a ―smart‖ electric
grid, and development of more distributed generation and microgrids.
But, there is the possibility of tension among these goals. Any one of these priorities, if pursued
independently, has the potential to undermine the others. Electric generating units can emit air pollutants
that harm public health and the environment. Connecticut has great potential sources of renewable
energy, but not all of them can be harnessed cost-effectively. Investments in system hardening to prevent
power outages can drive up utility bills. For these reasons, an effective strategy for the electricity sector
must reduce electric demand, enhance reliability, and meet environmental goals in a complementary way.
This Chapter briefly summarizes the structure of Connecticut‘s electricity sector, including current
challenges and opportunities arising in this sector. It concludes with a set of recommendations that are
crafted to take advantage of those opportunities, so as to advance the Governor‘s commitment to cheaper,
cleaner, and more reliable electricity, while balancing the need for environmental progress, economic
prosperity, and job growth.
Overview of the Electricity Sector
Over the last few decades, Connecticut‘s electricity sector has undergone profound changes in terms of the
types of fuel used to generate electricity, the structure and regulation of the companies that have
historically owned and maintained power plants and distribution lines in the state, the amount of air
pollution and other environmental impacts of the electricity sector, and even the ways that Connecticut
homes and businesses consume electricity itself. Consider that in the mid-1990s, Connecticut residents
and businesses purchased electricity primarily from two state-regulated investor-owned utilities, The
Connecticut Light & Power Company (CL&P) and The United Illuminating Company (UI), which owned
and operated fleets of power plants, transmission and electric distribution lines across the State.1 Nuclear
power plants built in the late 1960s and 1970s generated half of the state‘s electricity by the mid-1980s,2
and fuel oil-fired generating stations accounted for most of the other half. This reliance on in-state
generation from fuel oil (and some coal), coupled with Connecticut‘s geographic location downwind of
other coal- and oil-burning power plants, meant that Connecticut ranked high among other states in
terms of concentrations of harmful air pollutants such as ozone, sulfur dioxide (SO2), nitrogen oxides
(NOx), and carbon dioxide (CO2).
1 Approximately 66,000 Connecticut customers are serviced by municipal electric utilities. Available at
http://www.cmeec.com/whoiscmeec.htm. 2 U.S. Energy Information Administration State Energy Data System. ―Transportation Sector Energy Consumption
Estimates, Selected Years, 1960-2010, Connecticut.‖ Available at http://www.eia.gov/state/seds/sep_use/total/pdf/use_CT.pdf Nuclear-powered electricity generation declined steeply in the mid-1990s, with the shutdown of the Connecticut Yankee Atomic Power Company’s Haddam Neck plant in 1994, and the temporary shutdown of the Northeast Nuclear Energy Company’s Millstone plant in 1995.

2013 Connecticut Comprehensive Energy Strategy
Chapter 3: Electricity Sector Strategy
72
Legislation enacted in 1998 mandated sweeping changes to the structure of the electricity sector.3 CL&P
and UI were ordered to sell off their generation assets and begin operating solely as electric distribution
companies. Under this restructured arrangement, the electric distribution companies own and maintain
the poles and wires that distribute electricity to Connecticut customers. At the same time, Connecticut‘s
retail electricity customers were given the choice of buying electricity at competitive rates offered by
independent suppliers, or to continue purchasing electricity at a rate called the ―standard offer‖—now
standard service – from the electric distribution companies (who in turn purchase the power from
independent suppliers and the regional wholesale electricity market).4
This same legislation mandated specific charges on customer bills to support the State‘s energy efficiency
and renewable energy programs.5,6 It also established, for the first, time a Renewable Portfolio Standard
(RPS) for the state, which requires that over time, an increasing percentage of the electric generation
provided to Connecticut customers must be produced from renewable energy sources such as solar, wind,
small run-of-river hydropower, landfill gas, fuel cells, certain biomass, ocean, tidal, wave, and other
advanced energy conversion technologies.7
Today, Connecticut‘s electricity sector uses more than 300 trillion British Thermal Units (BTUs) per year
to generate about 30 terawatt-hours of electricity.8 Approximately 47% of that electricity is generated by
the Millstone Nuclear Power Station, which has two nuclear reactors operating in Waterford, Connecticut.
Approximately 45% is produced by natural gas-fired power plants, which over the last several years have
largely replaced older coal- and oil-fired facilities as natural gas prices have declined and coal and oil
prices have increased.9
Retail Electricity Prices Have Declined Since 2010
While proponents of restructuring anticipated that the switch to competitive supply would lead to lower
electricity rates, electricity rates climbed precipitously after deregulation, reaching an all-time high in
2009. The negative impacts can be traced to a combination of factors. Notably, the restructuring left
substantial ―stranded costs‖ that ratepayers had to bear for years. In addition, the regional wholesale
3 See Connecticut Public Act 98-28, ―An Act Concerning Electric Restructuring,‖ (1998).
4 See Connecticut Public Act 98-28, ―An Act Concerning Electric Restructuring,‖ (1998).
5 The conservation surcharge, set by statute at 3 mills per kWh, is imposed on all customer classes of the electric
distribution companies. See Conn. Gen. Stat. § 16-245m. 6 See Connecticut Public Act 98-28, ―An Act Concerning Electric Restructuring,‖ (1998).
7 Ibid.
8 U.S. Energy Information Administration State Energy Data System. ―Transportation Sector Energy Consumption
Estimates, Selected Years, 1960-2010, Connecticut.‖ Available at http://www.eia.gov/state/seds/sep_use/total/pdf/use_CT.pdf.
9 Connecticut Department of Energy and Environmental Protection, ―2012 Integrated Resource Plan for
Connecticut.‖ Available at http://www.ct.gov/deep/lib/deep/energy/irp/2012_irp.pdf.

2013 Connecticut Comprehensive Energy Strategy
Chapter 3: Electricity Sector Strategy
73
power market, operated by the Independent System Operator for New England (ISO New England),
procures needed generation using an auction market that induced investment in new generation capacity
and provides high reliability. However, these benefits come at a cost and have resulted in high generation
prices. The auction structure now in place makes ratepayers particularly vulnerable to fluctuations in
natural gas prices. In addition, Connecticut‘s under-investment in transmission lines led to federally-
mandated congestion charges that increased the transmission and distribution portion of customer bills.
Fortunately, the Competitive Transition Assessment (CTA) which reimburses the electric distribution
companies for stranded costs (such as the capital costs associated with generation facilities that were not
fully recovered when the assets were sold because of restructuring) is now nearing an end.10 After a
decade of paying CTA charges of about 1 ¢/kWh to cover stranded costs from restructuring, CL&P
customers saw the CTA charge decline to 0.128 ¢/kWh in 2011. The CTA charge for UI customers is
currently set at 1.51 ¢/kWh, and will be phased out over the next two years. Smart transmission
investments are helping to reduce congestion charges and maintain transmission security. Transmission
and distribution costs have increased as a result of these investments, but these increases have been more
than offset by declining generation costs.
In an effort to reduce generation price volatility, the State implemented contract ―laddering‖ in 2004,
whereby power purchases were made in three year blocks. Although laddering stabilized generation rates,
this procurement strategy soon prevented Connecticut standard service customers from fully benefiting
from declining natural gas-fired power prices because they were locked into contracts for several years.
Nevertheless, rates in Connecticut as a whole have declined due to an extended period of relatively low
natural gas prices.
As a result of these actions and circumstances, Connecticut‘s average retail electricity costs have dropped
by 12% (Figure 1).11 Ratepayers in CL&P service territory will also benefit from a freeze on distribution
rates for the next few years as part of terms agreed to by CL&P during the Northeast Utilities-NSTAR
merger negotiations with the State.12 UI has provided notice of its intent to request a distribution rate
increase in which the issue of their current rate of return (which is lower than CL&P‘s and well below the
10
Stranded costs are generally defined as costs incurred by a utility company (e.g., for building and owning generation plants and increasing capacity) that the company is no longer able to recoup because of changes in regulations. In Connecticut, as a result of deregulation, CL&P and UI were mandated to sell off their generation assets, thereby ―stranding‖ some generation costs that the companies would otherwise have been able to recoup through regulation.
11 See PURA Docket 12-06-01, ―PURA Semi-Annual Review Of The Transmission Adjustment Clause Of The Connecticut Light And Power Company And The United Illuminating Company,‖ CL&P Exhibit MJM-2’ UI Revised Exhibit 8. Available at http://www.ct.gov/pura/docketsearch.
12 See PURA Docket 12-07-01, ―PURA Investigation Into The Establishment Of Low-Income Discounted Rates For Electric And Gas Services.‖ Available at http://www.ct.gov/pura/docketsearch.
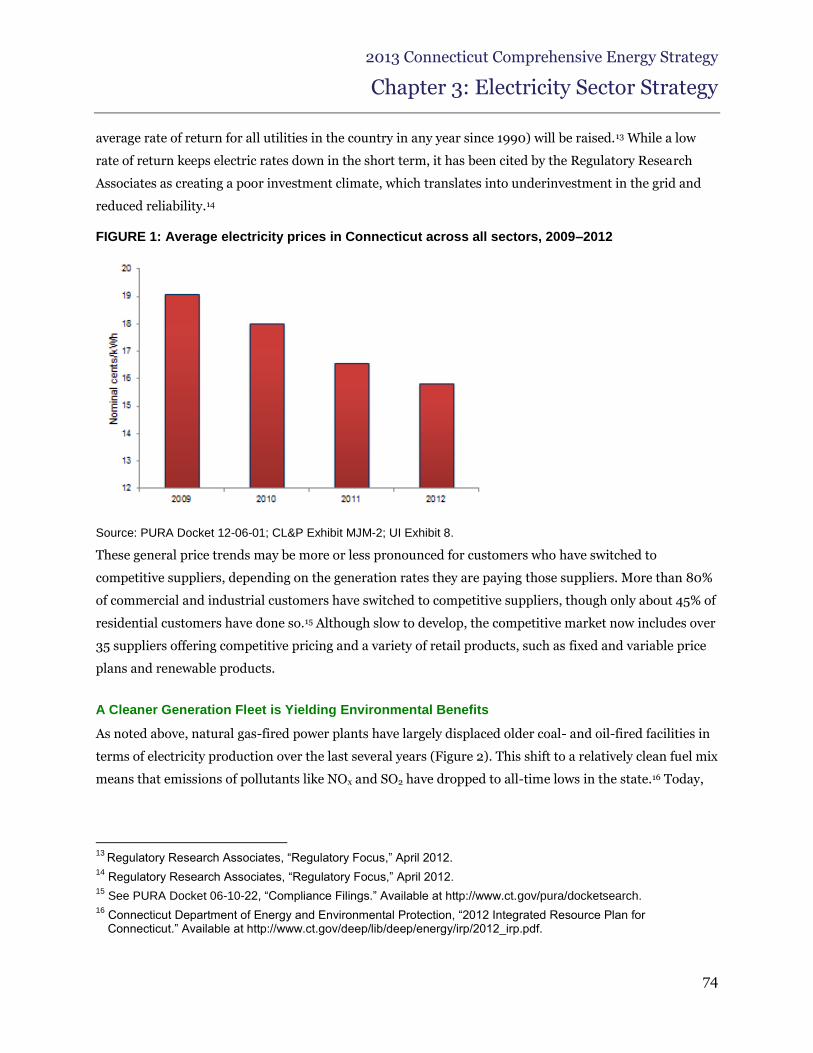
2013 Connecticut Comprehensive Energy Strategy
Chapter 3: Electricity Sector Strategy
74
average rate of return for all utilities in the country in any year since 1990) will be raised.13 While a low
rate of return keeps electric rates down in the short term, it has been cited by the Regulatory Research
Associates as creating a poor investment climate, which translates into underinvestment in the grid and
reduced reliability.14
FIGURE 1: Average electricity prices in Connecticut across all sectors, 2009–2012
Source: PURA Docket 12-06-01; CL&P Exhibit MJM-2; UI Exhibit 8.
These general price trends may be more or less pronounced for customers who have switched to
competitive suppliers, depending on the generation rates they are paying those suppliers. More than 80%
of commercial and industrial customers have switched to competitive suppliers, though only about 45% of
residential customers have done so.15 Although slow to develop, the competitive market now includes over
35 suppliers offering competitive pricing and a variety of retail products, such as fixed and variable price
plans and renewable products.
A Cleaner Generation Fleet is Yielding Environmental Benefits
As noted above, natural gas-fired power plants have largely displaced older coal- and oil-fired facilities in
terms of electricity production over the last several years (Figure 2). This shift to a relatively clean fuel mix
means that emissions of pollutants like NOx and SO2 have dropped to all-time lows in the state.16 Today,
13
Regulatory Research Associates, ―Regulatory Focus,‖ April 2012. 14
Regulatory Research Associates, ―Regulatory Focus,‖ April 2012. 15
See PURA Docket 06-10-22, ―Compliance Filings.‖ Available at http://www.ct.gov/pura/docketsearch. 16
Connecticut Department of Energy and Environmental Protection, ―2012 Integrated Resource Plan for Connecticut.‖ Available at http://www.ct.gov/deep/lib/deep/energy/irp/2012_irp.pdf.
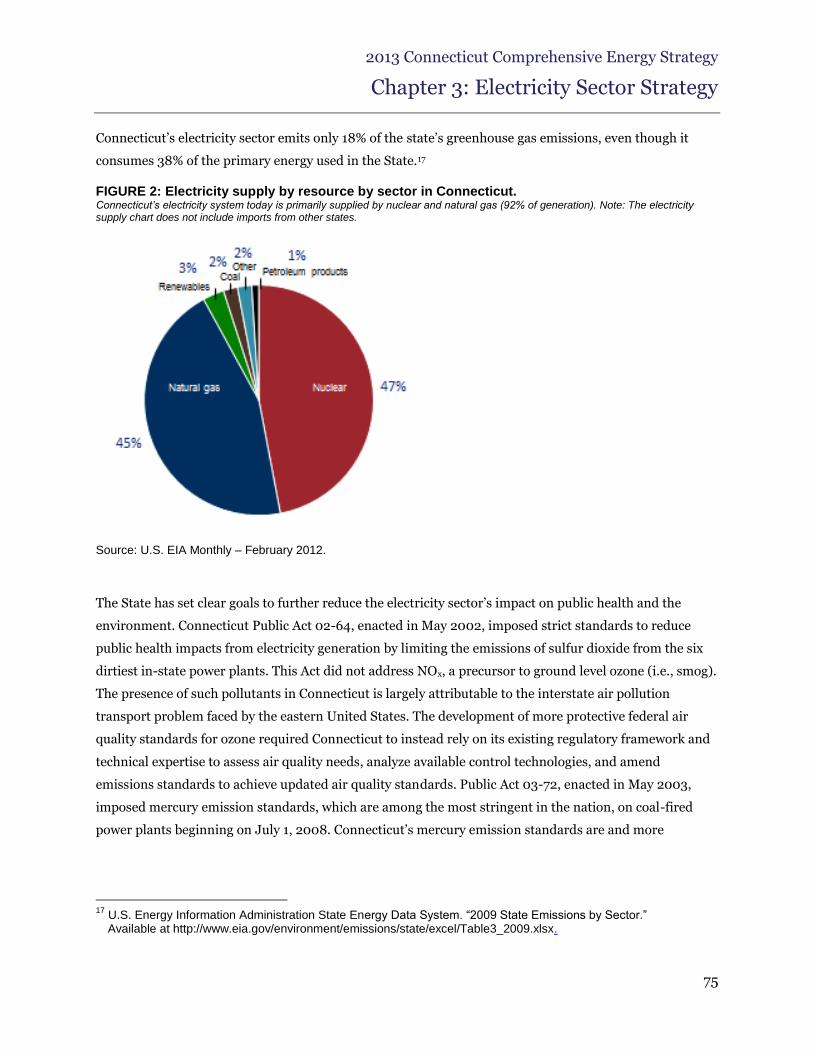
2013 Connecticut Comprehensive Energy Strategy
Chapter 3: Electricity Sector Strategy
75
Connecticut‘s electricity sector emits only 18% of the state‘s greenhouse gas emissions, even though it
consumes 38% of the primary energy used in the State.17
FIGURE 2: Electricity supply by resource by sector in Connecticut. Connecticut‟s electricity system today is primarily supplied by nuclear and natural gas (92% of generation). Note: The electricity supply chart does not include imports from other states.
Source: U.S. EIA Monthly – February 2012.
The State has set clear goals to further reduce the electricity sector‘s impact on public health and the
environment. Connecticut Public Act 02-64, enacted in May 2002, imposed strict standards to reduce
public health impacts from electricity generation by limiting the emissions of sulfur dioxide from the six
dirtiest in-state power plants. This Act did not address NOx, a precursor to ground level ozone (i.e., smog).
The presence of such pollutants in Connecticut is largely attributable to the interstate air pollution
transport problem faced by the eastern United States. The development of more protective federal air
quality standards for ozone required Connecticut to instead rely on its existing regulatory framework and
technical expertise to assess air quality needs, analyze available control technologies, and amend
emissions standards to achieve updated air quality standards. Public Act 03-72, enacted in May 2003,
imposed mercury emission standards, which are among the most stringent in the nation, on coal-fired
power plants beginning on July 1, 2008. Connecticut‘s mercury emission standards are and more
17
U.S. Energy Information Administration State Energy Data System. ―2009 State Emissions by Sector.‖ Available at http://www.eia.gov/environment/emissions/state/excel/Table3_2009.xlsx.

2013 Connecticut Comprehensive Energy Strategy
Chapter 3: Electricity Sector Strategy
76
stringent than the standards adopted in 2012 by U.S. Environmental Protection Agency, known as the
Mercury and Air Toxics Standards rule.18
In addition to requiring stricter pollution controls to reduce public health impacts, Connecticut has been a
leader in taking steps to reduce the greenhouse gas emissions related to generating electricity. In 2008,
Connecticut became one of nine states to implement the Regional Greenhouse Gas Initiative (RGGI), the
first mandatory carbon dioxide cap and trade program in the United States.19 While seeking to reduce the
negative environmental impacts of traditional electric generation, the State has also set very aggressive
targets for deploying cleaner generation sources. The Global Warming Solutions Act (Connecticut Public
Act 08-98) sets a goal of reducing greenhouse gas emissions by 80% by 2050.20 Connecticut‘s Renewable
Portfolio Standard (RPS) requires that 20% of generation serving state customers be from renewables by
2020. Meeting the 2020 RPS goal will require the development of 6,196 gigawatt-hours, or nearly 3
gigawatts of low-carbon supply — more than 25 times the amount of power generated by Class I resources
(i.e., solar power, wind power, and fuel cells) within Connecticut in 2011.21
New approaches will be essential to cost-effectively meet Connecticut‘s renewable power goals. This
Strategy proposes to ramp up renewable energy using a new ―finance‖ model designed to draw private
capital into promising alternative power projects. It also seeks to harness market forces to lower the costs
of renewable energy. Connecticut‘s first-in-the-nation ―Green Bank,‖ the Clean Energy Finance and
Investment Authority (CEFIA) lies at the heart of this ―finance‖ approach. This Strategy proposes that
CEFIA expand its portfolio of flexible financing mechanisms to promote further investments in renewable
power from a wide range of private sector companies deploying a diverse set of technologies.
18
See 77 CFR § 9304 (February 16, 2012). 19
New Jersey had been a part of RGGI initially but withdrew in 2011. 20
See Connecticut Public Act 08-98, ―An Act Concerning Connecticut Global Warming Solutions,‖ (2008). 21
Connecticut Department of Energy and Environmental Protection, ―2012 Integrated Resource Plan for Connecticut.‖ Available at http://www.ct.gov/deep/lib/deep/energy/irp/2012_irp.pdf.

2013 Connecticut Comprehensive Energy Strategy
Chapter 3: Electricity Sector Strategy
77
What Is The Regional Greenhouse Gas Initiative?
The Regional Greenhouse Gas Initiative (RGGI) is the first mandatory carbon dioxide cap and trade program in the United
States. States participating in RGGI set a cap on total carbon emissions in the region and each participating state is allotted a
limited number of emission allowances. Any electric generator in a RGGI-participating state that is larger than 25 megawatts
is required to obtain ―allowances‖ sufficient to cover its emissions. RGGI is the first cap and trade program to rely on an open
and transparent auction process to distribute a large percentage of allowances to regulated entities. The eighteen auctions
held to date have generated over $1.1 billion dollars for the participating states. Early concerns that RGGI would drive up
electricity prices have not materialized. Moreover, most of the states in RGGI have reinvested the majority of the money
received from the purchase of these allowances in energy efficiency and clean energy resources, thereby further reducing
emissions and mitigating program costs. In Connecticut, about 70% of the more than $65 million it has received from the sale
of RGGI CO2 allowances augment energy efficiency programs overseen by the Energy Efficiency Board, while 23% of the
proceeds support renewable energy programs administered by the Clean Energy Finance Investment Authority. These funds
have supported wide-ranging and dynamic programs to reduce energy use, including residential energy audits and large
commercial and industrial lighting and HVAC efficiency projects. RGGI funds have also supported renewable energy programs
such as solar photovoltaic installations in commercial, municipal, nonprofit, and educational settings throughout Connecticut.
During its first two and a half years, RGGI-funded investments have boosted economic growth in Connecticut by more than
$189 million and have created approximately 1,300 jobs.22
RGGI states have been working cooperatively over the last year through an open and transparent process to examine
opportunities to improve the program. Recent analyses conducted as part of the program review indicate that meeting RGGI-
related environmental, energy, and economic goals can be achieved at minimal cost. In addition, preliminary energy modeling
indicates that a significantly lower RGGI cap (91 million tons) could be implemented with only a modest price impact of less
than 70¢ each month on the average residential energy bill in Connecticut while generating even more economic activity from
the investment of the RGGI proceeds. A revised RGGI program will continue to have an overall positive impact on
Connecticut’s economy, resulting in more energy dollars remaining in-state with the necessary safeguards such as a cost-
containment reserve that will automatically insert allowances into the marketplace to protect ratepayers.
Connecticut has already taken steps to make its generation assets cleaner and positioned itself for future
electricity price competitiveness. States that have failed to invest in cleaner generation sources are now
beginning to pay the price for their inaction, as EPA adopts new regulations that require generators to
emit fewer pollutants. Thanks to earlier investments in a cleaner generation fleet, Connecticut ratepayers
will avoid large rate increases associated with environmental compliance costs that other areas of the
country are facing. At a time when many states will be facing an increasing cost of generation due to these
factors, Connecticut‘s generation costs are projected to continue to fall in the short term (Figure 3) and
remain relatively stable out to 2018.
22
―The Economic Impacts of the Regional Greenhouse Gas Initiative on Ten Northeast and Mid-Atlantic States: Review of the Use of RGGI Auction Proceeds from the First Three-Year Compliance Period,‖ (November 15, 2011). Available at http://www.analysisgroup.com/uploadedFiles/Publishing/Articles/Economic_Impact_RGGI_Report.pdf.

2013 Connecticut Comprehensive Energy Strategy
Chapter 3: Electricity Sector Strategy
78
FIGURE 3: Projected Average Annual Generation Service Charge (GSC) for Connecticut Customers (Nominal Cents/kWh), 2010-2017
Projections based on current commodity price projections; 2013-2017 projections for CL&P service territory (80% of the state).
Source: CT DEEP; CL&P; Brattle Group Projections
Renewed Investment in Reliability
Controlling the environmental impacts of the electricity sector is crucial. So too is ensuring the reliability
of the electric grid. Managing this system is a complex task that requires the instantaneous balancing of
supply and demand, since demand occurs when power is needed, and supplies of electricity cannot be
cost-effectively stored using current technologies. Demand for electricity changes constantly during the
day, as temperatures rise and people crank up their air conditioners, or as factory assembly lines start up
or shut down. At peak use times (often on the hottest summer afternoons), demand can be twice the
annual daily average.23 The regional electric grid operator, ISO New England, must constantly ramp
production from power plants up or down so that at any given moment, the power used in Connecticut
and across the New England region always perfectly matches the power being produced.
Although recent storms have been a challenge, Connecticut‘s average system reliability has been as good
as or better than that of most states in recent years (Figure 4). In an average year, a customer in
23
ISO New England, ―2012 Forecast Data File.‖
Available at http://www.iso-ne.com/trans/celt/fsct_detail/2012/isone_fcst_data_2012.xls.

2013 Connecticut Comprehensive Energy Strategy
Chapter 3: Electricity Sector Strategy
79
Connecticut experiences only two hours without power and until recently most went years without
experiencing an outage.24
FIGURE 4: System Average Interruption Duration Index (SAIDI) for New England Utilities
Connecticut’s average system reliability is as good as or better than that of other states; however, major storms produced two prolonged outages in 2011. The SAIDI values shown here exclude ―major storms.‖
Sources: Connecticut DPUC, 2011 Annual Report on Reliability; Massachusetts DPU, Fitchburg Gas and Electric Light Company; Massachusetts DPU, Massachusetts Electric Company; Massachusetts DPU, Nantucket Electric Company; Massachusetts DPU, NSTAR Electric Company; Massachusetts DPU, Western Massachusetts Electric Company; New York Department of Public Service, Electric Reliability Performance Report; and New York Office of Electricity and Environment, 2005 Interruption Report.
In 2011, the state had two catastrophic power outages. In August 2011, Tropical Storm Irene left 800,000
customers without power for up to nine days. This record outage was surpassed only six weeks later when
an unusual October snowstorm took out power for 880,000 customers. Full restoration of service from
the October snowstorm took twelve days.25 Then almost exactly a year later, superstorm Sandy hit many
of the areas still recovering from Irene and knocked out power for much of a week to more than 625,000
customers.26 The October storm was by almost any measure an unusual occurrence. The last event with a
similar impact was a Category III hurricane that hit Connecticut in 1938. Sandy was termed a superstorm
because of the confluence of several severe weather systems, but also due to a warming climate. Rising sea
24
PURA Docket 11-04-11, ―DPUC 2011 Annual Report To The General Assembly On Electric Distribution Company System Reliability.‖ Available at http://www.ct.gov/pura/docketsearch.
25 McGee, Two Storm Panel Report. Available at http://www.ct.gov/deep/lib/deep/forestry/vmtf/two_storm_panel_final_report.pdf.
26 DeSalvo, Mike (October 29, 2012), ―Over 625,000 without Power Across Connecticut.‖ Available at: http://blog.ctnews.com/sandy/2012/10/29/outages-top-590000/.

2013 Connecticut Comprehensive Energy Strategy
Chapter 3: Electricity Sector Strategy
80
levels increase the prospect that the state will be more vulnerable to these types of storms in the years
ahead.
The human and economic costs that resulted from these prolonged power outages have fundamentally
changed the discussion about what constitutes adequate reliability in the State‘s electric sector. These
experiences have underscored the need to take action in a number of areas to reduce the likelihood of
disastrous outages and to alleviate the human toll and economic impact from those that do occur.
Changes that were made in the wake of the 2011 storms meant that the State and its utilities were better
prepared to respond to storm Sandy. However, the combination of these experiences has reinforced the
critical need to increase our ability to develop alternative ways to provide some core levels of electric
service independent of the larger grid system.
Challenges Ahead
Declining rates, lower levels of air emissions, and renewed investments in reliability spell progress for
Connecticut, but several key challenges must be met over the next few years to ensure that recent progress
continues. Many of these challenges were analyzed in Connecticut‘s 2012 Integrated Resources Plan
(IRP), released by DEEP in June 2012. The 2012 IRP analyzed projected supply and demand for
electricity in Connecticut through 2022, and concluded that Connecticut‘s electricity sector can
adequately and reliably meet the State‘s demand for electricity for several more years without building
any new power plants.27 Analysis performed for the 2012 IRP showed that rates should continue to
decline through 2016 with a business-as-usual approach.28 The price customers have paid for electricity
generation, which topped 12 ¢/kWh for several years, should remain at or below 8 ¢/kWh through 2017,
thanks to an expanding supply of cheap natural gas. Recent advances in drilling techniques have made
vast domestic shale gas resources (all located outside of Connecticut) available. Domestic natural gas
production has increased by 20% in the last five years, and the delivered price of natural gas for electricity
generation in Connecticut fell by 50% from April 2011 to April 2012.29 Natural gas fired generation is
currently 15-50% lower in cost than coal-fired power and for the first time, natural gas is being used to
fuel as much electricity generation in the United States as coal. 30,31
27
Connecticut Department of Energy and Environmental Protection, ―2012 Integrated Resource Plan for Connecticut.‖ Available at http://www.ct.gov/deep/lib/deep/energy/irp/2012_irp.pdf.
28 Analysis for the 2012 IRP was performed in early 2012, and conclusions about the timing of this trend were current as of the time of the analysis.
29 U.S. Energy Information Administration, ―Natural Gas Gross Withdrawals‖; and U.S. Energy Information Administration, ―Average Cost of Natural Gas.‖
30 Calculations using NREL’s online LCOE calculator (http://www.nrel.gov/analysis/tech_lcoe.html) with input data from Black & Veatch, Cost and Performance Data; U.S. EIA, ―Average Cost of Coal‖; and U.S. EIA, ―Average Cost of Natural Gas.‖

2013 Connecticut Comprehensive Energy Strategy
Chapter 3: Electricity Sector Strategy
81
While the state‘s residents and businesses are likely to enjoy steady or decreasing electricity prices over
the next few years, electricity rates may well go up again after 2017, when the costs associated with
electricity generation are projected to increase by as much as 3 ¢/kWh.32 There are several reasons for this
anticipated cost increase. First, regional demand for electricity — which declined during the economic
recession — is likely to increase. In Connecticut, electricity consumption is expected to grow by
approximately 1% per year, causing power demand to begin to outstrip supply. Second, natural gas prices
are expected to increase over time, driving up the cost of generation.
Finally, demand for renewable generation across New England is expected to outpace available supply.
Many New England states have renewable generation targets in place. Connecticut‘s Renewable Portfolio
Standard (RPS) sets a high target for renewable generation (20% from Class 1 resources by 2020).
Connecticut generates only a small amount of renewable power in-state from hydroelectric dams, solar
installations, and fuel cells, though these amounts are growing as a result of the Zero Emission (ZREC)
and Low Emission (LREC) Renewable Energy Certificate programs. Currently, the state‘s generators and
utilities satisfy most of their renewable requirements by purchasing renewable energy credits from
generation elsewhere in New England.
Unless regional development of renewable resources and enabling transmission accelerate, Connecticut
customers could face so-called Alternative Compliance Payment obligations of more than $250 million (in
2012 dollars) annually by 2022 to meet the requirements of the existing RPS. As noted above, DEEP is
close to releasing a draft study of the RPS. In addition to recommendations that may come from that
study, this Strategy recommends a continued expansion of in-state renewable power using models such
as the ZREC and LREC programs to drive down costs. This Strategy also recognizes the cost benefits
associated with achieving economies of scale and therefore supports a regional collaboration to procure
the most cost-effective out-of-state renewable resources.
Connecticut faces a further challenge in that its generation fleet primarily relies upon two sources: nuclear
(47%) and natural gas (45%).33 While these sources meet current needs, this lack of diversification in
generation exposes the State to both price and reliability risks. This lack of diversification subjects
Connecticut to potential electricity rate increases and reliability risks if natural gas-fueled generation
costs spike, or one of its nuclear plants need to go off-line for an extended period. This latter threat was
brought into focus in the summer of 2012, when higher than normal water temperatures in Long Island
31
U.S. Energy Information Administration, ―Net Generation by Energy Source.‖ Available at http://www.eia.gov/electricity/monthly/
32 Rates in 2022 could turn out to be higher or lower depending on market conditions, but are still expected to increase from projected 2017 levels. See Connecticut Department of Energy and Environmental Protection, ―2012 Integrated Resource Plan for Connecticut.‖ Available at http://www.ct.gov/deep/lib/deep/energy/irp/2012_irp.pdf.
33 U.S. Energy Information Administration State Energy Data System. ―Electric Power Monthly: February 2012.‖ Available at http://www.eia.gov/electricity/monthly/update/archive/february2012/

2013 Connecticut Comprehensive Energy Strategy
Chapter 3: Electricity Sector Strategy
82
Sound forced the shutdown of one of the State‘s two active nuclear units. 34 Understanding the
implications of these challenges and risks and exploring the options for addressing them, is crucial to
maintaining and enhancing Connecticut‘s electric system.
More than 90% of the nuclear, natural gas, and coal power plants in Connecticut, Maine, Massachusetts,
New Hampshire, Rhode Island, and Vermont will exceed average industry lifetimes by the mid-21st
century.35 Replacing these plants will require investments in new resources, and can provide an
opportunity to create a cheaper and cleaner electricity sector. Because new plants can have a life of more
than thirty years, it will be important for Connecticut to set policies that ensure new resource
developments are consistent with the State‘s long-term environmental, economic, and reliability goals.
To adapt to these challenges and trends, Connecticut needs an electricity sector that has greater flexibility,
more diverse sources of supply, a higher use of renewable energy, and a commitment to capacity increases
in step with demand growth. A more diverse ―portfolio‖ of power generation facilities would enhance both
reliability and rate stability. At the same time, electricity costs must be managed and reduced to support a
healthy, competitive economy. Efficiency is one of the most effective ways to reduce costs, and this
Strategy makes enhanced efficiency a top priority, as discussed in Chapter 1 (Efficiency).
Managing and Reducing Peak Electric Demand
Demand for electricity can be managed and reduced through greater participation in demand response
programs, an increase in renewable energy (especially solar), targeting demand management as part of
the State‘s energy efficiency programs, and behavioral change supported by advances in technology and
dynamic rates. These efforts can reduce the need to build new generating capacity, avoid new
transmission costs, provide a buffer against rate increases driven by rising natural gas prices, lower
capacity payments, and improve the environment. Moreover, decreasing demand will also buy time to
explore and develop other supply options for the more distant future so that the state can take advantage
of new (or newly cost-effective) technologies that meet our long-term energy and environmental policy
goals. In this section, we discuss several strategies that can meet these goals and improve Connecticut‘s
overall load profile.
Demand Response
Demand response programs are administered by ISO New England as part of an overall strategy to
maintain the reliability of the electric grid. These programs allow ISO New England to manage loads to
34
Benson, Judy. ―Warm water in Sound causes Millstone unit to shut down,‖ The Day, 13 August 2012. Available at http://www.theday.com/article/20120813/BIZ02/120819912/1047.
35 Analysis based on: U.S. Energy Information Administration, ―Existing Generating Units.‖ Available at http://www.eia.gov/electricity/capacity/; and Hodgkins, ―Wave U.S. plant retirements.‖ Available at http://http://publicutilities.utah.gov/news/waveofusplantretirementslikelyapproaching.pdf.

2013 Connecticut Comprehensive Energy Strategy
Chapter 3: Electricity Sector Strategy
83
avoid brown outs, outages or equipment damage or failure, in response to extremely high prices or supply
conditions that threaten the system. This Strategy recommends increased participation in these programs
to help control costs for Connecticut ratepayers and to allow ISO New England greater flexibility in
managing the system.
Connecticut has been a leader in implementing demand response. The 2012 IRP highlighted that
520 megawatts of peak demand response capacity is available in Connecticut today.36 Most of this
capacity comes from larger customers who have agreed to reduce demand or provide grid support in the
event that demand is projected to exceed the supply of electricity. Such events occur at most only a few
times a year, typically on the hottest days when the grid is at a critical reliability stage.
Many types of entities such as large universities, hospitals, and commercial and industrial companies take
advantage of these demand response programs to lower their overall electricity costs. For example, when
overall demand is high, Western Connecticut State University reduces the electricity it uses by shutting
down fourteen of its buildings and moving students to other classrooms. The university is rarely asked to
do this — only three times in five years — but this simple act of moving students to other classrooms can
help alleviate the reliability risks and increased costs that occur when electricity demand reaches peak
levels. The university also reaps a financial benefit as it is paid $100,000 a year to provide this service.37
Although the State has developed successful demand response programs, there is potential to further
reduce peak energy demand. Studies show that 15% of peak demand could be targeted (compared to 7%
today) if current programs continue through 2020 and Connecticut pursues even greater adoption of
demand response.38 The greatest opportunities for new demand response will come from enrolling new
customers in the existing programs and providing an opportunity for smaller customers to participate.
These opportunities are much easier to implement today because of the availability of new technologies,
particularly advanced metering and information systems. But Connecticut must make an investment in
these technologies to capture this potential. DEEP will continue to work with ISO New England to
strengthen and broaden its demand response programs. In addition, DEEP will work with ISO New
England to more fully incorporate demand response into the capacity and energy markets. As efficiency
efforts are simultaneously expanded, it will be important to track the relative cost-benefits of each to
ensure that efforts to control demand are done at the least cost to ratepayers.
36
See Connecticut Department of Energy and Environmental Protection, ―2012 Integrated Resource Plan for Connecticut.‖ Available at http://www.ct.gov/deep/lib/deep/energy/irp/2012_irp.pdf.
37 EnerNOC, Western Connecticut State University. Available at http://www.enernoc.com/our-resources/case-studies.
38 FERC, ―A National Assessment of Demand Response Potential.‖ Available at http://www.enernoc.com/our-resources/case-studies. The 15% and 30% reductions are based on analysis done in 2009. If the 2020 potential for demand response were calculated today it might be slightly different.

2013 Connecticut Comprehensive Energy Strategy
Chapter 3: Electricity Sector Strategy
84
This Strategy recommends that the State increase awareness about the opportunities for larger customers
to enroll in demand response programs and that we invest in technologies that will allow smaller
customers, including residential customers, to participate in these programs. Recommendations
surrounding advanced meters are discussed below.
Energy Efficiency Fund – Renew Efforts to Shave Peak Demand
The focus of Connecticut‘s energy efficiency programs has changed over past 12 years. In 2000, the
programs were targeted towards energy savings (i.e., reducing kilowatt-hour consumption). In 2003, the
focus shifted to reducing peak demand to mitigate congestion charges assessed on Connecticut ratepayers
when transmission constraints in southwest Connecticut led to changes in ISO New England market rules.
Significant investment in transmission facilities between 2004-2008 have relieved these constraints and
helped reduce congestion costs. As a result, the focus of the energy efficiency programs has shifted back to
energy efficiency, once again targeting measures that reduce the amount of electricity being consumed.
This Strategy recommends that in addition to targeting energy savings the programs should also more
aggressively pursue peak demand reductions.
Technology – Smart Appliances, Smart Grid, and Advanced Meters
As mentioned above, Connecticut has been a leader in demand response. But demand response is only
used to address specific situations such as when reliability is threatened or when prices are extremely
high. As such, these programs do not provide sustainable, day-to-day peak demand reduction. This is an
area in which Connecticut can do much more to lower its peak demand. This Strategy recommends that
Connecticut invest in the technologies necessary to allow all customers the opportunity to lower their
costs by managing peak demand.
An array of new technologies makes it possible to manage power demand from end uses such as
residential air conditioners and water heaters by automatically reducing these electric ―draws‖ for brief
periods of time. Historically, the electric grid was operated to serve demand and maintain reliability and
did not have the tools needed to understand and respond to the economic consequences of changes in that
demand. Advances in technology are changing the way the electric system operates. Appliances like
refrigerators, hot water heaters, and air conditioners will increasingly be equipped with communication
devices, allowing grid operators to adjust multiple small loads for short periods of time. These ―smart
appliances‖ will become common in the marketplace over the next few years providing residential and
small business customers the opportunity to participate in demand response programs. These appliances
will be just one component of a ―smart grid.‖ The term ―smart grid‖ refers to an electric system that uses
information and communications technology in an automated fashion, to improve the efficiency and
reliability of providing electric service while at the same time controlling costs.

2013 Connecticut Comprehensive Energy Strategy
Chapter 3: Electricity Sector Strategy
85
Recent advances in information technology for meters, controls, appliances, and equipment are beginning
to transform today‘s grid into an intelligent, better-integrated system that can be controlled in a far more
dynamic fashion than currently possible. Throughout the country, different utilities are experimenting
with advanced demand response programs by testing technology, pricing structures, and smart
appliances. Central to all of these programs are advanced meters (also called ―smart‖ meters) that can be
used for two-way communication between grid operators and loads, and that are capable of modulating
demand as needed or desired. Without advanced meters, Connecticut will be unable to take advantage of
the benefits that dynamic pricing and the enhanced demand management opportunities that emerging
technologies will provide.
The vast majority of Connecticut electric customers still have traditional meters, which only measure
gross monthly usage and provide no information to consumers on their time of use, demand, or other
usage characteristics. Advanced metering technologies and capabilities continue to evolve, so a
thoughtful strategy must avoid adopting systems that may become obsolete within a few years. Advanced
meter use also needs to be tied to dynamic pricing to ensure that customers have appropriate and fair
incentives to use power at optimal times.
In some places, advanced metering efforts have run into opposition from customers who fear that the
technology could raise costs, create health risks, or invade privacy. These concerns must be addressed so
that consumers are fully informed about this technology. As part of an ongoing and evolving process, the
State should continue to monitor privacy guidelines and regulations established by federal agencies, such
as the Department of Homeland Security, the Department of Energy, and the National Institute of
Standards and Technology to adapt existing privacy and security standards of Connecticut‘s utilities to
meet the new data requirements that accompany smart grid technology. In addition, policymakers strive
to meet renewable portfolio standards that will result in having more variable renewable resources
integrated onto the system, advanced metering technologies offer important features that could be
utilized to improve service and reduce costs.
Dynamic Pricing
The cost to produce and deliver electricity varies throughout the day. It is generally higher on weekdays,
between noon and eight p.m. (Connecticut‘s peak demand period), and lower during the remaining hours
(the off-peak period). However, most customers pay the same price for electricity 24 hours a day and 7
days a week. As a result, there is no incentive for people to change the way they consume electricity. This
Strategy recommends expanding time-of-use pricing and other dynamic rate mechanisms to offer
customers a financial incentive to reduce usage during peak hours thereby lowering their energy bills and
helping control overall system costs.

2013 Connecticut Comprehensive Energy Strategy
Chapter 3: Electricity Sector Strategy
86
Consistent with this Strategy‘s emphasis on creating frameworks to promote improved energy outcomes,
Connecticut needs to adopt a dynamic rates structure that allows all customers the opportunity to align
their electric use with the incentive created by time-of-use pricing. Currently, the state‘s two regulated
electric utilities offer time-of-use meters and different rates to all customer classes. However, each utility
faces different circumstances with regard to their individual metering infrastructure and the costs
associated with deploying advanced meters.
CL&P serves about 1 million residential customers and 120,000 small business customers, all of whom
have monthly demands of less than 350 kilowatts. CL&P completed the installation of an Automated
Meter Reading (AMR) system in 2005 that allows CL&P to read each customer‘s meter using a drive by,
one-way radio signal technology. This system allowed CL&P to reduce meter reading costs by eliminating
the use of pedestrian meter readers. Unfortunately, the meters that were installed do not record time-of-
use consumption and it would be costly to install new meters that can collect this information. For
instance, if a residential customer requests a time-of-use meter, CL&P would need to replace the existing
AMR meter with a new time-of-use AMR meter, which CL&P does not generally have in inventory. These
new meters could become obsolete in a very short time depending on when an advanced meter solution is
ultimately selected. Although CL&P‘s AMR system can support time-of-use rates, the meters cannot
support more sophisticated dynamic pricing strategies, such as hourly pricing. Nor can the existing
system be cost-effectively converted to do so.
As a result of the former Department of Public Utility Control (DPUC) Docket No. 05-10-03 (2006), a
mandatory time-of-use policy was established for all CL&P customer classes. Under that policy, CL&P
began a phase-in of time-of-use rates for its business customers with a monthly demand of
100-350 kilowatts. Customers with demands of 200-350 kilowatts were placed on time-of-use rates. The
phase-in was suspended for customers with monthly demands of 100-200 kilowatts. The mandatory time-
of-use policy for residential customers was also suspended while meter-related technology and cost issues
were being reviewed. Every day CL&P is installing meters for new customers and replacing meters that
fail. These meters are non-time-of -use meters that are compatible with their current AMR system but
which would not enable adoption of dynamic pricing structures. In the years since CL&P‘s roll out of
time-of-use rates was suspended, smart meter technology options have evolved significantly and to the
point where it makes sense for CL&P to reevaluate the installation of smart meters. -
Therefore, this Strategy recommends that CL&P submit a detailed plan to the Public Utilities Regulatory
Authority (PURA) for a multi-stage roll out of advanced meters over a five to ten year time frame in a
manner that minimizes stranded costs, prioritizes adoption by customers most likely to benefit from their
use, and provides for hybrid rate structures and/or affordable basic service for customers opting out of
any installation program. Additionally, the mandatory time-of-use policy should be reactivated as
advanced meters are installed. Central to any rollout strategy will be pricing that reflects the cost of

2013 Connecticut Comprehensive Energy Strategy
Chapter 3: Electricity Sector Strategy
87
procuring electricity (higher during periods of peak demand and lower when demand is low) so as to
provide commensurately positive and negative signals to customers. Until such a plan is approved, this
Strategy recommends that CL&P not promote time-of-use rates to its residential customers until
advanced meters are available.
The CL&P plan for deploying smart meters should target meters as they fail or otherwise need to be
replaced and target different customer classes, based primarily upon which classes (such as high use
residential customers) are most likely to benefit from advanced meters. Approval of such a plan will also
require that PURA examine current time-of-use rates and other dynamic pricing structures to ensure that
rates will encourage behavioral change among customers. Consideration should also be given to providing
hybrid structures that protect vulnerable classes of ratepayers (e.g., senior citizens and the disabled). In
particular this Strategy recommends that PURA consider a flat rate for a base level of usage such that real
time pricing applies only at higher levels of use. Such a hybrid structure should be designed to still provide
low use customer an incentive to shift non-essential uses to off-peak time periods. In addition, to
providing customers with information that enables them to control their electric bills, smart meters
provide benefits to ratepayers and the electric companies by improving revenue collection, identifying
outages and reducing operating costs. Issues such as privacy and health effects will continue to be
monitored by DEEP and should be addressed in the smart meter plan submitted by CL&P.
UI, the other electric distribution company serving Connecticut customers, retrofitted its current meters
with one-way cellular communications capability during the 1990s. This allows UI to read its meters
remotely and frequently (i.e., on an hourly basis). These meters can support time-of-use rates for all
customer classes without UI needing to replace the meter, or visit the meter to reprogram it, thereby
enabling UI to place any customer on a time-of-use rate without incurring additional costs. However, UI‘s
metering infrastructure is approaching the end of its useful life. As a result, UI has been replacing its
current meters with advanced meters. In addition to supporting time-of-use pricing, these meters can
support other dynamic rate structures, like hourly rates (i.e., 24 hourly price points). They can also
communicate with smart appliances and provide real-time consumption data to UI and its customers.
Because the existing meters are older and fully depreciated, encouraging the adoption of time-of-use rates
and smart meters to facilitate demand response, reduce peak loads, and lower customer costs can be done
without creating stranded costs. These differences mean that UI is better positioned to provide its
customers with the opportunity to control their use and cost in the near term.
Therefore, this Strategy recommends that UI promote time-of-use rates to all of its residential and small
business customers. Both UI and CL&P should also provide information to customers about ways to
conserve energy and the opportunity to participate in the State‘s energy efficiency programs. It is worth
noting that over 70,000 customers are currently taking service under UI‘s residential time-of-use rate.
Although UI has been a leader in time-of-use and seasonal rates, more can be done to promote demand

2013 Connecticut Comprehensive Energy Strategy
Chapter 3: Electricity Sector Strategy
88
response during peak periods. UI should develop and promote more dynamic price options for its
customers.
Developing Low-Cost Renewable Generation
In addition to managing demand through efficiency and demand response, Connecticut must develop
low-cost renewable generation to help make the electricity sector more diverse, affordable, and reliable,
while also meeting the State‘s commitment to reducing the environmental impacts from electricity
generation. As discussed above, the 2012 IRP predicts that by 2018, the available supply of economically-
viable, grid-ready renewable generation in the region will be insufficient to meet the targets set by
Connecticut‘s RPS and other New England states‘ renewable generation targets. Since 2010, Connecticut
has taken several important steps that will help prevent this supply shortfall from happening.
In 2011, Connecticut created the Clean Energy Finance and Investment Authority (CEFIA), the nation‘s
first ―Green Bank,‖ which has dual roles in promoting renewable generation. CEFIA develops and
implements programs that promote adoption of renewable energy resources formerly overseen by the
Connecticut Clean Energy Fund. With the passage of PA 11-80 CEFIA was given the additional mission of
finding finance-oriented solutions to advancing the State‘s energy goals. The enactment of PA 12- 148
provided CEFIA with the authority and financial tools needed to carry out the directive contained in PA
11-80.39 CEFIA represents a breakthrough in financing clean energy with a portfolio of incentive programs
and financing opportunities to support the new renewable generation deployment required to meet the
2020 RPS goals. CEFIA‘s financing programs will also enable participants in the State‘s energy efficiency
programs, developed by the Energy Efficiency Board, to finance more comprehensive efficiency measures,
thereby increasing the benefits captured by those programs.
CEFIA has launched a Residential Solar Investment Program (RSIP) that makes solar PV technology more
accessible and affordable to households through innovative incentives and programs.40 The program will
result in no less than 30 MW of renewable energy deployment in the residential sector.41 As part of its
commitment to the residential sector through the RSIP, CEFIA has deployed a website that allows
homeowners interested in installing solar PV systems to compare installation prices among contractors
39
See State Clean Energy Finance Banks: New Investment Facilities for Clean Energy Deployment: A Brooking-Rockefeller Project on State and Metropolitan Innovation (September 2012). Available at http://www.brookings.edu/r:esearch/papers/2012/09/12-state-energy-investment-muro.
40 The Residential Solar Investment Program (RSIP) was established by CEFIA pursuant to Section 106 of Connecticut Public Act 11-80, ―An Act Concerning The Establishment Of The Department Of Energy and Environmental Protection and Planning For Connecticut's Energy Future,‖ (2012).
41 See Connecticut Public Act 11-80, Section 106, ―An Act Concerning The Establishment Of The Department Of Energy and Environmental Protection and Planning For Connecticut's Energy Future,‖ (2012).

2013 Connecticut Comprehensive Energy Strategy
Chapter 3: Electricity Sector Strategy
89
who participate in the program.42 In addition, CEFIA has other funding instruments aimed at attracting
private capital investment in clean energy deployment. The Connecticut Solar Lease program is a public-
private partnership that engages tax equity investors and lenders to finance rooftop solar PV and solar hot
water system projects for residential ratepayers, while the Commercial Property Assessed Clean Energy
(C-PACE) program facilitates loan financing for clean energy and energy efficiency improvements to
commercial and industrial properties, using a municipal tax assessment mechanism to provide security
for loan repayment. Other CEFIA programs will utilize energy savings agreements and creative financing
approaches to improve energy efficiency for Connecticut‘s independent colleges and universities,
Collaboration with the Department of Housing and Urban Development, via its Energy Innovation Fund-
Multifamily Pilot Program, will utilize a CEFIA-provided loan loss reserve to provide at least $4 million
for improvements at Connecticut Housing Finance Authority properties.
In December of 2011, DEEP received and evaluated proposals from private developers to build, own, or
operate up to 10 megawatts (MW) of zero emission Class I renewable energy source generation facilities,
in accordance with Section 127 of Public Act 11-80. Out of 21 proposed projects, DEEP selected two
projects to be eligible to enter into long-term power purchase agreements pursuant to the Act,
representing the addition of approximately 10 MW of renewable generation to the State‘s renewable
energy portfolio. Currently, these projects and the associated contracts are undergoing review at PURA.
In the summer of 2012, a Zero Emissions and Low Emissions Renewable Energy Credit (ZREC/LREC)
program was launched. This program provides an incentive to companies to develop clean energy
projects that require the lowest amount of ratepayer funding. The ZREC/LREC program utilizes a reverse
auction structure to capture maximum generation capacity per ratepayer dollar spent. At the heart of the
―Connecticut model‖ for cheaper and cleaner energy lies a commitment to having the State depart from
the common practice of ―picking winners.‖ Rather, the model aims to allow market competition to identify
the most cost-effective projects, while creating a platform that will encourage a wide range of
entrepreneurial efforts. The ZREC/LREC program is emblematic of this approach and this strategy has
already begun to pay off. The first year of the ZREC/LREC will result in more than 31 MW of clean
generation being deployed at an average subsidy level of 9 cents per kWh. This is some of the lowest
priced clean energy in the country, and even further cost reductions in future years seem likely.
As noted earlier, DEEP is undertaking a study — separate from this Strategy — to evaluate options for
cost-effectively meeting the State‘s renewable power goals. Study objectives include an evaluation of the
impacts of the State‘s current 20%-by-2020 RPS target, determination of the appropriate RPS target, and
a reassessment of the State‘s current definition of renewable power. Some potential options for updating
42
CEFIA, ―Residential Solar Incentives.‖ Available at http://www.energizect.com/residents/programs/residential-solar-investment-program.

2013 Connecticut Comprehensive Energy Strategy
Chapter 3: Electricity Sector Strategy
90
the State‘s RPS could include qualifying other resources such as geothermal that replaces electric use, the
inclusion of large-scale hydropower from Canada and elsewhere, changes to Class III efficiency and
Combined Heat and Power (CHP), regional procurement approaches, and the potential for cost-effectively
developing in-state resources. Consideration will also be given to whether the current percentages for
various classes of renewables and the timeframes for compliance are still supportive of the RPS‘s overall
objectives. The RPS study will consider the regional renewables potential, including where resources are
located, their transmission and siting requirements, and the total costs for each resource. The overarching
goal of this study is to meet Governor Malloy‘s commitment to cheaper and cleaner power.
DEEP is also working with other New England states through a coordinated procurement process
organized by the New England State Committee on Electricity (NESCOE) to identify opportunities to cost-
effectively expand renewable energy development in the region. As part of that work, it will be essential to
understand the challenges and expenses associated with transmission and siting concerns for the
generation itself and the complexities of coordination with other states in the region regarding planning,
permitting, and cost allocation. For example, as the 2012 IRP points out, the processes to approve
transmission and fairly allocate costs across state borders are not yet resolved.43 Since regional, non-
Connecticut resources such as onshore wind may be the most cost-effective large scale renewables, greater
clarity about the costs and benefits of regional development and their associated transmission will help
ensure that Connecticut is in a strong position to inform its involvement in any regional renewable
solicitation.
It is important to point out that New England is not facing a renewable power shortfall because the region
lacks the technical potential to develop such resources. Rather there has not been a carefully designed
strategy that spells out how to access, finance, and integrate potential sources of renewable electricity in a
cost-effective way. Studies show that the New England region has a large and diverse supply of potential
low-carbon energy sources, equal to nearly 3.7 million gigawatt hours per year, or 37 times the amount of
energy that was needed to meet the region‘s demand for electricity in 2010.44 It is clear, however, that
each of the potential sources of renewable power faces its own unique challenges, including siting and
costs. It is important that each renewable power project be considered in light of other state policy
objectives, such as optimizing the way land is used in the state.
On the other hand, it is unclear how much of this technical renewable potential is economically viable now
or in the future. Across the United States, renewable power prices are declining rapidly. The cost of wind
43
See Connecticut Department of Energy and Environmental Protection, ―2012 Integrated Resource Plan for Connecticut.‖ Available at http://www.ct.gov/deep/lib/deep/energy/irp/2012_irp.pdf.
44 Lopez, Renewable Energy Technical Potentials. Available at http://www.nrel.gov/docs/fy12osti/51946.pdf.

2013 Connecticut Comprehensive Energy Strategy
Chapter 3: Electricity Sector Strategy
91
power has dropped by 2-15% since 1998, depending on the type of wind resource.45 The best wind
resources can now compete with natural gas generation. The per-kilowatt-hour installed cost of solar
photovoltaic (PV) systems has declined by 35% in the past decade. Some experts expect solar PV systems
to cost less than retail rates for electricity purchased from utilities within the next five years, even without
subsidies (but that cost will still be more than the wholesale cost of gas-fired generation).46
The Importance of a Portfolio Approach to Renewable Power Development
Diversity is a key element of a successful integration of variable renewables, both with respect to the type and location of
resources. Diverse types of resources can complement each other. For example, solar PV provides power in the daytime,
while wind power often provides its largest output at night. Similarly, with respect to the location of resources, while solar
panels in one part of the State may be shaded by clouds, those located elsewhere may be under sunny skies. Beyond
onshore wind and solar, other types of low-carbon sources — such as wave or tidal power or new small-scale hydropower —
are not currently viable but over time may become available at appealing costs. Their integration into the State’s electricity
system could contribute to the system’s diversity, and in turn its reliability.
These price trends are having an impact in Connecticut and the New England region. In Connecticut
(where we have limited in-state wind potential) and the New England region as a whole, high
transmission costs are barriers to capturing the full potential of wind resources.47 The largest potential
cost-competitive clean energy resource in Connecticut is solar PV generation. Both solar PV systems and
fuel cells can work within the current distribution system and so require no new investment in
transmission. The combined potential for utility scale solar installations — which exceed one megawatt in
capacity and are mounted on the ground (ideally on underutilized lands) — and smaller rooftop solar
systems, dwarf other low-carbon resources that might be developed in the state at this time.48 Currently,
both utility scale and rooftop solar systems are typically more expensive than out-of-state renewable
options, but costs for both resources are falling rapidly (rooftop costs shown in Figure 5). Estimates from
consultants Black & Veatch show the costs of utility-scale and rooftop solar PV systems declining by 13%
and 37%, respectively, between 2010 and 2020.49
45
Barbose, Tracking the Sun IV; and Wiser, ―Cost of Energy from U.S. Wind Projects.‖ Available at http://eetd.lbl.gov/ea/ems/reports/lbnl-5047e.pdf.
46 Black & Veatch, Cost and Performance Data. Available at http://bv.com/docs/reports-studies/nrel-cost-report.pdf.
47 Lazard, Levelized Cost of Energy. Available at http://blog.cleanenergy.org/files/2009/04/lazard2009_levelizedcostofenergy.pdf.
48 Rooftop and utility-scale solar PV have a technical potential of 33,601 gigawatt-hours per year. Excluding on/off-shore wind and enhanced geothermal, which are currently not developable in Connecticut, the other renewables account for a potential of 1,893 gigawatt-hours per year. See Lopez, Renewable Energy Technical Potentials. Available at http://www.nrel.gov/docs/fy12osti/51946.pdf.
49 Black & Veatch, Cost and Performance Data. Available at http://bv.com/docs/reports-studies/nrel-cost-report.pdf.

2013 Connecticut Comprehensive Energy Strategy
Chapter 3: Electricity Sector Strategy
92
FIGURE 5: Historic and projected costs of rooftop solar PV in Connecticut and the United States.
This figure shows the average levelized cost of residential rooftop solar PV in Connecticut, which allows the cost to be compared directly to retail rates. At typical financing and performance assumptions for a residential system in Connecticut, the 2001 installed cost of $13.81/W (direct current) equates to a levelized cost of energy of $0.73 per kilowatt-hour, while today‟s average cost of $5.29/W (direct current) equates to $0.28 per kilowatt hour. For comparison, see the levelized cost of hypothetical systems installed in Connecticut with average U.S. installed costs and future projected costs from Black & Veatch.
Source: CEFIA, ―PowerClerk Data Export‖; CEFIA, ―PV On Site Project Dashboard‖; Barbose, Tracking the Sun IV; Black & Veatch, Cost and Performance Data; U.S. EIA, ―Average Retail Price of Electricity‖; and NREL, ―System Advisor Model.‖
Connecticut has an opportunity to further accelerate price reductions in solar PV. A survey of the rooftop
solar PV market in Connecticut reveals a very wide range in installed costs. The most expensive
installation in Connecticut today costs about five times more per kilowatt than the least expensive option.
This spread in project costs is not unique to Connecticut, as illustrated by the data for rooftop installations
in Connecticut and California over the past several years (Figure 6). It suggests that a carefully
constructed set of incentives designed to drive down costs combined with an unwavering commitment to
find and adopt ―best practices‖ could yield significant benefits.
$-
$0.10
$0.20
$0.30
$0.40
$0.50
$0.60
$0.70
$0.80
2000 2010 2020 2030 2040 2050
Levelizedcostofelectricity,$/kWh
Connec cut
UnitedStates
projected
retailrate

2013 Connecticut Comprehensive Energy Strategy
Chapter 3: Electricity Sector Strategy
93
FIGURE 6: Minimum, median, and maximum costs for solar PV projects in Connecticut and California, 2001–2012
While the median costs of energy from residential and commercial solar PV systems have been declining in both Connecticut and California, both states have a huge spread in costs from project to project. Cost ranges are tighter for commercial installations, which typically have more “buying power” than homeowners and often shop around for the most competitive bids.
Source: CEFIA, ―PowerClerk Data Export‖; CEFIA, ―PV On Site Project Dashboard‖; Go Solar California, ―California Solar Statistics‖; and NREL, ―System Advisor Model.‖
A portion of this spread is due to uncontrollable factors that make some projects more challenging than
others (e.g., roof type and accessibility), but much of it is driven by differences in the experience,
capability, and project scale of solar installers. If every installation in Connecticut came in at the costs of
the least expensive quartile of solar projects, average installed costs would be 40% lower — and the cost of
the electricity these projects produce would approach or beat residential retail rates (Figure 7).50
50
See Appendix B (Electricity) for more details.
min
lowerQ
median
upperQ
max
$-
$0.20
$0.40
$0.60
$0.80
$1.00
$1.20
2000 2002 2004 2006 2008 2010 2012
Levelizedcostofenergyfromroo
opsolarPV,$/kWh
(withFederalITC
butnostateincen
ves)
installa onyear
CTres
CTcomm
CAres
CAcomm

2013 Connecticut Comprehensive Energy Strategy
Chapter 3: Electricity Sector Strategy
94
FIGURE 7: The opportunity for cost reductions in rooftop solar PV in Connecticut
All residential solar PV projects would be cheaper than retail electricity rates (dashed line) if installers could achieve top quartile performance for material and installation costs. Connecticut must work to create scale and drive down installation costs now, while the Federal 30% investment tax credit is still in place, to prepare for its expiration in 2016. All costs exclude existing state incentives. “Balance of system” costs make up the remainder of an installation‟s cost, after counting hardware, design, installation, permitting, and interconnection. These costs typically include installer marketing, customer acquisition, and overhead.
Source: Analysis based on CEFIA, ―PowerClerk Data Export‖; CEFIA, ―PV On Site Project Dashboard‖; and Wesoff, ―Germany Solar Installations.‖
To explore this important point in more detail, today‘s average installation cost — including the federal
30% investment tax credit, but no state subsidies — is 25¢/kWh in Connecticut. In contrast, the average
cost for the least expensive quartile of installations is only 16.3¢/kWh. That is only slightly higher than the
average residential energy-only rate of 14¢/kWh for CL&P residential customers, and lower than UI‘s
average residential energy-only rate of 18.6¢/kWh.51 With net metering, the electricity generated by
rooftop solar systems that offsets the customer‘s consumption is credited to the owner of the system at the
full retail rate. That means solar PV costs that are below the full retail rate reduce a customer‘s electricity
bill, making an enticing financial case for anyone who has contemplated installing solar systems.52
Many countries and states, including Connecticut, have already seized on the opportunity to implement
policies aimed at reducing solar costs. Experience with the ZREC program indicates that a more
51
PURA Docket 12-01-01, ―Administrative Proceeding To Review The Connecticut Light And Power Company's Rates And Charges Effective January 1, 2012.‖ Available at http://www.ct.gov/pura/docketsearch.
52 Using the retail rate as a benchmark does not, however, fully represent costs from a system standpoint, since avoided fixed transmission and distribution costs have to be shifted to other customers or reassigned on a non-volumetric, non-avoidable basis.

2013 Connecticut Comprehensive Energy Strategy
Chapter 3: Electricity Sector Strategy
95
competitive solar market can reduce the average cost of installation. Recent results from the program
demonstrate that utilizing the ―reverse auction‖ structure of the ZREC program effectively drives down
installed costs in the industry. The program has demonstrated the ability to deliver Renewable Energy
Credit (REC) payments that are around half the price of solar deployment programs in other states.53
CEFIA‘s Residential Solar Investment Program (RSIP) is also contributing to the decline in average
residential system cost by attracting solar installers with incentives that decline over time. Since the start
of the program, average residential systems installed through the RSIP have declined by 5%.54
As the cost of materials and labor drops, ―soft costs‖ associated with solar installations (i.e., permitting,
siting, and interconnection fees) account for a growing share of the overall cost of a solar installation.
Many states and countries have launched policies and initiatives aimed at reducing these ―soft‖ costs. For
example, Germany uses widespread training and certification programs, and streamlined permitting
processes to improve the efficiency and lower the costs of solar installations. In the United States, non-
hardware or soft costs are more significant than in Germany, representing 30-50% of solar PV installation
costs in recent years.
Permitting fees in the 169 Connecticut jurisdictions are generally uncapped and vary widely, while wasted
time and delays due to inefficient and inconsistent permitting, inspection and interconnection processes
and requirements add cost to installer labor or overhead. Solutions include implementation of best
practices including: streamlined processes and application requirements and forms, fees based on
recovering processing costs, making information on processes readily available online, online permitting
to save installer travel and jurisdiction processing time, and legislation that would standardize and
streamline the process.
Connecticut, along with Massachusetts, California, and Oregon, is also using a ―Solarize‖ program to drive
down installation costs by working with municipalities to aggregate residential customers.55 This pooling
allows installers to bid for larger installation quantities and to reduce customer acquisition costs. While
the State has a number of incentives to help promote solar PV adoption, driving to top quartile cost
reduction performance would help increase adoption rates and ensure that they continue at a high level
even after the expiration of state and federal incentives. Under prices bid by installers as part of CEFIA‘s
ongoing Solarize pilot, it is now possible to forecast installed costs for residential solar PV in Connecticut
that approach grid parity.
53
Connecticut Department of Energy and Environmental Protection, Low and Zero Emissions Renewable Energy Credit Program. Available at http://www.ct.gov/deep/cwp/view.asp?a=4120&Q=503720.
54 This figure is current through August 2012.
55 Irvine, The Solarize Guidebook. Available at http://www.nrel.gov/docs/fy12osti/54738.pdf; and Solarize CT Program. Available at http://solarizect.com/.

2013 Connecticut Comprehensive Energy Strategy
Chapter 3: Electricity Sector Strategy
96
Solarize Connecticut is still in its early stages, but its cost reduction strategy appears promising. In the
summer of 2012, the installer bids selected for the first four Solarize pilot communities reflected pricing
10-30% below the current average installed cost for residential solar PV in the state. Some installers bid as
low as a 40% discount off current averages. These numbers suggest that Solarize aggregation strategies
could help dramatically lower the cost of residential solar PV for Connecticut homeowners, and
potentially drive significantly accelerated deployment. Table 1, below, reflects the levelized cost of
electricity for residential solar PV under a variety of financing scenarios.
TABLE 1. Declining Average Installed Costs of Residential Solar PV Lead to a Lower Levelized Cost of Energy:
Source: CEFIA Analysis of Residential Solar Investment Program Data through September 2012
The second scenario outlined in Table 1 is reflects the federal Investment Tax Credit (ITC), which is in
effect through 2016 and eliminates 30% of the upfront costs, leaving the remaining 70% to be financed at
market rates. This scenario demonstrates that as efforts such as Solarize Connecticut help drive down the
installed cost per watt of solar PV (from current averages of $5.00/watt to $3.50/watt, and potentially
even lower), residential solar systems can produce electricity at an effective price close to retail grid parity,
even without significant state incentives.
Connecticut is also one of 22 national recipients of U.S. Department of Energy (DOE) SunShot Initiative
funding to reduce soft costs through the Rooftop Solar Challenge.56 The focus of the Connecticut Rooftop
Solar Challenge is to streamline and standardize processes, remove barriers, reduce soft costs and fees
associated with permitting, inspection, interconnection, net metering, and planning and zoning for
rooftop solar PV. The Rooftop Solar Challenge project will help inform work on crafting state-level
recommendations for guidance and/or legislation aimed at streamlining processes and removing other
barriers to installing significantly more rooftop solar PV in Connecticut
56
See U.S. Department of Energy, Rooftop Solar Challenge. Available at http://www.eere.energy.gov/solarchallenge/. This program is administered in Connecticut by CEFIA.

2013 Connecticut Comprehensive Energy Strategy
Chapter 3: Electricity Sector Strategy
97
Fuel cells, which are defined as Class I renewable resources in Connecticut, are another important
element of the renewable resources strategy. Fuel cells can help the state meet its RPS goals as well as
provide a highly reliable source of distributed generation that can be the power source for local
microgrids. Better integration and support of fuel cell usage into the state‘s homes, industrial facilities,
and cars would provide a clean source of reliable power and Connecticut jobs.
Ensuring System Reliability
Electric power must be delivered 24 hours a day, 365 days per year, without interruption. Providing such
reliability involves three important components: resource adequacy, transmission security, and
distribution resiliency. ―Resource adequacy‖ refers to the fact that grid operators must, in practical terms,
have enough electricity supply to meet demand in every hour of each year even if some resources are
temporarily disabled. ―Transmission security‖ is the system‘s ability to deliver electricity to the
distribution system (i.e., the ―last mile‖) while protecting individual facilities and maintaining the overall
stability of the grid as system conditions change. Lastly, ―distribution resiliency‖ refers to the capability of
the distribution system to provide power from the transmission system to end-use customers under all
conditions as well as to restore service quickly in the event of storms or other disruptions. The vast
majority of service interruptions occur at the distribution level, both in Connecticut and nationally.
Unfortunately, the cost of improving distribution reliability may be high relative to the cost of improving
resource adequacy and transmission security.
The State plays a small but important role in ensuring resource adequacy. ISO New England determines
the installed capacity requirement for New England and conducts a forward capacity market to ensure
that there are adequate resources available to meet resource needs. Connecticut‘s role is to ensure that its
policies support sufficient levels of generation capacity, especially within the state‘s sub-areas, that the
market will respond to efficiently and at competitive prices. The State has stepped in when necessary and
taken actions to ensure resource adequacy when the market has failed to respond to price signals. As an
example, the State conducted procurement for peaking capacity to fill the need for local reserves when the
market failed to respond to price signals for several years. If it finds that the current capacity markets are
not delivering sufficient incentives for the development of adequate resources at just and reasonable rates,
the State can advocate for process changes before ISO New England and the Federal Energy Regulatory
Commission (FERC), or it can consider sponsoring long-term contracts to address its specific needs.
Connecticut‘s renewable energy goals will indirectly affect the state‘s power resources in the future.
Connecticut and other New England states have committed to achieving a much higher penetration of
renewable resources such as wind and solar. It is important to note that some renewable power
technologies may pose operational challenges if developed on a large scale, because their output cannot be
2013 Connecticut Comprehensive Energy Strategy
Chapter 3: Electricity Sector Strategy
98
perfectly forecast and fluctuates throughout the day. These challenges demand new sources of system
flexibility, which may come from larger operating reserves.57 Operating reserves are electric generating
resources that are held back from use until they are needed to replace generating sources or transmission
lines that unexpectedly stop working. In the future, operating reserves could also be used to balance the
system when the output from solar PV or wind power drops.
In the short-term, the level of variable resources in the overall supply mix is sufficiently small relative to
the total system that additional investment to integrate variable resources will not be needed for some
time. Many systems around the world have successfully integrated up to 20–25% variable renewables
without much change to system operations or costs. ISO New England and its stakeholders are already
discussing ways to make sure the system has enough other flexible resources to balance the hourly and
minute-by-minute ups and downs of intermittent renewables.
The State plays an even more limited role in ensuring transmission adequacy and security. The ISO New
England and FERC share responsibility for oversight of transmission lines. But, the State does have a role
in working with ISO New England and FERC to ensure that federal planning fairly considers non-
transmission alternatives that might meet identified needs at lower cost. DEEP is committed to playing a
more active role in FERC and ISO New England proceedings to ensure that the transmission strategies
developed and the incentives and rates of return provided for transmission projects are well-conceived
and consistent with the goals of this Strategy.
In contrast to resource adequacy and transmission security, distribution resiliency is directly overseen by
PURA and implemented by the electric distribution companies. Distribution outages are by far the biggest
challenge for ensuring reliability. They are also the most complicated (and potentially costly) to address.
While Connecticut‘s distribution system is fairly reliable day-to-day (as seen in Figure 4 above), it is
vulnerable to major disruption in extreme events, such as the three storms that hit the State in 2011 and
2012.
In the wake of those storms, the State has taken several steps, described below, to reduce the chances of
such prolonged outages. A ―Two Storm Panel,‖ convened by Governor Malloy, identified several
approaches to improving resilience, including better vegetation management, infrastructure hardening,
undergrounding of utility lines, improved communications and emergency response timing and practices,
better backup generation for critical loads, and microgrid designs that could support critical services at
57
The Brattle Group, Resource Adequacy Renewable Energy. Available at http://www.brattle.com/_documents/uploadlibrary/upload878.pdf.

2013 Connecticut Comprehensive Energy Strategy
Chapter 3: Electricity Sector Strategy
99
times of major outages.58 Each measure has significant costs and tradeoffs that must be evaluated. For
example, putting wires underground can avoid large outages, but can be prohibitively expensive.
In response to a recommendation from the Two Storm Report, DEEP established a Vegetation
Management Task Force to produce specific standards and guidelines regarding management of tree
trimming along Connecticut's roads. The Task Force recently recommended steps the State,
municipalities, utilities, and property owners can take to improve the resiliency of roadside trees and
forests against future catastrophic weather events while ensuring the reliability of the State‘s power grid.59
This Strategy proposes that the guidelines advanced — most notably the principle of ―right tree, right
place‖ — guide the State, municipalities, and our utilities.
In response to proceedings conducted by PURA, the State‘s utility companies are required to develop
strategies to improve system reliability.60 For example, CL&P, the utility whose service area was most
affected by the 2011 storms, is already conducting a more aggressive tree trimming and infrastructure
hardening program that will enhance the resiliency of the traditional grid. PURA has also ordered the
following measures:
CL&P shall implement a maintenance tree trimming program based on a four-year trim cycle.
CL&P shall redesign the interface between the call center technologies and the outsource
Interactive Voice Record vendor to improve communications as well as other initiatives directed
at its town liaison program and communication of restoration times to customers and public
officials to improve storm related communications.
CL&P shall implement the rollout of additional technology that provides real time electronic
communication capability to enable real time status updates from the field regarding the status of
restoration efforts.
CL&P has undertaken a number of actions in response to the various reports and hearings to improve the
company‘s planning process and to invest in needed programs. CL&P indicates that it has allocated an
additional $7.3 million in 2012 to support maintenance tree trimming and an additional $20 million to
support enhanced tree trimming. CL&P also recently submitted a system resiliency program to PURA that
includes proposals for pole administration and certain distribution equipment upgrades in accordance
with an updated emergency preparedness response plan.
58
McGee, Two Storm Panel Report. Available at http://www.ct.gov/deep/lib/deep/forestry/vmtf/two_storm_panel_final_report.pdf.
59 State Vegetation Management Task Force, ―Final Report Issued to the Department of Energy and Environmental Protection, August 28, 2012.‖ Available at http://www.ct.gov/deep/lib/deep/forestry/vmtf/final_report/svmtf_final_report.pdf.
60 See PURA Dockets. 11-09-09, 12-06-09 and 12-07-06. Available at http://www.ct.gov/pura/docketsearch.

2013 Connecticut Comprehensive Energy Strategy
Chapter 3: Electricity Sector Strategy
100
In addition to ―hardening‖ the existing distribution system, additional deployment of distributed
generation and backup generation would provide independent power sources. Another key element of
system reliability is the security of the grid itself. Grid security has been identified by many experts, from
the President of the United States on down, as a glaring hole in our nation‘s cyber and physical security.
Since any attack on the state‘s power grid would have devastating consequences for Connecticut residents
and businesses, a sharpened focus on electricity grid security and understanding of what the State can do
to mitigate that vulnerability is critical.
As many commenters, including the Office of Consumer Counsel and the Connecticut Energy Advisory
Board noted, infrastructure planning is an important issue for the State to monitor and act on, if
necessary. New mechanisms are needed to ensure that adequate gas supply is reliably available to meet
increased demand for natural gas for both building heating and electricity generation. This problem is
particularly acute during periods of very cold weather, as Connecticut has experienced in early 2013. As a
member of the New England States Committee on Electricity (NESCOE) DEEP continues to participate in
and closely monitor the regional efforts to understand and monitor the status of natural gas supply into
the region. NESCOE has initiated a two phase natural gas study as part of a regional effort to analyze the
current and future natural gas fuel supply and infrastructure in New England and to assist policymakers‘
understanding of the future implications for natural gas-fired power generation in New England, power
system reliability and consumer costs over the long-term. Phase 1 of the study assessed the adequacy of
natural gas infrastructure in New England based on the studies and information available to date. This
analysis suggested the potential for infrastructure inadequacy as the regional demand for natural gas
increases.
An outcome of Phase I was the conclusion that additional information and analysis is necessary to ensure
a comprehensive discussion of the region‘s potential infrastructure needs and challenges. NESCOE is
currently in the process of conducting Phase II of its natural gas study. A key item highlighted by
NESCOE as an important point of analysis for the Phase II study is a cost-benefit analysis of any potential
solutions to addressing the region‘s infrastructure challenges, aimed at preserving system reliability.61
Cyber Security
Cyber security and the need to detect, deter, and if necessary manage the effects of a cyber disruption of
Connecticut‘s public utilities are matters of concern to Connecticut‘s public officials, utilities, and
customers. Addressing Connecticut‘s cyber vulnerabilities is part of the larger, national effort to detect,
deter, and manage all forms of cyber disruption across the United States in private and public use of
61
NESCOE’s Phase I Gas Study can be accessed at http://www.nescoe.com/uploads /Phase_I_Report_12-17-2012_Final.pdf. Additional information on both phases of the study, including updates to the progress of Phase II, can be found at http://www.nescoe.com/Gas_Supply_Study.html.

2013 Connecticut Comprehensive Energy Strategy
Chapter 3: Electricity Sector Strategy
101
internet communication. The challenges are obviously vast and complex. Connecticut must ensure that
its utilities establish, update, maintain, and practice cyber defense and management capabilities
commensurate with high industry standards. A concerted effort will be required to develop a game plan
to meet this standard of protection – and this Strategy makes improved cyber security a priority.
Should We Underground Our Power Lines?
In the wake of the severe power outages of 2011 and 2012, some observers suggested that Connecticut adopt a system-wide
commitment to putting its electric lines below ground. DEEP has explored this issue, and concluded that while undergrounding
would make sense in some circumstances, it cannot be adopted as a state-wide policy because such a commitment would
entail an expense that would not be justified by the benefits that would accrue. The average cost of putting existing distribution
lines underground is around $5 million per mile for urban settings, with lower figures for suburban and rural environments62
.
Depending on how many miles of power lines have been undergrounded already, this could easily increase retail electricity
rates in excess of 200%. Further, undergrounding is not always the best option for ensuring reliability. Whereas outages may
occur less frequently with an underground line, outages can last much longer when an underground line must be repaired.
Additionally, some studies show that overhead lines are more reliable than underground lines at later stages in their life cycle.
Microgrids
The passage of Connecticut Public Act 12-148 acted to bolster resiliency by requiring investments in many
of the approaches described above. Specifically, the law requires utilities to develop better emergency
response plans and creates financial incentives to induce better emergency response and provide more
backup generation at key sites. In accordance with other provisions in the Act, DEEP has launched a pilot
program that will support the development of some initial microgrids to protect critical facilities like
hospitals, public shelters, police and fire stations, water treatment plants, and telecommunications
towers. 63
In municipal centers, where a system of distributed generation can be ―islanded,‖ microgrids
would allow some number of grocery stores, gas stations, and other facilities to stay ―up‖ when the grid
fails.64 Although the technology is relatively new to the United States, numerous microgrids exist around
the world. In line with the global trend, Connecticut should proceed to test different ways of deploying
distributed generation and microgrids to mitigate the impact of widespread power outages. A microgrid
entails a system of 24/7 local generation (not simply back-up generation) and a system of ―trips‖ and
―transfers‖ that modifies the existing distribution infrastructure so as to isolate the ―microgrid‖ to provide
power even when there is a large-scale grid outage. DEEP is currently reviewing 36 proposals for potential
microgrids and will provide some portion of them additional technical development assistance. The
62
Edison Electric Institute, ―Out of Sight, Out of Mind,‖ January 2013. Available at http://www.eei.org/ourissues/electricitydistribution/documents/undergroundreport.pdf.
63 Connecticut Public Act 12-48, ―An Act Enhancing Emergency Preparedness,‖ (2012).
64 See DEEP Energy Filings, ―Public Act 12-148 – Section 7 – Microgrid Grant and Loan Pilot Program.‖ Available at http://www.ct.gov/deep/energyfilings.

2013 Connecticut Comprehensive Energy Strategy
Chapter 3: Electricity Sector Strategy
102
program is scheduled to deliver a first round of pilot microgrid projects beginning in the summer of 2013
and continuing through 2014.
Most critical sites, such as hospitals and police stations, already have access to backup power. But in some
instances, backup generators do not have the firm fuel supplies needed to operate through a long outage
or are not in proper condition to run continuously for long periods. New backup standards, such as
designing for longer operational independence or requiring regular testing or minimum fuel supplies for
existing backup systems, could bolster resilience. Over the long term, distribution level resiliency can be
enhanced by smarter, more distributed, or otherwise novel grid architectures, including microgrids.
Further, as Connecticut becomes increasingly reliant on aging nuclear units and gas fired generation, the
interdependencies between the gas and electric markets will be a critical factor in maintaining system
reliability. Recent analysis indicates that there is sufficient flexibility in the electric system to meet
reliability needs in New England, but meeting the daily operating needs is increasingly a challenge to
system operators. The immediate challenge facing the region is to better align the gas and electric markets
while making sure the markets send the proper price signals to participants. Connecticut has an
opportunity to help ensure regional system reliability by taking a leading role in the discussions that are
taking place at ISO New England, the New England Power Pool, and FERC related to gas-electric
reliability. In the longer term, Connecticut must work with other states in the region, or independently if
necessary, to ensure that enough pipeline capacity is available to allow Connecticut ratepayers to access
new regional shale gas supplies that can provide economic and environmental benefits in the electricity
and home heating sectors while also ensuring capacity for generation. Connecticut is working with
NESCOE to conduct a study aimed at answering many of these questions, so that it will be in a position to
play an integral part in the regional discussions.
Electricity Sector Strategy: Recommendations
For the reasons discussed above, this Strategy makes the following recommendations to better enable
Connecticut residents and businesses to take advantage of the opportunities outlined in this Chapter and
to transform the existing electric system into one that meets the State‘s energy needs at the least cost
while using the cleanest resources and ensuring greater reliability.
1. Expand Conservation & Load Management Funding to Invest in All Cost-Effective Electric Efficiency
Energy efficiency represents the most cost-effective way to lower the electric bills for all of Connecticut‘s
residential and business ratepayers. Thus, a central conclusion of this Strategy is that the State must
aggressively pursue expanded levels of efficiency across all sectors (government, commercial, industrial,
and residential). To ensure that Connecticut ratepayers achieve benefits more commensurate with those
in neighboring states, increasing investments in energy efficiency is one of the primary recommendations

2013 Connecticut Comprehensive Energy Strategy
Chapter 3: Electricity Sector Strategy
103
of both the 2012 IRP and this Strategy.65 This recommendation is discussed in greater detail in Chapter 1
(Efficiency).66
2. Reduce Peak Demand and Improve Load Factor Through Technology and Pricing
This Strategy recommends that the State increase awareness about the opportunities for larger customers
to enroll in demand response programs and that it invest in technologies that will also allow smaller
customers, including residential customers, to participate in these programs. In addition to targeting
energy savings, the State‘s energy efficiency programs should more aggressively pursue peak demand and
peak energy reductions and establish metrics that will enable the Energy Efficiency Board to determine
the most cost-effective ways to control demand.
This Strategy further recommends that CL&P submit a detailed plan to PURA for a phased in multi-stage
roll out of advanced meters in a manner that minimizes stranded costs, prioritizes adoption by customers
most likely to benefit from their use, and provides for hybrid rate structures and/or affordable basic
service for customers opting out of any installation program. The Strategy also recommends that CL&P
not promote time-of-use rates to its residential customers until advanced meters are available, but that
time-of-use rates be reactivated as these meters are installed.
This Strategy recommends that UI promote time-of-use rates to all of its customers. Both UI and CL&P
should provide information to customers about ways to conserve energy and the opportunity to
participate in the State‘s energy efficiency programs. UI should also develop and promote additional
dynamic pricing options for its customers.
3. Align Utilities’ Incentives with Achieved Efficiency Savings and Other Performance Metrics
Utilities have traditionally had a disincentive to promote energy efficiency, because their revenues were
determined by the amount of electricity they delivered, so that any efforts to lower customer use of
electricity would reduce their revenues. This disincentive can be eliminated through a regulatory
mechanism called ―decoupling,‖ which enables the utility to recover its allowed costs even as sales decline
due to efficiency gains. Decoupling can lower customers‘ energy bills while providing utilities assurance
that they will collect the money they need to operate their systems.67
The General Assembly has long recognized the need for decoupling. Legislation enacted two decades ago,
required the former DPUC (now known as PURA) to investigate the relationship between utilities‘ sales
65
Connecticut Department of Energy and Environmental Protection, ―2012 Integrated Resource Plan for Connecticut.‖ Available at http://www.ct.gov/deep/lib/deep/energy/irp/2012_irp.pdf.
66 See Recommendation ―1. Provide Sufficient And Consistent Long-Term Funding For Efficiency Programs‖ in Chapter 1 (Efficiency).
67 Satchwell, Andrew, Peter Cappers, and Charles Goldman. Ernest Orlando Lawrence Berkeley National Laboratory, "Carrots and Sticks: A Comprehensive Business Model for the Successful Achievement of Energy Efficiency Resource Standards." Available at http://eetd.lbl.gov/ea/emp/reports/lbnl-4399e.pdf.

2013 Connecticut Comprehensive Energy Strategy
Chapter 3: Electricity Sector Strategy
104
and earnings, and to set rates in a way that encouraged the use of conservation and load management
programs.68 The DPUC was required to balance a variety of factors, including a utility company‘s success
in complying with state energy conservation goals with the impact on rates. More recently, Section 107 of
Public Act 07-242 directed the DPUC to ―order the state's gas and electric distribution companies to
decouple distribution revenues from the volume of natural gas or electricity sales through any single or
combination of the following strategies: (1) A mechanism that adjusts actual distribution revenues to
allowed distribution revenues, (2) rate design changes that increase the amount of revenue recovered
through fixed distribution charges, or (3) a sales adjustment clause, rate design changes that increase the
amount of revenue recovered through fixed distribution charges, or both.‖ This order required the DPUC
to consider the impact of decoupling on the gas or electric distribution company's return on equity and
make adjustments as necessary.
To date, however, UI is the only regulated utility in Connecticut that has full decoupling, and that is only
on a pilot basis. UI‘s decoupling mechanism, established in 2009, provides the utility the difference
between the actual revenue it collects and revenue necessary to cover expenses approved by the
regulators.69 Under this structure, UI submits an annual filing to PURA and is either allowed to collect
any revenue shortfall, or required to issue a refund if it collects more than the allowed revenues. In 2009,
UI collected $1.9 million less than its approved revenue, and was allowed to recover this amount from
customers.70 In 2010, UI collected $1.3 million more than its approved revenue and therefore issued a
refund to its customers. UI‘s decoupling was initially approved as a pilot program. PURA extended the
pilot period in 2011, and will decide whether to continue decoupling during UI‘s next general rate case.71
Earlier, the DPUC had implemented decoupling through rate design for CL&P in 2007, but denied full
68
Conn. Gen. Stat. § 16-19kk(b) and See Conn. Gen. Stat. § 16-19tt, codifying Section 107 of Connecticut Public Act 07-242, ―An Act Concerning Electricity and Energy Efficiency,‖ (2007).
69 See PURA Docket 08-07-04, ―Application of The United Illuminating Company To Increase Its Rates and Charges,‖ Decision, February 4, 2009. Available at http://www.ct.gov/pura/docketsearch.
70 See PURA Docket 08-07-04RE02, ―Application of The United Illuminating Company To Increase Its Rates and Charges – Review of Decoupling Pilot, Pension Tracker, ROE Sharing Mechanism and GET Adjustment,‖ Decision, September 1, 2010. Available at http://www.ct.gov/pura/docketsearch.
71 See PURA Docket 08-07-04RE03, ―Application of The United Illuminating Company To Increase Its Rates and Charges – Review of Decoupling Pilot, Pension Tracker, ROE Sharing Mechanism and GET Adjustment,‖ Decision, August 31, 2011. Available at http://www.ct.gov/pura/docketsearch.

2013 Connecticut Comprehensive Energy Strategy
Chapter 3: Electricity Sector Strategy
105
decoupling for CL&P in 2010. 72,73 Two of Connecticut‘s three natural gas utilities have requested that the
DPUC implement decoupling, but both of these requests were denied.74 This pattern must change.
Decoupling mechanisms need to be designed carefully and should include consideration of potential
impacts on rates. But short-term impacts must not be used as an excuse not to undertake investments
with long-term benefits.
To truly effect cultural change within the utility (and shift the business model of distribution companies to
prioritize efficiency), decoupling must be a consistent regulatory commitment. It cannot be implemented
on an ―on-again, off-again‖ or pilot basis. Therefore, this Strategy recommends that PURA implement full,
permanent decoupling in the next general rate case for UI and CL&P. In addition, the Strategy
recommends that Section 16-19tt of the Connecticut General State be amended to require that ―a
mechanism that adjusts actual distribution revenues to allowed distribution revenues‖ be the sole
mechanism used to decouple revenues from sales for each of the state‘s gas and electric utilities.
While decoupling is an important step towards ensuring that the utilities effectively implement the State‘s
energy efficiency programs, it only removes a disincentive to delivering energy efficiency. It ―protects‖ the
utility from lost revenues if it succeeds in reducing customer demand for electricity. But it does adequately
reward efficiency. Currently, Connecticut‘s electric utilities are allowed to earn performance incentives for
achieving energy savings goals and meeting other targets as part of their administration of the State‘s
energy efficiency programs. But these ―bonus‖ opportunities have proven to be an insufficient incentive
to encourage all cost-effective efficiency. Performance-based benefits, tied to achievement of the greatest
efficiency for the least cost, should therefore be expanded in addition to decoupling, so as to fully
incentivize the utilities to implement efficiency programs in the most cost-effective way.
This Strategy further recommends that PURA implement additional performance-based incentives such
as authorizing a higher return on equity for success in meeting the State‘s public policy goals including
expanded energy efficiency. Such a ―bonus‖ should be tied to quantitatively-tracked results in achieving
success in restoring service after storm-related outages, a range of efficiency goals, grid reliability,
electricity costs, and perhaps other factors. This approach would allow each company to earn a
performance-based rate of return based on defined performance targets thereby creating substantial
incentives to improve results. Similarly, poor performance should result in a reduction in the base-line
72
See PURA Docket 07-07-01, ―Application of The Connecticut Light and Power Company to Amend Rate Schedules,‖ Decision, January 28, 2008. Available at http://www.ct.gov/pura/docketsearch.
73 See PURA Docket 09-12-05, ―Application of The Connecticut Light and Power Company to Amend Its Rate Schedules,‖ Decision, June 30, 2010. Available at http://www.ct.gov/pura/docketsearch.
74 See PURA Docket 08-12-06, ―Application of Connecticut Natural Gas Corporation for a Rate Increase,‖ Decision, June 30, 2009. Available at http://www.ct.gov/pura/docketsearch; and See PURA Docket 08-12-07, ―Application of The Southern Connecticut Gas Company for a Rate Increase,‖ Decision, July 17, 2009. Available at http://www.ct.gov/pura/docketsearch.

2013 Connecticut Comprehensive Energy Strategy
Chapter 3: Electricity Sector Strategy
106
rate of return. A similar construct could be developed for the gas companies tied to goals outlined in
Chapter 4 (Natural Gas). If PURA allows a performance-based return on equity that includes goals tied to
efficiency, the existing performance incentives incorporated into future C&LM program would need to be
adjusted.
4. Engage Vigorously in Regional and Federal Regulatory Processes
With the newly created DEEP Bureau of Energy and Technology Policy Connecticut has an excellent
opportunity to increase its engagement with other states and regional organizations to help shape the
policy direction and resulting FERC and ISO New England rules that so directly impact the State‘s ability
to shape its energy future. The Bureau can further the policy objectives of Governor Malloy, as outlined in
the Strategy, by working with the Connecticut legislative delegation and other representatives from New
England as well as on a national level to ensure that FERC‘s mandates clearly align with state and regional
energy and environmental policy goals. Additionally, the creation of the Bureau of Energy and Technology
Policy and the development of the Comprehensive Energy Strategy coincide with a time when many
important discussions are underway to decide how the region should deal with challenges facing the
electric industry as identified in ISO New England‘s Strategic Planning Initiative. Connecticut can play a
leading role in important regional discussions with ISO New England and the New England Power Pool
(NEPOOL) on issues such as the alignment of markets and planning, the region‘s increased reliance on
natural gas for electricity production, and designing the reserve and capacity markets so as to provide
market participants only the level of incentives needed to ensure an adequate level of supply.
5. Work with Municipalities to Expand Programs and Policies that Drive Down the Cost of In-State Renewable Resources
As discussed above, solar PV currently offer a substantial near-term renewable energy opportunity for
Connecticut. Although the costs of installed solar PV are still high relative to out-of-state renewable power
options, costs are falling fast and as described earlier, Connecticut‘s best solar installers provide systems
that operate at a cost below residential rates. This Strategy recommends that the State take steps to
ensure that the vast majority of installers meet this benchmark to drive the average installed cost of solar
PV below residential rates.
To complement existing programs, this Strategy proposes that the State and municipalities work together
to streamline permitting, siting, and other requirements to help reduce the ―soft costs‖ involved in solar
PV installations. As hardware costs continue to decline, customer acquisition and ―soft costs‖ will account
for a greater percentage of total costs.
Over the long-term, CEFIA should seek to expand the lessons learned from the Solarize Connecticut
model and its work under the DOE Rooftop Solar program in order to apply them to other renewable
energy systems (i.e., solar hot water systems, ground source heat pumps, etc.) in the residential sector.
These same lessons can be applied in the commercial and industrial sectors with the goals of reducing
2013 Connecticut Comprehensive Energy Strategy
Chapter 3: Electricity Sector Strategy
107
installed costs, rapidly increasing customer demand, and transitioning from subsidizing these
technologies towards financing them. In conjunction with these efforts, consideration should be given to
enabling property tax exemptions for clean energy projects.
6. Evaluate Options for Waste-To-Energy in Connecticut
Under Connecticut‘s RPS, waste-to-energy facilities largely comprise Class II generation in Connecticut.
These facilities also handle 50% of the State‘s solid waste. Historically, long-term contracts with the
electric distribution companies have been necessary to ensure the economic viability of these facilities
with the expectation that proceeds from the Class II market would provide a sustainable future revenue
source. However, many long-term contracts have ended, the Class II market is currently oversupplied,
wholesale energy prices have declined, and operating costs have increased. Reduced revenues, unsold
renewable energy credits (RECs), and increased costs have created financial hardship and raised concerns
about the consequences for the future of managing of the state‘s solid waste. This issue was highlighted in
the 2012 IRP and will need to be further explored as part of DEEP‘s RPS study, recommendations
developed by Governor Malloy‘s Recycling Task Force as well as any legislative proposals emerging from
DEEP‘s waste transformation efforts that will be presented to the legislature for consideration in its 2013
session.
7. Expand Virtual Net Metering Opportunities to Promote Deployment of Large-Scale Renewable Systems
Virtual net metering allows customers who operate behind-the-meter generation (i.e., the host) to assign
the surplus production from the generator to other metered accounts, such as designated beneficial
accounts that are not physically connected to the generator. The surplus production is then used to reduce
the electric bill of the beneficial account(s) through an accounting mechanism. Virtual net metering is
designed to encourage the installation of additional distributed generation by providing a financial model
that can make the investment economically feasible.
Section 121 of Public Act 11-80 authorized virtual net metering for Connecticut's municipalities and
allowed the electric distribution companies to credit surplus production to offset the generation service
charge, but not the distribution charge, of a municipality‘s beneficial accounts. Because most behind-the-
meter generation is not modeled in the ISO New England system, surplus production from these units
simply reduces system load within the electric distribution company‘s service territory and provides no
direct payment to the electric distribution company. Because no payment is made to the distribution
company, the offset to the beneficial account‘s retail generation charge creates a subsidy that is paid for by

2013 Connecticut Comprehensive Energy Strategy
Chapter 3: Electricity Sector Strategy
108
other ratepayers. The Act capped the subsidy at $1 million, which in turn limited the amount of
distributed generation that can be installed under this policy.75
An alternative way of incentivizing these projects would be to have these projects pay some portion of the
distribution charge in support of the grid, which promotes the State‘s energy and economic goals while
balancing the financial incentives needed to make renewable generation economical with the need for all
customers to contribute to the costs of maintaining the electric grid.
Massachusetts has established another alternative and uses a rate schedule that varies depending on the
type of generation and whether the host is a municipality, agricultural customer, or other private entity.
While adopting the Massachusetts model would have the benefit of establishing standardized net
metering policies in the two states now served by the NU/NSTAR utility, the approach would be
significantly more complicated to implement in situations where the virtual net metering is credited to
customer types on a different schedule.
Until such capabilities are available, this Strategy recommends expanding Connecticut‘s existing virtual
net metering provisions to include agricultural as well as governmental entities, crediting all customers
with eighty percent of the kilowatt distribution charge, and lifting the cap to ten million dollars. It further
recommends that governmental entities be allowed to designate up to five non-governmental beneficial
accounts if such are defined as critical facilities under PA 12-148.
8. Strengthen the Regional Carbon Dioxide Cap as Called for by the RGGI Program Review
Connecticut‘s participation in RGGI is essential to achieving the State‘s RPS goals. Due to several factors,
but most notably the dramatic shift from oil and coal generation in the region to lower-emitting natural
gas generation, there has been a dramatic reduction in carbon dioxide emissions from electric generating
units over the past few years. Between 2009 and 2011, regional emissions were 34% below the current
regional carbon dioxide cap.76 These lower carbon dioxide emissions are great news for the environment
and public health. Indeed, lower emissions have led to lower demand for carbon dioxide allowances,
which has created a significant surplus of unsold emissions allowances, and caused the price paid for
allowances at auctions to fall from a high of $3.51 per ton in the first several auctions to the minimum
reserve price of $1.93 per ton in the latest auction. 77
As a result, this Strategy recommends that Connecticut implement the changes called for under the RGGI
Program Review and lower the regional carbon dioxide cap to take a series of other measures to ensure
75
See Connecticut Public Act 11-80, Section 106, ―An Act Concerning The Establishment Of The Department Of Energy and Environmental Protection and Planning For Connecticut's Energy Future,‖ (2012).
76 Emissions data from RGGI, Inc. CO2 Allowance Tracking System (RGGI-COATS). Available at https://rggi-coats.org/eats/rggi/
77 Ibid.

2013 Connecticut Comprehensive Energy Strategy
Chapter 3: Electricity Sector Strategy
109
that the RGGI program continues to incentivize better environmental outcomes. Specifically the RGGI
Model Rule should be amended to:
Lower the emissions cap to ensure reductions from current emissions levels going forward while providing a means to ensure an adequate supply of allowances at a reasonable price;
Adjust the manner in which compliance is determined by requiring periodic compliance checks during the three year compliance period;
Address carbon emissions associated with imports of electricity not subject to RGGI allowance requirements;
Revise the lowest (―reserve‖) price for which allowances can be sold;
Permit states to retire unsold allowances; and
Help the State put RGGI auction proceeds to their highest and best use by conducting a cost-benefit analysis of current funding allocations.
In addition, this Strategy recommends that Connecticut continue discussions and efforts to include other
jurisdictions in a greenhouse gas reduction program. As always, any adjustments to the RGGI program
should be pursued in a manner that protects electric customers from unanticipated rate impacts.
9. Develop Submetering Protocols to Promote the Use of Renewable Energy and Combined Heat and Power in Multi-Tenant Buildings
Many older apartment buildings and commercial complexes are master metered, meaning that individual
tenants are not metered and billed separately by the utility company. The building receives one electric
bill and the landlord includes the cost of electricity in the rent. This does not promote fairness or
efficiency since customers are not billed for their actual usage.
Retrofitting utility meters is expensive and may be difficult due to space constraints. Technological
developments have made smaller, less-expensive meters available that would allow landlords to submeter
each tenant and bill them for actual usage. Current law, however, only specifically authorizes submetering
for marinas and campgrounds. This Strategy recommends that PURA establish rules to enable
submetering generally – with appropriate consumer safeguards established. As a particular priority,
submetering needs to be made available for electric service in multi-tenant buildings that are served by
distributed power generation as well as combined heat and power systems. The submetering rules must
ensure that consumer interests are protected in the context of a metering system where the landlord
would own the meters, read the meters, and bill customers.
10. Develop and Deploy Microgrids to Support Critical Services and Ensure Public Safety During Electricity Outage Crises
The early success of the DEEP Microgrid Grant and Loan Pilot Program has clearly demonstrated that the
Governor‘s proposed expansion of funding for microgrids (beyond the current $15 million commitment)
is supported by demand within the state – and the prospect of reducing the burden on the public during
power outages. Microgrid designs have the potential to provide highly reliable power for critical facilities

2013 Connecticut Comprehensive Energy Strategy
Chapter 3: Electricity Sector Strategy
110
and also support the robustness of the overall electricity grid. The State has begun the process of
launching an initial pilot program that will result in the deployment of 10 to 12 microgrids over the next
eighteen months.
Continued evolution in local generation, energy storage, and other information technology-enabled grid
devices make it a compelling time to expand the experiment with microgrids. The pilot program received
more than 30 applications in its first round, and is scheduled to deliver projects in 2013 and 2014.78 A
broader commitment to microgrids should be guided by the results of the pilot projects. DEEP should
also pursue additional funding opportunities for the deployment of microgrids, including congressional
appropriation of funds in the wake of storm Sandy. Initial microgrid proposals indicate that a variety of
generation and distribution models are going to be needed to meet different circumstances and some will
need to include the authority to serve critical facilities across public rights of way. DEEP should work with
the Legislature to arrive at a more flexible regulatory structure for microgrids, which would allow for
private ownership of the microgrid to be an option.
DEEP should also engage CEFIA in facilitating the creation of a tax equity financing fund for fuel cell
technology in partnership with private sector investors, DEEP, and the electric distribution companies.
Like the Connecticut Solar Lease program for residential homeowners, a fuel cell tax equity fund can
attract private capital investment into Connecticut and support its cleaner, cheaper, and more reliable
energy goals.
11. Implement the Reliability Recommendations of the Two Storm Panel
State and local government planning and preparedness is necessary to address major power disruptions
more comprehensively and inclusively, including coordination with utility providers and establishing
robust procedures for preparing for, and responding to, utility outage events. The Two Storm Panel
Commission Report contains several recommendations for actions that DEEP, PURA, Department of
Transportation (ConnDOT), the Connecticut Siting Council, and other State agencies should take on a
wide variety of topics, which include: electric, gas, water, sewer, telephone, cable, television, data, piping
infrastructure, municipal assistance, and other changes that can be implemented to improve the state‘s
readiness for the next emergency.
Many of the recommendations from the 2011 Two Storm Report have already been implemented and did
improve preparedness and response to storm Sandy in 2012. Others, including utility system hardening
and microgrids will continue to be advanced over the months and years ahead as previously discussed in
this Chapter. DEEP should convene an ongoing collaboration with other state entities to act on the
January 2012 findings of the Connecticut Geospatial Information Systems (GIS) Council Storm Response
78
See DEEP Energy Filings, ―Public Act 12-148 – Section 7 – Microgrid Grant and Loan Pilot Program.‖ Available at http://www.ct.gov/deep/energyfilings.

2013 Connecticut Comprehensive Energy Strategy
Chapter 3: Electricity Sector Strategy
111
and Recovery Assessment Group, with regards to a creating a state level GIS Emergency Response team. 79
DEEP should also require the electric utilities to develop GIS applications that incorporate information
from advanced meters/grids and mobile data terminals to facilitate the real-time sharing of data on
service outages.
12. Charge PURA with Cyber Security Review of State’s Public Utilities and Water Companies
DEEP recommends that the Public Utilities Regulatory Authority (PURA), working in conjunction with
other relevant State agencies, be charged with conducting a review of Connecticut‘s electricity, natural gas
and major water companies to assess the adequacy of their capabilities to deter interruption of service.
An unclassified report of such review together with recommended actions to strengthen deterrence should
be presented to the Governor and General Assembly by September 1, 2013.
13. Transition Current Standard Service Customers to the Competitive Supplier Marketplace
This Strategy proposes that remaining standard service customers be given the same savings opportunity
that customers who have already made the shift into the retail choice market are given. This outcome
could be achieved through a transitioning of customers to the competitive marketplace, with the
additional benefit of raising revenue for the State‘s taxpayers in the process.
DEEP and PURA should work together to divide standard service customers into tranches of 100,000
(based on the average load used by the customer, so that each tranche would have a roughly equal total
average load) and make them available to the retail electricity supplier market, with the customer
tranches being awarded to the highest bidder and the proceeds going to Connecticut taxpayers.
To assure that the transitioned customers realize savings in their electricity rates, the winning retail
electricity supplier must guarantee that the rate offered to the customers for one year would be at least 5%
below the utility standard offer on the date of the transaction. Moreover, the transitioned customers must
be allowed to return to standard service or to choose a different retail electricity supplier if they wish, with
appropriate market information provided to these customers in coordination with PURA. This action
could be initiated in 2013, with the transfers officially taking effect in 2014.
Since the average electricity bill of an existing standard service customer is roughly $1,300 per year, under
this scenario an existing standard service customer would see guaranteed savings of $65 per year as a
result of this program.
79
Connecticut Geospatial Information Systems (GIS) Council Storm Response and Recovery Assessment Group, ―Draft Findings Report, January 25, 2012.‖ Available at http://www.ct.gov/gis/lib/gis/Final_Draft_GIS_Storm_Assessment_Findings_Report_01_25_12.pdf.

2013 Connecticut Comprehensive Energy Strategy
Chapter 3: Electricity Sector Strategy
112
The City of Chicago approved a similar auction in November of this year by referendum.80 Under their
approach, 930,000 customers (representing 14% of the Illinois electricity customers) will be auctioned off
to the competitive retail electricity supply market, with the winning bidder guaranteeing a price savings
for electricity for the 900,000 customers.81 Pennsylvania‘s regulated electricity market and Ohio‘s
regulated natural gas market have executed similar programs.
This approach will also require mechanisms that ensure consumer protections and DEEP should
collaborate with PURA to ensure that such protections are in place.
Conclusion
Since 2010, Connecticut‘s electricity sector has made important strides towards advancing a cheaper,
cleaner, and more reliable energy future. Electricity rates are decreasing, power plants are burning cleaner
fuels, and there is renewed attention on the need to invest in reliability. With the creation of the
Department of Energy and Environmental Protection, the State has new planning and policy capabilities
that can help it anticipate and adapt to trends in technology development, changes in fuel prices,
electricity markets, and state and federal environmental and energy policies that affect the cost, reliability,
and environmental impact of our electricity sector. The establishment of CEFIA is enabling the State to
engage the private market in new ways to advance Connecticut‘s long-term policy objectives.
This Strategy recommends actions relating to the electricity sector that will enable Connecticut to create
an energy future very different from today‘s. It underscores the importance of expanding funding for all
cost-effective energy efficiency and an increased emphasis on reducing peak demand. It proposes
mechanisms to ensure that traditional energy supplies continue to decrease their negative health and
environmental impacts, recommends approaches to better identify cost-competitive renewable resources
that will be critical to the state‘s future, and proposes specific approaches to drive down the cost of solar
PV — the largest cost-effective in-state renewable resource — to significantly boost customer adoption and
economic benefits to Connecticut. Following the path outlined in this Chapter and other Chapters in this
Strategy will position Connecticut as a leader in creating a cheaper, cleaner energy future while growing
the state‘s economy and ensuring that Connecticut is an increasingly desirable place to live and work.
80
For more information on Chicago’s program, visit its official website. Available at https://sites.google.com/site/electricityaggregation/.
81 Daniels, Steve. ―Chicago predicts 10 percent savings on electric bills if referendum passes,‖ Chicago Business, 10 October 2012. Available at http://www.chicagorealestatedaily.com/article/20121020/ISSUE01/310209976/chicago-predicts-10-percent-savings-on-electric-bills-if-referendum-passes.

2013 Connecticut Comprehensive Energy Strategy
Chapter 3: Electricity Sector Strategy
113
Bibliography
An Act Enhancing Emergency Preparedness and Response (2012). 2012. Index to Connecticut Public and
Special Acts. PA 12-148. http://www.cga.ct.gov/2012/act/pa/pdf/2012PA-00148-R00SB-00023-
PA.pdf.
An Act Concerning Connecticut Global Warming Solutions (2008). 2012. Index to Connecticut Public and
Special Acts PA 08-98. http://www.cga.ct.gov/2008/ACT/PA/2008PA-00098-R00HB-05600-
PA.htm.
Analysis Group, 2011, The Economic Impacts of the Regional Greenhouse Gas Initiative on Ten Northeast
and Mid-Atlantic States. http://www.analysisgroup.com/RGGI.aspx.
Barbose, Galen, Naïm Darghouth, Ryan Wiser, and Joachim Seel. Tracking the Sun IV: An Historical
Summary of the Installed Cost and Photovoltaics in the United States from 1998 to 2010. LBNL-
5047E. Berkeley, CA: Lawrence Berkeley National Laboratory, 2011.
http://eetd.lbl.gov/ea/ems/reports/lbnl-5047e.pdf.
Benson, Judy. ―Warm water in Sound causes Millstone unit to shut down,‖ The Day, 13 August 2012.
http://www.theday.com/article/20120813/BIZ02/120819912/1047.
Black & Veatch. Cost and Performance Data for Power Generation Technologies: Prepared for the
National Renewable Energy Laboratory. Centennial, CO: Black & Veatch, 2011.
http://bv.com/docs/reports-studies/nrel-cost-report.pdf
Clean Energy Finance and Investment Authority. ―PowerClerk Data Export.‖ Microsoft Excel file shared
with Connecticut Department of Energy and Environmental Protection. May 14, 2012.
———. ―PV On Site Project Dashboard.‖ Microsoft Excel file shared with Connecticut Department of
Energy and Environmental Protection. April 30, 2012.
Cochran, Jaquelin, Lori Bird, Jenny Heeter, and Douglas J. Arent. Integrating Variable Renewable
Energy in Electric Power Markets: Best Practices from International Experience. NREL/TP-
6A00-53732. Golden, CO: National Renewable Energy Laboratory, 2012.
Connecticut Department of Energy and Environmental Protection. 2012 Integrated Resource Plan for
Connecticut. New Britain, CT, 2012. http://www.ct.gov/deep/lib/deep/energy/irp/2012_irp.pdf.
Connecticut Department of Energy and Environmental Protection, Public Utilities Regularity Authority
(PURA), and Department of Public Utility Control (DPUC). The United Illuminating Company
Schedule of Rates and Riders, and Connecticut Light and Power Residential Electric Service
Rates. PURA and DPUC Docket nos. 03-07-02, 03-07-02RE08, 03-07-02RE09, 07-10-29, 08-11-
11, 10-01-01, 11-01-01, 12-01-01, 01-10-10, 03-07-15RE01, 05-06-04, 05-06-04RE02, 07-11-31,

2013 Connecticut Comprehensive Energy Strategy
Chapter 3: Electricity Sector Strategy
114
08-11-12, 10-02-02, 11-01-02, 12-01-02. New Britain, CT, 2005–2012.
http://www.ct.gov/pura/docketsearch.
Connecticut Department of Public Utility Control (DPUC). Application of the Connecticut Light and
Power Company to Implement Time-of-use, Interruptible Load Response, and Season Rates –
Review of Metering Plan. DPUC Docket no. 05-10-03RE01. New Britain, CT, 2007.
———. Application of the United Illuminating Company for Approval of Metering Plan. DPUC Docket no.
07-07-02. New Britain, CT, 2007.
———. DPUC 2011 Annual Report to the General Assembly on Electric Distribution Company System
Reliability. DPUC Docket 11-04-11. New Britain, CT, 2012. http://www.ct.gov/pura/docketsearch.
Connecticut Siting Council. Review of the Ten Year Forecast of Connecticut Electric Loads and Resources
2005–2014. New Britain, CT, 2005.
http://www.ct.gov/csc/lib/csc/f2005/ct_siting_council_05ar.pdf.
Daniels, Steve. ―Chicago predicts 10 percent savings on electric bills if referendum passes,‖ Chicago
Business, 10 October 2012.
htttp://www.chicagorealestatedaily.com/article/20121020/ISSUE01/310209976/chicago-
predicts-10-percent-savings-on-electric-bills-if-referendum-passes.
DeSalvo, Mike (October 29, 2012), ―Over 625,000 without Power Across Connecticut.‖
http://blog.ctnews.com/sandy/2012/10/29/outages-top-590000/.
Edison Electric Institute, ―Out of Sight, Out of Mind,‖ January 2013.
http://www.eei.org/ourissues/electricitydistribution/documents/undergroundreport.pdf.
EnerNOC. ―Western Connecticut State University Relies on EnerNOC as Its Comprehensive Energy
Management Partner.‖ Accessed May 2012. http://www.enernoc.com/our-resources/case-
studies.
Federal Energy Regulatory Commission. A National Assessment of Demand Response Potential. Staff
Report. Washington DC: Federal Energy Regulatory Commission, 2009.
http://www.ferc.gov/legal/staff-reports/06-09-demand-response.pdf.
———. Order Granting Petition for Declaratory Order. FERC Docket no. EL09-20-000. Washington DC:
Federal Energy Regulatory Commission, 2009.
Go Solar California. ―California Solar Statistics.‖ Accessed May 2012.
http://www.californiasolarstatistics.ca.gov/

2013 Connecticut Comprehensive Energy Strategy
Chapter 3: Electricity Sector Strategy
115
Hodgkins, Jay. ―Wave of U.S. Plant Retirements Likely Approaching; IPPs Particularly Exposed.‖ SNL
Power Daily, April 25, 2012.
http://http://publicutilities.utah.gov/news/waveofusplantretirementslikelyapproaching.pdf.
Hydro Quebec. ―Developing Quebec‘s Hydropower Potential.‖ Accessed July 21, 2012.
http://hydroforthefuture.com/projets/9/developing-quebec-s-hydropower-potential.
Irvine, Linda, Alexander Sawyer, and Jennifer Grove. The Solarize Guidebook: A Community Guide to
Collective Purchasing of Residential PV Systems. Golden, CO: National Renewable Energy
Laboratory, 2012. http://www.nrel.gov/docs/fy12osti/54738.pdf.
ISO New England. ―2012 Forecast Data File.‖ Microsoft Excel file with energy and peak load forecasts for
use in the 2012 ISO-NE CELT report. May 4, 2012. http://www.iso-
ne.com/trans/celt/fsct_detail/2012/isone_fcst_data_2012.xls.
Lazard. Levelized Cost of Energy Analysis – Version 6.0. New York: Lazard, 2012.
http://blog.cleanenergy.org/files/2009/04/lazard2009_levelizedcostofen
ergy.pdf
Lopez, Anthony, Billy Roberts, Donna Heimiller, Nate Blair, and Gian Porro. U.S. Renewable Energy
Technical Potentials: A GIS-Based Analysis. NREL/TP-6A20-51946. Golden, CO: National
Renewable Energy Laboratory, 2012. http://www.nrel.gov/docs/fy12osti/51946.pdf
McGee, Joe, and Major General James Skiff, Co-chairs. Report of the Two Storm Panel. Hartford, CT:
Connecticut Two Storm Panel, 2012.
http://www.ct.gov/deep/lib/deep/forestry/vmtf/two_storm_panel_final_report.pdf.
Meehan, Chris. ―Connecticut‘s SunShot Grant to Reduce Soft Costs of Solar.‖ Clean Energy Authority,
April 5, 2012. http://cleanenergyauthority.com/solar-energy-news/connecticut-sunshot-grant-
to-reduce-solar-soft-costs-040512.
Massachusetts Department of Public Utilities (DPU). Fitchburg Gas and Electric Light Company: 2011
Service Quality Report. By Fitchburg Gas and Electric Light Company. DPU Docket no. 12-SQ-10.
Boston, MA, 2012. http://www.env.state.ma.us/DPU_FileRoom/frmDocketListSP.aspx.
———. Massachusetts Electric Company: 2011 Service Quality Report. By National Grid. DPU Docket no.
12-SQ-11. Boston, MA, 2012.
http://www.env.state.ma.us/DPU_FileRoom/frmDocketListSP.aspx.
———. Nantucket Electric Company: 2011 Service Quality Report. By Nantucket Electric Company. DPU
Docket no. 12-SQ-12. Boston, MA, 2012.
http://www.env.state.ma.us/DPU_FileRoom/frmDocketListSP.aspx.

2013 Connecticut Comprehensive Energy Strategy
Chapter 3: Electricity Sector Strategy
116
———. NSTAR Electric Company: Annual Service Quality Report. By NSTAR Electric. DPU Docket no.
12-SQ-13. Boston, MA, 2012.
http://www.env.state.ma.us/DPU_FileRoom/frmDocketListSP.aspx.
———. Western Massachusetts Electric Company: 2011 Service Quality Report. By Western
Massachusetts Electric Company. DPU Docket no. 12-SQ-14. Boston, MA, 2012.
http://www.env.state.ma.us/DPU_FileRoom/frmDocketListSP.aspx.
National Renewable Energy Laboratory. ―System Advisor Model (Version 2011.6.30).‖ [Software]. Golden,
CO: National Renewable Energy Laboratory, 2011. https://sam.nrel.gov.
New York Department of Public Service. 2010 Electric Reliability Performance Report. Albany, NY, 2011.
http://documents.dps.ny.gov/public/Common/ViewDoc.aspx?DocRefId=%7B41C1950A-5BF1-
498F-8199-8B7FE81FD82C%7D
New York Office of Electricity and Environment. The 2005 Interruption Report. Albany, NY, 2006.
North Carolina State University. ―Database of State Incentives for Renewables & Efficiency: Federal
Business Energy Investment Tax Credit (ITC).‖ Last modified November 28, 2011.
http://www.dsireusa.org/incentives/incentive.cfm?Incentive_Code=US02F&re=1&ee=1.
———. ―Database of State Incentives for Renewables & Efficiency: Federal Residential Renewable Energy
Tax Credit.‖ Last modified December 20, 2011.
http://www.dsireusa.org/incentives/incentive.cfm?Incentive_Code=US37F&re=1&ee=1.
———. ―Database of State Incentives for Renewables & Efficiency: Federal Renewable Electricity
Production Tax Credit.‖ Last modified May 22, 2012.
http://www.dsireusa.org/incentives/incentive.cfm?Incentive_Code=US13F&re=1&ee=1.
Renewable Energy Portfolio Standards (1998). 2001. Conn. Gen. Stat. § 16-245a. http://www.cga.ct.gov/
Rose, Kara, and Kate Alexander. ―Underground Wires Could Cost Billions.‖ Gazette.net, July 10, 2012.
http://www.gazette.net/article/20120710/NEWS/707109979/1022/underground-wires-could-
cost-billions&template=gazette.
Solarize Connecticut Program. http://solarizect.com/
Tax Foundation. ―Connecticut: The Facts on Connecticut‘s Tax Climate.‖ Accessed May 2012.
http://taxfoundation.org/state-tax-climate/connecticut.
The Brattle Group, ―Resource Adequacy and Renewable Energy in Competitive Wholesale Electricity
Markets.‖ http://www.brattle.com/_documents/uploadlibrary/upload878.pdf.

2013 Connecticut Comprehensive Energy Strategy
Chapter 3: Electricity Sector Strategy
117
U.S. Department of Housing and Urban Development. Federal Housing Administration (FHA): Notice of
FHA PowerSaver Home Energy Retrofit Loan Pilot Program. Docket no. FR-5450-N-03.
Washington DC, 2011.
U.S. Energy Information Administration. ―Average Cost of Coal Delivered for Electricity Generation by
State, May 2012 and 2011.‖ In May 2012 Electric Power Monthly, Table 4.10.A. Washington DC:
U.S. Energy Information Administration, 2012. http://www.eia.gov/electricity/monthly/
———. ―Average Cost of Natural Gas Delivered for Electricity Generation by State, May 2012 and 2011.‖ In
May 2012 Electric Power Monthly, Table 4.13.A. Washington DC: U.S. Energy Information
Administration, 2012. http://www.eia.gov/electricity/monthly/
———. ―Average Retail Price of Electricity to Ultimate Consumers by End-Use Sector, by State.‖ In May
Electric Power Monthly, Table 5.6.A. Washington DC: U.S. Energy Information Administration,
2003–2012. http://www.eia.gov/electricity/monthly/
———. ―Average Retail Price of Electricity to Ultimate Customers by End-Use Sector, by State.‖ In April
2012 Electric Power Monthly, Table 5.6.A. Washington DC: U.S. Energy Information
Administration, 2012. http://www.eia.gov/electricity/monthly/
———. ―Connecticut Carbon Dioxide Emissions from Fossil Fuel Consumption (1980–2009).‖ In State
CO2 Emissions. Washington DC: U.S. Energy Information Administration, 2011.
http://www.eia.gov/environment/emissions/state/state_emissions.cfm.
———. ―Electric Power Industry Generation by Primary Energy Source, 1990 Through 2010.‖ In
Connecticut Electricity Profile 2010, Table 5. Washington DC: U.S. Energy Information
Administration, 2012.
———. ―Electric Power Sector Consumption Estimates, Selected Years, 1960–2010, Connecticut.‖ In State
Energy Data System, Table CT8. Washington DC: U.S. Energy Information Administration,
2012.
———. Existing Generating Units in the United States by State and Energy Source. Data from Form EIA-
860. Washington DC: U.S. Energy Information Administration, 2010.
———. Form EIA-826 Data Monthly Electric Utility Sales and Revenue Data, 2011. Washington DC: U.S.
Energy Information Administration, 2012.
———. ―Natural Gas Gross Withdrawals and Production.‖ Last modified July 31, 2012.
http://www.eia.gov/dnav/ng/ng_prod_sum_dcu_NUS_a.htm.

2013 Connecticut Comprehensive Energy Strategy
Chapter 3: Electricity Sector Strategy
118
———. ―Net Generation by Energy Source: Total (All Sectors), 2002–May 2012.‖ In May 2012 Electric
Power Monthly, Table 1.1. Washington DC: U.S. Energy Information Administration, 2012.
http://www.eia.gov/electricity/monthly/
U.S. Nuclear Regulatory Commission. NRC Renews Millstone Nuclear Power Station Operating Licenses
for an Additional 20 Years. NRC News no. 05-161. Washington DC: Office of Public Affairs, 2005.
http://www.nrc.gov/reading-rm/doc-collections/news/2005/05-161.html.
Wesoff, Eric. ―Germany Solar Installations Coming in at $2.24 per Watt Installed, U.S. at $4.44.‖
Greentech Media, June 19, 2012. http://www.greentechmedia.com/articles/read/German-Solar-
Installations-Coming-in-at-2.24-Per-Watt-Installed-U.S-at-4/.
Wiser, Ryan, Eric Lantz, Mark Bolinger, and Maureen Hand. ―Recent Developments in the Levelized Cost
of Energy from U.S. Wind Power Projects.‖ Presentation completed under U.S. Department of
Energy contract no. DE-AC02-05CH11231, February, 2012.
Woolf, Tim, David White, Cliff Chen, and Anna Sommer. Potential Cost Impacts of A Renewable Portfolio
Standard in New Brunswick. Cambridge, MA: Synapse Energy Economics, 2005.

2013 Connecticut Comprehensive Energy Strategy
Chapter 4: Natural Gas Sector Strategy
119
Introduction
For decades, the prices of natural gas and oil have been linked, with gas historically being the more expensive
of the two. Over the last several years, the price of the two commodities have diverged, or ―decoupled,‖ from
one another. The emergence of new extraction techniques (most notably horizontal drilling and hydraulic
fracturing, or ―fracking‖) have made it economic to bring enormous amounts of new domestic natural gas
supply to the marketplace from shale basins across the country (including in the mid-Atlantic states). As a
result, the average wholesale price of natural gas (before factoring in the cost of transportation and delivery to
the customer) dropped from over $7 per million BTU in 2007 to below $3 per million BTU in 2012. While now
in the $3 - $4 range and likely to rise slowly in the coming years, natural gas prices are projected to remain
relatively low for the foreseeable future. Over the same period, the average wholesale price of oil has risen
from $12 to over $16 per million BTU (averaging $96/barrel in 2012). Oil prices are projected to remain high
due to growing global demand, especially in emerging markets such as China and India.
This recent development presents Connecticut residents and business owners with a once-in-a-generation
opportunity to switch to a cheaper, cleaner fuel source. Replacing fuel oil with natural gas offers the prospect
of lower energy bills. Burning natural gas also decreases the level of harmful air pollution in comparison with
fuel oil – and even more dramatically in comparison to coal. A switch to domestically available natural gas
also helps customers break free from the price spikes that result from a dependence on oil, since so much of
America‘s oil is imported from unstable regions of the world. This Strategy seeks to promote an enhanced
regulatory structure designed to provide fuel flexibility and diversity. It offers a path toward greater consumer
fuel choice and long overdue investments in infrastructure that will make it easier for many Connecticut
residents and businesses to take advantage of the opportunity to heat with lower cost and cleaner burning
natural gas – if they would like to do so.
Some sectors of Connecticut‘s economy have already begun to shift to gas. Since 2009, natural gas
consumption in Connecticut has increased by 24%, mostly attributable to an increased use for electric
generation. Electricity generation rates have come down significantly as a result of this switch to a cheaper
fuel source.1 Many industrial firms that require a lot of energy to power manufacturing processes have also
made the switch to natural gas (Figure 2). These two sectors now account for more than half of Connecticut‘s
natural gas consumption (Figure 1).
1 Nearly 35% of Connecticut’s electricity is now generated from natural gas. For a more detailed discussion of natural gas
use for electricity generation, see the 2012 Connecticut Integrated Resource Plan. Available at http://www.ct.gov/deep/lib/deep/energy/irp/2012_irp.pdf.

2013 Connecticut Comprehensive Energy Strategy
Chapter 4: Natural Gas Sector Strategy
120
FIGURE 1: Connecticut natural gas consumption2
Source: U.S. EIA, ―State Energy Data System.‖
At the same time, the upfront costs of converting heating equipment and, in some instances, expanding
natural gas distribution infrastructure have prevented other energy users from taking advantage of low
natural gas prices. In the transportation sector, natural gas is now a cheaper fuel than gasoline and diesel, but
natural gas-powered vehicles are currently more expensive than conventional vehicles. Additionally, there are
few natural gas refueling stations located in the state at this time. Over the next decade, the use of natural gas
for transportation will likely increase but we do not know by how much. Thus, this Strategy calls for the build-
out of the basic natural gas infrastructure so as to ensure that consumer choices are not limited by past
infrastructure decisions.
In contrast to power plants and manufacturers, homeowners and businesses have been slower to adopt
natural gas as a fuel to heat their homes, stores, office buildings, factories, and other facilities. Only 31% of the
state‘s 1.4 million residences are using natural gas for space heating. That penetration percentage is lower
than most of the rest of New England and the U.S. average, which is about 50%.3 Currently, only 35% of
Connecticut businesses have the choice of using natural gas (for space heating or otherwise) (Figure 2).4 Why
aren‘t more residents and businesses converting to natural gas use for space heating and other uses even when
it is potentially available? The primary reason lies in the significant upfront cost of installing natural gas
heating equipment, which presents a significant barrier to adoption. In addition, for homes and businesses
located more than 150 feet from a gas main, the cost of equipment may be dwarfed by the customer‘s required
contribution to the cost of expanding the main itself.
2 Connecticut natural gas consumption will be ~15% higher in 2011 than the 2010 data shown here, driven primarily by a
28% increase in electricity sector consumption. U.S. EIA, ―Natural gas consumption by end-use.‖ 3 U.S. Energy Information Administration (EIA), Residential Energy Consumption Survey. Available at
http://www.eia.gov/consumption/residential/. 4 Connecticut Department of Economic and Community Development. The Economic Impact of Expanding Natural Gas
Use in Connecticut. By Stanley McMillen and Nandika Prakash. Hartford, CT, 2011. Available at http://www.ct.gov/deep/lib/deep/energy/decd_nat_gas.pdf.
Petroleu
m
0
1000
Tri
llio
n B
TU
Petroleum
Electricity 43%
Buildings 42%
Industry 12%
Transport 3%
CT natural gas Consumption by sector 2010 CT primary energy
consumption by fuel
Natural gas
Nuclear
Coal Renewables
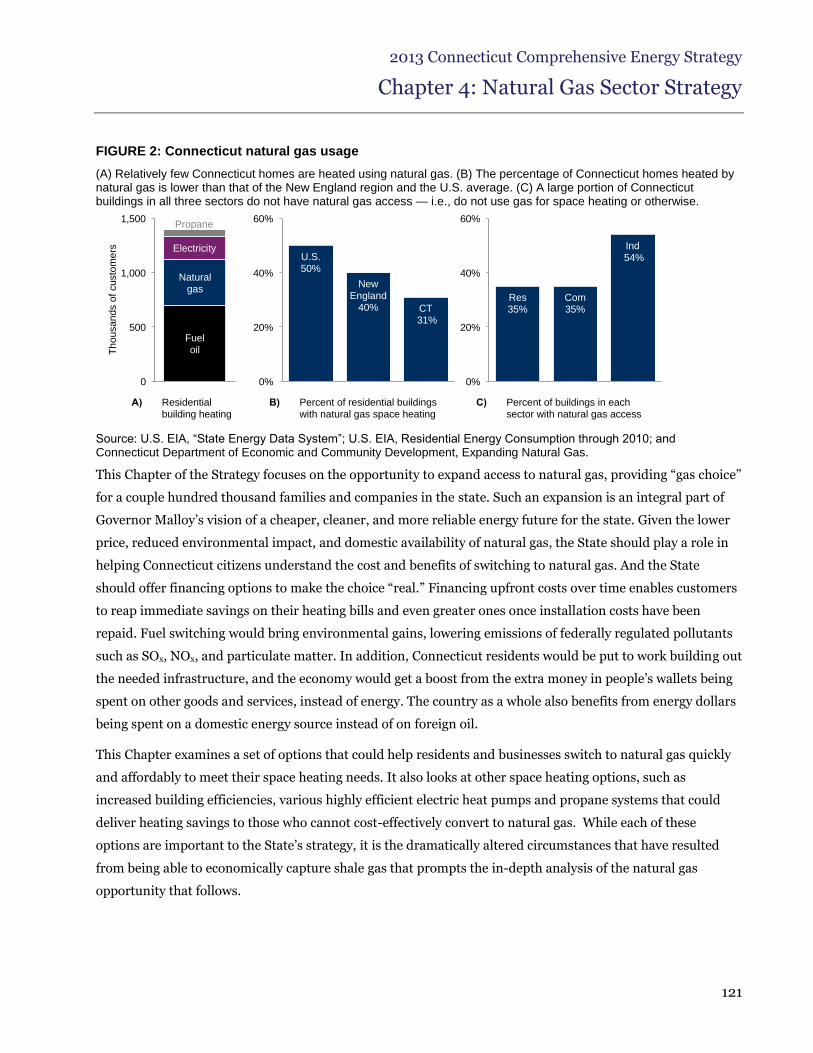
2013 Connecticut Comprehensive Energy Strategy
Chapter 4: Natural Gas Sector Strategy
121
FIGURE 2: Connecticut natural gas usage
(A) Relatively few Connecticut homes are heated using natural gas. (B) The percentage of Connecticut homes heated by natural gas is lower than that of the New England region and the U.S. average. (C) A large portion of Connecticut buildings in all three sectors do not have natural gas access — i.e., do not use gas for space heating or otherwise.
Source: U.S. EIA, ―State Energy Data System‖; U.S. EIA, Residential Energy Consumption through 2010; and Connecticut Department of Economic and Community Development, Expanding Natural Gas.
This Chapter of the Strategy focuses on the opportunity to expand access to natural gas, providing ―gas choice‖
for a couple hundred thousand families and companies in the state. Such an expansion is an integral part of
Governor Malloy‘s vision of a cheaper, cleaner, and more reliable energy future for the state. Given the lower
price, reduced environmental impact, and domestic availability of natural gas, the State should play a role in
helping Connecticut citizens understand the cost and benefits of switching to natural gas. And the State
should offer financing options to make the choice ―real.‖ Financing upfront costs over time enables customers
to reap immediate savings on their heating bills and even greater ones once installation costs have been
repaid. Fuel switching would bring environmental gains, lowering emissions of federally regulated pollutants
such as SOx, NOx, and particulate matter. In addition, Connecticut residents would be put to work building out
the needed infrastructure, and the economy would get a boost from the extra money in people‘s wallets being
spent on other goods and services, instead of energy. The country as a whole also benefits from energy dollars
being spent on a domestic energy source instead of on foreign oil.
This Chapter examines a set of options that could help residents and businesses switch to natural gas quickly
and affordably to meet their space heating needs. It also looks at other space heating options, such as
increased building efficiencies, various highly efficient electric heat pumps and propane systems that could
deliver heating savings to those who cannot cost-effectively convert to natural gas. While each of these
options are important to the State‘s strategy, it is the dramatically altered circumstances that have resulted
from being able to economically capture shale gas that prompts the in-depth analysis of the natural gas
opportunity that follows.
Fuel oil
0
500
1,000
1,500
Th
ou
san
ds o
f cu
sto
me
rs
Natural gas
Electricity
Propane
U.S. 50%
New England
40% CT 31%
0%
20%
40%
60%
Res 35%
Com 35%
Ind 54%
0%
20%
40%
60%
A) Residential building heating
B) Percent of residential buildings with natural gas space heating
C) Percent of buildings in each sector with natural gas access

2013 Connecticut Comprehensive Energy Strategy
Chapter 4: Natural Gas Sector Strategy
122
The Costs and Benefits of Conversion, by Customer Segment
The Department‘s calculations (using traditional regulatory cost accounting) show that converting all
residential, commercial, and industrial customers that are currently ―low-use‖ (connected to natural gas but
not using it for heating) and ―on-main‖ (within 150 feet of an existing gas main) to gas heating would yield a
huge net economic benefit: $2.8 billion in net present value over 20 years (Table 1). Converting On-Main
Segment A customers would create the great majority of that value (90% or $2.6 billion), while Segment B
conversion accounts for 10% or $0.2 billion in Net Present Value (NPV).5 The lower value that results from
converting all Segment B customers is, however, a reflection of the narrow basis of traditional regulatory
accounting, which focuses on private costs and benefits with inadequate attention to broader public impacts.
Thus, the Strategy calls for a more comprehensive cost-benefit analysis that takes into account the full
spectrum of externalities associated with an expansion of the natural gas infrastructure – including but not
limited to economic development opportunities, job growth, enhanced competitiveness, and environmental
gains - that have historically been ignored. When this ―fully loaded‖ cost-benefit analysis is undertaken,
DEEP believes that the NPV of building out gas mains to reach most of Segment B customers will be fully
justified. Even on the more narrow traditional regulatory accounting basis, the net economic benefit of
converting 305,000 customers to natural gas would be $ 2.8 billion on a present value basis over the next
twenty years.
TABLE 1: Net Economic Benefits from Conversion NPV $(000) over 20 years
Segment Customer
Type
Prospective Customers (Estimated)
Total Savings Total Costs
Net Savings
Total Net Savings
A
Residential, Low Use
39,000 $ 871 $ 292 $ 578
$2,606 Residential,
On Main 160,852 $3,591 $ 1,895 $ 1,696
Commercial 15,585 $ 624 $ 435 $ 188
Industrial 569 $173 $ 30 $ 144
B
Residential 51,506 $1,150 $ 978 $ 172
$209 Commercial 37,333 $1,494 $1,528 $ (34)
Industrial 430 $ 131 $ 60 $ 71
Total 305,275 $8,034 $5,218 $2815 $2,815
Source: DEEP Analysis.
5 This natural gas NPV is based upon all conversion investments made in year one. The benefits are calculated for
twenty years and discounted back to present value. This approach is used to size the overall natural gas opportunity for each sector and segment. In reality, the investment will be phased over a discrete time period, an approach modeled in Chapters 1 and 2, Efficiency and Industry.

2013 Connecticut Comprehensive Energy Strategy
Chapter 4: Natural Gas Sector Strategy
123
It should be further noted that these calculations do not include the benefits to existing ratepayers associated
with an expanded natural gas infrastructure including the potential greater volume discounts in gas
purchases, a larger basis over which to spread utility administrative costs, and more flexibility in volume
predictions and forward gas purchase commitments. These calculations also do not incorporate the economic
development gains that would arise if more homes and businesses were able to access inexpensive natural gas,
nor does it assign a value to the significant environmental benefits. Those benefits are discussed later in the
Chapter.
After grouping potential customers according to the segments described above, DEEP estimated the costs and
benefits of converting each segment as a whole to natural gas, in terms of NPV. NPV is a value used to assess
and compare investment opportunities — it is the (present value) monetary gain or loss due to an investment
decision. NPV is calculated by summing the net costs, including the new customer and gas company
investment, and the expected benefits for a given opportunity. To calculate the NPV of natural gas conversion
for this Strategy, DEEP estimated the conversion costs for each segment and the retail bill savings over a 20-
year period, applying a real discount rate of 5% to the savings estimate, to yield a present value.
In sum, expanding access to the new and abundant shale gas supplies presents Connecticut residents and
businesses with a rare opportunity to capture significant benefits at modest costs that can be recouped
quickly. The conversion opportunity offers a prospect of greater heating fuel choice – and the promise of
lower energy bills for many ratepayers – as well as improving the competitive position of the state‘s
manufacturers.
Connecticut’s Natural Gas Opportunity
Natural gas is a relative newcomer to the energy landscape of Connecticut. For centuries, Connecticut‘s
residents heated their homes and businesses with wood, then coal, and then oil. Wood could usually be
obtained from plentiful, nearby forests, coal became available as wood sources were depleted, and then oil
became readily available and could be easily delivered across the state. In contrast, natural gas delivery
typically requires pipelines with large initial infrastructure costs. The United States did not begin to build an
extensive network of natural gas pipelines until the 1920s. Even then, natural gas did not become widely
available in Connecticut until the 1960s. Three major transmission pipelines — Algonquin Gas Transmission,
Tennessee Gas Pipeline and, later, the Iroquois Gas Transmission System — were constructed to bring gas to
New England from both the Gulf of Mexico and Canada. Today, three local gas distribution companies
(referred to in this Chapter as gas companies) provide natural gas service to Connecticut customers. The gas
companies have constructed a distribution system of pipelines or ―mains‖ to distribute natural gas to end-use
customers spread in higher concentrations along the state‘s coast and through its central industrial section
(Figure 3).

2013 Connecticut Comprehensive Energy Strategy
Chapter 4: Natural Gas Sector Strategy
124
FIGURE 3: Connecticut’s Natural Gas Infrastructure
Connecticut natural gas infrastructure is concentrated in areas with high population density, such as the central part of the state and along the coast.
Source: Connecticut Natural Gas, Southern Connecticut Gas, and Yankee Gas
Low-cost and abundant shale gas has transformed America‘s energy outlook. Advances in drilling techniques
— most notably hydraulic fracturing, also known as ―fracking,‖ and improved horizontal drilling — have led to
an enormous expansion in the amount of economically recoverable natural gas in the United States, including
in the eastern United States.6 Domestic natural gas production has increased by 19% since 2007, largely from
unconventional sources such as shale gas, while prices have dropped by over 50% and have diverged from
rising oil prices.7 As shown in Figure 4, the U.S. Energy Information Administration‘s (EIA) latest forecast
projects that gas prices will remain low for at least the next 20 years, thanks to ample known domestic
6 See the following for a brief explanation of hydraulic fracturing and horizontal drilling techniques:
http://www.propublica.org/special/hydraulic-fracturing-national. 7 Natural gas and oil price histories are from U.S. Energy Information Administration (EIA). Price projections are from the
reference case in U.S. EIA, 2012 Annual Energy Outlook (AEO). Available at http://www.eia.gov/forecasts/aeo/pdf/0383(2012).pdf. Delivered gas and fuel oil prices are from AEO supplementary tables for the New England region. Prior to the 2008 price spike, Natural Gas prices were relatively steady around the $6-7/MBTU range. Since then, prices have dropped more than 50% with recent prices below $3/MBTU.

2013 Connecticut Comprehensive Energy Strategy
Chapter 4: Natural Gas Sector Strategy
125
reserves and new technologies that allow gas to be extracted from those reserves. Natural gas is currently 60-
75% lower in cost than the equivalent amount of energy produced by petroleum-based fuels.8 Natural gas is
largely produced and consumed domestically, since limited export capacity currently exists in the United
States.9 As a result, natural gas prices in the United States are at present less susceptible to the geopolitical
gyrations that surround oil. At the end of 2012, the Department of Energy had 15 pending LNG export
applications which they will now begin to act upon on a case-by-case basis. While the impact of LNG exports
is unknown at this time, The National Economic Research Associates (NERA) consulting firm concluded in a
study done for the Department of Energy that LNG exports would not drive the price of domestic natural gas
to levels commensurate with those observed in countries that are willing to pay oil parity-based prices for
LNG imports, partly because of the basis differentials due to transportation costs (such as liquefaction, tanker
transportation, and regasification10.
FIGURE 4: Oil and natural gas prices with U.S. EIA projections11
Source: U.S. EIA.7
Some sectors are better able than others to benefit from the opportunity to switch to lower cost, cleaner-
burning natural gas. In the transportation sector, a number of Connecticut fleet operations have implemented
8 Delivered prices from U.S. EIA, State Energy Data System updated using price rise/decline since 2010 using U.S. EIA,
―Natural Gas Prices‖; and U.S. EIA, ―Weekly Heating Oil Prices.‖ 9 In 2010, the United States exported 11 percent of its total natural gas supply. Annual Energy Outlook 2012, U.S. EIA, p.
94. 10
See ―Macroeconomic Impacts of LNG Exports from the United States,‖ NERA Economic Consulting, p. 76.
11 The ―spot‖ price is the wholesale market price for purchasing a commodity, in this case oil or gas, for (near) immediate delivery. Spot prices for oil and gas are typically given for a benchmark location, such as ―Henry Hub‖ located in Erath, Louisiana (a major trading ―hub‖ where nine major interstate pipelines come together) and/or for a known grade, such as West Texas Intermediate (WTI) (a relatively easily refined grade of crude oil produced in Texas).
$0
$5
$10
$15
$20
$25
$30
$35
1985 1995 2005 2015 2025
201
2$/M
BT
U
$0
$5
$10
$15
$20
$25
1985 1995 2005 2015 2025
201
2$/M
BT
U
EIA projected
EIA projected
Wholesale/spot
Customer/delivered
WTI crude oil
Henry hub gas
Delivered residential gas, New England region
Fuel oil

2013 Connecticut Comprehensive Energy Strategy
Chapter 4: Natural Gas Sector Strategy
126
successful conversion projects. These efforts are discussed in more detail in Chapter 5 (Transportation).
Industrial processes and electricity generation sector (where the use of natural gas is largely optimized
already), and the residential and commercial building sectors are areas with the greatest potential to increase
natural gas use.
Economic Benefits
Only about one third of Connecticut residences and commercial buildings heat with natural gas despite the
fact that it is currently 60-75% cheaper than fuel oil, 70-80% cheaper than propane, and 75-85% cheaper than
electric resistance heating.12This means that the average homeowner heating with natural gas pays 54%
($1,800) less each year to heat his or her home than the average homeowner heating with fuel oil. For
commercial businesses, natural gas is 58% ($3,300) cheaper to heat with than fuel oil. Annual energy bills for
industrial customers heating with natural gas are 74% ($25,000) lower than for their oil-heating competitors
(Figure 5).
FIGURE 5: Average annual savings from heating with natural gas instead of fuel oil, by sector
Source: U.S. EIA. 2012. AEO 2012 Early Release - Supplemental tables for regional detail, Table 11, New England. * Savings based on the differential in average fuel prices for the period 2012-2032.
The average savings per customer on a present value basis over twenty years is $22,324 for a residential
customer, $40,020 for a commercial customer and over $300,000 for an average industrial customer. To
determine the total estimated savings for each segment, DEEP took the average customer savings for twenty
years for each segment and multiplied them by the number of customers per segment. The total savings on a
present value basis are estimated at $8.0 billion over the twenty-year period analyzed.
12
Prices from U.S. EIA, State Energy Data System. Updated using price rise/decline since 2010 using U.S. EIA.
Fuel oil
$0
$1
$2
$3
$4
Th
ou
sa
nd 2
01
2$
Natural gas
Savings*: $1,800 54%
$0
$2
$4
$6
Tho
usa
nd
$3,300 58%
$0
$10
$20
$30
$40
Tho
usa
nd
$25,000 74%
Residential Commercial Industrial

2013 Connecticut Comprehensive Energy Strategy
Chapter 4: Natural Gas Sector Strategy
127
TABLE 2: Economic benefits from conversion, by customer segment and sector
Segment Customer
Type
Prospective Customers (Estimated)
Annual Fuel
Savings
20-year present value of fuel savings for a
single conversion
20-year present value
Cost for a single conversion
Average NPV for a single conversion
20-year net present value for
entire segment ($million)
Total Savings
A
Residential, Low Use
39,000 $1800 $22,324 $7,500 $14,824 $578
$2,606 Residential,
On Main 161,000 $1800 $22,324 $11,783 $10,541 $1,696
Commercial 16,000 $3300 $40,020 $27,969 $12,051 $188
Industrial 600 $25000 $304,727 $52,104 $252,624 $144
B
Residential 52,000 $1800 $22,324 $18,991 $3,333 $172
$209 Commercial 37,000 $3300 $40,020 $40,939 $(919) $ (34)
Industrial 400 $25000 $304,727 $139,479 $165,248 $ 71
DEEP calculated the savings based on projected fuel prices in the reference case for the New England region
presented in the 2012 Annual Energy Outlook (AEO) produced by the U.S. Energy Information
Administration (EIA). The 2012 AEO reference case projects that natural gas prices will rise by 2.1% per year
from 2010 through 2035, to an annual average of $7.37 per million BTU (2010 dollars) by 2035.13 The report
further projects that oil prices will remain at least three times higher than natural gas prices through that time
period.14 While there is certainly a risk of gas price fluctuations and a narrowing of the current oil-gas price
gap, the expectation of a $4-6 per million BTU price out to about 2020 is widely accepted and did not change
in EIA‘s 2013 early outlook release.
Occasional short periods of elevated gas prices must be anticipated during demand spikes (such as periods of
very cold weather) until supply bottlenecks are addressed. Over the past year, Connecticut has seen such
elevated prices for short periods of time, but it is notable that New York has not. This pricing pattern suggests
that the critical factor is pipeline capacity – an issue that should be given special priority by relevant state
agencies going forward.
A detailed description of the data and assumptions used in DEEP‘s NPV calculations is provided in Appendix
C (Natural Gas). But note again that this baseline analysis reflects traditional regulatory accounting and not
13
U.S. Energy Information Administration State Energy Data System, ―Annual Energy Outlook 2012,‖ p. 91 Available at http://www.eia.gov/forecasts/aeo/pdf/0383(2012).pdf. Note that the natural gas price does not include the cost of delivery (transmission) into the state. Other energy analysts such as CERA and Platt’s support broad-based validity of these price projections,
14 Ibid.

2013 Connecticut Comprehensive Energy Strategy
Chapter 4: Natural Gas Sector Strategy
128
the broader structure of costs and benefits that this Strategy identifies as critical to the conclusion that a
substantial build-out of the State‘s natural gas infrastructure should be undertaken.
Conversion Costs
The cost of converting a building‘s space heating system from fuel oil to natural gas varies depending on
several factors, including the proximity of the building to a gas main, and the amount of energy needed to heat
the building and the specifics of the equipment installed. These costs include:
Equipment Replacement Costs – The new gas customer must replace their existing oil-burning furnace or boiler and hot water heater with gas furnaces or boilers and, often, gas water heaters. For a residential customer, the cost of a new, high efficiency gas furnace or boiler, which can be used with existing radiators/ductwork, plus a natural gas water heater, will range from approximately $3,000-$4,000. The customer may also have to pay to have their oil tank removed, depending on where it is located — whether underground, or inside the home. With installation and disposal costs factored in, the total bill for residential equipment replacement adds up to an average of $7,500.15
Hookup Costs – Some buildings may already be ―hooked up‖ to a gas main. For example, if a home has a gas stove for cooking, but relies on an oil-burning furnace or boiler for heat, it may be ―hooked up.‖ If a home is not ―hooked up,‖ a meter and a ½‖ to 2‖ diameter underground service line must be installed by the gas company to connect the building to a gas main in a street adjacent to the building. Sometimes the service line can be pushed through the soil instead of requiring a trench to be dug. Service and meter installations will cost on average, roughly $4,283 for a residential customer, $7,669 for a commercial customer and $11,504 for an industrial customer.16
Main Extension Costs – In many cases, there is no gas main located in a street adjacent to the building. In that case, the gas main itself must be extended in order for the customer to access natural gas. As a general rule of thumb, if a new customer is located more than 150 feet from a gas main, some extension of the main will be needed to connect the customer to natural gas service. Main extensions are estimated to cost about $1 million per mile, or about $190 per foot, though these costs can vary significantly. Depending on where the new gas main will be located, permits or approvals may be required by DEEP to address soil remediation, wetlands, and water quality impacts. Municipal governments may also require permits for paving or excavation. Paving costs alone may comprise 20% of main extension costs. These paving costs could be reduced if a gas main extension is coordinated with water, sewer, or other infrastructure repairs that involve tearing up and repaving streets.
15
Connecticut Department of Economic and Community Development. The Economic Impact of Expanding Natural Gas Use in Connecticut. By Stanley McMillen and Nandika Prakash. Hartford, CT, 2011. Available at http://www.ct.gov/deep/lib/deep/energy/decd_nat_gas.pdf.; and Navigant Consulting, "EIA-Technology Forecast Updates-Residential and Commercial Building Technologies." Available at http://wpui.wisc.edu/news/EIA%20Posts/EIA%20Reference%20Case%2009-2007%20Second%20Edition%20Final.pdf; and Communication with local installers. Customer conversion cost includes equipment and labor for replacement with new furnace/boiler and water heater, disposal of fuel oil tank, new controls, balancing, etc. See, Appendix C (Natural Gas) Table TA-3 for a summary of response from communication with local installers.
16 Connecticut Department of Economic and Community Development. The Economic Impact of Expanding Natural Gas Use in Connecticut. By Stanley McMillen and Nandika Prakash. Hartford, CT, 2011. Available at http://www.ct.gov/deep/lib/deep/energy/decd_nat_gas.pdf.The Department adjusted the industrial number by a factor of 1.5X for the purposes of this analysis.

2013 Connecticut Comprehensive Energy Strategy
Chapter 4: Natural Gas Sector Strategy
129
For commercial and industrial customers, with larger installations, overall conversion costs are proportionally
higher and vary more widely, due their wider range of heating needs. These customers typically need larger
heating equipment and potentially larger service lines, more advanced meters than homeowners, and also
have greater old equipment disposal costs (Table 3).
TABLE 3: Approximate cost for conversion to natural gas, by customer type
Primary cost drivers are heating equipment, and service line/meter. Gas main extensions can add significant costs to off-
main customers’ expenses — these costs will vary widely.17
Customer Type Equipment
Replacement Hookup Main Extension
Residential $7,500 $4,283
Approximately
$190 per foot Commercial $20,300 $7,669
Industrial $40,600 $11,504
Source: Connecticut Department of Economic and Community Development, Expanding Natural Gas; Communication with local installers; and Navigant, ―Technology Forecast Updates.‖
Who pays for the various costs associated with conversion? All new natural gas customers must pay for the
cost of equipment replacement. Some pay for these costs out-of-pocket. Others may utilize a home equity loan
or other financing mechanism to spread the equipment costs out over time. For many who might like to
convert to natural gas however, the upfront cost has been an obstacle. Developing attractive new financing
options to make natural gas conversion easier is therefore an important component of this Strategy.
In practice, the majority of the ―hookup‖ costs (service line and meter) are paid for by the gas company (Table
3). Under the current regulatory structure, the gas company may invest (and then recover from existing as
well as the new ratepayers) the costs of expanding the distribution system to add a new customer, so long as
the expected increase in revenues from supplying natural gas to the new customer is sufficient to recover both
the costs of hooking them up and the associated utility rate of return over a 15 or 20 year period (―payback
period‖).18 This regulatory structure, also called the ―hurdle rate test,‖ is intended to protect existing
ratepayers from the risk that the gas companies will add new customers that are not cost-effective. For the
average new ―on-main‖ residential customer (i.e., a customer located within 150‘ of a gas main), the hurdle
17
Main extension costs were estimated for reaching approximately 90,000 off-main customers. Based on the current distribution system average (number of customers per length of main), an estimated 900 miles of main extension would be required. Main extension cost was then accrued by demand – e.g., if a customer or sector will use x% of total segment B demand, the cost for main extension to that customer is assumed to be x% of the total main extension cost. By using this method the intention is to provide a societal cost/benefit perspective. An alternate method would likely require a detailed bottom-up analysis. In reality, costs are likely to weigh more heavily on ―anchor tenants‖ and those customers who are willing to commit to gas service at the time of the main extension.
18 Currently, the hurdle rate for Yankee Gas is based on a 15-year payback period. In April 2011, the hurdle rate for Connecticut Natural Gas and Southern Connecticut Gas was extended to a 20-year payback period under a two-year pilot program.

2013 Connecticut Comprehensive Energy Strategy
Chapter 4: Natural Gas Sector Strategy
130
rate test allows the gas companies to invest an amount sufficient to cover the ―hookup‖ costs, provided no
complex construction requirements are involved.
TABLE 4: Approximate allowed gas company contribution to new customer addition, by customer type (Hurdle Rate)
Customer Type Estimated Increase in Sales (MMBTU/Year)
15 Year Hurdle Rate (Yankee)
20 Year Hurdle Rate (SCG, CNG)
Residential 100 $5,264 $5,190
Commercial 126 $7,209 $12,615
Industrial 971 $20,604 $34,640
Source: Response to DEEP data request (August 27, 2012).
In the event that revenues associated with the new customer are insufficient to recover the hookup costs over
the allowed payback period, the Connecticut regulatory structure has historically required the new customer
to pay for the non-covered costs up-front through a charge called a ―Contribution in Aid of Construction‖
(CIAC). This Strategy propose to change this practice in a number of regards in order to capture the full
spectrum of societal benefits from greater fuel choice – as spelled out above.
For the majority of new customers located on-main, little to no CIAC will be required.19 Conversely, ―off-main‖
customers located 150 feet or more from a gas main that historically would have faced significant upfront
CIAC payments to convert to natural gas will benefit from the regulatory changes called for in this Strategy. As
discussed in more detail below, if a potential new off-main industrial customer uses a large amount of energy
(e.g., a factory, a hospital, or a school), the savings from using natural gas instead of heating oil may balance
out the CIAC charge for a gas main extension – particularly if the traditional CIAC burden can be converted
into a slightly higher gas rate which allows the construction costs to be paid back over time. Alternatively, a
potential new off-main residential customer who does not consume a lot of energy may be able to lower the
CIAC charge if the customer lives in a densely populated neighborhood in which many people convert to
natural gas all at once, thereby spreading the main extension expense more cost-effectively.
The Fuel Switching Opportunity, by Customer Segment
Whether it makes economic sense for a fuel oil customer to switch to natural gas depends on a variety of
factors, including the price of natural gas and heating oil, the amount of energy the customer uses for building
heating, the proximity of the nearest gas main, the cost and appropriateness of other heating options, and the
cost of the furnace, boiler, or other equipment that must be replaced. To evaluate the opportunity for
Connecticut homes and businesses to cost-effectively switch to natural gas, potential new customers have
19
Gas companies’ response to DEEP data request (July 16, 2012), p. 3.

2013 Connecticut Comprehensive Energy Strategy
Chapter 4: Natural Gas Sector Strategy
131
been divided into the following segments, based on the factors that affect the cost-effectiveness of their
conversion potential.20
Segment A: On-Main and Low-Use Customer Prospects
Currently, about 216,000 homes and businesses in Connecticut are located on gas mains but are not receiving
gas service.21 No main extensions would be needed to convert these customers to natural gas. As explained
above, the ―hookup‖ costs to install a service line and meter would be paid for and recovered in rates by the
gas company in most instances, and therefore the home or business owner would only have to pay for
equipment replacement costs in order to switch to natural gas. However, the gas companies estimate that of
those 216,000 total potential customers, approximately 15% are currently heating their homes with electricity,
which makes it difficult and expensive to convert to gas, and another 4% would be unwilling to convert for
other reasons. Therefore, close to 20% of these total potential customers would not be likely prospects for gas
conversion.22 The gas companies estimate the number of potential on-main conversions is closer to 177,000.
In addition to this potential ―on-main‖ customer segment, there are another 63,000 residences in Connecticut
that have natural gas service and use it for cooking, but not for space heating. The gas companies have
indicated that more than one-third (24,000) of these so-called ―low-use‖ customers live in apartments or
other multi-family dwellings that are heated by a central furnace or boiler. These customers are unlikely
prospects for equipment conversion due to what is called the ―split incentive:‖ while the apartment-dweller
pays the heating costs for their unit and may be eager to save money by switching to natural gas, the building
owner would shoulder the costs of installing natural gas equipment and may have no incentive to switch. The
remaining 39,000 potential low-use customers will have the same overall conversion costs as the ―on-main‖
customers (i.e., for equipment replacement), and the gas companies would incur little to no distribution
infrastructure costs when a customer converts.23 This sector therefore is very cost-effective to convert as it
adds revenues but costs little to convert to the gas system. For the purposes of this analysis, DEEP believes
39,000 is the appropriate number of potential new gas customers in this segment.
As Table 5 indicates, converting all the likely on-main and low-use customer prospects would increase the
share of Connecticut residences heating with natural gas from 34% to 49%, and would increase the share of
commercial and industrial firms heating with gas to 75%. Extrapolating from the costs of expansion discussed
20
Average costs are used here for economic evaluation. They are not applicable to an individual potential gas customer’s economic decision whether or not to convert to natural gas. Within each of these segments, there are sub-segments that are broadly defined by residential, commercial, and industrial customers whose economics also differ depending on conversion costs and energy use.
21 Gas companies’ response to DEEP data request (August 17, 2012), p.1.
22 Gas companies’ response to DEEP data request (August 17, 2012), p.1; and Connecticut Department of Economic and Community Development. The Economic Impact of Expanding Natural Gas Use in Connecticut. By Stanley McMillen and Nandika Prakash. Hartford, CT, 2011. Available at http://www.ct.gov/deep/lib/deep/energy/decd_nat_gas.pdf.
23 Gas companies response to DEEP data request (August 17, 2012).

2013 Connecticut Comprehensive Energy Strategy
Chapter 4: Natural Gas Sector Strategy
132
above, DEEP estimates that the capital costs the gas companies would incur in adding distribution
infrastructure (i.e., service line and meter) for Segment A customers would be approximately$815 million.
Most of these costs would meet the existing hurdle rate test, and would be recovered by the gas companies
from existing and the new ratepayers. In addition, new customers could personally invest approximately
$1.84 billion to pay for the cost of equipment replacement. DEEP estimates the total savings to be $5.2 billion
over a 20 year period from Segment A conversions. The total impact is a positive net benefit of $2.6 billion
over the twenty year period.
TABLE 5: Number of Customers, by Segment
Customer Type Total
Premises Current Gas Customers
A B C
Low Use On Main Off Main Unlikely to
Convert
Residential 1,400,000
(100%)
482,000
(34%)
39,000
(3%)
161,000
(12%)
51,500 (4%)
666,500
(47%)
Commercial 133,600
(100%)
47,000
(35%)
16,000
(12%)
37,300
(28%)
33,300
(25%)
Industrial 4,500
(100%)
2,350
(52%)
650
(14%)
400
(9%)
1,100
(25%)
Segment B: Off-Main Customer Prospects
As discussed above, for premises located more than 150 feet from a gas main (―off-main‖), conversions will
require some extension of the gas mains as well as equipment replacement and hookup costs. As noted above,
at an average of $1 million per mile, the cost of a gas main extension can add up quickly. Under the existing
regulatory structure, any costs not recoverable through future revenues over a 15- or 20-year period must be
paid up front by the new customer. Moreover, the traditional regulatory accounting does not fully account
capture the benefits of an expanded gas infrastructure.
Larger prospective off-main customers, often referred to as ―anchor customers,‖ have more of an economic
incentive to switch than smaller customers due to their higher usage. A factory, school, or hospital that
consumes a large amount of energy for heating can achieve significant savings by switching from oil to natural
gas, and in some cases the savings outweigh the CIAC cost for the main extension. Smaller off-main customer
prospects, such as a home or small business, may not consume enough energy for the savings benefit to
outweigh the CIAC cost if they switch to natural gas on their own. The conversion of a nearby anchor
customer, however, might bring the gas main close enough to these smaller customers to reduce or even
eliminate their CIAC cost. Many would be more likely to convert to natural gas if they could share the cost of
the main extension with others. For example, a group of off- main homes or businesses clustered together in a
dense neighborhood may find that by converting to natural gas at the same time, their collective revenues are
sufficient to recover the costs of the main extension over a 15- to 20-year period, and thus avoid or reduce the

2013 Connecticut Comprehensive Energy Strategy
Chapter 4: Natural Gas Sector Strategy
133
CIAC required. And when the full non-energy (or ―societal‖) benefits are factored in as this Strategy calls for,
many more Segment B conversions will be cost-effective.
As these examples show, there are a variety of factors that affect the economics of a gas main extension.
Consequently, it is hard to say with precision how many ―off main‖ homes and businesses are economically
good candidates for gas conversion. In 2011, Connecticut‘s three natural gas distribution companies
commissioned the Connecticut Department of Economic and Community Development (DECD) to produce a
study of ―The Economic Impact of Expanding Natural Gas Use in Connecticut.‖24 The DECD study analyzed
the potential of increasing the share of Connecticut homes and businesses heating with natural gas to 50% for
residential customers, and 75% for commercial and industrial firms. To reach the 50% and 75% penetration
level targets for residential and C&I customers, respectively, the DECD study estimated that in addition to
converting all likely on-main and low-use customer prospects (Segment A), an additional 89,000 new off-
main customers and almost 900 miles of gas main could be added in two five-year periods.25 These 89,000
off-main potential customers were identified by the gas companies as having the best combination of factors
— high-energy consumption, proximity to an existing gas main and other potential customers — to support
cost-effective conversion.
For the purposes of this Strategy, these 89,000 potential off-main customers will be referred to as Segment B.
To convert a customer in Segment B, the cost compared to Segment A customers is estimated to increase on
average, by an approximate $7,200 for residential buildings. The cost increases estimated for commercial and
industrial facilities are more than $13,000.26 DEEP estimates that adding distribution infrastructure to serve
all Segment B customers would cost approximately$1.44 billion ($512 million for service and meters, and
$926 million for gas main extensions). In addition, customers would incur approximately $1.16 billion for
equipment replacement. DEEP estimates that the total savings associated with Segment B conversions is
approximately $2.8 billion, which leads to a net savings of $.2 billion over twenty years on a net present value
(NPV) basis. Again, these calculations do not represent the ―fully loaded‖ cost/benefit analysis that would take
into account economic development, job growth, and environmental benefits, among other considerations.
The actual number of Segment B customers that are viable off-main prospects will ultimately depend on a
number of factors including gas prices, costs of main extensions, the actual number of customers converting
in a given locale and regulatory policies and incentives. Given the cost-benefit variables within Segment B,
any strategy for expansion into this segment should be further broken down by load and distance to existing
main in order to prioritize reaching the customers for whom conversion is the most cost-effective and that
24
DEEP has utilized some of the data contained in the study, where applicable, to develop a comprehensive cost/benefit analysis of the natural gas opportunity that exists.
25 Connecticut Department of Economic and Community Development. The Economic Impact of Expanding Natural Gas Use in Connecticut. By Stanley McMillen and Nandika Prakash. Hartford, CT, 2011. Available at http://www.ct.gov/deep/lib/deep/energy/decd_nat_gas.pdf. p. 14.
26 Main extension costs were estimated for reaching 90,000 off-main customers.

2013 Connecticut Comprehensive Energy Strategy
Chapter 4: Natural Gas Sector Strategy
134
would also provide the most economic benefit to the state. In addition to maximizing early benefits, such an
approach allows the State additional time to monitor market trends and other factors that might affect
decisions about what degree of further expansion is in the state‘s interest.
Segment C: Unlikely Prospects for Conversion
As Table 5 indicates, almost half of Connecticut‘s residences and a quarter of its commercial and industrial
premises are not good candidates for conversion to natural gas at this time given their distance from gas
mains. This is a large group: about 666,500 residences, 33,300 commercial buildings, and 1,200 industrial
facilities — amounting to about 54% of buildings in the state. 27 These buildings are now heated by fuel oil,
propane, or electricity. Many of these properties are located far enough away from existing natural gas
infrastructure that the costs of converting them to gas heat (i.e., substantial main extension, hookup and
equipment replacement) are prohibitive relative to their potential energy bill savings. These customers are
grouped in Segment C, and are considered unlikely prospects for conversion at this time. It is important to
recognize however, that some of these buildings might become conversion prospects in the future, as gas
mains are extended to connect Segment B customers. Gas main extensions to reach Segment B may thereby
reduce the distance needed to connect nearby premises in Segment C. An example of the three segments in
the residential sector (A, B, C), and their potential for fuel switching, is shown in Figure 6, below. The
interplay between Segment B customers and Segment C customers will be ―tied‖ to the sequential
prioritization of segment B customers recommended above.
FIGURE 6: Conversion potential by customer segment, for the residential sector
Source: Connecticut Department of Economic and Community Development, Expanding Natural Gas.
Conversion Risks
27
Connecticut Department of Economic and Community Development. The Economic Impact of Expanding Natural Gas Use in Connecticut. By Stanley McMillen and Nandika Prakash. Hartford, CT, 2011. Available at http://www.ct.gov/deep/lib/deep/energy/decd_nat_gas.pdf.
Fuel oil
0
500
1,000
1,500
Th
ou
san
ds o
f custo
me
rs
Natural gas
Electricity
Propane
Residential building heating by fuel type
0
250
500
750
Th
ousa
nd
s o
f cu
sto
me
rs
Non-heat/low-use
On-main Off-main
A
B
C
Current fuel oil custom-
ers
Potential NG conversions—36% of current fuel oil customers
Far off-main— unlikely to convert at this
time, 64%

2013 Connecticut Comprehensive Energy Strategy
Chapter 4: Natural Gas Sector Strategy
135
While this NPV analysis shows the clear economic benefits of converting to natural gas for building heating, it
is important to understand the risks involved in a large-scale conversion strategy. As noted above, future
prices can never be forecast with absolutely certainty. Oil prices could decline or natural gas prices could rise
unexpectedly. Demand for natural gas could rise as more electric generation switches from coal or oil to
natural gas. An expansion in natural gas exports could redirect United States gas supplies to markets in Asia
and Europe where gas prices are much higher, driving up the price of natural gas here in the United States.
Additionally, reserves could prove more difficult to access than currently thought. Fuel consumption could
drop because of the investment in energy efficiency measures called for elsewhere in the Strategy, reducing
the potential savings from natural gas conversion. Potential negative environmental impacts from ―fracking‖
— such as groundwater contamination, methane leakage, or other damage to the environment or public health
— could require regulatory changes in the areas where natural gas is produced which could slow the pace of
drilling or drive up the costs in order to address these issues.
DEEP takes the environmental concerns related to fracking very seriously. Recent surveys indicate that
Connecticut‘s own potential undiscovered natural gas resources are so minimal that they are highly unlikely to
be developed.28 Proper fracking regulations are needed in the states that do have recoverable natural gas
reserves. To date, safety and environmental regulation of fracking has been better in some states than others.
DEEP will work with other states and the federal government to do what it can to ensure that natural gas is
produced and transported in accordance with the highest environmental standards. The State recently called
upon the EPA to establish standards for methane releases from gas and oil wells. The State will also work with
the pipeline and local distribution companies to establish a ―no leakage‖ target for transmission and
distribution of natural gas in the State. For its part, Connecticut is aggressively working to upgrade cast-iron
local distribution infrastructure. Additionally, the state should require each of the local gas companies to
partner with the EPA in its ―Gas Star‖ program.
In order to assess the impact that any of these uncertainties might have on the analysis, DEEP compared the
NPV of natural gas conversion under several different scenarios. During this comparison, the 2011 Annual
Energy Outlook (AEO) fuel price projections were applied. These projections assume lower or higher recovery
of natural gas reserves, and lower or higher oil prices. DEEP‘s calculations, which are explained in detail in
Appendix C (Natural Gas), showed that if (retail) home heating oil prices turn out to be lower (approximately
$17.50 per MMBtu, or $2.40/gallon)29 than projected in the 2012 AEO reference case (approximately $28.50
per MMBtu, or $3.90/gallon), neither Segment A nor Segment B conversions would be cost-effective.
However, in all of the other scenarios tested, DEEP found that converting all ―on main‖ homes and businesses
28
A recent USGS survey estimated undiscovered reserves of 3.5 billion cubic feet of natural gas in five assessment units in Connecticut’s Hartford Basin. These reserves are tiny in comparison to the Marcellus shale, which is estimated to contain 84 trillion cubic feet of gas.
29 Based on the low oil price scenario as forecasted in the U.S. EIA, Annual Energy Outlook 2011, averaged for the period 2013-2033.

2013 Connecticut Comprehensive Energy Strategy
Chapter 4: Natural Gas Sector Strategy
136
(Segment A) from fuel oil to gas creates positive NPV within EIA‘s forecast range for natural gas prices (Figure
7). In fact, natural gas prices would have to rise ten times higher than EIA‘s current ―high‖ natural gas price
projections to negate the benefits of conversion for average Segment A customers. For Segment B, the DEEP‘s
calculations showed that residential and industrial conversions would still create value and reduce bills even
under the EIA high natural gas price scenario. But if prices were to rise two-fold above the ―high‖ EIA gas
price, the benefits of conversion would be negated for some of the customers in Segment B. This further
reinforces the need for proper targeting and segmentation of Segment B customers as recommended in this
Chapter.
FIGURE 7: Sensitivity of net present value to natural gas prices (based on EIA high natural gas price scenario)
Source: Analysis using data from U.S. EIA, Annual Energy Outlook 2011; and U.S. EIA, Annual Energy Outlook 2012.
The deployment of energy efficiency measures will also influence the cost-effectiveness of natural gas
conversion. As detailed elsewhere in the Strategy, Connecticut has a significant opportunity to reduce energy
costs by improving the efficiency of its buildings. See, Chapter 1 (Efficiency). Efficiency measures reduce the
amount of energy needed to heat a home or business which, in turn, reduces the savings that would be
recouped from switching from fuel oil to cheaper natural gas. To model the impact of a sustained investment
in all cost-effective efficiency measures across the state, DEEP assumed a 20% reduction in energy
consumption in the residential sector, and a 15% reduction in the commercial and industrial sectors over a 10-
year investment period. Even if these efficiency goals are achieved, switching potential ―on main‖ customers
to natural gas (Segment A) still yields enormous value: about $1.7 billion in aggregate NPV.
For Segment B buildings, achieving planned energy efficiency savings could potentially create a net negative
NPV for commercial and residential buildings, though the industrial segment would remain slightly positive.
If planned efficiency gains were to coincide with a rise in the price of natural gas, Segment A would still
remain a solid positive investment, but Segment B would not, further supporting the recommendation to
divide segment B into categories with the highest benefit for investment (Figure 8). Additional sensitivity
scenarios can be found in Appendix C (Natural Gas). These are average results that can be used for strategic
guidance and for managing risks, but the outcomes of actual conversions will vary in each segment.
Base case NPV
$2.6bn High NG
price NPV reduction
(11%)
High NG price NPV
$2.3bn
$0
$1
$2
$3
Bill
ion
20
12
$
Base case NPV
$0.2bn High NG
price NPV $0.05bn
High NG price NPV reduction
(73%)
$0.0
$0.2
$0.4
Bill
ion
20
12$
Segment A Segment B

2013 Connecticut Comprehensive Energy Strategy
Chapter 4: Natural Gas Sector Strategy
137
FIGURE 8: Sensitivity of net present value to combined energy efficiency and high NG prices
Source: RMI analysis, discussed in Appendix C (Natural Gas)
On December 5, 2012, the U.S. Energy Information Administration (EIA) issued an early release of its 2013
Annual Energy Outlook (AEO2013) which highlighted changes from the 2012 reference case projections.
Some of the major changes forecast in the AEO2013 outlook include: crude oil production, particularly from
tight oil plays, rising sharply over the next decade; greater increases in natural gas production to meet rising
demand, increased use of natural gas in the industrial and electric power sectors; and an expanding export
market. While a significant differential between oil and gas prices still exists, it has been reduced slightly due
to some projected decline in oil prices.
FIGURE 9: Comparison of EIA price projections
Source: EIA Annual Energy Outlook 2012 projections; EIA Annual Energy Outlook 2013 projections.
Base case NPV
$0.2bn EE EE + high NG price
NPV
($0.4bn)
High NG prices
-$1
$0
$1
Bill
ion
20
12
$
Base case NPV
$2.6bn
EE
EE + high NG price
NPV
$1.4bn
High NG prices
$0
$1
$2
$3
Bill
ion
20
12
$

2013 Connecticut Comprehensive Energy Strategy
Chapter 4: Natural Gas Sector Strategy
138
DEEP updated the Strategy‘s Net Present Value (NPV) analysis to reflect EIA‘s gas and oil projections from
AEO2013 and found that it reduced the aggregate savings of each segment.30 For Segment A, the aggregate
savings were reduced from approximately $5.28 billion to $4.70 billion. For Segment B, the aggregate savings
were reduced from approximately $2.77 billion to $2.54 billion. Since the cost of conversion is unchanged, the
reduced savings lead to a lower NPV for each segment. A large NPV benefit remains for Segment A, at
approximately $2.04 billion, while Segment B in its entirety becomes NPV negative (-$23 million). While the
updated forecast figures have little effect on the economics of Segment A, it greatly reduces the number of
cost-effective conversion prospects in Segment B (though it should be noted that there are many Segment B
customers that will still see a net positive economic benefit from conversion, which is one of the reasons for
undertaking the more detailed analysis described in the recommendations section of this chapter). After
weighing all of these risks and uncertainties, the DEEP‘s analysis concludes that a large benefit will accrue to
the state if it can effectively convert Segment A buildings and those Segment B buildings whose economics are
most positive (i.e., the net benefits exceed the costs of investment).
However, to capture these benefits several challenges must be met – most notably dealing with the upfront
investment costs that new customers and the utilities and their customers will face. At the same time, a
strategy needs to be developed to better address the heating costs of approximately 50% of state homes whose
locations and energy use make conversion cost prohibitive. The best solutions for these customers can be
found with greater efficiency measures and other types of fuel-switching, such as converting to geothermal (or
ground source heat pump) heating systems.
Current and projected fuel prices provide an opportunity for many customers to significantly reduce their
energy bills by converting to natural gas. While the analysis in this report is based on the continuation of
current trends and predictions, it is quite possible that the price differential between oil and natural gas prices
could shrink further if gas prices were to rise faster than expected and/or oil prices declined. Historically, it
has been extremely difficult to forecast future energy prices with a high degree of accuracy. The economics
and risks associated with conversion will vary for each customer. There are also risks to gas ratepayers and the
gas distribution companies. It is important to recognize these risks so that the gas companies, state
regulators, and policymakers act to minimize negative impacts and are prepared to make changes if needed as
we move forward.
The analysis of societal impact of the costs and benefits of the gas conversion strategy in this report is based
on average fuel savings and conversion cost estimates for customer groups in each segment. The average cost
for natural gas equipment for residential customers is estimated at $7,500, and the annual fuel savings are
estimated at $1,800 a year over a 20-year period. Off-main customers incur an additional cost for the main
extension. While using such average numbers is common and necessary to estimate the economics for each
30
The AEO2013 does not include data for high/low price scenarios, and therefore DEEP has not updated the sensitivity analysis.

2013 Connecticut Comprehensive Energy Strategy
Chapter 4: Natural Gas Sector Strategy
139
segment, the actual economics of conversion will vary significantly for each customer. Equipment costs will
vary among vendors and savings will vary based on the size of the home, its degree of weatherization, and the
actual per unit gas rates relative to oil prices. While customers will have to pay a significant amount to convert
to natural gas, the total cost is really based upon the time value of that investment since all of these customers
will need to replace their existing furnace at some point in the future. For on-main customers with old
furnaces that will need to be replaced in a few years, the real cost is relatively minor and a year or two of
savings will justify their investment. For customers with newer furnaces, the cost will approximate the amount
they must pay for the new furnace and main extension and they will face a longer payback period, making
future expectations regarding fuel prices more important. If the differential between gas and oil prices does
decline the payback time will be longer for all customers. Customers that convert will also be improving the
efficiency of their heating systems so that some savings will persist even if there were a dramatic change in
fuel prices.
This Strategy directs the gas companies to submit a comprehensive seven year plan to DEEP and annual
updates for PURA review so that any expansion proceeds incrementally to minimize risks to existing
ratepayers and cost recovery for the gas distribution companies. It is important that gas mains and supply be
expanded to coincide with new demand to the greatest extent possible to minimize paying excess capacity
costs and any resulting impact on rates. Therefore, it is critical that the plan developed by the gas companies
include a detailed schedule for reserving the increments of capacity needed over time, and PURA approve
procuring such incremental increases in capacity in anticipation of increased load.
DEEP recommends changes to some current regulatory policies to encourage gas conversions including
extending the hurdle rate to twenty-five years (which is more in keeping with calculations used in other states)
and allowing greater flexibility in projecting revenues from proposed main extension. While these changes
would somewhat alter the economics of gas expansion, projects would still need pass the hurdle rate test
(using a longer time frame) and participating customers would still be required to pay a contribution in aid of
construction (CIAC) if expected revenues are insufficient to recover the costs.
Additional Costs and Benefits to Society
While the discussion so far has focused on the direct costs and benefits to potential new customers of
switching to natural gas, it is important to also consider the costs and benefits of fuel switching to society as a
whole. Neither natural gas nor fuel oil is produced in Connecticut so most of the money Connecticut
consumers spend on either fuel flows into the pockets of out-of-state energy producers. Every dollar that
Connecticut customers save by switching to natural gas, therefore, is a dollar that can be redirected into the
state‘s economy.
The Department of Economic and Community Development (DECD) study, referenced earlier, identified
significant economic benefits that could result from a natural gas distribution build-out in terms of jobs
created, increased tax revenue, and increased net GDP. Assuming that a distribution build-out of

2013 Connecticut Comprehensive Energy Strategy
Chapter 4: Natural Gas Sector Strategy
140
approximately 266,000 customers occurred over ten years, the DECD study estimated the addition of 54,000
job-years of net total employment, with 8,000 jobs added per year in the first five years and 3,100 added per
year in years 6-10. The DECD study further estimated that a ten-year build-out would increase net GDP by
$4.1 billion over the expansion period ($2.8 billion in the first five years and $1.3 billion in the later years)
and would generate $0.4 billion in increased state tax revenue (86% realized in the first five years). Assuming
the expansion is completed in 2021, the DECD study projected a set level of savings would accrue to
customers and business owners, equivalent to $250 million/year and would be injected into Connecticut‘s
economy (once the program was completed) by saving residential customers up to $1,200 per year on their
heating bills. The study anticipated a $215 million annual reduction in energy costs for commercial and
industrial customers over the same time period.31
Natural gas fuel switching can also improve regional competitiveness by attracting or retaining businesses by
offering lower fuel costs. The extension of a gas main to connect a manufacturing plant to natural gas can help
a company lower its energy costs, which can benefit society by creating or retaining jobs in-state and boosting
Connecticut‘s economic competitiveness within the region. For this reason, many commenters representing
Connecticut businesses supported opportunities to expand the natural gas distribution network.
The conversion of on-main and off-main customers to natural gas would also generate environmental benefits
for all Connecticut residents. The combustion of fossil fuels emits several types of pollutants, including carbon
dioxide (CO2), nitrogen oxides (NOx), sulfur oxides (SOx), and particulate matter (solid or liquid particles in
soot or smoke that are discharged into the air).32 NOx, SOx, and particulate matter are regulated by the federal
government because they cause respiratory illnesses, harm the environment, and damage property. CO2 and
NOx are greenhouse gases, meaning that they trap heat in the atmosphere and thereby contribute to climate
change.
Natural gas produces less air pollution when burned than other fossil fuels. Connecticut is already seeing the
air pollution benefits of fuel switching in the electricity sector. Burning natural gas instead of fuel oil for
heating, or in place of gasoline or diesel fuel for transportation, can reduce emissions of NOx by 20-50% and
SOx by up to 99%, and can reduce CO2 emissions by up to 25-27% (Figure 10). 33,34 Emissions of particulate
matter are typically reduced as well, but the amount of reduction depends on the specific application.
31
The Department notes that these figures are based on an assumed annual savings of $1,264, $2,825 and $44,497 for residential, commercial and industrial customers, respectively, reflecting market conditions at the time the DECD study was conducted, as well as a 10 year timeframe for completion of a natural gas expansion. Under current market conditions, actual savings are now larger.
32 U.S. Environmental Protection Agency, ―Particulate Matter.‖ Available at http://www.epa.gov/air/particlepollution/.
33 NESCAUM analysis based on: U.S. Environmental Protection Agency (EPA), ―MOVES‖; Connecticut DEEP, ―Emissions Inventory‖; U.S. EPA, ―Clean Air Markets‖; and U.S. EPA, ―Emissions Factors.‖ SOx emissions are reduced by 40-60% compared to gasoline and low sulfur diesel or fuel oil, whereas they can be reduced up to 99% compared to commonly available (2000ppm sulfur) fuel oil.

2013 Connecticut Comprehensive Energy Strategy
Chapter 4: Natural Gas Sector Strategy
141
FIGURE 10: Carbon dioxide emissions from fossil fuel combustion, by fuel type
Source: U.S. EPA.
These reductions in air pollution, however, only take into account the burning of natural gas instead of other
fossil fuels at the point of use. They do not consider the potential environmental impacts occurring
―upstream,‖ where the natural gas or oil is produced, or the potential for methane leakage from natural gas
pipelines as the gas is transmitted to Connecticut. Although these upstream issues need to be considered for
oil or any other fuel source, they have garnered special attention with regards to natural gas. Some studies
point to minor and/or manageable impacts, while others suggest these upstream impacts could potentially
offset any end-use greenhouse gas emissions reduction. As the impacts of drilling/transport emissions of
natural gas relative to fuel oil are unclear at this time, DEEP did not adjust the figures used in the Strategy for
air pollution reductions.
Assuming that these upstream impacts from natural gas production/transportation are not dramatically
different than oil, the conversion of all potential Segment A and Segment B customers could reduce the state‘s
greenhouse gas emissions by about 8% relative to today‘s building heating related emissions. An 8% reduction
would contribute measurably towards the 80% greenhouse gas reduction requirement from 2001 levels by
2050, specified in the State‘s Global Warming Solutions Act (GWSA) of 2008. However, more dramatic steps
will be needed in the future in order to meet the State‘s greenhouse gas emissions reduction targets. DEEP
expects that natural gas will continue to have a major role in energy planning as the country continues to
move toward developing an even cleaner, renewable energy future, because natural gas generation is an
effective and relatively clean way to balance the intermittency of solar and wind generation until large-scale
energy storage solutions can be found for currently-intermittent renewable electricity generation.
Large-scale expansion of natural gas as a heating fuel would cause some economic dislocation. Because fuel oil
use will drop, some of the state‘s fuel oil companies will lose delivery revenues, particularly in certain service
areas. The same will be true for those distributing and servicing fuel oil-based equipment. At the same time,
natural gas conversion will create jobs — primarily for the installation of natural gas infrastructure and
34
For more information, see International Energy Agency, Golden Rules; Kirchgessner, ―Estimate of Methane Emissions‖; and Barcella, ―Mismeasuring Methane.‖
Natural gas 53
Diesel 73
Heating oil 73
Gasoline 71
0
25
50
75
100
Kg
CO
2/M
BT
U
Buildings and Transportation
-25–27%

2013 Connecticut Comprehensive Energy Strategy
Chapter 4: Natural Gas Sector Strategy
142
heating equipment. As noted above, the 2011 DECD study estimates that converting Segment A and Segment
B customers would create 54,000 man-years of work, meaning that 5,400 people could be employed for 10
years (assuming a 10 year expansion time frame).35 As will be discussed in the recommendations section,
below, participation in a natural gas expansion program can also present new opportunities for fuel oil dealers
that would lessen the impact of associated oil business revenue loss.
Planning for Expansion
In light of the potential fuel cost savings described above, it is no surprise that increasing numbers of
Connecticut homes and businesses are already taking steps to switch from fuel oil heating to natural gas
(Figure 11). Over the past three years, the number of new natural gas customers has increased steadily, from
9,000 customers added in 2009 to an estimated 15,000 expected to convert in 2012. At this rate, it would take
14 years for all Segment A customers to convert to natural gas, and 20 years to convert both Segment A and
Segment B customers.
FIGURE 11: Comparison to recent natural gas customer addition rate
Conversion to natural gas has increased in recent years driven by lower prices and gas companies’ marketing efforts.
Source: Data provided by Connecticut Natural Gas and Southern Connecticut Gas. A 2012 estimate from Yankee Gas was not available; therefore the number was estimated by applying the growth rate from the other gas companies to Yankee’s (larger) market share.
Assuming no incentives to convert to gas are provided, Table 6 shows the payback from the customer‘s
perspective under the current regulatory structure. Switching to gas today can generate annual fuel savings
that cover the cost of conversion in less than two years for industrial customers in Segment A, and little more
than four years for residential customers in Segment A and industrial customers in Segment B. But even in
highly economic circumstances, some customers may be deterred from converting because of the upfront
costs they must pay.
35
Estimated job creation is for both segment A and B and was taken from Connecticut Department of Economic and Community Development. The Economic Impact of Expanding Natural Gas Use in Connecticut. By Stanley McMillen and Nandika Prakash. Hartford, CT, 2011. Available at http://www.ct.gov/deep/lib/deep/energy/decd_nat_gas.pdf.
9 11
12 15
32
64
0
20
40
60
2009 2010 2011
An
nu
al cu
sto
me
r a
dd
itio
ns
(th
ou
san
d)
Estimated for 2012
Yankee
SCG CNG
Required rate for segments A & B over 10yr (left) and
5yr (right column)
A
B
On-main
Off-main
Non-heating

2013 Connecticut Comprehensive Energy Strategy
Chapter 4: Natural Gas Sector Strategy
143
TABLE 6: Summary of paybacks
Segment Customer Type Prospective Customers (Estimated)
Estimated Customer
Conversion Cost
Estimated CIAC Cost
Estimated Annual Fuel
Savings
Simple Payback (years)
A
Residential, Low Use
39,000 $7,500 $1,800 4.2
Residential, On Main
160,800 $7,500 $1,800 4.2
Commercial 15,500 $20,300 $3,100 6.5
Industrial 570 $40,600 $24,000 1.7
B
Residential 51,500 $7,500 $6,300 $1,800 7.7
Commercial 37,000 $20,300 $12,100 $3,100 10.5
Industrial 430 $40,600 $67,900 $24,000 4.5
Source: DEEP Analysis.
The economics are compounded by the fact that customers‘ existing equipment is usually working and they
would therefore be retiring it before the end of its serviceable life. Most furnaces fail during the winter months
at which point the customer‘s sole priority is rapid replacement to restore heat to their home or business. Fuel
switching will not be a viable option, since service lines and gas mains cannot be installed overnight. HVAC
contractors can also be extremely busy during the winter months, exacerbating delays.
The current process for developing new gas mains is both time- and cost-intensive. For example, where an
―off-main‖ customer expresses interest in conversion but cannot afford to pay the entire CIAC charge needed
to build out the main, gas company sales representatives may recruit nearby homeowners or businesses to
also convert and thereby spread the CIAC charge among them. As potential customers opt in or opt out of the
conversion process, the economics of the main extension, and in some cases the associated CIAC, will change.
This may cause more customers to opt in or out due to the required CIAC. Acquiring new customers requires
assembling and obtaining commitments from this ―portfolio‖ of potential customers, which is an iterative,
time-consuming and in many instances, unsuccessful process. Siting the new main can also be time- and
resource-intensive. Depending on where the new gas main will be located, permits or approvals may be
required by DEEP to address soil remediation, wetlands, and water quality impacts. Municipal governments
may also require permits for paving or excavation.
Given the challenges discussed above, it is important to consider the benefits of developing a more
coordinated fuel -switching program, organized through a planning process overseen by the State. Such a
coordinated planning process has the potential to not just speed up the rate of customer conversions, but to
ensure that customers have a real choice when it comes to heating their homes or businesses. A structured
planning process can also reduce the costs of conversion and help ensure the reliability of gas supply for
heating and electric generation purposes. A planning process would also raise customer awareness about the

2013 Connecticut Comprehensive Energy Strategy
Chapter 4: Natural Gas Sector Strategy
144
economic opportunity from fuel switching, accelerating the pace at which the state and individual citizens will
get the benefits of conversion. For example, a planning process could reduce the conversion costs for Segment
B by coordinating main expansion with other infrastructure improvement projects such as sewers, storm
water control, and road resurfacing. Anecdotal evidence suggests that such as eliminating the cost of
excavating and repaving streets for individual distribution projects, could reduce main expansion costs from
~10-40% under some conditions.
The economic analysis presented in this Chapter is based on the full potential of approximately 300,000
customer prospects. The potential on-main customers did not include electrically heated homes since they
are difficult and expensive to convert to natural gas. However, only 4% of the on-main oil customers were
assumed not to switch to gas. DEEP believes that this assumption is very optimistic. It is likely that
customers with relatively new oil furnaces will be reluctant to abandon their investment and convert to gas
immediately. Price uncertainty or personal finance issues and priorities will limit other customers from
switching.
The customers that represent Segment B in the analysis in this Chapter are the number of customers needed
to reach 50% of the total residential customers and 75% of total commercial and industrial customers in
Connecticut. Many of these customers would currently be required to make a large CIAC contribution and
therefore would likely not convert, absent the reduction, or elimination of the CIAC. Converting these
Segment B customers without charging them any CIAC would shift cost to existing customers and raise rates
and, therefore, is not recommended. DEEP does recommend a change to the hurdle rate, and while this
would modestly reduce the CIAC and help some customers, it would not be enough to drive all Segment B
customers to convert.
The economics would, however, be favorable for a group of Segment B customers that are closer to the main.
With the proposed change to the hurdle rate and the availability of on-bill financing, some off-main customers
would be likely to convert to gas. DEEP has not quantified or attempted to conduct an economic analysis of a
smaller number of Segment B customers. It should also be noted that as time goes on, existing furnaces will
age and new mains will be added which in turn will make the economics for other on and off –main customers
more cost-beneficial. Other accrued benefits include economic development resulting from increased jobs,
energy security from the utilization an energy source less than one-hundred miles from the state‘s borders,
and environmental improvements from the installation and use of cleaner burning equipment represent
additional benefits not currently captured or quantified in this Strategy.
As a result, the Strategy assumes that the number of customers who will actually convert will be lower than
the total potential analyzed for both segments A and B. Estimating the actual number expected to convert is
important for planning purposes. The gas distribution companies should do their best to estimate the number
of probable conversions over the next seven years, based on the approaches recommended in this Chapter
and then plan their construction needs and capacity additions accordingly. The Department recommends the

2013 Connecticut Comprehensive Energy Strategy
Chapter 4: Natural Gas Sector Strategy
145
gas companies take into consideration the less favorable economics of Segment B in their planning process
and prioritize projects within Segment B with a focus on ―anchor-loads,‖ concentrated residential areas and
customers that provide wider economic benefits to the state in order to maximize the gas volumes and dollar
savings on a given main extension. By increasing gas volumes, revenues will increase and improve the cost-
effectiveness of converting Segment B customers.
Ensuring a Reliable Natural Gas Supply
Reliability of natural gas supply is also an important consideration in an expansion planning process, as
increased demand will naturally increase the need for regional natural gas supply capacity. The interstate
pipeline system that supplies Connecticut‘s natural gas is already constrained, and there is limited liquid
natural gas (LNG) capacity in Connecticut. At current use rates, there will not be enough interstate pipeline,
storage, or peaking capacity to serve a large-scale addition of new customers. Natural gas pipeline supply
projects typically take 3-4 years to develop, meaning that capacity must be purchased based on projections of
customer demand several years in the future. In implementing a large-scale natural gas expansion program,
Connecticut‘s gas companies will need to acquire new capacity in larger increments than in the past.
Underestimating and purchasing too little capacity could lead to reliability issues (i.e., a shortfall in supply
during peak winter season) or might require the gas companies to turn away customers who want to convert
to natural gas.
The Connecticut gas companies indicated in their joint written comments that current interstate pipeline
infrastructure is insufficient to bring new shale gas supplies to the New England market, resulting in prices
that are higher relative to the rest of the Northeast. With a substantial commitment to expanding the use of
natural gas and a regulatory and policy framework that allows gas LDCs to enter into longer term capacity
contracts, the major interstate pipeline companies would be expected to expand their facilities to serve New
England.
In their written comments, two of the three pipeline operators in Connecticut, Spectra Energy and Iroquois
Gas Transmission System, mentioned that they see a considerable opportunity to expand their services to
meet a potential increased demand identified in the Strategy. Spectra Energy, which services approximately
half of Connecticut‘s existing load via its Algonquin pipeline system, recently concluded an Open Season for
its Algonquin Incremental Market (AIM) project to gauge market demand for increasing volumes of natural
gas to the region and received robust interest in the project. Spectra‘s next steps entail evaluating the specifics
of each bid received during the Open Season and then entering into definitive commercial agreements, with
all interested parties, reflective of the desired terms of each. These next steps are expected to be completed
during the first quarter of 2013, with the service commencement date for this project targeted for November 1,
2016 (Spectra Comments, p. 2). Iroquois has also reviewed its pipeline system and has determined that it can
economically expand the capacity of its infrastructure by adding compression, thereby providing an additional

2013 Connecticut Comprehensive Energy Strategy
Chapter 4: Natural Gas Sector Strategy
146
200,000 Dth/day at a rate that is competitive with recently renewed capacity contracts (Iroquois Comments,
p. 2-3).
Historically, new capacity additions have been priced on an incremental basis and have come to the market
more expensively than existing capacity. However, DEEP believes the gas marketplace is evolving rapidly and
that the cost of new pipelines and gas capacity can be reduced through proper planning and by achieving
greater economies of scale by spreading the fixed cost of an expansion project over a larger number of units.
DEEP will continue to work closely with the gas companies, potential pipeline developers, and other parties
with an interest in creating/obtaining greater access for New England demand centers to Marcellus shale in
order to obtain the best possible price for new capacity.
DEEP will work with gas pipeline developers and the LDCs to ensure that the transmission capacity increases
to meet anticipated growth in demand. DEEP will continue to work with stakeholders, including ISO New
England, to further coordinate the electric and gas systems to address the myriad of issues concerning
increased natural gas dependency and its potential effect on electric reliability.
Natural Gas Sector Strategy: Recommendations
Based on this assessment of current and future supplies, customer demand, and costs of fuel oil and natural
gas, this Strategy calls for development of a natural gas expansion planning process, to better ensure that
conversions over a 7 year time period occur in a way that is cost-effective and has a positive NPV for
customers who switch to natural gas. The goal of this plan would be to provide customers in Segments A and
B (who can cost-effectively switch to natural gas) the choice of converting quickly and efficiently, thereby
cutting their heating bills by half or more. As explained above, these conversions also produce broader
benefits for all Connecticut citizens, by reducing air pollution, cutting costs for residents, and boosting the
State‘s business competitiveness.
Capturing these benefits will require significant investment by Connecticut gas companies, new and existing
gas customers, and private capital. To facilitate this conversion program, the Strategy proposes a set of
regulatory changes and financing options that, if implemented as part of a planned expansion process, can
reduce the costs of fuel switching, ensure a more reliable gas supply, and help more Connecticut homeowners
and businesses take advantage of fuel savings. For customers beyond the economically feasible reach of
expansion, the Strategy supports a robust, fully-integrated energy efficiency program as well as exploring a
range of heating options; including efficient oil and propane furnaces and new technologies such as solar
thermal water heating, ground source heat pumps, ductless heat pumps, and cold weather heat pumps.
The components of the Strategy‘s long-range energy planning objectives can be summarized follows:
Establish a planning process for natural gas expansion;
Raise customer awareness of the opportunities for fuel-switching;

2013 Connecticut Comprehensive Energy Strategy
Chapter 4: Natural Gas Sector Strategy
147
Make efficiency investments and fuel switching affordable through financing and incentives for choosing the most energy efficient equipment;
Enact regulatory changes to broaden the reach of financing option the utilities may provide;
Reduce the costs of off-main expansion, by streamlining permitting and siting processes as well as coordinating main extensions with the build out of other underground infrastructure (e.g., water lines, fiber optic cable, and electric lines);
Offer training and assistance to employees and businesses adversely impacted by gas expansion; and
Create a range of fuel-saving options for customers unlikely to convert to gas and for those choosing not to do so;
Re-crafting Connecticut‘s outdated regulatory accounting to reflect a 25 year ―hurdle rate‖ and other changes required to account for other non-energy (or ―societal‖ benefits).
Each of these recommendations is described in more detail below. It is important to emphasize that these
recommendations are part of a proposed process for coordinated natural gas expansion. Some of these
recommendations would require legislative approval; other recommendations would require action by PURA.
1. Establish a Planning Process for Natural Gas Expansion
As described above, there are many benefits to establishing a coordinated planning process for natural gas
expansion. These benefits include increasing the rate of customer conversions, lowering the costs of
conversion, ensuring the reliability and timely addition of gas supply, and limiting the risk to existing gas
ratepayers. The Strategy calls for the gas companies to jointly file a plan with DEEP and PURA, based on the
expanded cost/benefit analysis described in this chapter, to expand the rate of natural gas conversions in a
manner that targets cost-effective potential on- and off-main customers over the next seven years. Such plan
shall propose specific cost recovery mechanisms for each customer segment. DEEP and PURA will conduct
coordinated proceedings to consider the Plan. DEEP will review the Plan for its consistency with the goals of
the Strategy. PURA will assess its potential ratepayer impact. After DEEP modification and approval of the
Plan for its consistency with the Strategy and PURA‘s guidance, any elements of it that require PURA
implementation may be submitted individually and/or sequentially for timely regulatory evaluation by PURA.
The Plan should include, but not be limited to, the following components:
A customer conversion plan and schedule. The plan should identify the number of new on- and
off-main customers in each sector (residential, commercial, industrial, etc.) that the gas companies
will target for conversion during each year of the planning period, including a map showing
geographical locations and densities. The plan should show how the gas companies have optimized
alignment of expansion territory with DOT and municipal road construction projects, and utility
activities (including replacement or extension of water and sewer pipes, fiber optic cables, or
underground electric wires) as well as other planned infrastructure build-out. The plan should also
identify:
o Prioritized potential ―anchor load‖ customers that the companies intend to target (including the distance of each from the nearest main and its potential load), and the economic development potential from converting those anchor loads; and

2013 Connecticut Comprehensive Energy Strategy
Chapter 4: Natural Gas Sector Strategy
148
o Potential high-uptake residential areas based on housing vintage, new development, past customer interest, etc.
Feasibility analysis. The Plan should demonstrate the feasibility of reaching the conversion goals
for on- and off-main customers, including:
o Expected capital budget for both on- and off-main conversion projects;
o Any proposed incentives, including an analysis of all available options and discussion of why selected options were chosen and how such will be funded;
o Identification of expected costs of distribution service installations and customer equipment for each sector and segment of customers (on and off-main, etc.) based on selected options/incentives;
o Plans to secure the infrastructure and overhead (e.g., personnel, construction materials, partnership with HVAC contractors) and capacity needed to meet the conversion goals, and associated costs;
o A cost/benefit analysis that project impacts on rates and revenues over a twenty year time frame; and
o A discussion of changing market conditions (e.g., gas-to-oil spread), if applicable, and the corresponding effect, if any, on the goals of this Chapter.
Outreach and marketing analysis. The Plan should include a well-structured marketing analysis
for each sector. Which segments have the largest awareness gaps? How can greater awareness be
achieved and what are the most significant barriers to conversion for each customer segment and
sector? How can conversions be achieved most effectively? How will the gas companies market the
conversion opportunity to each segment and sector, and what will be the associated costs?
Cost reduction strategy. The Plan should identify the steps the gas companies will take or have
taken to reduce the costs of conversion, such as neighborhood outreach efforts, organizing dedicated
crews for main extension, streamlining permitting and siting compliance, etc.
Capacity Procurement. To ensure reliability, the Plan should identify the capacity needed and
timing of additions needed to serve the new customers included in the conversion goal; demonstrate
how the gas companies will acquire the capacity to serve the new customer load; and identify
projected costs of these new capacity additions. Since the timing of the issuance of this plan coincides
with an announced ―open season‖ pipeline project as well as other potential projects, the gas
companies will need to work quickly to identify the capacity needs to support the Strategy‘s
recommendations.
Financing mechanisms. The Plan should include a detailed strategy for leveraging third-party
investment to finance equipment conversion and main extensions for the new customers added,
including the sources of capital, expected cost of capital, administrative costs, etc., and indicate any
regulatory changes needed to implement the proposed financing mechanism(s).
Regulatory proposals. The Plan may include suggested regulatory changes (e.g., hurdle rate
model, new customer rate riders, PGA credit sharing), describing how any proposed change would
contribute to reaching the conversion goals, and what the rate impact would be of each proposed
change.
2. Raise Customer Awareness through Marketing

2013 Connecticut Comprehensive Energy Strategy
Chapter 4: Natural Gas Sector Strategy
149
It is important to make customers who can cost-effectively switch to natural gas aware of both the opportunity
to reduce heating costs by converting to natural gas and financing options for doing so for those that don‘t
have sufficient capital to cover the upfront costs. Greater customer awareness will help customers plan for
conversion, rather than waiting until a furnace failure when conversion is unlikely to be feasible. It will also
help to aggregate demand among ―off-main‖ customers and maximize opportunities to spread or eliminate
CIAC charges. Outreach should be targeted towards those customers for whom there will be the greatest
economic benefit and who are therefore most likely to convert. There are several ways to raise customer
awareness. The gas companies should enhance their websites to provide more information to help customers
switch to gas. The companies currently spend shareholder funds to promote gas use and should continue to do
so in the future. A robust marketing effort by the three gas distribution companies could cost $1.5 to $2.0
million annually.
3. Financing Mechanisms to Make Fuel Switching Affordable and Reduce Upfront Costs
Converting from fuel oil to natural gas requires a large upfront investment. (The cost averages $7,500 for
Segment A and is higher for Segment B and for commercial and industrial potential customers). As discussed
above, switching to gas can generate annual fuel savings that cover the cost of conversion in less than two
years for industrial customers in Segment A, and little more than four years for residential customers in
Segment A and industrial customers in Segment B. But many potential customers either can‘t afford to pay
these costs upfront, or are reluctant to spend money to replace equipment that still works.
New customers in Segment A must pay for the costs of replacing their heating equipment. Financing
equipment replacement at commercial interest rates in the range of 6-8% would allow these customers to
cover these costs with no money paid up-front, while still bringing them immediate and attractive reductions
in their fuel bills. As an example, financing the conversion at 8% would mean that the average new residential
customer in Segment A will see an approximate annual net savings of $682 compared to their current fuel oil
bill (Table 7).
TABLE 7: Equipment replacement financing options
Sector Customer
Cost to Convert
Annual Fuel
Savings
Annual Benefit to Customer
(Fuel Savings minus Payment)
0% 2% 4% 6% 8% 10%
Residential** $7,500 $1,800 $1,050 $965 $875 $781 $682 $579
Commercial $20,300 $3,100 $1,070 $840 $597 $342 $75 ($204)
Industrial $40,600 $24,000 $19,940 $19,480 $18,994 $18,484 $17,949 $17,393
Source: RMI analysis; Annual fuel savings based on projected fuel price for first 10 years after conversion. **Residential sector includes both ―low use‖ and ―on main‖ customers in Segment A.
While many customers currently finance their conversion through home equity loans or high efficiency energy
programs, there are additional ways to expand and streamline access to financing. This Strategy recommends

2013 Connecticut Comprehensive Energy Strategy
Chapter 4: Natural Gas Sector Strategy
150
setting up new financing options, increasing availability of new sources of capital and making supportive
regulatory changes. Specifically, this Strategy proposes two financing mechanisms, discussed in detail in
Chapter 1 (Efficiency), which could be utilized for natural gas conversions. Those mechanisms include a ―low
or no‖ interest rate loan program for high efficiency heating and domestic hot water systems modeled on the
Mass Save program. The second mechanism is an ―on-bill‖ financing program that would enable customers to
finance conversions on their utility bill over time.36 Regulatory approval may be required for the gas
companies to implement a program that allows the gas companies (or another financial entity) to collect loan
payments on the customer‘s regular monthly bill over sufficient time to enable the customer to see savings on
their bill from day one. Because the payment is tied to gas service, this mechanism lowers the risk of non-
payment and increases the ease of collection for those providing capital. The financing program can be
capitalized using utility capital, financial institutions or self-funding and can be administered through
collaboration among the gas companies and entities such as the Connecticut Housing Investment Fund or the
Clean Energy Finance and Investment Authority (CEFIA). It is important to minimize the total cost of
financing. By doing so lower rates can be offered to participants improving the economics of projects while
reducing or eliminating any subsidies by other ratepayers. In establishing an on-bill conversion financing
program, the Strategy recommends a competitive bidding process be undertaken by the gas companies to
secure the lowest cost for administration of the financing.
For Segment B customers, the additional cost for main extension makes conversion more expensive, on
average. As with Segment A, developing financing options to overcome initial investment costs and ensuring
sufficient awareness of potential benefits will be critical to achieving high conversion rates. However, to
achieve the full societal benefits of converting significant numbers of Segment B customers will require
additional policy and regulatory mechanisms. For example, an average residential customer financing a
conversion at 8% would actually see an increase of $257 in annual costs related to heating (Table 8).
TABLE 8: Segment B financing options
Sector Customer
Cost to Convert
Annual Fuel
Savings
Annual Benefit to Customer (Fuel Savings minus Payment)
0% 2% 4% 6% 8% 10%
Residential $13,800 $1,800 $420 $264 $99 ($75) ($257) ($446)
Commercial $32,400 $3,100 ($140) ($507) ($895) ($1,302) ($1,729) ($2,173)
Industrial $108,500 $24,000 $13,150 $11,921 $10,623 $9,258 $7,830 $6,342
Source: RMI analysis. Annual fuel savings based on projected fuel price for first 10 years after conversion.
Reducing the interest rate would improve the economics for potential customers in Segment B – as would
potential other financing options and regulatory refinements. This Strategy calls upon the gas distribution
36
The structure of these financing mechanisms is discussed in more detail in the Chapter 1 (Efficiency).

2013 Connecticut Comprehensive Energy Strategy
Chapter 4: Natural Gas Sector Strategy
151
companies to develop options for such mechanisms to ensure the success of the natural gas infrastructure
development being proposed in their Plan. Because there is a wide difference in conversion economics and in
the assumptions created by various policy underpinnings, it is essential to evaluate expansion options in detail
by sub-segment and geographic location as well as under various policy refinements.
Direct Incentives
The single greatest impediment to customer conversions (where there is already local distribution
infrastructure) is the ability to pay the upfront cost of replacing the existing heating systems, especially when
the system is still in working order. While a typical residential customer could save up to $1,800/year, the
initial estimated cost of $7,500 is a barrier for many homeowners. Similar barriers exist for businesses. In
order to lower initial customer conversions costs, the final Strategy proposes the following ways to target
direct incentives to reduce the cost of off main customers and encourage highly efficient furnaces. These direct
incentives could be funded from a variety of sources, including tax credits, or reprogramming existing
incentives.
4. Incentives to Assist Systematic Aggregation of New Off-Main Customers
To provide a coherent basis for planning, the State should provide a tax credit to incentivize potential ―off-
main‖ customers to sign a contract with their gas company to convert to natural gas. The logic of this incentive
stems from the value of having a clear picture up front of those who wish to convert to gas up which will
enable more comprehensive and structured gas main extension planning. Thus, this Strategy calls for an
incentive program that will be offered for a limited time — until December 31, 2013 – with the credit going to
the gas companies and being rebated to their new customers when they are hooked up to the gas main. This
incentive would be offered only to Segment B customers—those who are ―off-main‖ but near gas mains. The
time limitation would be essential to structure new customer sign-ups, give gas companies greater certainty
about potential customer additions, and ensure the most economical construction program possible.
5. Provide Incentives to Encourage Installation of High-Efficiency Furnaces
To maximize the benefits of the fuel switching opportunity, it is important to ensure that potential gas
customers install the most efficient furnaces available on the market and purchase a furnace matched to their
heating needs – after optimizing efficiency. The State‘s gas energy efficiency programs currently offer
subsidized home energy services, a $500 rebate, and low interest loans for homeowners who install new high
efficiency gas heating systems. These incentives are paid for by gas ratepayers through their gas bills. The
options are less extensive and more expensive for oil customers because there is no funding for oil
conservation programs. To promote efficiency at the time of conversion the Strategy recommends that the gas
companies and gas efficiency fund programs encourage all homes considering conversion to natural gas to
participate in the Home Energy Solutions program and that any customers who convert to gas pay the same
costs and receive the same efficiency program benefits as other gas customers. If the level of conversions
envisioned in the Strategy over the next seven years is realized, demand for these incentives would exceed

2013 Connecticut Comprehensive Energy Strategy
Chapter 4: Natural Gas Sector Strategy
152
current funding levels and funding for the gas efficiency programs would need to be increased or reallocated
to accommodate demand.
Enact Regulatory Changes
6. Change Hurdle Rate Calculation to Reduce Upfront Customer Charge for Main Extensions
Under a regulatory mechanism called the ―hurdle rate test,‖ gas companies are authorized to invest a certain
amount of the costs of expanding the distribution system to add a new customer. This amount is largely
dependent on the expected increase in revenues over a specified time period (payback period) from supplying
natural gas to the new customer. Currently, the hurdle rate test allowed for Yankee Gas is a 15-year revenue
payback period. In April 2011, Connecticut Natural Gas and Southern Connecticut Gas were authorized by the
former DPUC to extend the payback period they use in their hurdle rate test, from 15- to 20-years, in a two-
year pilot program. By contrast, the payback period for NSTAR, a gas company in Massachusetts, is 33 years
for residential customers.
The Strategy recommends that PURA amend the hurdle rate test for all three gas companies to allow for
payback period of 25-years. Amending the hurdle rate in this manner would enable the gas companies to
cover more of the cost of main extensions for off-main customers, significantly improving the economics of
conversion, and as a result, conversion rates. Specifically, the amendment would reduce the required CIAC by
up to $1,700 for an average residential customer, $4,158 for a commercial customer, and $43,000 for a large
industrial customer. This modification would also eliminate small CIACs of $400 to $500 that can sometimes
affect on-main customers. DEEP estimates that expanding the hurdle rate payback period to 25 years could
decrease the total CIAC charges needed to convert all Segment B customers by approximately 40%.
7. Alternative Rate Rider to Pay Customer Main Extension Costs
The Strategy further recommends that PURA allow new customers to pay their CIAC charges over time
through payments on their gas bill, instead of requiring an upfront payment. To accomplish this, the Strategy
recommends that PURA consider setting rates generically for customers that require a CIAC payment based
on similar characteristics such as usage and distance from the main. This change would reduce the
administrative and transaction costs involved in calculating the CIAC charge for each new customer, provided
that it was set to collect enough revenue to cover the overall costs of main extension. Implementing this
recommendation would require PURA to revise and/or rescind previous orders, but would reduce the upfront
cost of conversion and thereby enable a greater number of Segment B customers to take advantage of the fuel-
switching opportunity.
8. Allow Greater Flexibility when Calculating Customers’ Main Extension Costs
The current process for expanding gas mains is cumbersome – and ignores significant societal benefits from a
broader gas infrastructure. An individual engineering and cost analysis is performed to determine if a CIAC is

2013 Connecticut Comprehensive Energy Strategy
Chapter 4: Natural Gas Sector Strategy
153
required from each customer. If (when) additional customers show interest, or interested customers drop out
due to high conversion costs, the hurdle rate test must be rerun in order to recalculate the CIAC.
DEEP recommends that the gas companies be allowed more flexibility in the calculation of new revenues in
the hurdle rate test when projects are analyzed. Currently revenues are only included in the hurdle rate
calculation if there is a firm commitment by a customer to switch to gas. Each project must also be cost
beneficial on its own. If the project is completed, new customers that later sign up for service along that main
do not incur any CIAC related to the original main extension, as the CIAC has already been paid. Flexibility
should be given to allow the gas companies to group projects together (portfolio view), in accordance with the
plan submitted to and approved by DEEP, for the purpose of comparing forecasted new revenues to the
revenue requirement necessary to support the incremental infrastructure. The portfolio view would increase
gas companies‘ flexibility to serve more customers while not exposing existing customers to significant cross-
subsidization. DEEP further recommends that the existing CIAC framework be replaced with a new cost
allocation methodology that ensure that societal benefits are taken into account in the equitable allocation of
costs among existing customers, new on-main customers, and new off-main customers.
The Strategy also recommends that some limited additional revenues be allowed to be forecasted in the hurdle
rate analysis if it is probable that additional customers will be added in the future. This would allow projects
to proceed based on a timeline of expected conversions over a reasonable time frame of three- to five-years as
outlined in the plan. The expectation is that an additional percentage of customers would choose to sign up
for gas service over that time frame, thereby satisfying the need for future revenues to cover the upfront cost
of the project. These changes would entail some risk but would allow for the more systematic and flexible
planning and construction of main extensions, which should help to reduce costs to all ratepayers. The impact
of these approaches would need to be monitored over time so that adjustments could be made to ensure that
the interests of new and existing customers are protected.
9. Establish a Mechanism for Timely Recovery of Capital Expenditures Made by the Gas Companies
This Strategy calls for the investment in new gas mains to be made by the state‘s gas distribution companies—
not taxpayers and state bonding. Due to the capital-intensive nature of a large-scale natural gas expansion
program, this Strategy proposes that PURA consider establishing a mechanism for the gas companies to
recover prudent investments in a timely manner, outside of a rate proceeding. This mechanism could also be
used to incorporate into rates, a consideration of the additional revenues the gas companies expect to generate
as more customers are added to the system.
10. Sharing of Purchased Gas Adjustment Credits
Existing gas customers have enjoyed meaningful rate reductions over the last several years due to the
declining price of natural gas. The gas companies regularly transact on-system interruptible and ―off system
sales‖ which generate marginal revenues. Currently 99% of the benefit from these sales flows back to all

2013 Connecticut Comprehensive Energy Strategy
Chapter 4: Natural Gas Sector Strategy
154
customers as a bill credit through the Purchased Gas Adjustment Credit. This credit is commonly referred to
as the Non-Firm Margin credit.
Using a portion of the Non-Firm Margin credit to offset rate base or other costs incurred for expansion would
reduce the possible impact on existing customers. Although existing customers would not see an immediate
bill credit, their rates would be reduced and they would receive similar or even greater benefits over time,
because fewer costs would be accumulated into rate base. This would reduce capital cost interest expenses.
Another approach would be to use a portion of the Non-Firm Margin credit to reduce the CIAC costs for off-
main customers converting to gas. In developing the gas expansion plan for submission to DEEP, the
companies should propose methods that PURA should consider for reassigning some or all of the Purchased
Gas Adjustment Credit to support system expansion.
11. Reduce the Costs of Equipment Conversion and Main Extension
While many of the costs involved in natural gas conversion are difficult to control — particularly the costs of
the fuel and the costs of moving the gas from the wellhead to Connecticut — there are other costs that can be
reduced through coordinated expansion and bulk purchasing. These include the paving cost component of gas
main extensions, the labor costs involved in deploying crews to install meters, service lines and gas mains, the
―soft costs‖ involved in complying with state and local permitting and siting requirements applicable to gas
main extensions and the unit costs of the natural gas heating equipment itself.
The significant cost savings that could be achieved where gas main extensions are coordinated with other
infrastructure projects has already been noted. If a municipality is already planning to install or repair water
lines, sewage pipes, or other infrastructure, installing a gas main at the same time can save 20% of the costs of
main extension by sharing the costs of excavation and re-paving the street. Pursuant to Section 10 of
Connecticut Public Act 12-148, An Act Enhancing Emergency Preparedness and Response, enacted on June
15, 2012, the Connecticut Department of Transportation and any municipality are required to notify PURA of
pending construction projects on state highways and other public highways, so that PURA can notify public
service companies of the opportunity to ―install . . . any water, sewer, or gas line.‖ Accordingly, PURA in
developing the procedures to implement this notification requirement should ensure that the gas companies
have the information needed to focus their natural gas expansion plans in areas where the Department of
Transportation (DOT) and municipalities are planning road construction.
The permitting and inspection process could become a bottleneck as the levels of conversions increase rapidly
over the next several years. Several options should be explored to mitigate that possibility including: creating
a generic approval process for Siting Council approvals, and standardizing the application and approval
process for gas mains and interconnections. These options would improve the process for the gas companies,
their contractors, and customers seeking to switch to gas and reduce the associated ―soft costs.‖ Towns and
municipalities can play an important role in reducing permitting and siting costs. There are important lessons
that could be applied here from the experience of solar PV installation, and specifically the SunShot and

2013 Connecticut Comprehensive Energy Strategy
Chapter 4: Natural Gas Sector Strategy
155
Solarize programs currently being administered by CEFIA, in partnership with several municipalities. The
SunShot program focuses on driving down the so-called ―soft costs‖ involved in solar PV installations, by
working with towns and municipalities to develop common applications, or making it possible for companies
to apply for permits online. Similar innovations could be applied to local permitting processes relevant to
natural gas. DEEP will work to streamline permit processes, to the extent that permits for gas main extensions
fall under DEEP‘s jurisdiction. Some other aspects of the Solarize program could also be applied to drive down
conversion costs. See Chapter 3 (Electricity). Municipalities interested in helping their residents and
businesses take advantage of the natural gas opportunity could use a similar approach, by raising customer
awareness and aggregating customer demand to obtain lower costs for natural gas equipment (or gas main
extensions) through bulk procurement.
12. Offer Training and Assistance Programs to Reduce Economic Dislocation
The build-out of Connecticut‘s natural gas infrastructure to service Segment A and cost-effective Segment B
customers will create a large number of jobs, employing up to an estimated 5,400 people for a ten-year period
depending on the extent of main expansions.37 At the same time, this conversion strategy could result in a
substantial decrease in fuel oil consumption in the state. A key recommendation of this Strategy, therefore, is
to develop training and assistance for businesses adversely affected by this transition, to help them re-develop
their businesses to take advantage of the economic opportunity created by natural gas conversions and
expansion of efficiency programs. Opportunities created by natural gas conversions could include the chance
to market, install, and service natural gas furnaces and other equipment, or to become a vendor in the Home
Energy Solutions program. The Board of Regents and community colleges should ensure that adequate
training programs are available to interested individuals. Many fuel oil companies are small, family-owned
operations, and are trusted by their customers. For these reasons, fuel oil companies can be especially
effective in becoming home energy service providers — advising customers on their options with regard to
energy efficiency investments, including the natural gas conversion opportunities. A marketing strategy could
also include a mechanism whereby gas companies pay a finder‘s fee to third parties who sign up new natural
gas customers. To succeed in meeting the conversion targets outlined in this Strategy, the gas companies will
need to significantly ramp up their shareholder investment in outreach and marketing efforts.
13. Create Options for Customers who are Unlikely to Convert
Approximately 50% of residential customers and approximately 25% of commercial and industrial customers
will not have access to natural gas in the foreseeable future. This Strategy proposes several energy cost
reduction options for homes and businesses that are not located near a natural gas main and outlines the costs
and benefits of each option. Improving the energy efficiency of a home offers the biggest opportunity for
37
Connecticut Department of Economic and Community Development. The Economic Impact of Expanding Natural Gas Use in Connecticut. By Stanley McMillen and Nandika Prakash. Hartford, CT, 2011. Available at http://www.ct.gov/deep/lib/deep/energy/decd_nat_gas.pdf.

2013 Connecticut Comprehensive Energy Strategy
Chapter 4: Natural Gas Sector Strategy
156
helping these customers reduce their heating bills (Figure 12). Providing incentives to upgrade to the most
energy efficient oil or propane furnaces should be a part of an effort to assist ―non-gas‖ customers. However,
to date these customers have not had consistent access to efficiency programs because of a lack of ongoing
funding. High fuel oil prices make efficiency gains through increasing oil efficiency or other heating
alternatives, even more cost-effective for large investments, as discussed further in Chapter 1 (Efficiency).
This Strategy therefore recommends that the General Assembly consider ways to secure and ramp up funding
from fuel oil and propane customers over the next three years to the level necessary to provide efficiency
programs to those customers, that are comparable to the programs offered to electric and natural gas
customers.
In addition to energy efficiency, there are several other options that can further reduce the reliance on heating
oil. These include solar hot water systems, solar thermal and geothermal and high efficiency air source heat
pumps. Some of these options can involve large investment costs (Figure 12), but may be cost-effective over
the life of the project, thereby providing opportunities for customers to reduce their energy bills over the long
term. This Strategy recommends that CEFIA and the Energy Efficiency Board further explore offering pilot
programs to promote ground-source heat pumps (which extract heat from the ground instead of the air as in
conventional heat pumps), solar hot water systems, and other technologies that can reduce heating costs for
customers who are unlikely to have an opportunity to convert to natural gas. The pilot projects would help
inform the work on evaluating current alternative technology economics, their potential for cost reductions,
and help identify other barriers and possible levers to overcome them.
Figure 12: Levelized cost of space heating options38
Ranges depend on both high and low projected fuel price scenarios as well as uncertainty around capital cost.
Source: RMI analysis based on Navigant, ―Technology Forecast Updates.‖
38
The levelized cost of energy — in this case for space heating — can be used to compare the cost of providing energy or energy efficiency for various technologies with a wide distribution of opex and capex. It is the required annual payment (accounting for both capex and opex) for providing or saving (in the case of energy efficiency) a given unit of energy. For more see the following: http://www.nrel.gov/analysis/tech_lcoe_documentation.html.
$0
$20
$40
$60
Energy eff
NG Ground source
HP
Fuel oil Air source
HP
$/M
BT
U
$0
$20
$40
$60
Energy Eff
NG Ground source
HP
Air source
HP
Fuel oil
$/M
BT
U
Residential Commercial
High
Low
2013 Connecticut Comprehensive Energy Strategy
Chapter 4: Natural Gas Sector Strategy
157
14. Mandate Low-Sulfur Heating Oil
Another way of increasing the efficiency and cleanliness of fuel oil is through the use of low sulfur heating oil.
This strategy recommends that the General Assembly adopt a 15 ppb standard for the sulfur content of home
heating oil as several neighboring states have done, thereby saving customers money and capturing significant
environmental benefits Stakeholders provided testimony that a near-term transition from high-sulfur to
low-sulfur heating oil would come at no cost premium to Connecticut residents (as New York has moved to a
low-sulfur standard, establishing a new baseline for the fuel oil marketplace. The benefits that Connecticut
stands to receive by adopting these new sulfur-content standards are substantial.39 Lower sulfur heating oil
creates economic savings in two ways, (1) it is cleaner and reduces service/maintenance costs to heating
equipment; and (2) it is more efficient allowing reduced amounts of fuel to provide the same energy. The use
of low sulfur heating oil also allows the use of higher efficiency oil fired boilers that could reduce overall fuel
and maintenance costs even more. Amending section 16a-21a of the Connecticut General Statutes to mandate
clean heating oil will ensure that Connecticut captures these benefits.
Conclusion
Natural gas presents Connecticut with a significant opportunity to move towards Governor Malloy‘s vision of
a cheaper, cleaner, more reliable energy future for the state. Residents and businesses across the State are
already analyzing whether to invest in the natural gas opportunity in the face of a highly dynamic energy
marketplace. The goal of this strategy is to give Connecticut citizens increased and better options for reducing
their energy bills, in some instances by reducing the costs of conversion to natural gas by implementing
financing and regulatory mechanisms that reduce upfront costs. In other cases it will be by developing options
for customers who cannot cost-effectively switch fuels so that these customers can capture energy savings
through energy efficiency measures and other space heating technologies. While switching several hundred
thousand customers to natural gas will significantly reduce their energy costs and cut air pollution, it is
important to recognize that pursuing this opportunity has risks that demand continued monitoring and
flexibility in approach so as to ensure that investments remain prudent in a dynamic and evolving
marketplace. Caution is necessary when pursuing any large-scale opportunity. The comprehensive planning
process called for in this Strategy is one way of better ensuring that gas expansion is cost-effective, not overly
burdensome on existing ratepayers, and that new gas customer demand is matched with an adequate gas
supply so as not to threaten electric reliability.
39
Comprehensive Energy Strategy - Natural Gas Technical Meeting Transcript. pp. 417, 484. Testimony of John Batey, president of Energy Research, on behalf of the Independent Connecticut Petroleum Association and Edward Levene, Vice President of Levco Tech, Inc. November 16, 2012.

2013 Connecticut Comprehensive Energy Strategy
Chapter 4: Natural Gas Sector Strategy
158
Bibliography
Barcella, Mary Lashley, Samantha Gross, and Surya Rajan. Mismeasuring Methane: Estimates for Greenhouse
Gas Emissions from Upstream Natural Gas Development. Cambridge, MA: IHS Cambridge Energy
Research Associates, 2011.
Connecticut Department of Economic and Community Development. The Economic Impact of Expanding
Natural Gas Use in Connecticut. By Stanley McMillen and Nandika Prakash. Hartford, CT: 2011.
Connecticut Department of Energy and Environmental Protection. 2012 Integrated Resource Plan for
Connecticut. New Britain, CT, 2012. http://www.ct.gov/deep/lib/deep/energy/irp/2012_irp.pdf.
———. ―Emissions Inventory.‖ Last modified December 1, 2011.
http://www.ct.gov/deep/cwp/view.asp?a=2684&Q=432056&depNav_GID=1619.
GDS Associates, Inc. Massachusetts Natural Gas Energy Efficiency Potential Study for Residential Sector.
Marietta, GA: GDS Associates, Inc., 2009. http://www.ma-eeac.org/docs/PAcites/GDS_Report.pdf.
International Energy Agency. Golden Rules for a Golden Age of Gas. Edited by Robert Priddle. Paris:
International Energy Agency, 2012.
Kirchgessner, David A., Robert A. Lott, R. Michael Cowgill, Matthew R. Harrison, and Theresa M. Shires.
―Estimate of Methane Emissions from the U.S. Natural Gas Industry.‖ Chemosphere 35, no. 6 (1997):
1365–1390.
National Renewable Energy Laboratory. ―Energy Analysis – Energy Technology Cost and Performance Data.‖
Last modified July 27, 2012. http://www.nrel.gov/analysis/tech_lcoe_documentation.html.
———. Renewable Electricity Futures Study. Edited by M. M. Hand, S. Baldwin, E. DeMeo, J. M. Reilly, T.
Mai, D. Arent, M. Meshek, and D. Sandor. 4 vols. NREL/TP-6A20-52409. Golden, CO: National
Renewable Energy Laboratory, 2012.
Navigant Consulting and SAIC. ―EIA – Technology Forecast Updates – Residential and Commercial Building
Technologies – Reference Case.‖ Presented to the U.S. Energy Information Administration,
September 22, 2011. http://wpui.wisc.edu/news/EIA%20Posts/EIA%20Reference%20Case%2009-
2007%20Second%20Edition%20Final.pdf.
U.S. Energy Information Administration. Annual Energy Outlook 2011: With Projections to 2035. DOE/EIA-
0383(2011). Washington DC: U.S. Energy Information Administration, 2011.
———. Annual Energy Outlook 2012 Early Release. DOE/EIA-0383er (2012). Washington DC: U.S. Energy
Information Administration, 2012.
———. Effect of Increased Natural Gas Exports on Domestic Energy Markets. Washington DC: U.S. Energy
Information Administration, 2012.

2013 Connecticut Comprehensive Energy Strategy
Chapter 4: Natural Gas Sector Strategy
159
———. ―Natural Gas Prices.‖ Last modified June 29, 2012.
http://www.eia.gov/dnav/ng/ng_pri_sum_dcu_SCT_m.htm.
———. Residential Energy Consumption Survey (RECS). Washington DC: U.S. Energy Information
Administration, 2012. http://www.eia.gov/consumption/residential/
———. ―State Energy Data System.‖ Last modified June 29, 2012. http://www.eia.gov/state/seds/
———. ―Weekly Heating Oil and Propane Prices.‖ Last modified March 31, 2012.
http://www.eia.gov/dnav/pet/pet_pri_wfr_dcus_SCT_w.htm.
U.S. Environmental Protection Agency. ―Clean Air Markets.‖ Last modified June 19, 2012.
http://www.epa.gov/airmarkets.
———. ―Emissions Factors & AP 42, Compilation of Air Pollutant Emission Factors.‖ Last modified December
28, 2011. http://www.epa.gov/ttnchie1/ap42/
———. ―MOVES (Motor Vehicle Emission Simulator).‖ Version 2010b. [Software]. Washington DC: U.S.
Environmental Protection Agency, 2012. http://www.epa.gov/otaq/models/moves/index.htm.
2013 Connecticut Comprehensive Energy Strategy
Chapter 5: Transportation Sector Strategy
160
Introduction
Connecticut‘s three and half million residents and varied economic activities are dependent upon a
transportation system that provides the foundation for the state‘s economy, quality of life, and the character of
our communities. The state‘s transportation system also consumes large amounts of energy and impacts the
health of our population and the environment. Transportation-related energy use is dependent on the types of
fuels used, the types of vehicles or other modes of transport used, and the number of vehicle miles traveled
(VMT). A sustainable transportation energy future will require significant refinements to this system in order
to provide increased mobility options to citizens and businesses and ensure that the state achieves its
greenhouse gas emissions goals. These goals, established by the General Assembly in 2008, require a
reduction in greenhouse gas emissions of 10% below 1990 levels by 2020 and 80% below 2001 levels by 2050.
The transportation sector alone accounts for 32% of the state‘s total energy consumption but in the process
produces roughly 40% of the state‘s greenhouse gas emissions.1,2 In addition, oil comprises 95% of the energy
used by the transportation sector which in turn drives the high percentage of emissions generated in the
transportation sector and leaves the public exposed to ―pain at the pump,‖ as well as price spikes caused by
global markets out of the state‘s influence.3 Transportation modes and patterns also directly affect economic
activity in the state as goods and people are moved.
This Comprehensive Energy Strategy is the first formal integration of transportation issues into the State‘s
overall energy planning, with a strong focus on offering Connecticut transportation choices. The State,
however, has limited authority in some of the areas that have the most impact on transportation energy use.
For example, vehicle efficiency standards, funding for much infrastructure and transit, and the composition of
fuels have historically been determined at the federal level.4 Municipalities have jurisdiction over land use and
development patterns at the local level. However, this Strategy proposes a stronger role for State
policymakers, as outlined in this Chapter.
Over the last decade in particular, Connecticut has demonstrated leadership in several of these areas,
adopting ambitious policy innovations to improve transportation systems and options in the state. The State
has made significant investments in public transit, with new rail and bus lines and expanded service, as part
1 U.S. Energy Information Administration State Energy Data System, ―Energy Consumption Overview: Estimates by
Energy Source and End-Use Sector,‖ (2010). Available at: http://www.eia.gov/state/seds/sep_sum/html/pdf/sum_btu_1.pdf.
2 U.S. Energy Information Administration State Energy Data System, ―2009 State Emissions by Sector.‖ Available at:
http://www.eia.gov/environment/emissions/state/excel/Table3_2009.xlsx. 3 U.S. Energy Information Administration State Energy Data System, ―Transportation Sector Energy Consumption
Estimates, Selected Years, 1960-2010, Connecticut.‖ Available at: http://www.eia.gov/state/seds/sep_use/total/pdf/use_CT.pdf.
4 Corporate Average Fuel Economy – U.S. Environmental Protection Agency: 40 CFR § 85, 86, and 600; Corporate Average Fuel Economy – National Highway Traffic Safety Administration: 49 CFR § 523, 531, 533, 536, and 537; Renewable Fuel Standard – U.S. Environmental Protection Agency: 40 CFR § 80.

2013 Connecticut Comprehensive Energy Strategy
Chapter 5: Transportation Sector Strategy
161
of federal and state stimulus packages. In addition, the State has promoted transit-oriented development as
part of a concerted effort to integrate economic development and transportation strategies in order to provide
increased opportunities for people to integrate a wider range of transportation modes, such as trains, buses,
cars, bicycles and walking, into their daily lives.
Recognizing that many Connecticut residents and businesses will continue to rely on automobiles for years to
come, the State has implemented policies to make that reliance more economically and environmentally
sustainable. For example, Connecticut is one of just thirteen states to adopt California‘s automobile pollution
standards for passenger cars. These tighter standards are projected to reduce greenhouse gas emissions from
passenger cars within California by 12% in 2025 and 27% in 2035 relative to business as usual levels, with
similar reductions in Connecticut.5 Widespread adoption of the California ―clean car‖ rules has encouraged
automakers to agree to more stringent federal pollution, greenhouse gas, and fuel economy standards. Two
Federal programs, the Corporate Average Fuel Economy (CAFÉ) program, and the Renewable Fuel Standard
(RFS) program , play an additional role in enabling the clean fuel/clean vehicle platform in Connecticut. The
State has also been replacing a growing number of its truck and bus fleets with vehicles using alternative fuels,
such as electricity, natural gas, biofuels, and hydrogen. State fleets are helping to demonstrate the viability of
these alternatives, which builds the market for ―clean vehicles‖ and cleaner fuels. Nevertheless, of the current
2.2 million passenger vehicles registered in Connecticut, fewer than 40,000 are currently powered by
alternative fuels (see Appendix D (Transportation)).6 Indeed, there exists a significant set of obstacles to a
clean fuels/clean vehicles future. This Strategy avoids trying to guess what the state fuel of choice will be in
2020 or 2030. Instead, this Strategy proposes building out a basic platform for many options, with a
sufficiently diverse refueling infrastructure so that choices are not made for Connecticut drivers, but rather, by
them.
This Strategy offers a foundation for tackling the tough mobility and related economic challenges involved in
creating a cleaner and more efficient transportation system in a cost-effective manner that is not overly reliant
on scarce government resources and is focused on providing residents with enhanced transportation choices.
While expanding mobility options in an era of limited government resources will be challenging, doing so can
also provide tremendous new opportunities that could strengthen Connecticut‘s communities and economy.
5
California Air Resources Board, (2011), ―Draft Environmental Analysis Prepared for the Advanced Clean Cars Program, Appendix B.‖ Available at http://www.arb.ca.gov/regact/2012/leviiighg2012/levappb.pdf.
6 Connecticut Department of Motor Vehicles response to DEEP data request (September 28, 2012).

2013 Connecticut Comprehensive Energy Strategy
Chapter 5: Transportation Sector Strategy
162
FIGURE 1: Transportation Strategy Gives Residents Expanded Mobility and Transportation Choices
Connecticut Department of Energy and Environmental ProtectionConnecticut Department of Energy and Environmental Protection
Current State and Future Vision
• Vehicle-dominant culture• Limited mobility options• Inefficient vehicle stock• Long commutes
CURRENT
• Dominant fuel choice—oil• Oil supply risks
IMPACTS• Air pollution• High gasoline costs• Congestion
CORE STRATEGIC
ELEMENTSTHE FUTURE
• Improved quality of life• Shorter commutes, less
congestion, lower vehicle use• Communities with mobility
options - transit, walk, bike• More efficient vehicles
• Multiple fuel options—biofuel, natural gas, electric
• Fuel diversity
IMPACTS• Economic development• Lower costs• Cleaner air
Clean fuels and clean vehicles
Enhanced mobility
High efficiency vehicles
Transportation system efficiencies
Sustainable funding
Source: Connecticut Department of Energy and Environmental Protection (2012).
Figure 1 provides an overview of the current and future vision for Connecticut‘s transportation sector. The
core strategies focus on: 1) promoting the use of vehicles that are more efficient, less polluting and less reliant
on oil fuels; 2) providing a platform to facilitate adoption of clean fuels and clean vehicles in step with public
demand; 3) increasing mobility through transit-oriented development and additional travel options; 4)
following best practices to improve efficiencies in the transportation system; and 5) developing sustainable
funding sources to maintain existing transportation infrastructure and to develop additional mobility options
within the state. Implementation of these core strategies can help enhance quality of life, build more livable
communities, promote economic development, reduce costs, and lower emissions to improve public health
and the environment.
Overview Of The Current State
Roughly 95% of Connecticut transportation energy comes from vehicular transport (with passenger cars
representing 80% of the total and trucks and buses accounting for 15%). The remaining 5% of transportation

2013 Connecticut Comprehensive Energy Strategy
Chapter 5: Transportation Sector Strategy
163
energy is used by locomotives, aircraft, and ships (see Figure 2).7 These sources provide little opportunity for
policy impact because the efficiency and use of airplanes, trains, and ships are primarily governed by federal
(not State) laws and regulations. Therefore, the focus of this Chapter will be vehicular transportation sources
and solutions.
Connecticut is a small, densely developed state with large numbers of people who commute relatively short
distances in single occupancy vehicles. Thus, despite the high reliance on automobiles and traditional
transportation fuels (specifically, gasoline and diesel), the state is well positioned to be a test bed for the clean
fuels and clean vehicles of the future. According to the Connecticut Department of Transportation
(ConnDOT), vehicles are driven 31 billion miles annually in Connecticut. Of these 31 billion miles, nearly all
are from people traveling in passenger cars and light trucks.8 This is roughly 3,500 miles less than the
national average.9
Transportation Energy Use, Costs, and Environmental Impact
Connecticut‘s current transportation system is over-reliant on oil-based fuels which are increasingly
expensive, and which contribute significantly to the state‘s greenhouse gas emissions profile. With 95% of
Connecticut‘s transportation energy supplied by gasoline and diesel, transportation emerges as the least fuel-
diverse of any of the state‘s energy use sectors. As shown in Figure 2, electric vehicles represent an
insignificant amount of total vehicle miles traveled, and as such, a very small portion of transportation energy
consumed. But given the very clean sources of power in Connecticut (about 92% of generation is either
nuclear or natural gas), the expanded use of electric vehicles in the state would yield substantial
environmental benefits.
7
U.S. Energy Information Administration, ―State Energy Data System 2011 Estimates,‖ (2011) Available at: http://www.eia.gov/states/seds/seds-data-fuel.cfm.
8 U.S. Department of Transportation Federal Highway Administration, ―Highway Statistics 2010.‖ Available at: http://www.fwha.dot.gov/policyinformation/statistics/2010/.
9 Connecticut Department of Transportation response to DEEP data request (September 14, 2012).

2013 Connecticut Comprehensive Energy Strategy
Chapter 5: Transportation Sector Strategy
164
FIGURE 2: Connecticut transportation energy consumption by mode and fuel type in 2009
Source: NESCAUM analysis using the U.S. Energy Information Administration’s State Energy Database System 2010 Estimates.
While gasoline and diesel prices have fluctuated in recent years, they have generally been quite high and they
are expected to increase further in coming decades. State residents and businesses dependent upon oil are
more vulnerable to price spikes, and to supply disruptions due to the volatile nature of the international oil
market. Widely available less polluting alternatives, including electricity and natural gas, are domestically
produced and now cost considerably less than gasoline on a per mile basis. As shown in Figure 3, these prices
are projected to stay at or near current levels for the foreseeable future, increasing their relative viability as
transportation fuels over time.
FIGURE 3: Projected transportation fuel prices assuming high oil prices
Source: U.S. Energy Information Administration, ―Annual Energy Outlook 2011‖.

2013 Connecticut Comprehensive Energy Strategy
Chapter 5: Transportation Sector Strategy
165
As shown in Figure 4, transportation emissions account for approximately 40% of the state‘s total greenhouse
gas emissions. This is almost double the emissions from the electric power sector. This Strategy seeks to
reduce greenhouse gas (GHG) emissions in the transportation sector to help satisfy the emissions reductions
requirements outlined in the 2008 Global Warming Solutions Act.
FIGURE 4: GHG emissions and energy expenditures by sector. 2009 data forecasted for 2012, adjusted for inflation
Source: U.S. EIA, ―State Energy Data System.‖
Transportation Infrastructure and Funding Gap
Energy use by vehicles is intimately linked with Connecticut‘s road infrastructure. Maintenance and design
issues and the sheer volume of vehicles in the state cause significant congestion and translate into more time
on the road. Thus, road capacity and condition affect energy consumption.
Because of its relatively high population density and dependence on car travel, Connecticut has an extensive
road network. For example, the state has nearly three times more miles of interstate highways per square mile
than Virginia. Overall, Connecticut has 346 miles of interstate highways and an additional 1,086 miles of main
arterial routes.10 There is also a high volume of use on these roadways. Connecticut interstates are among the
most heavily used in the nation: the state‘s three major highways (I-95, I-91, I-84) serve 100,000 to 170,000
vehicles per day, and heavy truck volumes comprise 10-15% of that traffic.11 The population‘s high mobility
needs are also reflected in the fact that the New Haven Metro-North Line is the nation‘s busiest commuter rail
10
Connecticut Department of Transportation response to DEEP data request (September 14, 2012). 11
Connecticut Department of Transportation, ―Transportation Fast Facts,‖ (2012). Available at: http://www.ct.gov/dot/lib/dot/documents/dcommunications/misc/2012_ConnDOTFast_Facts_online.pdf

2013 Connecticut Comprehensive Energy Strategy
Chapter 5: Transportation Sector Strategy
166
line, and ridership is only projected to increase in the future (at a rate of 6% a year). ConnDOT estimates that
ridership will reach an incredible 85 million rail rides in 2012. 12 ,13
Connecticut‘s transportation infrastructure is extensive, old, and costly to maintain. State-owned
transportation assets consist of approximately 3,700 miles of highways, 3,900 highway bridges, 230 miles of
rail track, 200 railroad bridges, 270 rail cars, 650 buses, 6 airports, a state pier, 2 ferries, and buildings such
as transit stations, highway garages, highway service plazas, and rest stops. In addition, 17,265 miles of local
roads and 1,241 local bridges are owned by Connecticut municipalities.14 The state‘s interstate highway system
was predominantly built in the 1950s and 1960s, and many stretches are now due for replacement or
upgrades.15
Both maintenance and new road construction are expensive. In 2011, ConnDOT spent $861 million on
repairing the current infrastructure and $0 on new roads. ConnDOT estimates, however, that far more money
is required for maintenance and repair because budget allocations have not kept up with the needs. For
instance, 8.3% of the state‘s more than 3,980 bridges need structural upgrades. The total price tag for repairs
and maintenance throughout the state is estimated to be more than $16 billion.16
ConnDOT‘s estimate of highway repair costs coincides with a realization that its ability to address these needs
will be severely impacted by a steep decline in the federal and state revenue streams used to fund
transportation-related improvements. Revenue sources for replacement of aging infrastructure are far lower
than the levels that were in place when these projects were first constructed. The bonding capacity of the State
Transportation Fund will diminish over the next few years as the 10-year special funding programs authorized
by the Legislature in 2005 and 2006 – $1.3 billion in 2005 and $1.0 billion in 2006 – wind down.
Moreover, support from the National Highway Transportation Administration and revenues from the State
gasoline tax, which have funded the construction and maintenance of roads, have declined sharply in recent
years and is expected to continue to decrease. Tougher fuel economy standards and high oil and gasoline
prices have raised customer demand for fuel-efficient vehicles so that automakers are now offering a wide
range of attractive, safe and efficient models. As these new vehicles displace older vehicles, the efficiency of
the whole fleet rises and overall fuel use drops, which means lower gasoline tax revenue is collected.
12
Connecticut Department of Transportation response to DEEP data request (September 18, 2012). 13
Connecticut Department of Transportation, ―Connecticut and Metro-North Make Service Investments in New Weekend and Off-Peak Trains,‖ (July 19, 2012). Available at: http://www.ct.gov/dot/cwp/view.asp?A=1373&Q=508220.
14 Connecticut Department of Transportation, ―Transportation Fast Facts,‖ (2012). Available at: http://www.ct.gov/dot/lib/dot/documents/dcommunications/misc/2012_ConnDOTFast_Facts_online.pdf.
15 Connecticut Department of Transportation response to DEEP data request (September 6, 2012).
16 Connecticut Department of Transportation response to DEEP data request (September 18, 2012).

2013 Connecticut Comprehensive Energy Strategy
Chapter 5: Transportation Sector Strategy
167
For the United States as a whole, the Congressional Budget Office forecasts that gasoline tax revenues will
drop about 21% by 2020 due to improved fuel economy (see Figure 5).17 Within the State transportation
budget, the 2011 revenue shortfall of$2 billion is projected to grow to more than $4.5 billion by 2017.18 Energy
policy progress creates a transportation policy challenge. Notably, the more Connecticut vehicle owners
increase their fuel efficiency and reduce their vehicle miles traveled, the larger the transportation revenue gap
will become. Alternative options for funding necessary transportation infrastructure projects and enhanced
public transit present a critical challenge.
FIGURE 5: The looming U.S. revenue gap as projected by the Congressional Budget Office for the period of 2012 to 2020 (in billions of dollars)
Source: Congressional Budget Office.
Connecticut has relieved some of the strain on the highway network by investing in public transit systems.
Ridership on Connecticut‘s three major train lines is rising (Figure 6). In addition, the State and federal
government have invested in some major new transit projects, which are discussed later in this Chapter.
17
Congressional Budget Office, ―How Would Proposed Fuel Economy Standards Affect the Highway Trust Fund?,‖ (May 2012). Available at: http://www.cbo.gov/publication/43198.
18 Connecticut Department of Transportation response to DEEP data request (September 18, 2012).

2013 Connecticut Comprehensive Energy Strategy
Chapter 5: Transportation Sector Strategy
168
FIGURE 6: Annual ridership on Connecticut’s three main transit lines: Amtrak, Shore Line East, and the New Haven line
Source: ConnDOT Bureau of Public Transportation and Amtrak.
Alternative Vehicle Infrastructure and Use
Connecticut is developing an increasing network of alternative fuel infrastructure, enabling a broader range of
vehicle choice. Figure 7 depicts currently available alternative fuel stations (public and private) within the
state. Alternative fuel stations include: compressed natural gas (CNG), electric, E-85 (made up of 85% ethanol
alcohol and 15% gasoline), liquefied natural gas (LNG), propane, and hydrogen stations. Although access to
these fueling stations is still limited, their growth in recent years reflects an increasing demand within the
state for non-petroleum based transportation fuels options.
Tho
usa
nd
rid
ers
on
Am
trak
an
d S
ho
re L
ine
East
Tho
usa
nd
rid
ers
on
New
Hav
en L
ine

2013 Connecticut Comprehensive Energy Strategy
Chapter 5: Transportation Sector Strategy
169
FIGURE 7: Location map of existing alternative fueling stations within the State, as of January 2013. As alternative fueling stations continually come on line in the state, updates can be found on the interactive map feature of the U.S. Department of Energy, found at http://www.afdc.energy.gov/locator/stations/.
Source: CT Clean Cities Coalition (January 2013).
Fast-moving shifts in vehicular technology are also forcing change. Interestingly, Connecticut has a rich
history of innovation in this arena, from the earliest mass production of electric vehicles at the Pope
Manufacturing Company in Hartford to the development of fuel cell technologies by many Connecticut-based
companies (some of which are used to power vehicles). Within the industry, automakers have developed
hybrid-electric versions of many popular vehicles that yield combined highway and city ratings of 40 miles per
gallon or greater. Since 2007, Connecticut Transit has operated up to five fuel cell buses on different routes
within the Hartford area and surrounding towns, significantly increasing fuel economy and reducing
emissions.
Electric cars offer one option for the vehicle choice for the 21st century. The major automakers and dozens of
smaller companies have either launched or announced plans to market in the near-term both fully electric

2013 Connecticut Comprehensive Energy Strategy
Chapter 5: Transportation Sector Strategy
170
cars and plug-in hybrid vehicles. These vehicles usually can travel the distance of a typical daily commute on
electricity alone – recharging at the office or at home overnight.19
Natural gas is becoming an increasingly attractive vehicle fuel. At about one-third the price of diesel, some
trucks, taxis, and delivery fleets are already replacing vehicles with either liquefied natural gas (LNG) or
compressed natural gas (CNG). A growing number of long-distance trucking companies have begun to move
to CNG, so Connecticut will establish CNG filling stations at a number of truck stops along the interstate
highways.
Many towns and cities across the state are deciding to use low-carbon fuel alternatives to meet their local
government transportation needs. For example, the 2011 Annual Report from Clean Cities (of the U.S.
Department of Energy) reports that Groton Public Utilities acquired 23 light-duty hybrid vehicles increasing
the average fuel economy of the fleet from just 20 miles per gallon to 32 miles per gallon. Furthermore, this
switch saved the utility 3,536 gallon of gas equivalents (gge) and reduced the fleet‘s greenhouse gas emissions
by 43.6 tons.20 The report outlines work in many municipalities and documents the positive impacts of
alternative fuel use.
Mobility and Consumer Transportation Costs
Cleaner vehicles and fuels are not the only factors that contribute to transportation energy use, costs, and
environmental impacts. The total number of vehicle miles traveled (VMT) in Connecticut each day is an
important piece of the equation. Land use patterns and mobility options largely influence how much people
drive and how much of their budget is consumed by transportation costs. Connecticut‘s VMT has grown
steadily in recent decades and is projected to continue to grow, as shown in Figure 8. These projections take
into account population and employment estimates, increases in bus and rail ridership, new transit systems,
and highway improvements.21 Research indicates that the energy and pollution gains from cleaner vehicles
and fuels can easily be offset by increases in VMT.22 Thus, this Strategy focuses on enhancing mobility options
in addition to transitioning to cleaner vehicles and cleaner fuels.
19
Life cycle analysis (including production, use, and disposal) of direct and indirect energy use of electric vehicles, and all others in this Chapter, is an important comparative tool, though it was outside the scope of the CES. The primary goal of this CES is to examine the effects of various transportation strategies on Connecticut energy use and emissions, so only the direct emissions and energy use occurring within the state were considered.
20 U.S. Department of Energy Clean Cities: Norwich Clean Cities, ―2011 Annual Report‖, (2011).
21 Connecticut Department of Transportation response to DEEP data request (November, 2012).
22 Ewing, R. et al., ―Growing Cooler the Evidence on Urban Development and Climate Change,‖ Urban Land Institute (2008). Available at: http://www.uli.org/wp-content/uploads/ULI-Documents/GrowingCooler.pdf.

2013 Connecticut Comprehensive Energy Strategy
Chapter 5: Transportation Sector Strategy
171
FIGURE 8: Average daily vehicle miles traveled in Connecticut
Source: Forecast - ConnDOT Statewide Travel Demand Model Series 29D and Highway Performance Monitoring System, September 2012.
Vehicle congested roads present another challenge to Connecticut‘s transportation system, quality of life, and
household budgets. The Urban Mobility Report (the Report) estimates that congestion causes over 32 million
hours of delay annually in Connecticut‘s three largest urban areas (Bridgeport-Stamford, Hartford, and New
Haven).23 The average commuter on I-95, the Merritt Parkway and other roads in the Stamford-Bridgeport
region spends the equivalent of more than four days a year delayed in traffic. The Report estimates that the
total cost of congestion in the state‘s urban corridors is a conservative $670 million per year in lost time and
energy costs (Figure 9).24,25 This total does not include the lost opportunities of businesses choosing not to
expand or relocate in the region due the transportation gridlock. When local wage rates are used, congestion
23
Lomax, T., Schrank, D., & Eisele, B., ―2011 Annual Urban Mobility Report,‖ University Transportation Center for Mobility, Texas A&M Transportation Institute (September, 2011). Available at: http://mobility.tamu.edu/ums/.
24 Connecticut Office of Policy & Management, ―A Strategic Framework for Investing in CT’s Transportation: Economic Growth – Infrastructure Preservation – Sustainable Communities,‖ (January, 2011). Available at: http://www.ct.gov/opm/lib/opm/tsb/meeting_materials/strategic_needs_statement_v9_2010-08-17.pdf.
25 The Report estimates that the national costs of congestion are $101 billion per year (based on 2010 data).
0
20
40
60
80
100
120
1970 1975 1980 1985 1990 1995 2000 2005 2010 2015 2020 2025 2030 2035 2040
DA
ILY
VE
HIC
LE
MIL
ES
TR
AV
EL
ED
(m
illio
ns
)
YEAR
STATEWIDE VMT TRENDS AVERAGE DAILY
SERIES 29D VMT
2012 - 88.8 2013 - 89.5 2014 - 90.3 2015 - 91.3

2013 Connecticut Comprehensive Energy Strategy
Chapter 5: Transportation Sector Strategy
172
costs in southwestern Connecticut far exceed the costs suggested by the Report.26 Congestion and travel delays
also cause stress, reduce worker productivity, and lower the quality of life.
FIGURE 9: Annual costs of congestion for the three largest urban areas within Connecticut: Bridgeport-Stamford, Hartford, and New Haven. The combined costs of the three regions are represented in the red „Total‟ line.
Source: Connecticut Office of Policy & Management, ―A Strategic Framework for Investing in CT’s Transportation: Economic Growth – Infrastructure Preservation – Sustainable Communities.‖
As shown in Figure 10 below, transportation is the second largest expense for most American households.
Nationwide, the average household spends 19% of their income on transportation. However, in communities
where people can walk or take public transit, households have significantly lower transportation costs. For
example, households in transit-friendly communities spend an average of only 9% of household income on
transportation. Households that must rely predominantly on their own cars devote up to 26% of their income
to transportation.27 In Connecticut, where housing and other costs are higher than the national average,
transit-oriented development can shrink the transportation piece of household expenses, making these
neighborhoods more affordable and freeing up dollars for other necessary expenses (such as healthcare, food,
clothing, et cetera).
26
Lomax et al., (September, 2011). 27
Reconnecting America’s Center for Transit-Oriented Development, ―Realizing the potential: Expanding housing opportunities near transit,‖ (April, 2007). Available at: http://www.reconnectingamerica.org/resource-center/books-and-reports/2007/realizing-the-potential-expanding-housing-opportunities-near-transit-2/.

2013 Connecticut Comprehensive Energy Strategy
Chapter 5: Transportation Sector Strategy
173
FIGURE 10: Transit rich neighborhoods are more affordable
Source: Center for TOD Housing & Transportation Affordability Index, 2004 Bureau of Labor Statistics.
Many Connecticut towns have begun to address the issues of ever-increasing VMT, congestion, and
transportation costs by redirecting growth to create more livable communities. The City of Stamford has
successfully achieved enhanced mobility in a transit-oriented community through smart land use planning.
Stamford has concentrated high-density residential and commercial development within one mile of its train
station and connected that development to other parts of the city with frequent bus service. This has resulted
in an 18% increase in transit ridership and 14% increase in carpooling.28
Transit-oriented communities offer a host of other benefits in addition to saving energy and reducing
automobile use. They tend to attract young professionals who can help revitalize downtowns and city
economies. They lower government costs of delivering services (such as snow removal or road repair) because
of their compact footprints. They can also direct reinvestment to historic buildings in dense areas that can
support transit stations, offering an additional community benefit. A transit-oriented community that is more
walkable may also increase real estate values compared to typical suburbs. Additionally, transit-oriented
developments can strengthen local economies through additional infill projects that tend to follow the arrival
of transit.
Over the last decade, State policy makers have increased support for transit-oriented development programs.
For instance, the Department of Community and Economic Development (DECD) has developed streamlined
procedures for approving and reviewing large-scale transit-oriented projects throughout the state. The Office
of Policy and Management‘s (OPM) Draft Plan of Conservation and Development promotes concentrated
development around transportation nodes. In October 2011, ConnDOT and the OPM awarded grants from a
transit-oriented development pilot program totaling $5 million to 11 cities, towns, and regional planning
28
City of Stamford, CT, ―Sustainability Amendment to the 2002 Master Plan,‖ (2010). Available at: http://www.cityofstamford.org/filestorage/25/52/138/164/202/SUSTAINABILITY_AMENDMENT_FINAL_12_23_2010.pdf

2013 Connecticut Comprehensive Energy Strategy
Chapter 5: Transportation Sector Strategy
174
organizations around the state. The grant–funded programs focused on site planning and market analyses to
support development of residential, commercial, and employment centers within one-half mile of existing or
planned rail and bus stations. Furthermore, the General Assembly, nonprofit environmental, historic
preservation, housing, land trust, and land use organizations have also taken steps to promote smart growth
as a guiding principle of further development in the state.
Regional Collaboration
The movement of people, goods, and services extends well beyond state borders. Regional collaboration on
transportation planning and infrastructure is critical. While the regional transportation networks serving
Connecticut do not have one overarching regulating entity, the State actively participates in regional
initiatives to address transportation issues on a larger scale.
For example, Governor Malloy serves as the Lead Governor for Transportation for the Coalition of
Northeastern Governors. Under this initiative, northeastern states work together to plan for safe and
dependable commuter rail for the region; ensure federal funding for an integrated transportation system; and
coordinate transportation assets, such as passenger and freight rail systems.
Connecticut also works with the Transportation & Climate Initiative (TCI), which formed in 2011. This
regional initiative includes 10 other states and the District of Columbia. There are four core work areas of TCI:
―1) developing clean vehicles and alternative fuels; 2) creating sustainable communities; 3) adopting
innovative communication and technologies; and 4) advancing more efficient freight movement.‖29
Opportunities and Challenges: Expanding Transportation Choice
Connecticut‘s transportation sector has been shaped by changing needs and technologies since the time of dirt
turnpikes and horse-drawn carriages. Today the state faces new drivers of change that bring both challenges
and opportunities including:
• The costs of transportation: from time wasted in traffic jams, to high levels of pollutants, to the cost of risk associated with volatile fuel markets;
• An emerging statewide effort to promote transit-oriented development and build vibrant communities that provide multiple housing options and attract young professionals;
• The first major public transit projects in decades; the growing transportation revenue gap;
• And the development of new vehicle technologies that offer a chance to significantly reduce energy use, energy costs, and pollution.
The State will leverage these transitions to help create a cleaner, cheaper transportation system that enhances
the quality of life for all residents.
29
Transportation & Climate Initiative, ―Transportation & Climate Initiative of the Northeast and Mid-Atlantic States.‖ Available at: http://www.georgetownclimate.org/sites/default/files/TCI%20brochure.pdf.

2013 Connecticut Comprehensive Energy Strategy
Chapter 5: Transportation Sector Strategy
175
This Strategy promotes the development of a diverse infrastructure for cleaner fuels and the accelerated
adoption of high-efficiency and alternative fuel vehicles to provide increased consumer choice and economic,
public health and environmental benefits. Even greater gains will be realized by designing communities
around smart growth and transit-oriented development principles and increasing opportunities for people to
choose the most energy efficient mode of travel. Well-designed communities are compact and include a mix
of uses by providing housing, jobs, and services within easy walking distance or easy access to other travel
modes. These communities provide both enhanced mobility (such as walking, biking, public transit, and ride-
sharing) and enhanced accessibility. Other actions proposed in this Strategy include improving efficiencies in
the system and developing sustainable funding sources for a highly efficient transportation system.
Enhancing Mobility
The State‘s current major transit projects provide an unparalleled opportunity to build vibrant, walkable,
communities and maximize ridership and economic development within these transit corridors. Smart land
use planning and development decisions will leverage the millions of state and federal dollars invested in
transit projects, which include: the New Haven-Springfield rail line, the CTfastrak busway from New Britain
to Hartford, and the Metro-North rail enhancements. Together, these new transit projects will make it
possible for thousands more Connecticut residents to travel by rail or bus, cutting vehicle miles traveled by up
to 240 million miles and saving nearly 9 million gallons of fuel annually. This Strategy prioritizes strong
interagency coordination and support to municipalities to build walkable, bikeable, transit-oriented
communities within these transit corridors.
The federal and State governments are investing approximately $647 million on a high-speed rail link from
New Haven through Hartford to Springfield, Massachusetts (the so-called ―Knowledge Corridor‖), which will
more than triple the daily number of trains (Figure 11).30 This line is predicted to bring 12,000 construction
and construction-related jobs, reduce vehicle miles traveled by 92.56 million miles in 2030, and save more
than 3.5 million gallons of fuel annually. 31 Another $567 million is being invested to create the CTfastrak
dedicated busway transit system from Hartford to New Britain (Figure 12).32 The busway will provide a safe,
clean, and efficient transit alternative to driving and cut travel times on the I-84 corridor by reducing existing
congestion. Additionally, Metro-North is enhancing service between New York City and New Haven (Figure
13) by adding parking garages, making station improvements, investigating communication and signal needs,
advancing efforts to rehabilitate moveable bridges, and evaluating the need for additional tracking. These
improvements are estimated to add 5.5 million new person trips, divert 5 million car trips, reduce the vehicle
30
Connecticut Department of Transportation, ―New Haven – Hartford – Springfield Rail Program Objectives and Scope,‖ (2012). Available at: http://www.nhhsrail.com/objectives/cost.aspx.
31 Connecticut Department of Transportation response to DEEP data request (September 14, 2012).
32 Connecticut Department of Transportation, ―CTfastrak,‖ (2012). Available at: http://www.ctfastrak.com/index.php/en.

2013 Connecticut Comprehensive Energy Strategy
Chapter 5: Transportation Sector Strategy
176
miles traveled by 138.4 million miles, and save 4.8 million gallons of fuel annually.33 Together these transit
systems will significantly enhance mobility options for Connecticut residents and provide the foundation for
thriving livable communities.
FIGURE 11: Map of the New Haven – Hartford – Springfield rail corridor
Source: New Haven – Hartford - Springfield Rail Program, ―Project Map,‖ (2012).
33
Connecticut Department of Transportation response to DEEP data request (September 18, 2012).

2013 Connecticut Comprehensive Energy Strategy
Chapter 5: Transportation Sector Strategy
177
FIGURE 12: Proposed route for the CTfastrak busway
Source: CTfastrak, ―Local Service Map,‖ (2012).
FIGURE 13: Map showing Metro-North New Haven Line, including the Waterbury, Danbury and New Canaan branches; Amtrak Intercity (Northeast Corridor and the New Haven-Hartford-Springfield Line); and Shore Line East
Source: ConnDOT.

2013 Connecticut Comprehensive Energy Strategy
Chapter 5: Transportation Sector Strategy
178
To build on the foundation provided by these transit projects, this Strategy calls for strong coordination
among agencies to align State planning and infrastructure spending to support strategic growth, maximize
transit use, and reduce vehicle travel demand within these corridors. For example, State funding for sewers
and other infrastructure could be focused to allow for high-density development in these transit corridors.
The Governor recently created an interagency panel to address the state‘s transit-oriented development needs
and facilitate this coordination. The panel –led by DECD and include ConnDOT, OPM, and DEEP –will help
integrate economic, transportation, and environmental policies and programs that impact development
around the state‘s transit systems and provide a broader regional planning perspective.
Interagency collaboration will support municipal efforts to revise land use plans and zoning to build
walkable, bikeable, transit-oriented communities and implement the following strategies that are consistent
with State statutes and the State‘s Plan of Conservation and Development. The State will develop ―priority
funding areas‖ for growth and development (as required by PA 05-205 and in the Plan of Conservation and
Development) and require State agencies to consider whether certain grant application proposals comply with
smart growth principles (in accordance with Public Act 10-138). The State should continue the efforts of
ConnDOT and others to implement Public Act 09-154, Connecticut Complete Streets Law, and other policies
and practices to ensure safe bicycle and pedestrian access on the state‘s roadways.
In addition, the State will pursue the Growth Management Principles established in the Plan of Conservation
and Development. These Growth Management Principles include:
• Redevelopment and revitalization of regional centers and areas with existing or currently planned physical infrastructure;
• Concentrated development around transportation nodes and along major transportation corridors to support the viability of transportation options;
• Promotion of integrated planning across all levels of government to address issues on a statewide, regional, and local basis.
While increasing efforts to support transit-oriented development, the State should also aggressively pursue
opportunities to augment transit service and expand transit systems. In addition, other initiatives can result
in substantial near-term energy savings and other benefits. The State should continue to promote alternate
commute options through its existing statewide transportation demand management measures such as
ConnDOT‘s RideShare and Telecommute Connecticut. These and other successful programs should be
expanded and marketed more aggressively.
The State will also consider other programs to reduce VMT, such as promoting an auto insurance structure
that links premiums to the number of miles driven. A 2008 Massachusetts Institute of Technology study for
Massachusetts projected that pegging insurance costs to miles driven can reduce vehicle miles traveled by 3%

2013 Connecticut Comprehensive Energy Strategy
Chapter 5: Transportation Sector Strategy
179
to 7%.34 Pilot pay-as-you-drive projects have cut driving by 8% and 10% in Minnesota and Texas, respectively.
Some insurers are already offering such products to Connecticut drivers.
Employers can also promote VMT reduction through subsidizing employee public transit fares and
eliminating free parking. Similarly, telecommuting, alternative work schedules, and allowing employees to
work at regional work hubs closest to their homes can reduce the number of cars on the road and save energy.
Promoting the Use of Highly Efficient Vehicles and Clean Fuels – Clean Vehicles
Over the next decade, Connecticut will closely follow emerging and dynamic trends in clean fuels and clean
vehicle technology markets. During this period of rapid change and market advances, the State will continue
to monitor and take advantage of technology breakthroughs that are economically viable and environmentally
preferable. This Strategy consciously avoids trying to pick winners or to define a preferred path toward a more
sustainable transportation future. Rather this approach provides an open platform that enables new and
varied technologies– electric, natural gas, propane, biofuel, hydrogen fuel cell, and other vehicles – a chance
to prove themselves and to provide a choice to drivers.
This Strategy promotes increased adoption of higher efficiency internal combustion engine vehicles (ICE). The
largest part of this opportunity is in cars and light trucks, which make up 90% of the vehicles on the road. This
Strategy also promotes the development of an alternative fueling infrastructure sufficient to support a variety
of clean vehicles, assuage general range anxiety, and further promote replacements of private, municipal, and
State fleets with cleaner alternatives through strategic pilot programs. Funding for these infrastructure
projects will come from a variety of sources. This strategy supports development of a pilot program to convert
such appropriate fleet vehicles to natural gas vehicles and the build-out of a network of publicly available LNG
and CNG filling stations. Partial funding should come from a contribution from the Northeast Utilities and
NSTAR merger settlement agreement and the State‘s ―Green Bank,‖ Clean Energy and Finance Investment
Agency (CEFIA) programs. CEFIA is currently developing pilot programs for households to finance natural
gas refueling and electric vehicle recharging at homes. Further, recent ―Fiscal Cliff‖ legislation, the Title IV
Energy Tax Extenders, extends credit for alternative fuel vehicle refueling property until December 31, 2013.
State agencies and businesses alike should be flexible and responsive to the emerging incentives and programs
that encourage alternative fueling vehicle development. Connecticut intends to be prepared for a changing 21st
century vehicle marketplace as new technologies bring down the cost of alternative fuel vehicles and as the
penetration of these vehicles increases.
Connecticut is one of just thirteen states to adopt California‘s automobile pollution standards for passenger
cars. These tighter standards are projected to reduce greenhouse gas emissions from passenger cars within
34
Ferreira, J. Jr. & Minikel, E., ―Pay-As-You-Drive Auto Insurance in Massachusetts A Risk Assessment and Report on Consumer, Industry, and Environmental Benefit,‖ Massachusetts Institute of Technology (November, 2010). Available at: http://www.clf.org/wp-content/uploads/2010/12/CLF-PAYD-Study_November-2010.pdf.

2013 Connecticut Comprehensive Energy Strategy
Chapter 5: Transportation Sector Strategy
180
California by 12% in 2025 and 27% in 2035 relative to business as usual levels, with similar reductions in
Connecticut.35 While the California standards have boosted the efficiency of Connecticut vehicles, the process
to adopt amendments to the California standards should be streamlined. This Strategy proposes changes to
Connecticut legislation to allow for the prospective incorporation of future amendments to California‘s vehicle
standards ―by reference‖ rather than requiring a lengthy regulatory process to adopt each change to the
California standards. Acknowledging the potential policy implications of defaulting into unknown future
program changes adopted by California, the proposal should contain an ―off ramp‖ that would enable
Connecticut to opt out of any future California standards found to be a detriment to our state.
FIGURE 14: Projected transportation energy use from 2013-2050 in Connecticut
Source: NESCAUM analysis using the EPA Motor Vehicle Emission Simulator (MOVES) model and post-processing tools, based on 2008 data.
Widespread adoption of the California ―clean car‖ rules has encouraged automakers to agree to more stringent
federal pollution, greenhouse gas, and fuel economy standards. Two federal programs, the Corporate Average
Fuel Economy (CAFE) program, and the Renewable Fuel Standard (RFS) program , play an additional role in
enabling the clean fuel/clean vehicle platform in Connecticut. The federal government‘s new fuel economy
standards will raise the average for automobiles and light trucks to 54.5 mpg by 2025. As new vehicles
displace older vehicles, the efficiency of the whole fleet rises. The federal average fuel economy standards and
vehicle turnover will result in a drop in Connecticut‘s transportation energy use from 240 trillion BTUs in
2012 to about 200 trillion BTUs in 2030, an estimated 17% reduction (Figure 14). Figure 14 includes three
scenarios: 1) a baseline with no national fuel economy policy; 2) a Corporate Average Fuel Economy (CAFE)
35
California Air Resources Board, (2011), ―Draft Environmental Analysis Prepared for the Advanced Clean Cars Program, Appendix B.‖ Available at http://www.arb.ca.gov/regact/2012/leviiighg2012/levappb.pdf.

2013 Connecticut Comprehensive Energy Strategy
Chapter 5: Transportation Sector Strategy
181
standard; and 3) a CAFE standard plus a national renewable fuel standard (RFS) and a national zero emission
vehicle program (ZEV).
Choosing cars with high fuel economy ratings compared to others of the same type and class brings big
savings at the pump. When considering the projected costs of fuel, choosing a vehicle that gets 30 mpg rather
than 25 mpg saves a consumer $4,000 over the life of the vehicle (Table 1).36 This simple choice saves money
and reduces emissions that are harmful to public health and the environment.37 Table 1 illustrates the cost-
effectiveness for a variety of passenger vehicle technologies.
TABLE 1: Expected payback period under a high oil price scenario for several different types of vehicle technologies. When lifetime fuel savings exceed incremental cost, the vehicle pays itself off.
Source: NESCAUM, VISION NE Transportation Fleet Model; U.S. EIA, ―Annual Energy Outlook 2011‖; NREL, ―Business Case for Compressed Natural Gas in Municipal Fleets, 2010‖. See Appendix D (Transportation) for assumptions.
This Strategy proposes the accelerated adoption of high efficiency vehicles, which will require broad and
effective outreach on the costs and benefits of these vehicles. In coordination with the Department of Motor
36
NESCAUM response to DEEP data request (September 14, 2012). 37
This analysis assumed a high oil price scenario with a 5% discount rate.
Vehicle Technology Fuel
Economy (mpg)
Incremental Cost
(2012$)
Lifetime Fuel
Savings (2012$)
Payback Period under High Oil
Prices
Base vehicle compliant with CAFÉ
25 ~~~ ~~~ ~~~
High fuel economy ICE passenger vehicle
30 ($7,900) $4,000 Instant Payback
Plug-in hybrid electric (PHEV) without $7500 Federal Tax Credit
electricity: 60
gasoline: 40 $10,700 $10,000
Greater than the Vehicle Lifetime
Plug-in hybrid electric (PHEV) with $7500 Federal Tax Credit
electricity: 60
gasoline: 40 $3,200 $10,000 3 years
Battery electric (BEV) without $7500 Federal Tax Credit
116 $14,300 $17,100 9 years
Battery electric (BEV) with $7500 Federal Tax Credit
116 $6,800 $17,100 4 years
Hydrogen fuel cell 39 $53,900 $15,300 Greater than the Vehicle Lifetime
Light-duty natural gas 23 $8,000 $13,000 7 years

2013 Connecticut Comprehensive Energy Strategy
Chapter 5: Transportation Sector Strategy
182
Vehicles (DMV) and ConnDOT, DEEP should disseminate information on state websites and in DMV
communications to educate the public about the relative efficiency of vehicles within each vehicle class and
encourage purchase of cars and light trucks that have high fuel economy ratings. In addition, DEEP will do
outreach through the Energize Connecticut campaign. Based on Figure 17, Vision of Passenger Fleet Mix, by
2030 49% of the passenger fleet mix could be powered by alternative fuels or zero emission vehicles
(Appendix D, (Transportation)). Further, by 2050, the percentage of the State‘s fleet powered by alternative
fuels or zero emission vehicles could increase to 53% (Appendix D, (Transportation)).
Recognizing the rapid advances in technology and low emissions of electric vehicles, this Strategy
recommends a targeted build-out of an additional 50 publicly available Level 2 electric vehicle charging
stations at shopping malls, parking lots, and other sites across the State. This level of build-out at shopping
malls, parking lots, and other sites across the state is predicted to sufficiently alleviate range anxiety. In
addition, DEEP and ConnDOT will work to establish a network of ten Level 3 electric vehicle charging stations
by 2014, located primarily at service plazas on the interstate highways.
DEEP will continue to closely monitor advancements in plug-in hybrid and electric cars for opportunities to
increase vehicle penetration. The challenge, however, is that these vehicles presently cost at least $3,000 more
than comparable conventional vehicles (after including a $7,500 federal credit) (Table 1). If the federal tax
credit expires as anticipated in 2015, the incremental cost of plug-in hybrid electric vehicles increases to
greater than $10,000 (Table 1). The payback on this upfront investment appears to be longer than the 1-4 year
payback period a typical consumer expects when purchasing a new vehicle. According to a study by
McKinsey, the price of a complete automotive lithium-ion battery pack could fall from today‘s price of $500-
$600 per kWh to roughly $200 per kWh by 2020 and to about $160 per kWh by 2025. Such reductions could
create conditions for the widespread adoption of electric vehicles in some markets.38
As shown in Figure 15 below, natural gas is an economically viable option for fleets such as buses, garbage
trucks and taxis that regularly return to a central location for fueling. Two major Connecticut taxi companies
have replaced a portion of their fleets with natural gas vehicles, and additional fuel savings could come from
the replacement of garbage trucks, short-haul trucks and transit buses with natural gas vehicles. Refuse trucks
have the shortest payback period, with longer paybacks for short-haul trucks and transit buses (Figure 15). A
vehicle‘s payback period is determined by its fuel economy and the distance it travels per year; high mileage,
low fuel economy vehicle like refuse trucks are ideal candidates for natural gas vehicles. This Strategy calls for
the development of a pilot program to support the conversion of appropriate fleet vehicles to natural gas along
with the construction of a network of publicly available LNG and CNG filling stations. Partial funding for the
targeted build-out should come from a fund available as a result of the Northeast Utilities and NSTAR merger
38
Hensley, R., Newman, J., Rogers, M., ―Battery Technology Charges Ahead,‖ (July, 2012), McKinsey Quarterly. Available at: http://www.mckinseyquarterly.com/Battery_technology_charges_ahead_2997.

2013 Connecticut Comprehensive Energy Strategy
Chapter 5: Transportation Sector Strategy
183
settlement agreement. Additional financing opportunities for home electric vehicle charging infrastructure
will be provided through CEFIA programs.
There are numerous towns and cities in the state that have made the switch to natural gas powered vehicles
through the U.S. Department of Energy Clean Cities program.39 For example, the towns of Fairfield, Stratford,
and Trumbull each have purchased CNG-powered vehicles. These vehicles save the towns from purchasing
thousands of gallons of gas each year, and result in tens of tons of fewer greenhouse gas emissions.40
Connecticut will benefit from continued support provided by the Clean Cities program.
FIGURE 15: Predicted net present value (NPV) of compressed natural gas (CNG) vehicle purchases. Compressed natural gas vehicles purchased in 2014 have positive net present values, meaning that the value of fuel saved over time exceeds the initial purchase premiums. NPV includes the cost of fuel and the fueling station.
Source: NESCAUM analysis.
As natural gas vehicle fueling infrastructure is built, one issue that is important to address is methane leakage
in the natural gas transmission network. Please see Chapter 4 (Natural Gas) for more information. In
response to stakeholder comments, this Strategy recognizes that the use of propane as a transportation fuel
provides Connecticut drivers another opportunity for fuel diversity. The State supports integration of propane
into the clean fuels, clean vehicles platform, with the recognition that propane‘s carbon content is
approximately 14% lower than diesel fuel per unit energy (Figure 16). The U.S. Energy Information
39
The U.S. Department of Energy Clean Cities Program is a national coalition of cities that unites the public and private sectors to improve and reduce energy use in the transportation sector.
40 U.S. Department of Energy Clean Cities: Connecticut Southwestern Area Clean Cities, ―2011 Annual Report‖, (2011).

2013 Connecticut Comprehensive Energy Strategy
Chapter 5: Transportation Sector Strategy
184
Association projects the price of propane to remain slightly lower than diesel fuel on an energy-equivalent
basis. The State will continue to follow propane markets and vehicle use.
FIGURE 16: Carbon dioxide emissions from four different fossil fuel transportation fuels. Recognizing the carbon footprint of fuel sources is an important step in comparing clean fuel policies to meet the Global Warming Solutions Act targets.
Source: U.S. Energy Information Association.
Biofuels are another evolving clean fuel option for Connecticut drivers. Currently ethanol, a biofuel commonly
derived from corn, is part of the state‘s fuel mix,41 and there are initiatives at the federal level to increase the
use of biofuels through the Renewable Fuel Standard in the 2007 Energy Independence Security Act. The
Renewable Fuel Standard promotes development of advanced biofuels (from sources other than corn or
soybean), includes a greenhouse gas standard for all fuels produced in accordance with the program, and
provides directives to monitor and ensure biofuel production occurs in the most sustainable manner
possible.42
The biofuels industry has seen growing activity in Connecticut. Several universities are conducting valuable
research, particularly on advanced generation biofuels that use non-food material feedstocks, such as brown
grease, hemp, algae, and perennial grasses. Furthermore, several startup companies are emerging to produce
equipment and biofuels in the state. The availability of biodiesel and other biofuels to Connecticut customers
is rapidly increasing. In order to finance current and future biofuel research and production projects,
41
Coleman, B., Gaffney, J.M., & Morris, D., ―A Northeast Regional Biofuels Action Plan,‖ (March 2008). Available at: http://www.nebiofuels.org/pdfs/NERegionalReportFINAL.pdf.
42 Ibid.

2013 Connecticut Comprehensive Energy Strategy
Chapter 5: Transportation Sector Strategy
185
Connecticut should be poised to take advantage of federal tax incentives and other programs that support the
biofuels industry. Recent tax legislation, the Title IV Energy Tax Extenders, highlights some opportunities
that can positively impact the biofuels industry.43
Connecticut also supports research and development and deployment of hydrogen fuel cell vehicles. These
vehicles offer the promise of high efficiency and minimal environmental impact, while also benefiting over
600 companies that work within Connecticut‘s fuel cell industry. Taking full advantage of the advances in
vehicle technologies and energy cost savings would significantly change the fuel mix of vehicles in the state
and reduce oil consumption over time (Figure 17). The State will continue to pursue federal funding
opportunities to advance research and development of hydrogen fuel cell technology.
Substantial benefits can be realized by expanded efforts to help consumers chose more efficient vehicles. This
Strategy proposes consideration of a feebate program with incentives for the purchase of high-efficient
vehicles and disincentives for purchases of inefficient vehicles. The former Connecticut Department of
Environmental Protection (DEP) and the Connecticut Department of Revenue Services evaluated a feebate
program in 2005 and identified implementation challenges that need to be overcome to advance a feebate
program in the state, while noting that such a program would be an effective tool to promote the purchase of
more fuel efficient vehicles.
At the time of the study, Connecticut constituted around 1% of the national new car sales market. 44 As this
limited market presence would not have the required effect of influencing manufacturing choices, it
represented a key obstacle to implementing the feebate program. A second challenge was the need for
significant education and outreach programs to adequately inform consumers, shopping for new cars, of the
impacts of the feebate. The DEP examined various program designs and concluded that separate sliding tax
schedules for cars and trucks based on average fuel economy proved to be the largest challenge for the
proposed feebate program. In the 2006 report, DEP concluded that while implementing a feebate program
was technically feasible, it would be stymied by administrative complexities and significant up-front costs
associated with retooling the sales tax infrastructure as it applied to the sales and lease of new motor vehicles.
For Connecticut to implement a successful feebate program it would need to include new approaches or
solutions to these previously identified administrative challenges. In addition, this Strategy proposes a more
robust educational and outreach effort aimed at informing consumers‘ future car buying decisions.
43
The recent related tax extensions are: the extension and modification of cellulosic biofuel producer credit; extensions of incentives for biodiesel and renewable diesel; cellulosic biofuels bonus depreciation, and alternative fuel excise tax credit.
44 Connecticut Department of Environmental Protection, ―Special Act No. 05-6: Connecticut Clean Car Incentive Program,‖ (2005). Available at: http://www.ct.gov/deep/lib/deep/air/climatechange/ctcleancarincentive.pdf.

2013 Connecticut Comprehensive Energy Strategy
Chapter 5: Transportation Sector Strategy
186
FIGURE 17: Changes in the types of passenger vehicles would significantly reduce the amount of oil consumed by the transportation sector over time Each band represents a percentage of the overall Connecticut fleet in a long-term vision scenario.
Source: NESCAUM, Vision NE Transportation Fleet Model.
Figure 17, above, shows the potential composition of the light-duty passenger vehicle fleet over time,
expressed as a percentage of the total. As older vehicles are retired from service, new alternative fuel and high
efficiency vehicles will be introduced to the fleet. Over time, the composition of the vehicle mix could
potentially shift away from one dominated by conventional internal combustion engine (ICE) vehicles,
towards a more diverse set of vehicles. In the scenario illustrated above, Connecticut‘s participation in the
California Zero Emission Vehicle (ZEV) program drives sales of Plug-in Hybrid and Battery Electric vehicles,
while other state incentives could spur adoption of High Fuel Economy ICE vehicles. Compressed Natural Gas
(CNG) vehicles serve as a ―bridge‖ to the adoption of Fuel Cell Vehicles, which begin entering the fleet in the
mid-2020s and increase in market share in the later decades of the strategy. As detailed in Appendix D, Figure
D-3, the mid-term vision for 2030 includes a market share increase for high efficiency/alternate fuel vehicles
to comprise over 49% of passenger vehicles in the State and increasing to almost 53% by 2050.
As discussed above, there are a number of strategies the State will pursue to help facilitate the adoption of
alternative fuel vehicles to meet the passenger vehicle fleet transformation illustrated in Figure 17. However,

2013 Connecticut Comprehensive Energy Strategy
Chapter 5: Transportation Sector Strategy
187
there are a number of issues raised during the public comment period on this Strategy that should be
considered in any further work done by the State:
Provide interagency coordination to facilitate adoption of a broad platform of clean vehicles, including
high fuel economy internal combustion engines, plug-in hybrid electric vehicles, electric vehicles,
natural gas vehicles, propane vehicles, biofuel vehicles, and fuel cell vehicles;
Ensure interagency coordination on issues such as vehicle inspections, consumer protection issues,
taxation (consideration of energy equivalencies/gallon), and building codes related to vehicle
charging and fueling infrastructure;
Recommend rate design strategies to incentivize alternative fuel vehicles (e.g., time of use for electric
vehicles, firm rates for natural gas, potential vehicle to grid charging);
Ensure the use of alternative fuels for transportation (e.g., electric, natural gas) does not adversely
impact fuel supplies for non-transportation uses;
Develop additional recommendations to incentivize high efficiency and alternative fuel vehicles;
Analyze greenhouse gas impacts of vehicle and fuel options, including life cycle analysis of vehicles
and fuels;
Build on and expand the work of the Electric Vehicle Infrastructure Council, created under Executive
Order 34, including further analysis as necessary of the impact of electric vehicles on the electric grid,
safety standards for charging equipment, and ensuring an appropriate mix of charging opportunities
at appropriate locations and levels (Level 1 AC, 2AC/DC, or Level 3 DC);
Analyze additional opportunities for expanded alternative fuels in public and private light duty and
heavy duty fleets and buses;
Recommend additional approaches to promote a broad understanding of the numerous cost-effective,
clean, efficient vehicle choices available to consumers and the multiple benefits of high efficiency and
alternative fuel vehicles; and
Recommend strategies for data collection on alternative fuel vehicle infrastructure use (e.g., electric
vehicle charging, natural gas refueling) to ensure adequate planning for supply and reliability.
In addition, this Strategy proposes that PURA adopt: 1) the use of firm rates for the basis of pricing natural
gas vehicle fuel rather than linking the price to gasoline, so that consumers can benefit from natural gas
vehicle fuel savings, and 2) time of use rates for electric vehicle charging to enable off-peak recharging, which
will lower costs and minimize impact on the electric grid and air quality and 3) a tariff for public use of
charging stations owned or operated by an electric distribution company. See additional discussion on time of
use rates in the Electricity Chapter.

2013 Connecticut Comprehensive Energy Strategy
Chapter 5: Transportation Sector Strategy
188
Transportation System Efficiencies
The transportation system itself can be made more efficient. Some options include more sophisticated timing
of traffic lights to improve traffic flow, reduce congestion, and save energy. Companies can improve logistics
to make driving routes more efficient. In an effort to reduce pollution and relieve highway congestion, the
State will continue to analyze the freight system and ports and consider increasing the amount of cargo
transported on trains or ships rather than long-haul trucks. Finally, the State will continue to take leadership
in regional transportation initiatives to ensure a safe, dependable, integrated, and efficient transportation
network connecting Connecticut within New England, the Mid-Atlantic region, and beyond.
Sustainable Funding for an Efficient Transportation System
As the State seeks to establish sustainable transportation funding mechanisms, it needs to ensure that there is
funding is sufficient to support a clean, efficient, safe, and well-maintained transportation infrastructure. The
options outlined by the Transportation Strategy Board, included in Appendix D, should be evaluated on the
basis of their ability to provide funding sufficient to sustain current transportation sector needs as well as
those that will be needed to enhance mobility options and reduce the negative economic and environmental
impacts of transportation.
Impacts of Transportation Strategies
Figure 18 illustrates the contribution of different aspects of the Strategy to the overall reductions in
greenhouse gas emissions. The ―Existing Federal Policy‖ bar largely represents the federal CAFE standards,
which require passenger cars and light trucks to increase in fuel efficiency through model year 2025. Also
included in this bar are small reductions from the Renewable Fuel Standard (RFS), which mandates volumes
of biofuel. The ‗Electric Vehicles‖ (ZEV) bar shows the contributions of the California Zero Emission Vehicle
(ZEV) program, which requires the sale of alternative fuel vehicles like Battery Electric Vehicles, Plug-in
Hybrids, and Fuel Cell Vehicles. This bar additionally reflects the recommendations of Chapter 3 (Electricity),
which support a cleaner electric generation mix over the course of the program. High Fuel Economy vehicles,
traditional ICE Vehicles with a high mile per gallon rating, provide small reductions. Fuel Cell Vehicles
account for some emissions reductions from light-duty vehicles as they are introduced in the later years of the
program, while Compressed Natural Gas is used extensively to fuel medium and heavy-duty fleet vehicles like
buses, refuse trucks and short-haul delivery vehicles. Lastly, transit oriented development and other vehicle
miles traveled (VMT) reduction strategies will decrease the need for passenger vehicle travel in the state. As
illustrated in the final two bars of the graph, these recommendations can achieve substantial reductions in
transportation sector emissions, but nevertheless fall substantially short of the mandated 80% reduction. The
State will pursue additional policy and strategy measures to further decrease transportation sector emissions
as well as measures to reduce greenhouse gas emissions in other sectors.

2013 Connecticut Comprehensive Energy Strategy
Chapter 5: Transportation Sector Strategy
189
FIGURE 18: Connecticut’s Transportation Energy Strategy can cut greenhouse gas emissions by roughly 37% by 2050. This figure falls short of the 80% statewide reduction goal, however, it represents the potential greenhouse gas reductions possible by just one sector.
Source: NESCAUM analysis using the EPA Motor Vehicle Emission Simulator (MOVES) model and post-processing tools.
Transportation Sector Strategy: Recommendations
Combined with the use of alternative fuel economy vehicles in the light-duty sector, significant reductions in
light-duty vehicle miles travelled per capita and additional use of compressed natural gas for municipal fleets
and short haul trucks could cut energy use by 19% and greenhouse gas emissions by roughly 37% by 2050.
Even this aggressive suite of policies falls short of the State‘s 80% greenhouse gas reduction goal, illustrating
the challenge in reducing transportation sector emissions.
This Strategy seeks to address the concerns and harness the opportunities described above and concludes, as
it has in other Chapters, that the most economic and easily achievable benefits will come from increasing
efficiency in all components of the transportation sector. Recognizing that government resources are limited,
this Strategy recommends the following actions to achieve energy savings in the transportation sector:

2013 Connecticut Comprehensive Energy Strategy
Chapter 5: Transportation Sector Strategy
190
1. Promote the Use of Highly Efficient Vehicles for Passengers and Freight
Highly efficient, affordable cars and light trucks in every vehicle class are already on the market, but many
customers are not aware of their availability and benefits. In coordination with the Department of Motor
Vehicles (DMV) and ConnDOT, DEEP should disseminate information on state websites and in DMV
communications to educate the public about the relative efficiency of vehicles within each vehicle class and
encourage purchase of cars and light trucks that have high fuel economy ratings. In addition, DEEP will
conduct outreach through the Energize Connecticut campaign. Based on Figure 17, Vision of Passenger Fleet
Mix, by 2030 49% of the passenger fleet mix should be powered by alternative fuels or zero emission vehicles
(Appendix D, (Transportation)). Further, by 2050, the percentage of the State‘s fleet powered by alternative
fuels or zero emission vehicles increases to 53% (Appendix D, (Transportation)).
2. Develop a Clean Vehicle/Clean Fuels Technology Platform in Connecticut
In an effort to foster Connecticut‘s clean vehicle/clean fuel platform, DEEP will advance the following:
A targeted build-out of an additional 50 publicly available Level 2 electric vehicle charging stations at
shopping malls, parking lots, and other sites across the State – sufficient to eliminate range anxiety.
In addition DEEP and ConnDOT will work to establish a network of 10 Level 3 electric vehicle
charging stations by 2014, located primarily at service plazas on the interstate highways. Partial
funding for the targeted build out should come from monies available as part of the Northeast
Utilities and NSTAR merger settlement agreement. Additional financing opportunities for home
electric vehicle charging infrastructure will be provided through CEFIA programs.
Development of a pilot program to support the conversion of fleet vehicles to natural gas vehicles and
the build-out of a network of publicly available LNG and CNG filling stations. Partial funding for the
targeted build-out should come from monies available from the Northeast Utilities and NSTAR
merger settlement agreement. Additional financing opportunities for home natural gas recharging
infrastructure will be provided through CEFIA programs.
Continued pursuit of funding opportunities to advance research and development of hydrogen fuel
cell technology in the transport sector.
Recommendation to PURA to adopt the use of firm rates rather than non-firm rates to base the price
of natural gas vehicle fuel rather than linking it to the price of gasoline thereby providing a clearer
price signal that will provide an incentive for greater utilization of natural gas vehicles.
Recommendation to PURA to adopt time of use rates for electric vehicle charging to enable off-peak
recharging, which will lower costs and minimize impact on the electric grid and air quality.
Recommendation to PURA to develop a tariff for electric vehicle charging at stations owned or
operated by an electric distribution company.

2013 Connecticut Comprehensive Energy Strategy
Chapter 5: Transportation Sector Strategy
191
3. Facilitate Transit-Oriented-Development to Increase Mobility and Create More Livable Communities
The money currently being invested in the State‘s three major transit projects (CTfastrak, New Haven –
Springfield rail, and Metro-North passenger rail enhancements) should be leveraged to maximize transit use
and reduce vehicle travel demand. This can be done by coordination among agencies to align State
infrastructure spending to support strategic growth within these corridors. For example, State funding for
sewers and other infrastructure could be focused to allow for high-density development in these transit
corridors.
The State should also continue to promote alternate commute options through its existing statewide
transportation demand management measures such as ConnDOT‘s RideShare and Telecommute Connecticut.
These successful programs should be expanded and marketed more aggressively.
In addition, OPM, DECD, ConnDOT, and DEEP will collaborate to support municipal efforts to build
walkable, bikeable, transit-oriented communities and to implement the following strategies that are
consistent with State statutes and the State‘s draft Plan of Conservation and Development Growth
Management Principles, including:
• Redevelopment and revitalization of regional centers and areas with existing or currently planned physical infrastructure.
• Concentrated development around transportation nodes and along major transportation corridors to support the viability of transportation options.
• Promotion of integrated planning across all levels of government to address issues on a statewide, regional and local basis.
4. Follow Best Practices to Improve the Efficiencies of the Transportation System
Within the construct of current responsibilities, ConnDOT will work with Regional Planning Organizations
and the municipalities to improve traffic light timing to speed traffic flow and reduce congestion. In addition,
existing traffic synchronization systems must be maintained to ensure they operate efficiently. The State will
also encourage and support efforts by trucking companies to plan more efficient travel and delivery routes,
and continue to support efforts consistent with the Governor‘s Port Study to transition freight transportation
from trucks to more energy efficient trains and ships.
5. Develop Sustainable Funding Sources for an Efficient Transportation System
As the State seeks to establish sustainable transportation funding mechanisms it needs to ensure that there is
funding to support a clean, efficient, and safe transportation infrastructure. The options outlined by the
Transportation Strategy Board, and included in Appendix D, need to be evaluated on the basis of their ability
to provide funding sufficient to sustain current transportation sector needs as well as those that will be needed
to enhance mobility options and reduce the negative economic and environmental impacts of transportation.

2013 Connecticut Comprehensive Energy Strategy
Chapter 5: Transportation Sector Strategy
192
Conclusion
In 2008 the Connecticut General Assembly passed the Global Warming Solutions Act; a law that sets legally
binding greenhouse gas emissions reductions targets. Specifically, the law states that CT must achieve a 10%
reduction in greenhouse gases from 1990 levels by 2020, and an 80% reduction in greenhouse gas emission
from 2001 levels by 2050. As depicted in Figure 18, the Transportation Sector Strategy falls short of the 80%
emissions reduction goal. However, through a suite of policies and advancements in the transportation sector
including cleaner, cheaper and more reliable fuels; increased transit options; and an emphasis on transit
oriented development—Connecticut can achieve nearly half of the goal. As DEEP moves forward it will
continue to analyze policies and strategies in terms of economic development potential, mobility
enhancement, air quality improvement, and greenhouse gas emissions reduction progress.
A cleaner, more efficient transportation sector will bring tremendous benefits to Connecticut. Improving the
efficiency of the cars and trucks on our roads improves the quality of life for the state‘s residents, puts money
back in people‘s pockets, reduces pollution, and boosts the state‘s economy. Giving people incentives and
opportunities to explore transportation options that reduce energy use and costs will also reduce traffic
congestion and improve everything from worker productivity to quality of life. Creating a hospitable
environment for the vehicle/fuel technologies of the future will help ensure that Connecticut can play a
leadership role as the market transforms to include these vehicles. By ensuring that communities are more
walkable and bikeable, and have enhanced options for safe, efficient transportation, Connecticut will offer its
residents a broad array of choices to meet their transportation needs and become an even more attractive
place to live and work.

2013 Connecticut Comprehensive Energy Strategy
Chapter 5: Transportation Sector Strategy
193
Bibliography
Alvarez, R.A., Pacala, S W., Winebrake, J.J,, et al., ―Greater Focus Needed on Methane Leakage from Natural
Gas Infrastructure,‖ (April 24, 2012), PNAS (109): 17.
http://www.pnas.org/content/early/2012/04/02/1202407109.full.pdf+html.
California Air Resources Board, (2011), ―Draft Environmental Analysis Prepared for the Advanced Clean Cars
Program, Appendix B.‖ http://www.arb.ca.gov/regact/2012/leviiighg2012/levappb.pdf.
City of Stamford, CT, ―Sustainability Amendment to the Master Plan,‖ (2010).
http://www.cityofstamford.org/filestorage/25/52/138/164/202/SUSTAINABILITY_AMENDMENT_
FINAL_12_23_2010.pdf.
Coleman, B., Gaffney, J.M., & Morris, D., ―A Northeast Regional Biofuels Action Plan,‖ (March 2008).
http://www.nebiofuels.org/pdfs/NERegionalReportFINAL.pdf.
Connecticut Department of Environmental Protection, ―Special Act No. 05-6: Connecticut Clean Car Incentive
Program,‖ (2005). http://www.ct.gov/deep/lib/deep/air/climatechange/ctcleancarincentive.pdf.
Connecticut Department of Transportation, ―Connecticut and Metro-North Make Service Investments in New
Weekend and Off-Peak Trains,‖ (July 19, 2012).
http://www.ct.gov/dot/cwp/view.asp?A=1373&Q=508220.
Connecticut Department of Transportation, ―CT fastrak,‖ (2012). http://www.ctfastrak.com/index.php/en.
Connecticut Department of Transportation, ―Transportation Fast Facts,‖ (2012).
http://www.ct.gov/dot/lib/dot/documents/dcommunications/misc/2012_ConnDOTFast_Facts_onli
ne.pdf.
Connecticut Department of Transportation, ―New Haven – Hartford – Springfield Rail Program Objectives
and Scope,‖ (2012). http://www.nhhsrail.com/objectives/cost.aspx.
Connecticut Light and Power and United Illuminating, ―2011 Electricity Sales by NAICS Code,‖ (April, 2012),
Microsoft Excel file shared with Connecticut Department of Energy and Environmental Protection.
Connecticut Office of Policy & Management, ―A Strategic Framework for Investing in CT‘s Transportation:
Economic Growth – Infrastructure Preservation – Sustainable Communities,‖ (January, 2011).
http://www.ct.gov/opm/lib/opm/tsb/meeting_materials/strategic_needs_statement_v9_2010-08-
17.pdf.
CTfastrak, ―Local Service Map,‖ (2012).
http://www.ctfastrak.com/images/ctfastrak_regional_and_local_maps_08-2012.pdf.
Electric Vehicle Infrastructure Council, ―Final Report,‖ (September 1, 2010).
http://www.ct.gov/pura/lib/pura/ev/evfinal.pdf.

2013 Connecticut Comprehensive Energy Strategy
Chapter 5: Transportation Sector Strategy
194
Environmental Protection Agency, ―MOVES: Motor Vehicle Emission Simulator (Version 2010b),‖ (2012).
http://www.epa.gov/otaq/models/moves/index.htm.
Ewing, R., et al, ―Growing Cooler the Evidence on Urban Development and Climate Change,‖ Urban Land
Institute (2008). http://www.uli.org/wp-content/uploads/ULI-Documents/GrowingCooler.pdf.
Fuel Diversification Task Force, ―Initial Findings and Recommendations,‖ (January 16, 2007).
http://www.ctbiofuelinfo.org/images/pdf/FuelDiversityReport11607.pdf.
Hensley, R., Newman, J., Rogers, M., ―Battery Technology Charges Ahead,‖ (July, 2012), McKinsey Quarterly.
http://www.mckinseyquarterly.com/Battery_technology_charges_ahead_2997.
Lomax, T., Schrank, D., & Eisele, B, ―2011 Annual Urban Mobility Report,‖ University Transportation Center
for Mobility, Texas A&M Transportation Institute (September 2011). http://mobility.tamu.edu/ums/.
National Highway Traffic & Safety Administration, ―Corporate Average Fuel Economy49 CFR § 523, 531, 533,
536, and 537‖.
New Haven – Hartford - Springfield Rail Program, ―Project Map,‖ (2012).
http://www.nhhsrail.com/pdfs/project_map_2011.pdf.
Reconnecting America‘s Center for Transit-Oriented Development, ―Realizing the potential: Expanding
housing opportunities near transit,‖ (April, 2007). http://www.reconnectingamerica.org/resource-
center/books-and-reports/2007/realizing-the-potential-expanding-housing-opportunities-near-
transit-2/
Transportation & Climate Initiative, ―Transportation & Climate Initiative of the Northeast and Mid-Atlantic
States.‖ http://www.georgetownclimate.org/sites/default/files/TCI%20brochure.pdf.
U.S. Department of Energy Clean Cities: Connecticut Southwestern Area Clean Cities, ―2011 Annual Report,‖
(2011).
U.S. Department of Energy Clean Cities: Norwich Clean Cities, ―2011 Annual Report,‖ (2011).
U.S. Energy Information Administration State Energy Data System, ―2009 State Emissions by Sector.‖
http://www.eia.gov/environment/emissions/state/excel/Table3_2009.xlsx.
U.S. Energy Information Administration, ―Annual Energy Outlook 2011: With Projections to 2035,‖ (2011).
http://www.eia.gov/oiaf/aeo/gas.html.
U.S. Energy Information Administration State Energy Data System, ―Energy Consumption Overview:
Estimates by Energy Source and End-Use Sector,‖ (2010)
http://www.eia.gov/state/seds/sep_sum/html/pdf/sum_btu_1.pdf.
U.S. Energy Information Administration, ―State Energy Data System 2011 Estimates,‖ (2011),.
http://www.eia.gov/states/seds/seds-data-fuel.cfm.

2013 Connecticut Comprehensive Energy Strategy
Chapter 5: Transportation Sector Strategy
195
U.S. Energy Information Administration State Energy Data System, ―Transportation Sector Energy
Consumption Estimates, Selected Years, 1960-2010, Connecticut.‖
http://www.eia.gov/state/seds/sep_use/total/pdf/use_CT.pdf.
U.S. Environmental Protection Agency, ―Corporate Average Fuel Economy 40 CFR § 85, 86, and 600‖.
U.S. Environmental Protection Agency, ―Renewable Fuel Standard 40 CFR § 80‖.
U.S. Department of Transportation Federal Highway Administration, ―Highway Statistics 2010.‖
http://www.fhwa.dot.gov/policyinformation/statistics/2010/