comprehensive multidimensional chromatography in natural
TRANSCRIPT

Comprehensive multidimensional
chromatography in natural product
analysis
aDepartment of Chemistry and Polymer Science, Stellenbosch UniversitybDepartment of Microbiology and Biochemistry, Hochschule Geisenheim University, Germany
bDepartment of Chemistry and Biochemistry, University of Namibia, NamibiadCentral Analytical Facility, Stellenbosch University
eDepartment of Biochemistry, Stellenbosch University
André de Villiersa, Gaalebalwe E. Ntlhokwea, Andreas G.J. Tredouxa,
Jochen Vestnerb, Kathithileni M. Kalilic, Chandré M. Willemsea, Pieter
Ventera, Maria A. Standerd,e

2
Introduction
• GC and HPLC find extensive use in this field.
The complexity of these samples dictates the need for
improvement of chromatographic performance.
• Need for improved analytical methods for natural product
characterisation informed by recognition of the complexity of these
samples and their derived commodities
• Requirement for fast, detailed and accurate chemical composition
data in support of research, product development and quality
control
• Important developments in MS have had a significant impact on
analytical performance (selectivity of high resolution systems,
tandem MS sensitivity)
• Performance of MS relies partially on chromatographic separation
(isomers, matrix effects…)

The comprehensive 2D approach
Limitations of 1-dimensional chromatography
Peak capacity (nc) for capillary GC, gradient HPLC limited to a few
hundreds. tg
To resolve 98% of n randomly distributed components, nc should be n
100
J.C. Giddings, J. Chromatogr. A 703 1995 3
A. Felinger, Data Analysis and Signal Processing in Chromatography, Elsevier, 1998
3
G(L)C×G(L)C: For comprehensive combination of orthogonal separations, nc,2D is
multiplicative
1st dimension1st dimension
2n
dd
ime
ns
ion
Karger, Snyder and Horvath, An Introduction
to Separation Science, 1973

The challenges: An example
Wulf et al, Am. J. Enol. Vitic. 29
1978 42
de Villiers et al, J. Chromatogr. A 1218 2011
4660
Willemse et al, Anal. Chem. 87 2015 12006
Time10.00 20.00 30.00 40.00 50.00 60.00 70.00 80.00 90.00
%
0
100
3
46 7
9-12
15
16
19
24+25273133
40
44
48
53
5564
65
76
84
87
88
104
108
102
110
114116
125
127
133
135 13780
HPLC: 45 min, 21
compounds, nc ~ 45UHPLC: 1.7 mm, 90 min, 101
compounds nc ~ 290
HILICxRP-LC: 450 min, 94
compounds, nc ~ 900
Analysis of red wine pigments by HPLC
Analysis of wine volatiles by GC
Marais et al., S. Afr. J. Enol. Vitic. 2
1981 19
Packed GC: 53 min, 44 comounds,
nc ~ 92Ortega et al., J. Chromatogr. A 923 2001
205
Capillary GC: 65 min, 37
compounds, nc ~ 300Weldegergis et al., Anal. Chim. Acta
701 2011 98
GC×GC: 84 min, 276
compounds, nc ~ 6500
5
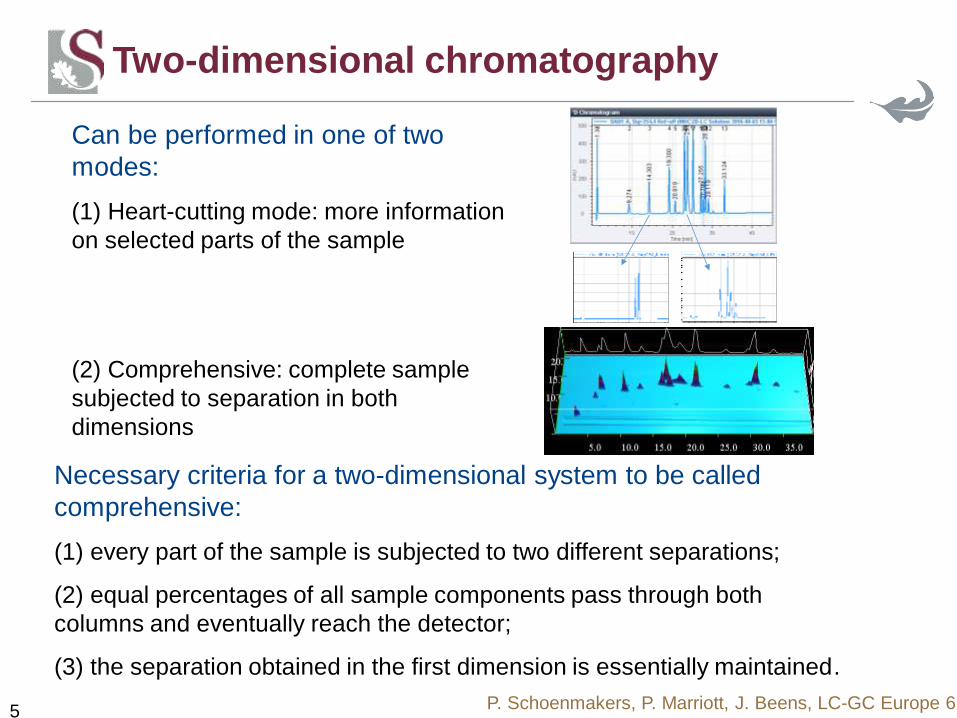
Two-dimensional chromatography
Necessary criteria for a two-dimensional system to be called
comprehensive:
(1) every part of the sample is subjected to two different separations;
(2) equal percentages of all sample components pass through both
columns and eventually reach the detector;
(3) the separation obtained in the first dimension is essentially maintained.
P. Schoenmakers, P. Marriott, J. Beens, LC-GC Europe 6
2003 1
Can be performed in one of two
modes:
(1) Heart-cutting mode: more information
on selected parts of the sample
(2) Comprehensive: complete sample
subjected to separation in both
dimensions

Comprehensive 2D chromatography:
considerations
Sampling rate
Sufficiently short fraction collection times (sampling rates) are
essential to maintain the first dimension separation.
..each first dimension peak should be
sampled at least three times …..
Murphy, Schure and Foley. 1998.
Anal. Chem. 70 (1998) 1585
1D tR
Orthogonality
The degree of mutually exclusive information that may be obtained
from each separation dimension
In GC: different stationary
phases
In LC: different modes,
stationary mobile phases

Experimental: HS-SPME-GCxGC-TOF-MS
Part I:
GC×GC in natural
product analysis

8
GC×GC: Principles and instrumentation
1D column
2D columnmodulator
injector
oven
detector1D column: conventional2D column: short, high speed
Modulation: 2-10 seconds
Detection: > 100 Hz (FID, TOF-
MS)
Orthogonal separations obtained
using apolar and (mid)-polar
columns
sign
al
time
sign
al
Data representation
Animation courtesy of T. Gorecki

9
Modulation in GC×GC
Thermal modulation
• heater based
• cryogenic
Flow modulationValve modulation
U.J. Meinert et al., Ang. Chem. Int. Ed. 51 (2012)
10460
P.J. Marriott et al., TrAC 34 (2012) 1F.C. Wang, J. Chromatogr. A 1188 (2008) 274

Analysis of wine volatiles: the challenges
Analysis of wine volatiles essential, but complicated:
• More than 800 volatiles identified in wine
J.S. Camara et al., Anal. Chim. Acta 563 (2006) 188–197.
% - mg/L mg/L mg/L – ng/L
Isoamyl
alcohol
estersacids phenols terpenes pyrazines
ng/L mg/L g/L - mg/L
• Wide range of concentrations (<ng/L - % level)
• Diverse physicochemical properties (polarity, volatility, reactivity)
alcohols
Isobutyl
methoxypyrazine
b-ionone
m-cresol
Isoamyl
acetate
Hexanoic
acid
Wine aroma is primarily determined by volatile content

11
GC×GC-TOF-MS in wine analysis
48 compounds identified (standards); 155 compounds tentatively
identified (deconvoluted mass spectra, 1D retention index)
Sample prep:
Columns:
Modulation:
Detection:
HS-SPME (CAR/PDMS),
10 mL, 10min, s/less inj.1D: 30 m x 0.25 mm VF-12D 1.5 m x 0.25 mm Wax
Single stage cryogenic (N2)
4 sec
TOF-MS, 50 Hz
isopropyl
methoxypyrazine
sec-butyl
methoxypyrazineOverloading/wraparound of high-level polar compounds
J. Harynuk, T. Gorecki, J. Chromatrogr. A 1019 (2006) 53B.T. Weldegergis et al., Food Chem. 129 (2011) 188

12
Secondary fermentation with lactic acid bacteria (Oenococcus oeni)
Primary goal is deacidification:
MLF also results in:
• Improvement of “mouth feel”, better microbial stability and
changes in aroma
A detailed description of the effect of MLF on wine volatile
composition is still lacking, in part due to analytical
limitations.
+
L-Malic acid L-Lactic acid
Investigating the effect of malolactic
fermentation using GC×GC

13
Investigating the effect of malolactic
fermentation using GC×GC
linalool
2-nonanol
nonanal
Ethyl heptanoatePropyl
hexanoate
IBMP
Fenchone
HS-SPME (CAR/PDMS),
5 mL, 5/30 min, s/less inj.
1D: 30 m x 0.25 mm VF-12D 1.5 m x 0.25 mm Wax
Single stage cryogenic (N2)
4 sec
TOF-MS, 100 Hz
Sample prep:
Columns:
Modulation:
Detection:
J. Vestner et al., J. Agric Food Chem. 59 (2011) 12732

Statistical analysis
• Univariate analysis (ANOVA):
Levels of 43 compounds showed significant difference
• Multivariate analysis (principal component analysis, PCA)
Differentiation between all starter cultures and control
Differentiation of control wines from MLF wines
• hexanal (85)
• hexanol (61)
green, grassy,
herbaceous
aromas
Alcohols &
carbonyls
S. Malherbe et al., J. Ind. Microbiol. Biotechnol. 39 (2012) 477
Control
MLF Culture C
MLF Culture O
MLF Culture V
Decrease in these
properties in MLF
wines has been
reported
: PCA
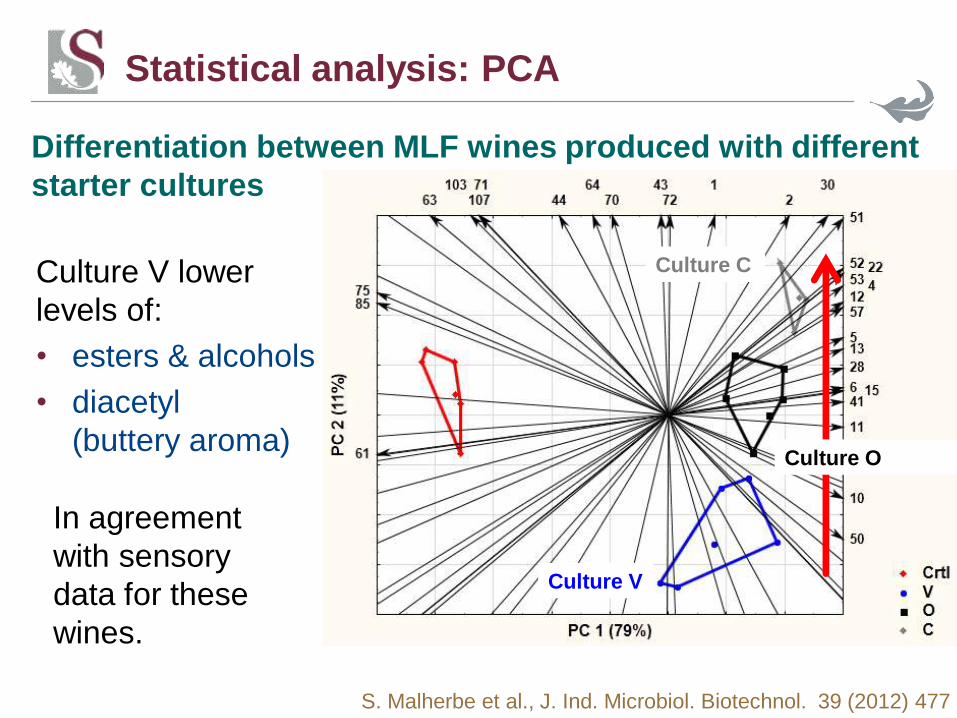
Culture V lower
levels of:
• esters & alcohols
• diacetyl
(buttery aroma)
Statistical analysis: PCA
Culture C
Culture O
Culture V
Differentiation between MLF wines produced with different
starter cultures
In agreement
with sensory
data for these
wines.
S. Malherbe et al., J. Ind. Microbiol. Biotechnol. 39 (2012) 477

16
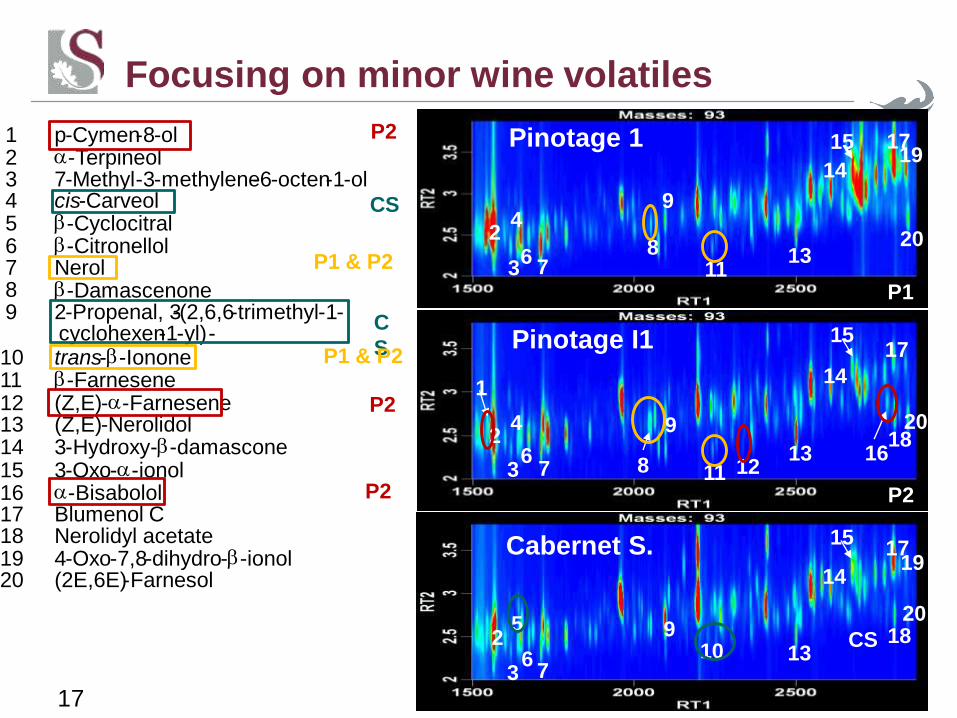
Focusing on minor wine volatiles
Sample prep:
Columns:
Modulation:
Detection:
SDVB SPE, rinse 50% MeOH
Elute DCM, s/less inj. 1D: 30 m x 0.25 mm Rxi2D 1.5 m x 0.25 mm Rtx
Dual stage cryogenic (N2)
4 sec
TOF-MS, 100 Hz
62 compounds
identified
(standards); 214
tentatively
identified (MS, 1D
RI)
B. T. Weldegergis et al., Anal. Chim. Acta 701 (2011)98
17
1 p-Cymen-8-ol2 a-Terpineol3 7-Methyl-3-methylene-6-octen-1-ol4 cis-Carveol5 b-Cyclocitral6 b-Citronellol7 Nerol8 b-Damascenone9 2-Propenal, 3-(2,6,6-trimethyl-1-
cyclohexen-1-yl)-10 trans-b-Ionone11 b-Farnesene12 (Z,E)-a-Farnesene13 (Z,E)-Nerolidol14 3-Hydroxy-b-damascone15 3-Oxo-a-ionol16 a-Bisabolol17 Blumenol C18 Nerolidyl acetate19 4-Oxo-7,8-dihydro-b-ionol20 (2E,6E)-Farnesol
16
1517
1820
1
2
3
4
67
9
11 1213
14
8
P2
2
36
7
9
13
14
15 17
204
19
811
P1
2
36
7
5 913
14
1517
1820
10
19
CS
CS
C
S
P1 & P2
P1 & P2
P2
P2
P2
Pinotage 1
Pinotage I1
Cabernet S.
Focusing on minor wine volatiles

18
GC×GC in indigenous tea analysis:
Honeybush tea
Honeybush is an indigenous South African
herbal tea, produced from Cyclopia species
(Fam. Fabaceae, tribe Podalrieae), endemic to
Western and Eastern Cape provinces.
Numerous Cyclopia species are used for the
production
+ Production: Blending depends on production yield and
availability of the species. Sensory profiles of individual
species not always taken into account.
E. Joubert et al, S.A. J. Bot. 77 2011 887
E. Joubert et al, J. Ethnopharmaco. 119 2008 376
Currently C. intermedia, C. subternata, and C.
genistoides are used for the production.
C. maculata and two others (C. sessiliflora, C.
longifolia) are to be included in production.
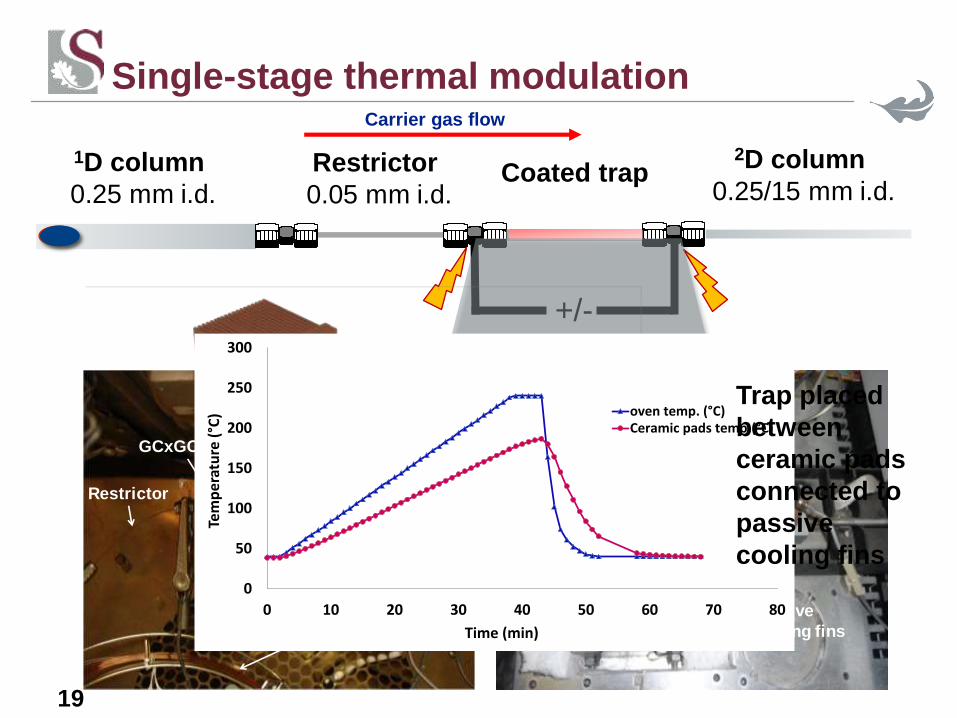
Single-stage thermal modulation
1D column
0.25 mm i.d.
Restrictor
0.05 mm i.d.
2D column
0.25/15 mm i.d.Coated trap
+/-
GCxGC trap
Restrictor
1-D (PDMS) column
2-D (WAX)
column
Passive
cooling fins
Ceramic
pads
19
0
50
100
150
200
250
300
0 10 20 30 40 50 60 70 80
Tem
pe
ratu
re (
°C)
Time (min)
oven temp. (°C)Ceramic pads temp.(°C)
Carrier gas flow
Trap placed
between
ceramic pads
connected to
passive
cooling fins

20
GC×GC-FID analysis of honeybush tea
1D Retention time (min)
2D
Rete
nti
on
tim
e (
sec)
10 20 30 40 50 60
0.5
1
1.5
2
2.5
3
3.5
4
4.5
5
57
3
21
77
19
418
37
1
30
28
27
35
7
1670
69
9
49
68
73
13
45
7184
5811
32
262478
2325
33
47
18
75
7264
22.50 22.55 22.60 22.65 22.70 22.75 22.80 22.85 22.90
5.00 î 10 4
1.0 0î 10 5
1.5 0î 10 5
2.00 î 10 5
2.5 0î 10 5
3.00 î 10 5
3.5 0î 10 5
4.00 î 10 5
4.50î 10 5
5.00 î 10 5
U2
U1
U1+23U3
23
23
24
24
1D Retention time (min)
2D
Rete
ntion
tim
e (sec)
22.2 22.4 22.6 22.8 23 23.2 23.4 23.6 23.8
0.8
1
1.2
1.4
1.6
1.8
2
2.2
2.4
2.6
24
2523
unknown 3
unknown 1
unknown 2
1D column: HP-5MS, 0.25mm i.d., 30m L
2D column: StabilWax 0.15mm i.d., 0.6m L
Modulation: 5 seconds
Flow: 24 cm/s 1D Ramp: 3oC/min

GEN4
GEN6
GEN8
GENB5
GENC5
MAC2
MAC12MAC17
MACB5
MACC5
SUB2
SUB4
SUB8
SUBB5
SUBC5-3
-2
-1
0
1
2
3
4
5
6
-5 -4 -3 -2 -1 0 1 2 3 4 5 6
F2 (
29
.86
%)
F1 (34.23 %)
Observations (axes F1 and F2: 64.08 %)
Statistical analysis: PCA scoresComparison with sensory data
21
Se
ns
ory
da
ta
GEN4
GEN6GEN8
GENB5
GENC5
MAC2
MAC12MAC17
MACB5
MACC5
SUB2
SUB4
SUB8
SUBB5
SUBC5
A_FynbosFloral
A_RoseGeranium
A_RosePerfume
A_LemonLemongrassA_ApricotApricotJa
m
A_CookedApple
A_Woody
A_Pine
A_Fruitysweet
A_Caramel
A_Honey
A_FynbosSweet
A_CassiaCinnamon
A_Walnut
A_Coconut
A_Dusty
A_BurntCaramel
A_Rottingplantwater
A_HayDriedGrass
A_Greengrass
A_Cookedvegetable
-1.5
-1
-0.5
0
0.5
1
1.5
2
2.5
-2.5 -2 -1.5 -1 -0.5 0 0.5 1 1.5 2 2.5
F2 (2
9.86
%)
F1 (34.23 %)
Biplot (axes F1 and F2: 64.08 %)

22
GC×GC-TOF-MS for detailed qualitative
analysis of honeybush tea
3
4
5
9
10
12
14
18
20
23
64
35
41
28
29
30
31
33
36
38
47
48
48 69
35
56
57
58
61
62
71
63
73
76
78
92
101
146
150
132
156
165
/166
173
172
246
215
264
190
197
202
160
205
224
217
225
235
232
243
236
248
81
83
8782
91
88
90
108
105
24
111
114
119
125
127
127
135
140
136
162
171
176
181
188
208
209212
214216
219
237
244
247
250255
258
260
265
272
283
285301
308
309
284
Sample prep:
Columns:
Modulation:
Detection:
HS-SPME (PDMS/DVB),
10 mL, 30min, split inj.1D: 30 m x 0.25 mm Rxi2D 0.8 m x 0.25 mm Wax
dual stage cryogenic (N2)
5 sec
TOF-MS, 100 Hz
108 reference standards
Data obtained in Alvaro Viljoen’s lab (TUT)

23
Deconvolution
90Linalool
93
92
95
98
1835
3835
0840
2840
4840
1845
0
250000
500000
750000
1e+006
1.25e+006
1.5e+006
1.75e+006
2e+006
1st Time (s)
2nd Time (s) 71 109 119
90
92
93
90
40 60 80 100 120 140 160 180 200
500
1000 71
82
55
93 107
Peak True - sample "Mac-C5-R3 A2:1", peak 181, at 840 , 2.540 sec , sec
40 60 80 100 120 140 160 180 200
500
1000 71
82
43
55 91
Library Hit - similarity 931, "Hotrienol"
40 60 80 100 120 140 160 180 200
500
1000 109
81
53 124 65 91
Peak True - sample "Mac-C5-R3 A2:1", peak 180, at 840 , 2.420 sec , sec
40 60 80 100 120 140 160 180 200
500
1000 109
43 81
53 124 65 91
Library Hit - similarity 963, "6-Methyl-3,5-heptadiene-2-one"
GC×GC-TOF-MS: Identification

24
C.genistoides
C. subternata
C. maculata
GC×GC-TOF-MS: Comparison of
species
232 compounds
218 compounds
182 compounds
Total of 274 identified
161 new compounds

196
202
205
209
212
224
232
233
237
240
248 253
259
269 277
284
258
C. maculata
C. subternata
196
202
205
209
212
232
233
237
240
248 253
254
258
259
269277
284224
C. genistoides
25
196
202
205
209
212
224
232
233
237
240
248253
259
269277
284
258
200
cinnamaldehyde uniquely
detected in C. maculata -
cassia cinnamon aroma.
Eugenol associated with spicy
aroma was detected in all the 3
species but differ in
abundance.
O
OH
GC×GC-TOF-MS: Comparison of
species
K.A. Theron et al., Food Res. Int. 66 2014 12-22
C.M. Guedes et al. Eur. Food Res. Technol. 219 2004 460-464
Likely responsible
for the
characteristic
cassia/cinnamon
aroma of this
species
GEN4
GEN6GEN8
GENB5
GENC5
MAC2
MAC12MAC17
MACB5
MACC5
SUB2
SUB4
SUB8
SUBB5
SUBC5
A_FynbosFloral
A_RoseGeranium
A_RosePerfume
A_LemonLemongrassA_ApricotApricotJa
m
A_CookedApple
A_Woody
A_Pine
A_Fruitysweet
A_Caramel
A_Honey
A_FynbosSweet
A_CassiaCinnamon
A_Walnut
A_Coconut
A_Dusty
A_BurntCaramel
A_Rottingplantwater
A_HayDriedGrass
A_Greengrass
A_Cookedvegetable
-1.5
-1
-0.5
0
0.5
1
1.5
2
2.5
-2.5 -2 -1.5 -1 -0.5 0 0.5 1 1.5 2 2.5
F2 (2
9.86
%)
F1 (34.23 %)
Biplot (axes F1 and F2: 64.08 %)

26
GC×GC combined with high speed high
resolution TOF-MS: Rooibos tea
Sample prep:
Columns:
Modulation:
Detection:
HS-SPME (PDMS/DVB),
10 mL, 30min, split inj.1D: 30 m x 0.25 mm Rxi2D 2 m x 0.25 mm Wax
dual stage cryogenic (N2)
4 sec
TOF-MS, 120 Hz
acetophenone
1-octen-1-ol
1-octanol
C8H8O
Mass accuracy: -0.14ppm
Match factor: 94%

Experimental: HS-SPME-GCxGC-TOF-MS
Part II:
LC×LC in natural
product analysis

28
Considerations in LC×LC method development
For LC×LC, injection volume in the second dimension is
the product of 1D flow rate and sampling time
Injection of fractions in strong 2D eluents limited by injection band broadening
Compatibility determined by mobile phase characteristics
Separation modes dictated by sample properties
For polymers, SEC×RP-LC, SEC×LCCC etc
280 nmA
1a
1b
2a
2b
3a
3b
3c
4b
4a
3d
6a+b
4d
9
7a+b
4c
5b
5a 5c
6c
7c
8
For neutral organic compounds, especially HILIC×RP-LC has
proven effective
Ionisable compounds: IEX×RP-LC, RP-LC×RP-LC varying pH, etc.
S. Keuchkarian et al, J. Chromatogr. A 1119 2003 20
29
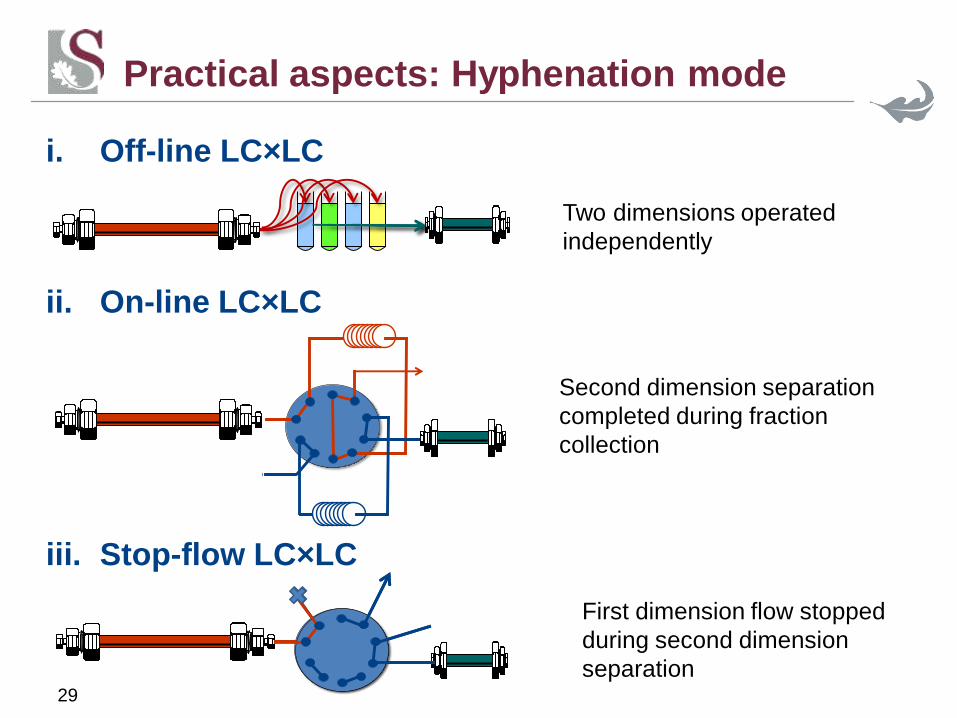
Practical aspects: Hyphenation mode
i. Off-line LC×LC
ii. On-line LC×LC
iii. Stop-flow LC×LC
Two dimensions operated
independently
Second dimension separation
completed during fraction
collection
First dimension flow stopped
during second dimension
separation

30
LC×LC considerations: Orthogonality
Orthogonality.
• HILIC and RP-LC characterised by high degree of orthogonality
• Different separation mechanisms required to exploit 2-dimensional
space.
*Lui, et al, Anal. Chem. 67 1995 3840 *Davis et al, Anal. Chem. 80 2008
8122
*Semard et al, J. Chromatogr. A 1217 2010
5449
0 0 0 0 1 0 0 0
0 0 0 0 0 0 0 0
1 0 2 0 1 1 0 0
0 0 2 0 3 1 0 0
1 0 2 0 2 4 4 0
0 0 1 0 3 1 4 0
0 0 0 0 1 2 5 3
0 0 1 0 1 1 5 70.2 0.4 0.6 0.8 1
0
0.2
0.4
0.6
0.8
1
“1. every part of the sample is subjected to two different separations”
M. Gilar et al, Anal. Chem. 77 2005 6426
surface coverage metrics preferred• Means to quantify orthogonality problematic;

31
First-dimension sampling time, 1ts
Determines 1st-dimension undersampling :
X. Li, D. Stoll, P.W. Carr, Anal. Chem. 81 2009 845
The volume of each fraction: Because HILIC eluents are strong solvents in
RP-LC, the maximum injection volume in the
second dimension (2Vinj) is limited
LC×LC considerations: Sampling time, 1ts
And the total analysis time (and second
dimension cycle time in on-line LC×LC)
“3. the separation (resolution) in the first dimension is essentially
maintained”

32 M. Schure, Anal. Chem. 71 1999 1645
LC×LC considerations: Dilution
“2. equal percentages (either 100% or lower) of all sample components
pass through both columns and eventually reach the detector”
2Dmodulation1D
is limited
Only a portion of each
fraction is injected:
if

Minimising dilution in HILIC×RP-LC
Off-line HILIC×RP-LC:• Minimise fraction volume: 1D i.d., flow rate
• Inject only portion of fraction (2Vinj < Vfrac; SR!)
• Evaporate and re-dissolve in weak solvent
• Dilute in weak solvent
Stop-flow and on-line HILIC×RP-LC:• Minimise fraction volume: 1D i.d., flow rate
• Inject only portion of fraction using a splitter (2Vinj < Vfrac; SR!)
• Use traps to trap analytes and remove mobile phase
• Dilute in weak solvent prior to 2D column
Loop 2
V
1
V
1
Waste
2nd D pump
2nd D column
Detector
Waste
1st D pump
1st D column
Loop 1
Trap 1
V
1
V
1
Waste
2nd D pump
Waste
Detector
Trap 2
1st D pump
1st D column
Make-up flow
2nd D column
Flow splitter
Weak diluent
34
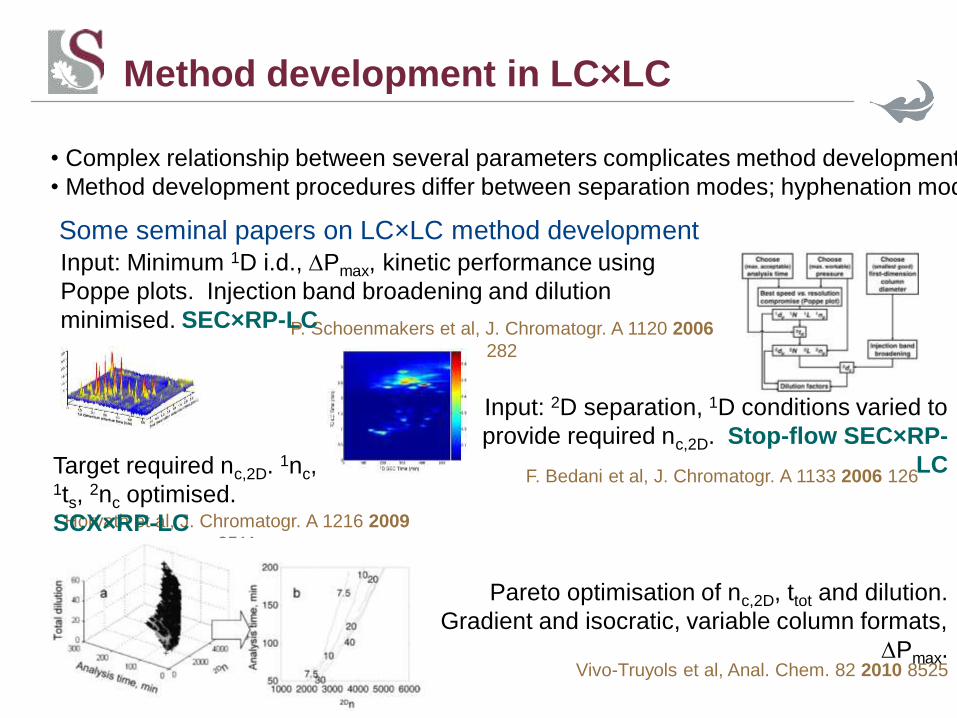
Method development in LC×LC
• Complex relationship between several parameters complicates method development
• Method development procedures differ between separation modes; hyphenation mode
Some seminal papers on LC×LC method development
P. Schoenmakers et al, J. Chromatogr. A 1120 2006
282
Input: Minimum 1D i.d., DPmax, kinetic performance using
Poppe plots. Injection band broadening and dilution
minimised. SEC×RP-LC
F. Bedani et al, J. Chromatogr. A 1133 2006 126
Input: 2D separation, 1D conditions varied to
provide required nc,2D. Stop-flow SEC×RP-
LC
Vivo-Truyols et al, Anal. Chem. 82 2010 8525
Pareto optimisation of nc,2D, ttot and dilution.
Gradient and isocratic, variable column formats,
DPmax.
Horvath et al, J. Chromatogr. A 1216 2009
2511
Target required nc,2D. 1nc, 1ts,
2nc optimised.
SCX×RP-LC

35
HILIC×RP-LC method optimisation strategy
nc,1D of individual separations
Off-line and stop-flow:
• Fixed 1-D conditions (1tg=50min, 1F=50mL/min)
On-line:
• Fixed 1-D conditions (1tg=100min, 1F=25mL/min)
• Repeated for various 1ts, ttot calculated for each
• For fixed 1ts: 2tc varied, nc,2D calculated, corrected for undersampling &
orthogonality• Stop-flow: nc,1D corrected for 1st dimension broadening
• 2tc varied, nc,2D calculated, corrected for undersampling & orthogonality, ttot
calculated for each
K.M. Kalili, A. de Villiers J. Chromatogr. A 1289 2013
58; 69
0
100
200
300
0 20 40 60
(min)
C18, 50×4.6 mm, 1.8 mm dp, 1.5 mL/min, 50°C Diol, 150×1 mm, 5 mm dp, 25-50 mL/min

36
Optimisation results
ii. On-line LC×LC
Second dimension separation
completed during fraction
collection
SR=62:1
0
100
200
300
400
500
600
0 5 10 15 200
0.2
0.4
0.6
0.8
1
1.2
1/b
2tc (min)
1/b
25 mL/min
n’c,2D
Optimal 1ts = 3
min
n’c2,D = 570
SR=124:1
SR=37:1
SR=24:1
• Higher 2nd dimension
peak capacity at longer 2tc
• 1st dimension under-
sampling dominates for long 2tc

37
Wine tannins
37
Complexity increases with degree of polymerisation (DP)
"polymeric procyanidins.....cannot be separated through conventional high-
performance liquid chromatography”.
*Tourino, et al, Rapid Comm. Mass Spectrom. 22 2008 3489
Tannins: proanthocyanidins, oligomeric phenolics comprising several
constituent units and a large number of isomeric
structures

On-line HILIC×RP-LC-UV-FL-
Q-TOF-MS analysis of grape seed tannins
1D: 80 min gradient, 25 mL/min2D: 2 min cycle time, 1.5 mL/min
1ts: 2 min
11
HILIC pump(UPLC )System 1
HILIC column(Devlosil Diol column:
250 x 1 mm, i.d., 5 mm dp)
RP column(KinetexC18 column:
50 x 4.6 mm, i.d., 1.8
UPLC-PDA DetectorSystem 2
RP pump(UPLC)
System 2
Waste
Loop 1
Loop 2
Q-TOF-MS DetectorSystem 3
Flow
splitter
Flow splitter
UPLCFLD DetectorSystem 2
, mm dp)

fluorescenc
eBase peak
chromatogram
Retention Time - HILIC [min]
Rete
ntion T
ime -
RP
LC
[m
in]
20 40 60 80 100
0.5
1
1.5
1
2
3
4
8
6
7
9
1011
16
17
1819
2122
32 3334
3536
37
38
4647
49
50
61,62
63
64
65
66
48
20
Retention Time - HILIC [min]
Rete
ntion T
ime -
RP
LC
[m
in]
20 40 60 80 100
0.6
0.8
1
1.2
1.4
1.6
1
2
†
†
5
3
4
†
6
7
9
10
11
12
13
14
15
1617
18
1920
2122
23
24
25
27
28
29
30
3132
3334
45
3536
37
38
39
40
42
43
44
26
41
8
†
†
FL MS
HILIC×RP-LC-UV-FL-Q-TOF-MS
analysis of grape seed tannins

A B
DC
F=10 F=50 F=100 F=20
F=10 F=5 F=2
n = 0-3
Extracted ions: gallated procyanidins

41
Wine anthocyanins and their alteration
O+
OH
HO
OH
OCH3
O
OCH3
O
OHOHHO
OH
O+HO
OH
O O
OHOHHO
OH
OH
O
HO
OH
OH
HO
OH
OCH3
OCH3
R1R2
direct
condensationRemy et al, J. Sci. Food
Agric. 80 2000 745
Proanthocyanins
(tannins)
Acetadehyde-
mediated
condensationRivas-Gonzalo et al, J. Agric.
Food Chem. 431995 14444
Proanthocyanins
(tannins)
O+HO
OH
O O
OHOHHO
OH
OH
OCH3
OCH3O OH
HO
HOOH
HO
R1
R2
O+HO
OH
O O
OHOHHO
OH
O
OCH3
O
HO
OH
OH
HO
OH
OCH3
R1R2
O+HO
OH
O O
OHOHHO
OH
O
OCH3
O
HO
OH
OH
HO
OH
OCH3
R1R2
A+-F
configuratio
n
Vinylflavano
l adductsFrancia-Aricha et
al, J. Agric. Food
Chem. 45 1997
2262
vinylflavanols
(tannins)
Vitisin A
derivativesBakker et al, Phytochem.
44 1997 1375
Pyruvic acid,
cycloaddition
O+
O
HO
OH
O O
OHOHHO
OH
OCH3
OCH3
COOH
Vinylphenol
derivativesSchwarz et al, J. Agric. Food
Chem. 51 2003 3682
O+
O
HO
OH
O O
OHOHHO
OH
OH
R1
OCH3
OCH3
R2
Hydroxy-
cinnamic
acids

0
2
4
6
8
1 0
400
800
1200
1600
0
10
20
30
40
50
17:1 (223min)
24:1 (155min)
1 mL/min
2 mL/min
6 mL/min
10 mL/min
7:1 (225min)
n* c
,2D
Split ratio
2tc (m
in)
4:1 (416min)
Minimising dilution: experimental conditions
Effect of 1D flow rate, gradient time:
0 2 4 6 8 10
500
750
1000
1250
1500
1750
2000
2250
n* c
,2D
2tc(min)
1tg = 376 min
2mL/min
1tg = 217 min
1tg = 156 min
0 2 4 6 8 10
500
750
1000
1250
1500
1750
2000
n* c
,2D
2tc(min)
6mL/min
1tg = 217 min
1tg = 126 min
1tg = 72 min
Lower 1F and longer 1tg provide:
• Higher n'c,2D
• lower split ratios
Solvent implications: required split ratio’s:
2tc,opt
C.M. Willemse et al., Anal. Chem. 87 2015 12006
11
HILIC pump
(CapLC)
System 1
HILIC column
(BEH Amide column: 150 × 1 mm, i.d., 1.7 mm dp)
RP column(Kinetex C18 column:
50 × 2.1 mm, i.d., 1.3 mm dp)
UPLC-PDA Detector
System 2
RP pump
(UPLC)
System 2
Waste
Loop 1
Loop 2
Q-TOF-MS
DetectorSystem 3
Flow
splitter
BEH Amide, 150×1 mm, 1.7 mm dp, 1-10 mL/min
Kinetex C18, 50×4.6 mm, 1.3 mm dp, 0.86
mL/min, 60°C
On-line HILIC×RP-LC analysis of red wine pigments
1D: 315 min gradient, 1 mL/min2D: 2 min cycle time, 0.86 mL/min
1ts: 2 min
To avoid the need for flow splitting:1F = 1 mL/min, 315 min gradient
1ts = 2tc = 2 min
SR =1
Sacrifice 2D performance for maximum sensitivity

Cap-LC
PDAQ-TOF
On-line HILIC×RP-LC-UV-
Q-TOF-MS analysis of red wine pigments

On-line HILIC×RP-LC analysis if wine pigments
6-year old red wine
Red wine
HILIC (n1) 22
RP-LC (n2) 63
orthogonalit
y
0.68
β 1.02
n'c,2D 890

Comparison of pigment profiles
1-year old 6-year old
2013 and 2008 Pinotage wines produced using standard winemaking
procedures at the Welgevallen experimental cellar (Stellenbosch) using grapes
from the same vineyard. 94 compounds tentatively identified based on 1tR, 2tR,accurate
mass and fragmentation information
m/z200 300 400 500 600
%
0
100493.1350
479.0844
303.0509
494.1381
495.1422
MS
m/z200 250 300 350 400 450 500
%
0
100331.0815
315.0496
287.0562
332.0853
333.0889493.1278
MSE

On-line HILIC×RP-LC: 2008 Pinotage
Retention time - HILIC (min)
Re
ten
tio
n t
ime -
RP
-LC
(m
in)
100 150 200 250 300 350 400 4500.4
0.6
0.8
1.0
1.2
1.4
26
265
34
73 72
7748
39
10
20
58
7469
9
92
1314
91 90
88 84 82
85 64
68
6267
61
93
66
m/z 781
2008 Pinotage
266.0 267.0 268.0 269.0 270.0
%
100
26
2728
26
27
28
26
27
28
26
27
28

120 140 160 180 200 220 240 260 2800.4
0.5
0.6
0.7
0.8
0.9
1.0
1.1
1.2
1.3
Re
ten
tio
n t
ime
-R
P-L
C (
min
)
Retention time - HILIC (min)
(b)
120 140 160 180 200 220 240 260 2800.4
0.5
0.6
0.7
0.8
0.9
1.0
1.1
1.2
1.3
Re
ten
tio
n t
ime
-R
P-L
C (
min
)
Retention time - HILIC (min)
(a)
Comparison of pigment profiles
□ Anthocyanin-glucosides (15)
○ Anthocyanin-di-glucosides (5)
Δ Oligomeric Anthocyanins (5)
□ Anthocyanin-tannin
adducts (15)
○ Acetaldehyde-mediated
tannin adducts (16)
Δ Vinylflavanol
condensation products
(12)□ Oxovitisins (3)
○ Pyruvic acid derivatives (6)
Δ Acetaldehyde derivatives
(4)□ Anthocyanin-catechol
derivatives (5)
○ Anthocyanin-phenol derivatives
(3)
Δ Anthocyanin-guaicol derivatives
(4)
◊ Anthocyanin-syringol derivative
(1)
2013
2008

Retention Time - HILIC [min]
Rete
ntion T
ime -
RP
LC
[m
in]
20 40 60 80 100
0.6
0.8
1
1.2
1.4
1.6
1
2
†
†
5
3
4
†
6
7
9
10
11
12
13
14
15
1617
18
1920
2122
23
24
25
27
28
29
30
3132
3334
45
3536
37
38
39
40
42
43
44
26
41
8
†
†
48
The future: some perspective…
PC10G3
PC11G3
PC12G396.0236 96.0214
PC11G2
PC11G4
PC11G5
50.6716 50.6715
50.6704
50.6632
PC11G1

49
The future: some perspective…
0
500
1000
1500
2000
2500
3000
3500
4000
4500
5000
0 2 4 6 8 10 12 14 16 18
Co
un
t p
er s
eco
nd
Retention time (min)
Chestnut - Reverse phase
RP-LC-MS analysis of tara hydrolysable tannins
1
2
x x
x x x
x x x x x x
3 5
4
11 14
6 8 10
12-2
7
9
13
9.1
16
17.1-2
17.2-2
19.3-2
17-2
20
18-2
18.1-2
19-2
19.1-2
21.1-2
21-2
22-2
23-2
24
19.2-2
26
272-
262-
282-
252-
22.1-2
292-
302-
30
22.2-2
312-
32
34
33
26.12-
35
27.1-2
28.12-
26.1
35.12-
36-2
37 37.1
34.1
6692-
x
39
909-2 m/z, RT 6.56
39
26.12-
34.2
38.32
x x
41 422-
42
34.3
x
44
43.1
34.4
34.5
34.6
45.10 37.2
46
47 82.4
48.2
47.22-
43.2
47.32-
51
522-
82.32-
53
48.
48.6
48.7
61
59.1
59.2
562-
552-
67
682-
83
65.3 65.2
69.2
75
79
Retention time (min)
Dri
ft t
ime
(m
se
c)

50
Conclusions
The complexity of natural products demands powerful analytical methods
for detailed chemical analysis.
• Chromatographic separation complementary to MS in this endeavor.
GC×GC with cryogenic modulations by now an established technique
offering higher resolving power, better sensitivity and improved
compound identification
• Developments in cheaper modulation strategies on-going
• Combination with HR-TOFMS extends the capability of the technique
• Current focus on improved data analysis techniques
LC×LC not established, but instrumental and theoretical developments
support fast-growing field
• Choice of orthogonal methods essential; implications for ease of
hyphenation
• Method development still complex
• Hyphenation to various detectors extends applicability
• HILIC×RP-LC in particular a powerful methods for flavonoid analysis
51
Acknowledgements
Post-graduate students: Elizabeth Ntlhokwe, Martha Kalili, Chandré Willemse, Jochen
Vestner, Pieter Venter, Magriet Muller
Collaborators: Andreas Tredoux, Marietjie Stander, Elizabeth Joubert, Dalene de Beer
(ARC), Nina Muller (Food Science), Wessel du Toit (DVO Stellenbosch), Harald Pash
(Stellenbosch), Frederic Lynen (Gent), Taduesz Gorecki (Waterloo)
Stellenbosch University, SASOL, Restek, Agilent Technologies, NRF, IFS, Restek, TWAS
for financial support
Dr. Peter Gorst-Allman (LecoAfrica), Prof. Alvaro Viljoen, Guy Kamatou (TUT)