determination of pesticides in complex samples by …cdn.intechopen.com/pdfs/20994.pdf ·...
TRANSCRIPT
12
Determination of Pesticides in Complex Samples by One Dimensional (1D-),
Two-Dimensional (2D-) and Multidimensional Chromatography
Tomasz Tuzimski Department of Physical Chemistry, Chair of Chemistry, Faculty of Pharmacy with Medical
Analytics Division, Medical University of Lublin Poland
1. Introduction
An important goal in the field of analytical chemistry is to achieve continous improvement
in the analysis of toxic pollutants, e.g., pesticides. Pesticides are widespread throughout the
world. The composition of pesticide mixtures occurring in environmental samples depends
on geographical area, season of the year, number of farms, and quantity and intensity of use
of plant-protection agents. The variety of their mixtures in different matrices, for example,
rivers, fruits and vegetables, medicinal plants, is very large. Sometimes, a monodimensional
chromatographic separation is not sufficient to resolve all the components of interest of
multicomponent mixtures. The problem of peak overlapping may occur, and a pre-
separation of the sample is often necessary. This pre-separation aims at reducing the
complexity of the original matrix, by isolating simpler fractions from the original mixture.
The fractions should contain the same amounts of the analytes as in the whole sample, ready
for analysis and free from substances that can interfere during the chromatographic
analysis. Multidimensional chromatography brings together separations often based on
different selectivity mechanisms. Multidimensional or comprehensive two-dimensional chromatography (GCxGC) is a
relatively new technique that can analyze multicomponent samples on different GC phases
in the same analysis. GCxGC has a number of advantages over single column techniques. In
this mode, two different chromatographic columns are connected in series through a
modulator, which traps the analytes eluting from the primary column and re-injects them in
small compressed packets onto the secondary column. Columns coupled in series provide
better separation of components of sample through different physical and chemical
properties (e.g., boiling point/polarity versus shape selection) in the two steps. The GCxGC
provides much better chromatographic resolution and peak capacity than single column
system. GCxGC can also be used as screening method for various groups of pesticides.
Multidimensional liquid chromatography also represents a powerful tool and alternative procedure to classical one-dimensional HPLC methods with optimum efficiency and selectivity for the separation of the component of interest, while simultaneously minimizing
www.intechopen.com

Pesticides in the Modern World – Trends in Pesticides Analysis
282
the analysis time by decreasing the time spent in separating those components of the sample that are of no analytical interest. Multidimensional LC separation has been defined as a technique which is mainly characterized by two distinct criteria, as follows: - the first criterion for multidimensional system is that sample components must be
displaced by two or more separation techniques involving an orthogonal separation mechanism,
- while the second criterion is that components that are separated by any single separation dimension must not be recombined in any further separation dimension.
Coupled-column liquid chromatography (LC-LC coupling) refers to the conventional two-dimensional mode of chromatography in which fractions from one column are selectivly transferred to a secondary column for further separation. The volume of the eluate transferred from the first column to the second column can correspond to a group of peaks, a single peak or a fraction of a peak, so that different parts of the sample may follow different paths through the LC-LC configuration. The separation of complex mixtures of pesticides is also possible by combination of different modes of multidimensional planar chromatography. Multidimensional planar chromatography (MDPC) can be performed using different mobile phases in systems with single-layer or bi-layer plates by graft thin-layer chromatography. Graft thin-layer chromatography is a complex system in which chromatographic plates with similar or different stationary phases are used. Compounds from the first chromatographic plate after chromatogram development are transferred to the second plate of different selectivity, without scraping, extraction, or re-spotting the bands by use of a strong mobile phase. In the second mode of MDPC the separation of complex mixtures of compounds has been realized on a monolayer. In these experiments a solvent system (mobile phase A) was selected for one adsorbent, e.g., silica stationary phase to separate groups of compounds from the investigated complex mixture. Afterwards the mobile phases were optimized (mobile phases B, C, D, E) for the different group of compounds regarding each group as an individual separation problem. By the help of this new procedure numerous compounds from a complex mixture were separated on 10 cm x 10 cm TLC or/and HPTLC plates. In this mode of MDPC the largest differences for separation of complex mixtures can be obtained by combination of normal-phase and reversed-phase systems with the same chromatographic layer, e.g., cyanopropyl one. In the third mode of MDPC the separations of multicomponent mixtures were realized on multiphase plates. Also in this mode the largest differences were obtained by combination of a normal-phase system of the type silica/nonaqueous eluent in the first step of MDPC and a reversed-phase system of the type octadecyl silica/water + organic modifier (methanol, acetonitrile, tetrahydrofuran) in the next steps of MDPC on multiphase plates, e.g., with a narrow zone of SiO2 and a wide zone of RP-18 (or vice versa) which are commercially available from Whatman (Multi K SC5 or CS5 plates). In the fourth mode of MDPC the separations of mixtures were realized on a monolayer of, e.g., silica. Separations of compounds were performed on polar stationary phases with a non-aqueous system (step A) and with partly aqueous eluents (step B) in the next step of MDPC. Application of multidimensional planar chromatography (MDPC) with different systems in steps, e.g., adsorption chromatography (step A) and hydrophilic interaction chromatography (HILIC) or ion exchange (step B) is especially useful for correct identification of components of difficult, complicated mixtures, e.g., pesticides in rivers or plant extracts. MDPC combined with different modes of scanning, e.g., with diode array
www.intechopen.com
Determination of Pesticides in Complex Samples by One Dimensional (1D-), Two-Dimensional (2D-) and Multidimensional Chromatography
283
detection (MDPC-DAD) or mass spectrometry (MDPC-MS) enables quantitative analysis and identification of compounds. Heart-cut spots of analytes from the stationary phase can also be injected on, e.g., a C18 column and analysed by HPLC-DAD. The new multidimensional methods with fast scanning detectors should enable us to detect and determine many more compounds in sample extracts and continue to improve modern analytical methods for better research to control the environment for persistent toxic compounds, e.g., pesticides. The most efficient approach to pesticide analysis involves the use of chromatographic methods. Sometimes, the resolving power attainable with a single chromatographic system is still insufficient for the analysis of complex mixtures. The coupling of chromatographic techniques is clearly attractive for the analysis of multicomponent mixtures of pesticides. Truly comprehensive two-dimensional (2D) hyphenation is generally achieved by frequent sampling from the first column into the second, which permits a very rapid analysis. This chapter is a continuation of an earlier published study by the same author: Multidimensional chromatography in pesticides analysis. In: Pesticides – strategies for pesticides analysis. (Ed.) Margarita Stoytcheva. InTech, Rijeka 2011, pp. 155-196 (Tuzimski, 2011a). In the previous study (Tuzimski, 2011a) were presented different modes of multidimensional chromatographic separation techniques including multidimensional gas chromatography (MDGC), multidimensional liquid chromatography (MDLC) and multidimensional planar chromatography (MDPC) applied to analysis of pesticides. In this study are presented sequential aspects of one dimensional (1D-), two-dimensional (2D-) and multidimensional chromatographic separation techniques including also MDGC, MDLC and MDPC applied to analysis of pesticides (without repetition of information included in the previous study (Tuzimski, 2011a)).
2. Chromatographic techniques applied to analysis of pesticides
2.1 Planar chromatography 2.1.1 Advantages of planar chromatography Planar chromatography is most effective for the low-cost analysis of samples requiring minimal sample clean-up. Planar chromatography is also selected for pesticides screening analysis, because (Tuzimski, 2011b): - single use of stationary phase minimizes sample preparation requirements; - parallel separation of numerous samples enhances high throughput; - ease of post-chromatographic derivatization enables improved method selectivity and
specifity; - detection and/or quantitation steps can easily be repeated under different conditions; - all chromatographic information is stored on the plate and can be (re-) evaluated if
required; - several screening protocols for different analytes can be carried out simultaneously; - selective derivatizing reagents can be used for individual or group identification of the
analytes; - detection of the separated spots with specific and sensitive color reagents; - visual detection of UV-absorbing compounds is possible in field analyses by use of a
UV lamp; - detection by contact with X-ray film, digital bio- and autoradiography, and even
quantitative assay by use of enzymes is possible;
www.intechopen.com

Pesticides in the Modern World – Trends in Pesticides Analysis
284
- TLC plates can be documented by videoscans or photographs; - planar chromatography combined with modern videoscanning and densitometry
enables quantitative analysis; - planar chromatography coupled with densitometry enables detection of the spots or
zones through scanning of the chromatograms with UV-Vis light in the transmission, reflectance, or fluorescence mode;
- with multi-wavelength scanning of the chromatograms, spectral data of the analytes can be directly acquired from the TLC plates and can further be compared with the spectra of the analytes from software library;
- additional information for structural elucidation can be obtained by planar chromatography combined with MS (fast atom bombardment (FAB) and liquid secondary mass spectrometry (SIMS));
- the whole procedure of chromatographic development can be followed visually, so any distortion of the solvent front, etc., can be observed directly;
- the chromatogram can be developed simply by dipping the plate into a mobile phase; - the possibility of two-dimensional development with a single adsorbent; - the possibility of two-dimensional development on e.g., silica – octadecyl silica coupled
layers (Multi-K SC5 and CS5 dual phase); - planar chromatography is also the easiest technique which performs multidimensional
separation (e.g., by graft chromatography or multidimensional chromatography). Summing up, planar chromatography is one of principal separation techniques, which plays an important role also in environmental analysis.
2.1.2 From one dimensional (1D-) planar chromatography by two-dimensional (2D-) planar chromatography to multidimensional planar chromatography Planar chromatography analysis of pesticides is especially suitable at sites where the
concentration of pesticides might be high, e.g., sites of dumping grounds of toxic substances;
after car or train accident during conveyance of pesticides and contamination of the
environment. The analysis of complex mixtures of pesticides can be simplified by
preliminary fractionation of the mixture into simpler mixtures by micropreparative
chromatography (Tuzimski and Soczewiński, 2004). The main purpose of preparative layer
chromatography is isolation of pure compounds from a mixture with maximal yield. Sample
application is one of the most important steps of a successful preparative separation. The
zonal application of the sample from the edge of the layer is preferable (Soczewiński and
Wawrzynowicz, 2000; Soczewiński 2001). Nyiredy (Nyiredy 2001; Nyiredy 2003) described
sample application and other characteristics of classical preparative layer chromatography,
overpressured layer chromatography, other special techniques, and trends in preparative
layer chromatography. Waksmundzka-Hajnos and colleagues (Waksmudzka-Hajnos and
Wawrzynowicz, 2002; Waksmudzka-Hajnos et al., 2002) described the strategy of
preparative separation in TLC. Dzido et al. (Dzido et al., 2002) also described the effect of
temperature on the separation of test solutes in preparative TLC. Guiochon and colleagues
(Guiochon, 2002; Felinger and Guiochon, 1998; Jandera et al., 1997; Gritti and Guiochon,
2003) described theory, instruments, and practical issues of preparative chromatography.
The separation of a certain target component from a multicomponent mixture using isocratic
preparative elution chromatography was also studied theoretically (Shan and Seidel-
Morgenstern, 2003).
www.intechopen.com
Determination of Pesticides in Complex Samples by One Dimensional (1D-), Two-Dimensional (2D-) and Multidimensional Chromatography
285
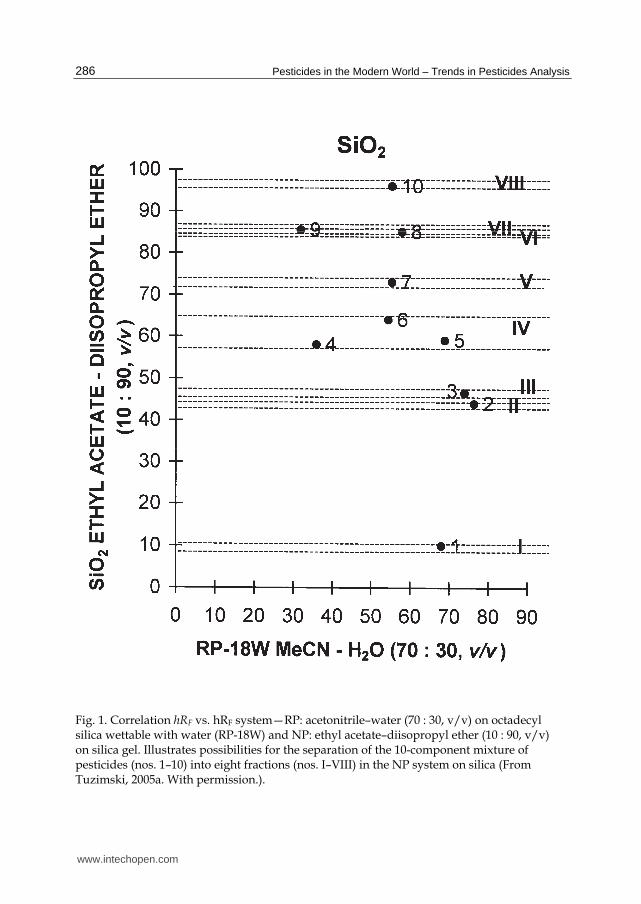
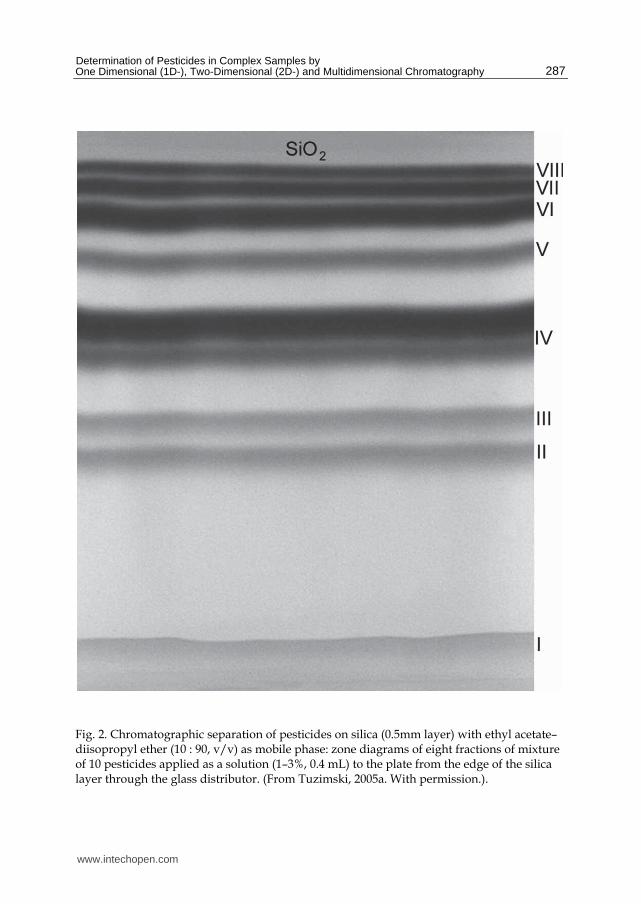
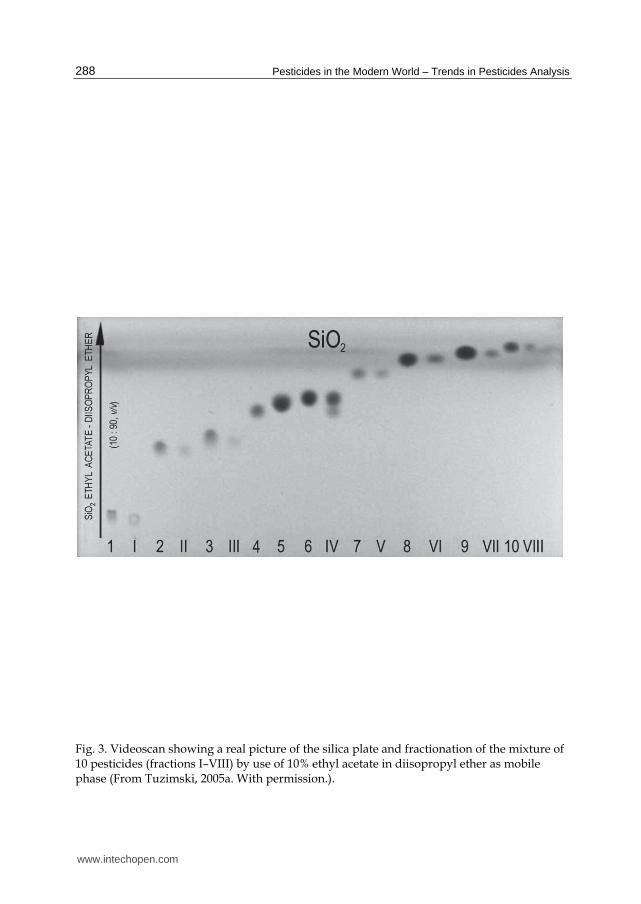
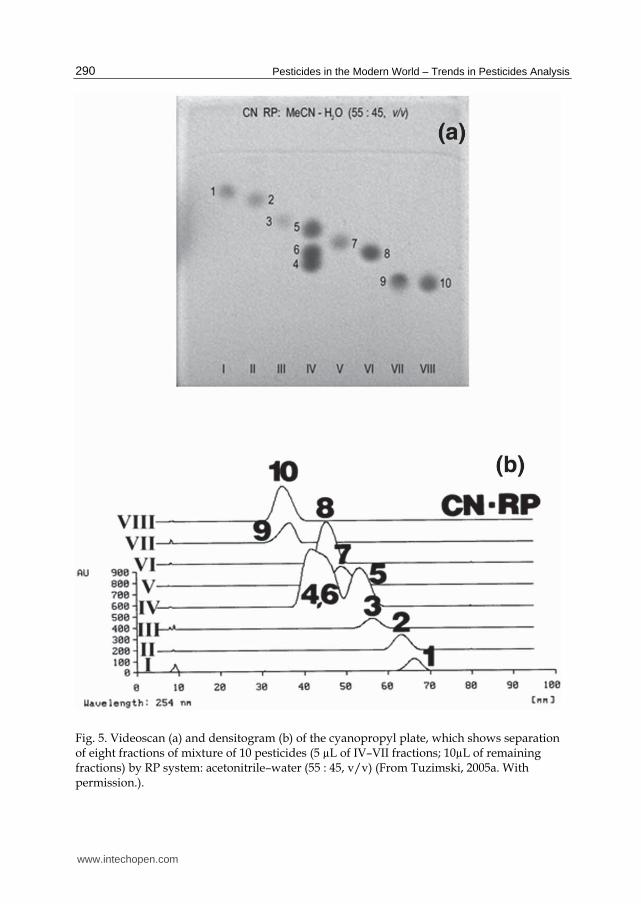
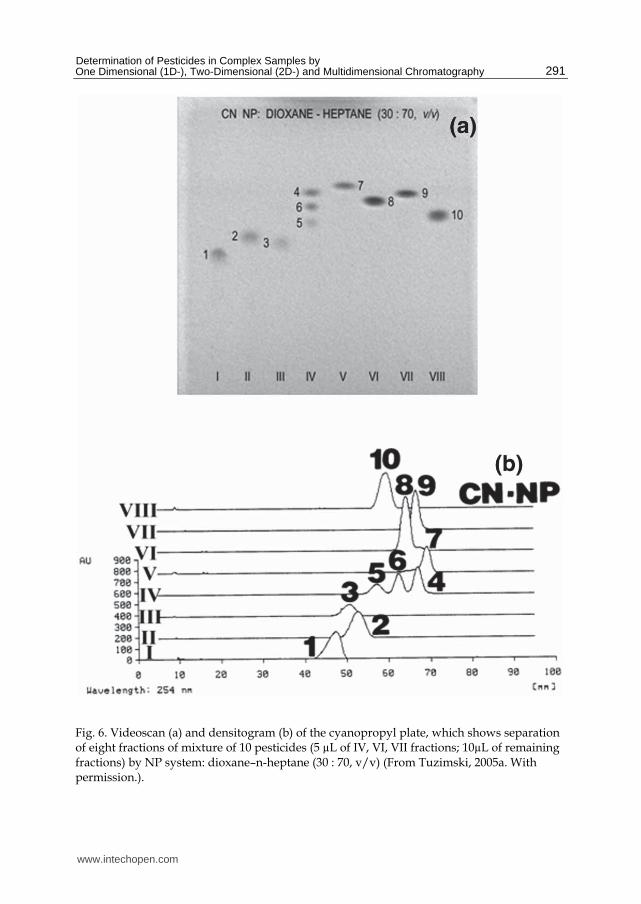
A good perspective of separation of compounds is obtained by use, in the second stage, systems of different selectivities compared with the first stage, e.g., NP system on silica in the first stage followed by a reversed-phase (RP) system on octadecyl silica adsorbent in the second stage [TLC or high performance liquid chromatography (HPLC)] or vice versa especially for samples with matrix rich in water. Also possible is the use of NP or RP systems with different retention mechanisms on hydrophilic modified stationary phases, e.g., cyanopropyl, aminopropyl, and diol. These phases have many other advantages—an extended range of selectivity, and graduated surface polarity, and show less influence of the vapour phase on retention behaviour and, therefore, have better reproducibility (Rabel, 2003). NP HPLC has also several advantages (Jandera, 2000): pressure drop across the column is lower in non-aqueous RP system than in aqueous RP system (because of lower viscosity of non-aqueous eluents); columns are usually more stable in non-aqueous solvents than in aqueous solvents; some samples are more soluble, or less prone, to decomposition in organic mobile phases. However, RP chromatography generally offers better selectivity for the separation of molecules with different sizes of their hydrocarbon part. Figure 1 illustrates possibilities for the separation of the 10-component mixture of pesticides (nos. 1–10) into fractions (nos. I–VIII) in the NP system, silica–ethyl acetate–diisopropyl ether (10 : 90, v/v) (Tuzimski, 2005a). A solution of the mixture of pesticides (1–3% of pesticides, 0.4 mL) was applied to the plate from the edge of the silica layer (0.5mm) through the glass distributor. The plate was developed with ethyl acetate–diisopropyl ether (10 : 90, v/v). Bands were visualised in UV light at Ǚ = 254 nm (Figure 2). Next, the zones were scraped from the plate, and the adsorbed fractions were isolated by elution with methanol. Each of the pesticide fractions (I–VIII) was applied on a silica gel 60 F254 HPTLC plate. In addition, standard substances were applied to the plates (1–10) and the plates developed to a distance of 9 cm with ethyl acetate–diisopropyl ether (10 : 90, v/v) as mobile phase. The real picture of the silica gel plate obtained by videoscanning (Figure 3) showed the separation of eight fractions of pesticides (Tuzimski, 2005a). The fractions were applied 0.5 cm from the edge on a RP-18W plate and developed with a RP aqueous eluent, acetonitrile–water (60 : 40, v/v) [Figure 4(a) and (b)]. It can be seen that the fractions are separated into single components. In the next series of experiments, the selectivity was investigated for cyanopropyl silica adsorbent. The cyanopropyl-bonded layer was developed with the RP system, acetonitrile–water (55 : 45, v/v). [Figure 5(a) and (b)] and with the NP system, dioxane–n-heptane (30 : 70, v/v) [Figure 6(a) and (b)]. It follows from Figure 6 that the selectivity of the CN/NP system is satisfactory for HPLC analysis on a CN column (Tuzimski, 2005a). The fractions (I–VIII) were also injected on a cyanopropyl column (LC–CN) and developed by NP eluents composed of dioxane and n–heptane (2 : 98, 3 : 97, and 5 : 95, v/v) (Tuzimski, 2005a). The fractions were also separated on a octadecyl silica column (LC-18) and analysed by the RP system with acetonitrile–water (70 : 30, v/v). The data of Table 1 (Tuzimski, 2005a) showed larger RS values for the majority of a set of pesticides of the I–VIII fractions in acetonitrile–water system on an LC-18 column, than nonaqueous system on an LC–CN column. The more sensitive HPLC analysis shows that some peaks are accompanied by small peaks of neighbouring compounds, e.g., in the fraction II: peak of metazachlor (no. 2) is accompanied by a small peak of neighbouring triadimefon (no. 3). The values of RS of the pair were 0.78 and 2.78, respectively, on SupelcosilTM LC–CN and SupelcosilTM LC-18 columns. These values indicate successful resolution of the compounds in the acetonitrile–
www.intechopen.com
Pesticides in the Modern World – Trends in Pesticides Analysis
286
Fig. 1. Correlation hRF vs. hRF system—RP: acetonitrile–water (70 : 30, v/v) on octadecyl silica wettable with water (RP-18W) and NP: ethyl acetate–diisopropyl ether (10 : 90, v/v) on silica gel. Illustrates possibilities for the separation of the 10-component mixture of pesticides (nos. 1–10) into eight fractions (nos. I–VIII) in the NP system on silica (From Tuzimski, 2005a. With permission.).
www.intechopen.com
Determination of Pesticides in Complex Samples by One Dimensional (1D-), Two-Dimensional (2D-) and Multidimensional Chromatography
287
Fig. 2. Chromatographic separation of pesticides on silica (0.5mm layer) with ethyl acetate–diisopropyl ether (10 : 90, v/v) as mobile phase: zone diagrams of eight fractions of mixture of 10 pesticides applied as a solution (1–3%, 0.4 mL) to the plate from the edge of the silica layer through the glass distributor. (From Tuzimski, 2005a. With permission.).
www.intechopen.com
Pesticides in the Modern World – Trends in Pesticides Analysis
288
Fig. 3. Videoscan showing a real picture of the silica plate and fractionation of the mixture of 10 pesticides (fractions I–VIII) by use of 10% ethyl acetate in diisopropyl ether as mobile phase (From Tuzimski, 2005a. With permission.).
www.intechopen.com

Determination of Pesticides in Complex Samples by One Dimensional (1D-), Two-Dimensional (2D-) and Multidimensional Chromatography
289
Fig. 4. Videoscan (a) and densitogram (b) of the RP-18W plate, which shows separation of eight fractions of mixture of 10 pesticides (5 µL of each fraction) by RP system: acetonitrile–water (60 : 40, v/v) (From Tuzimski, 2005a. With permission.).
www.intechopen.com
Pesticides in the Modern World – Trends in Pesticides Analysis
290
Fig. 5. Videoscan (a) and densitogram (b) of the cyanopropyl plate, which shows separation of eight fractions of mixture of 10 pesticides (5 µL of IV–VII fractions; 10µL of remaining fractions) by RP system: acetonitrile–water (55 : 45, v/v) (From Tuzimski, 2005a. With permission.).
www.intechopen.com
Determination of Pesticides in Complex Samples by One Dimensional (1D-), Two-Dimensional (2D-) and Multidimensional Chromatography
291
Fig. 6. Videoscan (a) and densitogram (b) of the cyanopropyl plate, which shows separation of eight fractions of mixture of 10 pesticides (5 µL of IV, VI, VII fractions; 10µL of remaining fractions) by NP system: dioxane–n-heptane (30 : 70, v/v) (From Tuzimski, 2005a. With permission.).
www.intechopen.com

Pesticides in the Modern World – Trends in Pesticides Analysis
292
water system on the octadecyl silica column. For the majority of the compounds, larger values of N were for the RP system on the LC-18 column, besides compounds (nos. 2, 3, 5). The solutions of some pesticides, during prolonged storage, development of chromatograms, elution and visualisation of bands in UV light, may decompose and can cause the appearance of additional peaks on their chromatograms. The correct identification and separation of the decomposition of the labile pesticides is possible.
SupelcosilTM LC-CN column
dioxane-n-heptane (2:98, v/v)
Fraction no. Pesticide No. tr N/m Rs
I 1 7.967 1,890 -
II 2 3
7.075 7.317
241,560 25,980
- 2.78
III 2 3
7.092 7.358
180,860 189,590
- 1.59
IV 4 6 5
3.245 5.408 7.075
22,880 31,830
165,880
- 11.64 3.91
V 7 8
3.800 4.183
35,310 26,940
- 2.97
VI 8 4.175 26,920 -
VII 9 4.275 41,060 -
VIII 10 6.308 46,080 -
SupelcosilTM LC-18 column
Acetonitrile-water (70:30, v/v)
Fraction no. Pesticide No. tr N/m Rs
I 1 2.650 12,940 -
II 2 3
2.558 3.083
31,370 26,980
- 2.78
III 3 5
3.067 3.400
24,070 26,830
- 1.59
IV 5 6 4
3.392 6.433 7.875
28,140 44,860 36,850
- 11.64 3.91
V 8 7
6.258 7.200
48,310 47,540
- 2.97
VI 8 6.250 46,480 -
VII 9 10.100 53,510 -
VIII 10 7.442 54,310 -
(From Tuzimski, 2005a. With permission).
Table 1. Data of HPLC analysis of the I-VIII fractions of 10-component mixture of pesticides on cyanopropyl LC-CN column and on octadecyl silica LC-18 column.
A good perspective of separation of all components of fractions was obtained by using systems of different selectivity in both stages, e.g., NP system on silica in first stage and RP
www.intechopen.com
Determination of Pesticides in Complex Samples by One Dimensional (1D-), Two-Dimensional (2D-) and Multidimensional Chromatography
293
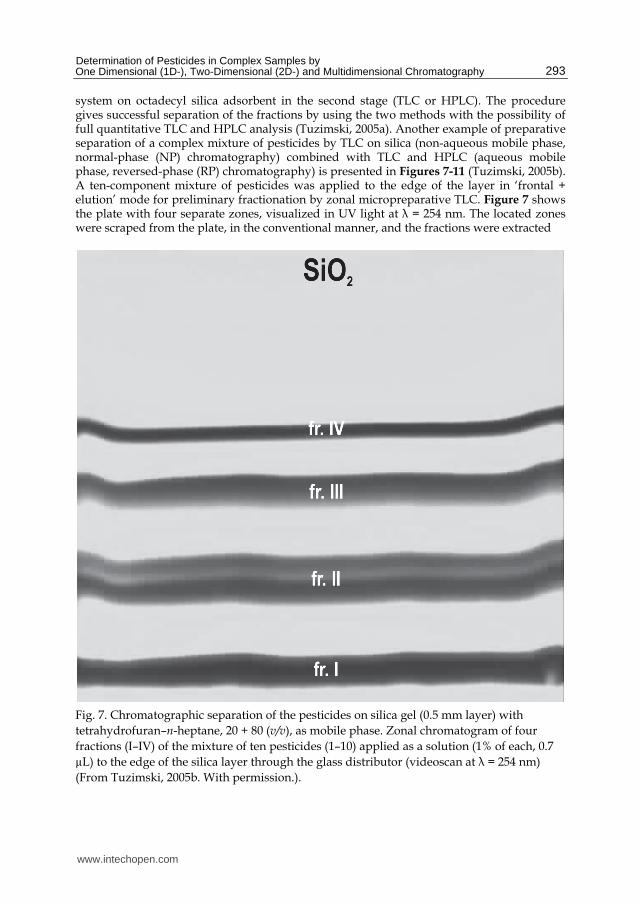
system on octadecyl silica adsorbent in the second stage (TLC or HPLC). The procedure gives successful separation of the fractions by using the two methods with the possibility of full quantitative TLC and HPLC analysis (Tuzimski, 2005a). Another example of preparative separation of a complex mixture of pesticides by TLC on silica (non-aqueous mobile phase, normal-phase (NP) chromatography) combined with TLC and HPLC (aqueous mobile phase, reversed-phase (RP) chromatography) is presented in Figures 7-11 (Tuzimski, 2005b). A ten-component mixture of pesticides was applied to the edge of the layer in ‘frontal + elution’ mode for preliminary fractionation by zonal micropreparative TLC. Figure 7 shows the plate with four separate zones, visualized in UV light at Ǚ = 254 nm. The located zones were scraped from the plate, in the conventional manner, and the fractions were extracted
Fig. 7. Chromatographic separation of the pesticides on silica gel (0.5 mm layer) with
tetrahydrofuran–n-heptane, 20 + 80 (v/v), as mobile phase. Zonal chromatogram of four
fractions (I–IV) of the mixture of ten pesticides (1–10) applied as a solution (1% of each, 0.7
µL) to the edge of the silica layer through the glass distributor (videoscan at Ǚ = 254 nm)
(From Tuzimski, 2005b. With permission.).
www.intechopen.com
Pesticides in the Modern World – Trends in Pesticides Analysis
294
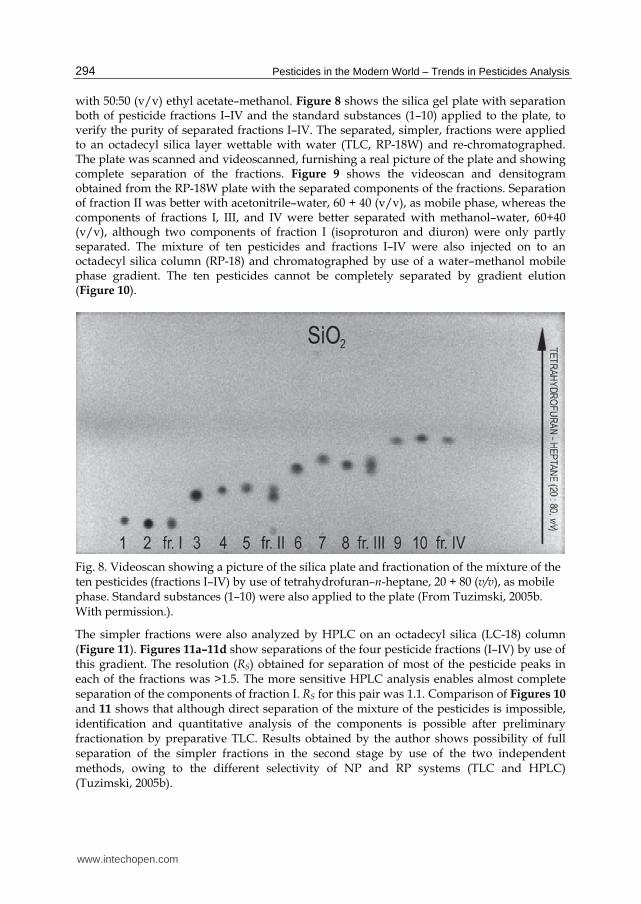
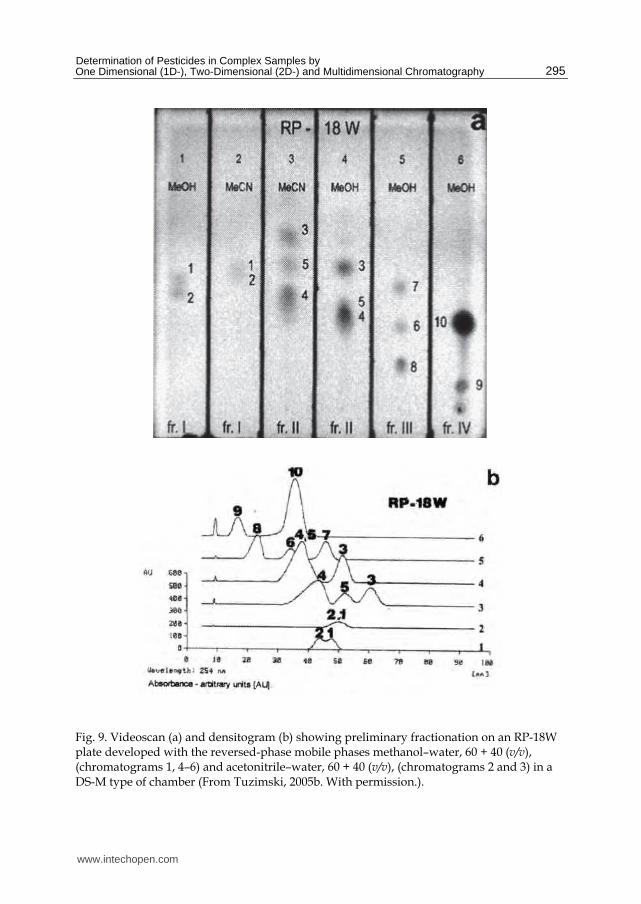
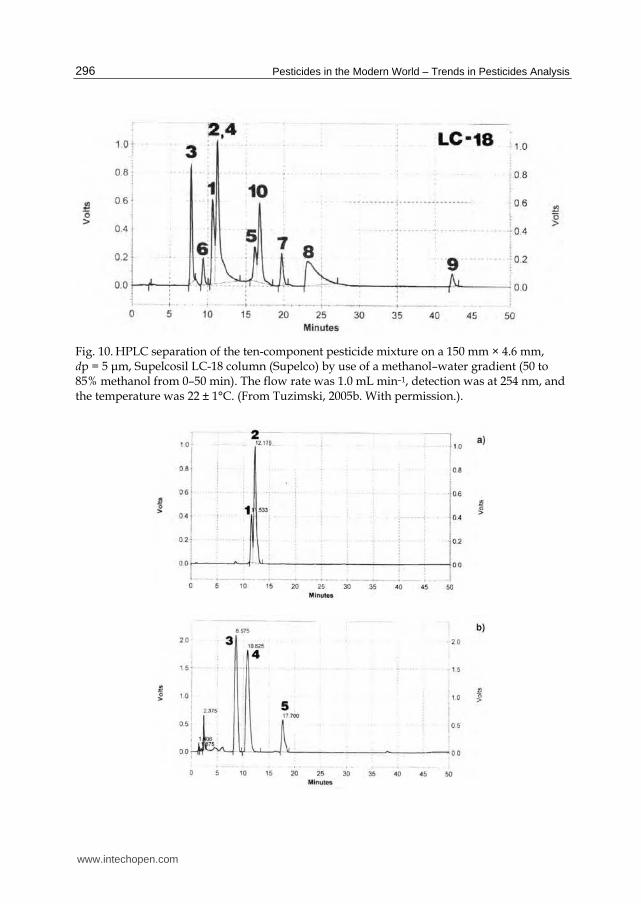
with 50:50 (v/v) ethyl acetate–methanol. Figure 8 shows the silica gel plate with separation both of pesticide fractions I–IV and the standard substances (1–10) applied to the plate, to verify the purity of separated fractions I–IV. The separated, simpler, fractions were applied to an octadecyl silica layer wettable with water (TLC, RP-18W) and re-chromatographed. The plate was scanned and videoscanned, furnishing a real picture of the plate and showing complete separation of the fractions. Figure 9 shows the videoscan and densitogram obtained from the RP-18W plate with the separated components of the fractions. Separation of fraction II was better with acetonitrile–water, 60 + 40 (v/v), as mobile phase, whereas the components of fractions I, III, and IV were better separated with methanol–water, 60+40 (v/v), although two components of fraction I (isoproturon and diuron) were only partly separated. The mixture of ten pesticides and fractions I–IV were also injected on to an octadecyl silica column (RP-18) and chromatographed by use of a water–methanol mobile phase gradient. The ten pesticides cannot be completely separated by gradient elution (Figure 10).
Fig. 8. Videoscan showing a picture of the silica plate and fractionation of the mixture of the ten pesticides (fractions I–IV) by use of tetrahydrofuran–n-heptane, 20 + 80 (v/v), as mobile phase. Standard substances (1–10) were also applied to the plate (From Tuzimski, 2005b. With permission.).
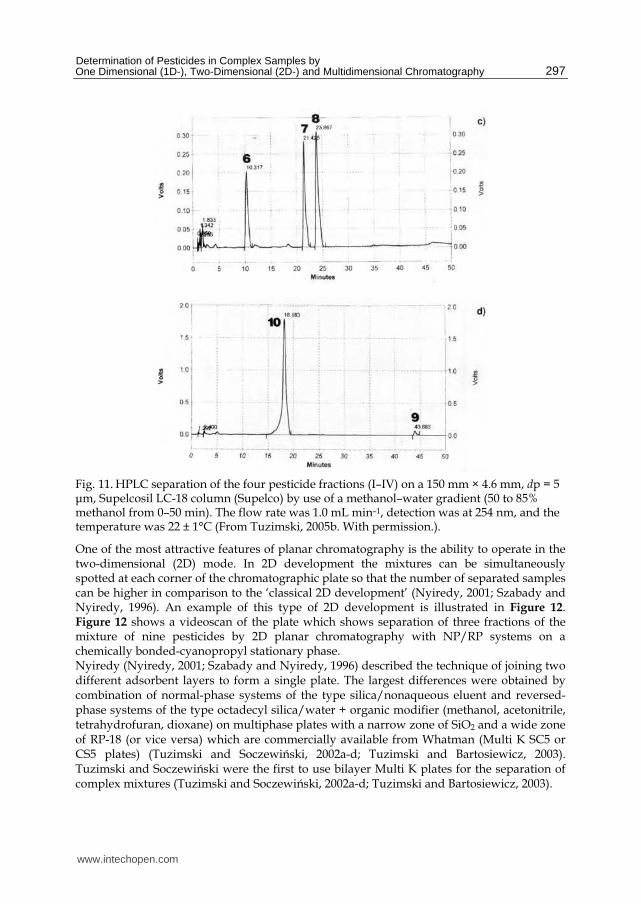
The simpler fractions were also analyzed by HPLC on an octadecyl silica (LC-18) column (Figure 11). Figures 11a–11d show separations of the four pesticide fractions (I–IV) by use of this gradient. The resolution (RS) obtained for separation of most of the pesticide peaks in each of the fractions was >1.5. The more sensitive HPLC analysis enables almost complete separation of the components of fraction I. RS for this pair was 1.1. Comparison of Figures 10 and 11 shows that although direct separation of the mixture of the pesticides is impossible, identification and quantitative analysis of the components is possible after preliminary fractionation by preparative TLC. Results obtained by the author shows possibility of full separation of the simpler fractions in the second stage by use of the two independent methods, owing to the different selectivity of NP and RP systems (TLC and HPLC) (Tuzimski, 2005b).
www.intechopen.com
Determination of Pesticides in Complex Samples by One Dimensional (1D-), Two-Dimensional (2D-) and Multidimensional Chromatography
295
Fig. 9. Videoscan (a) and densitogram (b) showing preliminary fractionation on an RP-18W plate developed with the reversed-phase mobile phases methanol–water, 60 + 40 (v/v), (chromatograms 1, 4–6) and acetonitrile–water, 60 + 40 (v/v), (chromatograms 2 and 3) in a DS-M type of chamber (From Tuzimski, 2005b. With permission.).
www.intechopen.com
Pesticides in the Modern World – Trends in Pesticides Analysis
296
Fig. 10. HPLC separation of the ten-component pesticide mixture on a 150 mm × 4.6 mm, dp = 5 ǚm, Supelcosil LC-18 column (Supelco) by use of a methanol–water gradient (50 to 85% methanol from 0–50 min). The flow rate was 1.0 mL min–1, detection was at 254 nm, and the temperature was 22 ± 1°C. (From Tuzimski, 2005b. With permission.).
www.intechopen.com
Determination of Pesticides in Complex Samples by One Dimensional (1D-), Two-Dimensional (2D-) and Multidimensional Chromatography
297
Fig. 11. HPLC separation of the four pesticide fractions (I–IV) on a 150 mm × 4.6 mm, dp = 5 ǚm, Supelcosil LC-18 column (Supelco) by use of a methanol–water gradient (50 to 85% methanol from 0–50 min). The flow rate was 1.0 mL min–1, detection was at 254 nm, and the temperature was 22 ± 1°C (From Tuzimski, 2005b. With permission.).
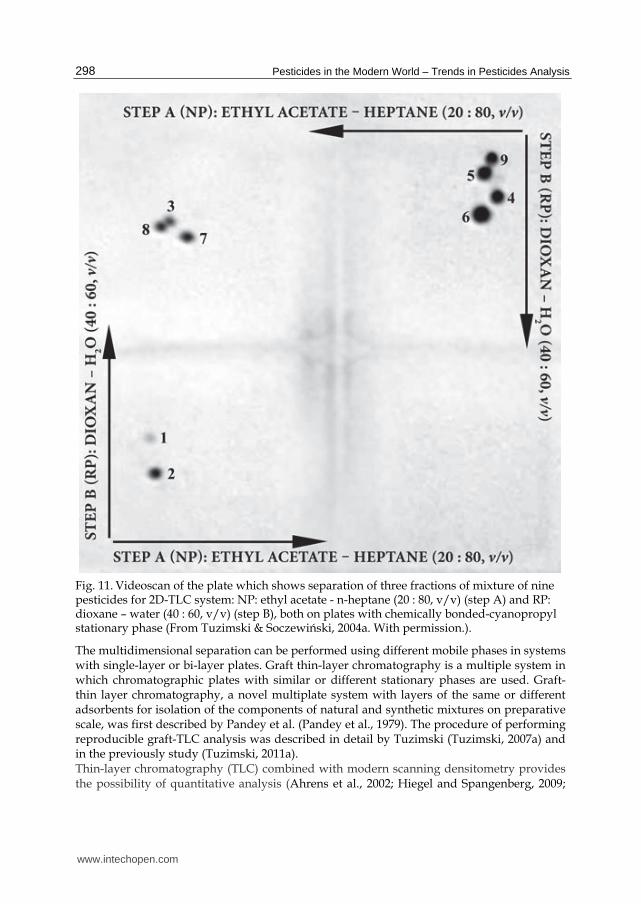
One of the most attractive features of planar chromatography is the ability to operate in the two-dimensional (2D) mode. In 2D development the mixtures can be simultaneously spotted at each corner of the chromatographic plate so that the number of separated samples can be higher in comparison to the ‘classical 2D development’ (Nyiredy, 2001; Szabady and Nyiredy, 1996). An example of this type of 2D development is illustrated in Figure 12. Figure 12 shows a videoscan of the plate which shows separation of three fractions of the mixture of nine pesticides by 2D planar chromatography with NP/RP systems on a chemically bonded-cyanopropyl stationary phase. Nyiredy (Nyiredy, 2001; Szabady and Nyiredy, 1996) described the technique of joining two different adsorbent layers to form a single plate. The largest differences were obtained by combination of normal-phase systems of the type silica/nonaqueous eluent and reversed-phase systems of the type octadecyl silica/water + organic modifier (methanol, acetonitrile, tetrahydrofuran, dioxane) on multiphase plates with a narrow zone of SiO2 and a wide zone of RP-18 (or vice versa) which are commercially available from Whatman (Multi K SC5 or CS5 plates) (Tuzimski and Soczewiński, 2002a-d; Tuzimski and Bartosiewicz, 2003). Tuzimski and Soczewiński were the first to use bilayer Multi K plates for the separation of complex mixtures (Tuzimski and Soczewiński, 2002a-d; Tuzimski and Bartosiewicz, 2003).
www.intechopen.com
Pesticides in the Modern World – Trends in Pesticides Analysis
298
Fig. 11. Videoscan of the plate which shows separation of three fractions of mixture of nine pesticides for 2D-TLC system: NP: ethyl acetate - n-heptane (20 : 80, v/v) (step A) and RP: dioxane – water (40 : 60, v/v) (step B), both on plates with chemically bonded-cyanopropyl stationary phase (From Tuzimski & Soczewiński, 2004a. With permission.).
The multidimensional separation can be performed using different mobile phases in systems with single-layer or bi-layer plates. Graft thin-layer chromatography is a multiple system in which chromatographic plates with similar or different stationary phases are used. Graft-thin layer chromatography, a novel multiplate system with layers of the same or different adsorbents for isolation of the components of natural and synthetic mixtures on preparative scale, was first described by Pandey et al. (Pandey et al., 1979). The procedure of performing reproducible graft-TLC analysis was described in detail by Tuzimski (Tuzimski, 2007a) and in the previously study (Tuzimski, 2011a). Thin-layer chromatography (TLC) combined with modern scanning densitometry provides the possibility of quantitative analysis (Ahrens et al., 2002; Hiegel and Spangenberg, 2009;
www.intechopen.com
Determination of Pesticides in Complex Samples by One Dimensional (1D-), Two-Dimensional (2D-) and Multidimensional Chromatography
299
Spangenberg and Klein, 2000; Spangenberg and Klein, 2001; Spangenberg et al., 2003; Spangenberg, 2006; Tuzimski, 2010a; Tuzimski, 2011a). The method offers a simple and economical alternative to other chromatographic techniques, especially column high-performance liquid chromatography (HPLC). Application of modern fiber optic TLC scanner with a diode array detector (DAD) has several advantages (Ahrens et al., 2002; Hiegel and Spangenberg, 2009; Spangenberg and Klein, 2000; Spangenberg and Klein, 2001; Spangenberg et al., 2003; Spangenberg, 2006; Tuzimski, 2010a; Tuzimski, 2011a) e.g., the scanner can measure TLC plates simultaneously at different wavelengths without destroying the plate surface and permits parallel recording of chromatograms and in situ UV spectra in the range 191-1033 nm; therefore, it is possible to obtain doubly credible correct identification of the compounds on a chromatogram. The TLC scanner permits analysis of each compound at its optimum wavelength, thus offering optimum sensitivity for detection of each component. The TLC-DAD scanner permits measurement of a three-
dimensional chromatogram, A = f(λ, t), with absorbance as a function of wavelength and migration distance. The TLC-DAD scanner can compare parallel UV spectra of an unknown compound and a standard from the library of spectra. Software is available that allows the user access to all common parameters used in HPLC-DAD: peak purity, resolution, identification via spectral library match, etc. The TLC-DAD scanner is especially useful for correct identification of components of difficult, complicated mixtures, such as in plant extract and toxicological analysis.
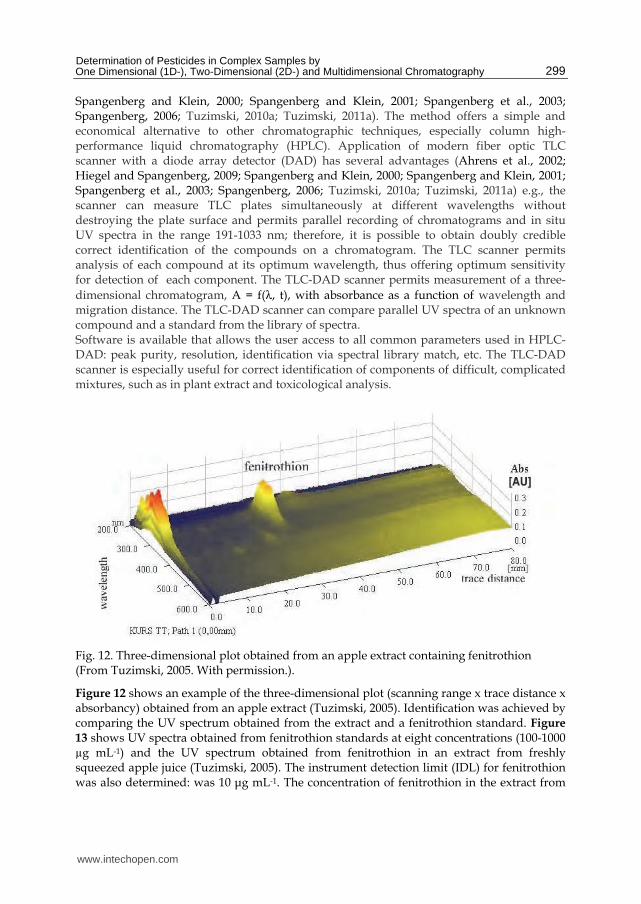
Fig. 12. Three-dimensional plot obtained from an apple extract containing fenitrothion (From Tuzimski, 2005. With permission.).
Figure 12 shows an example of the three-dimensional plot (scanning range x trace distance x absorbancy) obtained from an apple extract (Tuzimski, 2005). Identification was achieved by comparing the UV spectrum obtained from the extract and a fenitrothion standard. Figure
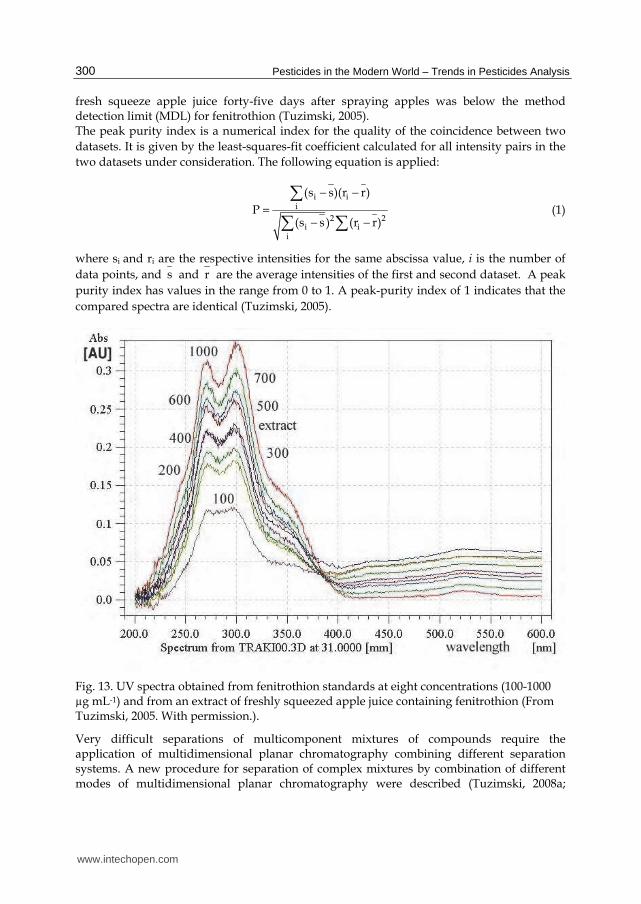
13 shows UV spectra obtained from fenitrothion standards at eight concentrations (100-1000 µg mL-1) and the UV spectrum obtained from fenitrothion in an extract from freshly squeezed apple juice (Tuzimski, 2005). The instrument detection limit (IDL) for fenitrothion was also determined: was 10 ǚg mL-1. The concentration of fenitrothion in the extract from
www.intechopen.com
Pesticides in the Modern World – Trends in Pesticides Analysis
300
fresh squeeze apple juice forty-five days after spraying apples was below the method detection limit (MDL) for fenitrothion (Tuzimski, 2005). The peak purity index is a numerical index for the quality of the coincidence between two
datasets. It is given by the least-squares-fit coefficient calculated for all intensity pairs in the
two datasets under consideration. The following equation is applied:
i i
i
2 2i i
i
(s s)(r r)
P(s s ) (r r)
− −
=
− −
(1)
where si and ri are the respective intensities for the same abscissa value, i is the number of
data points, and s and r are the average intensities of the first and second dataset. A peak
purity index has values in the range from 0 to 1. A peak-purity index of 1 indicates that the
compared spectra are identical (Tuzimski, 2005).
Fig. 13. UV spectra obtained from fenitrothion standards at eight concentrations (100-1000 µg mL-1) and from an extract of freshly squeezed apple juice containing fenitrothion (From Tuzimski, 2005. With permission.).
Very difficult separations of multicomponent mixtures of compounds require the application of multidimensional planar chromatography combining different separation systems. A new procedure for separation of complex mixtures by combination of different modes of multidimensional planar chromatography were described (Tuzimski, 2008a;
www.intechopen.com
Determination of Pesticides in Complex Samples by One Dimensional (1D-), Two-Dimensional (2D-) and Multidimensional Chromatography
301
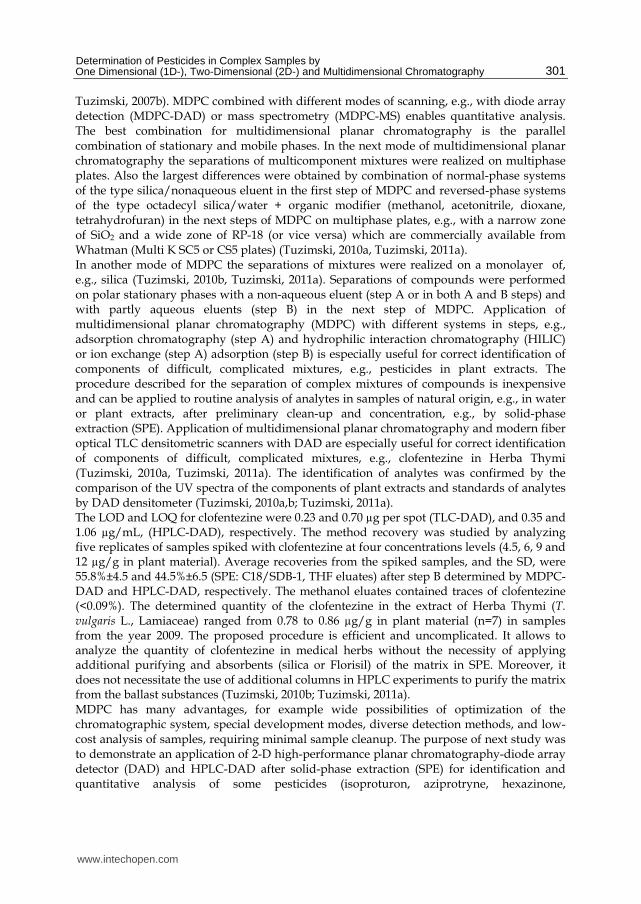
Tuzimski, 2007b). MDPC combined with different modes of scanning, e.g., with diode array detection (MDPC-DAD) or mass spectrometry (MDPC-MS) enables quantitative analysis. The best combination for multidimensional planar chromatography is the parallel combination of stationary and mobile phases. In the next mode of multidimensional planar chromatography the separations of multicomponent mixtures were realized on multiphase plates. Also the largest differences were obtained by combination of normal-phase systems of the type silica/nonaqueous eluent in the first step of MDPC and reversed-phase systems of the type octadecyl silica/water + organic modifier (methanol, acetonitrile, dioxane, tetrahydrofuran) in the next steps of MDPC on multiphase plates, e.g., with a narrow zone of SiO2 and a wide zone of RP-18 (or vice versa) which are commercially available from Whatman (Multi K SC5 or CS5 plates) (Tuzimski, 2010a, Tuzimski, 2011a). In another mode of MDPC the separations of mixtures were realized on a monolayer of, e.g., silica (Tuzimski, 2010b, Tuzimski, 2011a). Separations of compounds were performed on polar stationary phases with a non-aqueous eluent (step A or in both A and B steps) and with partly aqueous eluents (step B) in the next step of MDPC. Application of multidimensional planar chromatography (MDPC) with different systems in steps, e.g., adsorption chromatography (step A) and hydrophilic interaction chromatography (HILIC) or ion exchange (step A) adsorption (step B) is especially useful for correct identification of components of difficult, complicated mixtures, e.g., pesticides in plant extracts. The procedure described for the separation of complex mixtures of compounds is inexpensive and can be applied to routine analysis of analytes in samples of natural origin, e.g., in water or plant extracts, after preliminary clean-up and concentration, e.g., by solid-phase extraction (SPE). Application of multidimensional planar chromatography and modern fiber optical TLC densitometric scanners with DAD are especially useful for correct identification of components of difficult, complicated mixtures, e.g., clofentezine in Herba Thymi (Tuzimski, 2010a, Tuzimski, 2011a). The identification of analytes was confirmed by the comparison of the UV spectra of the components of plant extracts and standards of analytes by DAD densitometer (Tuzimski, 2010a,b; Tuzimski, 2011a). The LOD and LOQ for clofentezine were 0.23 and 0.70 µg per spot (TLC-DAD), and 0.35 and 1.06 µg/mL, (HPLC-DAD), respectively. The method recovery was studied by analyzing five replicates of samples spiked with clofentezine at four concentrations levels (4.5, 6, 9 and 12 µg/g in plant material). Average recoveries from the spiked samples, and the SD, were 55.8%±4.5 and 44.5%±6.5 (SPE: C18/SDB-1, THF eluates) after step B determined by MDPC-DAD and HPLC-DAD, respectively. The methanol eluates contained traces of clofentezine (<0.09%). The determined quantity of the clofentezine in the extract of Herba Thymi (T. vulgaris L., Lamiaceae) ranged from 0.78 to 0.86 µg/g in plant material (n=7) in samples from the year 2009. The proposed procedure is efficient and uncomplicated. It allows to analyze the quantity of clofentezine in medical herbs without the necessity of applying additional purifying and absorbents (silica or Florisil) of the matrix in SPE. Moreover, it does not necessitate the use of additional columns in HPLC experiments to purify the matrix from the ballast substances (Tuzimski, 2010b; Tuzimski, 2011a). MDPC has many advantages, for example wide possibilities of optimization of the chromatographic system, special development modes, diverse detection methods, and low-cost analysis of samples, requiring minimal sample cleanup. The purpose of next study was to demonstrate an application of 2-D high-performance planar chromatography-diode array detector (DAD) and HPLC-DAD after solid-phase extraction (SPE) for identification and quantitative analysis of some pesticides (isoproturon, aziprotryne, hexazinone,
www.intechopen.com
Pesticides in the Modern World – Trends in Pesticides Analysis
302
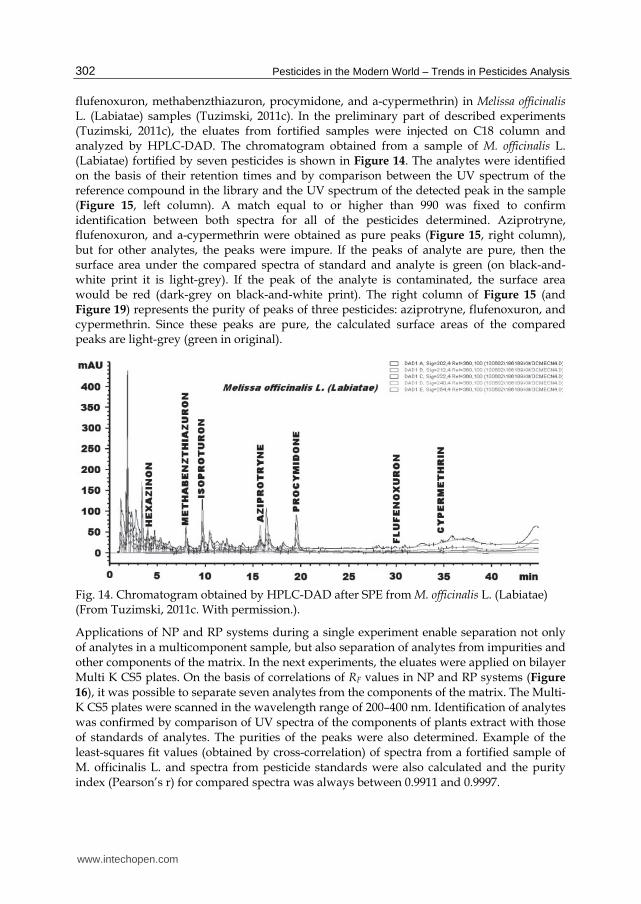
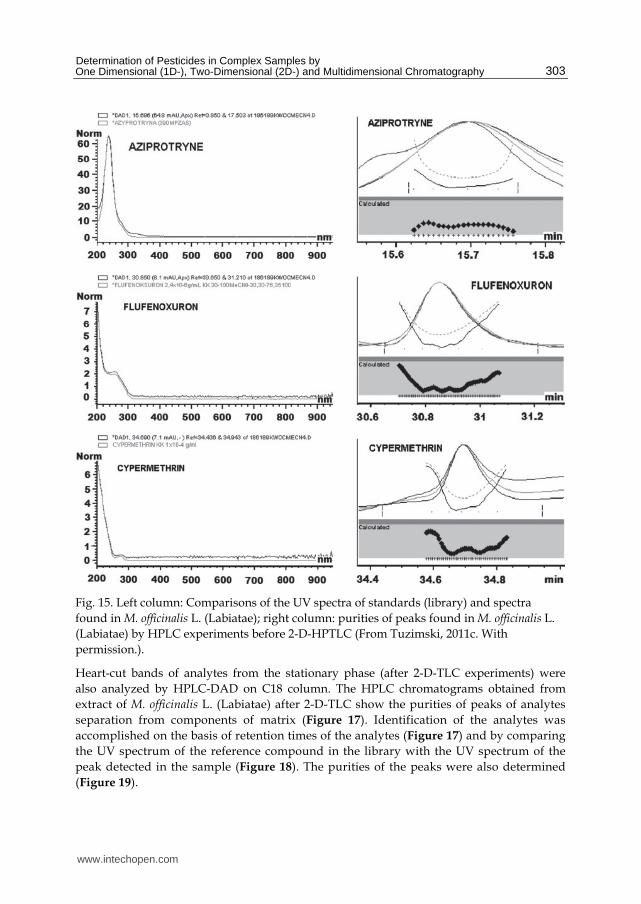
flufenoxuron, methabenzthiazuron, procymidone, and a-cypermethrin) in Melissa officinalis L. (Labiatae) samples (Tuzimski, 2011c). In the preliminary part of described experiments (Tuzimski, 2011c), the eluates from fortified samples were injected on C18 column and analyzed by HPLC-DAD. The chromatogram obtained from a sample of M. officinalis L. (Labiatae) fortified by seven pesticides is shown in Figure 14. The analytes were identified on the basis of their retention times and by comparison between the UV spectrum of the reference compound in the library and the UV spectrum of the detected peak in the sample (Figure 15, left column). A match equal to or higher than 990 was fixed to confirm identification between both spectra for all of the pesticides determined. Aziprotryne, flufenoxuron, and a-cypermethrin were obtained as pure peaks (Figure 15, right column), but for other analytes, the peaks were impure. If the peaks of analyte are pure, then the surface area under the compared spectra of standard and analyte is green (on black-and-white print it is light-grey). If the peak of the analyte is contaminated, the surface area would be red (dark-grey on black-and-white print). The right column of Figure 15 (and Figure 19) represents the purity of peaks of three pesticides: aziprotryne, flufenoxuron, and cypermethrin. Since these peaks are pure, the calculated surface areas of the compared peaks are light-grey (green in original).
Fig. 14. Chromatogram obtained by HPLC-DAD after SPE from M. officinalis L. (Labiatae)
(From Tuzimski, 2011c. With permission.).
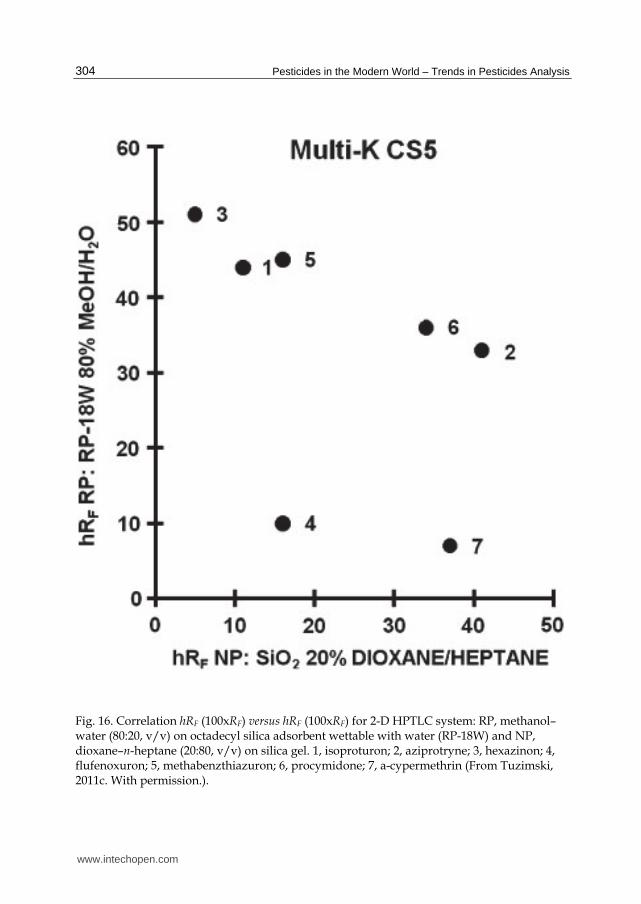
Applications of NP and RP systems during a single experiment enable separation not only of analytes in a multicomponent sample, but also separation of analytes from impurities and other components of the matrix. In the next experiments, the eluates were applied on bilayer Multi K CS5 plates. On the basis of correlations of RF values in NP and RP systems (Figure
16), it was possible to separate seven analytes from the components of the matrix. The Multi-K CS5 plates were scanned in the wavelength range of 200–400 nm. Identification of analytes was confirmed by comparison of UV spectra of the components of plants extract with those of standards of analytes. The purities of the peaks were also determined. Example of the least-squares fit values (obtained by cross-correlation) of spectra from a fortified sample of M. officinalis L. and spectra from pesticide standards were also calculated and the purity index (Pearson’s r) for compared spectra was always between 0.9911 and 0.9997.
www.intechopen.com
Determination of Pesticides in Complex Samples by One Dimensional (1D-), Two-Dimensional (2D-) and Multidimensional Chromatography
303
Fig. 15. Left column: Comparisons of the UV spectra of standards (library) and spectra
found in M. officinalis L. (Labiatae); right column: purities of peaks found in M. officinalis L.
(Labiatae) by HPLC experiments before 2-D-HPTLC (From Tuzimski, 2011c. With
permission.).
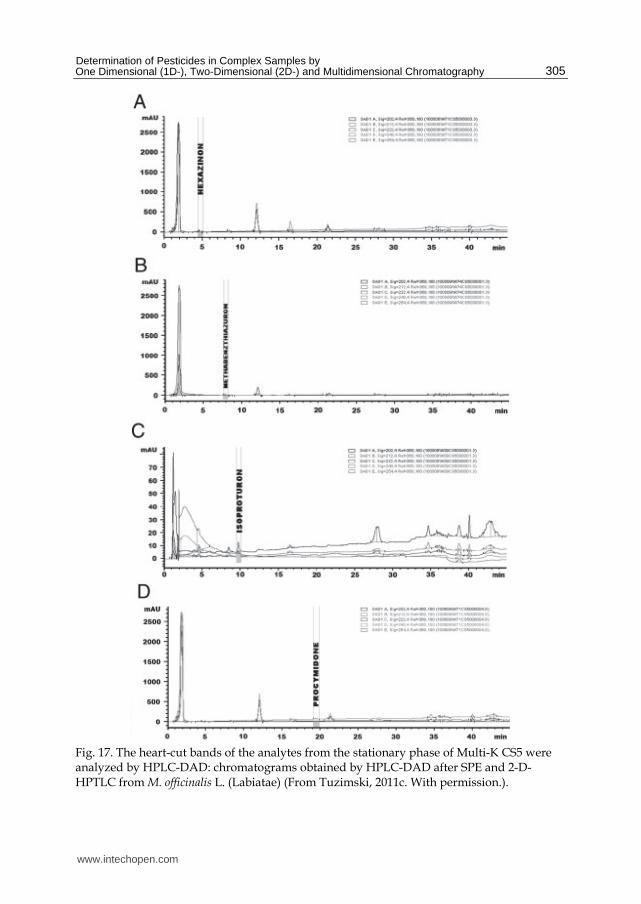
Heart-cut bands of analytes from the stationary phase (after 2-D-TLC experiments) were
also analyzed by HPLC-DAD on C18 column. The HPLC chromatograms obtained from
extract of M. officinalis L. (Labiatae) after 2-D-TLC show the purities of peaks of analytes
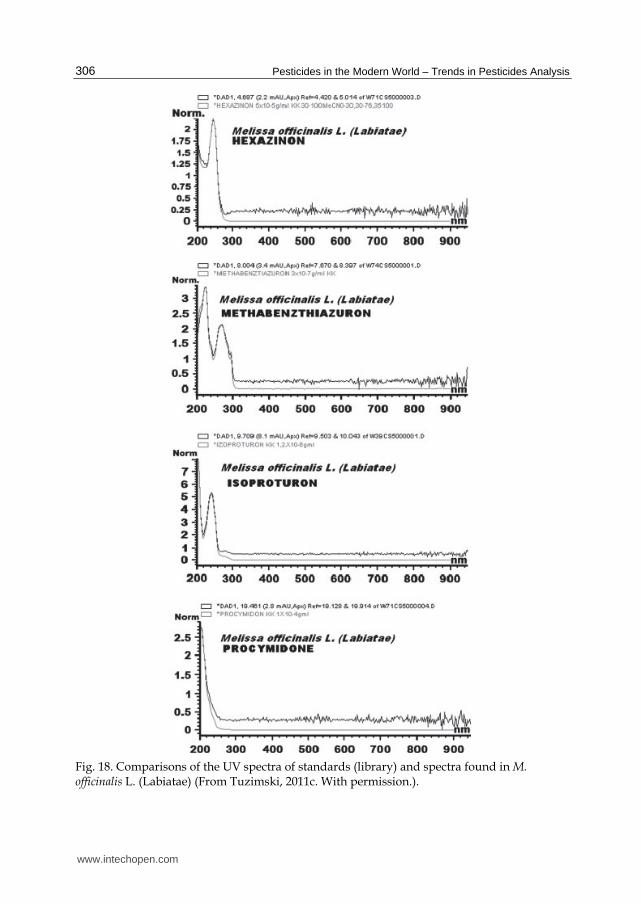
separation from components of matrix (Figure 17). Identification of the analytes was
accomplished on the basis of retention times of the analytes (Figure 17) and by comparing
the UV spectrum of the reference compound in the library with the UV spectrum of the
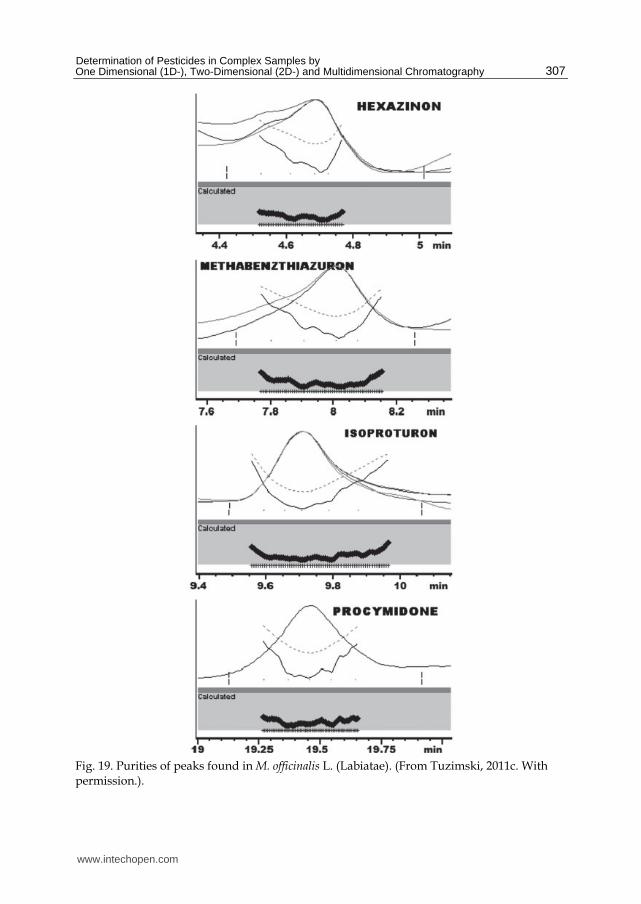
peak detected in the sample (Figure 18). The purities of the peaks were also determined
(Figure 19).
www.intechopen.com
Pesticides in the Modern World – Trends in Pesticides Analysis
304
Fig. 16. Correlation hRF (100xRF) versus hRF (100xRF) for 2-D HPTLC system: RP, methanol–water (80:20, v/v) on octadecyl silica adsorbent wettable with water (RP-18W) and NP, dioxane–n-heptane (20:80, v/v) on silica gel. 1, isoproturon; 2, aziprotryne; 3, hexazinon; 4, flufenoxuron; 5, methabenzthiazuron; 6, procymidone; 7, a-cypermethrin (From Tuzimski, 2011c. With permission.).
www.intechopen.com
Determination of Pesticides in Complex Samples by One Dimensional (1D-), Two-Dimensional (2D-) and Multidimensional Chromatography
305
Fig. 17. The heart-cut bands of the analytes from the stationary phase of Multi-K CS5 were analyzed by HPLC-DAD: chromatograms obtained by HPLC-DAD after SPE and 2-D-HPTLC from M. officinalis L. (Labiatae) (From Tuzimski, 2011c. With permission.).
www.intechopen.com
Pesticides in the Modern World – Trends in Pesticides Analysis
306
Fig. 18. Comparisons of the UV spectra of standards (library) and spectra found in M. officinalis L. (Labiatae) (From Tuzimski, 2011c. With permission.).
www.intechopen.com
Determination of Pesticides in Complex Samples by One Dimensional (1D-), Two-Dimensional (2D-) and Multidimensional Chromatography
307
Fig. 19. Purities of peaks found in M. officinalis L. (Labiatae). (From Tuzimski, 2011c. With permission.).
www.intechopen.com

Pesticides in the Modern World – Trends in Pesticides Analysis
308
The proposed procedure was proved correct for spiked samples with seven pesticides at concentration levels equal to 10 µg/g in plant material after 1, 5, and 11 days. The method characterized good reproducibility. Application of both chromatographic techniques with different systems, e.g. NP and RP (in both steps of 2-D-TLC-DAD on the bilayer Multi-K CS5 plates) and RP (HPLC-DAD) can be useful for correct identification of pesticides in complicated mixtures and separation of analytes from the components of the matrix. Thanks to 2-D-TLC experiments, it is possible to obtain pure peaks of almost all pesticides investigated and acceptable values of recoveries of analytes (except for very nonpolar pesticides, e.g. pyrethroids, benzoylphenylurea chitin synthesis inhibitors) (Tuzimski, 2011c).
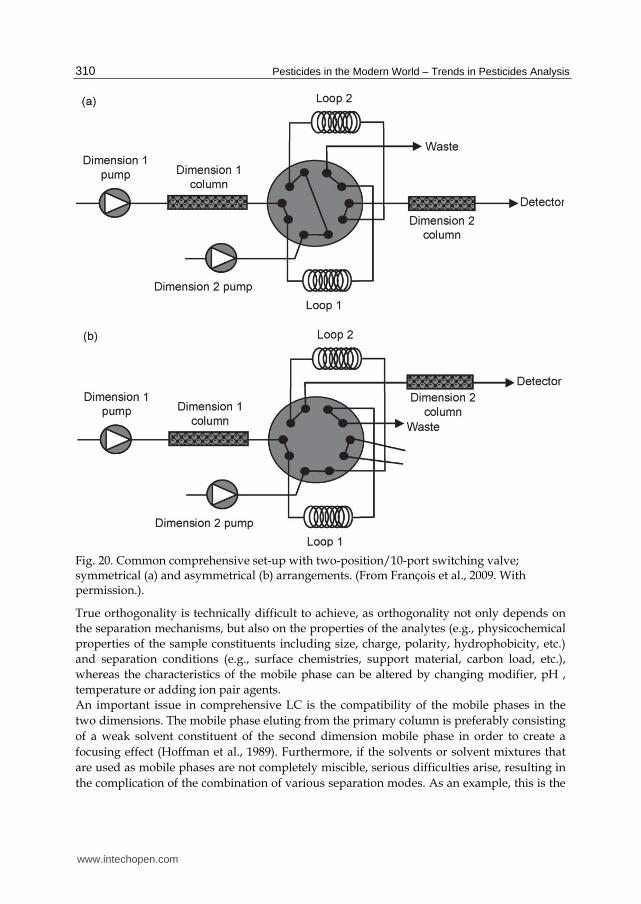
2.2 Liquid chromatography In the last past decade high performance liquid chromatography has emerged as a technique for the separation of complex environmental samples because of its outstanding chromatographic resolving power, the possibilities to automate the analysis and its compatibility with mass-spectrometric detection using electrospray interfacing (ES-MS). Mutiresidue analysis of 95 pesticides at low nanogram/liter levels in surface waters by HPLC with mass spectrometry was described (Jasson and Kreuger, 2010). Analysis of pesticide residues in apples based on QuEChERs (quick, easy, cheap, effective, rugged and safe) was described by Stevens et al. (Zhao, 2009). The maximum peak capacity obtained in one-dimensional (1D) liquid chromatography is mainly determined by the column technology such as column length and particle size, and also the duration of the gradient (Eeltink et al., 2009). The maximum allowable column length is determined by the permeability of the chromatographic bed and the maximum pressure drop of the HPLC instrumentation (Poppe, 1997; Desmet et al., 2009). 1D-LC allows the separation of hundreds of analytes. The excellent power of the multidimensional separation approaches have potential to separate thousands of analytes (Stoll et al., 2007). Dependent on the way transfers from the primary column effluent to the second dimension column are established, distinctions should be made for 2D-LC separations between either off- or on-line 2D-LC. Off-line 2D-LC is propably the most applied 2D-LC approach, since the execution is very simple. Fractions of the first dimension effluent are collected (manually or via fraction collector), after which they are concentrated if necessary and re-injected on the secondary column (François et al., 2009). On-line 2D-LC can be divided into heart-cutting and comprehensive liquid chromatography, abbreviated as LC-LC and LC x LC, respectively (Schoenmakers et al., 2003). Off-line 2D-LC (or LC x LC) offers the most flexibility in terms of separation modes and LC conditions, because matching eluents, flow-rates and transfer volumes are less critical than in on-line 2D-LC (Kohne and Welsch, 1999). However, off-line 2D-LC allows re-analysis of samples when partial injection of the fractions is applied. Schoenmakers et al. (Schoenmakers et al., 2003) defined the criteria of a comprehensive separation based on postulates earlier reported by Giddings (Giddings, 1990): subjection of the entire sample to two different separations, separation and detection of equal percentages of all sample components and the preservation of the separation obtained in the first dimension (François et al., 2009). A typical comprehensive 2D-LC system consists of two pumps, two columns, injector, interface and detector. An excellent review of method development and instrumentation used in comprehensive liquid chromatography was described by Sandra et al. (François et al., 2009). A typical example of an LC x LC set-up is shown in Figure 20. The interface is the key component in all LC x LC systems, since it
www.intechopen.com
Determination of Pesticides in Complex Samples by One Dimensional (1D-), Two-Dimensional (2D-) and Multidimensional Chromatography
309
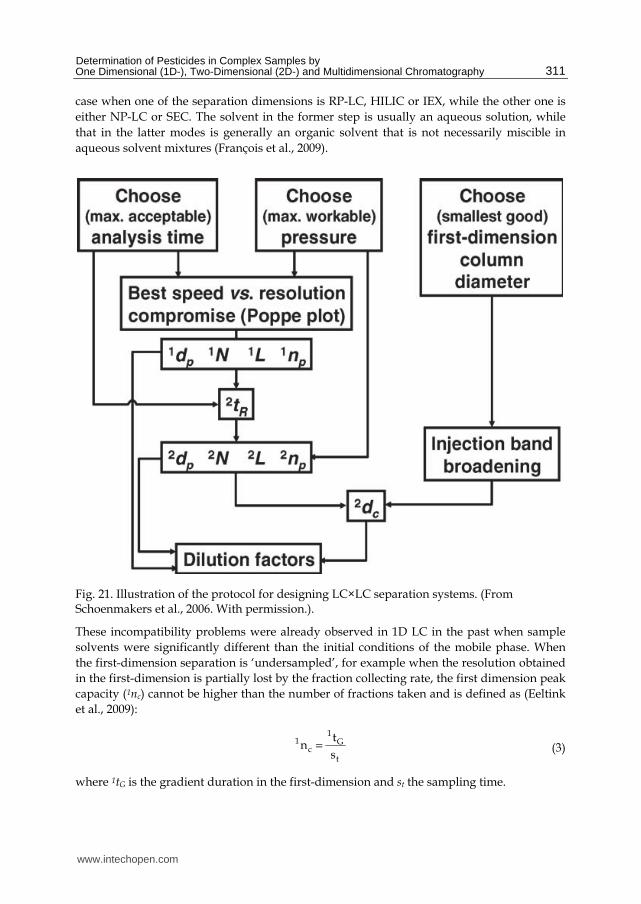
enables the continuous transfer of the primary column effluent to the second dimension (François et al., 2009). Schoenmakers et al. (Schoenmakers et al., 2006) published a paper in
which a protocol was proposed for establishing suitable column dimensions (length and diameters), particle sizes, flow rates, and second dimension injection volumes (i.e. loop sizes) in comprehensive two-dimensional liquid chromatography (LC×LC). The chromatographer should select the maximum allowable first-dimension retention time, which is approximately equal to the overall analysis time. Also, (s)he should define the maximum allowable pressure in both dimensions and the (minimum) diameter of the first-dimension column. The proposed protocol provides design parameters corresponding to the ideal (theoretically optimal) conditions or to realistic practical conditions. The protocol also allowed us to study the implications of contemporary developments in LC, such as the use of high temperatures (implying reduced viscosities and increased diffusion coefficients), monolithic columns (implying smaller flow-resistance factors), and ultra-high-pressure LC (Schoenmakers et al., 2006). Monolithic columns can mainly be advantageous as first dimension columns in LC×LC. Because of their lower resistance to flow, long monolithic columns can be used to obtain high efficiencies (plate counts). Operating at the highest possible pressure is advantageous in either dimension (Schoenmakers et al., 2006). The use the full peak capacity offered by comprehensive LC x LC the separation mechanism used in the first dimension should be independent of the retention mechanism in the second-dimension separation and none of the separation achieved should be lost due to understanding (i.e., transferring too few fractions to the second-dimension column) (Eeltink et al., 2009). In the case, the maximum 2D-LC peak capacity (2Dnc) that can be obtained is:
2Dnc = 1nc x 2nc (2)
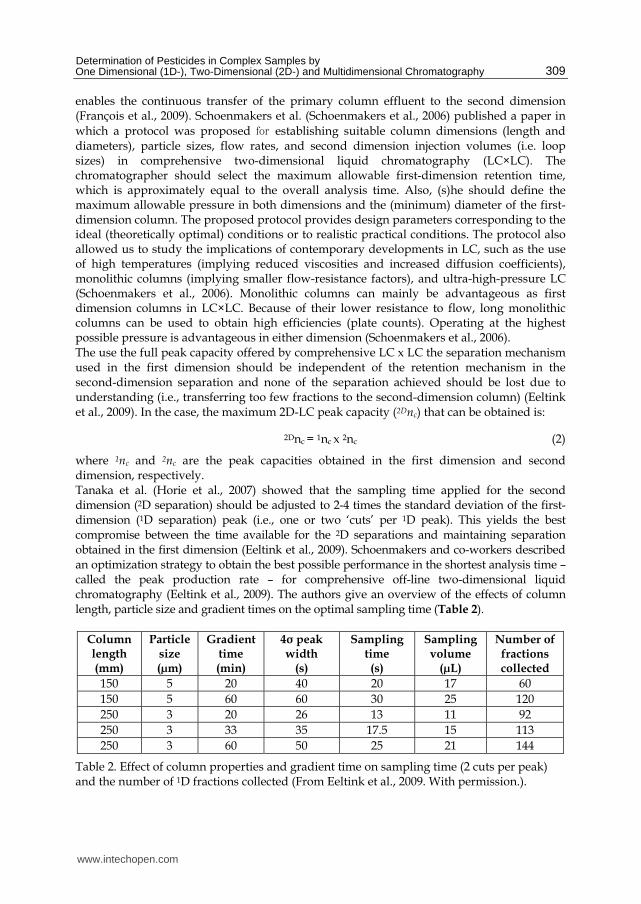
where 1nc and 2nc are the peak capacities obtained in the first dimension and second dimension, respectively. Tanaka et al. (Horie et al., 2007) showed that the sampling time applied for the second dimension (2D separation) should be adjusted to 2-4 times the standard deviation of the first-dimension (1D separation) peak (i.e., one or two ‘cuts’ per 1D peak). This yields the best compromise between the time available for the 2D separations and maintaining separation obtained in the first dimension (Eeltink et al., 2009). Schoenmakers and co-workers described an optimization strategy to obtain the best possible performance in the shortest analysis time – called the peak production rate – for comprehensive off-line two-dimensional liquid chromatography (Eeltink et al., 2009). The authors give an overview of the effects of column length, particle size and gradient times on the optimal sampling time (Table 2).
Column length (mm)
Particlesize (µm)
Gradient time (min)
4σ peak width
(s)
Sampling time (s)
Sampling volume
(µL)
Number of fractions collected
150 5 20 40 20 17 60
150 5 60 60 30 25 120
250 3 20 26 13 11 92
250 3 33 35 17.5 15 113
250 3 60 50 25 21 144
Table 2. Effect of column properties and gradient time on sampling time (2 cuts per peak) and the number of 1D fractions collected (From Eeltink et al., 2009. With permission.).
www.intechopen.com
Pesticides in the Modern World – Trends in Pesticides Analysis
310
Fig. 20. Common comprehensive set-up with two-position/10-port switching valve; symmetrical (a) and asymmetrical (b) arrangements. (From François et al., 2009. With permission.).
True orthogonality is technically difficult to achieve, as orthogonality not only depends on
the separation mechanisms, but also on the properties of the analytes (e.g., physicochemical
properties of the sample constituents including size, charge, polarity, hydrophobicity, etc.)
and separation conditions (e.g., surface chemistries, support material, carbon load, etc.),
whereas the characteristics of the mobile phase can be altered by changing modifier, pH ,
temperature or adding ion pair agents.
An important issue in comprehensive LC is the compatibility of the mobile phases in the
two dimensions. The mobile phase eluting from the primary column is preferably consisting
of a weak solvent constituent of the second dimension mobile phase in order to create a
focusing effect (Hoffman et al., 1989). Furthermore, if the solvents or solvent mixtures that
are used as mobile phases are not completely miscible, serious difficulties arise, resulting in
the complication of the combination of various separation modes. As an example, this is the
www.intechopen.com
Determination of Pesticides in Complex Samples by One Dimensional (1D-), Two-Dimensional (2D-) and Multidimensional Chromatography
311
case when one of the separation dimensions is RP-LC, HILIC or IEX, while the other one is
either NP-LC or SEC. The solvent in the former step is usually an aqueous solution, while
that in the latter modes is generally an organic solvent that is not necessarily miscible in
aqueous solvent mixtures (François et al., 2009).
Fig. 21. Illustration of the protocol for designing LC×LC separation systems. (From Schoenmakers et al., 2006. With permission.).
These incompatibility problems were already observed in 1D LC in the past when sample
solvents were significantly different than the initial conditions of the mobile phase. When
the first-dimension separation is ‘undersampled’, for example when the resolution obtained
in the first-dimension is partially lost by the fraction collecting rate, the first dimension peak
capacity (1nc) cannot be higher than the number of fractions taken and is defined as (Eeltink
et al., 2009):
11 G
ct
tn
s= (3)
where 1tG is the gradient duration in the first-dimension and st the sampling time.
www.intechopen.com

Pesticides in the Modern World – Trends in Pesticides Analysis
312
The peak capacity (2nc) (2D) in gradient-elution chromatography can be approximately
defined as (Eeltink et al., 2009):
2 22 G G
cR
t t Ln 1 1
W 4t H= + = + (4)
where 1tG is the gradient duration of the second-dimension reversed-phase gradient, W the
average peak width (which is approximately equal to four times the standard deviation, at
σ), L the column length, tR the retention time and H the plate height.
Details were described by Schoenmakers and co-workers (Eeltink et al., 2009). The
conclusions obtained by Schoenmakers and co-workers (Eeltink et al., 2009) indicates that
the highest peak production rate in 2D-LC mode was obtained when applying second-
dimension RP gradients of 20 min duration on a 150 mm long column packed with 3 µm
particles. The optimal 2D gradient time is strongly influenced by the column equilibrium
time. In the case when increasing column length, the equilibrium time also increases,
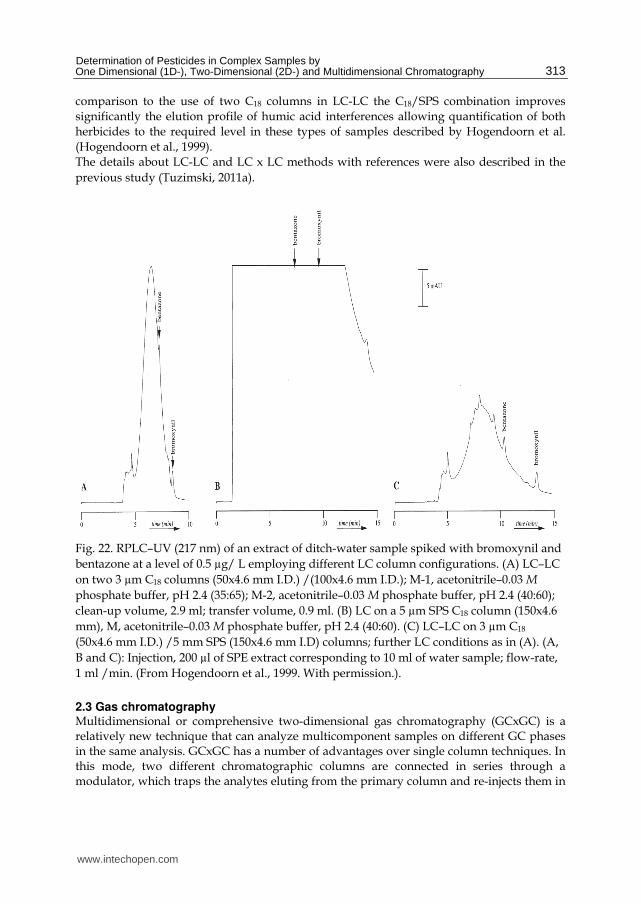
decreasing the final peak production rate in 2D-LC (Eeltink et al., 2009). Gradient elution provides significant improvement of the peak capacity in comparison to isocratic conditions. In the second dimension, gradients are limited to a short-time period available for separation. Various types of second-dimension gradients in comprehensive LC x LC are compared: (i) ‘‘full in fraction’’, (ii) ‘‘segment in fraction’’ and (iii) ‘‘continuously shifting’’ gradients, applied in orthogonal LC x LC separations was described by Jandera et al. (Jandera et al., 2010). The porous shell columns provide narrow bandwidths and fast second-dimension separations at moderate operating pressure that allows important savings of the overall separation time in comprehensive LC x LC separations. The effects of the gradient type on the bandwidths, theoretical peak capacity, separation time and column pressure in the second dimension were investigated by these authors (Jandera et al., 2010). The coupled-column (LC–LC) configuration consisting of a 3 µm C column (50x4.6 mm I.D.)
as the first column and a 5 µm C18 semi-permeable-surface (SPS) column (150x4.6 mm I.D.)
as the second column appearing to be successful for the screening of acidic pesticides in
surface water samples was described by Hogendoorn et al. (Hogendoorn et al., 1999). In
comparison to LC–LC employing two C18 columns, the combination of C18/SPS-C18
significantly decreased the baseline deviation caused by the hump of the co-extracted humic
substances when using UV detection (217 nm). The developed LC–LC procedure by
Hogendoorn et al. (Hogendoorn et al., 1999) allowed the simultaneous determination of the
target analytes bentazone and bromoxynil in uncleaned extracts of surface water samples to
a level of 0.05 µg/L in less than 15 min. In combination with a simple solid-phase extraction
step (200 mL of water on a 500 mg C18 -bonded silica) the analytical procedure provides a
high sample throughput. During a period of about five months more than 200 ditch-water
samples originating from agricultural locations were analyzed with the developed
procedure. Validation of the method was performed by randomly analyzing recoveries of
water samples spiked at levels of 0.1 µg/L (n=10), 0.5 µg/L (n=7) and 2.5 µg/L (n=4).
Weighted regression of the recovery data showed that the method provides overall
recoveries of 95 and 100% for bentazone and bromoxynil, respectively, with corresponding
intra-laboratory reproducibilities of 10 and 11%, respectively. The performance of different
columns in LC-LC configuration is illustrated in Figure 22 (Hogendoorn et al., 1999). In
www.intechopen.com
Determination of Pesticides in Complex Samples by One Dimensional (1D-), Two-Dimensional (2D-) and Multidimensional Chromatography
313
comparison to the use of two C18 columns in LC-LC the C18/SPS combination improves
significantly the elution profile of humic acid interferences allowing quantification of both
herbicides to the required level in these types of samples described by Hogendoorn et al.
(Hogendoorn et al., 1999).
The details about LC-LC and LC x LC methods with references were also described in the
previous study (Tuzimski, 2011a).
Fig. 22. RPLC–UV (217 nm) of an extract of ditch-water sample spiked with bromoxynil and
bentazone at a level of 0.5 µg/ L employing different LC column configurations. (A) LC–LC
on two 3 µm C18 columns (50x4.6 mm I.D.) /(100x4.6 mm I.D.); M-1, acetonitrile–0.03 M
phosphate buffer, pH 2.4 (35:65); M-2, acetonitrile–0.03 M phosphate buffer, pH 2.4 (40:60);
clean-up volume, 2.9 ml; transfer volume, 0.9 ml. (B) LC on a 5 µm SPS C18 column (150x4.6
mm), M, acetonitrile–0.03 M phosphate buffer, pH 2.4 (40:60). (C) LC–LC on 3 µm C18
(50x4.6 mm I.D.) /5 mm SPS (150x4.6 mm I.D) columns; further LC conditions as in (A). (A,
B and C): Injection, 200 µl of SPE extract corresponding to 10 ml of water sample; flow-rate,
1 ml /min. (From Hogendoorn et al., 1999. With permission.).
2.3 Gas chromatography Multidimensional or comprehensive two-dimensional gas chromatography (GCxGC) is a relatively new technique that can analyze multicomponent samples on different GC phases in the same analysis. GCxGC has a number of advantages over single column techniques. In this mode, two different chromatographic columns are connected in series through a modulator, which traps the analytes eluting from the primary column and re-injects them in
www.intechopen.com
Pesticides in the Modern World – Trends in Pesticides Analysis
314
small compressed packets onto the secondary column. Columns coupled in series provide better separation of components of sample through different physical and chemical properties (e.g., boiling point/polarity versus shape selection) in the two steps. The GCxGC provides much better chromatographic resolution and peak capacity than single column system. GCxGC can also be used as screening method for various groups of pesticides (Tuzimski, 2011a). The details about GC x GC methods with examples and references were described in the previous study of an earlier published by the same author: Multidimensional chromatography in pesticides analysis. In: Pesticides – strategies for pesticides analysis. (Ed.) Margarita Stoytcheva. InTech, Rijeka 2011, pp. 155-196 (Tuzimski, 2011a).
3. Acknowledgements
The investigations were financially supported by a grant (No N N204 167136, 2009-2011) of the Ministry of Science and Higher Education, Poland (see references: Tuzimski, T. (2010a-c) and Tuzimski, T. (2011a, c)).
4. References
Ahrens, B.; Blankenhorn, D.; Spangenberg, B. (2002). Advanced fibre optical scanning in
thin-layer chromatography for drug identification, J. Chromatogr. B, 772, 11–18.
Desmet, G.; Clicq, D.; Gzil, P. (2005). Geometry-independent plate height representation
methods for the direct comparison of the kinetic performance of LC supports with a
different size or morphology, Anal. Chem., 77, 4058-4070.
Dzido, T.H.; Gołkiewicz, W.; Piłat, J.K. (2002) The effect of temperature on the separation of
some test solutes in preparative thin-layer chromatography. J. Planar Chromatogr. —
Mod. TLC, 15, 258–262.
Eeltink, S.; Dolman, S.; Ursem, M.; Swart, R.; McLeod, F.; Schoenmakers, P.J. (2009).
Maximizing the peak production rate in off-line comprehensive two-dimensional
liquid chromatography with mass spectrometry detection, LC-GC Europe, 22, 8, 404-
413.
Felinger, A.; Guiochon, G. (1998). Comparing the optimum performance of the different
modes of preparative liquid chromatography. J. Chromatogr. A, 796, 59–74.
François, I.; Sandra, K.; Sandra, P. (2009). Comprehensive liquid chromatography:
Fundamental aspects and practical considerations—A review, Anal. Chim. Acta, 641,
14-31.
Gritti, F.; Guiochon, G. (2003). Band splitting in overloaded isocratic elution
chromatography. I. The experimental evidence. J. Chromatogr. A, 1008, 13–21.
Guiochon, G. (2002). Preparative liquid chromatography. J. Chromatogr. A, 965, 129–161.
Hiegel, K.; Spangenberg, B., (2009). New method for the quantification of dequalinium
cations in pharmaceutical samples by absorption and fluorescence diode array thin-
layer chromatography, J. Chromatogr A, 1216, 5052–5056.
Hoffman, N.E.; Pan, S.L.; Rustum, A.M. (1989). Injection of eluites in solvents stronger than
the mobile phase in reversed-phase liquid chromatography, J. Chromatogr. 465, 189-
200.
www.intechopen.com
Determination of Pesticides in Complex Samples by One Dimensional (1D-), Two-Dimensional (2D-) and Multidimensional Chromatography
315
Horie, K. et al. (2007). Calculating optimal modulation periods to maximize the peak
capacity in two-dimensional HPLC, Anal. Chem. 79, 3764-3770.
Jandera, P.; Komers, D.; Guiochon, G. (1997) Effect of the gradient profile on the production
rate in reversed-phase gradient elution overloaded chromatography, J. Chromatogr.
A, 760, 25–39.
Jandera, P. (2000). Comparison of various modes and phase systems for analytical HPLC, In:
Handbook of Analytical Separations, Valko, K. (Ed.) Elsevier Science B.V., Amsterdam,
Vol. 1, 1–71. Separation Methods in Drug Synthesis and Purification.
Jandera, P.; Hájek, T.; Česla, P. (2010). Comparison of various second-dimension gradient
types in comprehensive two-dimensional liquid chromatography, J. Sep. Sci., 33,
1382–1397.
Jansson, C.; Kreuger, J. (2010). Multiresidue analysis of 95 pesticides at low nanogram/liter
levels in surface waters using online preconcentration and high performance liquid
chromatography/tandem mass spectrometry, J. AOAC International, 93, 6, 1732-
1747.
Köhne, A.P.; Welsch, T. (1999). Coupling of a microbore column with a column packed with
non-porous particles for fast comprehensive two-dimensional high-performance
liquid chromatography, J. Chromatogr. A, 845, 463–469.
Nyiredy, Sz. (2001). Possibilities of preparative planar chromatography, In: Planar chromatography.
A Retrospective View for the Third Millennium, Nyiredy, Sz. (Ed.) Springer Scientific
Publisher, Budapest, pp. 386–409.
Nyiredy, Sz. (2003). Preparative layer chromatography, In: Handbook of Thin-Layer
Chromatography, 3rd Ed; Chromatographic Science Series, Sherma, J.; Fried, B. (Eds.)
Marcel Dekker, Inc., New York, Basel, Vol. 89, pp. 307–338.
Poppe, H. (1997). Some reflections on speed and efficiency of modem chromatographic
methods. J. Chromatogr. A, 778, 3–21.
Rabel, F.M. (2003). Sorbents and precoated layers in thin-layer chromatography, In: Handbook of
Thin-Layer Chromatography, 3rd Ed.; Chromatographic Science Series, Sherma, J.; Fried,
B. (Eds.) Marcel Dekker Inc., New York, Basel, Vol. 89, Chapter 4, pp. 99–133.
Schoenmakers, P.; Marriot, P.; Beens, J. (2003). LC-GC Eur., 16, 335-339.
Schoenmakers, P.J., Vivo-Truyols, G., Decrop, W.M.C. (2006). A protocol for designing
comprehensive two-dimensional liquid chromatography separation systems, J.
Chromatogr. A, 1120, 282-290.
Shan, Y.; Seidel-Morgenstern, A. (2003). Analysis of the isolation of a target component
using multicomponent isocratic preparative elution chromatography. J. Chromatogr.
A, 1041, 53–62.
Soczewiński, E.; Wawrzynowicz, T. (2000). Preparative TLC, In: Encyclopedia of
Chromatography, Cazes, J. (Ed.) Marcel Dekker Inc.: New York, Basel, pp. 660–662.
Soczewiński, E. (2001). Quantitative retention–eluent composition relationships in partition and
adsorption chromatography, In: A Century of Separation Science, Issaq, H.J. (Ed.) Marcel
Dekker Inc., New York, pp. 179–195.
Spangenberg, B., (2006). Does the Kubelka-Munk theory describe TLC evaluations correctly?,
J. Planar Chromatogr. – Mod. TLC, 19 (111) 332–341.
www.intechopen.com
Pesticides in the Modern World – Trends in Pesticides Analysis
316
Spangenberg, B., Klein, K.-F. (2001). New evaluation algorithm in diode-array thin-layer
chromatography, J. Planar Chromatogr. – Mod. TLC; 14 (4) 260–265.
Spangenberg, B., Klein K.-F. (2000). Fibre optical scanning with high resolution in thin-layer
chromatography, J. Chromatogr. A; 898, 265–269.
Spangenberg, B.; Lorenz, K.; Nasterlack, S. (2003). Fluorescence enhancement of pyrene
measured by thin-layer chromatography with diode-array detection, J. Planar
Chromatogr. – Mod. TLC 2003, 16 (5) 331–337.
Stoll, D.R.; Li, X.; Wang, X.; Carr P.W.; Porter S.E.G.; Rutan S.C. (2007). Fast, comprehensive
two-dimensional liquid chromatography, J. Chromatogr. A, 1168, 3–43.
Szabady, B.; Nyiredy, Sz. (1996). The versatility of multiple development, In: Dünnschicht-
Chromatographie in Memorian Professor Dr. Hellmut Jork, Kaiser, R.E.; Günther, W.;
Gunz, H.; Wulff, G. (Eds.) InCom Sonderband, Düsseldorf, pp. 212-224.
Tuzimski, T.; Soczewiński, E. (2002a). Retention and selectivity of liquid-solid chromatographic
systems for the analysis of pesticides (Retention database of ca. 100 pesticides). In:
Problems of Science, Teaching and Therapy. Medical University of Lublin, Poland,
No 12, Lublin, October 2002, pp. 219.
Tuzimski, T.; Soczewiński, E. (2002b). Chemometric characterization of the RF values of
pesticides in thin-layer chromatography on silica with mobile phases comprising a
weakly polar diluent and a polar modifier. Part V, J. Planar Chromatogr. - Mod. TLC,
15, 164-168.
Tuzimski, T.; Soczewiński, E. (2002c). Correlation of retention parameters of pesticides in
normal- and reversed-phase systems and their utilization for the separation of a
mixture of 14 triazines and urea herbicides by means of two-dimensional thin-layer
chromatography, J. Chromatogr. A, 961, 277-283.
Tuzimski, T.; Soczewiński, E. (2002d). Use of database of plots of pesticide retention (RF)
against mobile-phase composition. Part I. Correlation of pesticide retention data in
normal- and reversed-phase systems and their use to separate a mixture of ten
pesticides by 2D-TLC, Chromatographia, 56, 219-223.
Tuzimski, T., Bartosiewicz, A. (2003). Correlation of retention parameters of pesticides in
normal and RP systems and their utilization for the separation of a mixture of ten
urea herbicides and fungicides by two-dimensional TLC on cyanopropyl-bonded
polar stationary phase and two-adsorbent-layer Multi-K plate. Chromatographia, 58,
781-788.
Tuzimski, T.; Soczewiński, E. (2004). Use of database of plots of pesticide retention (RF)
against mobile-phase compositions for fractionation of a mixture of pesticides by
micropreparative thin-layer chromatography, Chromatographia, 59 (1/2), 121–128.
Tuzimski, T. (2005a). Two-stage fractionation of a mixture of 10 pesticides by TLC and
HPLC, J. Liq. Chromatogr. Relat. Technol., 28 (3), 463–476.
Tuzimski, T. (2005b). Two-stage fractionation of a mixture of pesticides by micropreparative
TLC and HPLC, J. Planar Chromatogr. — Mod. TLC, 18, 39–43.
Tuzimski, T. (2007a). Separation of multicomponent mixtures of pesticides by graft thin-
layer chromatography on connected silica and octadecyl silica layers, J. Planar
Chromatogr. — Mod. TLC, 20, 13–18.
www.intechopen.com
Determination of Pesticides in Complex Samples by One Dimensional (1D-), Two-Dimensional (2D-) and Multidimensional Chromatography
317
Tuzimski, T. (2007b). A new procedure for separation of complex mixtures of pesticides by
multidimensional planar chromatography, J. Separation Sci., 30, 964-970.
Tuzimski, T. (2008a). Strategy for separation of complex mixtures by multidimensional
planar chromatography, J. Planar Chromatogr. — Mod. TLC, 21, 49-54.
Tuzimski, T. (2008b). Application of SPE-HPLC-DAD and SPE-TLC-DAD to the
determination of pesticides in real water samples. J. Sep. Sci., 31, 3537 – 3542.
Tuzimski, T. (2008c) Determination of Pesticides inWater Samples from the Wieprz-Krzna
Canal in the Łęczyńsko-Włodawskie Lake District of Southeastern Poland by Thin-
Layer Chromatography with Diode Array Scanning and High-Performance
Column Liquid Chromatography with Diode Array Detection. J. AOAC
International, 91, 5, 1203-1209.
Tuzimski, T. (2009). Application of SPE–HPLC–DAD and SPE–HPTLC–DAD to the Analysis
of Pesticides in Lake Water. J. Planar Chromatogr. — Mod. TLC, 22, 4, 235–240.
Tuzimski, T.; Sobczyński, J. (2009). Application of HPLC-DAD and TLC-DAD after SPE to
the Quantitative Analysis of Pesticides in Water Samples. J. Liquid Chromatography
& Related Technologies, 32, 1241–1258.
Tuzimski, T. (2010a). New Procedure for Analysis of Complex Mixtures by use of
Multidimensional Planar Chromatography in Combination with Diode-Array
Scanning Densitometry and High-Performance Liquid Chromatography Coupled
with Diode-Array Detection. J. Planar Chromatogr. — Mod. TLC, 23, 3, 184–189.
Tuzimski, T. (2010b). Determination of clofentezine in medical herb extracts by
chromatographic methods combined with diode array scanning densitometry. J.
Sep. Sci., 33, 1954–1958.
Tuzimski, T. (2010c). Application of HPLC and TLC with Diode Array Detection After SPE
to the Determination of Pesticides in Water Samples from the Zemborzycki
Reservoir (Lublin, Southeastern Poland). J. AOAC International, 93, 6, 1748-1756.
Tuzimski, T. (2010d). Use of Planar Chromatography in Pesticide Residue Analysis, In: Nollet,
L.M.L., Rathore, H.S. (Eds) Handbook of Pesticides: Methods of Pesticide Residues
Analysis, Taylor & Francis Group, Chapter 9, pp. 187-264.
Tuzimski, T. (2011a). Multidimensional chromatography in pesticides analysis, In: Pesticides –
strategies for pesticides analysis, Stoytcheva, M. (Ed.) InTech, Rijeka, pp. 155-196.
Tuzimski, T. (2011b). Basic principles of planar chromatography and its potential for hyphenated
techniques, In: High-Performance thin-layer chromatography (HPTLC), Srivastava, M.M.
(Ed.) Springer, Heidelberg, pp. 247-310.
Tuzimski, T. (2011c). Determination of analytes in medical herbs extracts by SPE coupled
with two-dimensional planar chromatography in combination with diode array
scanning densitometry and HPLC-diode array detector, J. Separation Sci., 34, 27-36.
Waksmundzka-Hajnos, M.; Wawrzynowicz, T. (2002). Strategy of preparative separation of
organic compounds by thin-layer chromatographic methods. J. Liq. Chromatogr.
Relat. Technol., 25 (13–15), 2351–2386.
Waksmundzka-Hajnos, M.; Gadzikowska, M.; Hajnos, M.Ł. (2002). Strategy for preparative
separation of quaternary alkaloids from Chelidonium majus L. by thin-layer
chromatography. J. Planar Chromatogr. — Mod. TLC, 15, 289–293.
www.intechopen.com

Pesticides in the Modern World – Trends in Pesticides Analysis
318
Zhao, L.; Schultz, D., Stevens, J. (2009). Analysis of pesticide residues in apples using
Agilent SampliQ QuEChERS AOAC Kit by LC-MS-MS detection. LC-GC Europe, 13-
14.
www.intechopen.com

Pesticides in the Modern World - Trends in Pesticides AnalysisEdited by Dr. Margarita Stoytcheva
ISBN 978-953-307-437-5Hard cover, 514 pagesPublisher InTechPublished online 21, October, 2011Published in print edition October, 2011
InTech EuropeUniversity Campus STeP Ri Slavka Krautzeka 83/A 51000 Rijeka, Croatia Phone: +385 (51) 770 447 Fax: +385 (51) 686 166www.intechopen.com
InTech ChinaUnit 405, Office Block, Hotel Equatorial Shanghai No.65, Yan An Road (West), Shanghai, 200040, China
Phone: +86-21-62489820 Fax: +86-21-62489821
The book offers a professional look on the recent achievements and emerging trends in pesticides analysis,including pesticides identification and characterization. The 20 chapters are organized in three sections. Thefirst book section addresses issues associated with pesticides classification, pesticides properties andenvironmental risks, and pesticides safe management, and provides a general overview on the advancedchromatographic and sensors- and biosensors-based methods for pesticides determination. The second booksection is specially devoted to the chromatographic pesticides quantification, including sample preparation.The basic principles of the modern extraction techniques, such as: accelerated solvent extraction, supercriticalfluid extraction, microwave assisted extraction, solid phase extraction, solid phase microextraction, matrix solidphase dispersion extraction, cloud point extraction, and QuEChERS are comprehensively described andcritically evaluated. The third book section describes some alternative analytical approaches to theconventional methods of pesticides determination. These include voltammetric techniques making use ofelectrochemical sensors and biosensors, and solid-phase spectrometry combined with flow-injection analysisapplying flow-based optosensors.
How to referenceIn order to correctly reference this scholarly work, feel free to copy and paste the following:
Tomasz Tuzimski (2011). Determination of Pesticides in Complex Samples by One Dimensional (1D-), Two-Dimensional (2D-) and Multidimensional Chromatography, Pesticides in the Modern World - Trends inPesticides Analysis, Dr. Margarita Stoytcheva (Ed.), ISBN: 978-953-307-437-5, InTech, Available from:http://www.intechopen.com/books/pesticides-in-the-modern-world-trends-in-pesticides-analysis/determination-of-pesticides-in-complex-samples-by-one-dimensional-1d-two-dimensional-2d-and-multidim